


Highlights
What are the main findings?
- A study of the literature on short-term load forecasting was conducted using the similar day (SD) methodology. The study focused on the last 25 years and covered conventional, intelligent, and hybrid methods.
- The methods operate in three stages: (a) selecting similar days; (b) choosing forecasting techniques; and (c) integrating both steps to produce the short-term forecasted load demand profile.
What are the implications of the main findings?
- The operation of power systems is changing rapidly compared with just a few years ago. Modern power system operation is increasingly complex due to uneven grid expansion, high renewable penetration, and new technologies that change demand behavior unpredictably. Additionally, unusual events occur more frequently, contributing to this unpredictability. Therefore, forecasting tools need to be revisited and improved continuously if they are to remain useful in real operating conditions.
- The literature studied for this work indicated that very few methods have been developed for forecasting similar days, highlighting the need for forecasting tools that remain accurate under abnormal or disruptive conditions. Attempts in this direction could include generating synthetic data and a history of similar days only in extreme event scenarios; training intelligent methods only in extreme event scenarios; and using emergent technologies, such as explainable artificial intelligence (XAI).
Abstract
Short-term load forecasting is essential for the reliable, secure, efficient, and economic operation of modern power systems and electricity markets. Among many forecasting strategies, the similar day (SD) approach for short-term load forecasting was among the earliest used to assess power demand and remains one of the most intuitive and widely adopted techniques worldwide. However, over time, increasing system complexity, richer datasets, and advances in computational intelligence have led to the evolution of SD methodologies beyond heuristic-based rule formulations. This work presents a study of the relevant literature on short-term load forecasting using SD methods reported between 2000 and 2025. This study analyzes how similarity is defined, how forecasts are generated, and how both stages interact within the complete forecasting process in the reviewed literature. Based on these criteria, a unified taxonomy is proposed to classify SD methods into conventional, intelligent, and hybrid formulations. This study provides insight into the methodologies, their performance, and the systems in which they have been tested. The results show that SD-based approaches remain competitive for short-term forecasting and that incorporating artificial intelligence techniques can further enhance their accuracy.
1. Introduction
Currently, decarbonization is an urgent priority that must be pursued from every possible front. To achieve carbon-neutral energy systems, cleaner energy sources must be utilized, along with improved energy efficiency and management in energy systems [1,2]. Energy systems consist of electrical loads ranging from a few watts to hundreds of gigawatts that must be supplied by electrical generation. A set of interconnected electrical components that generate, transmit, and distribute electrical energy from power plants to satisfy load demand is a power system. Thus, electrical load forecasting is essential for the success of power systems, from their design and installation to their operation and maintenance [3,4,5].
Electrical load forecasting is needed at multiple timescales [6,7]. The load forecasting horizons can be categorized as follows [8]:
- Very short-term forecasts, ranging from minutes to one hour ahead, are essential for managing contingencies using supplementary reserves or interruptible loads.
- Short-term forecasts, ranging from hours to a few days ahead, are required for unit commitment, the electric market, and reserve allocation [9]. In particular, in this time horizon lies the day-ahead load forecasting, which is crucial for economic dispatch, the electrical market, and the balance between all types of electric generation and storage.
- Medium-term forecasts, ranging from a few days to weeks, are useful for maintenance and fuel requirements.
- Long-term forecasts, ranging from months to years, are needed for investments and expansion studies.
Given that renewable penetration, particularly the intermittent forms, and demand variability continue to grow, accurate short-term load forecasting becomes more and more important every day for system operators [10]. Even early on, methods that extracted information from historical patterns were practical tools for anticipating next-day consumption, such as the SD method.
The SD method is one of the oldest, most intuitive, and most used methods currently in electrical utilities. In its simplest form, the SD method assumes that energy patterns repeat under comparable weather and calendar conditions, making historical analogs a valuable basis for forecasting. Although no publication documents the introduction of the SD method, it is believed that utilities have applied it since the 1970s, since it was documented in the 1980s [11]; it is described as an analogous day-selection procedure in utility practices of the North American Electric Reliability Council (NERC) [12]. Indeed, early implementations consisted of identifying similar days based on calendar attributes or basic weather variables, and their load curves were used, directly or combined with simple statistical calculations, to provide the day-ahead load curve. Since the methods were intuitive, easy to implement, and computationally low-cost, they were adopted by many utility company operators. Later works formalized this idea by interpreting SD forecasting as a pattern similarity problem in the space of daily load profiles, providing a theoretical foundation for modern SD-based methods [13,14].
In recent years, the development of larger and more complex power systems, coupled with the availability of vast amounts of high-resolution data and a growing demand for improved forecasting quality, has posed significant challenges. To address this issue, which is becoming a strategic focus in energy transition research, efforts are underway to develop forecasting methodologies that achieve the following:
(a) Capture the know-how of forecasting operators with data-driven information;
(b) Integrate more variables;
(c) Capture nonlinear behaviors;
(d) Account for structural changes in demand.
These methodologies include data-driven approaches, complex forecasting systems, and the use of sophisticated tools, such as AI, either alone or in combination [15]. In particular, load forecasting approaches can be broadly categorized into similarity-based methods, data-driven deep learning models, and hybrid approaches, as shown in Figure 1. While modern deep learning models, such as recurrent neural networks and Transformer-based architectures learn temporal dependencies directly from historical data, similar day methods rely on explicit similarity metrics to identify historical analog days.
Figure 1.
Conceptual taxonomy of load forecasting approaches, highlighting the position of similar day methods within the broader forecasting landscape.
In recent years, deep learning architectures, such as recurrent neural networks and Transformer-based models, have shown promising results in load forecasting due to their ability to learn complex temporal dependencies. However, unlike similar day methods, most of these approaches typically rely on data-driven representation learning rather than explicit similarity-based selection of historical analog days [16,17,18].
This review focuses on similar day forecasting approaches.
Despite this evolution, the literature lacks a consolidated technical synthesis that describes how SD methods have developed, which components drive their performance, and how recent machine learning (ML)-enhanced or hybrid approaches relate to the original formulation. Most existing studies focus on proposing new variations rather than situating them within a coherent methodological structure.
This review addresses that gap by offering a technical perspective on SD-based forecasting. Specifically, this review achieves the following:
- Summarizes some recent advances in SD-based forecasting methods;
- Presents a structured taxonomy organizing the literature into a clear classification based on similarity definition, forecasting model, and integration strategy;
- Provides a comparison of approaches analyzing trends, performance ranges, and key technical insights reported over the past two decades.
It is important to clarify that, in this work, conventional methods refer to methods that do not use AI techniques, including heuristic, statistical, and other non-intelligent methods.
The goal of this work is to provide a structured view of SD-based methods for short-term load forecasting and to highlight the developments that have shaped their performance in contemporary power systems. The remainder of this work is structured as follows. Section 2 presents the conceptual background of SD methods for short-term load forecasting and introduces the analytical perspective and the taxonomy employed to classify SD forecasting methods according to their structural characteristics. Section 3 presents the results of the review, including a comparative analysis and identification of key technical findings. Section 4 provides a critical discussion of the reviewed approaches, highlighting cross-cutting comparisons, analytical insights, and practical implications for power system operators. Finally, Section 5 concludes the paper and outlines directions for future research.
2. Materials and Methods
This section presents the conceptual background of SD methods for short-term load forecasting together with the definition of the variables and the similarity metrics used in conventional SD selection and describing the approaches followed in intelligent SD selection. Additionally, the analytical perspective adopted in this work and the taxonomy that groups SD forecasting methods according to their structural characteristics are outlined at the end of this section.
2.1. Similar Day Method Background
The SD approach has been employed in short-term load forecasting for several decades and continues to be one of the most practical ways to incorporate historical information into prediction tasks. The SD method relies on the core assumption that if certain days in the past share similar conditions with the target day, then their load profiles may be very similar to that of the future target day. Early versions of the SD approach relied mainly on simple rules, such as matching calendar characteristics or weather conditions [19], and were widely adopted because they had low computational requirements and were easy for system operators to interpret.
As more data became available, forecasting demands became more complex, and the SD formulation expanded. Besides load data, additional variables, such as day type, meteorological conditions, and various pattern indicators, were incorporated to better define day-to-day similarity. Thus, the SD approaches expanded from a single, heuristic procedure to a diverse set of techniques for selecting similar days and integrating them into forecasting models. As part of the evolution of SD formulations, several studies focused on identifying and classifying daily load patterns using data-driven techniques. For instance, Zhang et al. (2012) proposed a clustering-based approach to extract typical load profiles from high-resolution daily load curves of large electricity customers [20]. Although this work does not perform load forecasting or SD selection, it illustrates how pattern recognition and clustering techniques can capture representative demand behaviors. Such approaches later influenced intelligent SD methodologies, where clustering is used intelligently as a preliminary step to identify candidate similar days or to enhance similarity definitions beyond simple calendar or weather rules.
It is worth noting that some studies do not adopt calendar-based SD rules in a strict sense but instead identify analogous historical instances through pattern-based similarity or data-driven partitioning of historical observations. Although these approaches differ from conventional SD formulations, they share the same underlying principle of retrieving historical analogs to support short-term load forecasting. For this reason, pattern-based similarity methods [13,14] are considered within the broader scope of SD-inspired approaches, particularly when intelligent or data-driven techniques, such as clustering, are used to define similarity beyond explicit calendar or weather features matching the target day, thus laying the foundation for intelligent and pattern-based SD methodologies [21].
Despite this diversity, as previously mentioned, most SD approaches share three elements that form their backbone. The first is the definition of similarity, which determines how candidate days are identified in the historical record as similar days. The second is the forecasting model that uses the selected days, ranging from classical statistical tools to more advanced machine learning algorithms. The third is the integration of the selection and modeling, since the SD step can shape both the structure and inputs of the forecasting model in different ways.
The evolution of SD approaches has evolved from conventional to intelligent methods, and, more recently, to hybrid methods, where similarity conditions coexist with clustering, optimization, or machine learning techniques. Therefore, a trend in load forecasting is emerging, combining domain knowledge with data-driven methods to develop more accurate and robust methodologies. Therefore, organizing SD approaches into a consistent framework is useful for comparing them effectively and understanding their relationships. The following subsections build this foundation, starting with the variables and distance metrics that define similarity in SD-based forecasting.
2.2. Variables and Similarity Metrics
The SD approach is based on the premise that daily electricity demand patterns repeat under comparable conditions. So, this approach relies on the definition of similarity between the target day and historical days. Thus, the first step of this process is the selection of the conditions or characteristics, also known as similarity-defining features, which are used to quantify similarity between days. However, similarity-defining features are time-varying quantities underlying time series, such as historical load profiles, meteorological observations, or calendar-related variables. For this reason, similarity-defining features can be regarded as explanatory variables, since they evolve over time and describe the factors that directly influence load dynamics, playing the role of explanatory variables in load forecasting models. The explanatory variables capture temporal, climatic, and/or behavioral patterns relevant to load demand. In many SD formulations, distances are computed directly over historical load profiles, which constitute a particular case of similarity-defining features. In addition to explicit distance-based similarity metrics, modern SD approaches increasingly rely on learning-based similarity measures, where similarity is implicitly learned through clustering, representation learning, or machine learning models rather than predefined distance functions.
Hence, in SD forecasting, the definition of similarity depends on two elements:
- (a)
- The set of variables selected to characterize the demand conditions;
- (b)
- The metric used to compare these variables and quantify similarity between the target day and historical days.
2.2.1. Variable Categories
SD methods for load forecasting typically use three main categories of explanatory variables:
- Load variables, which incorporate short-term load history, such as the previous day’s demand or recent load profiles representing temporal continuity and system inertia in consumption behavior;
- Weather-related variables, which correspond to meteorological conditions that may influence electricity consumption, such as temperature, humidity, solar radiation, wind speed, and other meteorological parameters;
- Temporal variables, which reflect calendar structure, such as the day of the week, hour, season, holidays, working or non-working period, or special events, which capture recurrent behavioral and operational patterns.
However, more categories could be considered, such as the following:
- 4.
- Economic variables, which measure regional economic activity or performance, such as regional gross domestic product, per capita income, electricity rates, inflation and exchange rates, energy regulation, and economic crises;
- 5.
- Political variables, which represent the political activity of the region, such as public policies, regulations, subsidies, tariff structures, international agreements, climate commitments, presidential or congressional elections, political instability, and governance;
- 6.
- Social variables, which characterize the region’s society, such as holidays, social events and festivities, population density, level of urbanization, and social infrastructure.
2.2.2. Similarity Metrics
Once the variables are selected, the next step is to determine how to quantify the similarity of the chosen variables between the target day and historical days. Several distance metrics have been used for this purpose, ranging from simple to more elaborate formulations [22,23,24]. Table 1 shows the main metrics used in conventional SD approaches.
Table 1.
Similarity metrics used to quantify the similarity of the chosen variables between the forecast day and historical days, where is the explanatory variable, with the corresponding mean value, chosen to find the similar days, at hour , runs from to and corresponds to a historical day in the group of historical data , and corresponds to the forecast day, and is the similar day value that, when maximized or minimized, determines the similar day. Additionally, is the deviation of the load of the forecast day and the historical day , is the deviation between their load slopes, is the deviation of the variable chosen to find the similarity between the forecast and the historical day , and and are the corresponding weight factors.
As shown below, the Euclidean and weighted distances are the most used, followed by the Manhattan distance. However, there are also a few works that use the Cosine metric and the Pearson coefficient. Nevertheless, there are probabilistic or fuzzy similarity indices, which allow partial membership when weather uncertainty is significant [25]. More recent work explores distances learned through machine learning models, with clustering being the most common one, which capture structures not directly visible in raw variables alone or in big datasets.
Since SD approaches involve the choice of variables and the distance metric, their sensitivity to weather anomalies, structural breaks, or changes in user behavior is different. Some approaches explicitly tune the metric or adjust the variable set to reduce these effects. Others embed the similarity computation within optimization or hybrid schemes, using learned weights to emphasize the variables most relevant to demand variability.
Thus, the combination of variables and distance metrics forms the foundation for defining and evaluating the concept of similarity and strongly influences SD performance. Indeed, this foundation is essential for interpreting how conventional, AI-based, or hybrid SD methods behave and sets the stage for the analytical and taxonomic perspectives introduced in the next section.
It is worth noting that not all similarity-based load forecasting approaches operate at the level of individual days. Some recent studies explore similarity at an aggregated or regional scale, where entire load profiles (daily, weekly, or yearly) are compared across different systems rather than selecting analogous historical days for a specific target date. For instance, clustering-based regional similarity combined with transfer learning has been proposed to exploit structural similarities among power systems, enabling knowledge transfer across regions with limited historical data [26]. Although these approaches do not follow the traditional or pattern-based similar day paradigm, they reflect a broader evolution of similarity concepts in load forecasting and highlight alternative ways of leveraging historical information beyond day-level analogies.
2.3. Analytical Approach
In this work, the examination of SD methods follows a technical perspective, focusing on how these approaches are built and how they have changed over time. This analysis focuses on understanding the structure behind SD techniques rather than compiling an exhaustive list of publications.
While reviewing the literature, three aspects appeared consistently across SD approaches, even when described in different forms:
- The choice of variables and similarity criteria, which determines how historical days are selected to form the set of similar days;
- The forecasting model that uses information from the selected days;
- The integration of the previous parts to complete the forecasting process.
By focusing on these shared structural elements, different SD variants can be compared under a unified framework that highlights the progressive integration of machine learning, optimization techniques, and hybrid architectures, and more elaborate definitions of similarity. Understanding this evolution is essential for formulating a coherent taxonomy, which is presented in the following subsection to organize SD methods according to their operational structure and modeling strategy.
Finally, forecasting performance is evaluated using the Mean Absolute Percentage Error (MAPE), given by
where and are the real and predicted values of the variable, respectively. Even though there are other errors such as Mean Absolute Error (MAE), the Root Mean Squared Error (RMSE), the MAPE is one of the most common metrics to measure the accuracy of a forecasting model due to its interpretability and suitability for comparing systems with different load magnitudes [27].
2.4. Proposed Taxonomy Diagram
The taxonomy diagram, shown in Figure 2, presents a structured classification of SD-based short-term load forecasting approaches by decomposing them into their fundamental building blocks. Rather than cataloging individual studies, the taxonomy focuses on the structural logic that defines how SD methods operate, evolve, and relate to one another. It organizes SD approaches into three conceptual layers, each representing a key decision in the forecasting process.
Figure 2.
Taxonomy of the SD-based methods for short-term load forecasting.
The following section presents the reviewed literature organized according to this taxonomy together with an analysis of the methodologies highlighting the most important findings.
- -
- First Layer: Similarity Selection Mechanism
The first layer classifies SD methods according to how similar days are identified from historical data. This layer reflects the knowledge paradigm used to define similarity.
- Conventional SD methods rely on explicit, rule-based criteria derived from domain expertise, such as calendar attributes (day type, season, holidays) and basic weather conditions. These approaches do not use AI techniques and have been widely adopted in utilities due to their simplicity, transparency, and low computational cost.
- Intelligent SD methods employ data-driven techniques—such as clustering, optimization algorithms, or machine learning—to identify similar days. These methods are particularly effective when large datasets are available, as they can uncover latent structures and complex similarity patterns not captured by simple rules.
- Hybrid SD methods combine conventional similarity rules with intelligent or signal-processing techniques. By merging explicit domain knowledge with data-driven similarity learning, hybrid approaches aim to capture more complex and nonlinear demand behaviors.
This layer highlights the evolution of SD similarity definition from heuristic rules to intelligent and hybrid formulations.
- -
- Second Layer: Forecasting Model
The second layer categorizes the forecasting models applied after the similar days have been selected. It reflects how information extracted from historical analogs is transformed into load predictions.
- Conventional forecasting models include classical statistical techniques such as linear regression, exponential smoothing, and ARIMA. These models are interpretable and computationally efficient but limited in capturing nonlinear relationships.
- AI-based forecasting models use machine learning and data-driven techniques, such as Support Vector Regression, Random Forests, gradient boosting, neural networks, and ensemble learners. These models are capable of modeling nonlinearities and complex interactions among variables.
- Hybrid forecasting models integrate multiple forecasting techniques, often through multi-stage architectures or residual correction schemes, to improve accuracy and robustness.
This layer emphasizes that forecasting accuracy depends not only on similarity selection but also on the modeling strategy applied to the selected data.
- -
- Third Layer: Integrated Forecasting Strategy
The third layer represents the interaction between similarity selection and forecasting models, defining the overall SD-based forecasting architecture. Different combinations are possible:
- Conventional SD combined with conventional or AI-based forecasting models.
- Intelligent SD combined with conventional or AI-based forecasting models.
- Fully hybrid systems, where both similarity selection and forecasting models are hybridized.
The choice of integration strategy depends on data availability, system complexity, and operational constraints. This layer underscores that SD forecasting is not a single algorithm but a modular framework, where similarity identification and prediction modeling jointly determine performance.
3. Results
3.1. Structured Organization of the Literature
The reviewed literature spans more than two decades (approximately 2001–2025), revealing a clear methodological evolution in SD-based short-term load forecasting. Early studies predominantly relied on rule-based similarity selection combined with conventional statistical forecasting models, while more recent works increasingly incorporate artificial intelligence either in the similarity selection stage, the forecasting model, or both. This evolution culminates in hybrid SD frameworks that integrate multi-stage or fused methodologies. Figure 3 summarizes the percentage of the literature studied according to the proposed taxonomy of a total of 83 reviewed works. The results are as follows:
Figure 3.
Distribution of the literature with methodologies according to the classifications in the proposed taxonomy.
- Conventional SD approaches correspond to 39% (outer ring): 11% utilize conventional forecasting methods, while 28% employ intelligent forecasting methods (inner ring).
- Intelligent SD approaches correspond to 14% (outer ring): 6% use conventional forecasting methods and 8% apply intelligent forecasting methods (inner ring).
- Hybrid approaches, either on SD or forecasting methodologies, correspond to the remaining 47% (outer and inner ring).
Most studies utilize data from various countries worldwide. China leads in job numbers, followed by the USA, Australia, Japan, and India. Figure 4 illustrates the participation rates for the various countries. Despite regional differences, the explanatory variables used to determine similarity remain fairly consistent across the studies. Load, weather, and calendar variables dominate the selection process, while economic or social indicators appear in a small number of works.
Figure 4.
Percentage of countries where the different SD forecasting approaches from the revised literature have been applied. The level “competitions” refer to organized networks to compete on electricity load forecasting.
3.2. Literature Search and Selection Criteria
The literature search was conducted using major scientific databases, including IEEE Xplore Digital Library, Scopus, Web of Science, ScienceDirect, and SpringerLink. These databases were selected to ensure comprehensive coverage of the peer-reviewed literature in engineering and energy systems.
The literature search was conducted using a set of predefined keywords associated with short-term load forecasting and similar day approaches. The primary search terms included “short-term load forecasting”, “day-ahead load forecasting”, “similar days”, and “power systems”. These terms were combined using logical operators (AND, OR) and applied across multiple scientific databases to ensure a comprehensive and systematic identification of relevant studies. Additional variations and related terms were also considered to capture different formulations used in the literature.
In addition to the inclusion criteria, exclusion criteria were applied to ensure the relevance of the selected studies. Studies focusing on load forecasting in domains other than power systems—such as buildings, electric vehicles, residential households, or micro-level energy consumption—were excluded. The review specifically targets forecasting methods applied to power system-level demand, ensuring consistency in the scope and applicability of the analyzed studies.
3.3. Taxonomy of Similar Day Forecasting Approaches
In this subsection, we summarize some of the most recent works published. The works are organized in tables according to the taxonomy described above, which is also illustrated in the last layer of Figure 2. The main information extracted from these studies includes (a) the SD selection method, (b) the forecasting technique applied, (c) the input variables used, (d) the reported forecasting error, and (e) the country where the power system data was collected. As mentioned at the end of Section 2.3, the forecasted error is provided by the MAPE. In general, we include the minimum and maximum values reported in the literature, but in the cases where this information is missing, we specify the reported forecasting error. Finally, unless otherwise stated, the target variable in all studies is the electricity load demand (hourly, daily, or peak load, depending on the references) of power systems.
It is important to highlight that although multiple performance metrics are used in the literature, including the RMSE and the MAE, the MAPE remains the most widely adopted metric in short-term load forecasting due to its interpretability and scale-independence. For this reason, the comparative analysis in this review is primarily based on MAPE values. However, it is noted that only 4 out of 85 revised references do not report the MAPE, as explicitly stated in the tables.
3.3.1. Conventional Similar Day Methods and Conventional Forecasting Approaches
The summary of some main works employing conventional approaches for similar day classification and load forecasting is presented in Table 2.
Table 2.
Summary of key information on forecasting methods using conventional similar day classification and conventional load forecasting techniques.
Therefore, the short-term load forecasting methodologies under the category of conventional SD with conventional forecasting methods mainly use day-type rules and Euclidean distance metrics on load and temperature data for similar day selection. Moreover, as forecasting methodologies they employ regression, ARIMA or exponential smoothing, among others.
3.3.2. Conventional Similar Day Methods and Intelligent Forecasting Approaches
The summary of major works using conventional methods for similar day classification and intelligent techniques for load forecasting is provided in Table 3.
Table 3.
Summary of key information on forecasting methods using the conventional similar day classification and intelligent load forecasting techniques.
Thus, the short-term load forecasting methodologies under the category of conventional SD with intelligent forecasting methods mainly use day-type/calendar rules or distance metrics on load and temperature data for similar day selection. However, as forecasting methodologies, they employ machine learning techniques such as ANN, SVM and Random Forest, among others, or shallow deep learning models.
3.3.3. Intelligent Similar Day Methods and Conventional Forecasting Approaches
The summary of key works utilizing intelligent methods for similar day classification and conventional techniques for load forecasting is presented in Table 4.
Table 4.
Summary of key information on forecasting methods using intelligent similar day classification and conventional load forecasting techniques.
Therefore, the short-term load forecasting methodologies under the category of intelligent SD with conventional forecasting methods mainly use clustering, with different algorithms, SOM, regression trees or grey relational analysis to obtain similar days. Then, they employ conventional forecasting techniques such as regression or ARIMA models within each group of similar days.
3.3.4. Intelligent Similar Day Methods and Intelligent Forecasting Approaches
A summary of key studies using intelligent methods for similar day classification and load forecasting techniques is presented in Table 5.
Table 5.
Summary of key information on forecasting methods using intelligent similar day classification and intelligent load forecasting techniques.
Thus, the short-term load forecasting methodologies under the category of intelligent SD with intelligent forecasting methods use a machine learning technique to select SDs, such as clustering, SOM, grey relational analysis, etc., and to forecast the load, such as ANN, LSTM, GRU, etc.
3.3.5. Hybrid Similar Day Metrics Forecasting Approaches
The summary of the main works employing hybrid methods for similar day classification or load forecasting techniques is presented in Table 6.
Table 6.
Summary of key information on forecasting methods using hybrid approaches.
Thus, the short-term load forecasting methodologies under the category of hybrid methodologies for SD and forecasting models often use multi-criteria, such as calendar rules, distance, correlations and grey relation analysis, for the selection of SD. Concerning load forecasting, load decomposition, using wavelets or EMD/VMD, is often used and forecasting is then performed per component. Additionally, machine and deep learning techniques are also used to add residual corrections. Other methodologies present ensembles of models combining SD-based forecasts with non-SD models.
3.4. Distribution of Studies by Methodological Category
Table 7 provides a taxonomy-based quantitative synthesis of these methodologies identified across the reviewed studies, which are classified into conventional, intelligent, and hybrid SD approaches.
Table 7.
Percentage of the main SD methodologies used in the conventional, intelligent, and hybrid load short-term forecasting approaches studied in the literature.
The results indicate that conventional SD methods are predominantly distance-based, with Euclidean distance (26%) and weighted Euclidean distance (18%) being the most frequently employed metrics. Calendar-based selection (18%) and Pearson correlation (10%) also remain widely used, confirming the continued relevance of deterministic similarity measures in SD modeling.
In contrast, intelligent SD approaches are primarily driven by clustering techniques, particularly K-means (43%) and other algorithms (14%), followed by regression tree methods (14%) and neural-network-based or metaheuristic techniques (29%). This distribution reflects a methodological transition toward data-driven similarity construction, where implicit grouping mechanisms replace explicit metric definitions.
Hybrid SD methodologies integrate deterministic distance measures with clustering or learning-based components. Within this category, K-means-based strategies (22%) and Euclidean-type distances (18%) remain central, followed by correlation analysis (8%), grey relational analysis (4%), or neural network modules (4%).
Overall, the quantitative distribution highlights a progressive evolution from purely metric-based similarity definitions toward clustering-enhanced and hybrid architectures, evidencing the growing methodological sophistication of SD-based forecasting frameworks.
3.5. Temporal Evolution
Overall, the literature reveals a gradual shift from simple, rule-based SD formulations toward intelligent and hybrid SD frameworks that integrate clustering, machine learning, and feature-extraction techniques. This structure supports the taxonomy presented in the next subsection. Figure 5 shows the methodological evolution of SD load forecasting approaches. Early studies were predominantly based on conventional similar day approaches combined with classical forecasting methods. Over time, a transition toward intelligent and hybrid approaches can be observed, reflecting the integration of machine learning and advanced data-driven techniques.
Figure 5.
Methodological evolution of similar day load forecasting approaches across different time periods. The stacked bar chart illustrates the relative proportion of methodological categories, highlighting a clear transition from conventional similar day approaches toward intelligent and hybrid forecasting frameworks in recent years.
3.6. Technical Characteristics of Reviewed Studies
The analysis of the reviewed literature reveals several consistent patterns in terms of input variables, forecasting configurations, and methodological preferences.
Regarding input variables, most studies rely primarily on historical load data as the core predictor. In addition, weather-related variables—particularly temperature—are frequently incorporated due to their strong influence on electricity demand. Other variables, such as humidity, wind speed, and solar radiation, are included less consistently. Temporal features, including hour of the day, day of the week, and seasonal indicators, are also commonly used to capture periodic patterns in load behavior.
In terms of forecasting scenarios, the majority of studies focus on regular operating conditions, particularly weekday and weekend load forecasting. However, several works explicitly address special cases such as holidays, which are characterized by more irregular demand patterns. These special day scenarios are generally more challenging due to reduced predictability and deviations from typical consumption behavior.
From a methodological perspective, a clear predominance of hybrid and intelligent approaches can be observed in recent studies. While conventional SD methods remain relevant, especially in simpler or more stable contexts, there is a growing trend toward combining SD selection with machine learning or deep learning techniques. These hybrid approaches aim to improve forecasting accuracy by integrating pattern-based reasoning with data-driven modeling capabilities.
Overall, these findings highlight a transition from traditional, rule-based SD approaches toward more flexible and adaptive frameworks that incorporate additional variables and advanced modeling techniques. These technical characteristics provide important context for understanding the performance results presented in the following subsection.
3.7. Performance Overview Based on MAPE
The performance of the reviewed methods was analyzed using the MAPE. Figure 6 presents the distribution of MAPE values across the proposed taxonomical categories.
Figure 6.
Box plot charts for the different MAPE values—hourly, daily, weekly, and monthly—reported in the reviewed works. The graphs were produced according to the classification of the proposed methodology: (a) conventional SD + conventional forecasting models; (b) conventional SD + intelligent forecasting models; (c) intelligent SD + conventional forecasting models; (d) intelligent SD + intelligent forecasting models; and (e) hybrid SD forecasting models. Figure (f) shows the comparative boxplot of the daily MAPE values for the 5 types of models. Note that there were no reported data for weekly MAPES for figures (a,c).
The subsequent results follow:
- The best and most consistent results are obtained with Hybrid approaches (Figure 6e), despite some outliers; the results show the lowest variability;
- The second-best results (second-lowest variability across all approaches) were obtained from conventional SD + intelligent forecasting models (Figure 6b), with some outliers;
- Resultant MAPE value for intelligent SD + intelligent forecasting models (Figure 6d) shows the widest interquartile range (IQR) for daily and monthly MAPEs, but with minimum variability between the lowest and highest MAPE values, that is, very short whisker length;
- The largest number of results reported across all methodologies corresponds to the daily MAPE. For this reason, Figure 6f shows a comparison of the daily MAPE values obtained by all methodologies. The best results are achieved with conventional SD + intelligent forecasting models and hybrid SD approaches (combined similarity + combined forecasting), with low MAPE values and low variability. It is important to highlight that conventional SD + conventional forecasting models achieve excellent results comparable to those of intelligent methods, demonstrating the effectiveness of the method.
3.8. Key Findings from the Reviewed Studies
Building on the technical characteristics described previously, several key findings emerge from the reviewed studies.
First, the selection of similarity variables is a critical factor for forecasting performance, with historical load and temperature consistently identified as the most influential predictors.
Second, methods that employ more advanced similarity-definition techniques–such as clustering, weighted metrics, or intelligence-based procedures—generally outperform those based on fixed distance rules.
Third, the integration of intelligent techniques in either the SD selection or forecasting stage enhances accuracy, particularly under nonlinear and evolving demand conditions.
Finally, hybrid approaches—where similarity and forecasting are tightly coupled—offer a practical balance between interpretability and accuracy, emerging as one of the most promising directions for SD-based short-term load forecasting.
4. Discussion
While the previous section provides a structured overview of the reviewed studies, a deeper analysis is required to interpret the observed patterns and their implications. This section presents a cross-cutting discussion of methodological performance, limitations, and emerging trends, with particular emphasis on the conditions under which Similar-Day approaches are effective or fail, and their practical relevance for power system applications.
4.1. Cross-Cutting Comparison
A cross-cutting comparison of the reviewed methodologies reveals clear trade-offs across several key dimensions, including accuracy, robustness, interpretability, and implementation complexity.
In terms of accuracy, hybrid Similar-Day approaches and intelligent SD combined with advanced forecasting models consistently achieve the best performance, while conventional SD combined with classical forecasting methods tends to show lower accuracy, particularly in complex or highly dynamic systems.
Regarding robustness, conventional approaches are more vulnerable to regime changes and extreme events, such as those caused by behavioral shifts, electrification trends, or climate variability. Although intelligent and hybrid approaches generally exhibit improved adaptability, they still require additional mechanisms—such as data augmentation or specialized modules—to effectively handle rare or anomalous conditions.
From the perspective of interpretability, conventional Similar-Day methods remain the most transparent, as their decision-making process is directly linked to observable historical patterns. Intelligent SD approaches based on clustering offer a moderate level of interpretability, while fully intelligent and hybrid models tend to behave as black-box systems unless explainable artificial intelligence (XAI) techniques [109] are incorporated.
These methodological differences are also reflected in their data and infrastructure requirements. Conventional approaches require minimal data and computational resources, whereas intelligent and hybrid methods demand more extensive datasets, higher computational capacity, and more sophisticated model tuning. Similarly, implementation complexity increases progressively from conventional to intelligent and hybrid approaches.
Overall, these results indicate that no single methodology is universally optimal. Instead, the selection of an appropriate approach depends on the specific operational context, including data availability, system variability, and the required balance between accuracy, interpretability, and computational cost.
To provide a structured comparison of the reviewed methodologies, Table 8 summarizes their main advantages, limitations, and typical conditions under which each approach performs best.
Table 8.
Comparative analysis of methodologies, including examples with their advantages, disadvantages, and the situations in which they perform best.
This comparison highlights that methodological selection involves clear trade-offs between accuracy, interpretability, robustness, and implementation complexity. Building on this comparison, the following section provides a deeper analysis of the underlying mechanisms driving these differences, as well as the emerging trends shaping the evolution of Similar-Day approaches.
4.2. Analytical Insights and Emerging Trends
Beyond methodological categorization, the reviewed literature reveals a set of recurring patterns that explain not only how these approaches perform but also why certain strategies consistently outperform others under specific conditions.
In particular, the evolution of SD methods highlights the growing importance of similarity definition, data structure, and system dynamics over the mere selection of forecasting models. At the same time, emerging challenges such as structural changes in load behavior, increasing system complexity, and the need for uncertainty quantification are reshaping the way forecasting methodologies are designed and applied.
The following subsections synthesize these insights, identifying key trends and conceptual advances that characterize the current state and future direction of SD approaches in power system load forecasting.
4.2.1. SD Is Not Obsolete; It Is Being “Upgraded”
Despite the rapid growth of machine learning and deep learning techniques, the SD principle remains a fundamental component of operational load forecasting. Its persistence is explained by its intuitive nature and strong alignment with operator experience.
The continued relevance of SD can be attributed to the following:
- (a)
- Its intuitive logic based on identifying historical days with similar conditions;
- (b)
- Its strong alignment with operator expertise and calendar/weather heuristics;
- (c)
- Its ability to provide transparent and interpretable forecasting frameworks.
However, what is evolving is not the SD principle itself, but the way in which similarity and forecasting are implemented. Traditional approaches based on simple averages or regression models are being progressively replaced by more advanced techniques, including machine learning and deep learning models such as LSTM, GRU, support vector machines, ensemble methods, and probabilistic forecasting frameworks.
This evolution is reflected in the increasing adoption of hybrid and intelligent SD approaches, indicating that SD is not being replaced, but rather integrated into modern data-driven forecasting frameworks.
4.2.2. Why the Similarity Definition Matters More than “Just a Better Model”
The taxonomy and reported percentages indicate that differences in Similar-Day approaches are largely driven by the choice of distance metrics and input variables used to define similarity. Even when powerful machine learning models are employed, their performance is constrained by the quality of the input data, as similarity definition effectively determines what the model can learn.
The performance results show that simply replacing classical models (e.g., ARIMA or regression) with ANN or LSTM yields limited improvements if similarity is not properly defined. In contrast, the largest gains are achieved when Similar-Day sets are carefully constructed using techniques such as clustering, weighted metrics, or grey relational analysis, and combined with ML/DL models trained on structurally consistent data.
This supports a two-stage design philosophy: first, define similarity through appropriate data selection and feature engineering; and second, apply a suitable forecasting model.
4.2.3. Structural Breaks: Where SD Is Weakest and Where Research Is Still Needed
Several structural disruptors where classical SD approaches fail can be identified:
- Social shifts: COVID-19, hybrid work, informal bridge holidays, etc.
- Climate extremes: heat waves, cold snaps, hurricanes, floods and, wildfires.
- New loads: data centers, crypto mining, EV charging and, behind-the-meter PV.
From a quantitative perspective, very few methods are specifically designed for anomalous or extreme conditions, and forecasting errors during such periods can increase significantly (e.g., MAPE values exceeding 40% during blackout days). Moreover, most SD definitions are calibrated on “normal” years and fail to capture emerging regimes, such as:
- Weekend peaks exceeding weekday peaks;
- Pronounced midday troughs due to PV generation;
- Sudden EV-charging surges.
These limitations reveal critical gaps:
- Data scarcity for extreme events;
- Nonstationary conditions driven by climate and behavioral changes;
- Poor representation of new demand drivers (e.g., Behind-the-Meter PV, EVs, large industrial loads, market price signals).
Addressing these challenges requires approaches such as synthetic data generation, extreme-event–specific models, and the integration of XAI for anomaly diagnosis, which are aligned with current ML trends and are feasible for TSOs and ISOs.
4.2.4. The Rise of Clustering and Hybrid Architectures: Why This Makes Sense
The reported percentages indicate that clustering-oriented methods (e.g., K-means, K-medoids, SOM, and fuzzy C-means) represent a significant fraction of intelligent and hybrid SD approaches. In this context, clustering can be understood as a form of structural segmentation of the load time series based on season, day type, temperature regime, or load shape.
Once clustering is applied, several advantages emerge:
- Each cluster becomes more homogeneous, making it easier to model with simpler or specialized algorithms.
- Cluster-specific models can be designed to capture local behavior (e.g., high-temperature vs. mild conditions).
- Clusters can often be interpreted in physical terms (e.g., summer cooling regime, winter heating regime).
This approach helps reconcile the trade-off between accuracy and interpretability. On one hand, the Similar-Day concept remains intuitive—forecasting is based on historical days that exhibit similar behavior. On the other hand, machine learning models, which are often opaque, can be complemented by clustering and XAI techniques to provide insight into which cluster and variables drive the forecast.
In operational environments, this interpretability is critical. System operators are more likely to trust and adopt AI-based forecasting when the model can be explained in terms of recognizable conditions, such as a high-temperature weekday in summer with a characteristic peak demand pattern.
4.2.5. Deterministic vs. Probabilistic SD: The Next Frontier
The reviewed literature shows that most SD approaches are deterministic, focusing on point forecasts and reporting performance through metrics such as MAPE. However, a smaller subset of more recent studies has begun to explore probabilistic formulations, including quantile regression and interval forecasting based on deep learning models.
In the current context of increasing uncertainty—driven by extreme events, renewable integration, and the growth of behind-the-meter generation—probabilistic forecasting becomes essential. In particular, it enables:
- Risk-aware unit commitment and reserve allocation.
- Better alignment with security-constrained economic dispatch under uncertainty.
- The provision of realistic confidence intervals instead of a single deterministic trajectory.
From a methodological perspective, Similar-Day approaches are naturally well-suited for probabilistic forecasting. Each similar day can be interpreted as a sample of possible system behavior under comparable conditions, allowing the direct estimation of:
- Load distributions or quantiles.
- Scenario sets for stochastic optimization.
Despite these advantages, the development of fully probabilistic SD frameworks remains limited compared to traditional point-forecasting approaches, representing a clear and promising direction for future research.
4.2.6. Interpretable and Explainable SD
Beyond the methodological advances shown in this work, another opportunity to strengthen similar day forecasting lies in integrating XAI. So far, SHapley Additive exPlanations (SHAP) have been employed to interpret a forecasting model by quantifying the contribution of each input variable for load forecasting [58]. However, it can also be used in extreme conditions—such as heat waves, sudden behavioral shifts, or atypical system events—that often disrupt the assumptions under which traditional SD models operate. Under these non-standard conditions the importance of input variables can shift dynamically, making model interpretation essential. Recent studies have shown that XAI tools can find changes in variable importance during anomalous periods [110]; thus, they could help diagnose when a forecasting model relies on unstable or non-representative patterns [111]. Techniques such as SHAP [112] provide transparent insight into why certain days are selected as similar and how their features influence the forecast. By improving interpretability under stress conditions, XAI can make SD-based short-term forecasting more robust and trustworthy, representing a promising and practical direction for future research.
In this context, XAI techniques can:
- Reveal changes in variable importance (e.g., humidity or wind-chill becoming more influential).
- Identify when models rely on unstable or outdated features.
- Distinguish between data quality issues and genuine regime shifts.
For SD approaches specifically, XAI could provide answers to key operational questions:
- Why were certain days selected as similar?
- Which variables are driving the similarity or clustering process?
- When large errors occur, which features contributed to the misprediction?
This level of transparency is particularly valuable in operational environments, as it transforms SD-based forecasting from a black-box system into a tool that can be interpreted, audited, and improved collaboratively by engineers and data scientists.
4.3. Practical Implications for Power System Operators
Bringing all of this together, the quantitative evidence and analysis suggest the following practical takeaways for control-center and TSO/ISO environments, where load forecasting is a critical operational process:
- Keep SD approaches, but modernize them:SD methods should not be abandoned, but integrated into clustering, decomposition, and machine learning pipelines to enhance performance while preserving their intuitive foundation.
- The first step is to invest in similarity definition:It is essential to identify the key variables that define similarity in the system—such as load, temperature, humidity, photovoltaic generation, electric vehicle penetration, and calendar effects—and refine SD selection using clustering, grey relational analysis, or correlation-based methods.
- Use hybrid architectures as a default strategy:Combining SD selection with signal decomposition techniques (e.g., wavelets, EMD, VMD), machine learning or deep learning models, and residual correction improves both accuracy and robustness.
- Design explicit strategies for extreme events:Dedicated SD models for anomalous conditions and the use of synthetic data or scenario generation are necessary to address data scarcity and improve performance under rare but critical events.
- Move toward probabilistic SD-based forecasting:The use of similar-day ensembles, quantile methods, and interval forecasts enables more robust decision-making under uncertainty.
- Adopt XAI for trust and diagnosis:Integrating explainable AI techniques, such as SHAP, allows operators to interpret feature contributions, understand clustering behavior, and diagnose forecasting errors.
5. Conclusions
This review synthesized more than two decades of Similar Day-based short-term load forecasting research and proposed a unified taxonomy that organizes existing methods according to the similarity-definition mechanism, the forecasting model, and their integration strategy. This framework enables a clearer understanding of the evolution of SD approaches, from rule-based formulations to intelligent and hybrid architectures.
The analysis confirms that, despite the increasing adoption of artificial intelligence techniques, SD-based methods remain widely used due to their intuitive nature, low implementation cost, and strong connection to operational knowledge. However, their traditional formulations are increasingly challenged by structural changes in power systems, including social shifts (e.g., post-COVID behavioral patterns and hybrid work), climate-driven extreme events, the emergence of new large and distributed loads, and the growing impact of behind-the-meter generation. These factors introduce nonstationarity and increased variability that cannot be fully captured by conventional similarity rules.
In this context, the evidence indicates that the future of SD-based forecasting lies not in its replacement, but in its transformation. Enhancing similarity definitions through richer explanatory variables and adaptive strategies, together with the integration of clustering, machine learning, and hybrid modeling approaches, enables more accurate and flexible forecasting frameworks. In particular, hybrid architectures provide a practical balance between interpretability and accuracy, while probabilistic formulations offer a pathway to address uncertainty under increasingly complex operating conditions.
Finally, this work identifies key directions for future research:
- Systematic evaluation of SD methods under extreme conditions and other atypical operating conditions.
- Standardization of similarity metrics and variable sets to facilitate method comparison and reproducibility across systems and regions.
- Integration of high-resolution meteorological forecasts and climate information into SD selection and forecasting models.
- Improved representation of emerging demand drivers,
- Broader adoption of probabilistic and explainable AI techniques to quantify uncertainty and improve model transparency, particularly under stress scenarios.
These developments are essential to ensure reliable, transparent, and robust forecasting in modern power systems.
Author Contributions
Conceptualization, M.B.; methodology, M.B. and L.C.-L.; software, G.R.-C. and V.M.A.; validation, G.L.L. and E.d.J.C.A.; formal analysis, M.B.; investigation, M.B. and L.C.-L.; resources, G.R.-C., G.L.L. and E.d.J.C.A.; data curation, G.R.-C. and E.d.J.C.A.; writing—original draft preparation, M.B. and L.C.-L.; writing—review and editing, M.B. and L.C.-L.; visualization, M.B.; supervision, M.B.; project administration, M.B.; funding acquisition, M.B., L.C.-L., G.R.-C., G.L.L., V.M.A. and E.d.J.C.A. All authors have read and agreed to the published version of the manuscript.
Funding
This research received no external funding.
Data Availability Statement
All data used in this work is available online.
Acknowledgments
M.B. thanks SECIHTI for her “Investigadoras e Investigadores por México” research position with I.D. 71557 and CENIDET-TECNM for its hospitality and support. E.J.C.A. acknowledges the support provided by SECIHTI during his postdoctoral period. He also acknowledges the support of CENIDET for the development of this work. The authors thank Raul Garduno for his invaluable support.
Conflicts of Interest
The authors declare no conflicts of interest.
Abbreviations
The following abbreviations are used in this manuscript:
| AI | Artificial Intelligence |
| ANNs | Artificial Neural Networks |
| ARIMA | Auto Regressive Integrated Moving Average |
| BTM | Behind-the-Meter (Generation) |
| DL | Deep Learning |
| EMD | Empirical Mode Decomposition |
| GBoost | Gradient Boosting |
| GRU | Gated Recurrent Unit |
| ISO | Independent System Operator |
| LSTM | Long Short-Term Memory |
| MAPE | Mean Absolute Percentage Error |
| ML | Machine Learning |
| MLOps | Machine Learning Operations |
| NSDAR | Neural-based Similar Day Auto Regression |
| NERC | North American Electric Reliability Council |
| NN | Neural Network |
| PSO | Particle Swarm Optimization |
| PV | Photovoltaic |
| RBF | Radial Basis Function |
| RF | Random Forest |
| SDs | Similar Days |
| SHAP | SHapley Additive exPlanations |
| SOM | Self-Organizing Map |
| SVR | Support Vector Regression |
| SVM | Support Vector Machine |
| STLF | Short-Term Load Forecast |
| TSO | Transmission System Operator |
| VMD | Variational Mode Decomposition |
| XAI | Explainable Artificial Intelligence |
| XGBoost | Extreme Gradient Boosting |
References
- Fragkos, P.; Siskos, P. Energy systems analysis and modeling towards decarbonization. Energies 2022, 15, 1971. [Google Scholar] [CrossRef] [Scilit]
- Russo, M.A.; Carvalho, D.; Martins, N.; Monteiro, A. Forecasting the inevitable: A review on the impacts of climate change on renewable energy resources. Sustain. Energy Technol. Assess. 2022, 52, 102283. [Google Scholar] [CrossRef] [Scilit]
- Cengiz, E.; Yilmaz, C.; Yilmaz, E.N.; Tolga Kahraman, H. Importance of power flow and load analysis in pre-installation power systems. In Proceedings of the 2019 3rd International Symposium on Multidisciplinary Studies and Innovative Technologies (ISMSIT), Ankara, Turkey, 11–13 October 2019; IEEE: Piscataway, NJ, USA, 2019; pp. 1–4. [Google Scholar]
- Soliman, S.A.H.; Al-Kandari, A.M. Electrical Load Forecasting: Modeling and Model Construction; Elsevier: Amsterdam, The Netherlands, 2010. [Google Scholar]
- Hahn, H.; Meyer-Nieberg, S.; Pickl, S. Electric load forecasting methods: Tools for decision making. Eur. J. Oper. Res. 2009, 199, 902–907. [Google Scholar] [CrossRef] [Scilit]
- Iskandarnia, E.; Al-Amal, H.; Al-Madany, W. Load forecasting in different scale and horizon—A review. In Proceedings of the 3rd Smart Cities Symposium (SCS 2020), Online, 21–23 September 2020; pp. 464–470. [Google Scholar]
- Kuster, C.; Rezgui, Y.; Mourshed, M. Electrical load forecasting models: A critical systematic review. Sustain. Cities Soc. 2017, 35, 257–270. [Google Scholar] [CrossRef] [Scilit]
- Akhtar, S.; Shahzad, S.; Zaheer, A.; Ullah, H.S.; Killic, H.; Gono, R.; Jasinski, M.; Leonowicz, Z. Short-Term Load Forecasting Models: A Review of Challenges, Progress, and the Road Ahead. Energies 2023, 16, 4060. [Google Scholar] [CrossRef] [Scilit]
- Nti, I.K.; Teimeh, M.; Nyarko-Boateng, O.; Adekoya, A.F. Electricity load forecasting: A systematic review. J. Electr. Syst. Inf. Technol. 2020, 7, 13. [Google Scholar] [CrossRef] [Scilit]
- Mamun, A.A.; Sohel, M.; Mohammad, N.; Haque Sunny, M.S.M.; Dipta, D.R.; Hossain, E. A comprehensive review of the load forecasting techniques using single and hybrid predictive models. IEEE Access 2020, 8, 134911–134939. [Google Scholar] [CrossRef] [Scilit]
- Abu-El-Magd, M.; Shina, N. Short-term load demand modeling and forecasting: A Review. IEEE Trans. Syst. Man Cybern. 1982, 12, 370–382. [Google Scholar] [CrossRef] [Scilit]
- Hong, T. Short Term Electric Load Forecasting. Ph.D. Dissertation, North Carolina State University, Raleigh, NC, USA, 2010. [Google Scholar]
- Dudek, G. Pattern similarity-based methods for short-term load forecasting—Part 1: Principles. Appl. Soft Comput. 2015, 37, 277–287. [Google Scholar] [CrossRef] [Scilit]
- Dudek, G. Pattern similarity-based methods for short-term load forecasting—Part 2: Models. Appl. Soft Comput. 2015, 36, 422–441. [Google Scholar] [CrossRef] [Scilit]
- Fallah, S.N.; Ganjkhani, M.; Shamshirband, S.; Chau, K.W. Computational intelligence on short-term load forecasting: A methodological overview. Energies 2019, 12, 393. [Google Scholar] [CrossRef] [Scilit]
- L’Heureux, A.; Grolinger, K.; Capretz, M.A.M. Transformer-based model for electrical load forecasting. Energies 2022, 15, 4993. [Google Scholar] [CrossRef] [Scilit]
- Bouhamed, O.; Dissem, M.; Amayri, M.; Bouguila, N. Transformer-based deep probabilistic network for load forecasting. Eng. Appl. Artif. Intell. 2025, 152, 110781. [Google Scholar] [CrossRef] [Scilit]
- Wu, M.; Feng, W.; Liu, Y.; Cao, C. Short-term power load forecasting using an improved model integrating GCN and transformer. Appl. Sci. 2025, 15, 7003. [Google Scholar] [CrossRef] [Scilit]
- Staffell, I.; Pfenninger, S. The increasing impact of weather on electricity supply and demand. Energy 2018, 145, 65–78. [Google Scholar] [CrossRef] [Scilit]
- Zhang, T.; Zhang, G.; Lu, J.; Feng, X.; Yang, W. A new index and classification approach for load pattern analysis of large electricity customers. IEEE Trans. Power Syst. 2012, 27, 153–160. [Google Scholar] [CrossRef] [Scilit]
- Mori, H.; Yuihara, A. Deterministic annealing clustering for ANN-based Short-Term load forecasting. IEEE Trans. Power Syst. 2001, 16, 541–551. [Google Scholar]
- Voronin, S.; Partanen, J.; Kauranne, T. A hybrid electricity price forecasting model for the Nordic electricity spot market. Int. Trans. Electr. Energy Syst. 2014, 24, 736–760. [Google Scholar] [CrossRef] [Scilit]
- Nozawa, T.; Konda, M.; Fujibayashi, M.; Imai, M.; Kotani, K.; Sugawa, S.; Ohmi, T. A parallel vector-quantization processor eliminating redundant calculations for real-time motion picture compression. IEEE J. Solid-State Circuits 2000, 35, 1744–1751. [Google Scholar] [CrossRef] [Scilit]
- Lee, C.-Y.; Wu, C.-E. Short-term electricity price forecasting based on similar day-based neural network. Energies 2020, 13, 4408. [Google Scholar]
- Jain, A.; Jain, M.B. Fuzzy modelling and similarity based short term load forecasting using swarm intelligence—A step towards smart grid. In Proceedings of Seventh International Conference on Bio-Inspired Computing: Theories and Applications (BIC-TA 2012); Advances in Intelligent Systems and Computing; Bansal, J., Singh, P., Deep, K., Pant, M., Nagar, A., Eds.; Springer: New Delhi, India, 2013; Volume 202. [Google Scholar]
- Tzortzis, A.M.; Pelekis, S.; Spiliotis, E.; Karakolis, E.; Mouzakitis, S.; Psarras, J.; Askounis, D. Transfer learning for day-ahead load forecasting: A case study on European National Electricity demand time series. Mathematics 2024, 12, 19. [Google Scholar] [CrossRef] [Scilit]
- Klyuev, R.V.; Morgoev, I.D.; Morgoeva, A.D.; Gavrina, O.A.; Martyushev, N.V.; Efremenkov, E.A.; Mengxu, A. Methods of forecasting electric energy consumption: A literature review. Energies 2022, 15, 8919. [Google Scholar] [CrossRef] [Scilit]
- Rahman, S.; Bhatnagar, R. An expert system based algorithm for short term load forecast. IEEE Trans. Power Syst. 1988, 3, 392–399. [Google Scholar] [CrossRef] [Scilit]
- Ruzic, S.; Vuckovic, A.; Nikolic, N. Weather sensitive method for short term load forecasting in Electric Power Utility of Serbia. IEEE Trans. Power Syst. 2003, 18, 1581–1586. [Google Scholar] [CrossRef]
- Mu, Q.; Wu, Y.; Pan, X.; Huang, L.; Li, X. Short-term load forecasting using improved similar days method. In Proceedings of the 2010 Asia-Pacific Power and Energy Engineering Conference, Chengdu, China, 28–31 March 2010; pp. 1–4. [Google Scholar]
- Jin, X. Meteorological factors considered load decoupling forecasting techniques. Adv. Mater. Res. 2011, 354–355, 922–926. [Google Scholar] [CrossRef] [Scilit]
- Jian-Kai, L.; Cattani, C.; Wan-Qing, S. Power load prediction based on fractal theory. Adv. Math. Phys. 2015, 2015, 827238. [Google Scholar] [CrossRef] [Scilit]
- Karimi, M.; Karami, H.; Gholami, M.; Khatibzadehazad, H.; Moslemi, N. Priority index considering temperature and date proximity for selection of similar days in knowledge-based short term load forecasting method. Energy 2018, 144, 928–940. [Google Scholar] [CrossRef] [Scilit]
- Son, J.; Cha, J.; Kim, H.; Wi, Y. Day-ahead short-term load forecasting for holidays based on modification of similar days’ load profiles. IEEE Access 2022, 10, 17864–17880. [Google Scholar] [CrossRef] [Scilit]
- Conde-López, L.; Borunda, M.; Ruiz-Chavarría, G.; Aparicio-Cárdenas, T. A highly accurate and efficient statistical framework for short-term load forecasting: A case study for Mexico. Forecasting 2026, 8, 3. [Google Scholar] [CrossRef] [Scilit]
- Senjyu, T.; Takara, H.; Uezato, K.; Funabashi, T. One-hour-ahead load forecasting using Neural Networks. IEEE Trans. Power Syst. 2002, 17, 113–118. [Google Scholar] [CrossRef] [Scilit]
- Mandal, P.; Senjyu, T.; Uezato, E.; Funabashi, T. Forecasting several-hours-ahead electricity demand using neural network. In Proceedings of the 2004 IEEE International Conference on Electric Utility Deregulation, Restructuring and Power Technologies, Hong Kong, China, 5–8 April 2004; pp. 515–521. [Google Scholar]
- He, Y.J.; Zhu, Y.C.; Gu, J.C.; Yin, C.Q. Similar day selection based neural network model and its application in short-term load forecasting. In Proceedings of the International Conference on Machine Learning and Cybernetics, Guangzhou, China, 18–21 August 2005; Volume 8, pp. 4760–4763. [Google Scholar]
- Mandal, P.; Senjyu, T.; Urasaki, N.; Funabashi, T. A neural network based several-hour-ahead electric load forecasting using similar days approach. Int. J. Electr. Power Energy Syst. 2006, 28, 367–373. [Google Scholar] [CrossRef] [Scilit]
- Mandal, P.; Senjyu, T.; Funabashi, T. Neural networks approach to forecast several hour ahead in electricity prices and loads in deregulated market. Energy Convers. Manag. 2006, 47, 2128–2142. [Google Scholar] [CrossRef] [Scilit]
- Chang-Chun, C.; Min, W. Support vector machines with similar day’s training sample application in short-term load forecasting. In Proceedings of the 2008 Third International Conference on Electric Utility Deregulation and Restructuring and Power Technologies, Nanjing, China, 6–9 April 2008; pp. 1221–1225. [Google Scholar]
- Sun, C.; Song, J.; Li, L.; Ju, P. Implementation of hybrid short-term load forecasting system with analysis of temperature sensitivities. Soft Comput. 2008, 12, 633–638. [Google Scholar] [CrossRef] [Scilit]
- Chen, Y.; Luh, P.B.; Guan, C.; Zhao, Y.; Michel, L.D.; Coolbeth, M.A.; Friedland, P.B.; Rourke, S.J. Short-term load forecasting: Similar day-based wavelet neural networks. IEEE Trans. Power Syst. 2010, 25, 322–330. [Google Scholar] [CrossRef] [Scilit]
- Jain, A.; Jain, B. Fuzzy modeling and similarity based short-term load forecasting using swarm intelligence-a-step towards smart grid. In Proceedings of the 2012 IEEE Power and Energy Society General Meeting, San Diego, CA, USA, 22–26 July 2012; p. 1. [Google Scholar]
- Ebrahimi, A.; Moshari, A. Holidays short-term forecasting using fuzzy improved similar day method. Int. Trans. Electr. Energy Syst. 2013, 23, 1254–1271. [Google Scholar] [CrossRef] [Scilit]
- Eapen, R.R.; Simon, S.P. Performance analysis of combined similar day and day ahead short-term electrical load forecasting using sequential hybrid neural networks. IETE J. Res. 2018, 65, 216–226. [Google Scholar] [CrossRef] [Scilit]
- Song, K.B.; Park, J.D.; Park, R.J. Short term load forecasting algorithm for Lunar New Year’s Day. J. Electr. Eng. Technol. 2018, 13, 591–598. [Google Scholar]
- Barman, M.; Choudhury, N.B.D. A similarity based hybrid GWO-SVM method of power system load forecasting for regional special event days in anomalous load situations in Assam, India. Sustain. Cities Soc. 2020, 61, 102311. [Google Scholar] [CrossRef] [Scilit]
- Gundu, V.; Simon, S.P. Quality analysis of combined similar day and day ahead short-term load forecasting using recurrent neural networks. Sadhana 2022, 47, 43. [Google Scholar] [CrossRef] [Scilit]
- Xiang, M.; Du, S.; Yu, J.; Xu, Y. Short-term load forecasting based on sample weights assignment. Energy Rep. 2022, 8, 783–791. [Google Scholar] [CrossRef] [Scilit]
- Zhang, R.; Zhang, C.; Yu, M. A similar day based short term load forecasting method using wavelet transform and LSTM. IEEJ Trans. Electr. Electron. Eng. 2022, 17, 506–513. [Google Scholar] [CrossRef] [Scilit]
- Wei, S.; He, C.; Zhang, J.; Sun, F.; Jiang, X. Short-term load forecast based on similar daily retrieval and deep learning. In Proceedings of the IEEE IAS Industrial and Commercial Power system Asia (I&CPS Asia), Chongqing, China, 7–9 July 2023. [Google Scholar]
- Ortega, A.; Borunda, M.; Conde, L.; Garcia-Beltran, C. Load demand forecasting using a long-short term memory neural network. In Advances in Computational Intelligence, MICAI 2023; Lecture Notes in Computer Science; Springer: Cham, Switzerland, 2023; Volume 14391. [Google Scholar]
- Jiao, M.; Qi, X.; Mneg, F.; Wang, T.; Hou, Q.; Zheng, X.; Zhou, H. LSTM-RBF short-term load forecasting method based on Gaussian similar days. In Proceedings of the 5th Asia Energy and Electrical Engineering Symposium, Chengdu, China, 23–26 March 2023; pp. 1189–1194. [Google Scholar] [CrossRef] [Scilit]
- Linzi, Z. Short-term power load forecasting based on FA-LSTM with Similar Day Selection. In Proceedings of the IEEE 3rd International Conference on Electronic Technology, Communication and Information (ICETCI), Changchun, China, 26–28 May 2023; pp. 1110–1115. [Google Scholar] [CrossRef] [Scilit]
- Aswanuwath, L.; Pannakkong, W.; Buddhakulsomsiri, J.; Karnjana, J.; Huynh, V.N. A hybrid model of VMD-EMD-FFT, Similar Days Selection Method, Stepwise Regression and Artificial Neural Network for Daily Electricity Peak Load Forecasting. Energies 2023, 16, 1860. [Google Scholar] [CrossRef] [Scilit]
- Aswanuwath, L.; Pannakkong, W.; Buddhakulsomsiri, J.; Karnjana, J.; Huynh, V.N. An improved hybrid approach for daily electricity peak demand forecasting during disrupted situations: A case study of COVID-19 impact in Thailand. Energies 2024, 17, 78. [Google Scholar] [CrossRef] [Scilit]
- Wang, Z.; Xu, M.; Hao, J.; Li, W.; Cheng, S. Research on explainable BiGRU deep learning framework for short term load forecasting in smart power systems. Discov. Artif. Intell. 2025, 5, 407. [Google Scholar] [CrossRef] [Scilit]
- Martínez-Álvarez, F.; Troncoso, A.; Riquelme, J.C.; Aguilar-Ruiz, J.S. Energy time series forecasting based on pattern sequence similarity. IEEE Trans. Knowl. Data Eng. 2011, 23, 1230–1243. [Google Scholar] [CrossRef] [Scilit]
- Feng, Y.; Ryan, S.M. Day-ahead hourly electricity load modeling by functional regression. Appl. Energy 2016, 170, 455–465. [Google Scholar] [CrossRef] [Scilit]
- Martínez-Álvarez, F.; Schmutz, A.; Asencio-Cortés, G.; Jacques, J. A novel hybrid algorithm to forecast functional time series based on patterns sequence similarity with application to electricity demand. Energies 2019, 12, 94. [Google Scholar] [CrossRef] [Scilit]
- Pérez-Chacón, R.; Asencio-Cortés, G.; Martínez-Álvarez, F.; Troncoso, A. Big data time series forecasting based on pattern sequence similarity and its application to the electricity demand. Inf. Sci. 2020, 540, 160–174. [Google Scholar] [CrossRef] [Scilit]
- Jiang, Z.; Zhang, L.; Ji, T. NSDAR: A neural network-based model for similar day screening and electric load forecasting. Appl. Energy 2023, 349, 121647. [Google Scholar] [CrossRef] [Scilit]
- Wang, Z.Y. Development case-based reasoning system for short-term load forecasting. In Proceedings of the 2006 Russia Power Engineering Society General Meeting, Montreal, QC, Canada, 18–22 June 2006; pp. 1–6. [Google Scholar]
- Guo, Y.C.; Niu, D.X. Intelligent short-term forecasting based on pattern-base. In Proceedings of the 2008 International Conference on Machine Learning and Cybernetics, Kunming, China, 12–15 July 2008; pp. 1282–1287. [Google Scholar]
- Guo, Y.C.; Niu, D.X. Short-term load forecasting using support vector regression based on pattern-base. In Proceedings of the 2009 First Asian Conference on Intelligent Information and Database Systems, Dong Hoi, Vietnam, 1–3 April 2009; pp. 336–340. [Google Scholar]
- Duan, P.; Xie, K.; Guo, T.; Huang, X. Short-term load forecasting for electric power systems using the PSO-SVR and FCM clustering techniques. Energies 2011, 4, 173–184. [Google Scholar] [CrossRef] [Scilit]
- Martins, A.; Lagarto, J.; Canacsinh, H.; Reis, F.; Cardoso, M.G.M.S. Short-term load forecasting using time series clustering. Optim. Eng. 2022, 23, 2293–2314. [Google Scholar] [CrossRef] [Scilit]
- Janković, Z.; Vesin, B.; Selakov, A.; Berntzen, L. Gab-SSDS: An AI-Based Similar Days Selection Method for Load Forecast. Front. Energy Res. 2022, 10, 844838. [Google Scholar] [CrossRef] [Scilit]
- Chen, Y.; Luh, P.B.; Rourke, S.J. Short-term load forecasting: Similar day-based wavelet neural networks. In Proceedings of the 2008 7th World Congress on Intelligent Control and Automation, Chongqing, China, 25–27 June 2008; pp. 3353–3358. [Google Scholar]
- Lu, H.; Liu, K. Next day load forecasting using local temperature sensitive information. Key Eng. Mater. 2011, 460–461, 786–791. [Google Scholar] [CrossRef] [Scilit]
- Al-Qahtani, F.H.; Crone, S.F. Multivariate k-nearest neighbor regression for time series data-A novel algorithm for forecasting UK electricity demand. In Proceedings of the 2013 International Joint Conference on Neural Networks (IJCNN), Dallas, TX, USA, 4–9 August 2013; pp. 1–8. [Google Scholar]
- Moazzami, M.; Khodabakhshian, A.; Hooshmand, R. A new hybrid day-ahead peak load forecasting method for Iran’s National Grid. Appl. Energy 2013, 101, 489–501. [Google Scholar] [CrossRef] [Scilit]
- Zheng, H.; Yuan, J.; Chen, L. Short-term load forecasting using EMD-LSTM neural networks with a Xgboost algorithm for feature importance evaluation. Energies 2017, 10, 1168. [Google Scholar] [CrossRef] [Scilit]
- Sun, W.; Zhang, C. A hybrid BA-ELM model based on factor analysis and similar-day approach for short-term load forecasting. Energies 2018, 11, 1282. [Google Scholar]
- Barman, M.; Choudhury, N.B.D.; Sutradhar, S. A regional hybrid GOA-SVM model based on similar day approach for short-term load forecasting in Assam, India. Energy 2018, 145, 710–720. [Google Scholar]
- Liu, Q.; Shen, Y.; Wu, L. A hybrid FCW-EMD and KF-BA-SVM based model for short-term load forecasting. CSEE J. Power Energy Syst. 2018, 4, 226–237. [Google Scholar] [CrossRef] [Scilit]
- Nazar, M.S.; Fard, A.E.; Heidari, A.; Shafie-khah, M.; Catalao, J.P.S. Hybrid model using three-stage algorithm for simultaneous load and price forecasting. Electr. Power Syst. Res. 2018, 165, 214–228. [Google Scholar] [CrossRef] [Scilit]
- Liao, X.; Cao, N.; Li, M.; Kang, X. Research on short-term load forecasting using XGBoost based on similar days. In Proceedings of the International Conference on Intelligent Transportation, Big Data & Smart City (ICITBS), Changsha, China, 12–13 January 2019; pp. 675–678. [Google Scholar] [CrossRef] [Scilit]
- Sun, G.; Cheng, P.; Liu, R. A hybrid short-term load prediction with input selection for the distribution system. In Proceedings of the IEEE 2nd International Conference on Electronic Information and Communication Technology (ICEICT), Harbin, China, 20–22 January 2019; pp. 826–830. [Google Scholar]
- Barman, M.; Choudhury, N.B.D. Season specific approach for short-term load forecasting based on hybrid FA-SVM and similarity concept. Energy 2019, 174, 886–896. [Google Scholar] [CrossRef] [Scilit]
- Huang, W.; Zhang, D.; Song, Z.; Wang, H.; Liu, H. Short-term load forecasting based on similar day approach and intelligent algorithm using analytic hierarchy process. In Proceedings of the IEEE 3rd Information Technology, Networking, Electronic and Automation Control Conference (ITNEC), Chengdu, China, 15–17 March 2019; pp. 2507–2512. [Google Scholar]
- Kong, Z.; Zhang, C.; Lv, H.; Xiong, F.; Fu, Z. Multimodal feature extraction and fusion deep neural network for short-term load forecasting. IEEE Access 2020, 8, 185373–185383. [Google Scholar] [CrossRef] [Scilit]
- Park, R.J.; Song, K.B.; Kwon, B.S. Short-term load forecasting algorithm using a similar day selection method based on reinforcement learning. Energies 2020, 13, 2640. [Google Scholar] [CrossRef] [Scilit]
- Lu, Z.; Zheng, Z.; Wang, H.; Gao, Y.; Lei, Y.; Zhao, M. Study on short-term load forecasting considering meteorological similar days. In Advances in Intelligent Systems and Interactive Applications, ISSA 2019; Advances in Intelligent Systems and Computing; Xhafa, F., Patnaik, S., Tavana, M., Eds.; Springer: Cham, Switzerland, 2020; Volume 1084. [Google Scholar]
- Gunawan, F.; Huang, C.Y. An extensible framework for short-term holiday load forecasting combining dynamic time warping and LSTM network. IEEE Access 2021, 9, 106885–106894. [Google Scholar] [CrossRef] [Scilit]
- Wang, R.; Chen, S.; Lu, J. Electric short-term load forecast integrated method based on time-segment and improved MDSC-BP. Syst. Sci. Control Eng. 2021, 9, 80–86. [Google Scholar] [CrossRef] [Scilit]
- Dudek, G. Short-term load forecasting using neural networks with pattern similarity-based error weights. Energies 2021, 14, 3224. [Google Scholar] [CrossRef] [Scilit]
- Janković, Z.; Selakov, A.; Bekut, D.; Đorđević, M. Day similarity metric model for short-term load forecasting supported by PSO and artificial neural network. Electr. Eng. 2021, 103, 2971–2988. [Google Scholar] [CrossRef] [Scilit]
- Zhao, Z.; Xia, C.; Chi, L.; Chang, X.; Li, W.; Yang, T.; Zomaya, A.Y. Short-term load forecasting based on the transformer model. Information 2021, 12, 516. [Google Scholar] [CrossRef] [Scilit]
- Xiong, J.; Zhou, P.; Chen, A.; Zhang, Y. Attention-based neural load forecasting: A dynamic feature selection approach. In Proceedings of the 2021 IEEE Power & Energy Society General Meeting (PESGM), Washington, DC, USA, 26–29 July 2021; pp. 1–5. [Google Scholar]
- Dong, X.; Deng, S.; Wang, D. A short-term power load forecasting method based on k-means and SVM. J. Ambient. Intell. Humaniz. Comput. 2022, 13, 5253–5267. [Google Scholar] [CrossRef] [Scilit]
- Zhao, Z.; Tang, J.; Liu, J.; Ge, G.; Xiong, B.; Li, Y. Short-term microgrid load probability density forecasting method based on k-means deep learning quantile regression. Energy Rep. 2022, 8, 1386–1397. [Google Scholar] [CrossRef] [Scilit]
- Pang, X.; Sun, W.; Li, H.; Wang, Y.; Luan, C. Short-term power load forecasting based on gray relational analysis and support vector machine optimized by artificial bee colony algorithm. PeerJ Comput. Sci. 2022, 8, e1108. [Google Scholar] [CrossRef] [Scilit]
- Shi, M.; He, X. Shape-aided similar day selection method for short term load forecasting. In Proceedings of 2021 Chinese Intelligent Automation Conference; Lecture Notes in Electrical Engineering; Den, Z., Ed.; Springer: Singapore, 2022; Volume 801, pp. 195–202. [Google Scholar]
- Yang, J.; Tang, Y.; Duan, H. Application of fuzzy support vector machine in short-term power load forecasting. J. Cases Inf. Technol. 2022, 24, 5. [Google Scholar] [CrossRef] [Scilit]
- Wang, X.; Wu, B.; Wu, D.; Wang, W.; Ma, X. Enhanced ES-adRNNe load forecasting with contextual augmentation on similar load days. IEEE Access 2023, 11, 93727–93738. [Google Scholar] [CrossRef] [Scilit]
- Pajić, Z.; Selakov, A. A flexible approach for selection of the training set for ANN-based load forecast using autoencoder and similar day method. In Proceedings of the 2023 IEEE Belgrade Power Tech, Belgrade, Serbia, 25–29 June 2023; pp. 1–5. [Google Scholar]
- Criado-Ramón, D.; Ruiz, L.G.B.; Pegalajar, M.C. An improved patter sequence-based energy load forecast algorithm based on Self-Organizing Maps and artificial neural networks. Big Data Cogn. Comput. 2023, 7, 92. [Google Scholar] [CrossRef] [Scilit]
- Bu, X.; Wu, Q.; Zhou, B.; Li, C. Hybrid short-term load forecasting using CGAN with CNN and semi-supervised regression. Appl. Energy 2023, 338, 120920. [Google Scholar] [CrossRef] [Scilit]
- Xiong, J.; Zhang, T. A unifying framework of attention-based neural load forecasting. IEEE Access 2023, 11, 51606–51616. [Google Scholar] [CrossRef] [Scilit]
- Luo, S.; Wang, B.; Gao, Q.; Wang, Y.; Pang, X. Stacking integration algorithm based on CNN-BiLSTM-Attention with XGBoost for short-term electricity load forecasting. Energy Rep. 2024, 12, 2676–2689. [Google Scholar] [CrossRef] [Scilit]
- Amini, H.; Mehrizi-Sani, A. Similar days fuzzy clustering load forecasting. In Proceedings of the IECON 2024—50th Annual Conference of the IEEE Industrial Electronics Society, Chicago, IL, USA, 3–6 November 2024; pp. 1–5. [Google Scholar]
- Wang, Y.; Hao, Y.; Zhang, B.; Zhang, N. Short-term power load forecasting using SSA-CNN-LSTM method. Syst. Sci. Control Eng. Open Access J. 2024, 12, 2343297. [Google Scholar] [CrossRef] [Scilit]
- Borunda, M.; Ortega Vega, A.; Garduno, R.; Conde, L.; Adam Medina, M.; Ramírez Aparicio, J.; Magallón-Cacho, L.; Jaramillo, O.A. An intelligent method for day-ahead regional load demand forecasting via machine-learning analysis of energy consumption patterns across daily, weekly, and annual scales. Appl. Sci. 2025, 15, 4717. [Google Scholar] [CrossRef] [Scilit]
- Luo, S.; Meng, X.; Pang, X.; Li, H.; Zheng, Z. Optimized hybrid deep learning framework for short-term power load interval forecasting via improved crowned crested porcupine optimization and feature mode decomposition. Algorithms 2025, 18, 659. [Google Scholar] [CrossRef] [Scilit]
- Cheng, Q.; Shi, J.; Cheng, S. Short-term load forecasting based on similar day theory and BWO-VMD. Energies 2025, 18, 2358. [Google Scholar] [CrossRef] [Scilit]
- Zhao, W.; Xu, H.; Chen, P.; Zhang, J.; Li, J.; Cai, T. Elastic momentum-enhanced adaptive hybrid method for short-term load forecasting. Energies 2025, 18, 3263. [Google Scholar] [CrossRef] [Scilit]
- Ali, S.; Abuhmed, T.; El-Sappagh, S.; Muhammad, K.; Alonso-Moral, J.M.; Confalonieri, R.; Guidotti, R.; Del Ser, J.; Díaz-Rodríguez, N.; Herrera, F. Explainable Artificial Intelligence (XAI): What we know and what is left to attain Trustworthy Artificial Intelligence. Inf. Fusion 2023, 99, 101805. [Google Scholar] [CrossRef] [Scilit]
- Alam, K.; Kifayat, K.; Sampedro, G.A.; Karovic, V.; Naeem, T. SXAD: Shapely eXplainable AI-based anomaly detection using log data. IEEE Access 2024, 12, 95659–95672. [Google Scholar] [CrossRef] [Scilit]
- Xiao, Y.; Hu, X.; Lin, Y.; Lu, Y.; Jing, R.; Zhao, Y. Interpretable short-term electricity load forecasting considering small sample heatwaves. Appl. Energy 2025, 398, 126417. [Google Scholar] [CrossRef] [Scilit]
- Lundberg, S.M.; Lee, S.I. A unified approach to interpreting model predictions. In Proceedings of the NIPS’17: Proceedings of the 31st International Conference on Neural Information Processing Systems, Long Beach, CA, USA, 4–9 December 2017; pp. 4768–47777. [Google Scholar]
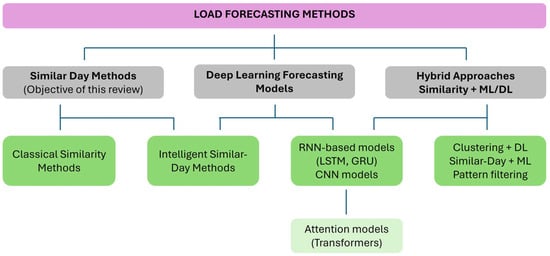
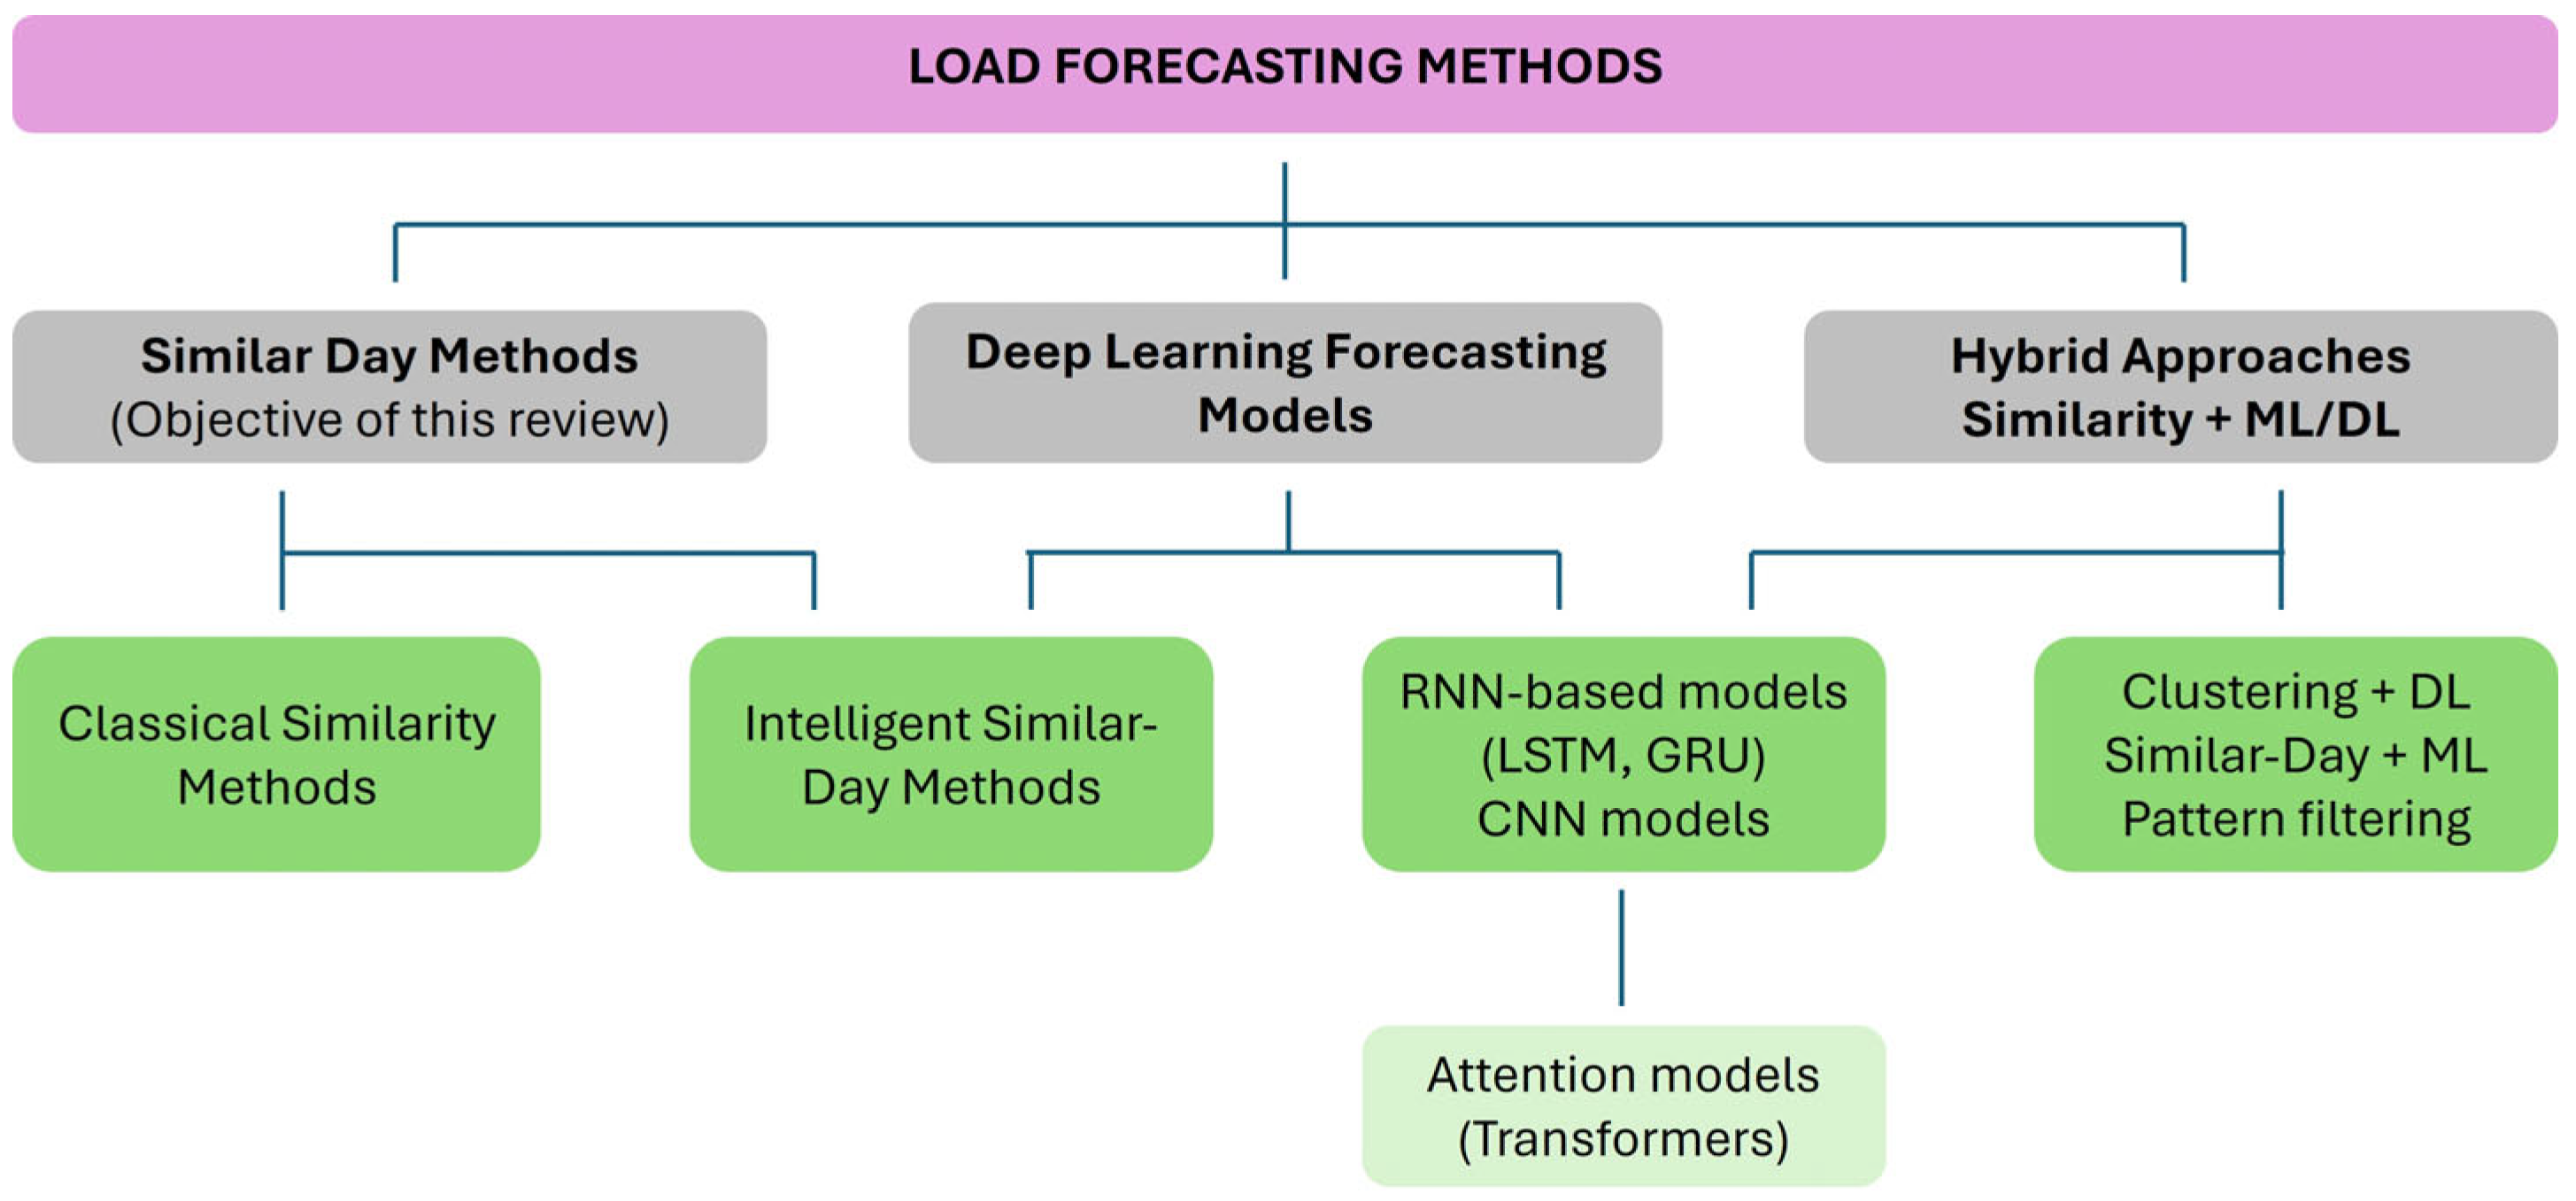
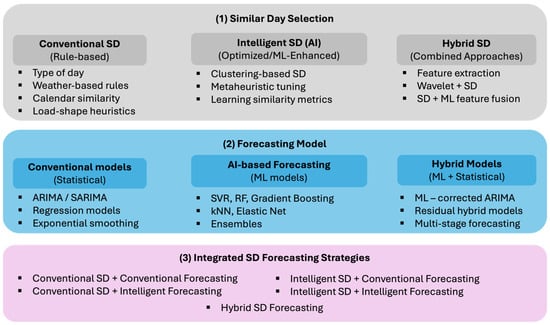
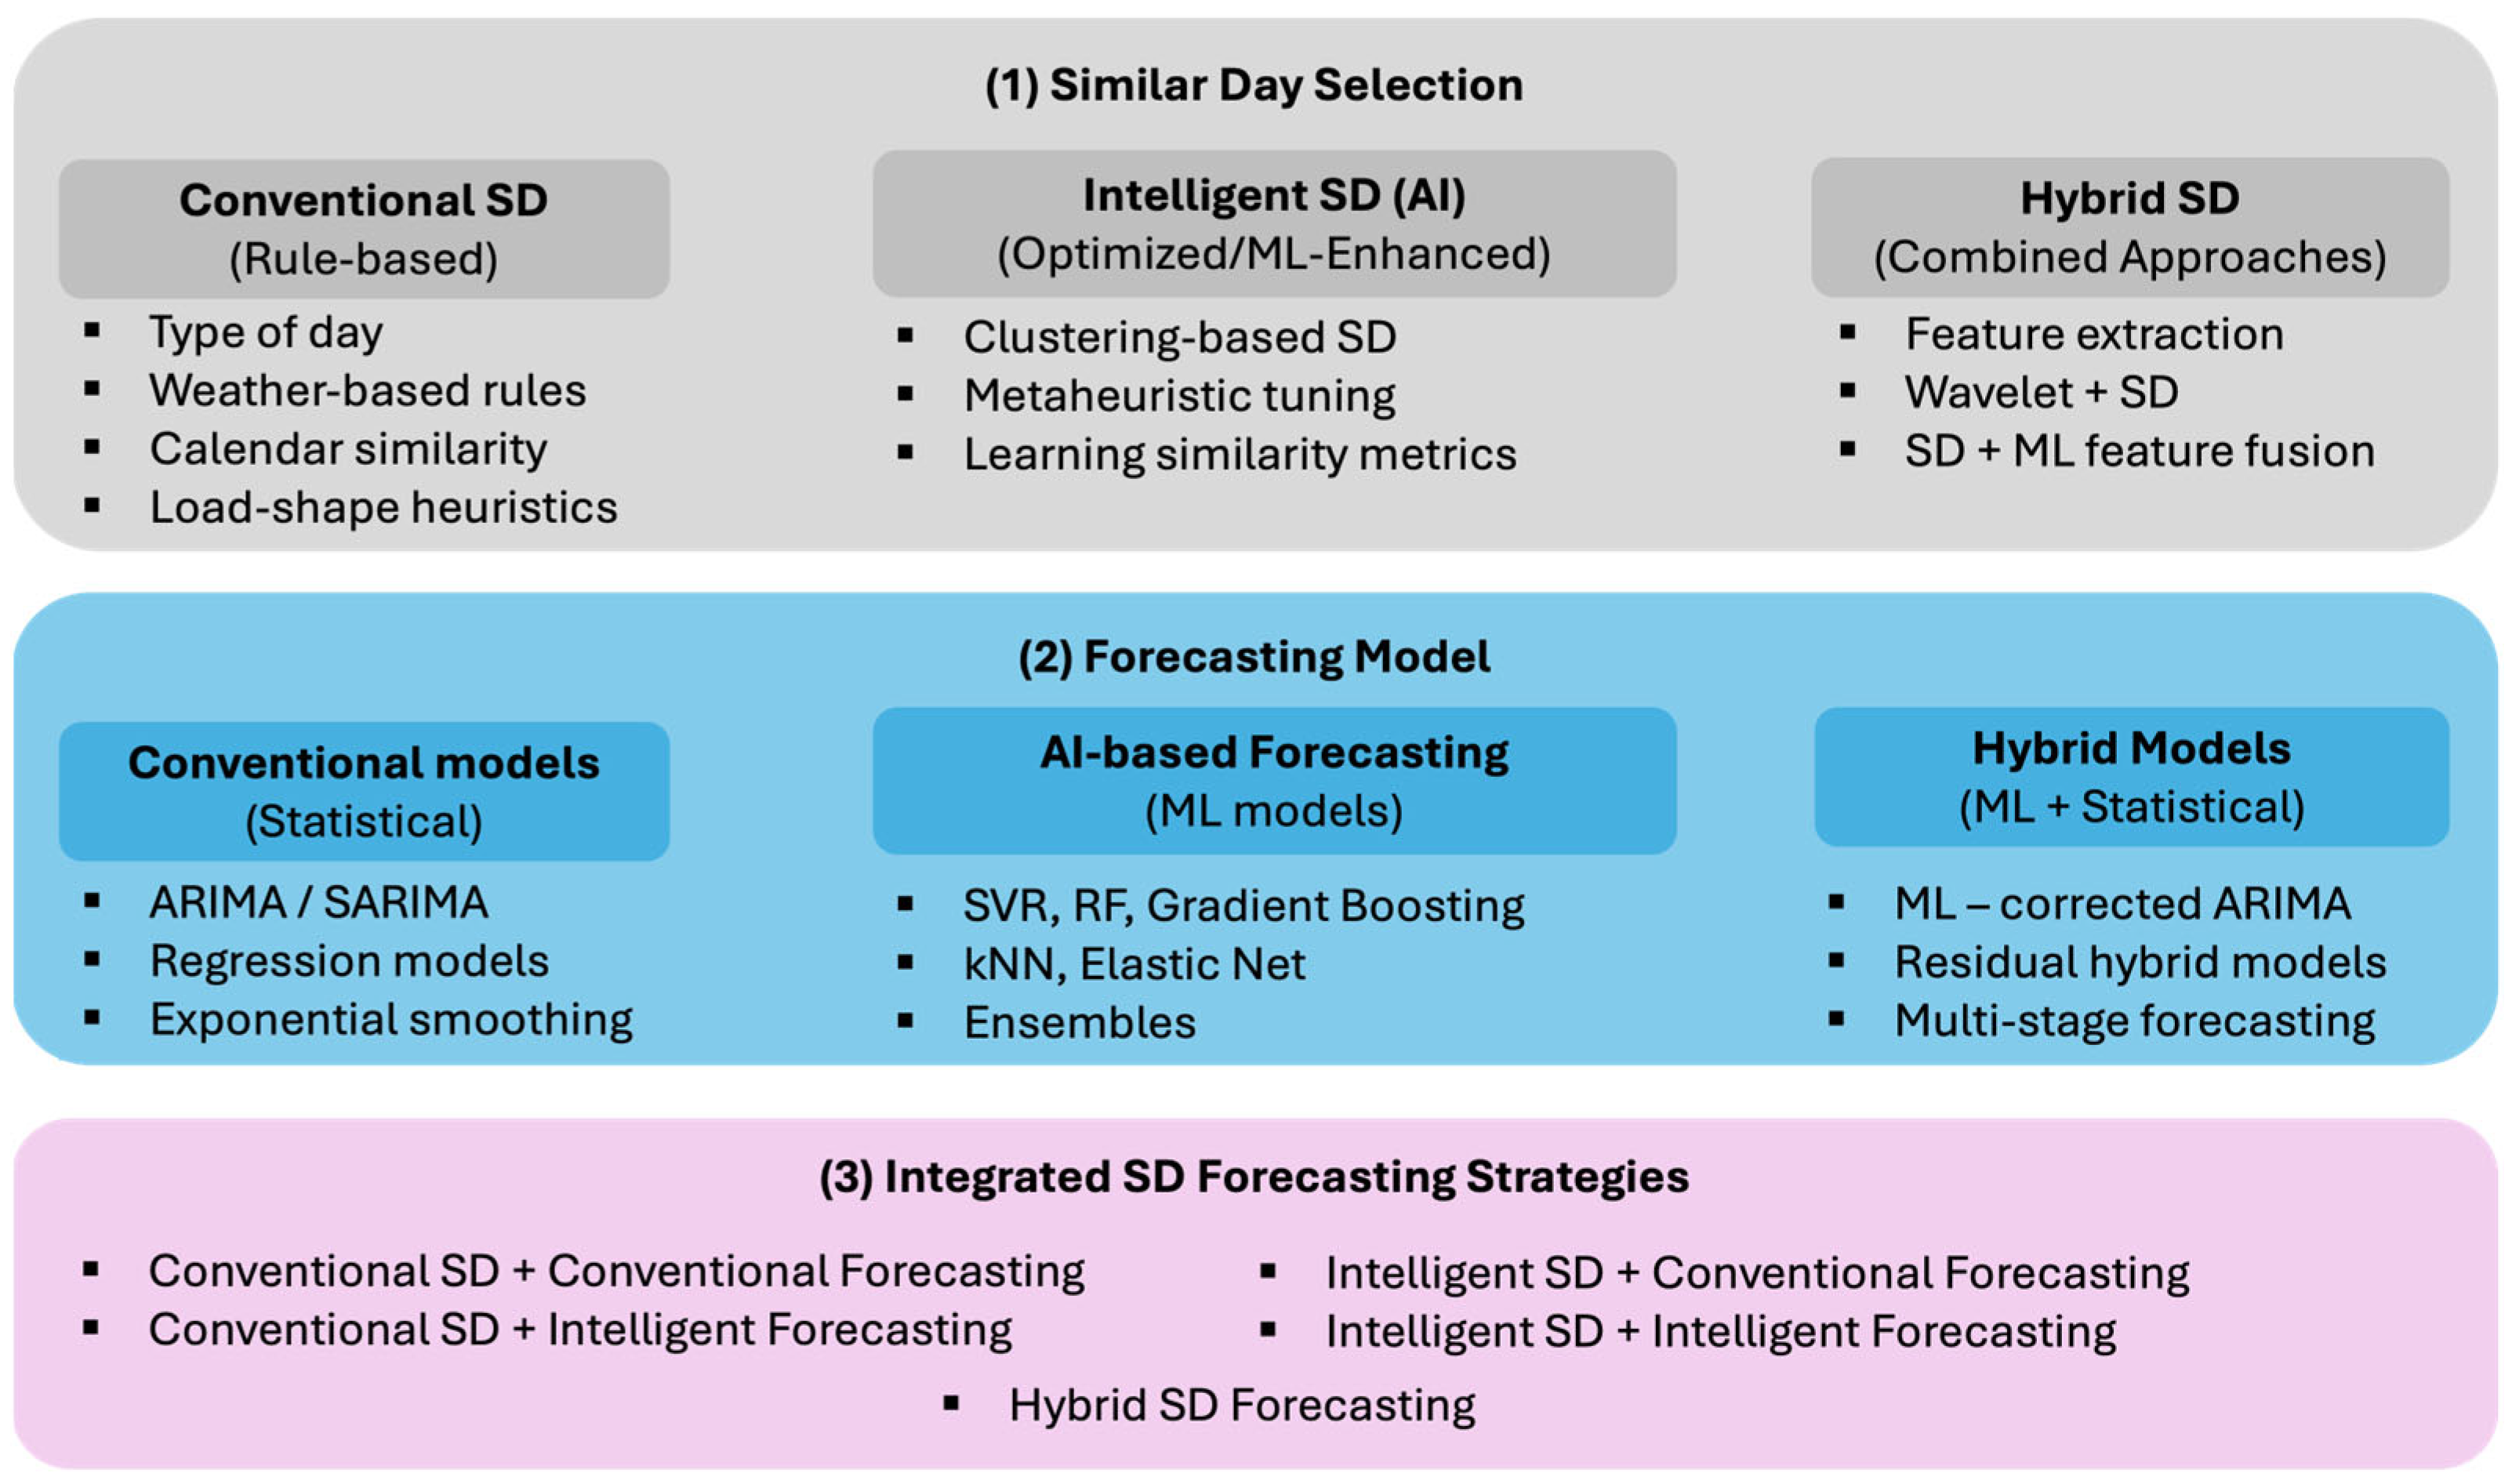
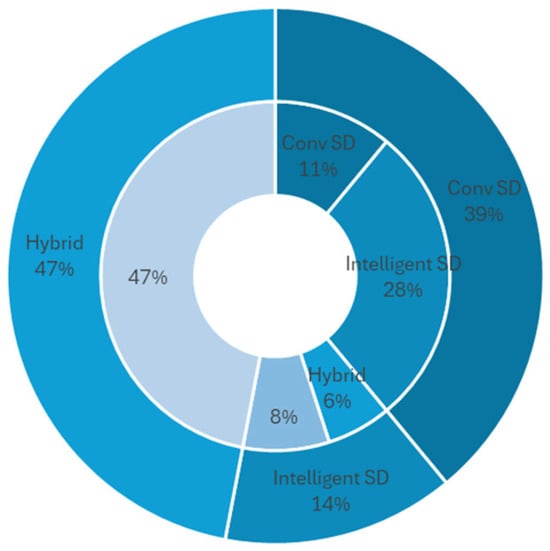
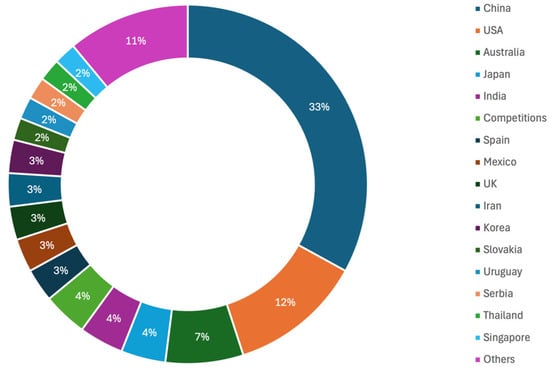
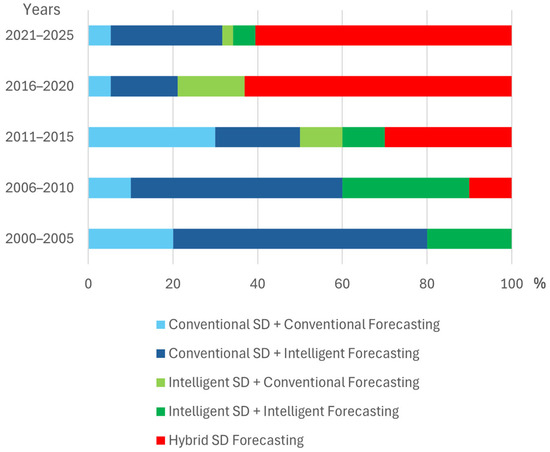
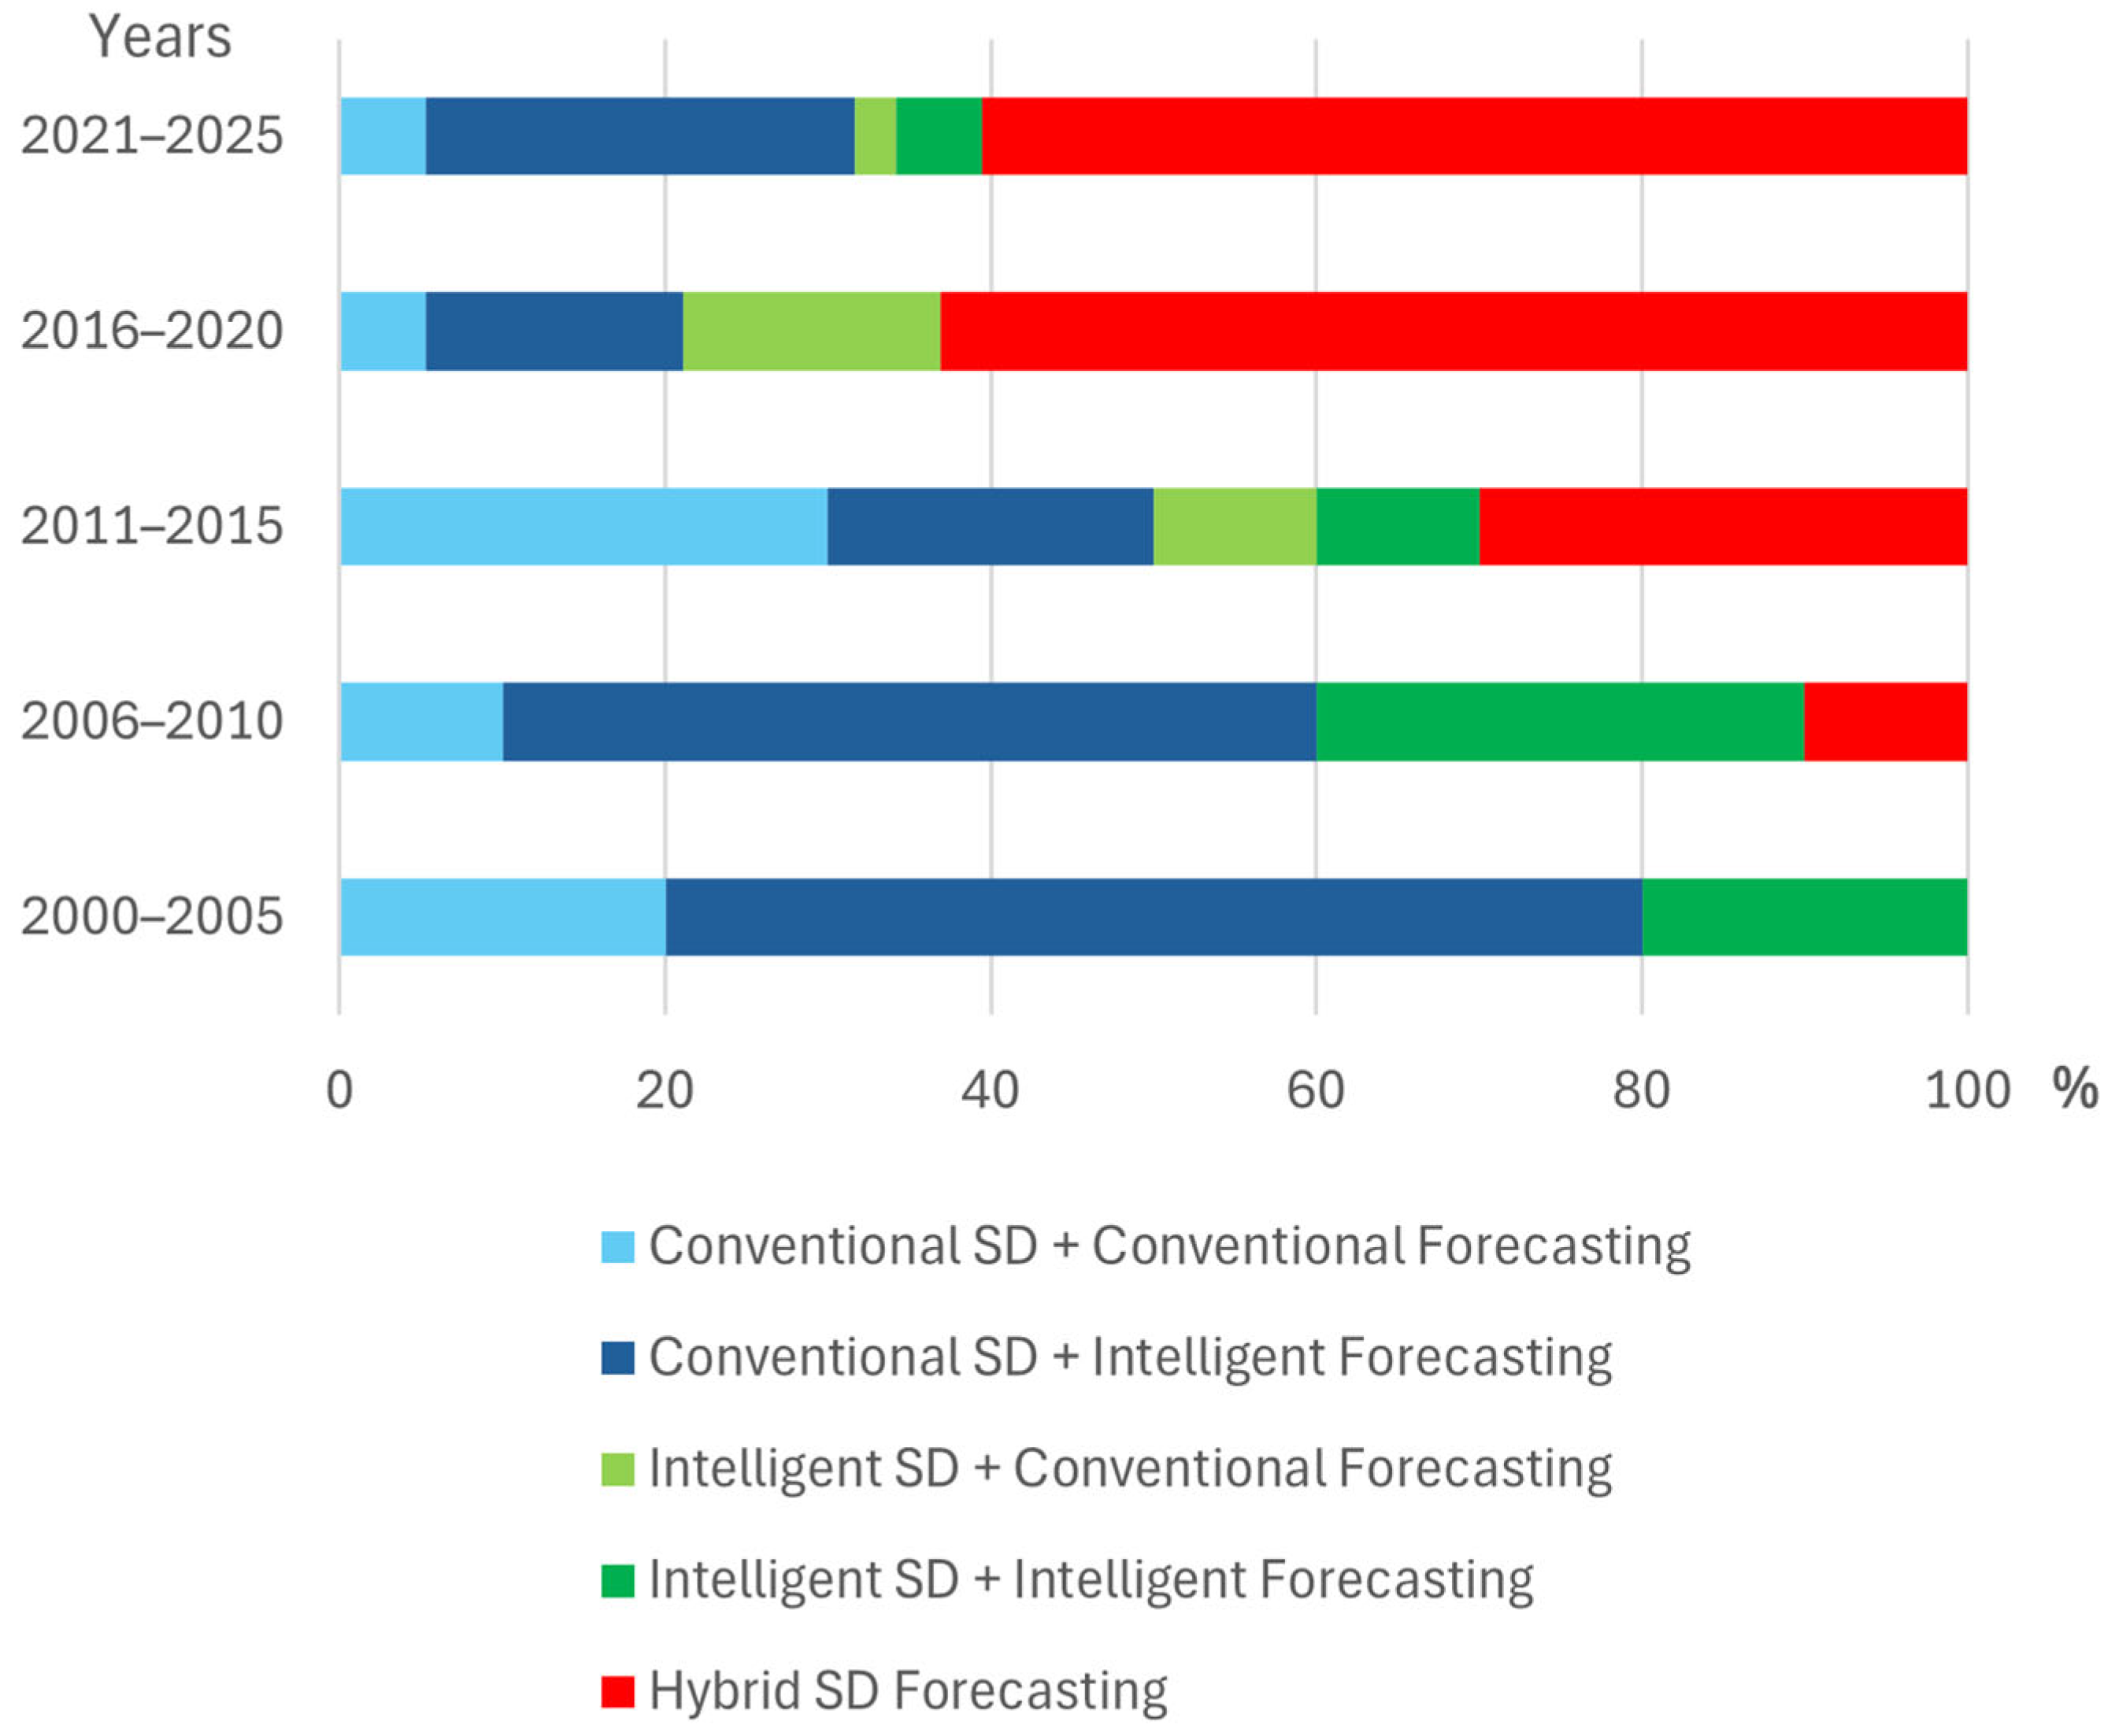
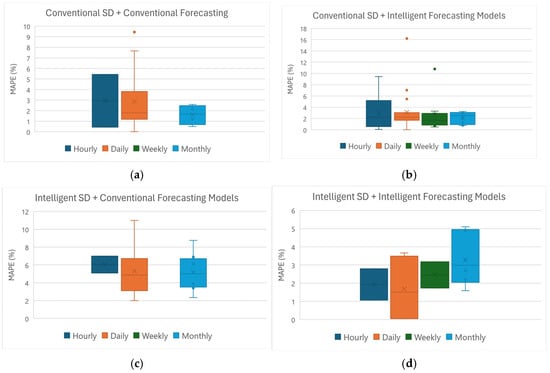
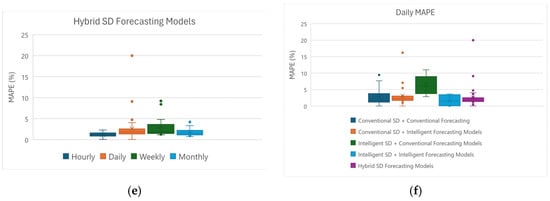
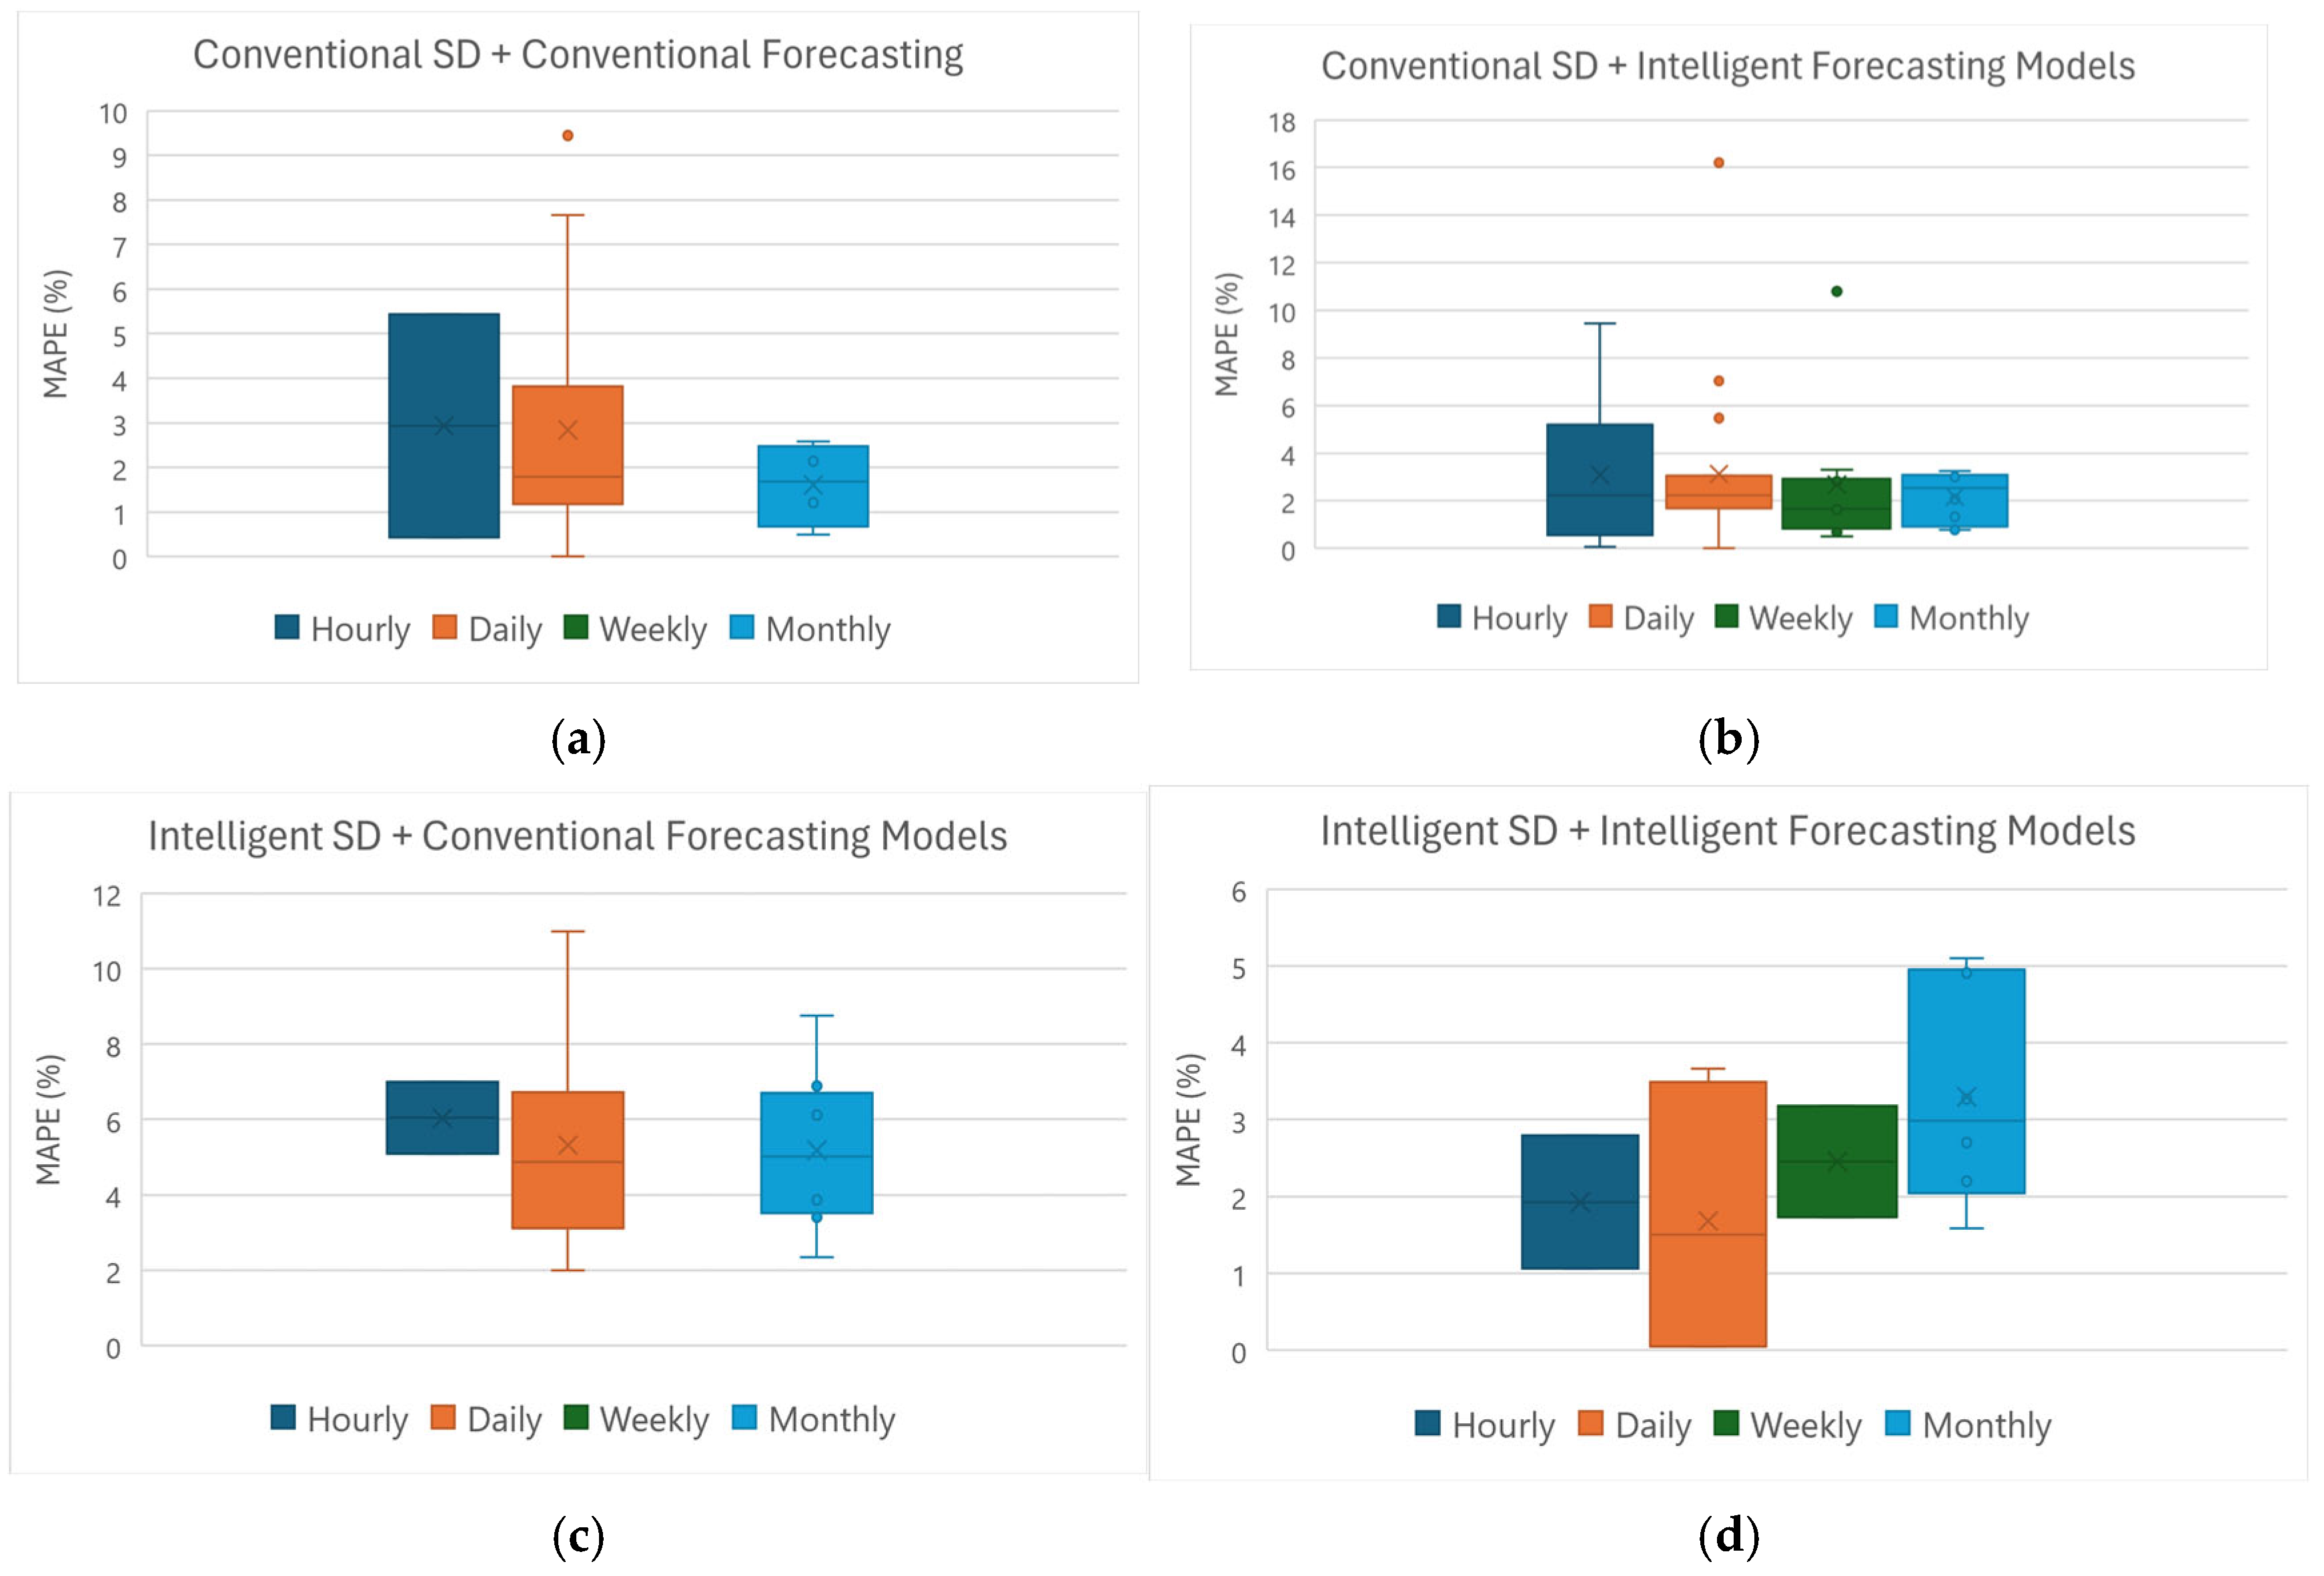
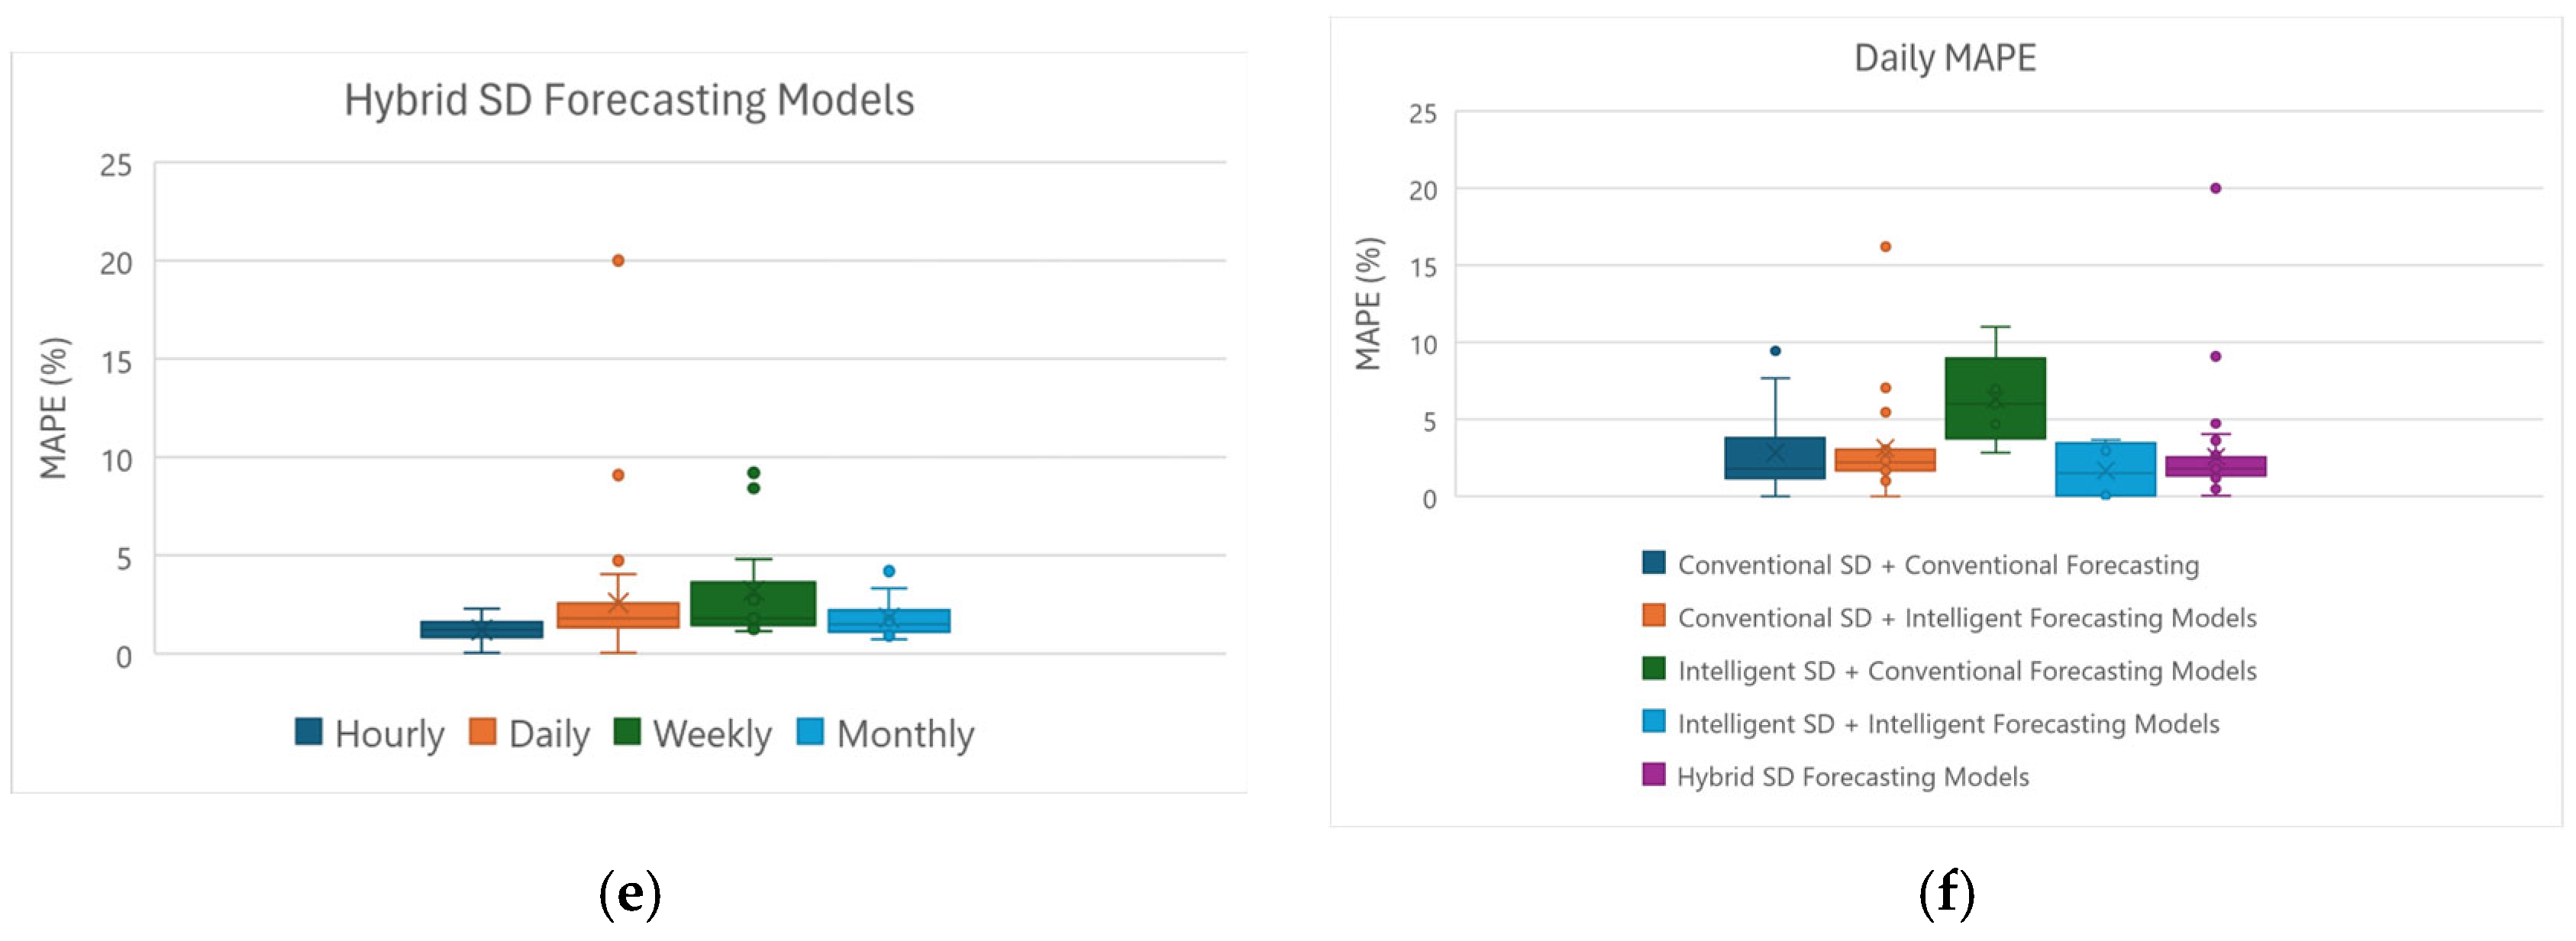

Disclaimer/Publisher’s Note: The statements, opinions and data contained in all publications are solely those of the individual author(s) and contributor(s) and not of MDPI and/or the editor(s). MDPI and/or the editor(s) disclaim responsibility for any injury to people or property resulting from any ideas, methods, instructions or products referred to in the content. |
© 2026 by the authors. Licensee MDPI, Basel, Switzerland. This article is an open access article distributed under the terms and conditions of the Creative Commons Attribution (CC BY) license.