


Highlights
What are the main findings?
- In Mexico, the cement industry is the highest-emitting manufacturing sector, contributing to ~6% of the country’s greenhouse gas (GHG) emissions; in the BAU scenario, direct emissions could increase by 103% from 2024, reaching 66.5 Mt cement with a direct emission intensity of 0.68 t CO2e/t cement. This necessitates urgent action to reduce emissions.
- The analysis showed that the strategies that contribute most to lowering emissions are carbon capture and reducing the clinker-to-cement ratio, followed by reducing thermal energy consumption and substituting petroleum coke with the inorganic fraction of MSW. This reduces 80.1% of direct GHG emissions from the BAU scenario by 2050.
- In Mexico, implementing emission reduction policies in this sector must balance economic growth and infrastructure needs, ensuring that cement demand is fulfilled while pursuing a cleaner industry. Cross-sector collaboration is required to effectively put these measures into practice.
- Introducing large-scale carbon capture initiatives in Mexico requires an assessment of its technological and economic feasibility, considering the current technological maturity and availability, and the need to decarbonise the energy mix to prevent shifting emissions from electricity consumption.
Highlights
What are the main findings?
- In Mexico, the cement industry is the highest-emitting manufacturing sector, contributing to ~6% of the country’s greenhouse gas (GHG) emissions; in the BAU scenario, direct emissions could increase by 103% from 2024, reaching 66.5 Mt cement with a direct emission intensity of 0.68 t CO2e/t cement. This necessitates urgent action to reduce emissions.
- The analysis showed that the strategies that contribute most to lowering emissions are carbon capture and reducing the clinker-to-cement ratio, followed by reducing thermal energy consumption and substituting petroleum coke with the inorganic fraction of MSW. This reduces 80.1% of direct GHG emissions from the BAU scenario by 2050.
What are the implications of the main findings?
- In Mexico, implementing emission reduction policies in this sector must balance economic growth and infrastructure needs, ensuring that cement demand is fulfilled while pursuing a cleaner industry. Cross-sector collaboration is required to effectively put these measures into practice.
- Introducing large-scale carbon capture initiatives in Mexico requires an assessment of its technological and economic feasibility, considering the current technological maturity and availability, and the need to decarbonise the energy mix to prevent shifting emissions from electricity consumption
Abstract
As the world faces the challenge of mitigating climate change, energy- and emissions-intensive industrial processes must be addressed urgently worldwide. The cement production industry accounts for over 8% of global greenhouse gas (GHG) emissions from calcination and fuel use. Mexico, a middle-income economy, has rising cement demand for infrastructure and commercial growth. Thus, this study analysed national cement production, the primary emitting manufacturing industry in the country, under a business-as-usual (BAU) and two alternative scenarios, using a top-down approach to model energy consumption and GHG emissions by 2050. These scenarios follow the projection of national cement production, estimated using socio-economic indicators, which are considered the main drivers of cement demand, reaching 97.3 Mt. A qualitative analysis evaluates the strengths, weaknesses, opportunities, and threats (SWOT) of implementing emission-reduction strategies. The analysis showed that the BAU scenario might reach 66.5 Mt CO2e by 2050, while the most ambitious scenario reduced direct emissions by 80.1% through carbon capture, clinker-to-cement reduction, thermal energy intensity reduction, and the use of municipal solid waste as an alternative fuel. However, incorporating these strategies in Mexico requires a more active role and investment support from key stakeholders.
1. Introduction
The cement production industry represents approximately 8% of the world’s greenhouse gas (GHG) emissions. Most of these are generated by the clinker production process (process-related emissions) and the on-site combustion of fossil fuels to obtain thermal energy (fossil-fuel-related emissions), which are classified as direct emissions from the production process [1].
Cement production is one of the highest-emitting manufacturing industries, contributing to climate change, and its GHG emissions, mainly carbon dioxide (CO2) emissions, must be urgently addressed. However, this industry poses a challenge for emissions mitigation, as its production growth depends directly on the construction sector’s needs for infrastructure development [2,3,4]. These needs are driven by socioeconomic trends such as population growth, urbanisation rate, and gross domestic product (GDP) [4]. In this context, emissions mitigation in cement production aims to satisfy demand while enhancing the sector’s sustainability performance [2,5]. To address the challenge of long-term decarbonisation in the cement industry, it is necessary to estimate future demand and, subsequently, model trajectories of energy consumption and emissions [6].
Achieving decarbonisation in the cement production industry, defined as reducing CO2 and other GHGs like methane (CH4) and nitrous oxide (N2O) in terms of carbon dioxide equivalent (CO2e), requires collaboration among diverse stakeholders in the private sector, policymakers, and society [7,8,9,10]. In many countries, cement production is expected to grow alongside socioeconomic development and infrastructure needs to meet evolving demands [4]. This is the case of Mexico, a middle-income economy, where in 2022, the manufacturing industry represented ~21% of the national GDP (value added), and in the same year, the cement production industry contributed ~6% of the national GHG emissions [11,12]. This situation requires the Mexican cement industry to address long-term emissions reduction of its production processes, as demand is expected to grow in the coming decades. For this purpose, stakeholders must consider strategies such as adjusting the clinker-to-cement ratio, improving thermal energy efficiency, and using alternative fuels alongside carbon capture (CC), which is the most promising strategy for substantially reducing CO2-intensive processes and represents an economic and technological maturity challenge for Mexico.
Literature Review
Worldwide, numerous studies have examined the cement industry’s efforts to reduce emissions. This study conducted a systematic literature review of the past 10 years on this topic (the detailed literature review process can be found in the Supplementary Materials). This literature review highlights the study by Kim et al. [13], which used a top-down approach to project Korea’s cement demand by 2030. The study compared a business-as-usual (BAU) scenario with a reduction scenario and a 2030 roadmap that included emission-reduction strategies such as equipment efficiency improvements, fuel substitution, and waste-heat recovery. Dhar et al. [14] analysed the impact of various strategies across four scenarios for the Indian cement and steel industries using an energy system model that links socio-economic data to emissions and energy use. Strategies included reducing material and energy intensity and lowering CO2 emissions through carbon capture and storage (CCS). The authors concluded that systemic transformation, involving multi-stakeholder engagement and integrated circular-economy policies, is necessary to achieve emission reduction targets. GHG emissions estimations for the industrial sector, disaggregating the cement subsector and modelling scenarios by 2050 for Saudi Arabia and Brazil, and by 2060 for China, highlighted the need for a multi-stakeholder approach to reduce emissions and improve existing strategies, rather than relying on immature technologies [15,16,17].
Focused on Mexico, Castrejón et al. [18] developed and compared two GHG emission reduction scenarios for the electrical, cement, steel, and chemical production sectors by 2070, based on population and economic growth as energy demand drivers. The results indicated that implementing CCS technologies in Mexico’s most emissions-intensive sectors from 2030 to 2070 could reduce emissions by more than half. Islas Samperio et al. [19] compared BAU and low-carbon (LC) scenarios for Mexico’s industrial sector. The LC scenario proposed 15 strategies to reduce emissions after peaking at 226 Mt CO2e in 2030. The authors note that financing is a barrier because a significant annual investment is required. These studies include the cement industry, but an analysis specific to this sector in Mexico is required. To improve comparability across the reviewed studies, Table S3 summarises key differences in country context, modelling approach, and time horizon, and the main findings of seven key studies obtained from the literature review process addressing cement industry emissions mitigation through similar methodologies. The comparison shows that the literature spans multiple analytical perspectives, from national energy system modelling to sector-specific and intersectoral assessments, and that results depend strongly on the selected system boundary and mitigation strategies portfolio. Despite these methodological differences, the studies consistently indicate that deep industrial decarbonisation requires moving beyond incremental efficiency improvements toward a combination of strategies, including clinker substitution, circular economy measures, low-carbon energy use, and carbon capture. Against this background, the present study helps clarify the case of Mexico by examining the cement sector through a dedicated analytical framework and identifying its role within longer-term mitigation pathways.
Most of these studies were conducted at a global, regional, or national level, and only a limited number focused on Latin America. Therefore, the need for studies focusing on emissions and energy consumption, with a detailed breakdown of the cement production process in Mexico, incorporating both scenario modelling and qualitative analysis, highlights a significant research gap. Therefore, this study aims to address this research gap by focusing on emissions mitigation strategies in Mexico’s cement production industry, using quantitative and qualitative analyses and incorporating statistical validation of the production model’s projections.
Mexico, as an emerging economy with significant potential to implement scientific and technological advancements for emissions mitigation, faces structural limitations in research capacity that warrant greater attention. Strengthening this area is essential to foster innovation and support sustainable development in the country. Incorporating advanced tools and analytical strategies will enable a more comprehensive examination of emission-reduction pathways in the cement industry, thereby contributing to both national priorities and global climate commitments.
In response to the cement industry’s concerns regarding energy and emissions, this study explored the current status and the emissions mitigation options of cement production in Mexico by 2050 through: (i) an overview of the cement industry; (ii) estimation of the BAU scenario, proposal of alternative scenarios, and modelling of their corresponding energy and GHG emissions trajectories; and (iii) evaluation of the proposed scenarios incorporating emission reduction strategies using the Strengths, Weaknesses, Opportunities, and Threats (SWOT) tool. To achieve the aims of the study, the following research questions need to be answered:
- What is the current and future situation of the cement production industry in Mexico?
- What are the energy and GHG emission trajectories identified by modelling global emission reduction strategies for the Mexican cement industry?
- What are the qualitative sustainability implications of implementing these emission mitigation strategies in Mexico?
An original study was conducted to examine these research questions. To the authors’ knowledge, it offers the first comprehensive analysis of the cement industry in Mexico and an assessment of emission reduction strategies by 2050 through quantitative and qualitative methods, providing valuable quantitative data and long-term perspectives on emissions mitigation in this industry. Furthermore, the study proposes a clear, structured methodology that enables a systematic approach to addressing the research questions.
2. Materials and Methods
This section describes the general methodology for analysing emissions mitigation in the Mexican cement production industry. This methodology consisted of three main stages, as indicated in Figure 1: (I) overview of the cement industry; (II) scenario development and modelling; (III) SWOT analysis of scenarios.
Figure 1.
General methodology. Methodological stages for emission-reduction scenario analysis in the cement production industry.
2.1. Stage I. Overview of the Cement Industry
This stage provides a broad overview of the cement industry at both the international and national levels to examine its status with respect to production records, energy consumption, and direct GHG emissions from the manufacturing process. The overview includes an analysis of the industry’s characteristics, identifying the leading producers, nationally and internationally, by cement volume; energy required for production; and emissions from direct sources. This information is essential for addressing emissions reduction in this sector. This section also presents strategies that have been proposed worldwide.
2.2. Stage II. Scenario Development and Modelling
This stage evaluates a BAU scenario and two alternative scenarios. Figure 2 details the scenario construction process and the subsequent modelling of energy consumption and GHG emissions trajectories, which are described in the following subsections.
Figure 2.
Modelling methodology. Scenario development and energy and GHG emissions modelling methodology for the cement production industry.
2.2.1. Delimitation of Scenario Boundaries
Each scenario was based on the same sectoral, geographical, and temporal boundaries. This delimitation allowed a standard comparison of the scenario’s characteristics.
2.2.2. Data Collection for Scenarios
Considering the boundaries, specific information for the scenario’s development was collected from official international and national sources and from research articles identified through the literature review. This collection considered: (i) general data regarding socio-economic indicators, cement production imports and exports, energy consumption and GHG emissions reporting; (ii) production technologies development in the private sector and their viability for implementation; (ii) international and national emissions mitigation targets at the governmental and private-sector levels; and (iv) worldwide strategies proposed to meet these targets.
2.2.3. Projection of the Cement Production
The construction of scenarios often requires projecting national cement production over a certain time horizon. A model to project the activity of an industry or sector can be linear, logarithmic, polynomial, or exponential [20]. The selection of a suitable model depends on analysing the specific industry or sector and the availability and quality of the data. In this study, the model represents the trend in cement production as a function of variables that determine its growth, such as macroeconomic indicators (e.g., the GDP and GDP per capita), social indicators (e.g., the population growth), and industrial development [6]. Therefore, assuming a direct positive correlation between GDP per capita (independent variable ()) and cement production (dependent variable ()), a linear regression equation (Equation (1)) was developed as a representative model to project cement demand by 2050 based on historical data from 2005 to 2024 (see Section 3.2.2 for historical data collection).
where:
: cement production (Mt);
: slope;
: GDP per capita (Constant 2015 USD);
: intercept.
2.2.4. Statistical Validation of the Projection Model
The cement production projection model was statistically evaluated to assess its reliability. This evaluation involved identifying and removing outliers (data statistically distant from the linear trend) that could affect the accuracy of the linear equation used to project to 2050. This validation followed Barnett and Lewis’s [21] methodology for the standard residual test as applied by Vallarta-Serrano et al. [22] for an ordinary linear regression (OLR) model (Equation (1)).
To develop and statistically validate the projection model, the slope () and intercept () (Equations (2) and (4)), and their corresponding coefficient errors ( and ) (Equations (5) and (6)) were obtained.
where is the slope; is the number of data points in the data set; is the GDP per capita in the year (USD constant 2015 per capita); is the cement production (Mt) in a year ; and
where is the intercept;
where is the coefficient error of ; and
where is the coefficient error of .
To detect the outliers, for , the residual coefficients and were calculated with Equations (7) and (8). Subsequently, these coefficients were compared against a set of critical values corresponding to a 1% or 5% discordancy, depending on the number of data () [21]. When a residual coefficient exceeded the tabulated range, it was considered an outlier and rejected by the model. This process was iterative and stopped whenever no outliers were identified. After eliminating the outliers, the resulting equation was considered a representative model for cement production (), based on the historical, statistically validated data.
where .
2.2.5. Definition of the BAU and Alternative Scenarios
All scenarios were based on the statistically evaluated projection model of national cement production and considered a set of general assumptions regarding: (i) delimitation of scenario boundaries and (ii) the methodology for energy consumption and GHG emissions calculations. Additionally, the targets and assumptions for each scenario were derived from the data gathered in Section 3.2.2 and Section 3.2.5.
2.2.6. Modelling Approach
The modelling approach for calculating energy consumption by fuel type and GHG emissions from national cement production was defined based on the availability and quality of data. According to the literature, the analytical approach can be top-down, bottom-up, or hybrid.
- A top-down approach uses aggregate data to represent an energy system’s socio-economic and macro-economic dynamics on a broad scale [23].
- A bottom-up approach requires detailed data to analyse the characteristics of a specific technology or sector in relation to a larger system, focusing on impacts like energy consumption and GHG emissions [23,24].
- A hybrid approach combines technological and socio-economic data for accurate, aggregated energy system representation; nevertheless, it is often limited by data availability [23,24].
2.2.7. Energy and GHG Emissions Modelling Trajectories
Energy consumption and GHG emissions trajectories for each scenario were modelled according to the selected approach. Worldwide, several computational models and modelling tools are widely used. When selecting a modelling tool suitable for energetic and emissions analysis, the capability for industrial-scale disaggregation, scenario simulation, and forecasting features is usually considered. The data input availability and requirements for modelling, researchers’ resources, and modelling approach also determine the appropriate modelling tool [25].
2.3. Stage III. SWOT Analysis of Scenarios
This stage integrated the information retrieved from the comprehensive literature review, the sector overview, and the modelling trajectories results, to evaluate the strategies in each scenario through a SWOT analysis. This tool is widely used for evaluating emission mitigation strategies across various industries, as in the studies from Ige and Kabeya [26], Abdulghani and Winkler [27], and Serino Olander et al. [28], which examine cement decarbonisation strategies, sustainable energy transition for coal, and decarbonisation in the automotive manufacturing sector, respectively. This analysis describes the strengths, weaknesses, opportunities, and threats of the strategies in each scenario required to achieve the emission mitigation targets.
3. Results
3.1. Stage I. Overview of the Cement Industry
Worldwide, the cement production process is similar in energy and material flows. However, the availability of resources (raw materials and fuels), energy consumption, emissions intensity, clinker-to-cement ratio, technological equipment specifications, amount of cement produced, and demand trends are different between regions and countries [29,30]. Considering these differences, the following subsections describe the general cement production process, global energy consumption and GHG emissions, and strategies proposed to reduce emissions in this industrial sector. The characteristics of cement production in Mexico are also described in detail.
3.1.1. Cement Production
The general cement production process consists of three main stages: raw material preparation, clinker production, and cement grinding [30,31,32]. Table S4 provides a detailed description of this process.
- Raw material preparation consists of crushing, grinding, and homogenising the raw materials, limestone, clay, silica, and iron ore, and mixing them to form the raw meal. Moisture, particle size, and blend composition are closely controlled because they are critical to clinker formation in stage II.
- The clinker production stage occurs when the raw meal is moved through pre-heaters or pre-calciners to be further moved into a cement kiln. This equipment heats the raw meal to over 1450 °C to facilitate the calcination reaction, which is composed of a series of overlapping chemical reactions that form clinker. To reach these high temperatures, thermal equipment mainly uses fossil fuels. One of the most important chemical reactions within the calcination process is Equation (9), where calcium carbonate (CaCO3) is decomposed into calcium oxide (CaO), the largest component of clinker, and carbon dioxide (CO2), due to the release of high volumes of this last compound, representing an important source of CO2 emissions during the entire cement production process.
- 3.
- The cement grinding stage occurs after the already formed clinker is cooled and ground into a fine powder. This powder is then mixed with gypsum, pozzolana, and blast-furnace slag to produce cement.
It is important to indicate that there are two types of production processes: wet and dry. In the wet process, the raw materials enter the plant with a moisture content of around 40%. This moisture requires mechanical equipment to mix, grind, and store slurry, in addition to a higher thermal energy demand to lower the moisture and properly process the minerals in the kiln to produce clinker. As the dry process requires less energy, it is the most widely used process worldwide [33]. Additionally, depending on the additives and minerals included in stage III of the production process, there are different types of cement.
Currently, there are some volunteer international standards published by the American Society for Testing and Materials (ASTM) International, the International Organisation for Standardisation (ISO), and the European Committee for Standardisation (CEN), which set out the chemical composition, strengths, setting, durability, and manufacturing process of cements [34,35,36]. However, each region and country establishes their own norms regarding cement production composition and characteristics [37]. According to the uses, the most common cement types worldwide are explained in Table S5. In Mexico, the norm that defines cement composition standards is NMX-C-414-ONNCCE-2017, published by the National Organisation for Standardisation and Certification of Construction and Building, S.C. (ONNCCE) in 2018, which is detailed in Table S6 [38,39]. The cement composition norms set the standards for reducing clinker composition in cement to introduce supplementary cementitious materials (SCM) as an emission reduction strategy.
As cement composition varies between regions and countries, the markets and production volumes also vary. The global cement production volume was 4158 Mt in 2022, with China as the largest producer, followed by India and Vietnam [40,41]. China accounted for ~50% of the world’s cement production, with an output nearly four times that of India, the second largest producer country [41]. China led in production but has exhibited a downward trend since 2020, with a sharp drop in 2022 to 2130 Mt. India and Vietnam showed a sustained growth, unlike Japan, which presented a clear decline since 2014. These declines in cement production and demand are mainly due to socioeconomic changes and reaching economic maturity after rapid urbanisation, in which infrastructure projects are no longer focused on construction but on maintenance [42,43]. The United States remained stable, slightly fluctuating between 83 Mt in 2014 and 92 Mt in 2022. Figure 3 illustrates the proportion of cement production in the top ten cement-producing countries for 2024, which have remained consistent since 2014.
Figure 3.
International volume of cement production. Proportional distribution and volume of the top ten cement producer countries in 2024 in Mt (own elaboration with data from USGS [41]).
Among the top cement producers worldwide, Mexico ranked 14th in 2024 [41]. The national official institutes reported cement production by type, divided into three types: grey cement, white cement, and mortar [44]. Figure 4 presents the volume of cement production and the cement production per capita from 2005 to 2024, according to the most recent official national available data. In 2023, the annual cement production capacity was reported at 62.8 Mt, and the total production at 42.89 Mt [44]. In 2024, the cement production share by type of cement was 89.36% grey cement, 1.86% white cement, and 8.78% mortar. The production share by type of cement, on average from 2005 to 2024, was 87.9% grey cement, 1.9% white cement, and 9.0% mortar [44]. Per capita cement production exhibited a gradual decline with minimal fluctuations, despite the overall increase in total cement production, and a visible increase from 2023 to 2024, with a value of 0.36 t per capita in 2024.
Figure 4.
Cement production in Mexico. Cement production by type (Mt) and per capita production (t) in Mexico from 2005 to 2024 (own elaboration with data from the National Institute of Statistics and Geography of Mexico (INEGI) [44,45,46] and Vásquez et al. [47]).
Currently, six cement companies operate in Mexico: Cemex (Hermosillo, Atotonilco, Monterrey, Zapotiltic, Torreón, Hidalgo, Tlalnepantla, Cuauhtinchán, Ciudad Valles, Tamuín, Huichapan, Ensenada, Guadalajara, Mérida), Holcim (Ramos Arizpe, Tecomán, Apaxco, Acapulco, Hermosillo, Macuspana, Orizaba), Cementos Cruz Azul (Tula de Allende, Lagunas, Palmar de Bravo, Tepezalá), Cementos Moctezuma (Tepetzingo, Cerritos, Apazapan), GCC Cementos (Chihuahua, Ciudad Juárez), and Cementos Fortaleza (Atotonilco de Tula, Santiago de Anaya, Progreso). Cemex and Holcim account for the highest production share, representing 43.5% and 21.2%, respectively [48]. As cement production in Mexico is projected to increase in the coming years, cement companies are expected to supply the materials needed for infrastructure development driven by economic and social progress, while also addressing the urgent need to reduce emissions from their processes. Increased cement production will require more energy, primarily from fossil fuel combustion, which results in emissions. To reduce the impact of direct emissions, the predominantly thermal energy consumption should be examined to identify alternative fuels that can lower emissions.
3.1.2. Energy Consumption
In stage II of cement production (Table S4), a temperature between 1350 °C and 1450 °C is required in the cement kiln to develop the clinkerisation reaction. To reach these temperatures, the thermal energy is generated from ~90% fossil fuels with high calorific values [40]. Commonly used fossil fuels in the kilns are coal, petroleum coke, fuel oil, and dry gas. Petroleum coke is the most used fuel for cement production due to its calorific value of 30,000–40,000 MJ/t and its ease of transport and storage [49,50]. In 2022, the global thermal energy intensity for clinker production due to fossil fuel combustion was 3.22 GJ/t clinker [40]. For Mexico, this value was 3.88 GJ/t clinker in the same year [12,51]. Additionally, the heavy machinery required for grinding, mixing, and transporting minerals during the production process consumes large amounts of electricity, which accounts for 22.7% of the total energy consumed by the cement production industry in Mexico [51].
3.1.3. Greenhouse Gas Emissions
In 2018, China contributed ~1073 Mt CO2e from direct emissions, while India, the second most emitting country, released ~159 Mt CO2e, three times higher than Vietnam, the third most emitting country in this sector with ~48 Mt CO2e [29]. In Mexico in 2022, direct emissions from this sector contributed 34 Mt CO2e, representing ~6% of total net GHG emissions [12]. Direct GHG emissions from cement production are generated by the clinker production process (process-related emissions) and on-site combustion of fossil fuels for thermal energy (fossil-fuel-related emissions):
- Process-related emissions account for ~60% of total direct GHG and are generated from the calcination reaction required to produce clinker in the kiln (according to Equation (9)) [52].
- Fossil-fuel-related emissions contribute ~40% of total direct GHG and are released when thermal energy is obtained for kilns and pre-heaters [30,40]. In Mexico, this value oscillates between 37% and 40% of the total direct emissions [44,51,53].
In 2022, the global direct emissions intensity of cement production was 0.58 t CO2/t cement [40]. As indicated in Tables S5 and S6, each cement type requires a different clinker proportion, complemented by other materials such as gypsum, clay, pozzolana, or blast furnace slag, depending on its use. This proportion, known as the clinker-to-cement ratio, is particularly significant for determining the structural properties of the final product and serves as a key indicator of process-related CO2 emissions. The clinker-to-cement ratio is commonly reported as a national average for cementitious materials produced in a country. In 2022, the global clinker-to-cement ratio was 0.71, whereas China held the lowest clinker-to-cement ratio, with 0.62 [40]. Mexico reported an emissions intensity of 0.73 t CO2e/t cement in 2022 [12,44]. Among Latin American countries, the clinker-to-cement ratio of Brazil in 2014 was 0.67; for Colombia, it was 0.68 in 2020; while in Mexico, the clinker-to-cement ratio is indicated as 0.85 by the Ministry of the Environment and Natural Resources (SEMARNAT) and National Institute of Ecology and Climate Change (INECC) in 2022 [53,54,55].
The linkage between cement production and total direct emissions is a challenge that calls for strategies to reduce GHG emissions while meeting demand. These strategies include implementing CC, decoupling process-related emissions from cement production demand, and using viable alternative thermal energy sources, among others.
3.1.4. Emissions Reduction of the Cement Sector
The production volume drives the total direct emissions, which also closely depend on the clinker-to-cement ratio and the thermal energy sources. In this regard, an increase in cement production (with a higher clinker-to-cement ratio) entails a proportional rise in clinker production and energy demand, increasing their associated emissions. Different actors, such as the International Energy Agency (IEA) in the Net Zero Roadmap 2023, have proposed several strategies to significantly reduce emissions in the cement production industry and address the production volume–emissions coupling [56]. The strategies have been widely discussed worldwide:
- CC deployment. Carbon capture involves removing CO2 before it enters the atmosphere [57]. Diverse CC technologies have been proposed for industrial purposes. The main technologies for CC can be divided into the following categories: post-combustion capture, pre-combustion capture (converting fuel into syngas to have it react with steam and obtaining a high-CO2 and -hydrogen (H2) gaseous mix, allowing CO2 to be captured and H2 used for energy or other industrial purposes), oxy-combustion, direct air combustion (DAC), mineral carbonation, and bioenergy with carbon capture and storage (BECCS) [58]. Diverse authors have evaluated the technological and economic feasibility of implementing one or various of these CC technologies, concluding on the importance of R&D [59,60,61].
- Cement production reduction. The IEA proposes decreasing cement demand as one of the most effective strategies to reduce emissions in this sector. This strategy implies a reduction in cement demand, driven by either reduced infrastructure needs or the adoption of alternative construction materials. For instance, in Mexico, sargassum, a solid waste biomass, is being studied for its feasibility in specific construction applications, considering the economic and environmental benefits that could reduce cement demand [62]. In contrast, a reduction of infrastructure needs could only be viable in regions where economic development, international trade, and infrastructure needs have already been satisfied [13,29].
- Clinker-to-cement ratio reduction. This strategy consists of increasing the share of SCM to substitute for clinker [58]. The most common SCMs are CaCO3, ground-granulated blast furnace slag, natural pozzolans, and fly ash [63,64]. Using SCM can reduce GHG emissions during the production process, reduce cement costs, and incentivise industrial symbiosis [65]. Nevertheless, the amount of SCM substituting clinker must comply with the cementitious characteristics required in the regional norms to avoid compromising the mechanical performance [64,66].
- Kiln thermal energy intensity improvement. Implementing pre-heaters or pre-calciners before the kiln can improve thermal energy efficiency, reducing fossil fuel burning [5]. The challenge of this measure lies in the average 30–50-year lifespan of cement production equipment, which implies an economic challenge for companies to invest in new machinery when the existing equipment has not yet reached the end of its useful life [67].
- Low-emission fuels substitution. Alternative fuels for cement production include municipal solid waste (MSW), biofuels, natural gas, biochar, and solar concentrating energy [67]. Some of these are currently used, such as MSW and biofuels.
In Mexico, a roadmap by 2030 was proposed by the National Chamber of Cement (CANACEM) and the Interamerican Federation of Cement (FICEM) to reduce GHG emissions from the cement production process [68]. The strategies proposed included:
- Coprocessing. Other economic activity residues, such as MSW, industrial residues, tyres, oils, agriculture and forestry residues, and wastewater treatment sludge, are used as fuel for clinker manufacturing.
- Low-carbon cements. Adding alternative raw materials such as pozzolana, ash, and slag can reduce the clinker content during cement milling. These materials are expected from construction and demolition residues, industrial residues and subproducts, steel slag, and thermoelectric industry ash.
- Thermal energy efficiency. Optimising kilns and using more efficient fuels and/or those with lower carbon content.
Diverse authors and international institutions have proposed these strategies for reducing emissions in this industrial sector. Some of the strategies were included in the scenario development and modelling process of this study, as the aim is to quantitatively and qualitatively analyse the energy consumption and GHG emissions trajectories to observe how these strategies would perform in the Mexican cement production industry.
3.2. Stage II. Scenario Construction and Modelling
In this study, an overview of global and Mexican cement production characteristics, including energy consumption and GHG emissions, served as the basis for constructing scenarios and modelling trajectories for Mexico.
3.2.1. Delimitation of Scenario Boundaries
Three scenarios were used to analyse Mexico’s cement production industry from 2005 to 2050, with 2024 as the base year. The 2050 time horizon allows this study to be comparable to similar analyses in other geographical areas [69]. The resulting trajectories evaluated in each scenario describe energy consumption performance and GHG emissions generation. These results were based on: (i) the national cement demand projected in this study and (ii) the implementation of emission reduction strategies.
3.2.2. Data Collection for Scenarios
Data and information for scenario construction were retrieved from the following sources:
- GDP per capita was the socio-economic indicator considered to be the driver for cement production projection in this study. The historical population data and forecasts to 2050 were obtained from the World Population Prospects statistics published by the United Nations (UN) [70]. The historical GDP for Mexico was collected from the World Development Indicators published by the World Bank [71], and the average annual GDP growth rate forecast to 2050 was assumed to be 2.8%, as published by the Mexican government [72]. This value was adopted from the construction sector economic forecast (assuming that cement production depends highly on construction requirements) indicated for 2025–2050 [1,72,73].
- Historical cement production was obtained from the data reported in the Monthly Manufacturing Industry Survey (EMIM), which is published annually by the National Institute of Statistics and Geography of Mexico (INEGI) [44,45,46].
- Historical energy consumption by fuel and sector was retrieved from the statistics reported in the National Energy Balance (BNE) published by the Ministry of Energy [51]. This study considers the 2018 BNE as the latest and most reliable source of energy statistics for the country.
- The values of the emission factors (EF) of each fuel were obtained from the data reported in the National Inventory of Greenhouse Gas and Compounds Emissions (INEGyCEI) of Mexico [53].
- The global warming potential (GWP) value of each GHG (CO2, CH4, and N2O) was obtained from the Intergovernmental Panel on Climate Change (IPCC) Sixth Assessment Report [74].
- Emission reduction strategies were retrieved and adapted from the IEA’s “Net Zero Roadmap: A Global Pathway to Keep the 1.5 °C Goal in Reach” and roadmaps from private companies operating in Mexico [56]. Section 3.2.5 explains specific milestones from each strategy for each scenario.
3.2.3. Projection of Cement Production
This study assumed that the national cement demand equals production [4]. As a middle-income economy, Mexico is expected to continue growing its cement demand due to infrastructure, construction, and nearshoring needs [14,29,75,76]. Therefore, cement demand was assumed to be driven by the socioeconomic indicators of GDP and population growth [4,29]. As shown in Figure 5, the national cement demand presents a linear correlation according to the GDP per capita growth trend from 2005 to 2024. Imports and exports of clinker were neglected since the amount was not significant [53]. Although Mexico produces slightly more clinker than it consumes, the resulting direct emissions are produced within the country [68]. Additionally, the relationship between cement production and historical data on fixed assets, the urbanisation rate, and construction-sector GDP was examined, revealing R2 values of 0.18 and 0.02, respectively (Figure S5). The urbanisation rate presented a higher R2 value of 0.24, but it was excluded from the multivariate equation as its projected change in Mexico during the study period is minimal. Specifically, the level of urbanisation is expected to increase only from 77.5% in 2024 to 79.5% in 2050; therefore, its contribution to the production projection model was considered negligible [77]. In contrast, national GDP was included as a key determinant, as it largely determines the availability of federal resources allocated to infrastructure development, social housing programs (the fastest-growing housing segment at the national level), and commercial and industrial construction activity.
Figure 5.
Cement production and GDP per capita dispersion graph. Mexico’s cement production linear relationship with GDP per capita growth from 2005 to 2024 is indicated with the yellow dotted line [44,45,46,47,70,71,72].
Based on this trend, the linear regression model (Equation (10)), which uses historical GDP per capita and cement production data, was proposed to project cement demand from 2025 to 2050.
where:
= cement production (Mt);
= GDP per capita (constant 2015 USD per capita).
The resulting Equation (10) was extrapolated to 2050 using the GDP per capita estimated for each year, which was obtained from estimations by the World Bank, UN, and the Government of Mexico [70,71,72]. Subsequently, Equation (10) was statistically validated to ensure a proper representative linear correlation.
Logarithmic and second-degree polynomial functional forms were also tested for the relationship with GDP per capita (Figure S6). However, the linear relationship was selected to project cement production in Mexico. A logarithmic pattern was not considered the most appropriate representation for the Mexican case, as Mexico remains a developing economy, and such behaviour is more commonly associated with more mature economies, in which infrastructure demand tends to decline over time [43]. In contrast, the second-degree polynomial regression produced a steeper growth trajectory, which increased the risk of overestimating future cement production. This became evident when the fitted curves were extrapolated to the GDP per capita levels projected for 2050 (Figure S7), based on the annual growth rate of 2.8% officially reported by the Mexican government, which is used in this study [72].
3.2.4. Statistical Validation of the Projection Model
After running the linear regression and obtaining the equation to forecast cement demand, statistical validation over Equation (10) was conducted to evaluate a proper correlation between the GDP per capita and cement production. This procedure (explained in Section 2.2.4) aims to identify possible outliers in the linear regression equation through an iterative series of values obtained for each observation, with a discordancy of 1% [21].
From Equation (10), four iteration processes were executed until no additional outliers were detected. The linear regression model (Equation (11)) resulting from the first iteration excluded the observations from 2017, 2020, and 2021, identifying the cement production values () corresponding to those years as outliers after statistically analysing Equation (10). The second iteration excluded the observations from 2009 and 2016, previously identified as outliers, leading to Equation (12). The third iteration excluded the 2022 observation, resulting in Equation (13). The fourth iteration excluded 2015 and resulted in Equation (14), which represents the final linear regression model used to project cement demand by 2050, as depicted in Figure 6.
where:
Figure 6.
Projection of the cement production graph. The linear regression equation model for the projection of cement production in Mexico by 2050 after statistical validation (Equation (14)) is indicated with the blue dotted line [44,45,46,47,70,71,72].
= cement production (Mt);
= GDP per capita (constant 2015 USD per capita).
According to the validation results, Mexico’s cement production was projected to reach 97.37 Mt by 2050, which implies a 105.59% increase from the base year 2024. The standard error of the estimate for the regression is 1.03 Mt of cement. Based on Equation (14), the corresponding 95% prediction interval at the projected 2050 GDP per capita ranges from 79.20 to 115.54 Mt of cement. This interval reflects both the residual variability of the regression and the increasing uncertainty associated with extrapolation beyond the historical data range. Demand for construction materials, including cement, is expected to rise over time; however, long-term projections remain subject to considerable uncertainty (over 20%), mainly due to variations in assumptions regarding population growth, the pace of economic development, the strong dependence of material demand on GDP, and the inherent difficulty in predicting future macroeconomic, demographic, and technological trends [78,79].
To address potential GDP growth uncertainty, a sensitivity analysis is presented in Figure 7, which was carried out with a variation of the GDP as follows:
Figure 7.
Sensitivity analysis to GDP variations in (a) cement production, (b) energy consumption, and (c) direct GHG emissions.
- GDP as considered in this study at 2.8% [72].
- Historical (2005–2024) compound annual growth rate (CAGR) of 1.6%.
- Private sector forecast of 3.3% [80].
Results from GDP sensitivity analysis show that, with a 1.6% annual growth rate, cement production reaches 66.42 Mt, which is 31.8% lower than a projection with a 2.8% annual growth rate in GDP. Similarly, when an annual growth rate of 3.3% is applied, the cement projection reaches 113.18 Mt by 2050, representing a value 16.2% higher than with the 2.8% GDP proposed for this study, and projects 97.37 Mt of cement by 2050. Energy consumption and direct GHG emissions share the same confidence bands because the sensitivity analysis is carried out for Scenario A (BAU), which assumes growth in emissions and energy consumption associated with cement production.
An additional sensitivity analysis concerning regression models was also conducted, comparing the model obtained from the outlier exclusion process, a model without excluding outliers, and a model in which well-known atypical economic events are identified as outliers and thus excluded (Figure S4). Results from this sensitivity analysis indicate that, for this Mexican case study, the most appropriate regression model is obtained from implementing the statistical outlier exclusion detailed in Section 2.2.4, aiming to ensure that the calculations for projections follow a rigorous and objective methodological procedure.
3.2.5. Definition of the BAU and Alternative Scenarios
Each scenario followed a set of general and specific assumptions. The general assumptions are:
- Cement production demand in each scenario from 2025 to 2050 will grow according to the projection based on the linear regression equation (Equation (14)). The share by type of cement projection by 2050 was defined as the average percentage of historical production.
- Fuels considered in the production process were coal, petroleum coke, diesel, fuel oil, dry gas, and MSW.
- Although MSW and waste from other industries are currently used to heat cement kilns, these fuels are not officially reported in the BNE as a source of energy for cement production [51,68]. This study did not include MSW consumption in the base year or BAU scenario by 2050 to align scenario construction with official data reporting.
- Electricity consumption was included in the energy balance of the production process. However, emissions associated with this energy source were not accounted for in the GHG calculations, as emissions from electricity generation are considered indirect to cement production, referring to emissions resulting from the purchase of electricity or heat [81]. In Mexico, emissions from electricity purchased from other industries are already accounted for in the “Energy Production Sector”, as reported in the INEGyCEI [53].
- Direct emissions (process-related and fossil-fuel-burning-related emissions) were considered for calculating GHG trajectories. Indirect emissions, which are those from the purchase of electricity or heat and emissions [12] generated by operations upstream and downstream of the cement production plant, were excluded from this study. GHG emissions calculations were carried out considering the 2006 IPCC Guidelines for National Greenhouse Gas Inventories, as proposed by the INEGyCEI [53,82]. The process-related emissions were calculated using Equation (15). Based on this equation, the clinker factor () for grey and white cement was 0.85, and for mortar, 0.64 as reported for Mexico in the INEGyCEI [53]. The clinker factor is different in scenarios A, B, and C, due to the specific targets established for each scenario. The emission factor of clinker () was defined in 0.52 Mt CO2/Mt clinker [53,82].
= CO2 emissions from cement production (Mt);
= cement production by type i (Mt);
= clinker factor by type of cement i;
= emission factor of clinker.
The fossil-fuel-burning-related emissions were calculated according to Equation (16):
where:
= type of greenhouse gas;
= type of fuel;
= CO2e emissions from fossil fuel burning (Mt);
= energy consumed by type of fuel j (PJ);
= emission factor of the type of GHG (CO2, CH4, N2O) by type of fuel;
= global warming potential of the type of GHG.
- 6.
- The emission factor of MSW is defined as the fossil (inorganic) fraction of MSW with values of 91,700 kg CO2/TJ, 30 kg CH4/TJ, and 4 kg N2O/TJ, as published by SEMARNAT [83]. In line with IPCC guidelines, biogenic CO2 from the organic fraction is not included in the reported totals. As a result, the emission reductions presented in Scenarios B and C represent reductions in fossil-carbon emissions only.
The specific assumptions for each scenario are presented in Table 1:
Table 1.
Specific assumptions and targets for the development of each scenario.
Particularly, the inclusion of Scenario C (Ambitious) in the model is based on Mexico’s historical participation in international institutions and agreements committed to sustainability. Since 2018, Mexico has been the only “Member Country” from Latin America in the IEA (excluding other “Accession Countries” or “Associate Countries”) and has actively contributed to the IEA’s discussions on global energy challenges, emphasising a secure, sustainable economy and an affordable energy future [84].
In Mexico, R&D capabilities in the field of carbon capture are still in an early, largely pre-commercial stage, while regional assessments continue to identify carbon capture as a high-potential but costly option [85]. Similarly, MSW can only contribute to decarbonise the cement industry to the extent that it is converted into refuse-derived fuel (RDF), as both Mexican case studies and broader technical analyses show that raw MSW is too heterogeneous and too sensitive to moisture to serve as a reliable, standardised raw material without pre-treatment or quality control [86]. Regarding cement regulation, the NMX-C-414-ONNCCE standard already accounts for hydraulic/blended cements such as Composite Portland Cement (CPC), but increased support for low-clinker formulations within the existing regulatory framework is still required [39].
Integrating the IEA’s objectives for decarbonising the cement sector at an international level into Mexico offers a way to identify potential trends in energy consumption and emissions within the country. This provides a foundation for understanding what is necessary, what is already in place, and what can be improved for implementing these measures in Mexico quantitatively. It also enables qualitative analyses, such as the SWOT analysis included in this study, to assess the prospects for further developing and adopting public policies that could facilitate a scenario with significant emissions reductions.
3.2.6. Modelling Approach
The lack of specific available information on the equipment used by Mexican companies for cement production prevents considering a bottom-up approach to forecasting energy consumption and GHG emissions at the national scale. Consequently, a top-down approach was adopted in this study to project the energy and emissions trajectories of Mexico’s cement industry. According to the data and characteristics of this case study, the Low Emissions Analysis Platform (LEAP) software (version: 2024.3.0.2), developed by the Stockholm Environment Institute, was selected to model the trajectories [1,18,87]. The key assumptions, including energy-by-source emission factors and the GWP of GHGs from Section 3.2.2, were entered into the LEAP interface. LEAP emission factor libraries were not used, since priority was given to Mexican factors and averages to ensure calculations were as nationally accurate as possible. In the ‘Current Accounts’ fields, historical cement production and energy consumption, along with historical GDP and population, were entered. For scenario simulations, the mathematical expressions from the statistical calculations in Section 3.2.3 and Section 3.2.4 were applied.
In the cement production process, the modelling was divided into two branches: the process-related and the fossil-fuel-burning-related emissions. The process-related emissions branch received input data on the clinker emission factor, expressed as the amount of clinker produced per unit of cement produced. In the fossil-fuel-burning-related emissions branch, the amount of energy by source is entered as an expression depending on the volume of cement, relating the thermal energy directly to clinker production. Finally, the resulting energy consumption and GHG emissions trajectories are exported and further analysed.
3.2.7. Energy and GHG Emissions Modelling Trajectories
The results of energy consumption by fuel for 2024, 2030, 2040, and 2050 are presented in Table 2 and Figure 8 and are described as follows.
Table 2.
Share of fuels by year and scenario resulting from the modelling process.
Figure 8.
Energy consumption results. This figure shows the modelling trajectories of energy consumption by fuel type and scenario in PJ from the base year to 2050. Bars show the change in energy consumption distributed across key years, from 2024 (base year) to 2030, 2040, and 2050. In scenario A, petroleum coke dominates the energy share, accounting for almost 66% in 2024 (around 111 PJ) and reaching 225.54 PJ by 2050. For scenario B in 2050, petroleum coke reaches almost 64.9 PJ, compensating energy demand with MSW. In Scenario C, seeking to replace petroleum coke with MSW and a substantial reduction of thermal energy intensity, the amount of this fossil fuel is 0 PJ by 2050; the implications of this are discussed in the Section 3.3 SWOT analysis.
Scenario A (BAU) exhibited a constant share of energy consumption by fuel, establishing a baseline of 4.5% coal, 65.7% petroleum coke, 0.1% diesel, 0.4% fuel oil, 6.5% dry gas, 0.0% MSW, and 22.8% electricity; for thermal energy only, petroleum coke would account for ~85%, which implies a primarily fossil-dependent production scenario. Scenario B (Intermediate) showed a constant share from 2030 to 2050, due to targets to replace petroleum coke with MSW set for 2030, which would also explain the abrupt change between the base year and 2030. The fuel shares of Scenario B from 2030 onwards will be 4.3% coal, 22.0% petroleum coke, 0.1% diesel, 0.4% fuel oil, 6.2% dry gas, 40.2% MSW, and 26.8% electricity. In this scenario, a higher proportion of MSW replaced petroleum coke, aiming for a less fossil-fuel-dependent production. Therefore, Mexican companies should consider the infrastructure and financial capacity required to implement this fuel replacement. Scenario C (Ambitious) presented an increase in MSW consumption and a reduction in petroleum coke use, as alternative fuel substitution targets were set for 2030, 2035, and 2050. These scaled targets would allow for a more steady and gradual change in the share, ending in a complete substitution of petroleum coke by MSW by 2050. As in the medium term in Scenario C, in 2035, the energy share by source would be 4.0% coal, 25.0% petroleum coke, 0.1% diesel, 0.4% fuel oil, 5.9% dry gas, 33.9% MSW, and 30.7% electricity. This scenario considers a complete substitution of petroleum coke with alternative fuels by 2050, which implies a challenge for the entire industry, including alternative fuels supply chain logistics. The share of each fuel by year and scenario resulting from the modelling process is detailed in Table 2.
Electricity consumption was assumed to remain constant, aligned with cement production growth. This assumption was based on the consideration that electricity would only be used in stages I and III of cement production (See Table S4). Therefore, the fuel substitution and energy intensity targets would only cover the thermal energy consumption used in stage II of production for the calcination reaction. This would also explain the increase in the share of electricity consumption, as the reduction in energy intensity would not include electricity.
The thermal energy intensity in Scenarios A and B will be constant at ~3.3 PJ/Mt clinker (~3.3 GJ/t clinker); meanwhile, in Scenario C, the thermal energy intensity is set to be reduced from ~3.3 PJ/Mt clinker (~3.3 GJ/t clinker) in the base year to ~3.1 PJ/Mt (~3.1 GJ/t clinker) clinker by 2030, ~3.0 PJ/Mt clinker (~3.0 GJ/t clinker) by 2035, and ~2.7 PJ/Mt (~2.7 GJ/t clinker) clinker by 2050. This measure would help to decouple production volume from the energy required and, consequently, the fossil-fuel-related emissions.
Figure 9 exhibits the total GHG emissions trajectories from implementing the emission reduction strategies for Scenarios A, B, and C by 2050. Scenario A will reach 66.48 Mt CO2e by 2050 by maintaining the energy consumption share, thermal energy intensity and clinker-to-cement ratio as the base year. Scenario B will reach 53.63 Mt CO2e, which implies a 19.3% decrease from Scenario A by 2050. Scenario C will reduce 80.1% from Scenario A by 2050, with 13.25 Mt CO2e, and its reduction from Scenario B is 75.3%. The compound annual growth rate of total GHG emissions from the scenarios will be 2.8% for Scenario A, 1.9% for Scenario B, and −3.4% for Scenario C. By 2050, the emissions intensity will remain constant at 0.68 t CO2e/t cement in Scenario A; reduce to 0.55 t CO2e/t cement in Scenario B; and reduce to 0.14 t CO2e/t cement in Scenario C.
Figure 9.
GHG emissions results. This figure shows the GHG emissions modelling trajectories of the Mexican cement production industry by 2050. Scenario A has the highest emissions, followed by Scenario B, with a difference of ~13 Mt CO2e. Scenario C shows a clear reduction in emissions by 2050, with a difference of ~53.23 Mt CO2e from Scenario A, aligning with the targets set for this scenario and aiming to adapt international decarbonisation goals to the Mexican context.
Reducing the clinker-to-cement ratio is one of the most impactful strategies for detaching and reducing energy consumption in cement production: the less clinker is produced, the less thermal energy is required. This phenomenon can be observed in the total energy consumption growth in Scenario C, which will increase 33% from 2024 to 2050, while scenarios A and B will grow 104% and 74%, respectively, between the same years (Figure 8).
Similarly, the clinker-to-cement ratio reduction is also a major contributor to decreasing emissions in Scenarios B and C by 2050. This effect can be seen in Figure 10, where the share of Scenario B process-related emissions would decline by 18.6% relative to Scenario A from 2030 onward. Scenario C will reduce process-related emissions by 31.2% by 2030, 73.4% by 2040, and 100% by 2050, compared to Scenario A. This reduction in Scenario C would be caused mainly by implementing CC. In this ambitious scenario, CC would account for 12.0% of process-related emissions by 2030, 63.7% by 2040, and 100% by 2050. This reflects a progressive reduction in both the absolute amount and relative share of these emissions in Scenario C. Without the CC strategy in Scenario C, total emissions by 2050 would reach 41.78 Mt CO2e. In contrast, in Scenario C without CC, compared to Scenario A, process-related emissions would only decline by 21.9% by 2030, 26.7% by 2040, and 31.4% by 2050. While these reductions in the process-related emissions highlight the relevance of the CC strategy, they still show a greater decrease than that achieved under Scenario B, which is a constant of 19.3% compared to Scenario A.
Figure 10.
GHG emissions results by source. This figure displays GHG emissions in Mt CO2e by 2050, disaggregated by scenario, key years, and direct emission sources, focusing on process- and -fossil-fuel-related emissions. Each bar shows the percentage share of each emission source and the total emissions in Mt CO2e.
3.3. Stage III. SWOT Analysis of Scenarios
The modelling results were analysed through the SWOT tool, which assesses the internal and external factors driving the implementation of the strategies within each scenario. The proposed SWOT analysis developed in this study, displayed in Figure 11 and detailed in the following subsections, addresses the emissions mitigation strategies for the Mexican cement industry.
Figure 11.
SWOT analysis of scenarios. Display of the strengths, weaknesses, opportunities, and threats of each scenario based on the modelling results.
3.3.1. Strengths
- Capacity for meeting cement demand. The three scenarios proposed had the constraint of satisfying the cement demand projected by Equation (14). According to the IEA’s Net Zero Roadmap, cement demand is expected to decrease globally to achieve the emissions reduction targets [56]. Reducing the demand will surely reduce emissions from this sector’s direct sources; however, this study assumed that Mexico’s current conditions and future growth trends will not enhance the reduction in demand as an emission reduction strategy to ensure the satisfaction of infrastructure needs required for this country’s development. However, the current cement production capacity installed might require expansion to cover the needs projected, and this investment could be unfeasible for already operating companies.
- No additional investment required. Scenario A will maintain the same clinker-to-cement ratio and energy consumption share by source as in the base year, representing a scenario with no further investment in sustainability improvement strategies. From a purely economic perspective, Scenario A would not require stakeholders’ investment in emission-reduction strategies. However, the lack of action to strengthen climate change mitigation measures would further hinder investment in adaptation.
- Less fossil fuel dependency. Scenarios B and C will significantly reduce their use of fossil fuels, specifically petroleum coke. This measure will reduce emissions and allow this sector to rely less on fossil fuel market price fluctuations. However, strong MSW management would be necessary to substitute conventional fuels, accounting for the calorific power differences between MSW and petroleum coke, since Mexico has historically relied on fossil fuels for manufacturing and energy purposes.
- Equipment capacity for processing low-calorific-content fuel. Most pre-heaters, pre-calciners, and kilns for cement production can use ~60% of low-calorific-content fuel, as indicated in the Technology Roadmap—Low-Carbon Transition in the Cement Industry published by IEA, which states that pre-heaters and pre-calciners operate at lower temperatures, allowing for higher amounts of low-calorific-content fuels [5,88]. Scenario B, with 55% MSW for thermal energy consumption, will meet this equipment’s capacity, keeping the strategy within the technological capacity of thermal equipment and representing a characteristic with a strength among other scenarios. However, Scenario C will exceed this capacity with 86% MSW for thermal energy consumption, which implies a need for technology development or to revisit the strategy in terms of viability. Furthermore, the capacity of kilns to co-process a higher share of alternative fuel, such as MSW, needs to be technologically assessed. MSW fuel has lower calorific content, requiring higher fuel volumes to effectively replace petroleum coke and achieve the high temperatures required for chemical reactions in clinker production.
- Market competitiveness reinforcement. Low-carbon cement reinforces companies’ competitiveness and aligns with sustainability market trends. Sustainability performance and decarbonisation transition have raised awareness across markets and among investors, and strategies are encouraged to be adopted [89]. Scenario C, with the lowest GHG emissions intensity, will position cement companies with strong sustainability indicators, which are attractive to investors and buyers. Markets’ focus on Environmental, Social, and Governance (ESG) is shifting from a trend to a requirement due to investor demand and regulations, focusing on environmental aspects, including emission reduction strategies.
- Availability of equipment for lower thermal intensity. The cement production process is similar worldwide, and the pre-heater and pre-calciner technologies are already being used to improve thermal intensity by heating the raw meal before going into the kiln. The current availability and display of information about these technologies represent a strength for Scenario C, which proposes improving thermal energy intensity.
3.3.2. Weaknesses
- Plant logistics rearrangement required. Scenario C proposed a high share of CC from the process, significantly reducing the total emissions. Implementing CC technologies involves rearranging cement plant equipment, leading to high costs for retrofitting existing sites due to space and energy requirements [5,90].
- Accelerated increase of GHG emissions and insufficient reduction measures. In Scenario A, emissions will continue to rise, coupled with cement production, dependent only on the decrease in demand to reduce emissions. The reference scenario shows that emissions are rising without mitigation strategies, which leads to insufficient climate commitment fulfilment. Scenario A will not reduce cement industry emissions, distancing Mexico from its Nationally Determined Contributions (NDC) commitment with the UNFCCC and the Paris Agreement. The latest Mexican NDC commits to reducing national GHGs by 35% from a 2013 baseline, including a 5% contribution from the industry sector without detailing each subsector’s responsibility. This commitment is outlined in both the 2022 Mexican NDCs and the General Law on Climate Change (LGCC) from 2012 [12,91,92]. A lack of compromise on national and international climate agreements might result in issues with diplomacy, investment, and support in the international context. Scenarios A and B might not significantly contribute to the long-term emission reduction objectives of the sector from a national and international perspective.
- High fossil fuel dependency. Scenario A will maintain a share of ~90% reliance on fossil fuels for thermal energy consumption, which will entail the generation of GHG emissions from fuel burning. Relying on a single energy source for cement depends on market demand–supply constraints, affecting both environmental and economic aspects, especially given the geopolitical distribution of energy resources.
- Strong investment required. An important drawback of implementing ambitious reduction strategies in a hard-to-abate industry, such as cement production, will be the investment required [93]. Companies should allocate a specific budget for technologies like CC, thermal energy intensity reduction, and the logistics of supplying enough raw material for SCM. The implemented strategies, mainly in Scenario C, would require an assessment to estimate the feasibility of adopting such aggressive strategies. In addition, the joint development of cement production standards between the public and private sectors will be necessary to facilitate the deployment of new technologies in the market. However, this weakness in Scenario C can be offset by the availability of green financing and exposure to a better presentation to a growing and more environmentally conscious market. With these market characteristics and better incentives in the public sector, these investments are expected to be returned. However, an in-depth cost analysis is needed, especially in countries with emerging economies.
3.3.3. Opportunities
- Carbon captured used as raw material for industries. Scenario C resulted in a capture of 28.5 Mt CO2 by 2050, representing 31.4% of the total emissions in Scenario A. This amount of carbon could be used as raw material for other industries, such as methanol production, food, chemical, and enhanced oil recovery industries [94]. This usage implies a revalorisation of CO2, which is a temporary carbon removal and can also generate economic value. It is essential to evaluate the feasibility of the value chain in Mexico to allow cooperation between industries and provide the required infrastructure and policy to ensure proper materials management.
- Opening for waste-to-energy (WtE) strategies. Scenarios B and C proposed a share of MSW as an alternative fuel to replace petroleum coke for thermal energy. The co-processing strategy is already used in Mexico for the cement industry to make the most of waste from other industries, and other thermal-intensive activities can replicate this strategy. Additionally, the increased demand for MSW in industrial processes would create an opportunity to strengthen waste management and prevent landfill disposal of carbon-content waste that can be co-processed. Moreover, CCS of fossil-derived CO2 and biogenic CO2 deployment across WtE facilities could enable carbon neutrality for this industry, being a joint strategy solution. However, it depends on cost-effective deployment models, strategic source-sink planning, and a blend of fiscal and market-based incentives.
- R&D for SCM advancement. Reducing emissions from substituting clinker with other materials would be crucial for this industry, as shown in the GHG emissions reduction results in Section 3.2.7. These reductions can be observed particularly in Scenario C, where the clinker-to-cement ratio was set to reach a value of 0.57 by 2050. Furthermore, alternative cementitious materials should be technologically and environmentally assessed to substitute this share of clinker in cement, considering the characteristics of the types of cement specifically for Mexico showed in Table S6, which are established for different purposes according to their main components. This would also represent an opportunity for metallurgical industrial wastes, such as ground granulated blast furnaces, basic oxygen furnace slag, waste limestone powder, and electric arc furnace slag, which would be used as SCM [63,95]. It can be seen in Table S6 that blast furnace slag cement already has 20–39% Portland clinker and calcium sulphate, with a higher share of granulated blast furnace slag of 61–80%, but it is the only one reaching this amount of alternative material, setting a precedent for other types to be included [39]. This refers to Mexican cement composition and is a starting point for cements with a lower share of clinker.
3.3.4. Threats
- Carbon-dependent electricity mix for CC. In 2023, the Mexican electricity mix relied on approximately 74% fossil fuels [96]. Current and prospective CC technologies rely on electricity, such as the post-combustion amine-based absorption systems, which involve high electricity and heat energy demand [97]. Therefore, implementing CC in a production process would require a higher electricity demand and, consequently, an increase in GHG emissions from the national electricity mix.
- Need for improvement of technological maturity and affordability of CC in Mexico. Due to their stage of development, CC technologies may not yet be affordable or widely available in the country for large-scale use and might represent a high percentage of investment in emission reduction budgets [98,99]. In this regard, emerging-economy countries tend to receive technological improvements later than countries with access to more financing, and this situation is unlikely to change in the near future. Scenario C proposes that 100% of carbon from process-related emissions be captured at a national level by 2050, which faces mainly technological feasibility threats, such as the need for CC technologies to be ready for an industry-scale deployment in the Latin American region. Additionally, the trade-offs between carbon storage and utilisation should be addressed. The net climate benefit of CC depends on its final destination. Storage generally offers greater and longer-lasting benefits, as it keeps CO2 out of the atmosphere in the long term, although this depends on the safety of the containment and infrastructure. Utilisation is generally more limited, as CO2 is often stored only temporarily, and the benefits depend on the use of low-carbon energy sources and on replacing a product that generates more emissions [100]. As one of the most promising strategies for reducing emissions in this sector, this strategy should be evaluated for large-scale implementation in Mexico.
- SCM availability and acceptance. The regional availability of minerals and industrial wastes to replace clinker should be assessed to satisfy the demand for cement production and thus reduce the clinker-to-cement ratio [66,95,101]. Scenarios B and C proposed a substantial share of SCM to substitute clinker and reduce process emissions. Furthermore, buyers and infrastructure developers would still face uncertainty about SCM implementation in cement, which would threaten the implementation of this strategy.
- Cement standards actualisation. The NMX-C-414-ONNCCE-2017 standard determines the hydraulic cement characteristics and composition of Portland cement in Mexico to ensure product quality [38,39]. The actualisation of the regional standards would be crucial for adopting the recently developed SCM. To ensure the first acceptance of these materials, SCM’s characteristics and benefits should be displayed, and international or regional standards for their implementation in cement and concrete should be adapted to account for the reduction of clinker in cement composition.
- Public waste management improvement required. Scenarios B and C suggested a high share of MSW as an alternative fuel. This strategy demands more MSW, mainly obtained from the residential and other industrial sectors. MSW management involves multiple stakeholders, combining public and private efforts, and incentivising communities to separate recyclable waste for thermal energy use. The entire MSW supply chain as an alternative fuel should be strengthened and economically evaluated, due to the higher costs [102]. Additionally, an effective MSW system must control excess moisture, which requires pre-treatment to reduce moisture and enhance energy efficiency [81,90]. Additionally, prior to implementation, it is essential to assess how these alternative fuels may influence clinker quality, overall cement production, and environmental performance. This evaluation should account for their heating value, chemical composition, and moisture and ash levels, while also considering their potential effects on process stability [103].
- Risk of hazardous pollutants release from MSW. MSW could release human-health-hazardous air pollutants if not appropriately treated. Hazardous compounds could be released from the burning of mismanaged MSW, such as nitrous oxides (NOx), carbon monoxide (CO), hydrochloric acid (HCl), sulphur dioxide (SO2), particulate matter (PMs), lead (Pb), manganese (Mn), copper (Cu), chromium (Cr), nickel (Ni), mercury (Hg), antimony (Sb), cadmium (Cd), arsenic (As), thallium (Tl), and cobalt (Co) [102,104,105]. In this matter, stakeholders’ collaboration along the MSW supply chain is crucial. This threat directly impacts communities near cement production plants, which is common in Mexico, where residential zones surround cement production plants.
4. Discussion
Other authors have also addressed the long-term decarbonisation of the cement industry. Although their methodological approaches and baseline data used to estimate emissions differ, the studies generally project that cement-related emissions in developing countries will increase in the coming decades due to rising cement demand driven by population growth, urbanisation, and infrastructure requirements [106,107]. For example, Cheng et al. [29] estimated that cement emissions in developing countries, excluding China, could reach 1.4 to 3.8 Gt CO2 in 2050, representing increases between 100% and 443% compared to 2018. For Mexico, their projections indicate an increase from approximately 22 Mt CO2 in 2020 to 30 Mt CO2 in 2050 under the Baseline + BAU scenario, equivalent to a 36% increase; and to approximately 38 Mt CO2 under the Baseline + Developed Average scenario, equivalent to a 73% increase.
Additionally, Camargo-Berte et al. [108] estimated cement industry emissions under a BAU scenario to 2050 for several countries expected to continue growing: Brazil, 66.0 Mt CO2 (a 106% increase from 2019); Mexico, 52.0 Mt CO2 (97% increase); Colombia, 19.6 Mt CO2 (136% increase); and Chile, 5.1 Mt CO2 (34% increase). The projections of these studies indicated that cement industry emissions are likely to persist in increasing up to 2050, driven by ongoing construction activity and higher material demand associated with development [78]. However, this expected growth must be accompanied by stronger mitigation strategies and a robust policy framework to prevent a proportional rise in emissions.
According to the insights from this study, CC and reducing the clinker-to-cement ratio are highlighted as the strategies with the most significant impact on GHG emissions mitigation during cement production in Mexico. Although CC is essential for reducing emissions in this industry, its implementation entails several weaknesses and threats for the Mexican industry. The main threat to CC implementation is economic and technological viability, as current estimates indicate high costs for implementing these technologies. The lack of a clear consensus on the early adoption of this technology causes uncertainty about considering it as a possible strategy to be implemented in the short term. This involves continuous R&D to enhance the scalability and viability of CC technologies, emphasising opportunities for industries in developing economies.
Additionally, reducing the clinker-to-cement ratio requires the introduction of SCM that complies with structural and compositional standards for cement production. This involves ensuring regional availability of these minerals, establishing a sustainable supply chain, and evaluating the necessary investments and logistics for transporting them to the plant and integrating them into the production process.
Moreover, switching to MSW as an alternative fuel reduces emissions on a minor scale. Waste management must be strengthened to supply the necessary MSW for thermal purposes. In this regard, the quality of this waste should be evaluated to prevent the release of human-health-hazardous pollutants that could affect people surrounding the production plants.
Several factors must be considered when implementing emission reduction strategies for the Mexican industry in the following decades (e.g., economic feasibility, technological viability, social impacts, market acceptance).
Diverse policy recommendations for cement industry decarbonisation might include:
- (i)
- Promotion or mandatory implementation of certifications and ecolabels for low-carbon cement products. For instance, LafargeHolcim offers cement and concrete products with a 30% lower CO2 footprint and 20% recycled material content [109,110].
- (ii)
- Establishment of energy efficiency regulations and incentives, comprising mandatory energy performance standards, energy audits, and efficiency improvements for manufacturing equipment and processes in cement production facilities, aiming to reduce emissions [109]. In Mexico, minimum energy-efficiency requirements are specified for motors used in industrial boilers, including the equipment operating in cement plants.
- (iii)
- Introduction of green building requirements to promote the use of low-carbon cement products. In Mexico, there are approximately 873 buildings with Leadership in Energy and Environmental Design (LEED) Silver, Gold, and Platinum certifications, which encourage high energy efficiency, responsible water use, and the utilisation of sustainable materials, including cement, in building design, construction, and operation [111].
- (iv)
- Integration of a life cycle assessment (LCA) approach to evaluate the environmental impacts of heavy industries and construction materials, including cement, thereby ensuring more realistic emissions accounting [26,109].
- (v)
- Implementation of effective economic policy strategies, such as tax exemptions, subsidies for low-carbon technologies, financing, carbon pricing mechanisms, and fiscal incentives to support investment in cleaner production processes and decarbonisation initiatives [26].
Regarding economic policy mechanisms, diverse strategies are available to support decarbonisation in Mexico, and some of the most relevant are already being implemented:
- (i)
- Emission trading systems (ETS), which establish a cap on GHG emissions and create a market for trading emission allowances, thereby providing incentives for industries to reduce emissions cost-effectively. In Mexico, the first ETS in Latin America was established in 2020, covering the energy and industrial sectors, including the cement industry, and it is currently in the pilot phase [112].
- (ii)
- Investment in clean and renewable energy infrastructure to supply industrial processes with lower-carbon energy, as established in Mexico through the Energy Planning and Transition Law [73].
- (iii)
- Tax incentives specifically targeted at low-carbon cement production, which can also contribute to accelerating the adoption of cleaner technologies, alternative fuels, and sustainable materials by reducing investment barriers and improving the economic viability of decarbonisation measures [109].
- (iv)
- Public and private R&D and training funding and financial support that drives initiatives in decarbonization and clean technologies across industries [108,109].
- (v)
- Allocation of governmental dedicated funds to facilitate implementation and deployment of low-carbon projects and technologies that support emissions mitigation [109].
- (vi)
- Regulatory requirements and obligations to implement circular economy practices can encourage low-carbon standards across the cement industry value chain through measures such as waste management (including selective demolition, separation, and collection), landfill taxes, resource reuse, and non-compliance penalties [108,109].
In general, the greater the ambition of the strategies, the higher the levels of investment and technological deployment required. It is therefore crucial to assess the feasibility of such investments within existing facilities, where implementation may be constrained by current infrastructure and operational limitations. Conversely, facilities still in the planning or design stages offer an opportunity to integrate these strategies from the outset, thereby establishing new benchmarks for sustainability and advancing industry-wide standards. Finally, cooperation between the private and public sectors is crucial for ensuring that strategies are adequately implemented, accepted, and scaled up by buyers and investors.
4.1. Limitations of This Study
The top-down approach adopted in this study is widely used to analyse the industrial sector’s emissions and energy consumption at a national level. The analysis of performance could be further enhanced with more specific data on the technology used in cement production processes in Mexico, as greater availability of such information would allow for deeper and more precise insights. Additionally, within the modelling framework, all non-GDP scenario parameters are fixed at their specified values, as presented in Section 3.2.5, where BAU and alternative scenarios are defined. Accordingly, the results should be interpreted as projections that are based on the designated targets for each scenario, rather than as probabilistic forecasts.
A potential technical limitation of the MSW as an alternative fuel, in this study envisioned to substitute for a high share of thermal energy use, is its high moisture and low calorific content, which pose pre-treatment challenges and require the entire MSW supply chain to make efforts to allow this fuel to be used as efficiently as possible.
Furthermore, the transparency and actualisation of the available official national data should be examined to accurately represent the industrial context of Mexico in the academic field. In this regard, it is well known that waste from the steel industry and other MSW is already used for thermal purposes in cement production, and CANACEM and FICEM display it in the roadmap for 2030; however, it is not reported as an energy source of this sector by the Mexican Ministry of Energy (SENER) in the BNE in the 2018 version. This situation limits the analysis of energy consumption and GHG emissions from burning fossil fuels.
4.2. Future Work
This study addressed the direct GHG emissions of cement production in Mexico by using a top-down approach, which can be complemented by a bottom-up analysis and by indirect upstream and downstream emissions analysis, whenever data becomes available. A bottom-up approach could provide a broader economic and social perspective on improving emission reduction options that can be implemented in Mexico, considering the necessity for more specific data availability. The results of this broader and more specific analysis would offer a more in-depth analysis and serve as a decision-making tool for Mexico’s private and public sectors. Moreover, indirect emissions from electricity consumption were not included in this study, although these emissions become increasingly relevant when CC is considered as a mitigation option due to its additional electricity demand. This restricts the ability to assess potential emissions shifts to the power sector linked to the large-scale deployment of carbon capture technologies. Future research should therefore adopt a scope 2 approach and include indirect electricity-related emissions, supported by improved regional data on the electricity needs of industrial-scale CC technologies. Additionally, future research can extend the analysis by developing a TOWS matrix, which would link the diagnostics identified in the SWOT analysis and articulate concrete strategic recommendations. This approach has been applied in some studies, such as those by Alrawashdeh et al. [113], who evaluated sustainable alternative materials to Portland cement to reduce emissions in the construction sector; and Zajemska et al. [114], who assessed sustainable construction materials, including cement.
Sensitivity analyses were conducted to evaluate GDP uncertainty and assess regression models regarding outlier-exclusion procedures, thereby addressing the inherent risks of long-term projections. Additionally, conducting a sensitivity analysis of target implementation by scenario could provide a clearer overview of how these strategies are put into action, considering potential shortcomings in technology deployment and additional threats identified in the SWOT analysis, which can be explored further in future work.
5. Conclusions
The characteristics of the cement production industry in Mexico were provided to diagnose the current performance of this sector and its possible future prospects related to energy consumption, emissions generation and mitigation, national commitments to the climate agenda, and potential strategies. For the first time, the production projection for 2050 was obtained using current and forecasted socio-economic indicators that set a positive linear correlation. This correlation was statistically validated to provide an accurate projection. The projection was used to construct a BAU and two alternative scenarios, for which we obtained top-down modelling of energy consumption and GHG emissions trajectories. The BAU scenario showed that, moving forward to 2050, the trend of direct GHG emissions from this industry in Mexico will continue to grow. Meanwhile, the analysis of alternative scenarios suggested that implementing strategies including CC, reducing the clinker-to-cement ratio, introducing MSW as an alternative fuel, and reducing thermal energy intensity would positively impact total direct emissions from the cement production industry in Mexico.
The quantitative results were analysed using the SWOT qualitative tool to assess the strengths, weaknesses, opportunities, and threats of implementing such strategies across the alternative scenarios. In this analysis, CC is highlighted as essential for reducing emissions in this industry. Additionally, clinker-to-cement ratio reduction was a significantly effective strategy for reducing emissions. However, their implementation would require a set of factors to be considered, including economic feasibility, technological development, and market acceptance. Finally, it is expected that the original results and findings from the current study may contribute towards the sustainability and development of a more robust pathway for reducing emissions in the cement industry and the country’s economic and social development.
Supplementary Materials
The following supporting information can be downloaded at: https://www.mdpi.com/article/10.3390/cleantechnol8020058/s1, Table S1: Comprehensive literature review methodology; Table S2: Scopus and WoS syntax of the search process; Table S3: Summary of key studies from literature review; Table S4: Cement production process description; Table S5: Types of cement produced worldwide; Table S6: Types of cement and chemical composition produced in Mexico; Figure S1: Comprehensive literature review methodology and results; Figure S2: Bibliometric analysis: affiliation country. Geographic distribution of the top ten articles in the final database; Figure S3: Bibliometric analysis: articles published by year. Fluctuation in the number of articles published yearly in the final database from 2016 to 2025; Figure S4: Sensitivity analysis on regression models: (a) cement production, (b) energy consumption, and (c) direct GHG emissions; Figure S5: Linear regression with additional parameters for cement production estimation: (a) fixed assets, (b) urbanisation rate, and (c) construction sector GDP; Figure S6: Alternative functional regression models for cement projection: (a) linear, (b) logarithmic, (c) polynomial; Figure S7: Extrapolation of alternative functional regression models for cement projection: (a) linear, (b) logarithmic, (c) polynomial. References [115,116,117,118,119,120,121,122,123,124] are cited in the supplementary materials.
Author Contributions
M.M.-M.: Conceptualisation, methodology, validation, investigation, software, data curation, writing—original draft, visualisation. S.I.V.-S.: Conceptualisation, methodology, formal analysis, writing—review and editing, supervision, project administration. E.S.-C.: Conceptualisation, methodology, formal analysis, writing—review and editing, supervision. S.A.N.-T.: Writing—review and editing, project administration. All authors have read and agreed to the published version of the manuscript.
Funding
This research received no external funding.
Data Availability Statement
The original contributions presented in this study are included in the article/supplementary material. Further inquiries can be directed to the corresponding author.
Acknowledgments
The authors want to thank Tecnologico de Monterrey, Escuela de Ingeniería y Ciencias and Secretaría de Ciencia, Humanidades, Tecnología e Innovación (SECIHTI), with the scholarship CVU: 1237057; and Villa-Mendoza for her support in the bibliometric analysis.
Conflicts of Interest
The authors declare no conflicts of interest.
Abbreviations
The following abbreviations are used in this manuscript:
| ASTM | American Society for Testing and Materials |
| BAU | Business-as-usual |
| BNE | National Energy Balance (in Spanish: Balance Nacional de Energía) |
| CAGR | Compound annual growth rate |
| CANACEM | National Chamber of Cement (in Spanish: Cámara Nacional del Cemento) |
| CC | Carbon capture |
| CCS | Carbon capture and storage |
| CEM | European Committee for Standardisation (in French: Comité Européen de Normalisation) |
| CPC | Composite Portland Cement |
| EMIM | Monthly Manufacturing Industry Survey (in Spanish: Encuesta Mensual de la Industria Manufacturera) |
| ESG | Environmental, Social, and Governance |
| FICEM | International Federation of Cement (in Spanish: Federación Interamericana del Cemento) |
| GDP | Gross domestic product |
| GHG | Greenhouse gas |
| GWP | Global warming potential |
| IEA | International Energy Agency |
| INECC | National Institute of Ecology and Climate Change (in Spanish: Instituto Nacional de Ecología y Cambio Climático) |
| INEGI | National Institute of Statistics and Geography (in Spanish: Instituto Nacional de Estadística y Geografía) |
| INEGyCEI | National Inventory of Emissions of Greenhouse Gases and Compounds (in Spanish: Inventario Nacional de Emisiones de Gases y Compuestos de Efecto Invernadero) |
| IPCC | Intergovernmental Panel on Climate Change |
| ISO | International Organization for Standardization |
| LEAP | Low Emissions Analysis Platform |
| LEED | Leadership in Energy and Environmental Design |
| MSW | Municipal solid waste |
| NDC | Nationally Determined Contributions |
| ONNCCE | National Organisation for Standardisation and Certification of Construction and Building, S.C. (in Spanish: Organismo Nacional de Normalización y Certificación de la Construcción y Edificación, S.C.) |
| OLR | Ordinary linear regression |
| SCM | Supplementary cementitious materials |
| SEMARNAT | Ministry of the Environment and Natural Resources (in Spanish: Secretaría de Medio Ambiente y Recursos Naturales) |
| SENER | Mexican Ministry of Energy (in Spanish: Secretaría de Energía) |
| SWOT | Strengths, Weaknesses, Opportunities, Threats |
| Symbols and variables | |
| Slope | |
| Intercept | |
| n | Number of data |
| Variance or uncertainty | |
| GDP per capita (constant 2015 USD) | |
| Historical cement production (Mt) | |
| Projected cement production (Mt) | |
| Chemical formulas | |
| CaCO3 | Calcium carbonate |
| CaO | Calcium oxide |
| CH4 | Methane |
| CO2 | Carbon dioxide |
| CO2e | Carbon dioxide equivalent |
| Cr | Chromium |
| Cu | Copper |
| H2 | Hydrogen |
| Mn | Manganese |
| N2O | Nitrous oxide |
| Ti | Titanium |
References
- Clark, G.; Davis, M.; Shibani; Kumar, A. Assessment of Fuel Switching as a Decarbonization Strategy in the Cement Sector. Energy Convers. Manag. 2024, 312, 118585. [Google Scholar] [CrossRef] [Scilit]
- Essam, M.; Gad, F.; Abouseada, N.; Soliman, M.A.; Aboelela, D. Process Simulation for Converting CO2 Emissions from the Cement Industry to Dimethyl Ether. Arab. J. Sci. Eng. 2024, 50, 4065–4076. [Google Scholar] [CrossRef] [Scilit]
- Krishna Priya, G.S.; Gundre, R.; Bandyopadhyay, S.; Seethamraju, S. Analysis of Decarbonization Measures for the Indian Cement Sector. J. Environ. Manag. 2024, 358, 120860. [Google Scholar] [CrossRef] [Scilit]
- Wei, J.; Cen, K.; Geng, Y. China’s Cement Demand and CO2 Emissions toward 2030: From the Perspective of Socioeconomic, Technology and Population. Environ. Sci. Pollut. Res. 2019, 26, 6409–6423. [Google Scholar] [CrossRef] [Scilit]
- International Energy Agency [IEA]. Technology Roadmap—Low-Carbon Transition in the Cement Industry; IEA: Paris, France, 2018. [Google Scholar]
- Zhang, C.Y.; Han, R.; Yu, B.; Wei, Y.M. Accounting Process-Related CO2 Emissions from Global Cement Production under Shared Socioeconomic Pathways. J. Clean. Prod. 2018, 184, 451–465. [Google Scholar] [CrossRef] [Scilit]
- Deep Decarbonization Pathways [DDP]. Network Deep Decarbonization Pathways Approach. Available online: https://ddpinitiative.org/overview/ (accessed on 24 January 2025).
- Instituto Nacional de Ecología y Cambio Climático [INECC]. Modelación de Descarbonización Profunda Del Sistema Energético En México al 2050. Reporte Final; INECC: Mexico City, Mexico, 2015.
- Intergovernmental Panel on Climate Change [IPCC]. Annex II: Glossary. In Climate Change 2022: Impacts, Adaptation and Vulnerability. Contribution of Working Group II to the Sixth Assessment Report of the Intergovernmental Panel on Climate Change; Möller, V., van Diemen, R., Matthews, J.B.R., Méndez, C., Semenov, S., Fuglestvedt, J.S., Reisinger, A., Eds.; Cambridge University Press: Cambridge, UK; New York, NY, USA, 2022; pp. 2897–2930. [Google Scholar]
- U.S. Environmental Protection Agency [U.S. EPA]. Greenhouse Gas FAQ’s. Available online: https://www.epa.ie/our-services/monitoring--assessment/climate-change/ghg/frequently-asked-questions/ (accessed on 12 April 2025).
- Instituto Nacional de Estadística y Geografía [INEGI]. Sistema de Cuentas Nacionales de México. Producto Interno Bruto Trimestral. Año Base 2018. Serie Del Primer Trimestre de 1993 al Cuarto Trimestre de 2024; INEGI: Aguascalientes, Mexico, 2024. [Google Scholar]
- Secretaría de Medio Ambiente y Recursos Naturales [SEMARNAT]; Instituto Nacional de Ecología y Cambio Climático [INECC]. Inventario Nacional de Emisiones de Gases y Compuestos de Efecto Invernadero (INEGyCEI) 1990–2022; INEGI: Aguascalientes, Mexico, 2024.
- Kim, N.; Hwang, Y.S.; Ho Hwang, M. New Projection of GHG Reduction Potentials for Korea’s Cement Industry and Comparison with Roadmap 2030. Energy Environ. 2019, 30, 499–521. [Google Scholar] [CrossRef] [Scilit]
- Dhar, S.; Pathak, M.; Shukla, P.R. Transformation of India’s Steel and Cement Industry in a Sustainable 1.5 °C World. Energy Policy 2020, 137, 111104. [Google Scholar] [CrossRef] [Scilit]
- Rahman, M.M.; Rahman, M.S.; Chowdhury, S.R.; Elhaj, A.; Razzak, S.A.; Abu Shoaib, S.; Islam, M.K.; Islam, M.M.; Rushd, S.; Rahman, S.M. Greenhouse Gas Emissions in the Industrial Processes and Product Use Sector of Saudi Arabia—An Emerging Challenge. Sustainability 2022, 14, 7388. [Google Scholar] [CrossRef] [Scilit]
- de Souza, J.F.T.; Pacca, S.A. A Low Carbon Future for Brazilian Steel and Cement: A Joint Assessment under the Circular Economy Perspective. Resour. Conserv. Recycl. Adv. 2023, 17, 200141. [Google Scholar] [CrossRef] [Scilit]
- Wu, T.; Ng, S.T.; Chen, J. Incorporating Carbon Capture and Storage in Decarbonizing China’s Cement Sector. Renew. Sustain. Energy Rev. 2025, 209, 115098. [Google Scholar] [CrossRef] [Scilit]
- Castrejón, D.; Zavala, A.M.; Flores, J.A.; Flores, M.P.; Barrón, D. Analysis of the Contribution of CCS to Achieve the Objectives of Mexico to Reduce GHG Emissions. Int. J. Greenh. Gas Control 2018, 71, 184–193. [Google Scholar] [CrossRef] [Scilit]
- Islas-Samperio, J.M.; Birlain-Escalante, M.O.; Grande-Acosta, G.K. Toward a Low-Carbon Industrial Sector in Mexico. Energy Sources Part B Econ. Plan. Policy 2020, 15, 545–571. [Google Scholar] [CrossRef] [Scilit]
- Balkan, D.; Akyuz, G.A. Labour productivity analysis of manufacturing sector in Turkey against EU. J. Bus. Econ. Manag. 2023, 24, 245–273. [Google Scholar] [CrossRef] [Scilit]
- Barnett, V.; Lewis, T. Outliers in Statistical Data, 3rd ed.; Wiley: Hoboken, NJ, USA, 1994; Volume 37, ISBN 978-0471930945. [Google Scholar]
- Vallarta-Serrano, S.I.; Santoyo-Castelazo, E.; Santoyo, E.; Ramirez-Mendoza, R.A.; Bustamante-Bello, R.; Beltrán-Rodríguez, L. Scenarios of Sustainable Energy Transition towards the Decarbonisation of the Road Transport Sector: A Case Study for Mexico. Renew. Sustain. Energy Rev. 2025, 212, 115341. [Google Scholar] [CrossRef] [Scilit]
- Timilsina, G.; Pang, J.; Xi, Y.; Timilsina, G.R. Enhancing the Quality of Climate Policy Analysis in China: Linking Bottom-up and Top-down Models. Renew. Sustain. Energy Rev. 2021, 151, 111551. [Google Scholar] [CrossRef] [Scilit]
- Yao, Y.; Lan, K.; Graedel, T.E.; Rao, N.D. Models for Decarbonization in the Chemical Industry. Annu. Rev. Chem. Biomol. Eng. 2024, 54, 31. [Google Scholar] [CrossRef] [PubMed]
- Lahijani, A.M.; Protheroe, M.D.; Gschwendtner, M. A Modelling Tool Selection for Decarbonising Industrial Process Heat Systems. Renew. Sustain. Energy Rev. 2025, 210, 115149. [Google Scholar] [CrossRef] [Scilit]
- Ige, O.E.; Kabeya, M. Decarbonizing the Cement Industry: Technological, Economic, and Policy Barriers to CO2 Mitigation Adoption. Clean Technol. 2025, 7, 85. [Google Scholar] [CrossRef] [Scilit]
- Abdulghani, T.; Winkler, H. A SWOT Analysis Approach for Assessing the Sustainable Transition in the Coal Energy Sector in Germany. Procedia Comput. Sci. 2025, 263, 76–81. [Google Scholar] [CrossRef] [Scilit]
- Serino Olander, A.; Albuquerque Wolf, L.; Moestam, L.; Despeisse, M. Decarbonisation of Manufacturing Operations: A Case Study in Automotive Manufacturing. Prod. Manuf. Res. 2025, 13, 2514613. [Google Scholar] [CrossRef] [Scilit]
- Cheng, D.; Reiner, D.M.; Yang, F.; Cui, C.; Meng, J.; Shan, Y.; Liu, Y.; Tao, S.; Guan, D. Projecting Future Carbon Emissions from Cement Production in Developing Countries. Nat. Commun. 2023, 14, 8213. [Google Scholar] [CrossRef] [Scilit] [PubMed]
- Gao, T.; Shen, L.; Shen, M.; Liu, L.; Chen, F. Analysis of Material Flow and Consumption in Cement Production Process. J. Clean. Prod. 2016, 112, 553–565. [Google Scholar] [CrossRef] [Scilit]
- Benhelal, E.; Zahedi, G.; Shamsaei, E.; Bahadori, A. Global Strategies and Potentials to Curb CO2 Emissions in Cement Industry. J. Clean. Prod. 2013, 51, 142–161. [Google Scholar] [CrossRef] [Scilit]
- Madlool, N.A.; Saidur, R.; Rahim, N.A.; Kamalisarvestani, M. An Overview of Energy Savings Measures for Cement Industries. Renew. Sustain. Energy Rev. 2013, 19, 18–29. [Google Scholar] [CrossRef] [Scilit]
- Mintus, F.; Hamel, S.; Krumm, W. Wet Process Rotary Cement Kilns: Modeling and Simulation. Clean Technol. Environ. Policy 2006, 8, 112–122. [Google Scholar] [CrossRef] [Scilit]
- American Society for Testing and Materials [ASTM]. International Cement Standards and Concrete Standards. Available online: https://store.astm.org/products-services/standards-and-publications/standards/cement-standards-and-concrete-standards.html (accessed on 1 January 2025).
- European Committee for Standardization [CEN]. CEN Technical Work. CEN/TC 51-Cement and Building Limes. Available online: https://standards.cencenelec.eu/dyn/www/f?p=205:32:0::::FSP_ORG_ID,FSP_LANG_ID:6035,25&cs=10662E88C70BB665613C41D9E5B016AE3 (accessed on 12 November 2024).
- International Organization for Standardization [ISO]. Standards by ISO/TC 74-Cement and Lime. Available online: https://www.iso.org/committee/50040/x/catalogue/p/1/u/0/w/0/d/0 (accessed on 17 January 2025).
- Portland Cement Association [PCA]. Cement and Concrete FAQ. Available online: https://www.cement.org/cement-concrete/cement-concrete-faq/ (accessed on 26 October 2024).
- Diario Oficial de la Federación [DOF]. Declaratoria de Vigencia de la Norma Mexicana NMX-C-414-ONNCCE-2017, “Industria de la Construcción-Cementantes Hidráulicos -Especificaciones y Métodos de Ensayo (CANCELA A LA NMX-C-414-ONNCCE-2014).”; DOF: Mexico City, Mexico, 2018.
- Organismo Nacional de Normalización y Certificación de la Construcción y Edificación [ONNCCE]. NORMA MEXICANA NMX-C-414-ONNCCE-2017. Industria de La Construcción–Cementantes Hidráulicos-Especificaciones y Métodos de Ensayo; ONNCCE: Mexico City, Mexico, 2018. [Google Scholar]
- International Energy Agency [IEA]. Cement. Available online: https://www.iea.org/energy-system/industry/cement (accessed on 16 January 2025).
- United States Geological Survey [USGS]. Cement Statistics and Information (Data from 2018 to 2024). Available online: https://www.usgs.gov/centers/national-minerals-information-center/cement-statistics-and-information (accessed on 13 February 2025).
- Habert, G.; Miller, S.A.; John, V.M.; Provis, J.L.; Favier, A.; Horvath, A.; Scrivener, K.L. Environmental Impacts and Decarbonization Strategies in the Cement and Concrete Industries. Nat. Rev. Earth Environ. 2020, 1, 559–573. [Google Scholar] [CrossRef] [Scilit]
- Steinberger, J.K.; Krausmann, F.; Getzner, M.; Schandl, H.; West, J. Development and Dematerialization: An International Study. PLoS ONE 2013, 8, e70385. [Google Scholar] [CrossRef] [Scilit]
- Instituto Nacional de Estadística y Geografía [INEGI]. Encuesta Mensual de La Industria Manufacturera (EMIM); INEGI: Aguascalientes, Mexico, 2025.
- Instituto Nacional de Estadística y Geografía [INEGI]. Encuesta Mensual de La Industria Manufacturera (EMIM) [Data Set]; INEGI: Aguascalientes, Mexico, 2024.
- Instituto Nacional de Estadística y Geografía [INEGI]. Encuesta Mensual de La Industria Manufacturera (EMIM) [Data Set]; INEGI: Aguascalientes, Mexico, 2023.
- Vásquez, B.; Corrales, S. Industria Del Cemento En México: Análisis de Sus Determinantes. Probl. Desarro. 2017, 48, 113–138. [Google Scholar] [CrossRef] [Scilit]
- Cámara Nacional del Cemento [CANACEM]. Datos de La Industria. Ubicaciones. Available online: https://canacem.org.mx/ubicaciones/ (accessed on 15 December 2024).
- London Premier Centre. Petroleum Coke: A Comprehensive Guide to Production, Specifications, and Types. Available online: https://www.lpcentre.com/articles/petroleum-coke-a-comprehensive-guide-to-production-specifications-and-types (accessed on 1 November 2024).
- Secretaría de Energía [SENER]; Comisión Nacional para el Uso Eficiente de la Energía [CONUEE]. Lista de Combustibles y Sus Poderes Calorificos 2024 Que Se Considerarán Para Identificar a Los Usuarios Con Un Patrón de Alto Consumo, Así Como Los Factores Para Determinar Las Equivalencias En Términos de Barriles Equivalentes de Petróleo; SENER: Mexico City, Mexico, 2024.
- Secretaría de Energía [SENER]. Balance Nacional de Energía 2018; SENER: Mexico City, Mexico, 2019.
- Portland Cement Association [PCA]. Energy and Environment. Committed to Sustainability. Available online: https://www.cement.org/advocacy/energy-and-environment/ (accessed on 1 December 2024).
- Secretaría de Medio Ambiente y Recursos Naturales [SEMARNAT]; Instituto Nacional de Ecología y Cambio Climático [INECC] México. Inventario Nacional de Emisiones de Gases y Compuestos de Efecto Invernadero 1990–2015 [INEGYCEI]; SEMARNAT: Mexico City, Mexico, 2018.
- da Silva Rego, J.H.; Sanjuán, M.Á.; Mora, P.; Zaragoza, A.; Visedo, G. Carbon Dioxide Uptake by Brazilian Cement-Based Materials. Appl. Sci. 2023, 13, 10386. [Google Scholar] [CrossRef] [Scilit]
- Federación Interamericana del Cemento [FICEM]; Cámara Colombiana del Cemento y el Concreto [PROCEMCO]. Hoja de Ruta. Colombia. Industria Del Cemento; FICEM: Bogota, Colombia, 2021. [Google Scholar]
- International Energy Agency [IEA]. Net Zero Roadmap: A Global Pathway to Keep the 1.5 °C Goal in Reach—2023 Update; IEA: Paris, France, 2023. [Google Scholar]
- Clark, G.; Davis, M.; Kumar, A. The Development of a Framework to Compare Carbon Capture and Storage Technologies as a Means of Decarbonizing Cement Production. Renew. Sustain. Energy Rev. 2025, 214, 115556. [Google Scholar] [CrossRef] [Scilit]
- Global Cement and Concrete Associations [GCCA]. Alternative Binders. Available online: https://gccassociation.org/cement-and-concrete-innovation/alternative-binders/ (accessed on 27 November 2024).
- Odor, G.E.; Dirisu, C.D.; Omekawum, N.C.; Adejumobi, A.I.; Olorunfemi, V.O.; Ajayi, A.O. Implementing Carbon Capture Technologies and Strategies in the Cement Industry: A Complete Review. World J. Adv. Eng. Technol. Sci. 2025, 16, 152–170. [Google Scholar] [CrossRef] [Scilit]
- Strojny, M.; Suchodolski, P.; Gładysz, P.; Nowak, W. Preliminary Analysis of Combining Amine Absorption and Calcium-Looping CO2 Capture in Cement Plant. Energy 2025, 327, 136361. [Google Scholar] [CrossRef] [Scilit]
- Varnier, L.; d’Amore, F.; Clausen, K.; Melitos, G.; de Groot, B.; Bezzo, F. Combined Electrification and Carbon Capture for Low-Carbon Cement: Techno-Economic Assessment of Different Designs. J. Clean. Prod. 2025, 498, 145029. [Google Scholar] [CrossRef] [Scilit]
- López-Sosa, L.B.; Rodríguez-Torres, G.M.; Rodríguez-Martínez, R.E.; Herrera-Ramírez, M.; Corral-Huacuz, J.C.; García, C.A.; Morales-Máximo, M. Multifunctional Characterization of Cement-Sargassum Composites for Application as Bioconstruction Materials. J. Build. Phys. 2025, 48, 794–820. [Google Scholar] [CrossRef] [Scilit]
- Amsalu Fode, T.; Jande, Y.A.C.; Kivevele, T. Modelling and Optimization of Multiple Replacement of Supplementary Cementitious Materials for Cement Composite by Response Surface Method. Clean. Eng. Technol. 2024, 19, 100735. [Google Scholar] [CrossRef] [Scilit]
- Zhang, Z.; Lei, Y.; Liew, J.Y.R.; Liu, M.; Wong, G.; Du, H. Embodied Carbon Saving Potential of Using Recycled Materials as Cement Substitute in Singapore’s Buildings. NPJ Mater. Sustain. 2024, 2, 27. [Google Scholar] [CrossRef] [Scilit]
- Cao, X.; Zhang, Z.; Wu, M.; Wang, X.; Liang, S. Environmental and Economic Implications of Closing Decarbonization Gap in Steel-Cement Industrial Symbiosis in China. Resour. Conserv. Recycl. 2025, 222, 108473. [Google Scholar] [CrossRef] [Scilit]
- Magallanes-Rivera, R.X.; García-Saucedo, A.G.; Gallardo-Heredia, M.; Avila-López, U.; Martínez-Sánchez, E.; Bazaldúa-Medellín, M.E. Sustainable Quaternary Binders Made from Metallurgical Wastes of Northeast Mexico: Strength, Hydration Products, and Durability. Environ. Sci. Pollut. Res. 2024, 31, 60141–60158. [Google Scholar] [CrossRef] [Scilit]
- The European Cement Association [CEMBUREAU]. Alternative Fuels. Available online: https://www.cementeurope.eu/ (accessed on 11 October 2024).
- Federación Interamericana del Cemento [FICEM]; Cámara Nacional del Cemento [CANACEM]. Hoja de Ruta. México. Industria Del Cemento. Hacia Una Economía Baja En Carbono; FICEM: Bogota, Colombia, 2023. [Google Scholar]
- Junianto, I.; Sunardi; Sumiarsa, D. The Possibility of Achieving Zero CO2 Emission in the Indonesian Cement Industry by 2050: A Stakeholder System Dynamic Perspective. Sustainability 2023, 15, 6085. [Google Scholar] [CrossRef] [Scilit]
- United Nations [UN]. World Population Prospects—Population Division; United Nations: New York, NY, USA, 2024. [Google Scholar]
- World Bank [WB]. GDP (Constant 2015 US$)—Mexico. World Bank Open Data. Available online: https://data.worldbank.org/indicator/NY.GDP.MKTP.KD?end=2022&locations=MX&start=1987 (accessed on 11 January 2025).
- Diario Oficial de la Federación [DOF]. Acuerdo Por El Que La Secretaría de Energía Aprueba y Publica La Actualización de La Estrategia de Transición Para Promover El Uso de Tecnologías y Combustibles Más Limpios, En Términos de La Ley de Transición Energética; Diario Oficial de la Federación [DOF]: Mexico City, Mexico, 2020.
- Diario Oficial de la Federación [DOF]. Ley de Planeación y Transición Energética Texto Vigente. Nueva Ley Publicada En El Diario Oficial de La Federación El 18 de Marzo de 2025; Diario Oficial de la Federación [DOF]: Mexico City, Mexico, 2025.
- Smith, C.; Gasser, T.; Nicholls, Z.; Armour, K.; Collins, W.; Forster, P.; Meinshausen, M.; Watanabe, M.; Pirani, A.; Connors, S.; et al. The Earth’s Energy Budget, Climate Feedbacks and Climate Sensitivity Supplementary Material. In Climate Change 2021: The Physical Science Basis. Contribution of Working Group I to the Sixth Assessment Report of the Intergovernmental Panel on Climate Change; Masson-Delmotte, V., Zhai, P., Pirani, A., Connors, S.L., Péan, C., Berger, S., Caud, N., Chen, Y., Gomis, M.I., Huang, M., Eds.; IPCC: Geneva, Switzerland, 2021. [Google Scholar]
- Garrido, C. México En La Fábrica de América Del Norte y El Nearshoring; CEPAL: Santiago, Chile, 2008. [Google Scholar]
- Gereffi, G. Nearshoring in Mexico. Diverse Options for Industrial Upgrading; ECLAC: Mexico City, Mexico, 2025. [Google Scholar]
- United Nations [UN]. World Urbanization Prospects: The 2025 Revision. Percentage of Population by Degree of Urbanization. Available online: https://population.un.org/wup/ (accessed on 18 January 2026).
- Organisation for Economic Co-Operation and Development [OECD]. Global Material Resources Outlook to 2060. Economic Drivers and Environmental Consequences; OECD: Paris, France, 2018. [Google Scholar]
- Sverdrup, H.U.; Olafsdottir, A.H. Dynamical Modelling of the Global Cement Production and Supply System, Assessing Climate Impacts of Different Future Scenarios. Water Air Soil Pollut. 2023, 234, 191. [Google Scholar] [CrossRef] [Scilit]
- Delphos Leading Emerging Markets Set to Overtake G7 Economies by 2050. Delphos Editor. 2024. Available online: https://delphos.co/news/blog/leading-emerging-markets-by-2050/ (accessed on 18 August 2024).
- WRI; WBCSD. Corporate Value Chain (Scope 3) Accounting and Reporting Standard Supplement to the GHG Protocol Corporate Accounting and Reporting Standard; WRI: Washington, DC, USA, 2011. [Google Scholar]
- Intergovernmental Panel on Climate Change [IPCC]. 2006 IPCC Guidelines for National Greenhouse Gas Inventories; IPCC: Hayama, Japan, 2006. [Google Scholar]
- Diario Oficial de la Federación [DOF]. ACUERDO Que Establece Las Particularidades Técnicas y Las Fórmulas Para La Aplicación de Metodologías Para El Cálculo de Emisiones de Gases o Compuestos de Efecto Invernadero; DOF: Mexico City, Mexico, 2015.
- International Energy Agency [IEA]. Member Countries. Available online: https://www.iea.org/countries (accessed on 9 February 2026).
- Mota-Nieto, J.; Fernández-Reyes, J.A.; García-Meneses, P.M. The Mexican Carbon Capture and Storage Platform: Construction of a Boundary Object for Bridging the Gaps between Contexts, Actors, and Disciplines. Int. J. Greenh. Gas Control 2023, 129, 103965. [Google Scholar] [CrossRef] [Scilit]
- Güereca, L.P.; Torres, N.; Juárez-López, C.R. The Co-Processing of Municipal Waste in a Cement Kiln in Mexico. A Life-Cycle Assessment Approach. J. Clean. Prod. 2015, 107, 741–748. [Google Scholar] [CrossRef] [Scilit]
- Heaps, C.G. LEAP: The Low Emissions Analysis Platform. [Software Version: 2024.3.0.2]; Stockholm Environment Institute: Somerville, MA, USA, 2022. [Google Scholar]
- Cheng, W.; Lin, X.; Liu, W.; Cao, H.; Xu, J. Evaluation of the Feasibility and Utilizability of Pretreated Sewage Sludge in Cement Kiln Co-Processing. Sustainability 2024, 16, 9025. [Google Scholar] [CrossRef] [Scilit]
- Hamoudi, H.; Avilés-Palacios, C. Product Sustainability and Consumer Environmental Awareness in Differentiated Markets. Int. Adv. Econ. Res. 2023, 29, 277–291. [Google Scholar] [CrossRef] [Scilit]
- Bacatelo, M.; Capucha, F.; Ferrão, P.; Margarido, F.; Bordado, J. Life Cycle Assessment of Synthetic Natural Gas Production from Captured Cement’s CO2 and Green H2. J. CO2 Util. 2024, 83, 102774. [Google Scholar] [CrossRef] [Scilit]
- Secretaría de Medio Ambiente y Recursos Naturales [SEMARNAT]; Instituto Nacional de Ecología y Cambio Climático [INECC]. Contribución Determinada a Nivel Nacional. Actualización 2022; SEMARNAT: Mexico City, Mexico, 2022.
- Diario Oficial de la Federación [DOF]; Ley General de Cambio Climático [LGCC]. Párrafo Adicionado; DOF: Mexico City, Mexico, 2012; p. 46.
- Wang, Y.; Yang, M.; Shen, F.; Zhou, M.; Du, W. Conceptual Design and Life-Cycle Environmental and Economic Assessment of Low-Carbon Cement Manufacturing Processes. J. Clean. Prod. 2024, 471, 143349. [Google Scholar] [CrossRef] [Scilit]
- Cooper, J.; Hawkes, A. Life Cycle Environmental Trade-off of Decarbonising UK Industrial Clusters—A Cradle to Gate Approach. Sci. Total Environ. 2024, 954, 176101. [Google Scholar] [CrossRef] [Scilit]
- Ndahirwa, D.; Zmamou, H.; Lenormand, H.; Leblanc, N. The Role of Supplementary Cementitious Materials in Hydration, Durability and Shrinkage of Cement-Based Materials, Their Environmental and Economic Benefits: A Review. Clean. Mater. 2022, 5, 100123. [Google Scholar] [CrossRef] [Scilit]
- International Energy Agency [IEA] Mexico. Sources of Electricity Generation. Available online: https://www.iea.org/countries/mexico/electricity (accessed on 21 January 2025).
- Al-Mamoori, A.; Krishnamurthy, A.; Rownaghi, A.A.; Rezaei, F. Carbon Capture and Utilization Update. Energy Technol. 2017, 5, 834–849. [Google Scholar] [CrossRef] [Scilit]
- Galusnyak, S.C.; Petrescu, L.; Cormos, C.C. Environmental Impact Assessment of Post-Combustion CO2 Capture Technologies Applied to Cement Production Plants. J. Environ. Manage. 2022, 320, 115908. [Google Scholar] [CrossRef] [Scilit] [PubMed]
- Zhu, Y.; Ren, M.; Song, J.; Ma, T.; Wang, Y.; Huang, C.; Cao, Z.; Dai, H. Health Driven Cost-Benefit Analysis of Provincial Decarbonization Pathways for China’s Cement Sector. Appl. Energy 2025, 397, 126326. [Google Scholar] [CrossRef] [Scilit]
- International Energy Agency [IEA]. CCUS in Clean Energy Transitions. CCUS Technology Innovation. Available online: https://www.iea.org/reports/ccus-in-clean-energy-transitions/ccus-technology-innovation (accessed on 9 March 2026).
- Raillard-Cazanove, Q.; Rogeau, A.; Girard, R. Decarbonisation Modelling for Key Industrial Sectors Focusing on Process Changes in a Cost-Optimised Pathway. Appl. Energy 2025, 382, 125206. [Google Scholar] [CrossRef] [Scilit]
- Sun, Y.; Qin, Z.; Tang, Y.; Huang, T.; Ding, S.; Ma, X. Techno-Environmental-Economic Evaluation on Municipal Solid Waste (MSW) to Power/Fuel by Gasification-Based and Incineration-Based Routes. J. Environ. Chem. Eng. 2021, 9, 106108. [Google Scholar] [CrossRef] [Scilit]
- Rivera Sasso, O.; Carreño Gallardo, C.; Soto Castillo, D.M.; Ojeda Farias, O.F.; Bojorquez Carrillo, M.; Prieto Gomez, C.; Herrera Ramirez, J.M. Valorization of Biomass and Industrial Wastes as Alternative Fuels for Sustainable Cement Production. Clean Technol. 2024, 6, 814–825. [Google Scholar] [CrossRef] [Scilit]
- Zhu, X.; Li, S.; Zhang, Y.; Li, J.; Zhang, Z.; Sun, Y.; Zhou, S.; Li, N.; Yan, B.; Chen, G. Flue Gas Torrefaction of Municipal Solid Waste: Fuel Properties, Combustion Characterizations, and Nitrogen/Sulfur Emissions. Bioresour. Technol. 2022, 351, 126967. [Google Scholar] [CrossRef] [Scilit]
- Fu, Z.; Lin, S.; Tian, H.; Hao, Y.; Wu, B.; Liu, S.; Luo, L.; Bai, X.; Guo, Z.; Lv, Y. A Comprehensive Emission Inventory of Hazardous Air Pollutants from Municipal Solid Waste Incineration in China. Sci. Total Environ. 2022, 826, 154212. [Google Scholar] [CrossRef] [Scilit]
- Uratani, J.M.; Griffiths, S. A Forward Looking Perspective on the Cement and Concrete Industry: Implications of Growth and Development in the Global South. Energy Res. Soc. Sci. 2023, 97, 102972. [Google Scholar] [CrossRef] [Scilit]
- Global Cement and Concrete Association [GCCA]. Societal Demand for Cement and Concrete. GCCA Association. Available online: https://www.gccassociation.org/ (accessed on 15 March 2026).
- Camargo-Bertel, A.A.; Hincapie, D.; Pugliese, V.; Dunuzalez-Quiroga, A.; Pupo-Roncallo, O. Decarbonizing the Cement Industry in Latin America and the Caribbean: A Comprehensive Review of Strategies, Barriers, and Policies. Energy Convers. Manag. X 2025, 26, 100956. [Google Scholar] [CrossRef] [Scilit]
- United Nations Industrial Development Organization [UNIDO]; Roland Berger Holding GmbH & Co. Global Best-Practices in Cement & Concrete Decarbonization Policies Report; Munich, Germany, 2025. [Google Scholar]
- Holcim EcoPact. El Concreto Bajo En Carbono. Available online: https://www.holcim.com.mx/ecopact (accessed on 2 December 2024).
- U.S. Green Building Council [USGBC]. Available online: https://www.usgbc.org/ (accessed on 15 March 2026).
- GIZ México. Hacia Un Sistema de Comercio de Emisiones En México. Documento de Difusión de Resultados Del Proyecto SiCEM; GIZ México: Mexico City, Mexico, 2025. [Google Scholar]
- Alrawashdeh, A.A.; Zamorano, M.; Alshaaer, M.; Martín-Morales, M. Promoting the Use of Geopolymer and Alkali-Activated Materials through the Identification of Critical Factors and Strategies. J. Build. Eng. 2024, 98, 111078. [Google Scholar] [CrossRef] [Scilit]
- Zajemska, M.; Wojtyto, D.; Michalik, J.; Berski, S. Review of Current Trends in Sustainable Construction. Energy 2025, 18, 2559. [Google Scholar] [CrossRef] [Scilit]
- Lai, K.E.; Abdul Rahiman, N.; Othman, N.; Ali, K.N.; Lim, Y.W.; Moayedi, F.; Mat Dzahir, M.A. Quantification Process of Carbon Emissions in the Construction Industry. Energy Build. 2023, 289, 113025. [Google Scholar] [CrossRef] [Scilit]
- Odoi-Yorke, F.; Opoku, R.; Davis, F.; Obeng, G.Y. Optimisation of Thermal Energy Storage Systems Incorporated with Phase Change Materials for Sustainable Energy Supply: A Systematic Review. Energy Rep. 2023, 10, 2496–2512. [Google Scholar] [CrossRef] [Scilit]
- He, F.; Ma, J.; Hu, Q.; Wang, J.; Chen, Y.; Yang, H.; Yang, Y. Enhancing Energy Efficiency and Decarbonization of Cement Production through Integrated Calcium-Looping and Methane Dry Reforming (CaL-DRM) for in-Situ CO2 Conversion to Syngas. Carbon Capture Sci. Technol. 2025, 14, 100359. [Google Scholar] [CrossRef] [Scilit]
- Sekisov, A.N.; Serga, G.V.; Gura, D.A.; Vyrodova, I.G.; Danko, V.P. Bases of Increasing Operational Characteristics of the Equipment for Cement Production. Civ. Eng. Archit. 2021, 9, 1498–1505. [Google Scholar] [CrossRef] [Scilit]
- Elmrabet, R.; Hmidani, Y.; Mariouch, R.; Elharfi, A.; Elyoubi, M.S. Influence of Raw Meal Composition on Clinker Reactivity and Cement Proprieties. Mater. Today Proc. 2021, 45, 7680–7684. [Google Scholar] [CrossRef] [Scilit]
- Gonçalves, J.P.; Han, T.; Sant, G.; Neithalath, N.; Huang, J.; Kumar, A. Toward Smart and Sustainable Cement Manufacturing Process: Analysis and Optimization of Cement Clinker Quality Using Thermodynamic and Data-Informed Approaches. Cem. Concr. Compos. 2024, 147, 105436. [Google Scholar] [CrossRef] [Scilit]
- Justnes, H. Alternative Low-CO2 “Green” Clinkering Processes. Rev. Mineral. Geochem. 2012, 74, 83–99. [Google Scholar] [CrossRef] [Scilit]
- Rashad, A.M. Metakaolin as Cementitious Material: History, Scours, Production and Composition-A Comprehensive Overview. Constr. Build. Mater. 2013, 41, 303–318. [Google Scholar] [CrossRef] [Scilit]
- Dunuweera, S.P.; Rajapakse, R.M.G. Cement Types, Composition, Uses and Advantages of Nanocement, Environmental Impact on Cement Production, and Possible Solutions. Adv. Mater. Sci. Eng. 2018, 2018, 4158682. [Google Scholar] [CrossRef] [Scilit]
- Mehta, P.K.; Monteiro, P.J.M. Concrete: Microstructure, Properties, and Materials, 4th ed.; McGraw-Hill Education: New York, NY, USA, 2014; ISBN 9780071797870. [Google Scholar]
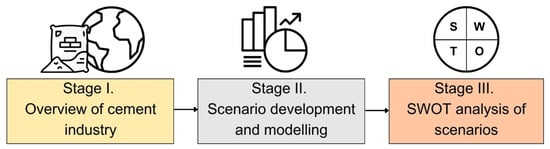
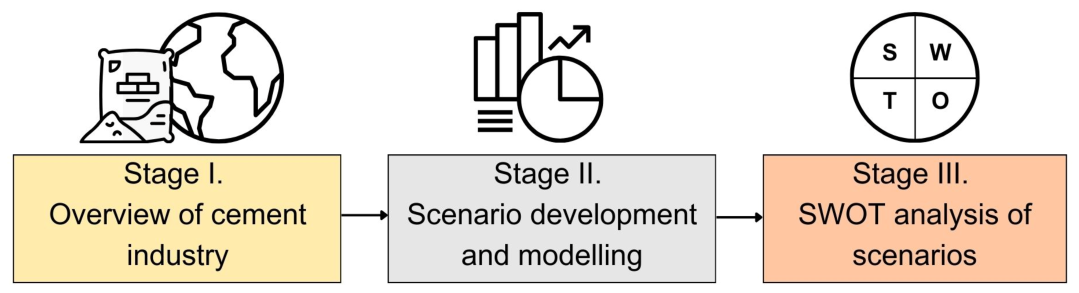
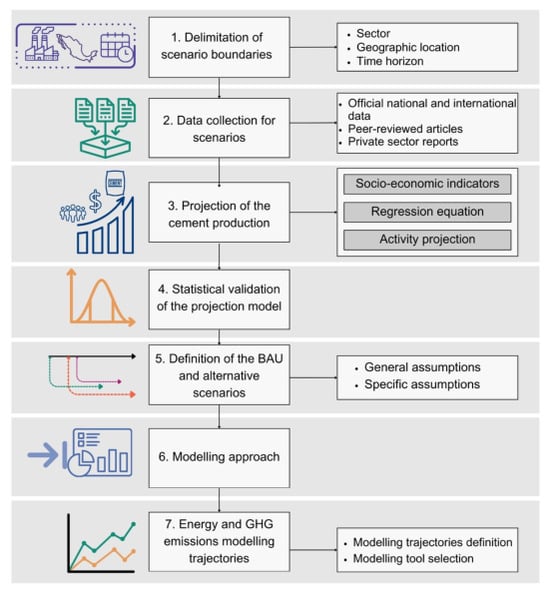
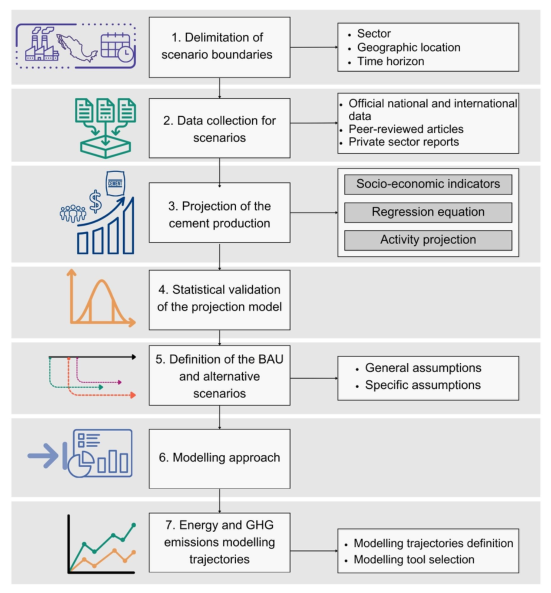
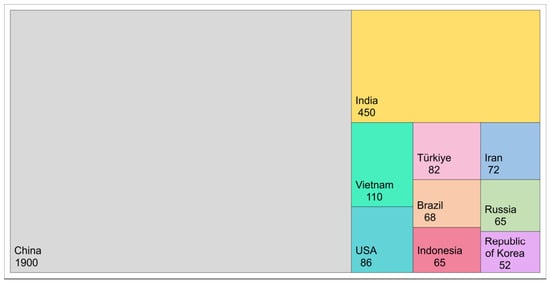
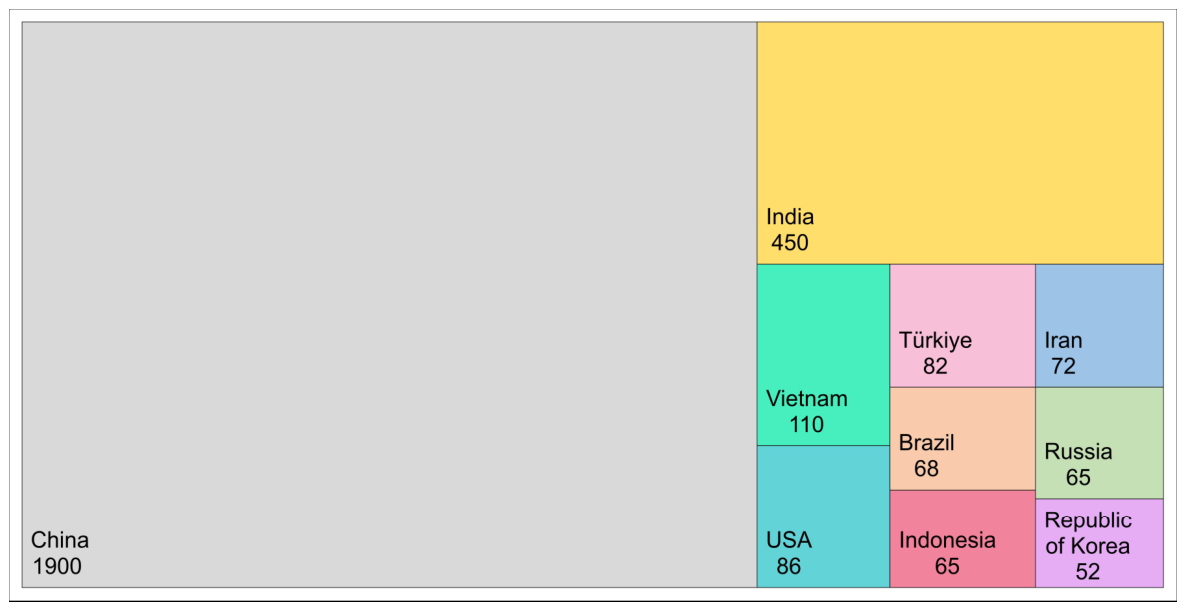
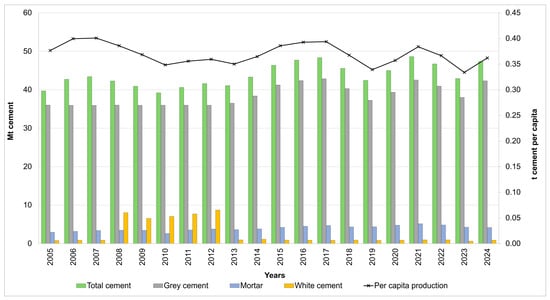
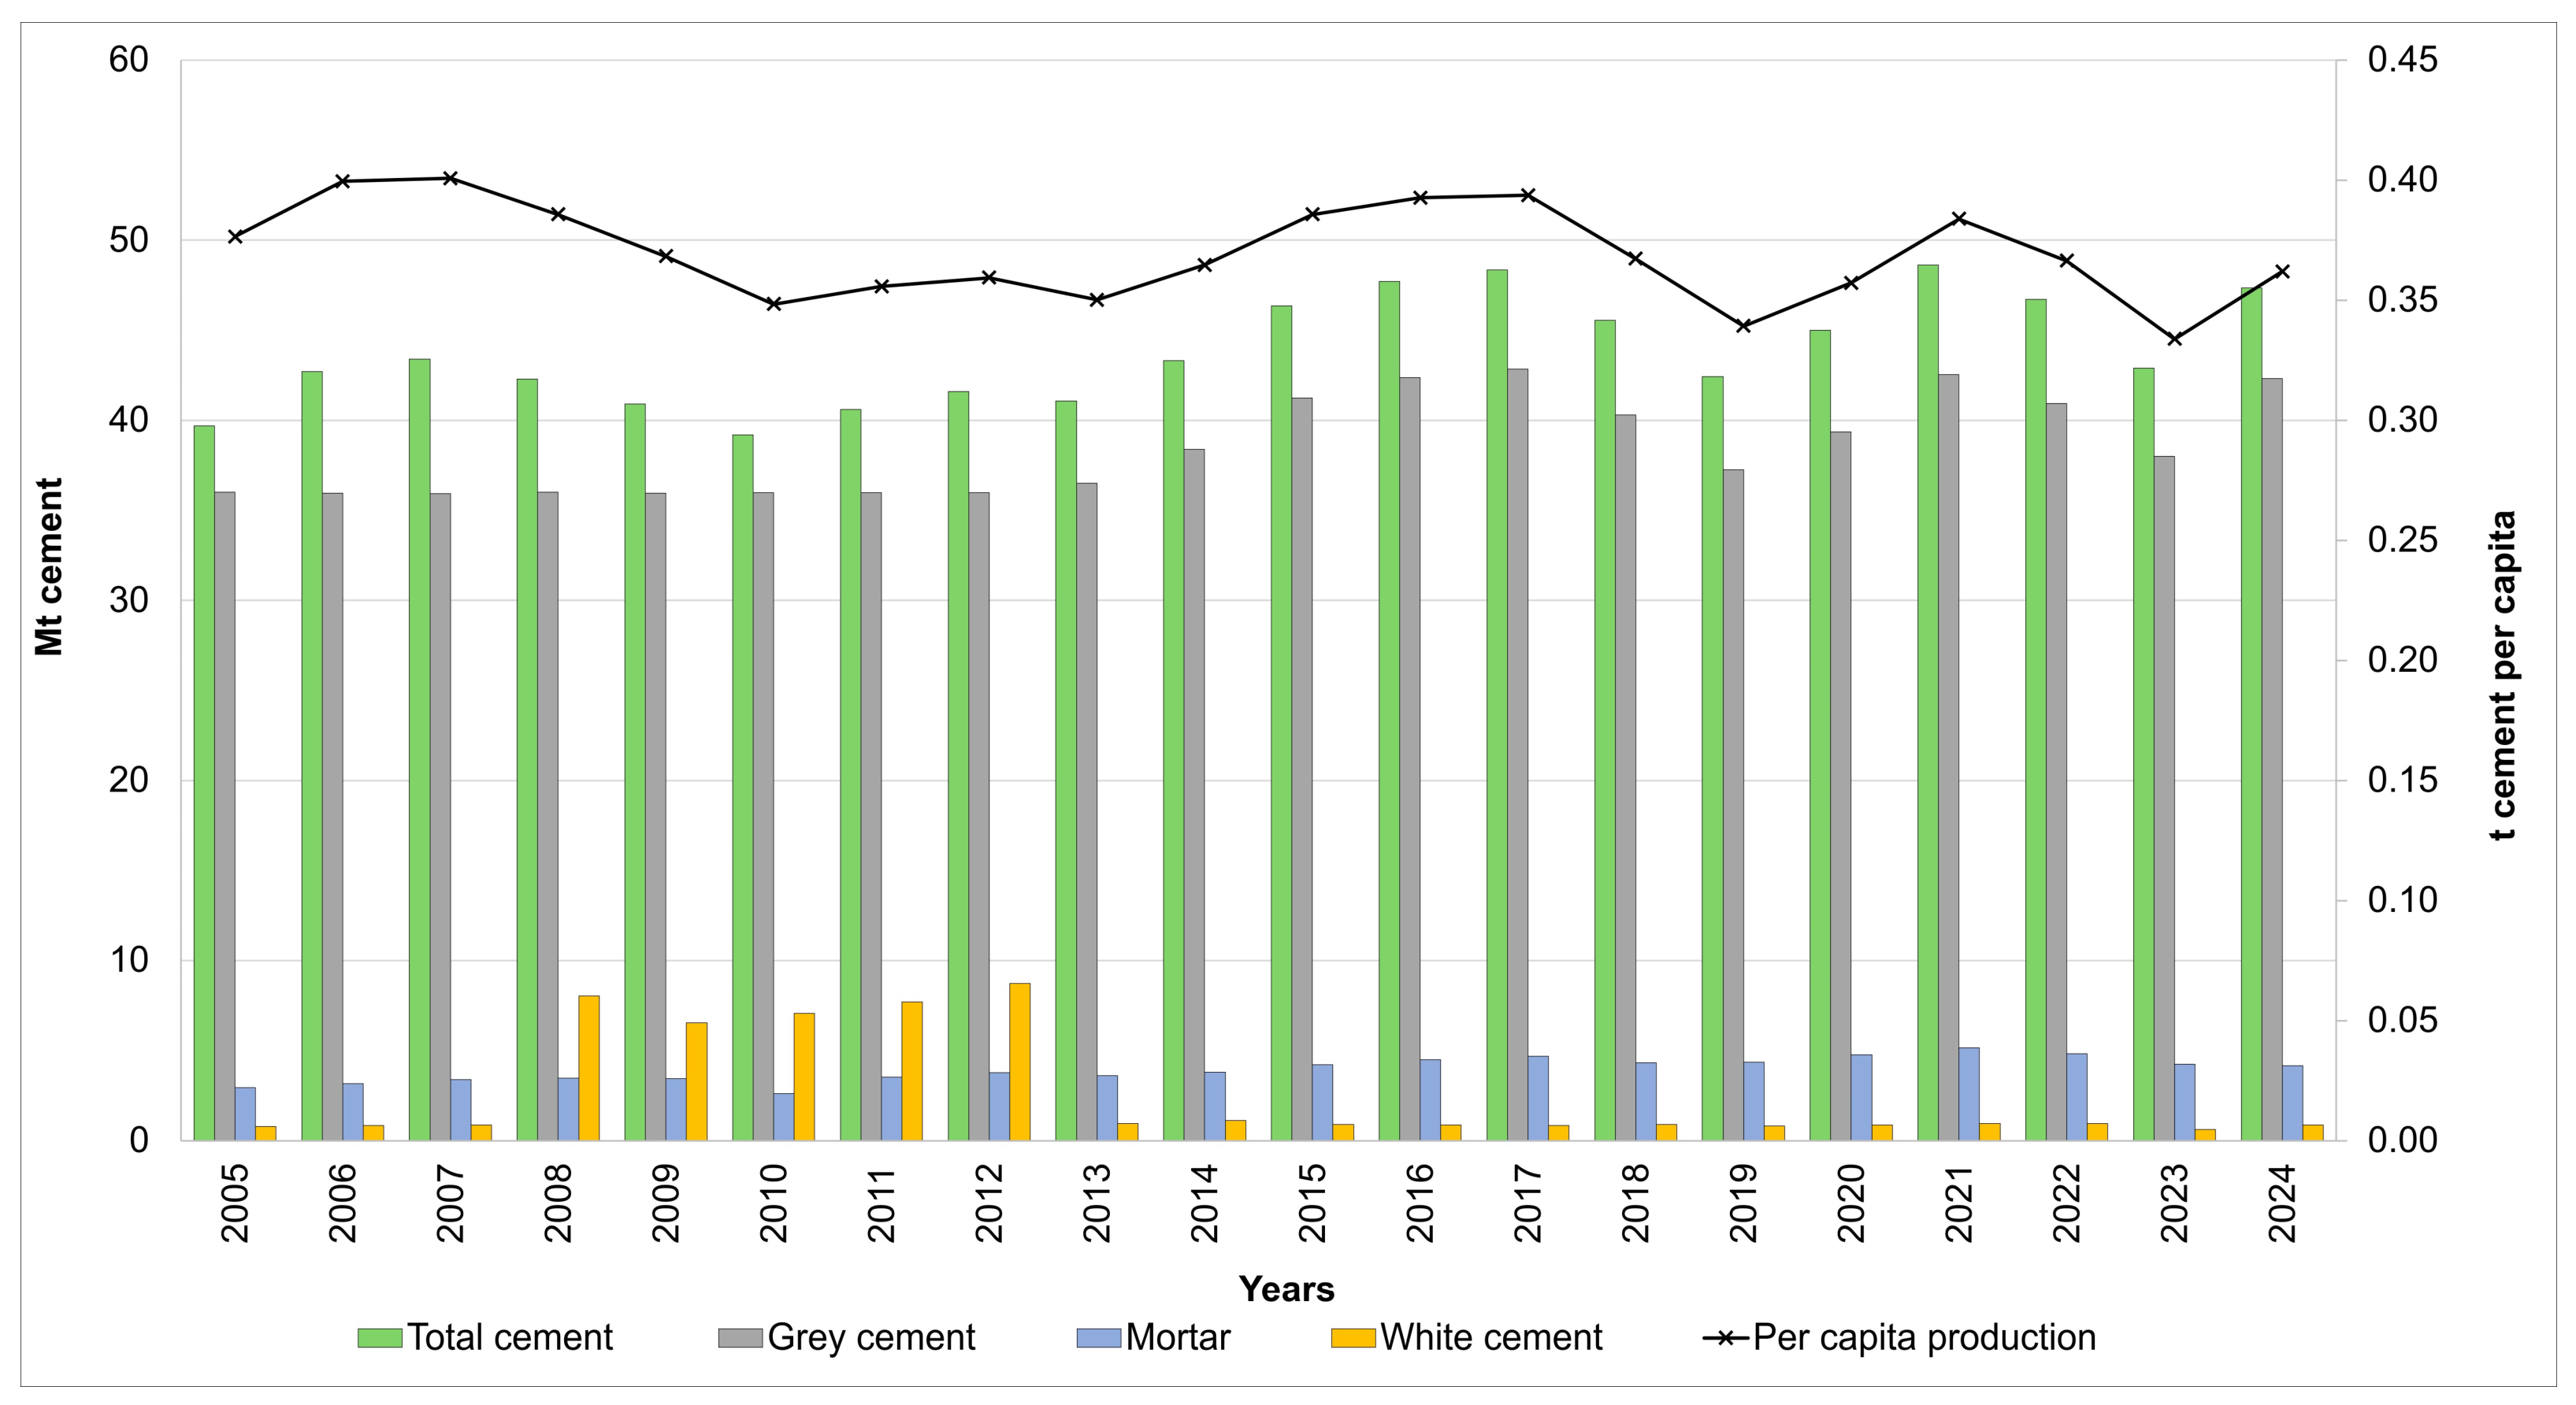
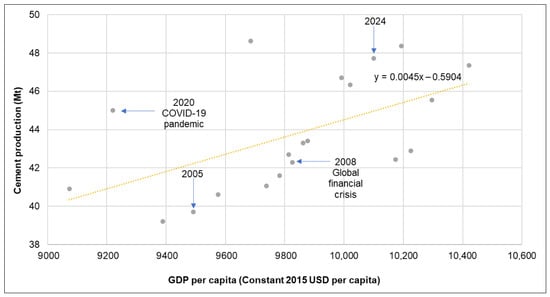
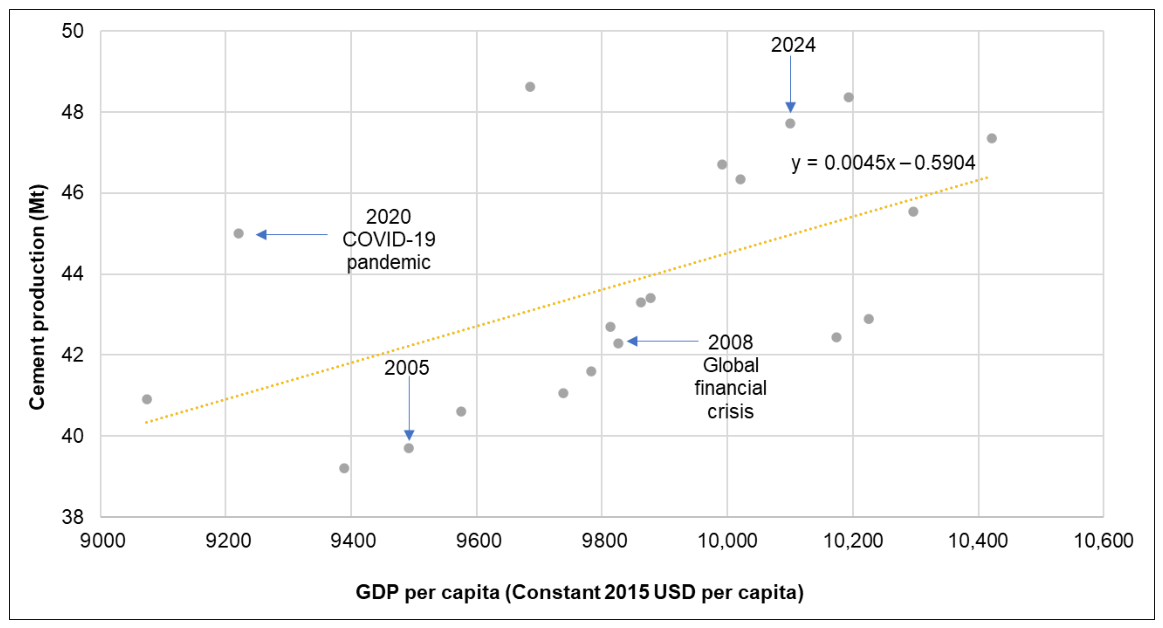
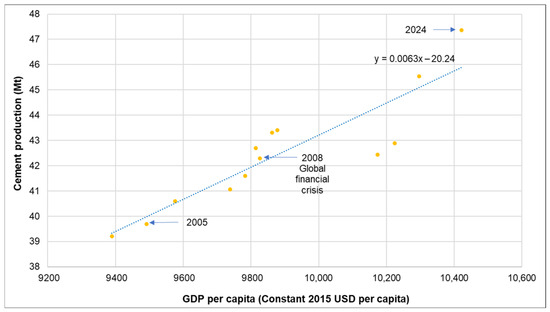
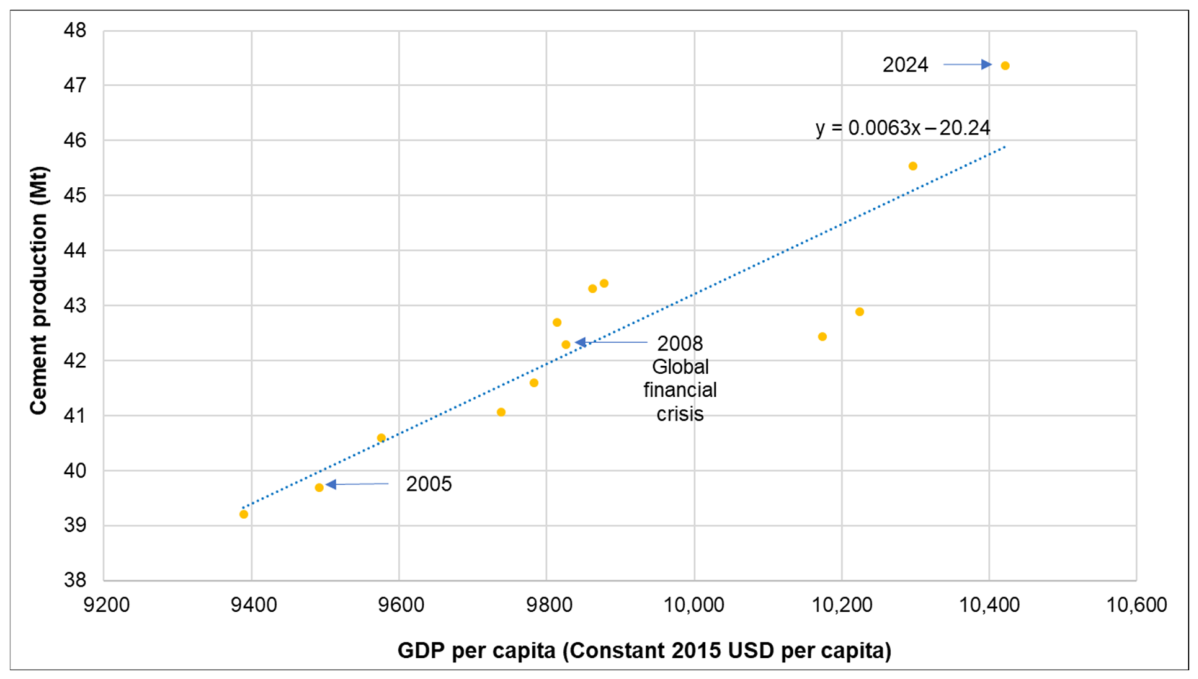
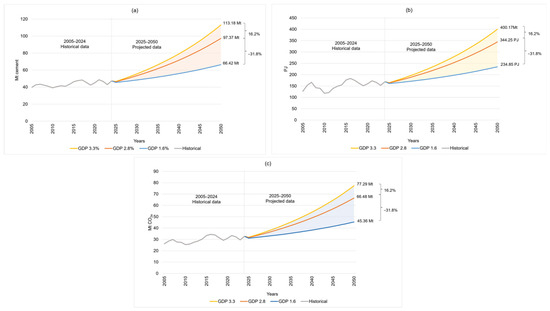
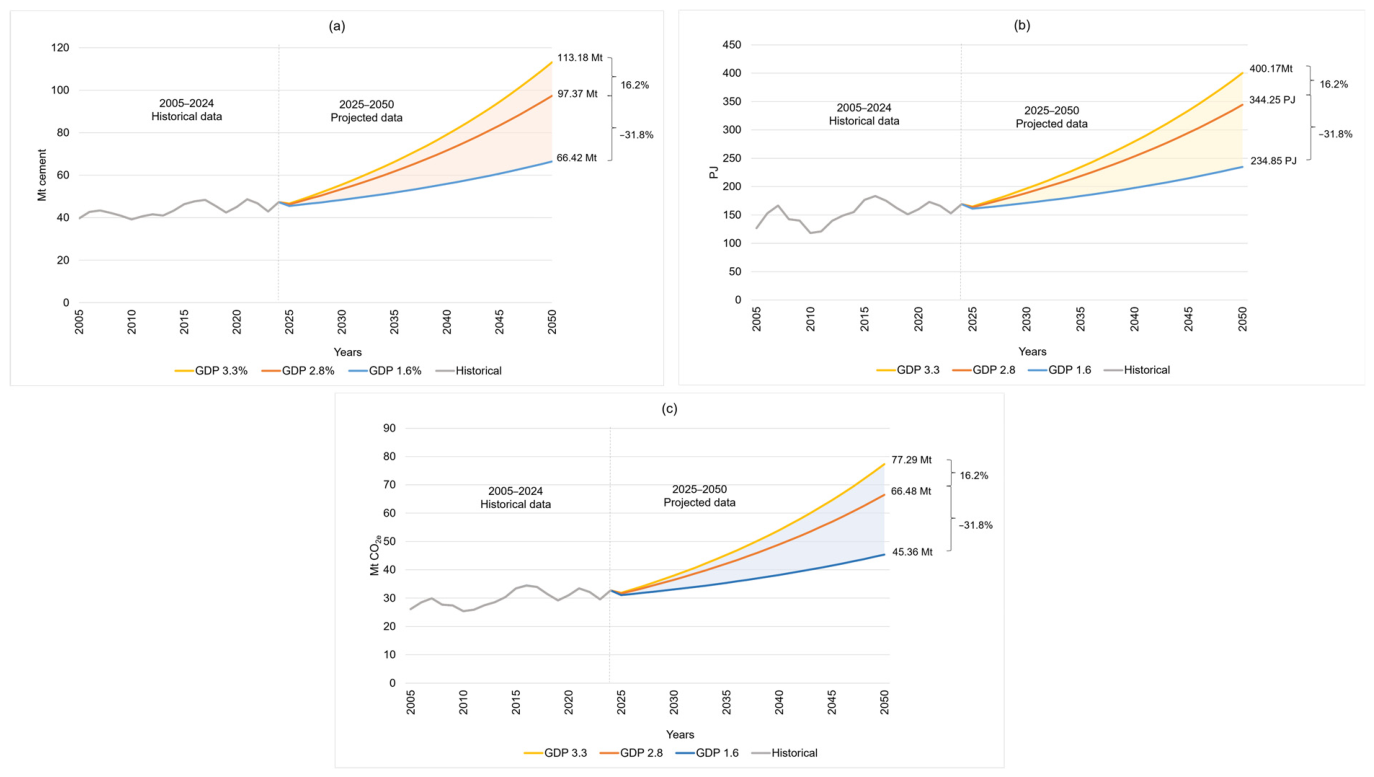
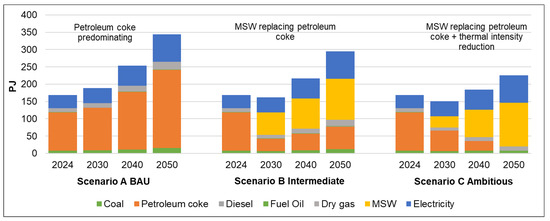
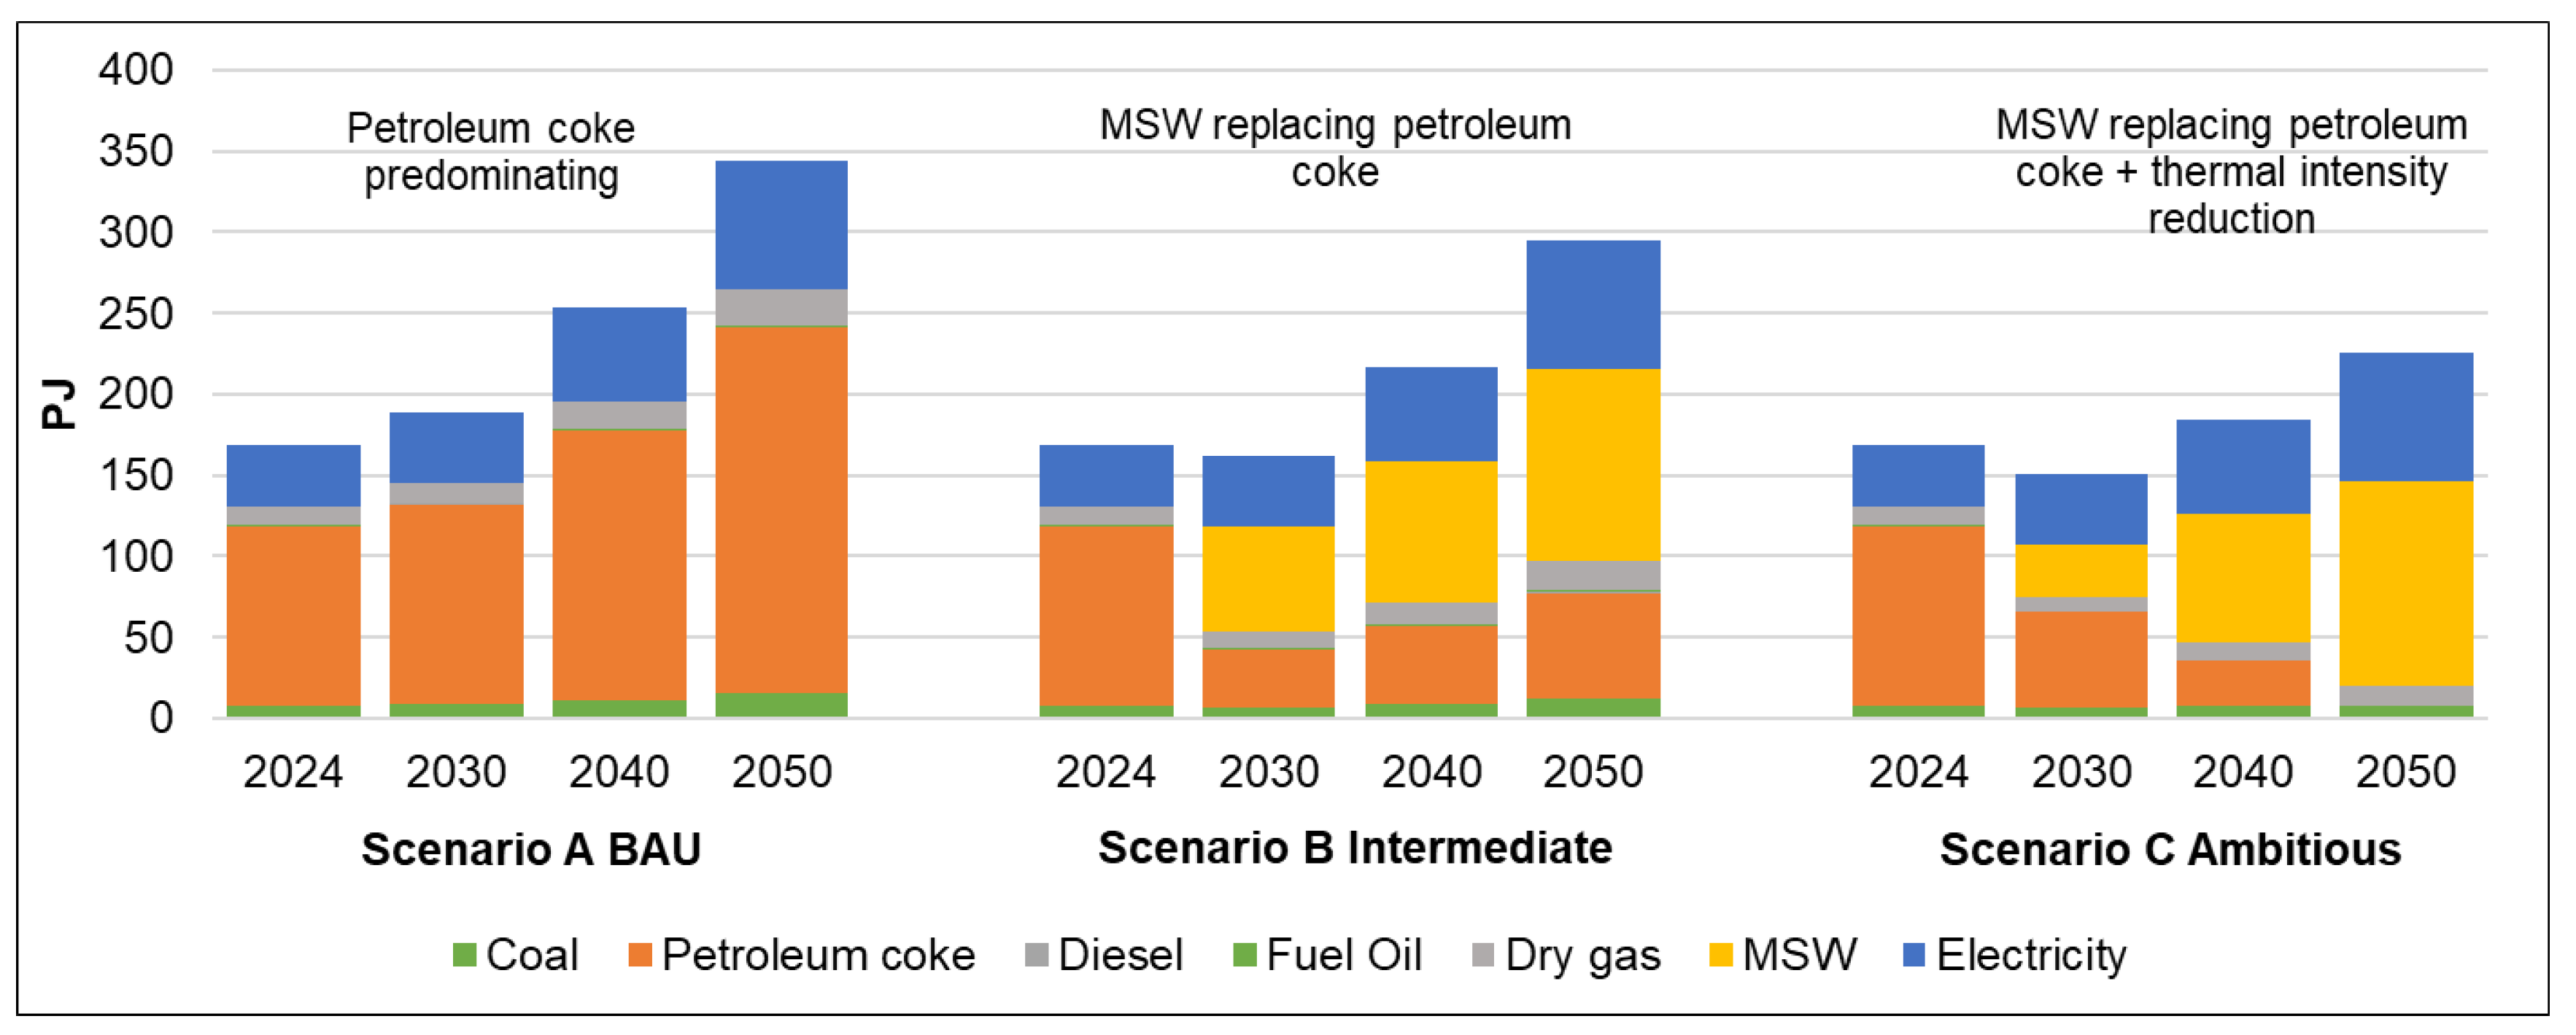
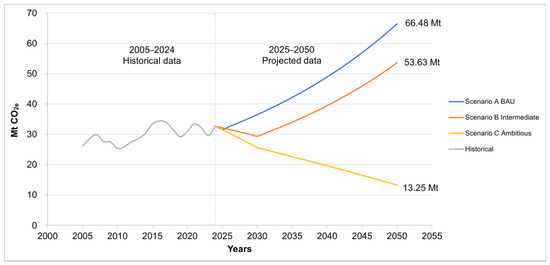
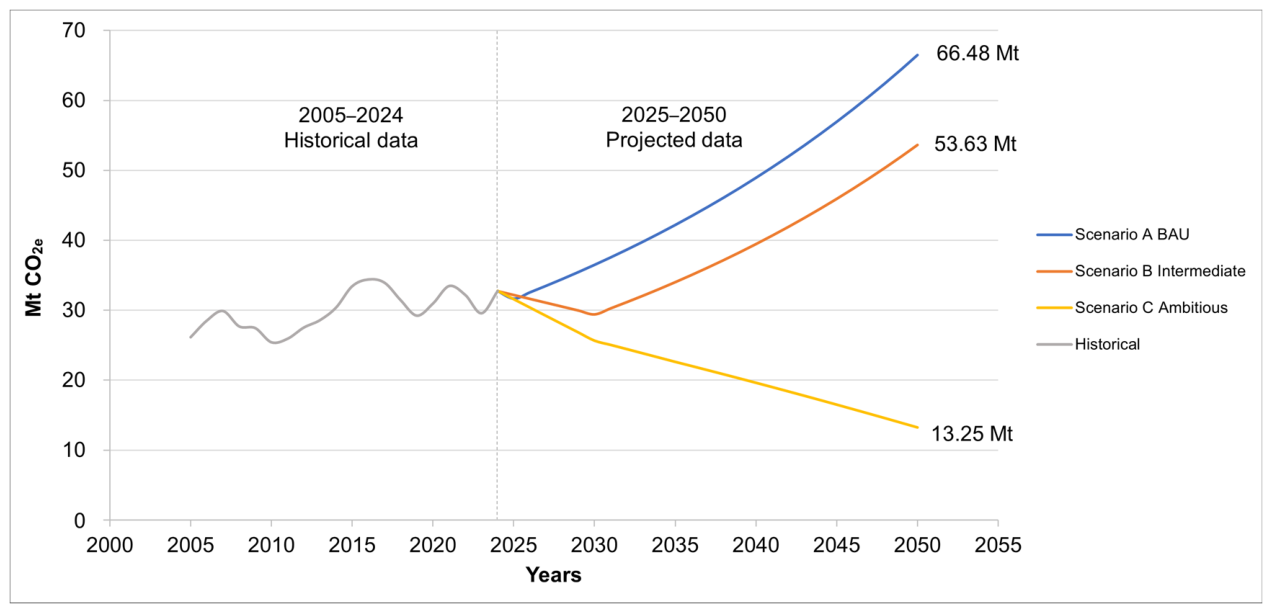
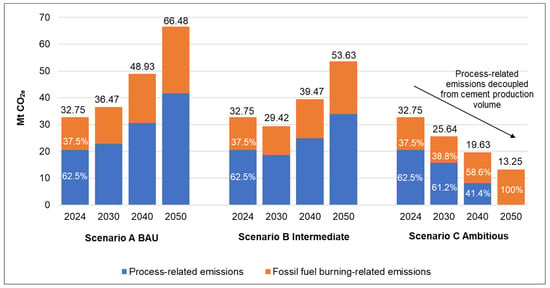
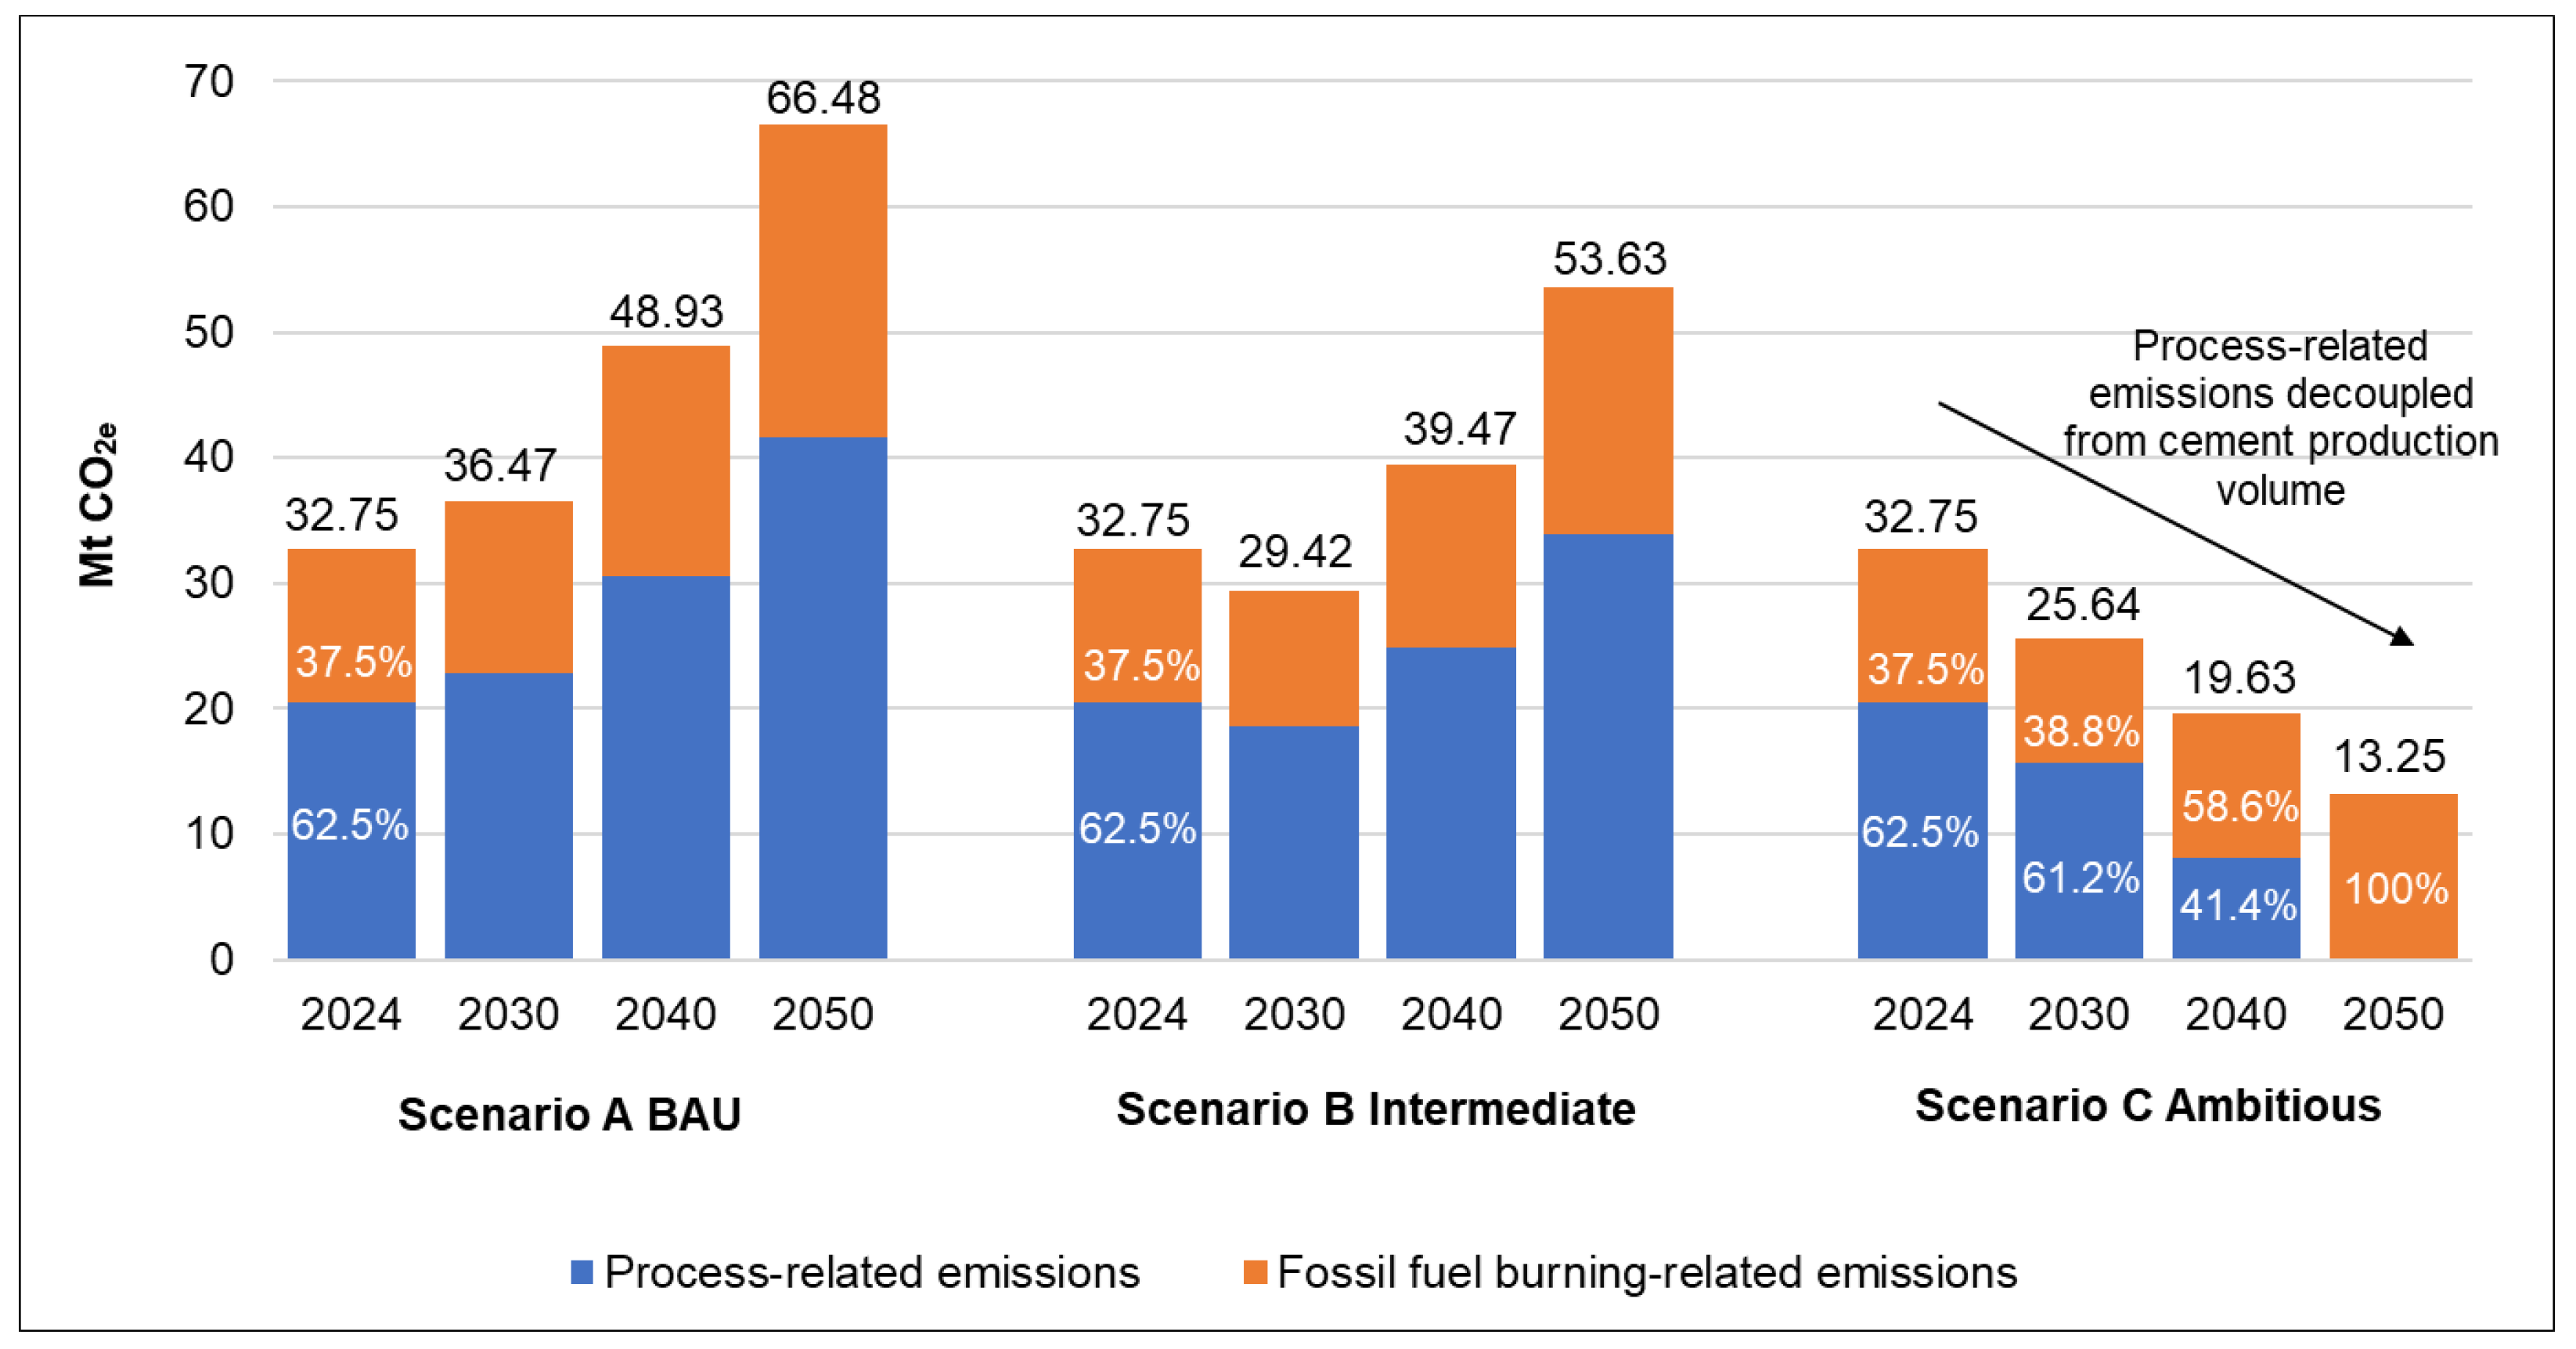
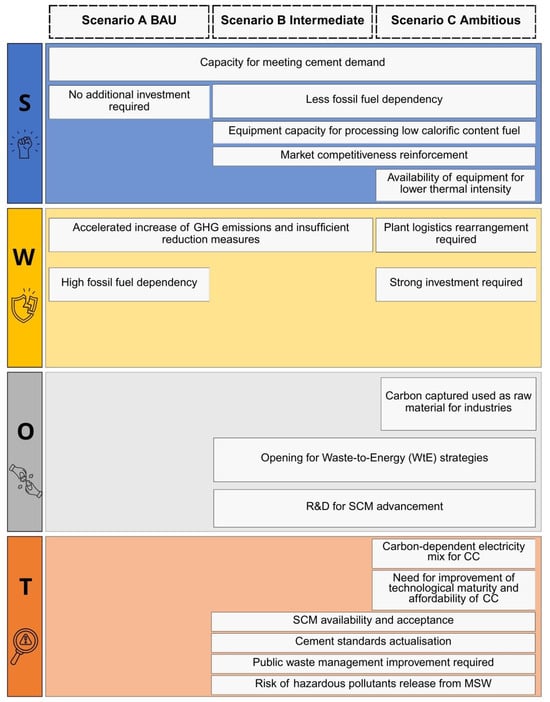
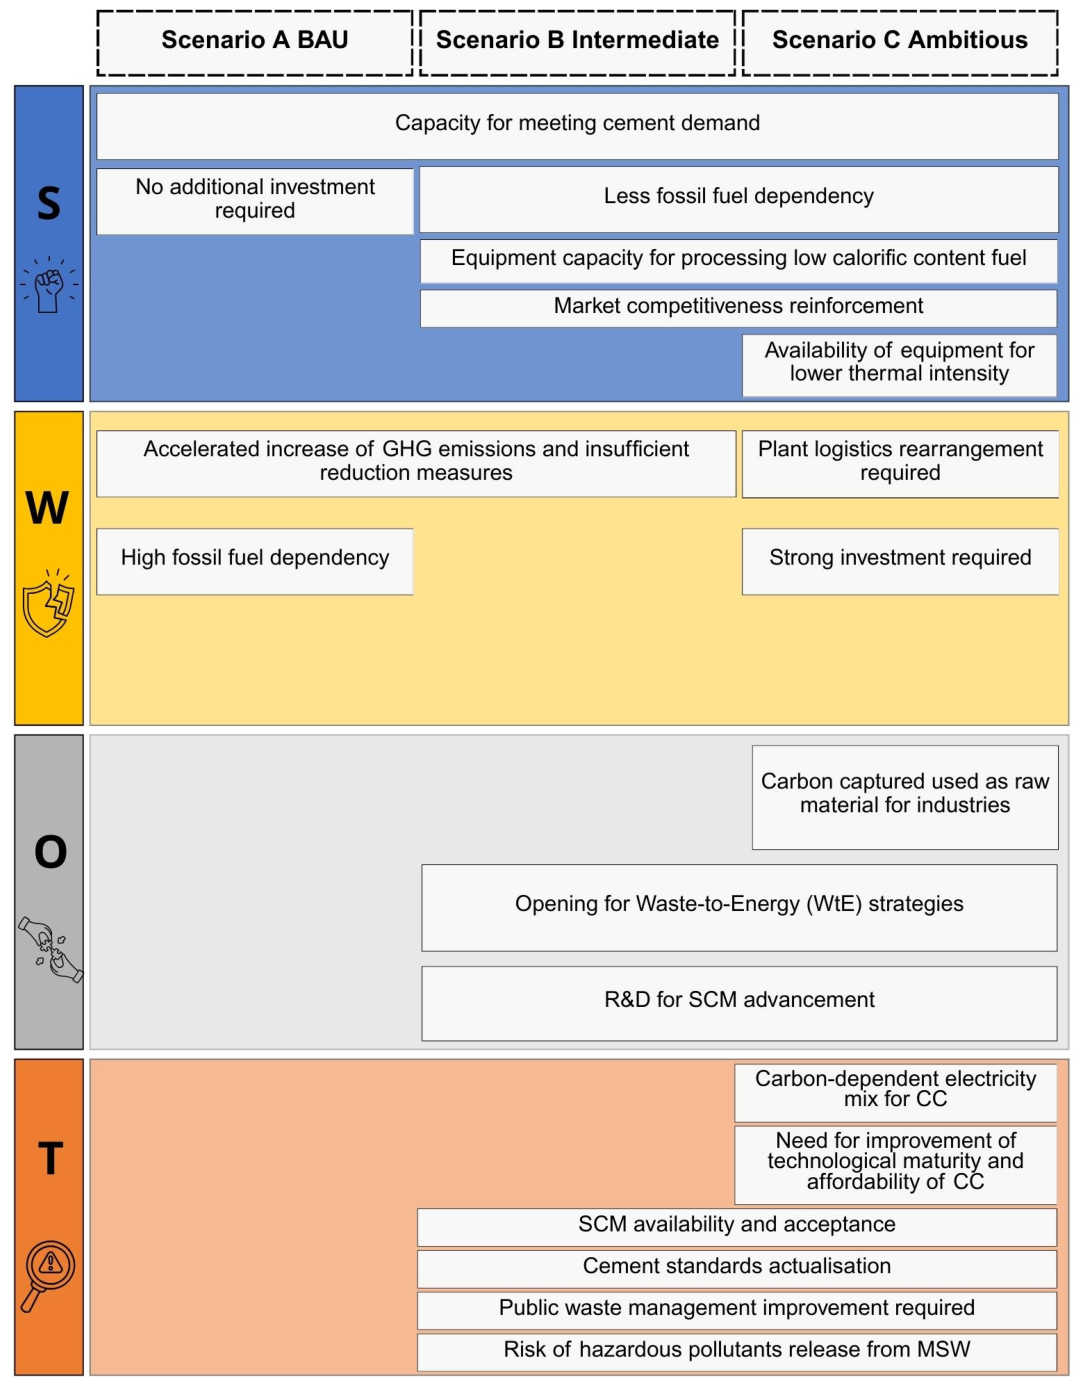

Disclaimer/Publisher’s Note: The statements, opinions and data contained in all publications are solely those of the individual author(s) and contributor(s) and not of MDPI and/or the editor(s). MDPI and/or the editor(s) disclaim responsibility for any injury to people or property resulting from any ideas, methods, instructions or products referred to in the content. |
© 2026 by the authors. Licensee MDPI, Basel, Switzerland. This article is an open access article distributed under the terms and conditions of the Creative Commons Attribution (CC BY) license.