


Abstract
With the conclusion of proton–proton collision data-taking in 2025, the ATLAS experiment has now integrated a luminosity exceeding 300 during the Run 3 period, which began in July 2022 following Long Shutdown 2 (LS2). During LS2, a series of detector upgrades were implemented, including the installation of the New Small Wheel (NSW) in the innermost stations of the Muon Spectrometer end-caps. The ATLAS Muon Spectrometer, the largest muon system ever built at a collider, now comprises both established gaseous detectors—Monitored Drift Tubes, Thin Gap Chambers, and Resistive Plate Chambers—and newer detectors like Micromegas and small-strip TGCs in the NSW. These new systems are now in stable operation following an extensive phase of construction and commissioning, providing enhanced muon tracking and trigger capabilities. This presentation covers the performance of the muon system, focusing on the stability of the established detectors over time, their ability to handle increasing luminosity and associated irradiation levels, and studies on detector aging. Emphasis will be placed on the NSW upgrade, including the strategies adopted for alignment, track reconstruction, and trigger. The performance results presented in this contribution are based on Run 3 data collected up to 2024.
1. Introduction
In 2022, the Large Hadron Collider (LHC) at CERN started its third operation period (Run 3) which is planned to continue until June of 2026, with a center-of-mass energy of 13.6 TeV. The ATLAS detector is a multipurpose particle detector with a forward–backward symmetric cylindrical geometry and ∼4 coverage in the solid angle. (ATLAS uses a right-handed coordinate system with its origin at the nominal interaction point (IP) in the center of the detector. The z-axis is along the beam pipe, the x-axis points from the IP to the center of the LHC ring, and the y-axis points upwards. Cylindrical coordinates () are used in the transverse plane, being the azimuthal angle around the z-axis. The pseudorapidity () is defined in terms of the polar angle as = −ln tan(/2). Transverse momentum () is defined relative to the beam axis and is calculated as sin , where p is the magnitude of the momentum. Transverse energy () is calculated as sin , where E is the energy. Angular distance is measured in units of .) The ATLAS Muon Spectrometer (MS) is located in the outer part of the ATLAS detector. Muons do not undergo strong interactions and have a mass higher than that of electrons. As a consequence, muons with momenta in the target range from a few GeV to the TeV scale at the ATLAS experiment exhibit high penetrating power, playing a key role in providing a distinctive signature in physics analyses. After the second operation period (Run 2) ended in 2018, the ATLAS experiment carried out its largest-scale upgrade to the MS during the LHC Long Shutdown 2 (LS2), which ended in 2022. This upgrade was designed to profit from a series of accelerator improvements towards the High-Luminosity LHC (HL-LHC), with an expected instantaneous luminosity of 5–7.5 times the nominal value (). The upgrade replaced the muon detectors at the innermost station of the MS in the forward region with the New Small Wheel (NSW) detectors for precision tracking and muon selection capabilities. Stable and efficient operation of the new detector is essential during Run 3 to cope with high pile-up conditions (). The pile-up () is defined as the average number of proton–proton interactions per bunch crossing.
2. The ATLAS Muon Spectrometer
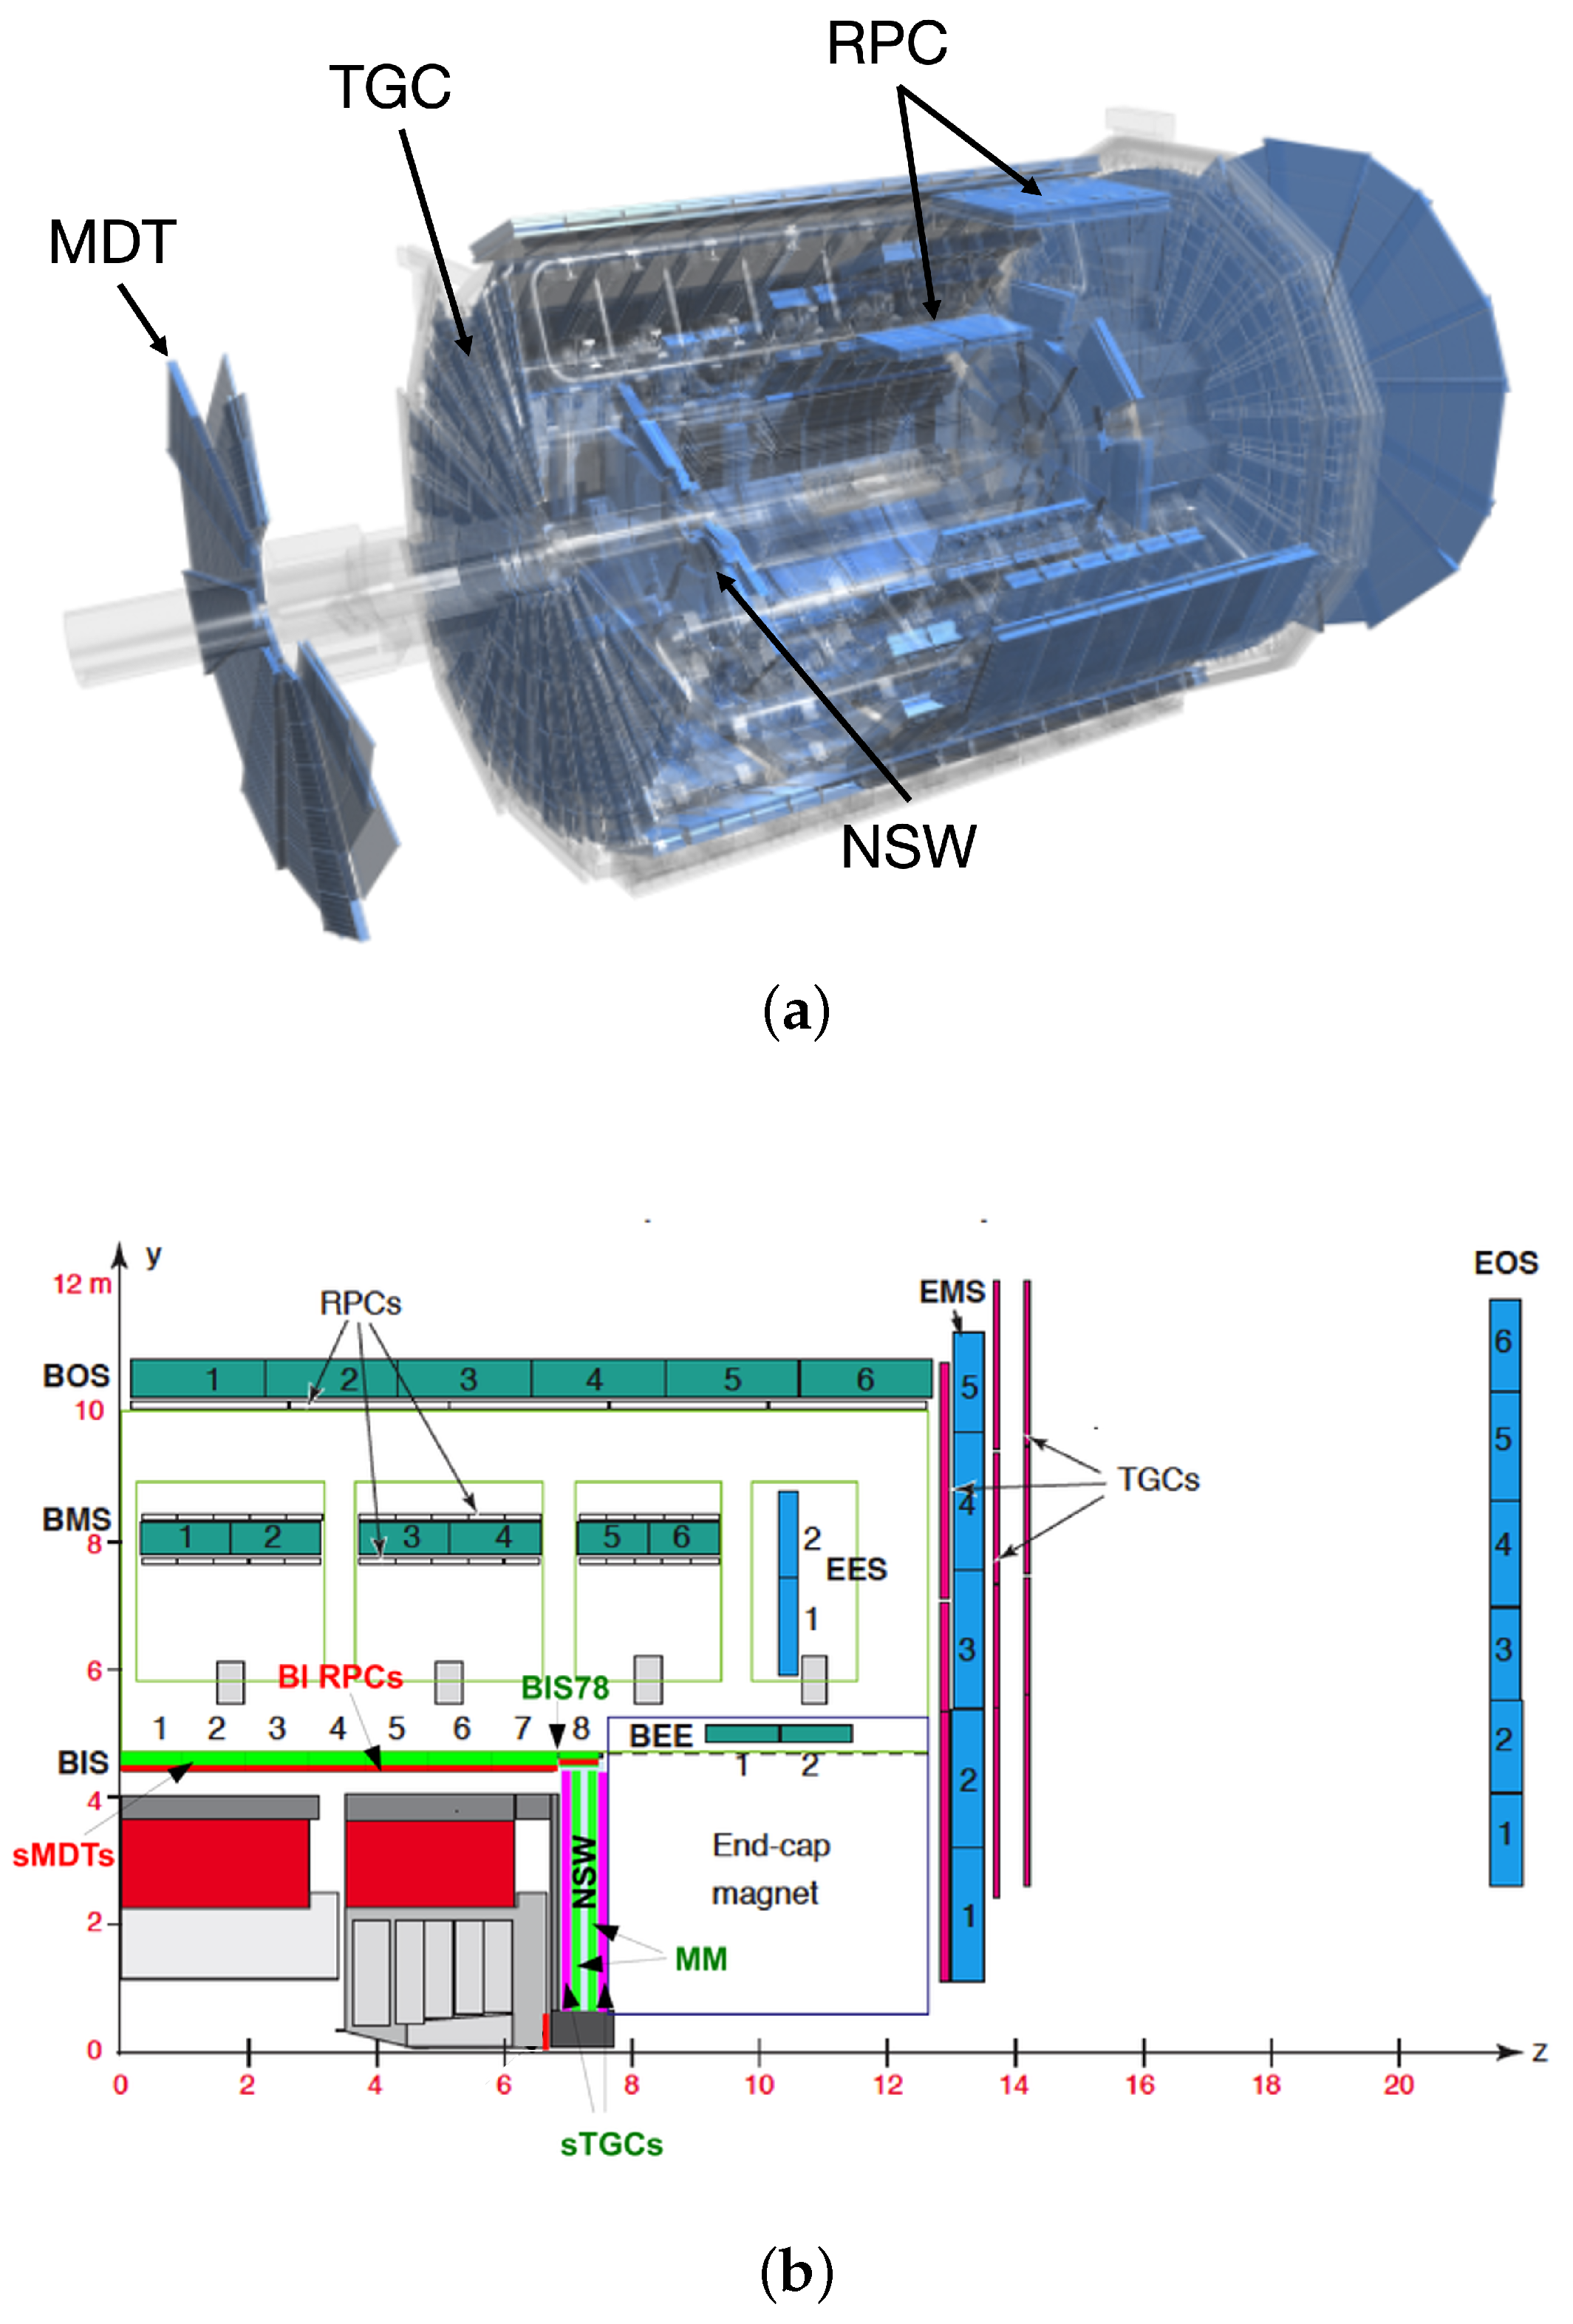
The MS forms the outermost layer of ATLAS and has a total volume of about 1600 . As shown in Figure 1, it consists of a barrel region and two end-cap regions. The barrel extends radially from 4.5 m to 11 m around the beam axis, while the end-caps extend longitudinally from 7 m to 23 m on both sides of the interaction point (IP). The side at a positive z is referred to as the A-side and the side with negative z as the C-side of the detector. The MS is composed of three established chamber types and two new detector technologies (Table 1). The established system includes Monitored Drift Tubes (MDTs), Resistive Plate Chambers (RPCs), and Thin Gap Chambers (TGCs), while Cathode Strip Chambers (CSCs) were used only during Run 1 and Run 2. The new system, the NSW, consists of two detectors: Micromegas (MM) and small-strip TGCs (sTGCs). Each detector covers a different pseudorapidity range, arranged to surround the IP. The MS contributes to both tracking and triggering.
The MS is located around the air-core toroidal magnet. The Muon Spectrometer is embedded in an air-core toroidal magnetic field, with an average field strength of about 0.5 T and reaching up to approximately 1 T in some regions. In the barrel region (), the field is provided by eight superconducting coils forming the barrel toroid. In the forward region (), the field is generated by the end-cap toroids, installed on both ends of the barrel toroid. Thus, in the intermediate pseudorapidity range, the overlap of the barrel and end-cap fields creates a complex magnetic field.
Table 1.
The ATLAS Muon Spectrometer overview. The New Small Wheel consists of two detector technologies: Micromegas and small-strip TGCs [1,2]. † The Cathode Strip Chambers were operated during Run 1 and Run 2 and were removed after Run 2, being replaced by the New Small Wheel during LS2.
Figure 1.
ATLAS Muon Spectrometer overview and location. (a) It shows the overall structure of the ATLAS detector, with the MS drawn in blue [3]. (b) It shows a quarter-cut view. Each detector covers a different pseudorapidity range. The MDTs are shown here as BOS, BMS, BIS, BEE, EEB, EMS, and EOS [1].
2.1. Established and Phase-I-Upgraded Chambers
The established chambers, MDT, RPC, and TGC, have worked well for over 10 years. The CSCs, which were operated during Run 1 and Run 2 in the forward region, also demonstrated stable performance but are not discussed further here, as this contribution focuses on the Run 3 operation. This section introduces the characteristics of these detectors.
2.1.1. Monitored Drift Tubes (MDTs)
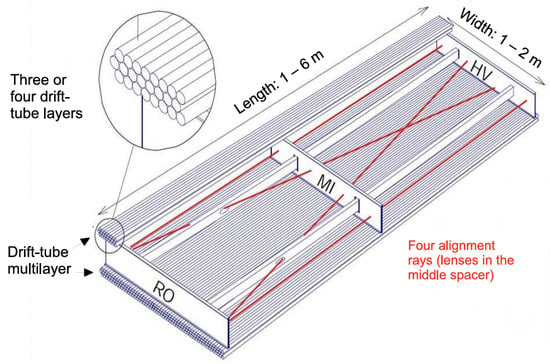
The MDTs perform the precise coordinate measurement in the bending direction of the toroidal magnet and therefore provide the muon momentum measurement. The tubes cover an area of 5500 , which is needed for a good momentum determination for muons with pseudorapidity in both barrel and end-cap regions. The drift tubes are cylindrical aluminum tubes of 30 mm diameter and a tungsten–rhenium central wire of 50 m diameter. They are operated with a gas mixture composed of Ar (93%) and at three bar absolute pressure for reduced diffusion and ionization fluctuation. The wire is provided with high voltage (HV) at 3080 V. The MDT stations consist of two multilayer blocks of drift tubes, separated by a spacer. Each multilayer block contains three or four layers of 30 mm diameter drift tubes (Figure 2). The MDT chambers are classified into three types according to their installation location: barrel, end-cap, and special regions. The barrel and end-cap chambers share a standardized spacer structure with different dimensions. Each type is optimized to match the magnetic field conditions and structural constraints of its respective area [2].
Figure 2.
Mechanical structure of an MDT chamber. Three spacer bars connected by longitudinal beams form an aluminum spacer frame, carrying two multilayers of three or four drift tube layers [4].
2.1.2. Resistive Plate Chamber (RPC)
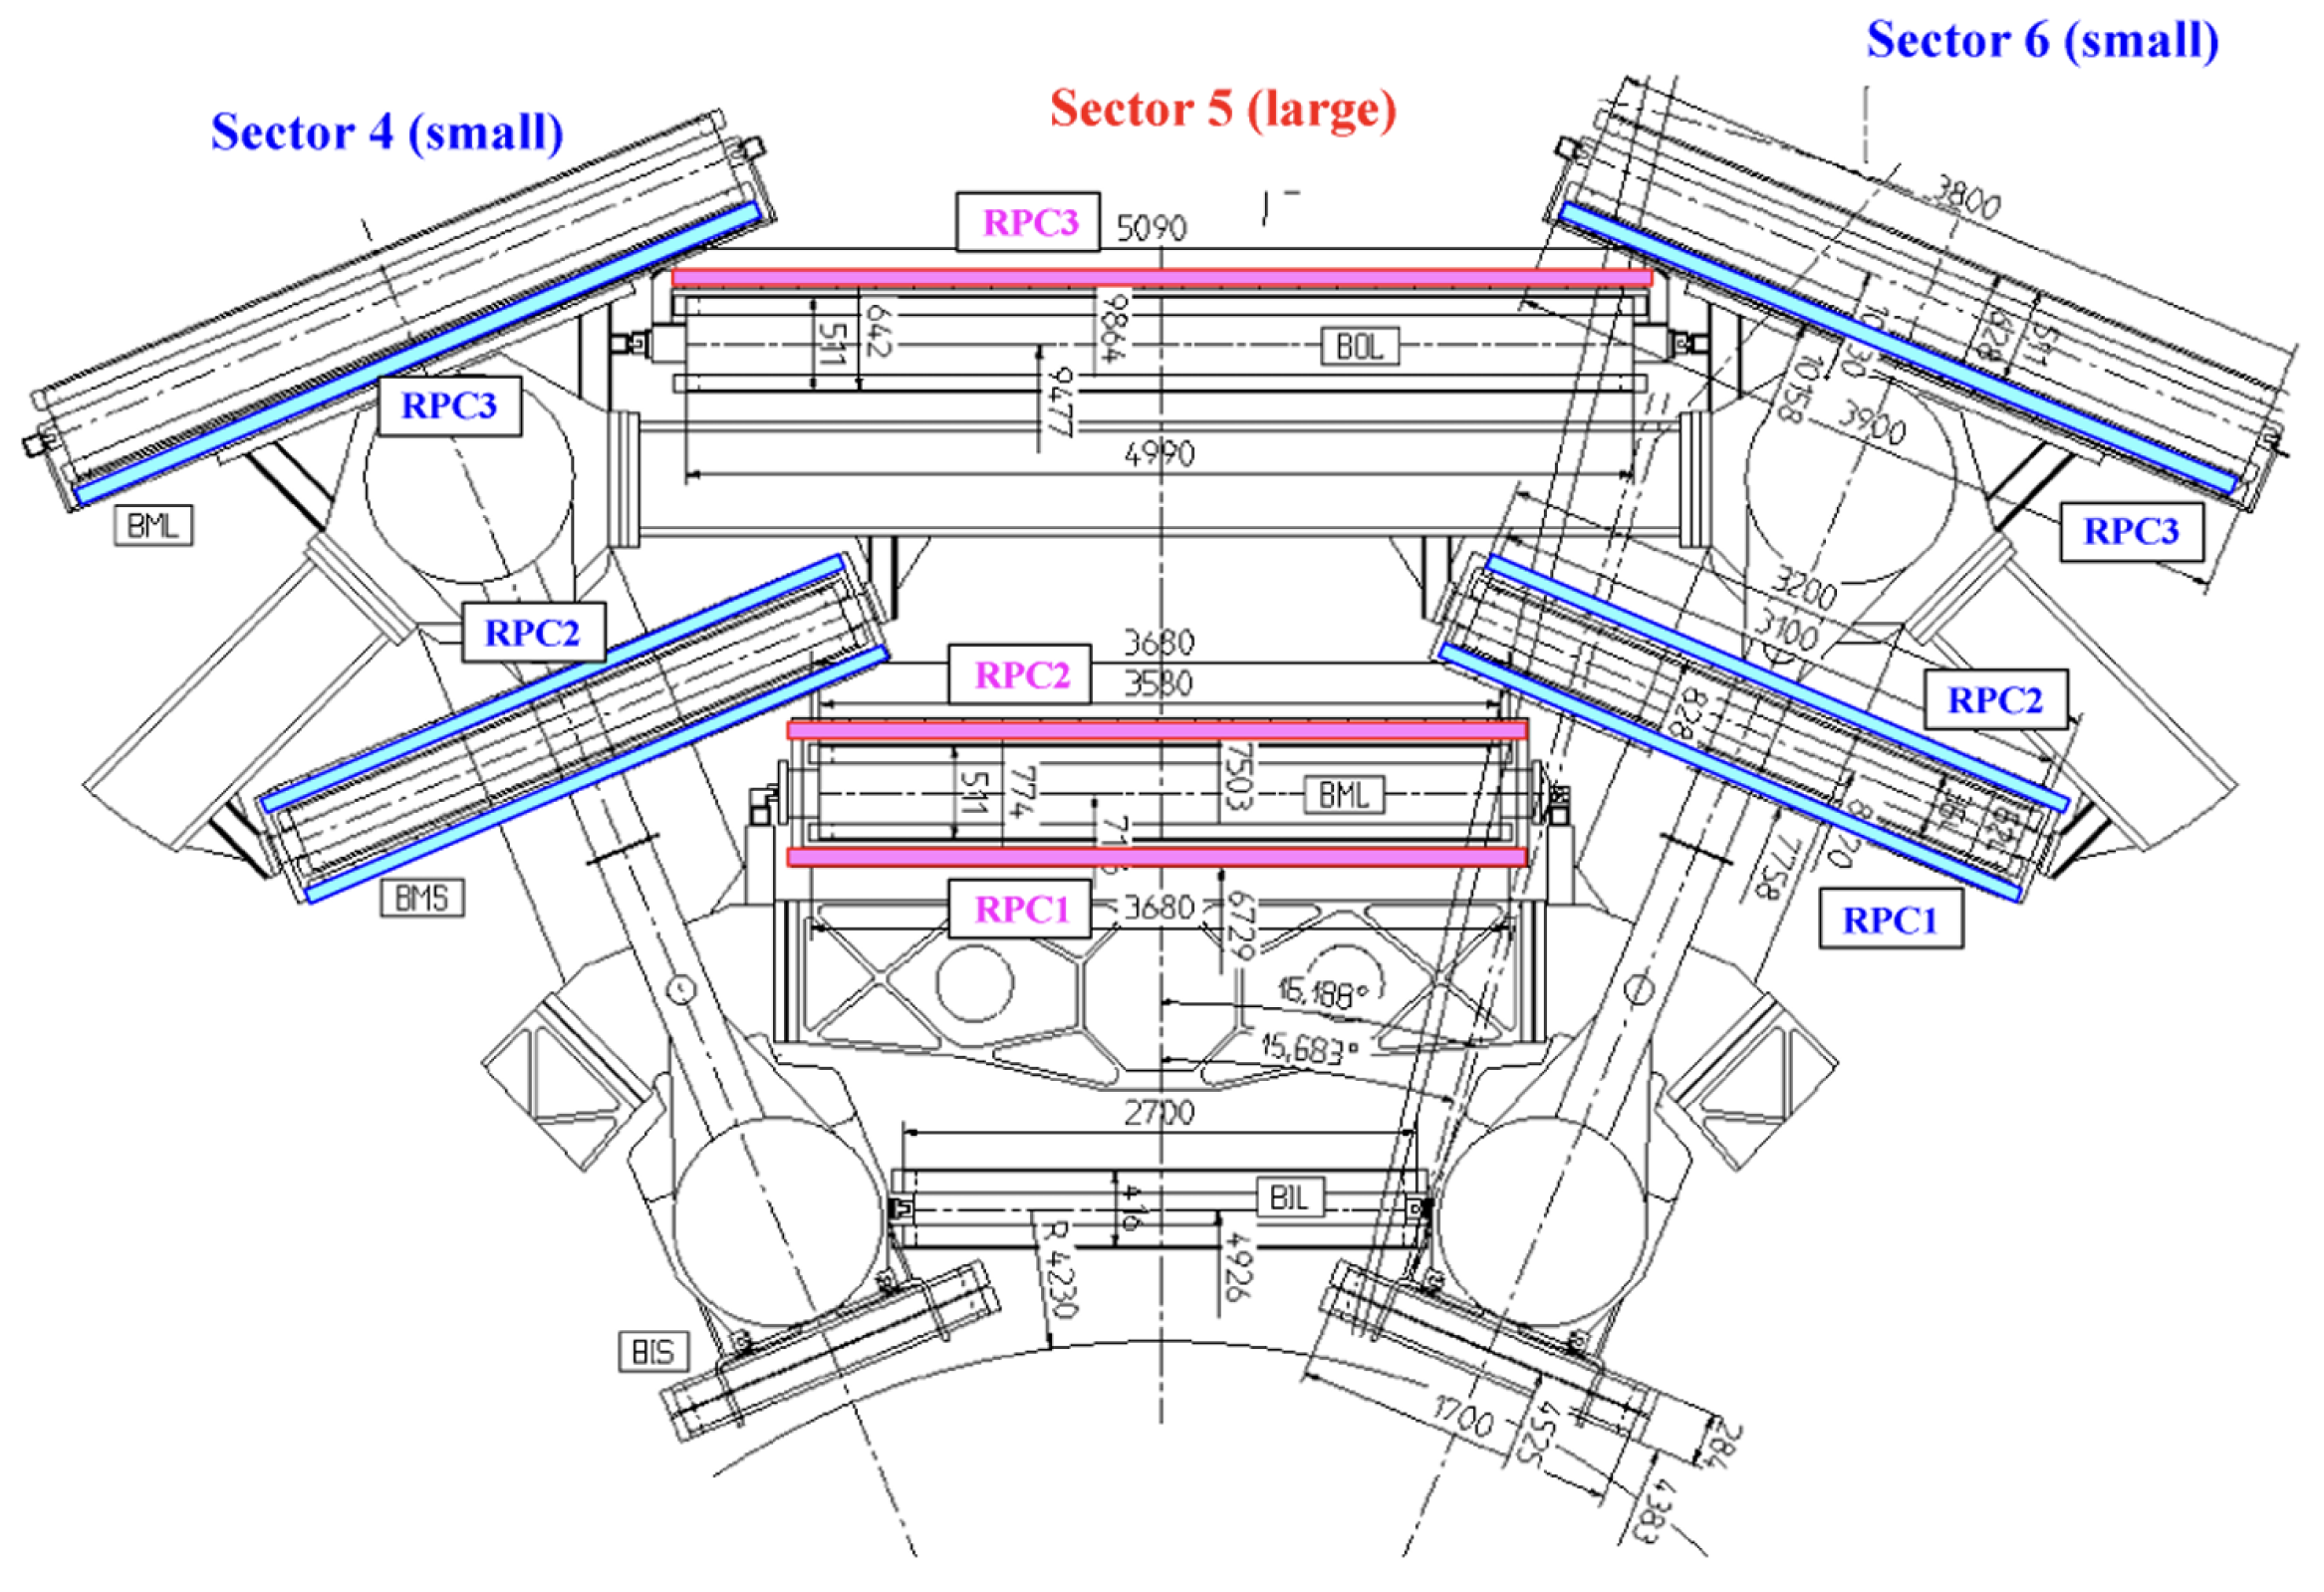
The muon trigger system in the barrel region consists of three concentric cylindrical layers of RPCs around the beam axis, referred to as the three trigger stations. To provide redundancy and ensure high trigger efficiency, each station consists of two independent detector layers, each measuring and . Figure 3 shows a standard barrel sector and the location of the RPC. If a track goes through all three stations, it provides a maximum of six measurements in and . For this redundancy in the track measurement, the low-transverse momentum () trigger applies a coincidence requirement in both projections, requiring hits in at least two out of four layers of the middle RPC stations, RPC1 and RPC2. For the high- trigger, a muon candidate identified by the low- trigger is further required to have an additional hit in the outer RPC station, RPC3. This trigger scheme rejects fake tracks from noise hits and greatly improves the trigger efficiency in the presence of small chamber inefficiencies.
Figure 3.
It shows the locations of the RPCs. In the middle chamber layer, RPC1 and RPC2 are below and above their respective MDT partner. In the outer layer, the RPC3 is placed outside the MDT in the large sectors and inside the MDT in the small sectors [4].
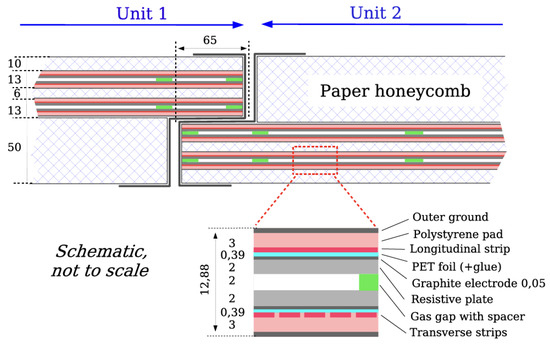
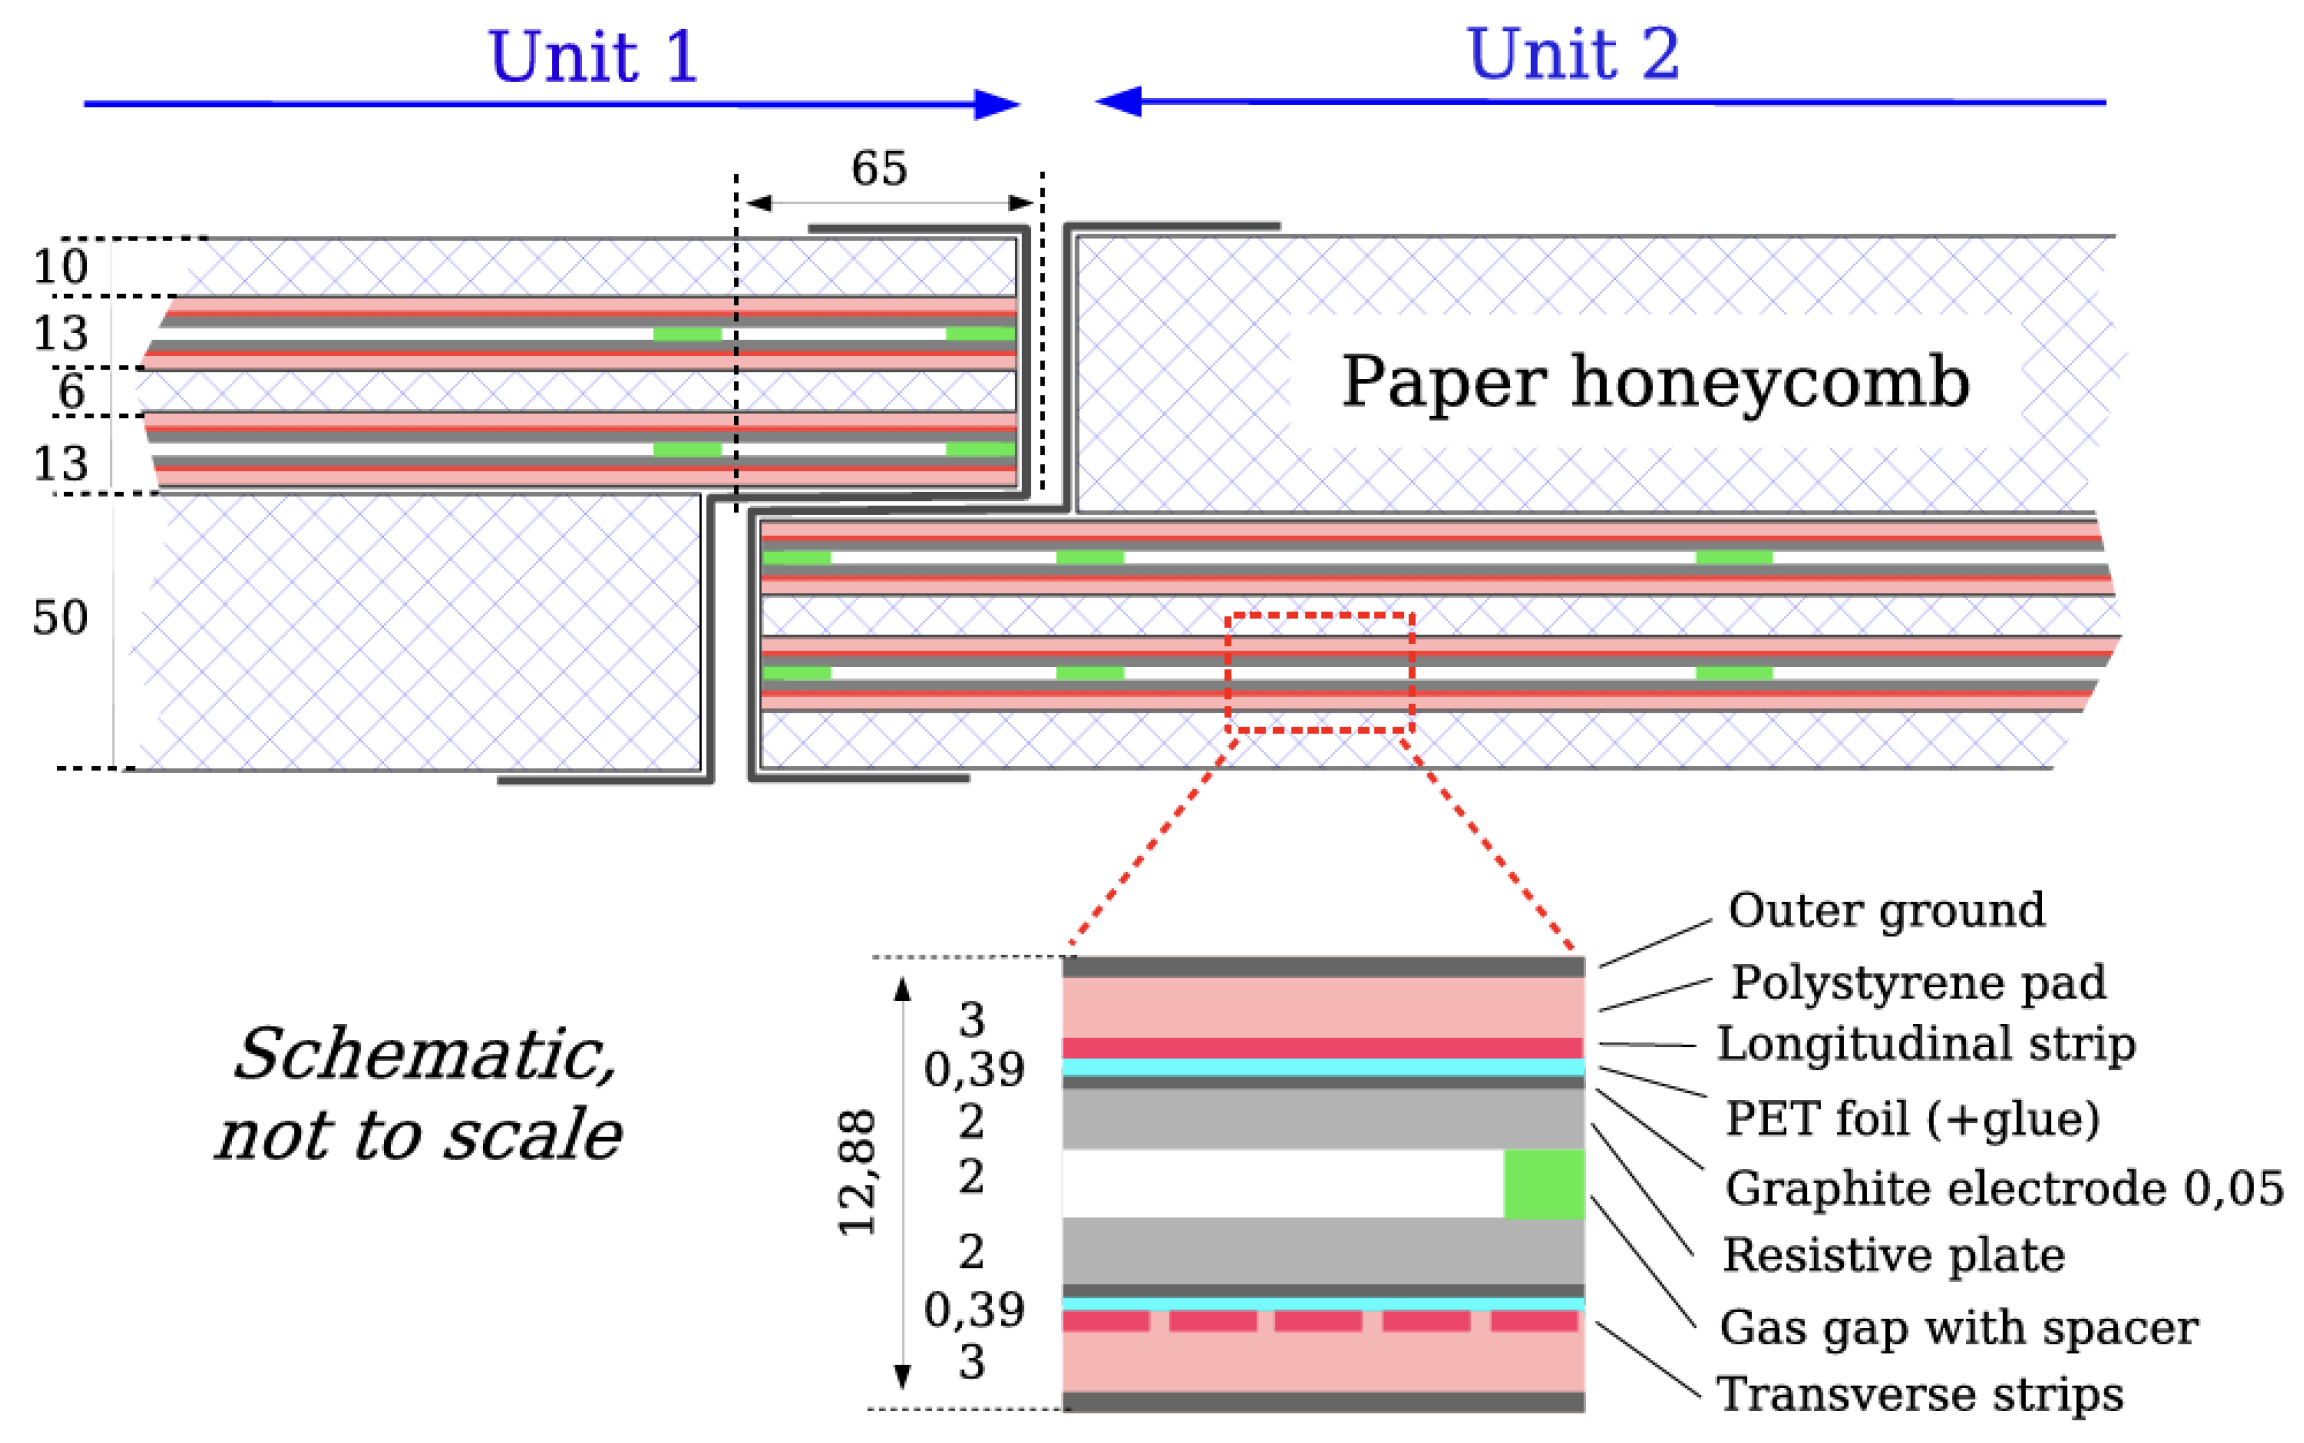
The RPC is made of two rectangular detectors called units. Each unit consists of two independent gas volumes, which are each read out by two orthogonal sets of pick-up strips. The structure of the gas volumes is identical for all RPCs. The two resistive plates are made of a 2 mm thick phenolic laminate, and their volume resistivity is cm. They are separated by a 2 mm gas gap. The distance of the gas gap is maintained by a series of insulating spacers. As shown in Figure 4, each resistive plate is coated on its outer surface with a thin graphite electrode, which provides a conductive surface for applying the high voltage.
Figure 4.
This shows a cross-sectional view of the RPC. It has two units and they are joined to form a detector module. Each unit consists of two gas volumes supported by spacers (the distance between successive spacers is 100 mm), four resistive electrodes and four readout planes, reading the transverse and longitudinal directions. These units are sandwiched by paper honeycomb. The strips are in the plane of the figure and the strips are perpendicular to it [4].
A readout signal is induced on the strips by the drift motion of the avalanche electrons. The graphite electrode is interposed between the gas gap and the readout strips. It does not significantly shield the signal induction due to its high resistivity and the fast rise time of the induced signal [4].
Until 2023, the standard RPC gas used was a mixture of (94.7%), Iso-, and . However, for a reduction in Global Warming Potential (GWP) (the Global Warming Potential (GWP) quantifies the amount of heat trapped in the atmosphere by a greenhouse gas over a given time period, relative to ), the RPC is operated by changing the gas mixture and operation voltage, as described in Section 3.
2.1.3. Thin Gap Chamber (TGC)
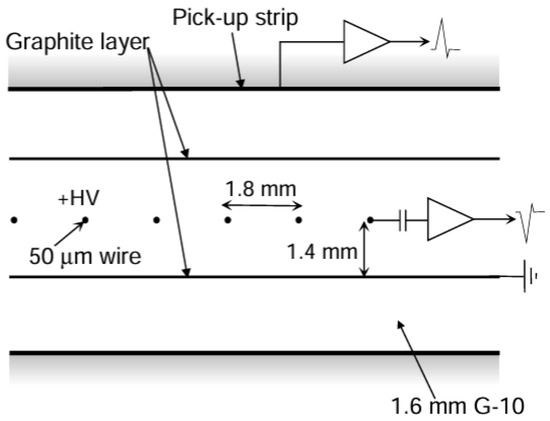
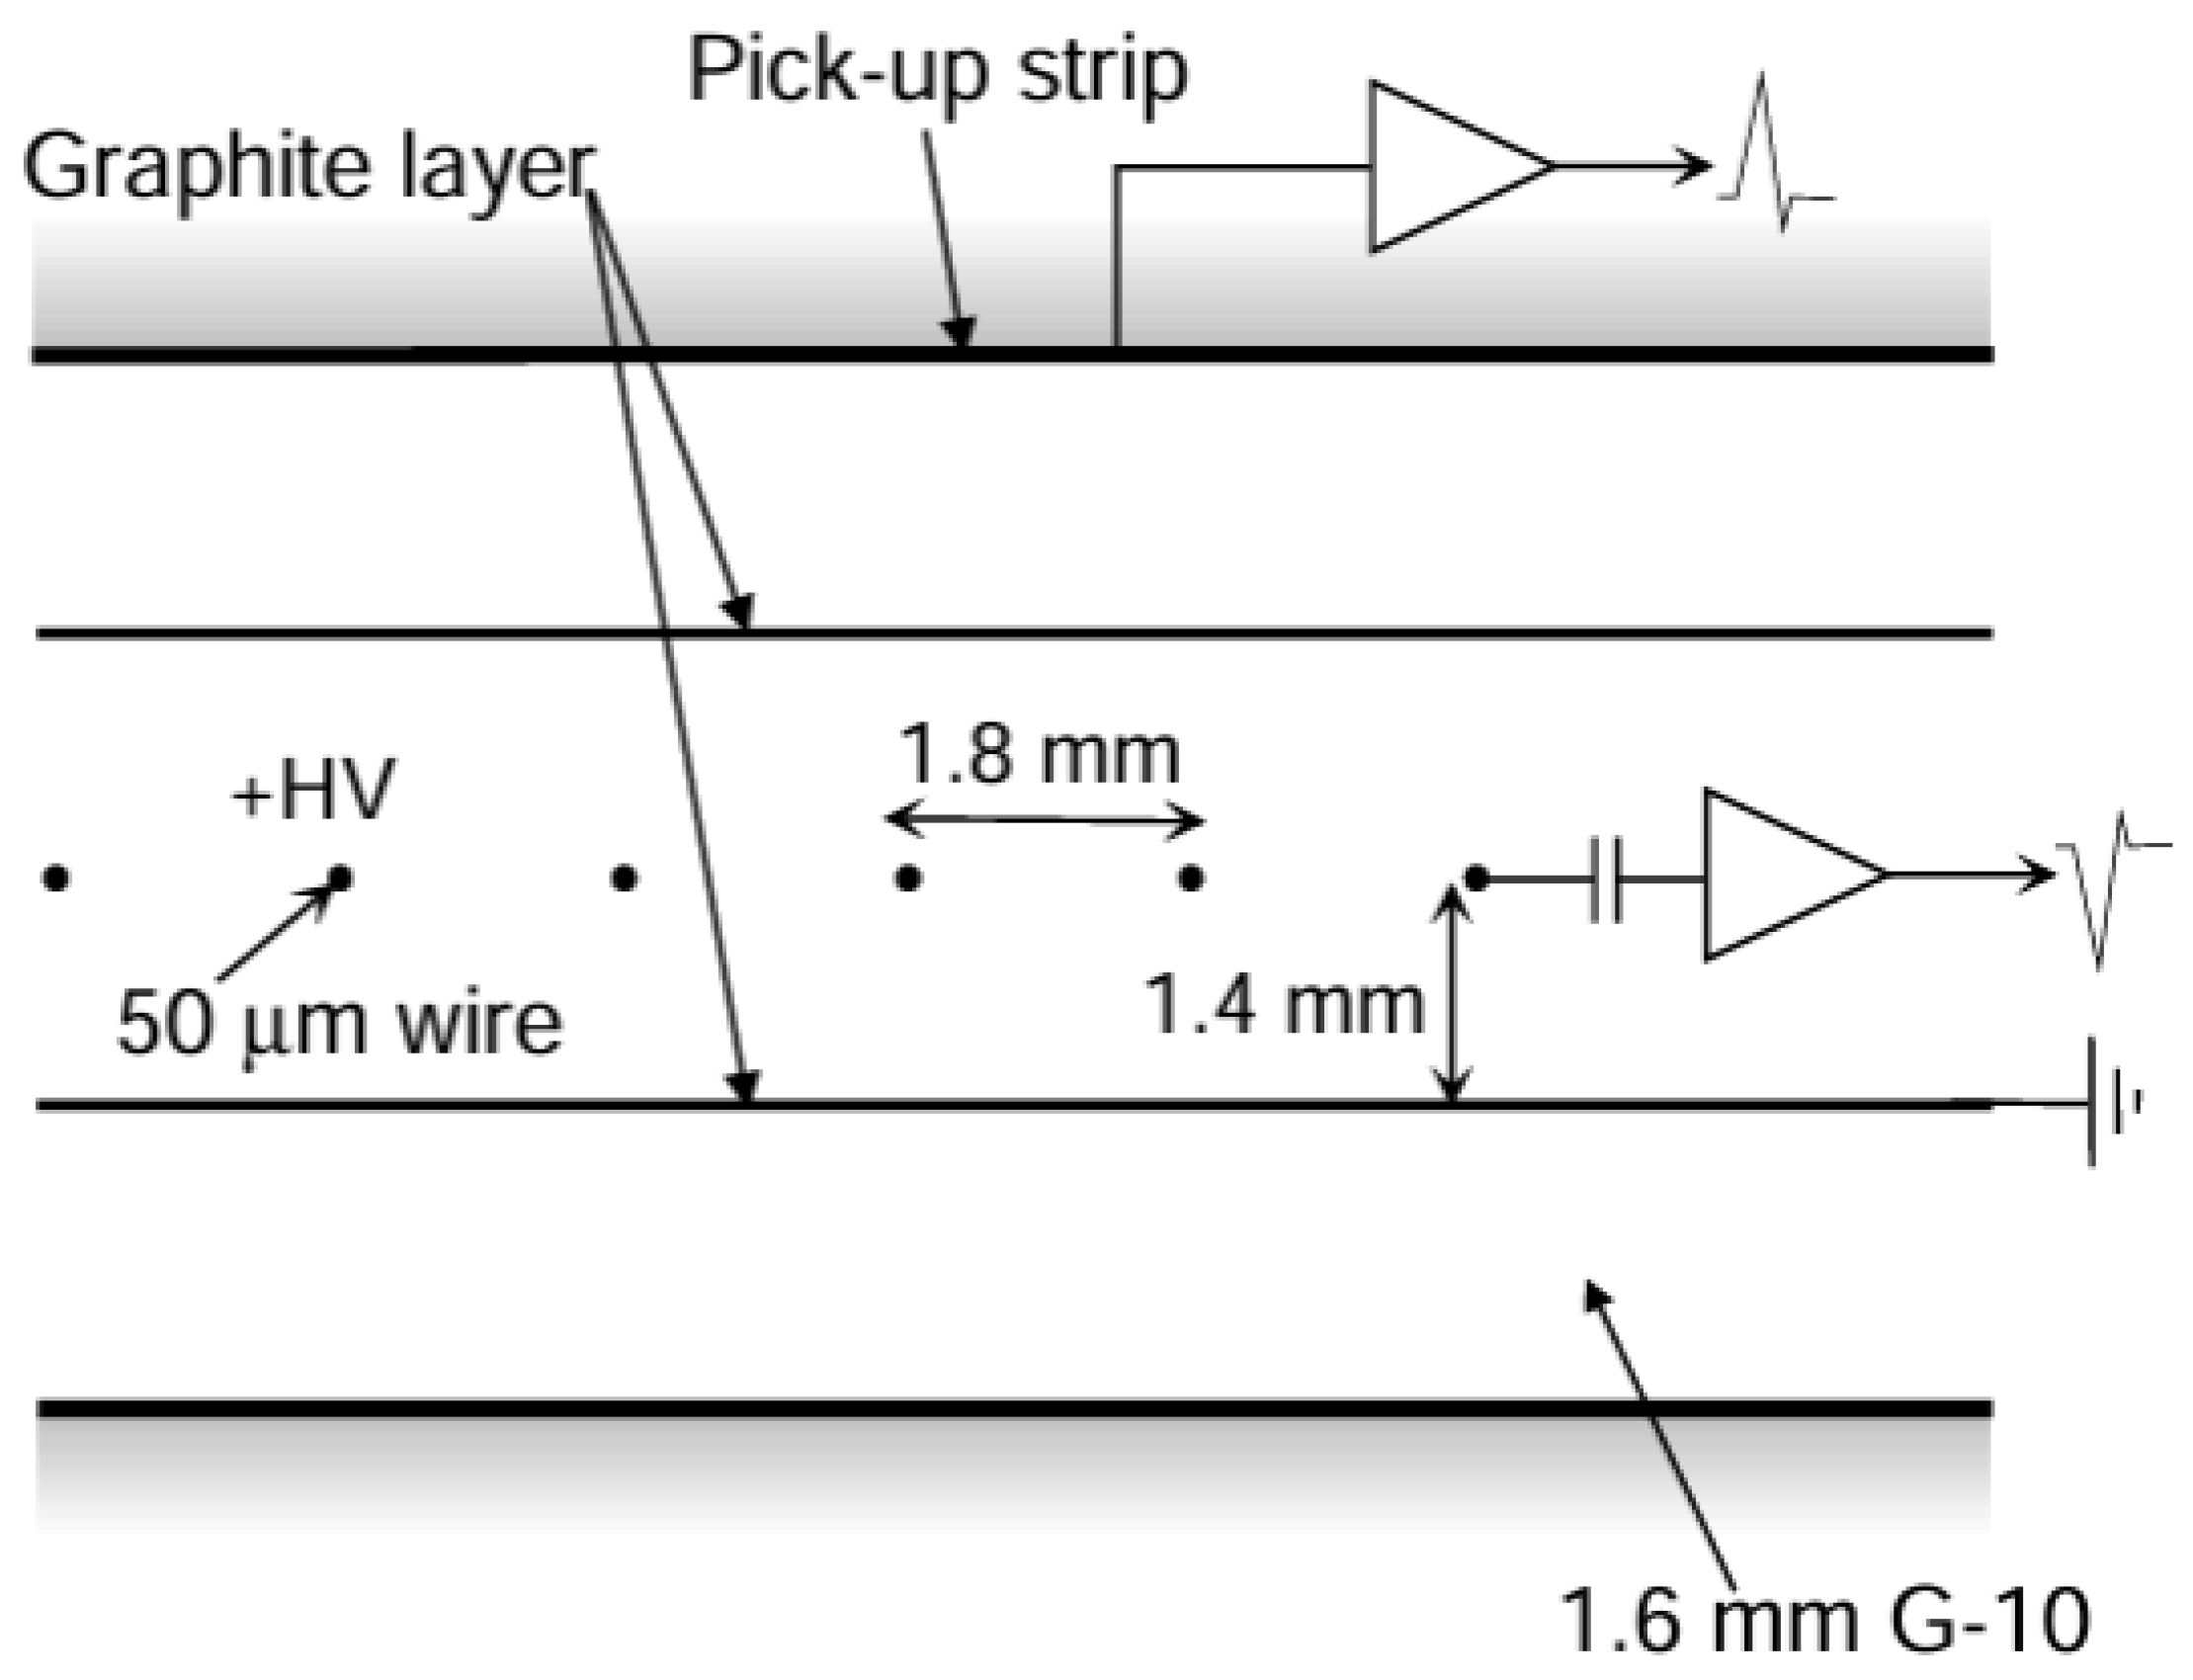
The TGC is a type of multi-wire proportional chamber, equipped with a two-dimensional readout consisting of anode wires ( direction) and pickup strips ( direction). The wire-to-strip distance is 1.4 mm, which is smaller than the wire-to-wire distance of 1.8 mm (Figure 5). The used gas is a mixture of and n-. The TGCs are operated in the limited proportionality region. A high time resolution and excellent detection efficiency are achieved, owing to their narrow wire spacing and the strong quenching of ultraviolet photons produced during gas amplification. The graphite layer coated on the G-10 layers serves as the electrode. It suppresses the photoelectric effect from UV photons produced in electron avalanches, reduces the voltage drop during discharges, and absorbs positive ions.
Figure 5.
TGC structure showing anode wires, graphite cathodes, G-10 layers, and a read-out strip orthogonal to the wires [4].
The seven detector layers are arranged with one triplet and two doublet chambers. The triplet arrangement is needed to cope with false coincidences from background hits, which are more likely in the end-cap region than in the barrel. The TGCs cover the pseudorapidity range of .
2.1.4. New Small Wheel (NSW)
In 2022, the ATLAS Collaboration completed the largest-scale phase-I upgrade of the HL-LHC. The innermost stations of the MS in were replaced by the NSW detectors. The NSW detectors provide track segments for determination of high- muons in the forward region. They are designed to maintain high hit and segment reconstruction efficiency even under the high hit rates expected at the HL-LHC. Furthermore, the suppression of fake muon triggers is one of the important roles of the NSW. Fake muons are charged particles not originating from the IP, increasing the muon trigger rate.
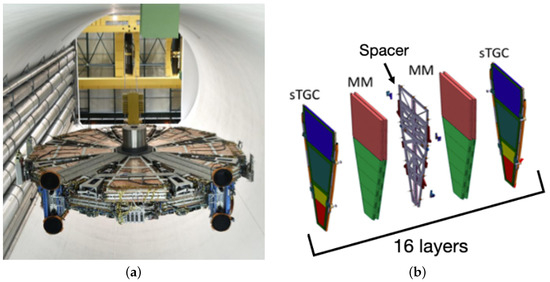
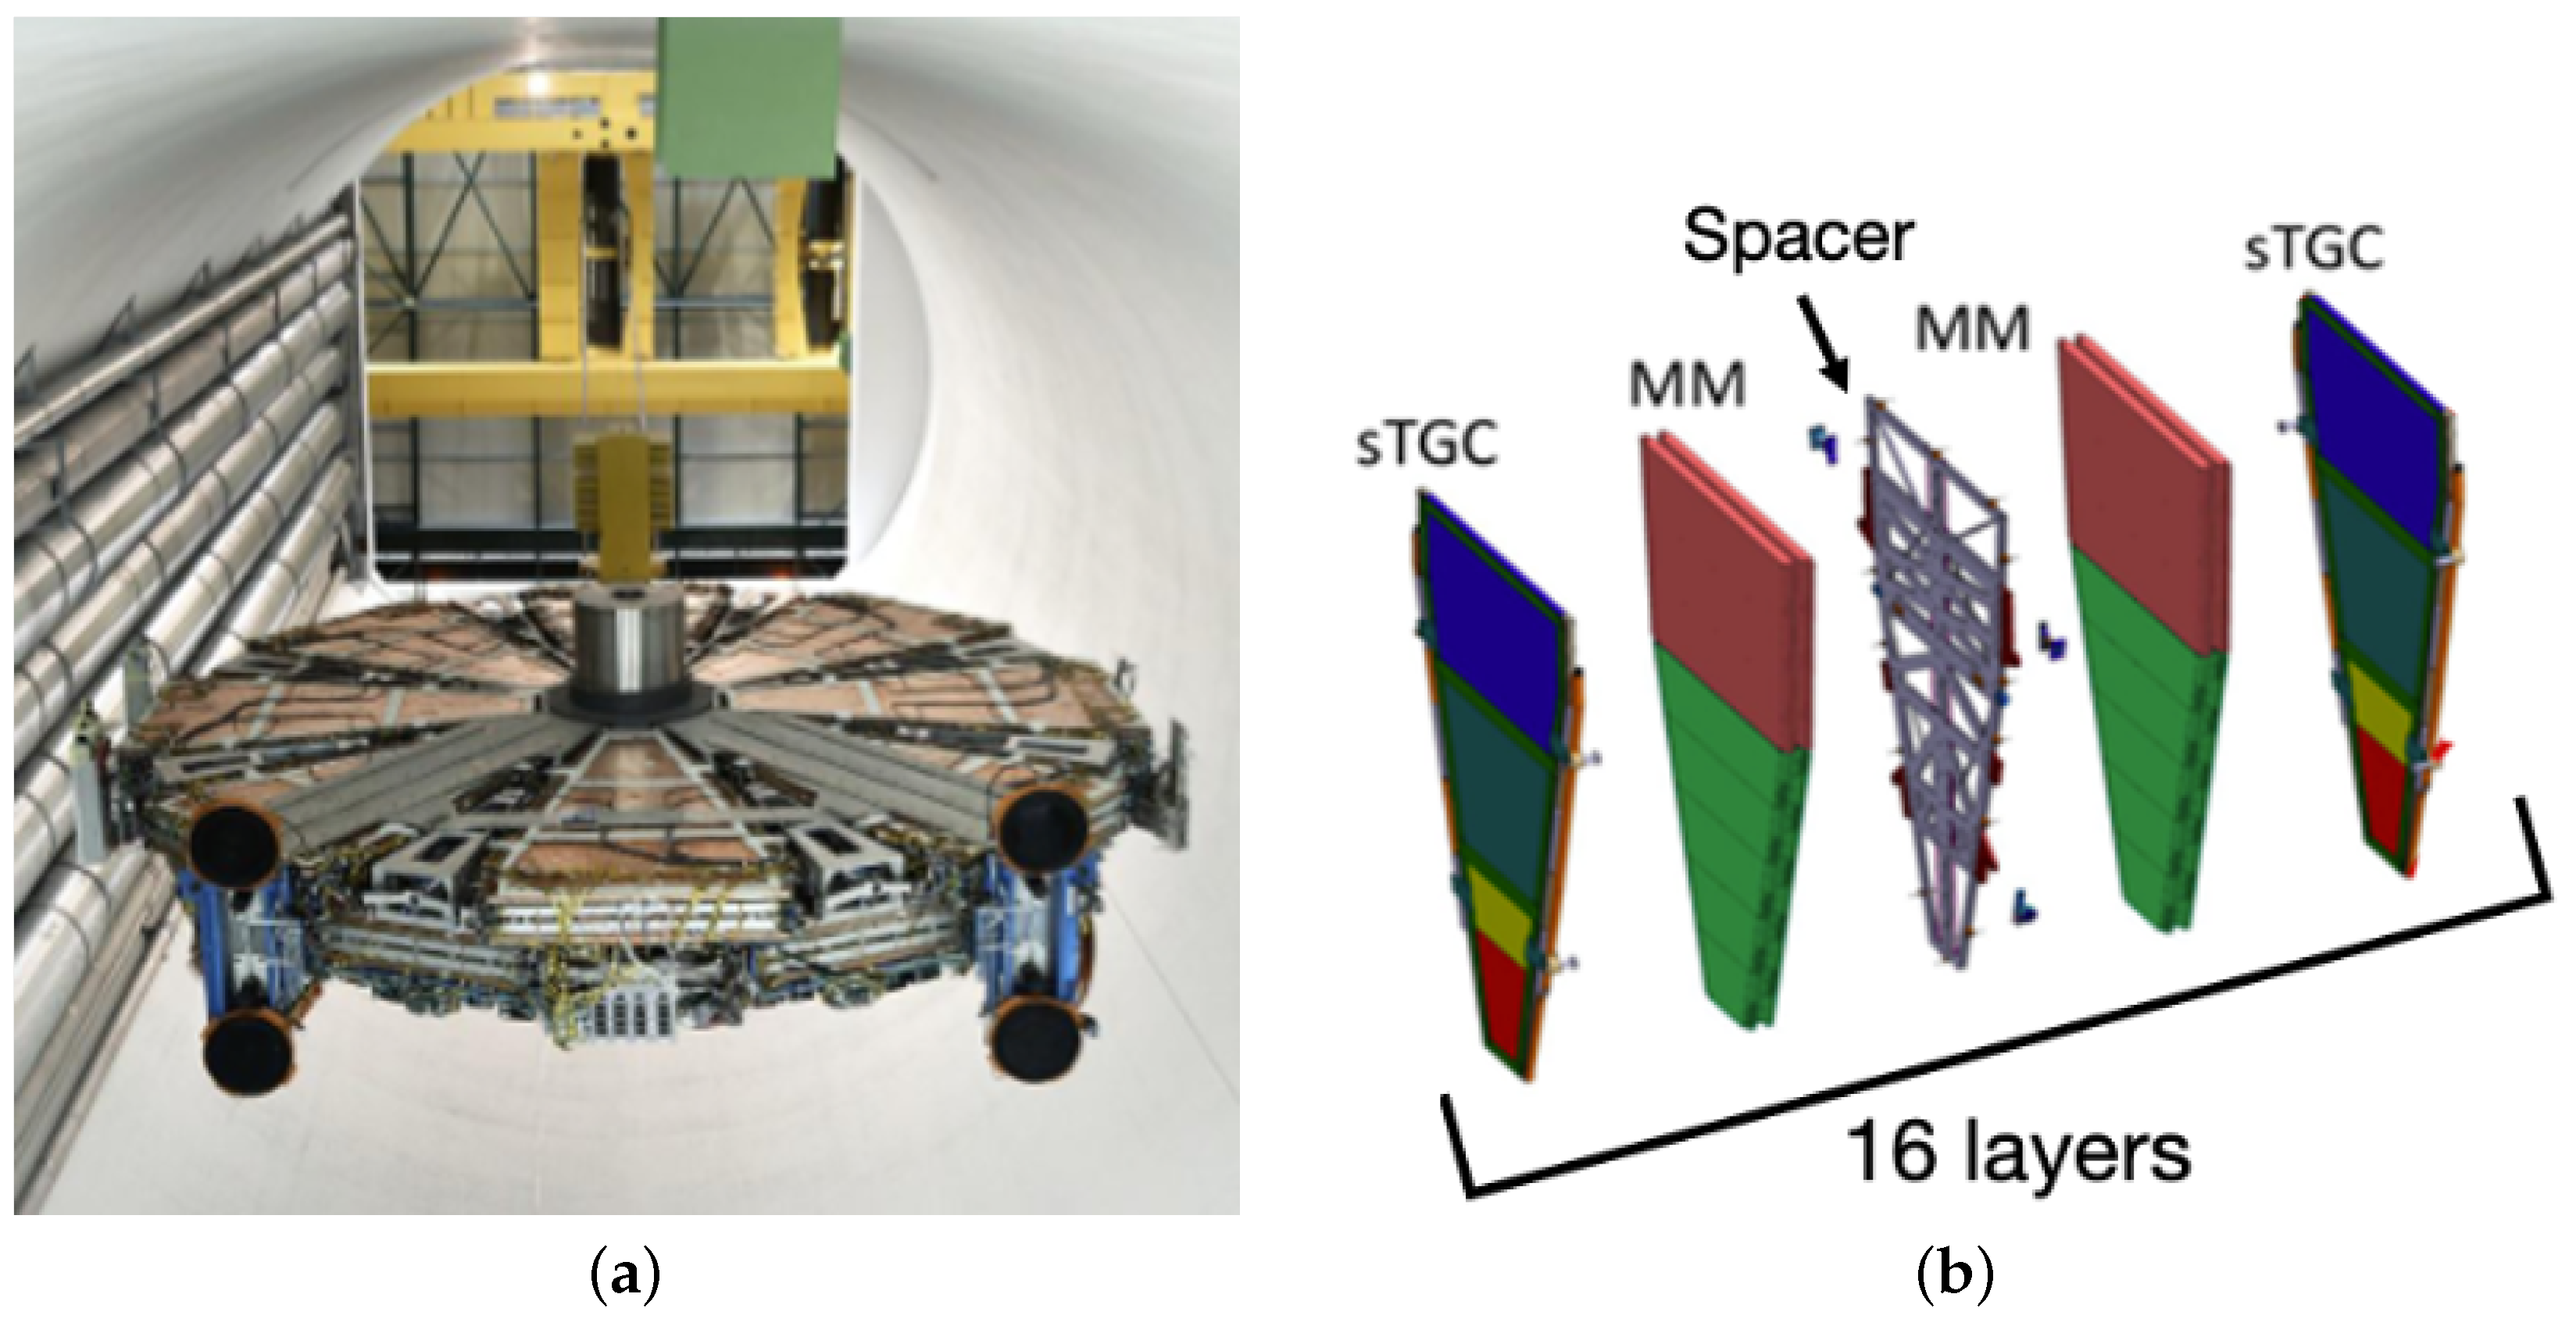
The NSW combines two detector technologies, MM and sTGC, in order to achieve excellent position resolution, efficiency, and timing under the anticipated background conditions. Both sTGC and MM are organized into assemblies consisting of four layers each. The NSW is arranged in the order of sTGC–MM–MM–sTGC, resulting in a total of 16 layers per sector (Figure 6). Both technologies are used for tracking and triggering, finding track segments independently and providing the position () for each segment. Finally, a coincidence in () between the NSW and the TGC is required to suppress the fake triggers.
Figure 6.
The NSW overview and its composition of each sector out of sTGC and MM quadruplet modules. (a) It shows a photo of the NSW detector during its installation. (b) Since each sTGC and MM has a four-layer structure, one NSW sector is composed of 16 layers in total.
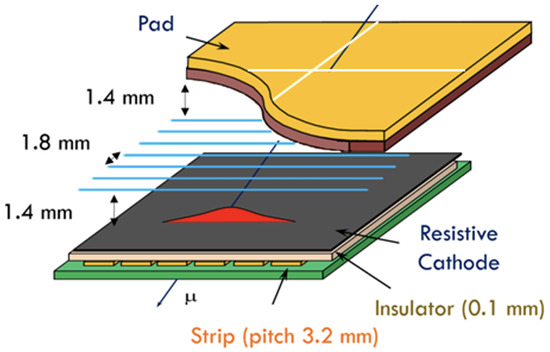
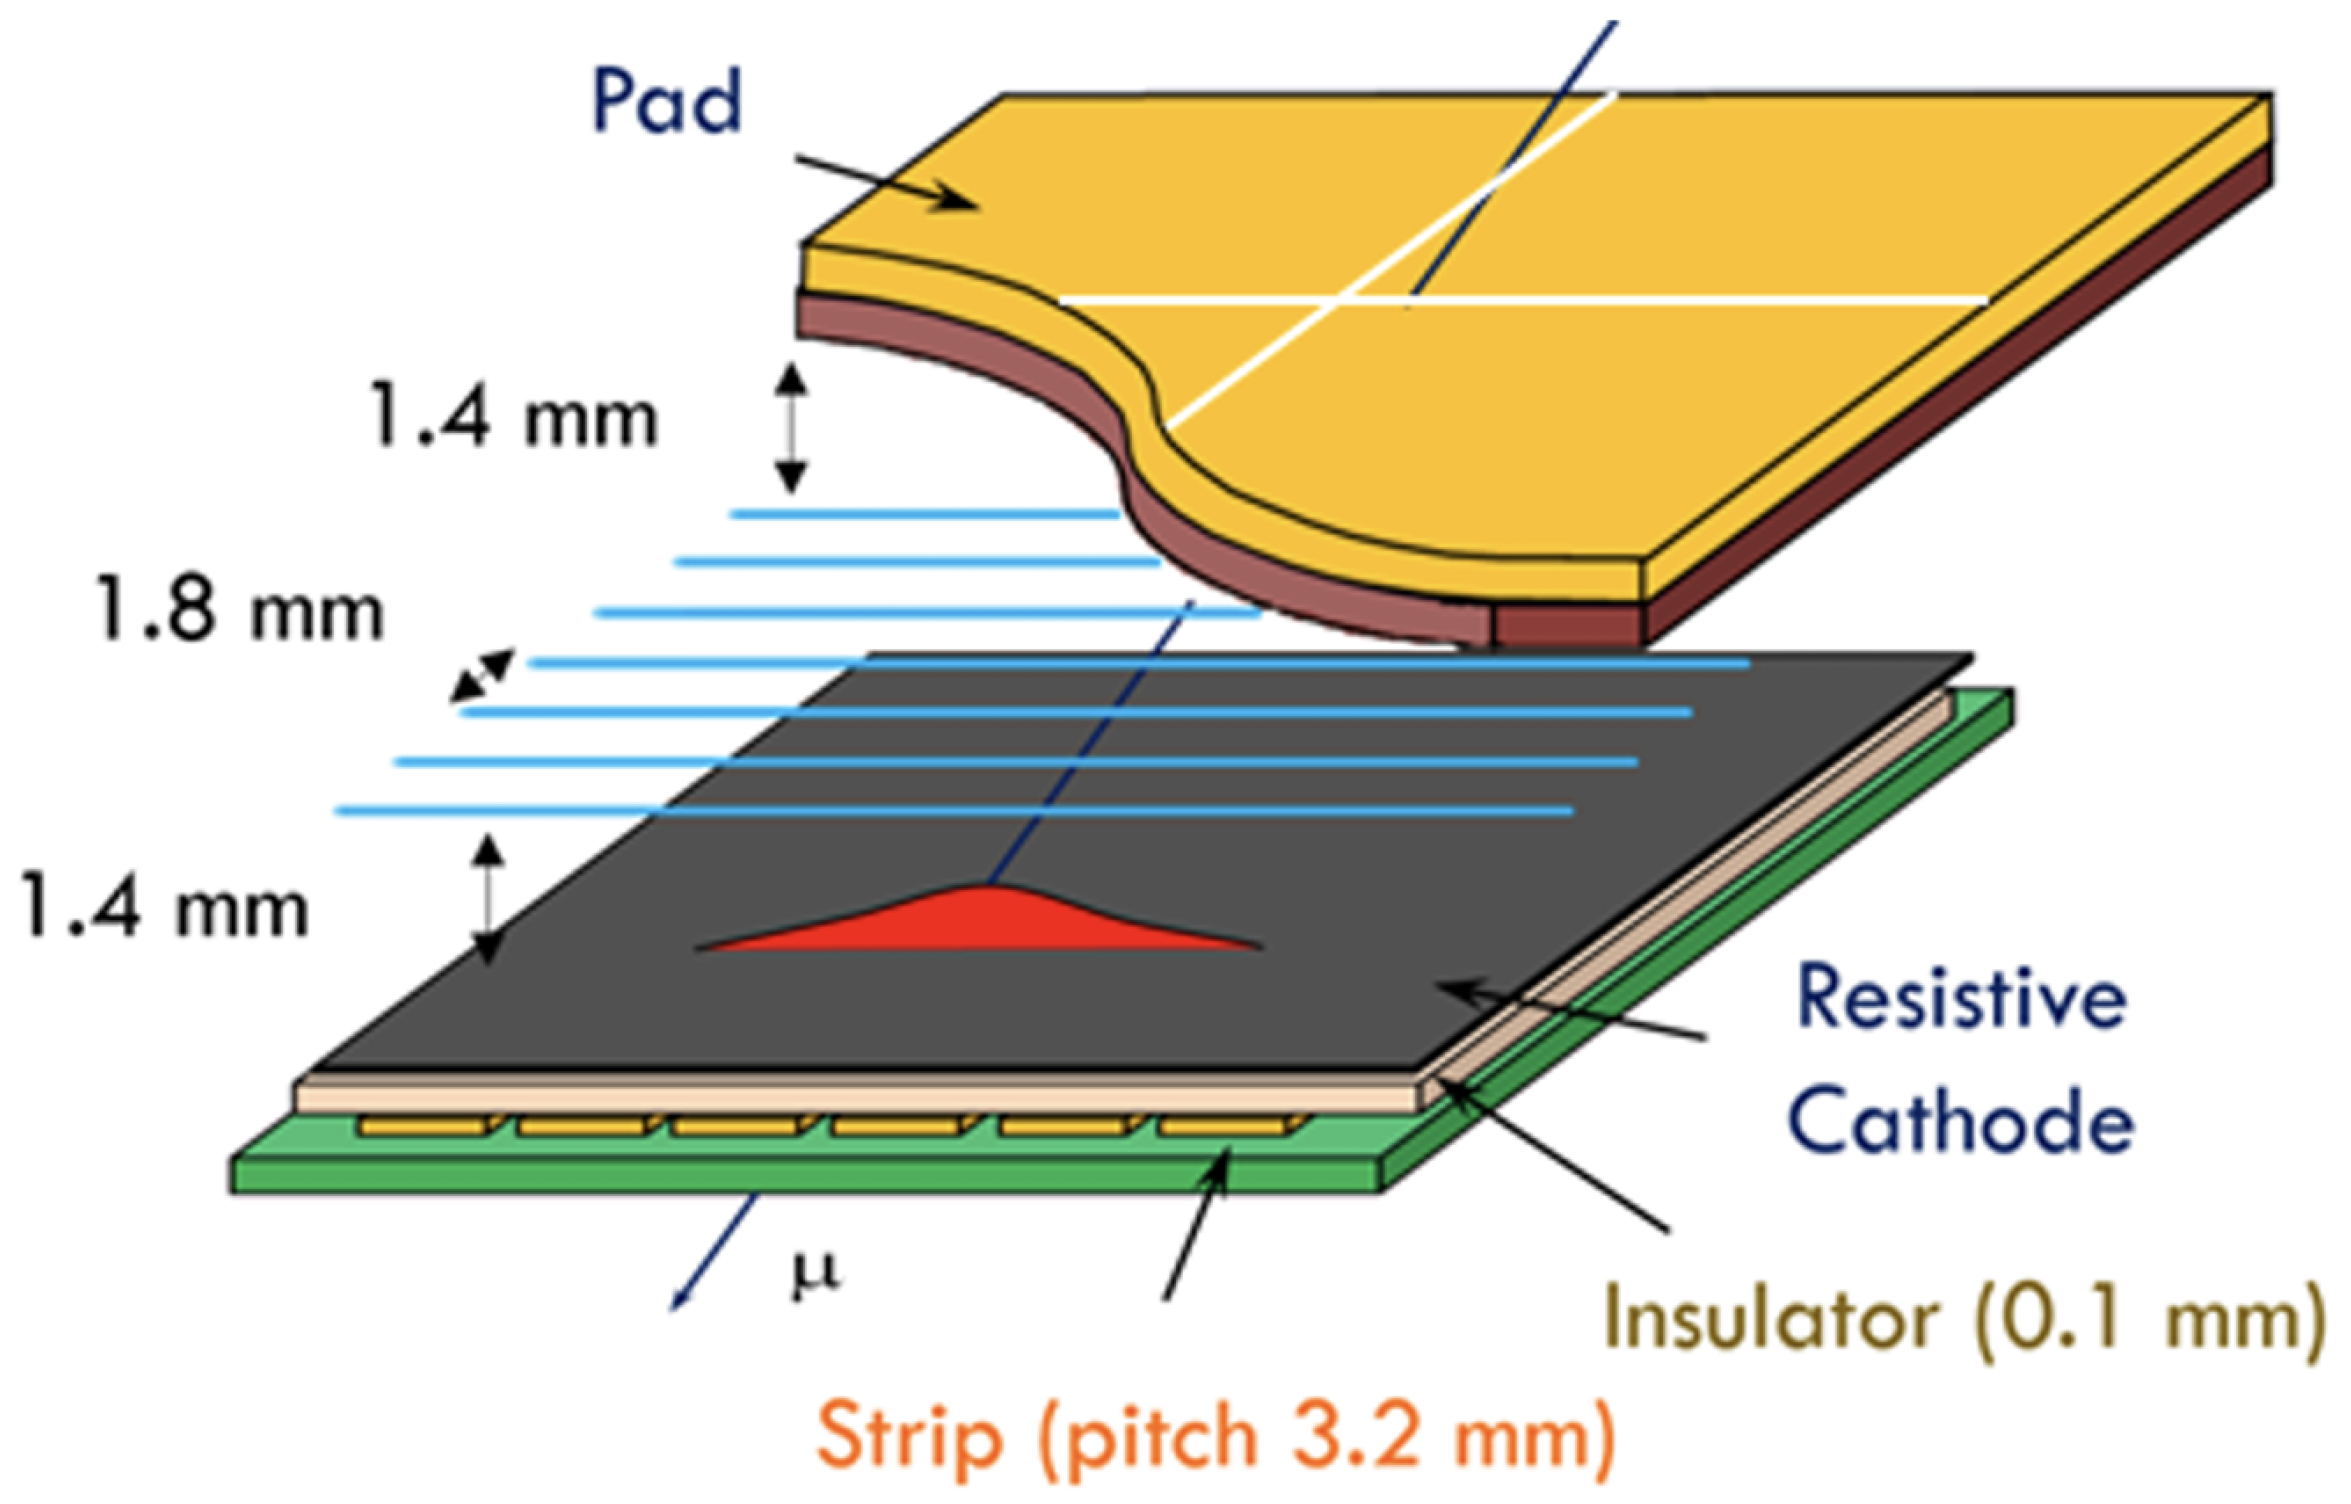
The sTGC structure is shown in Figure 7. It consists of wires with a 1.8 mm pitch sandwiched between two cathode planes at a distance of 1.4 mm. The cathodes are equipped with two types of readout electrodes: fine-pitch strips (3.2 mm) for precise position measurements and large-area pads for fast detection. The wires and strips provide readout in the and directions, respectively. The pad signals are coarse but fast and identify the hit region. Although the sTGC was originally designed to use both pad and strip signals for triggering, only pad signals are used in Run 3 due to limited latency. The strips, however, still provide precise coordinate measurements for tracking and are foreseen to be used in future trigger upgrades.
Figure 7.
A schematic drawing of the sTGC detector. The anode wires and two types of cathodes, fine-pitch strip and pad, are shown [5].
The average spatial resolution of the strips is 210 m, evaluated from the residuals between the cluster position produced by muons with > 15 GeV and the extrapolated track. Compared to 2023, it has improved by 10% thanks to the better detector alignment, and further improvement is expected with advanced position reconstruction methods using cluster shapes.
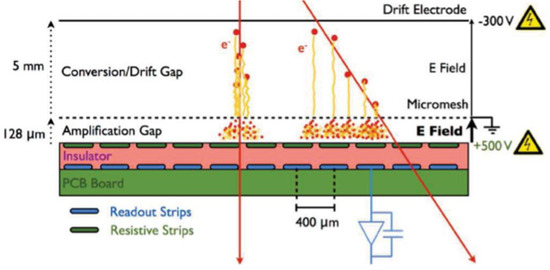
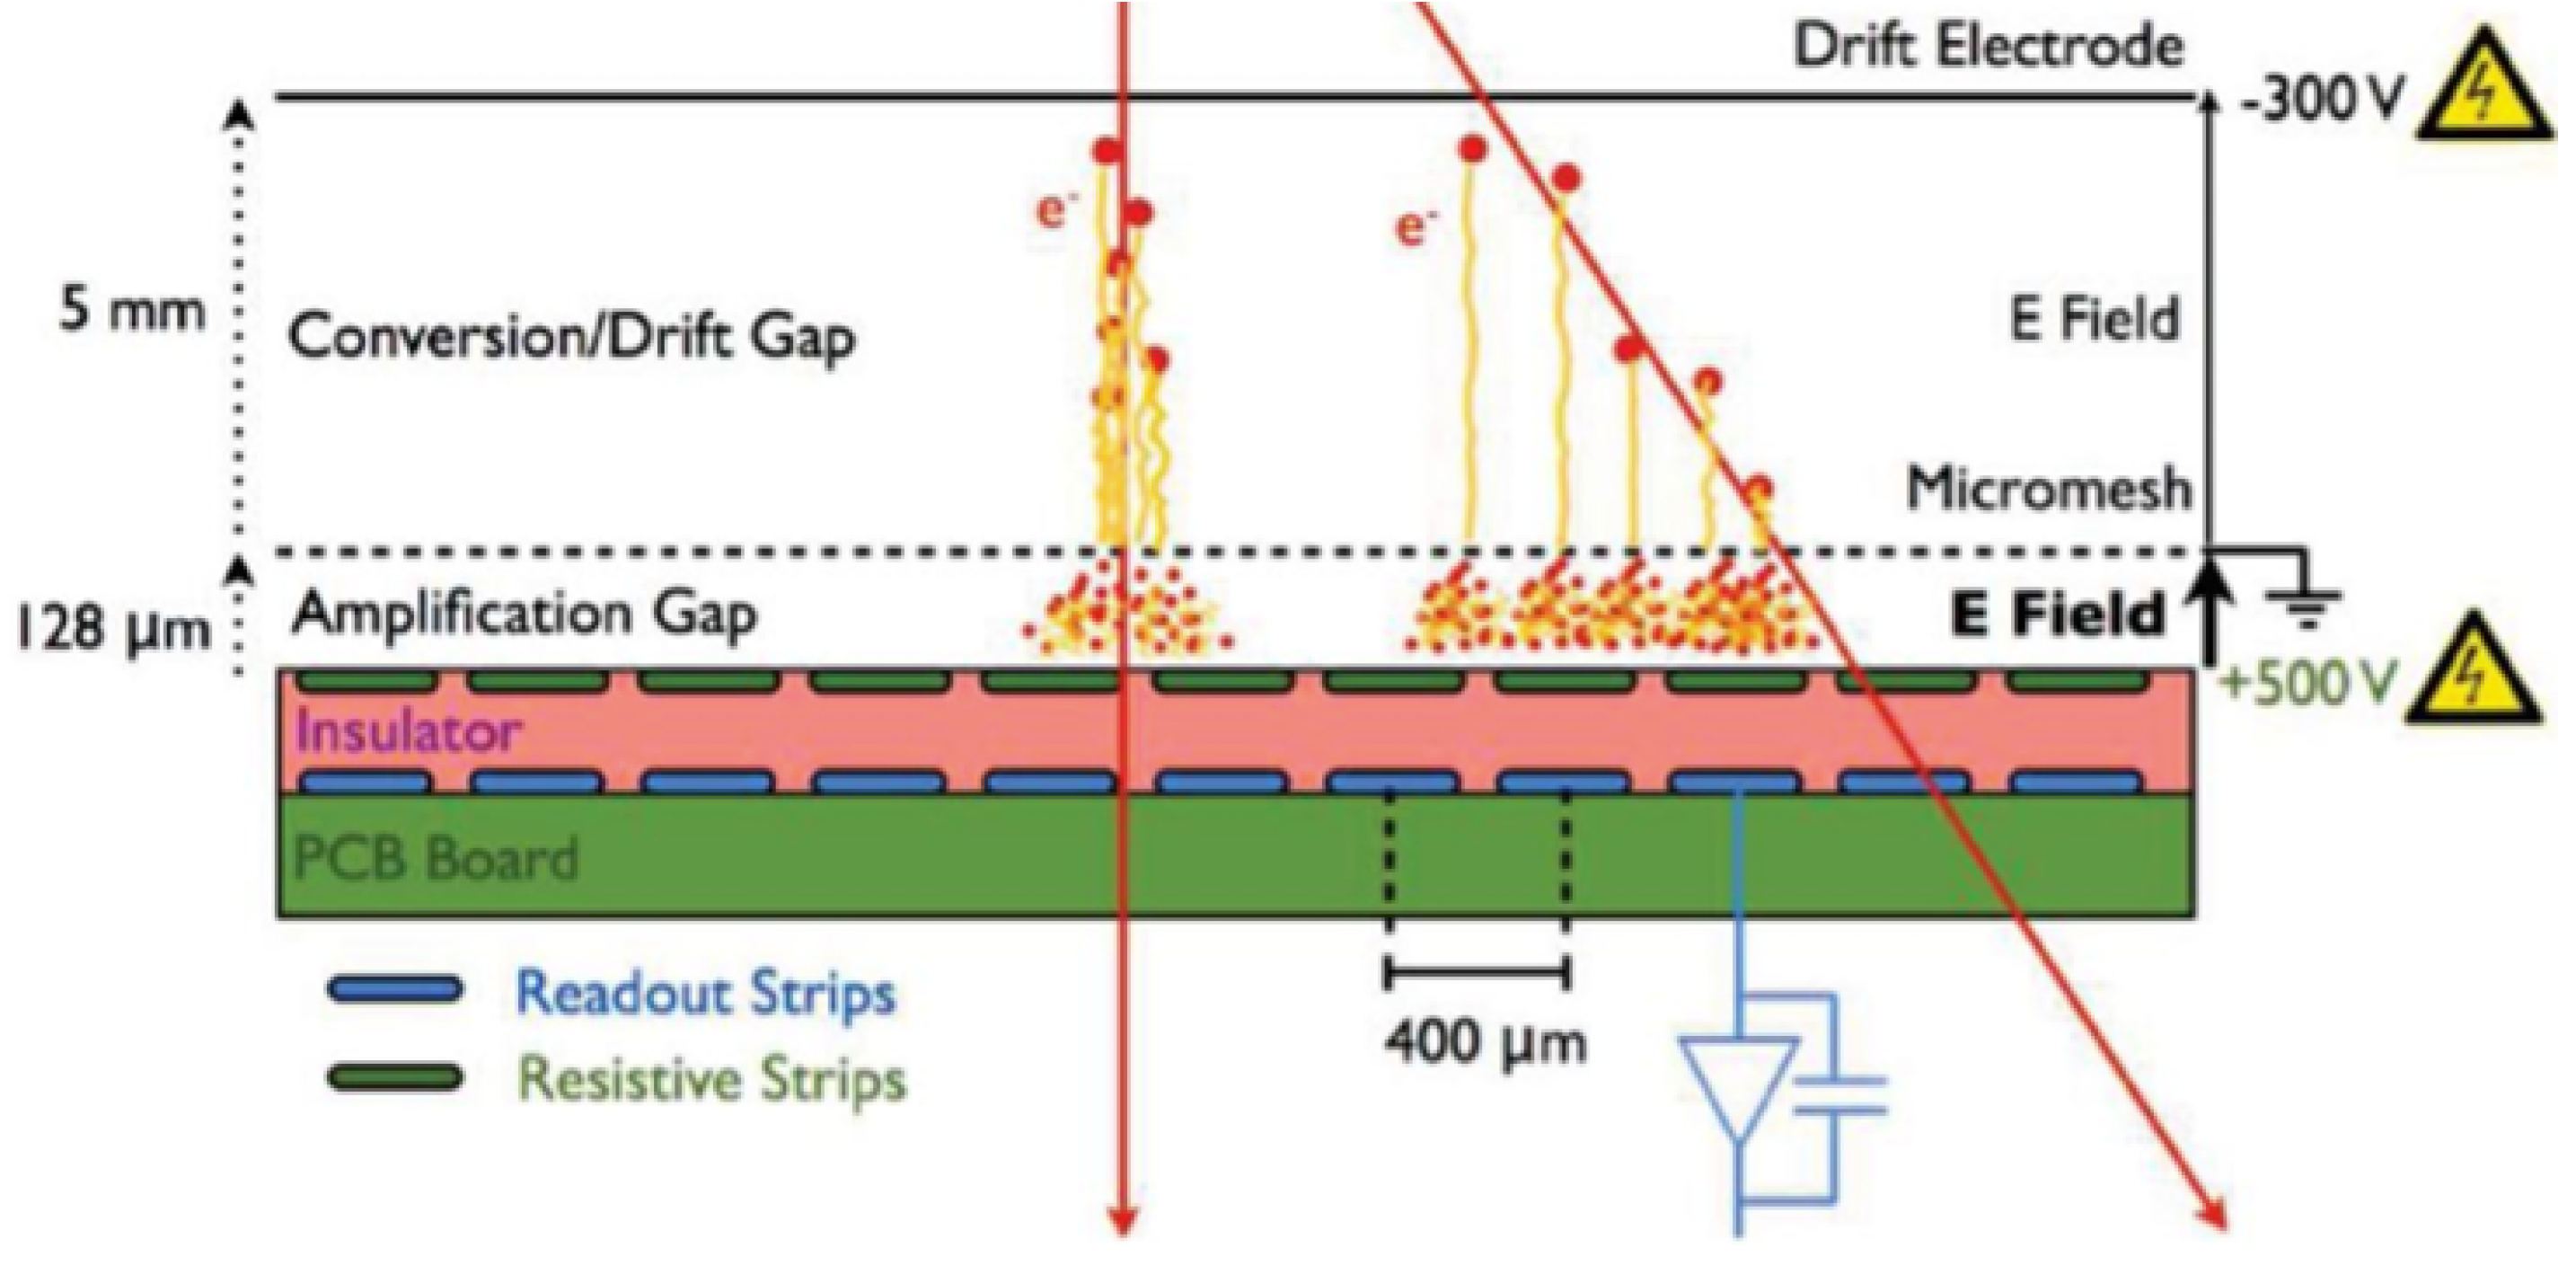
The MM is a gaseous detector with a fine micromesh structure, designed for a spatial resolution of about 100 m. It uses a gas mixture of argon (93%), , and Isobutane (2%). Its structure is shown in Figure 8. Chambers feature a 5 mm drift gap at −300 V and a 120 m amplification gap with readout planes at 500 V, with a grounded mesh. Spark protection is provided by resistive strips covering readout strips, achieving a pitch of 400 m. Four layers measure the precision coordinate, while the four stereo layers, tilted by ±1.5∘, provide the second coordinate. When a muon passes through the detector, it induces signals on multiple adjacent strips. These signals are grouped into clusters, and the hit position is reconstructed from the charge-weighted centroid of the cluster. The MM is primarily used for precision tracking, and it also contributes to triggering by identifying the earliest strip above threshold within each group of 64 strips.
Figure 8.
The MM structure shows two types of gaps: a 5 mm drift gap and a 128 m amplification gap. The signals are read out using strips with a 400 m pitch [6].
The current average spatial resolution of the strips measured with 2024 data is 350 m for muons with > 15 GeV. A new reconstruction algorithm is currently being developed, which uses timing and cluster shape information and shows promising improvements in resolution.
3. Detector Operation and Maintenance During Run 3
During Run 3, the ATLAS Muon Spectrometer was operated under challenging conditions with increased pile-up and higher instantaneous luminosity. Despite these conditions, the detector subsystems demonstrated stable performance.
While the RPC detector has generally exhibited stable operation, it has been affected by gas leakage issues, which have impacted both detector performance and the environment. As Figure 9 shows, throughout various periods, the system has been losing gas at a rate of 500 to 1400 L/h, depending on the period of operation. From a performance standpoint, the leaks can lead to air intake into the chambers, which can render the detector inoperable and therefore reduce trigger efficiency. Environmentally, the standard gas mixture used in the RPC system is expensive and has a high GWP impact, which makes the leakage problem more critical. To mitigate gas leakage, more than 1100 non-return valves and flowmeters were installed on the exhaust lines to improve the piping structure, and local crack repairs using epoxy adhesive were implemented. As a result, the gas consumption has stabilized since the start of operation in 2023.
To reduce the GWP impact, the gas mixtures for the RPC system were gradually upgraded, as shown in Table 2. To ensure stable operation, the effective operating voltage was adjusted based on temperature and pressure, achieving a detection efficiency of more than 97% for all mixtures (Figure 10). As for the TGC, more than 99% of TGC channels remained operational, and the trigger efficiency of TGC with a 14 GeV threshold is approximately 86.3% when it is operated on its own (Figure 11).
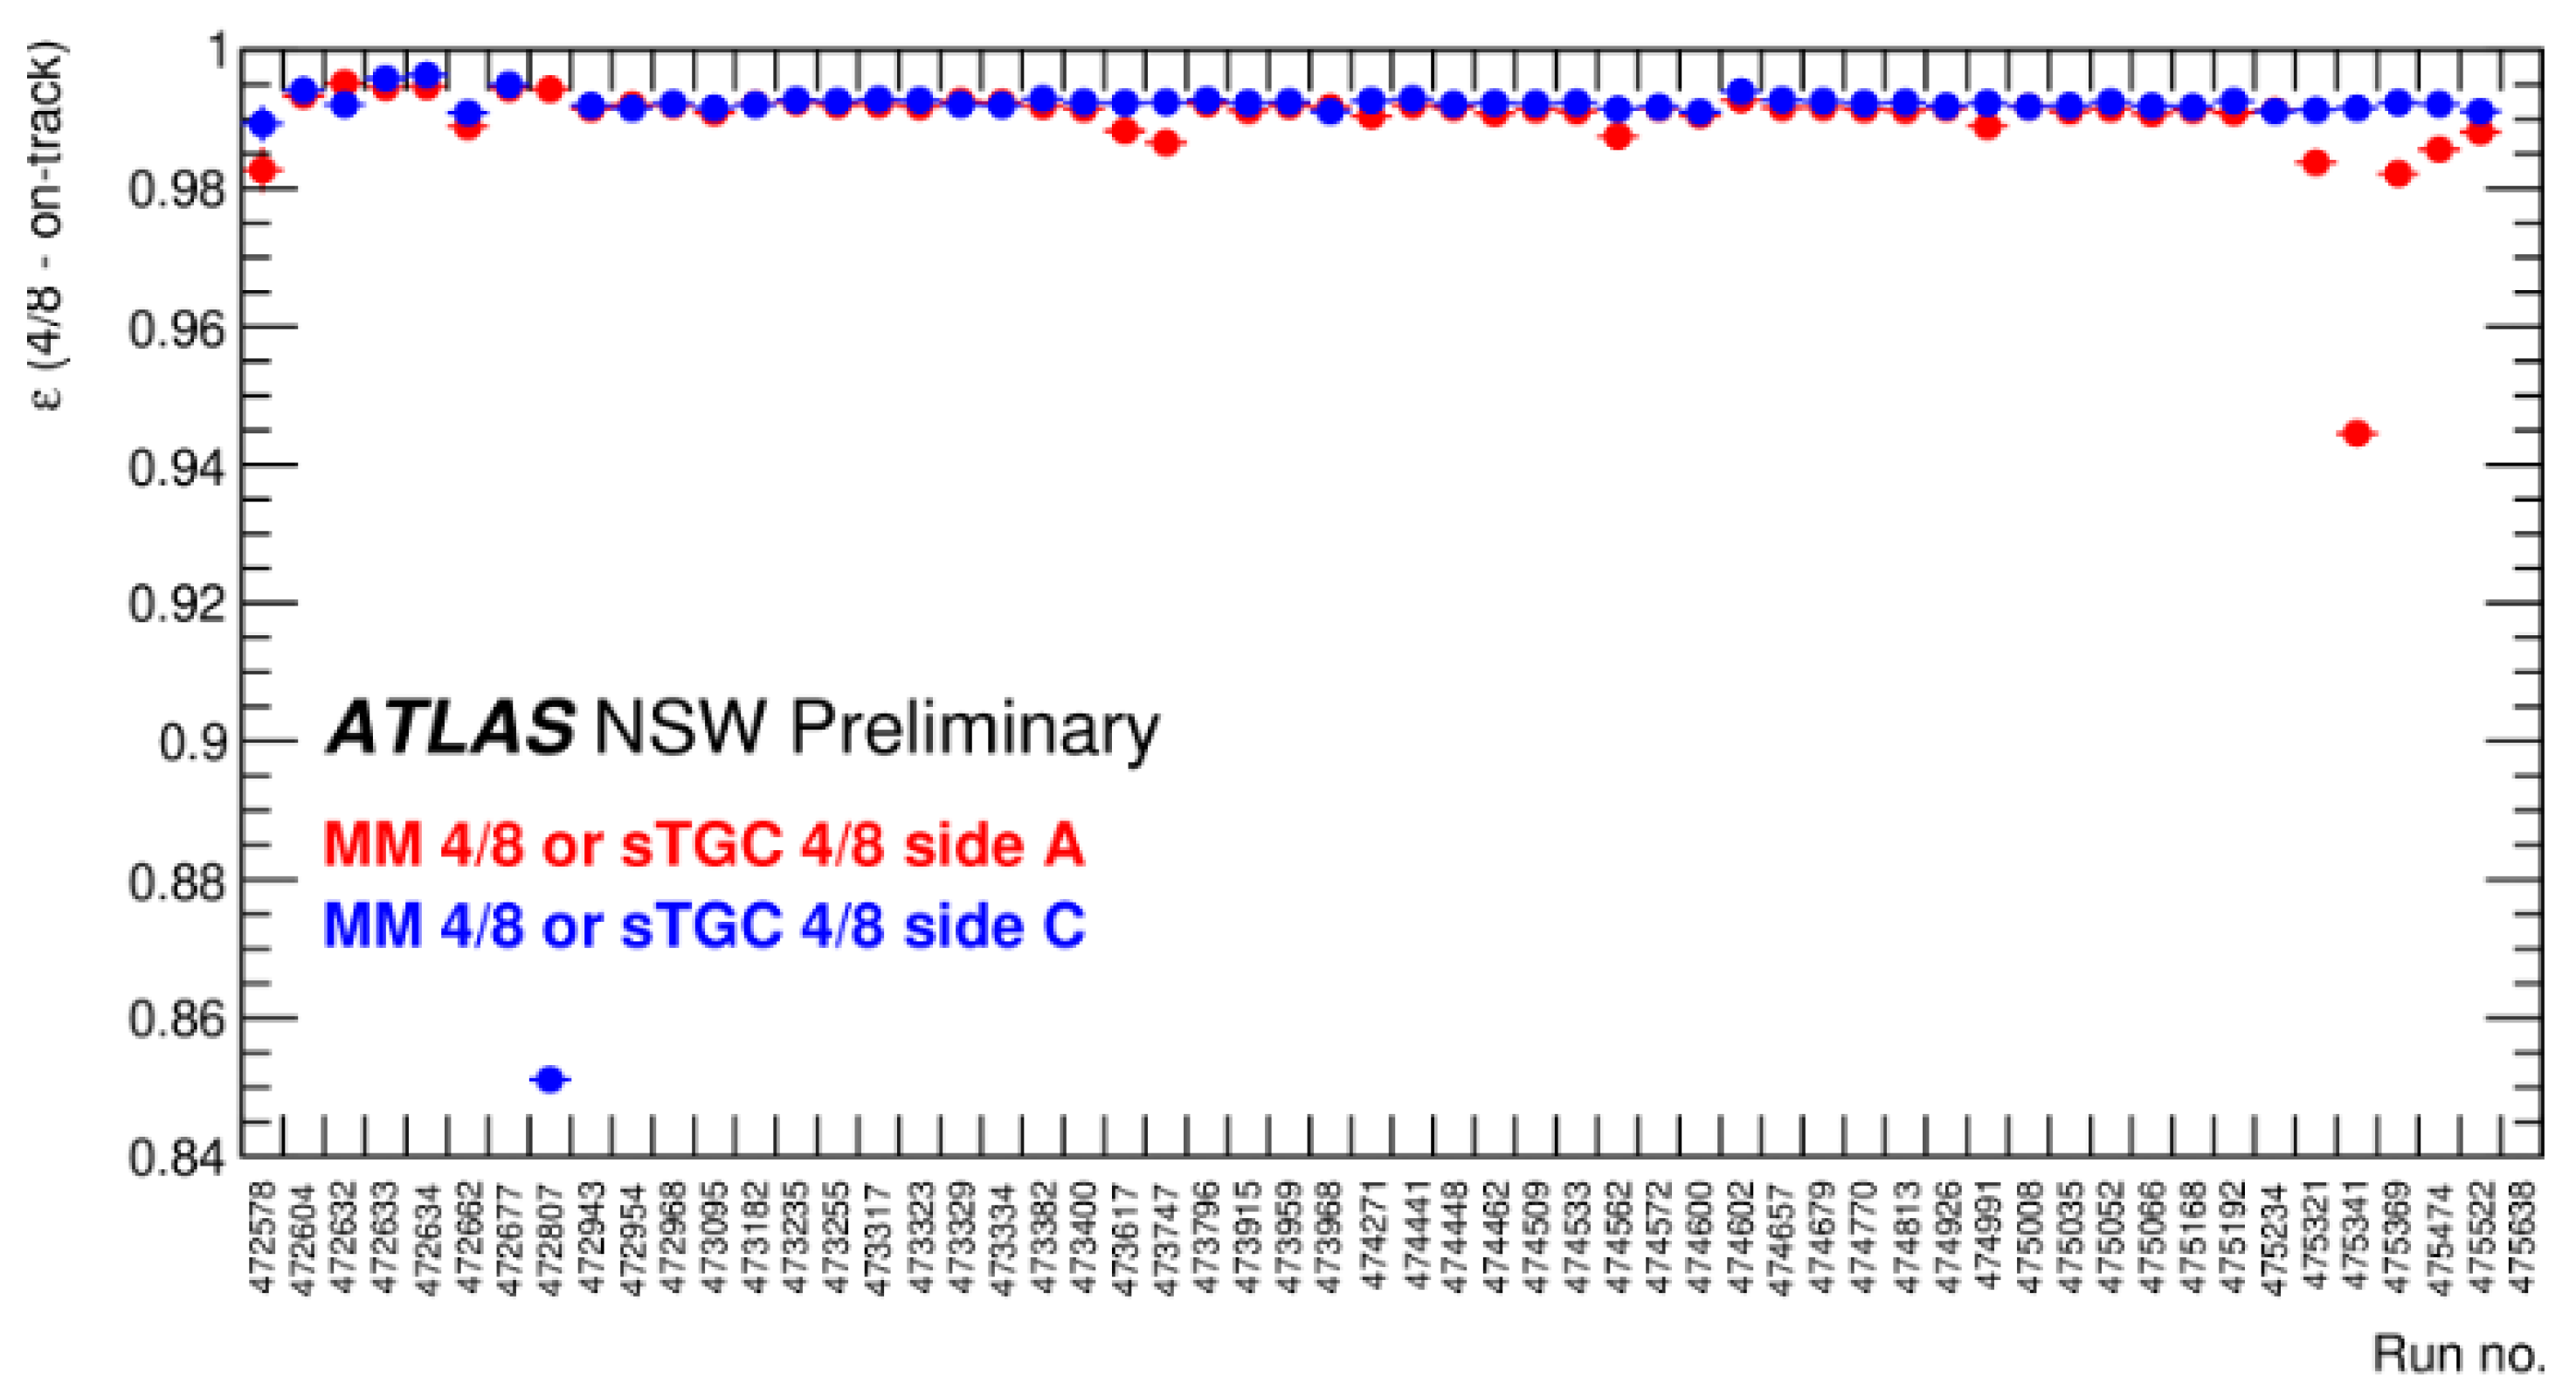
The NSW installation was completed in 2022. It has since been integrated into the trigger system in stages, beginning with validated components combined with the TGC detectors. Figure 12 shows the tracking efficiency in the end-cap region. The tracking efficiency is defined as the fraction of muon tracks that produce at least four hits out of eight strip layers in either the MM or sTGC detectors. Combined (ID + MS) tracks are used for < 2.5, while standalone MS tracks are used for > 2.5, where ID coverage ends.
The efficiency is evaluated as the logical OR between the MM and sTGC detectors. Since the NSW is located in the inner region of the MS, where access is difficult, its design has to incorporate redundancy. As a result, when at least four layers are active in either detector technology, a track segment can be independently formed within the NSW and subsequently combined with the segments reconstructed in the two outer end-cap stations of the MS.
Table 2.
RPC gas mixtures used during Run 3 [7].
Figure 9.
This plot shows the variation in fresh gas consumption ranging from 500 to 1400 L/h. The unshaded areas indicate periods when the gas system was stopped and restarted, except during the Long Shutdown periods. Since 2023, a stabilization of the gas consumption has been observed thanks to the repair campaigns [8].
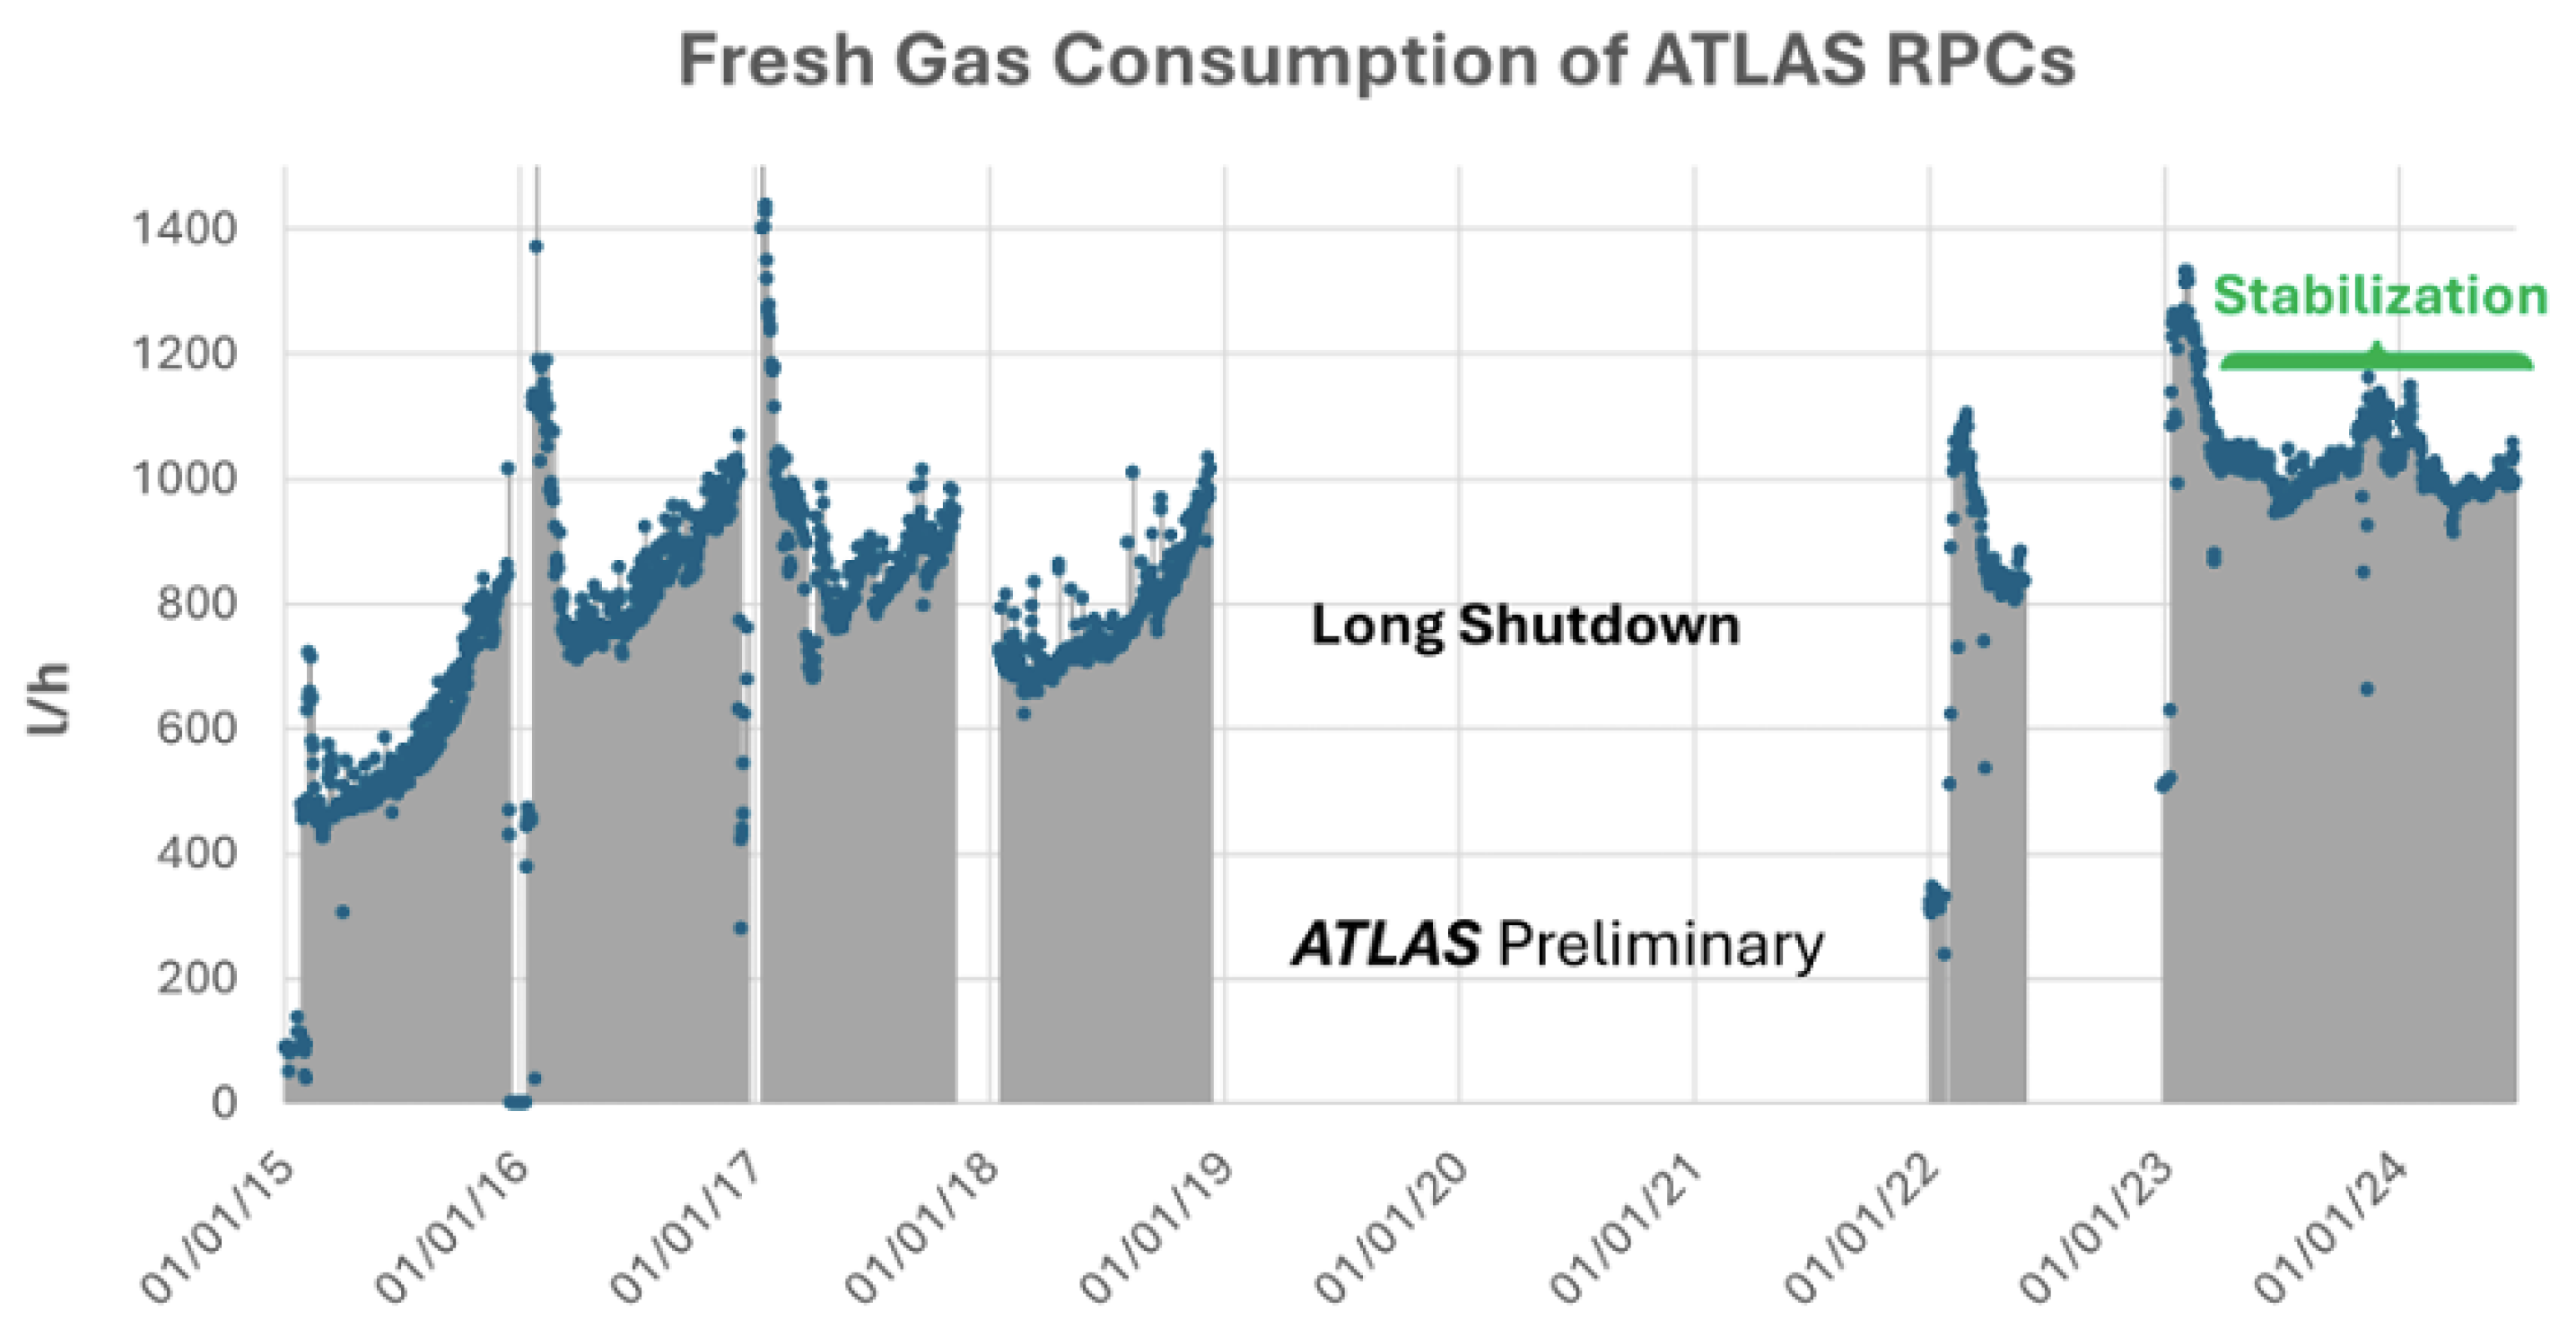
Figure 10.
RPC efficiency as a function of the applied voltage for each gas mixture. The evaluation is performed under a photon background equivalent to that of the most irradiated RPC in the LHC (luminosity ). Due to the combination of and concentrations, the plateau is shifted by approximately 200 V for all mixtures. A detection efficiency of 97% is achieved in all cases [7].
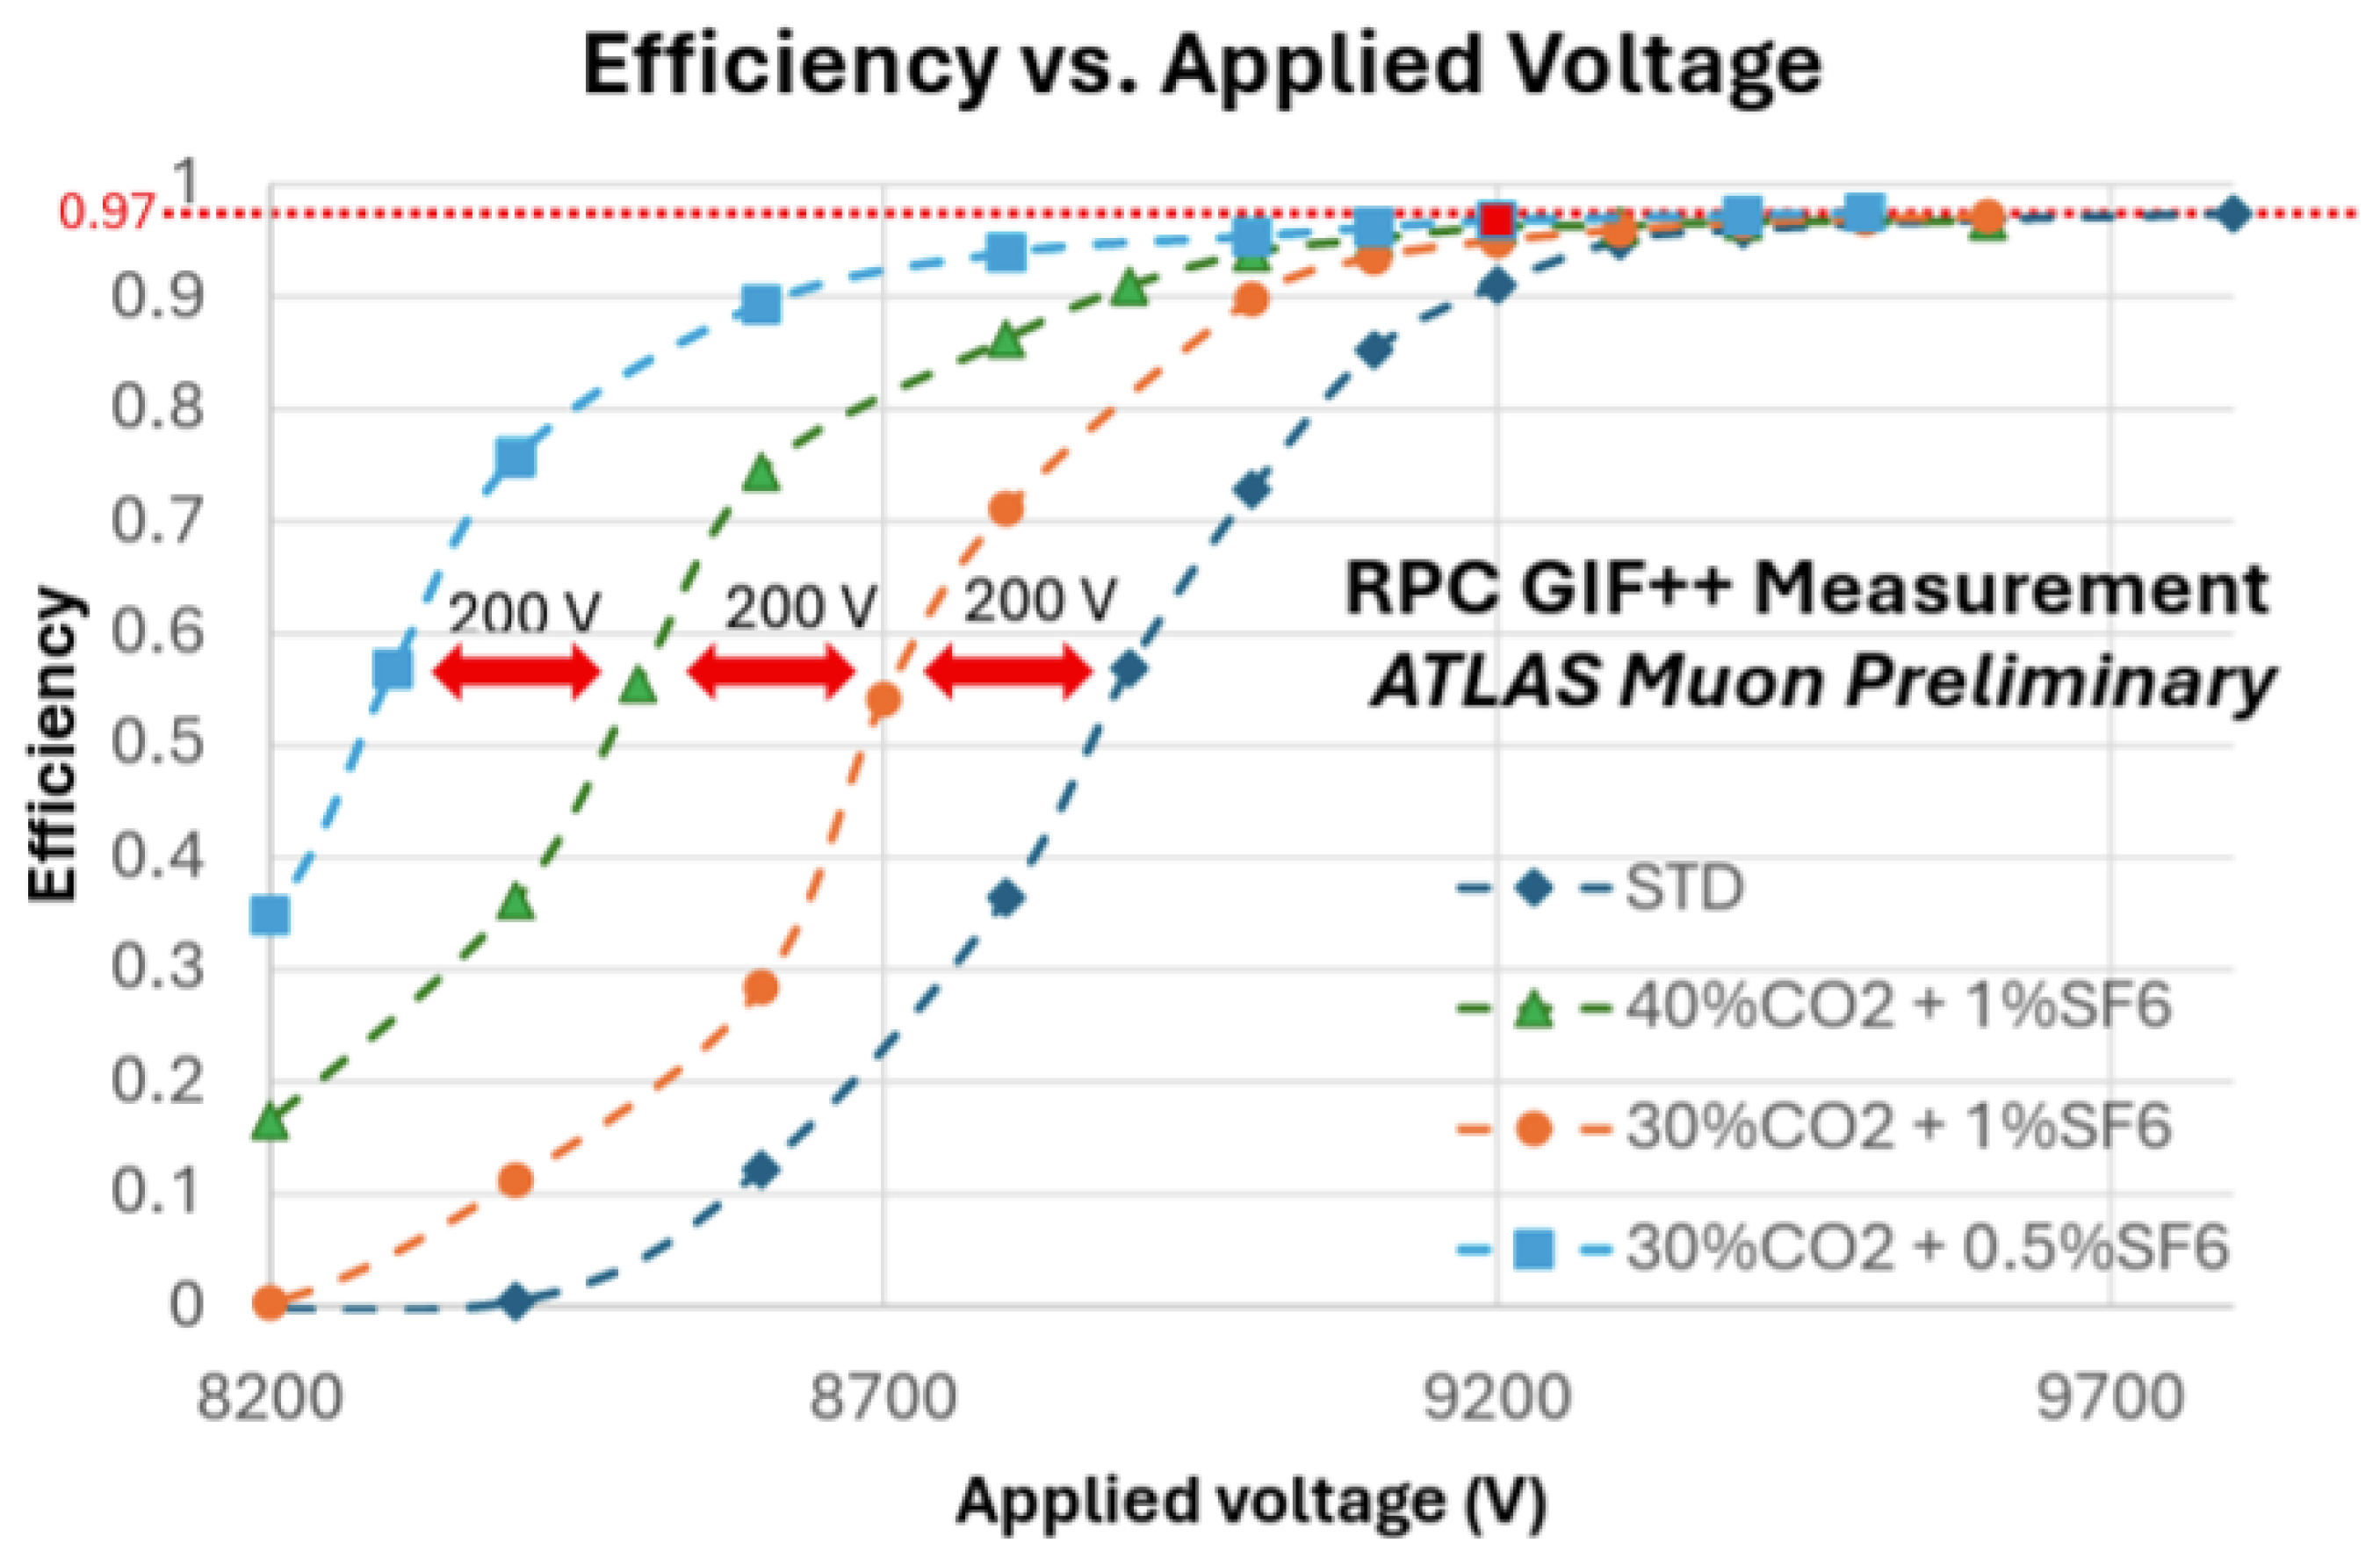
Figure 11.
Level-1 muon end-cap trigger efficiency as a function of offline muon evaluated using the L1_MU14FCH, a Level-1 single-muon trigger with a 14 GeV threshold. The trigger efficiency with the TGC-only configuration is high and stable at an average of 86.3%, and it remains higher than 80% even when Tile and NSW coincidences are included [9].
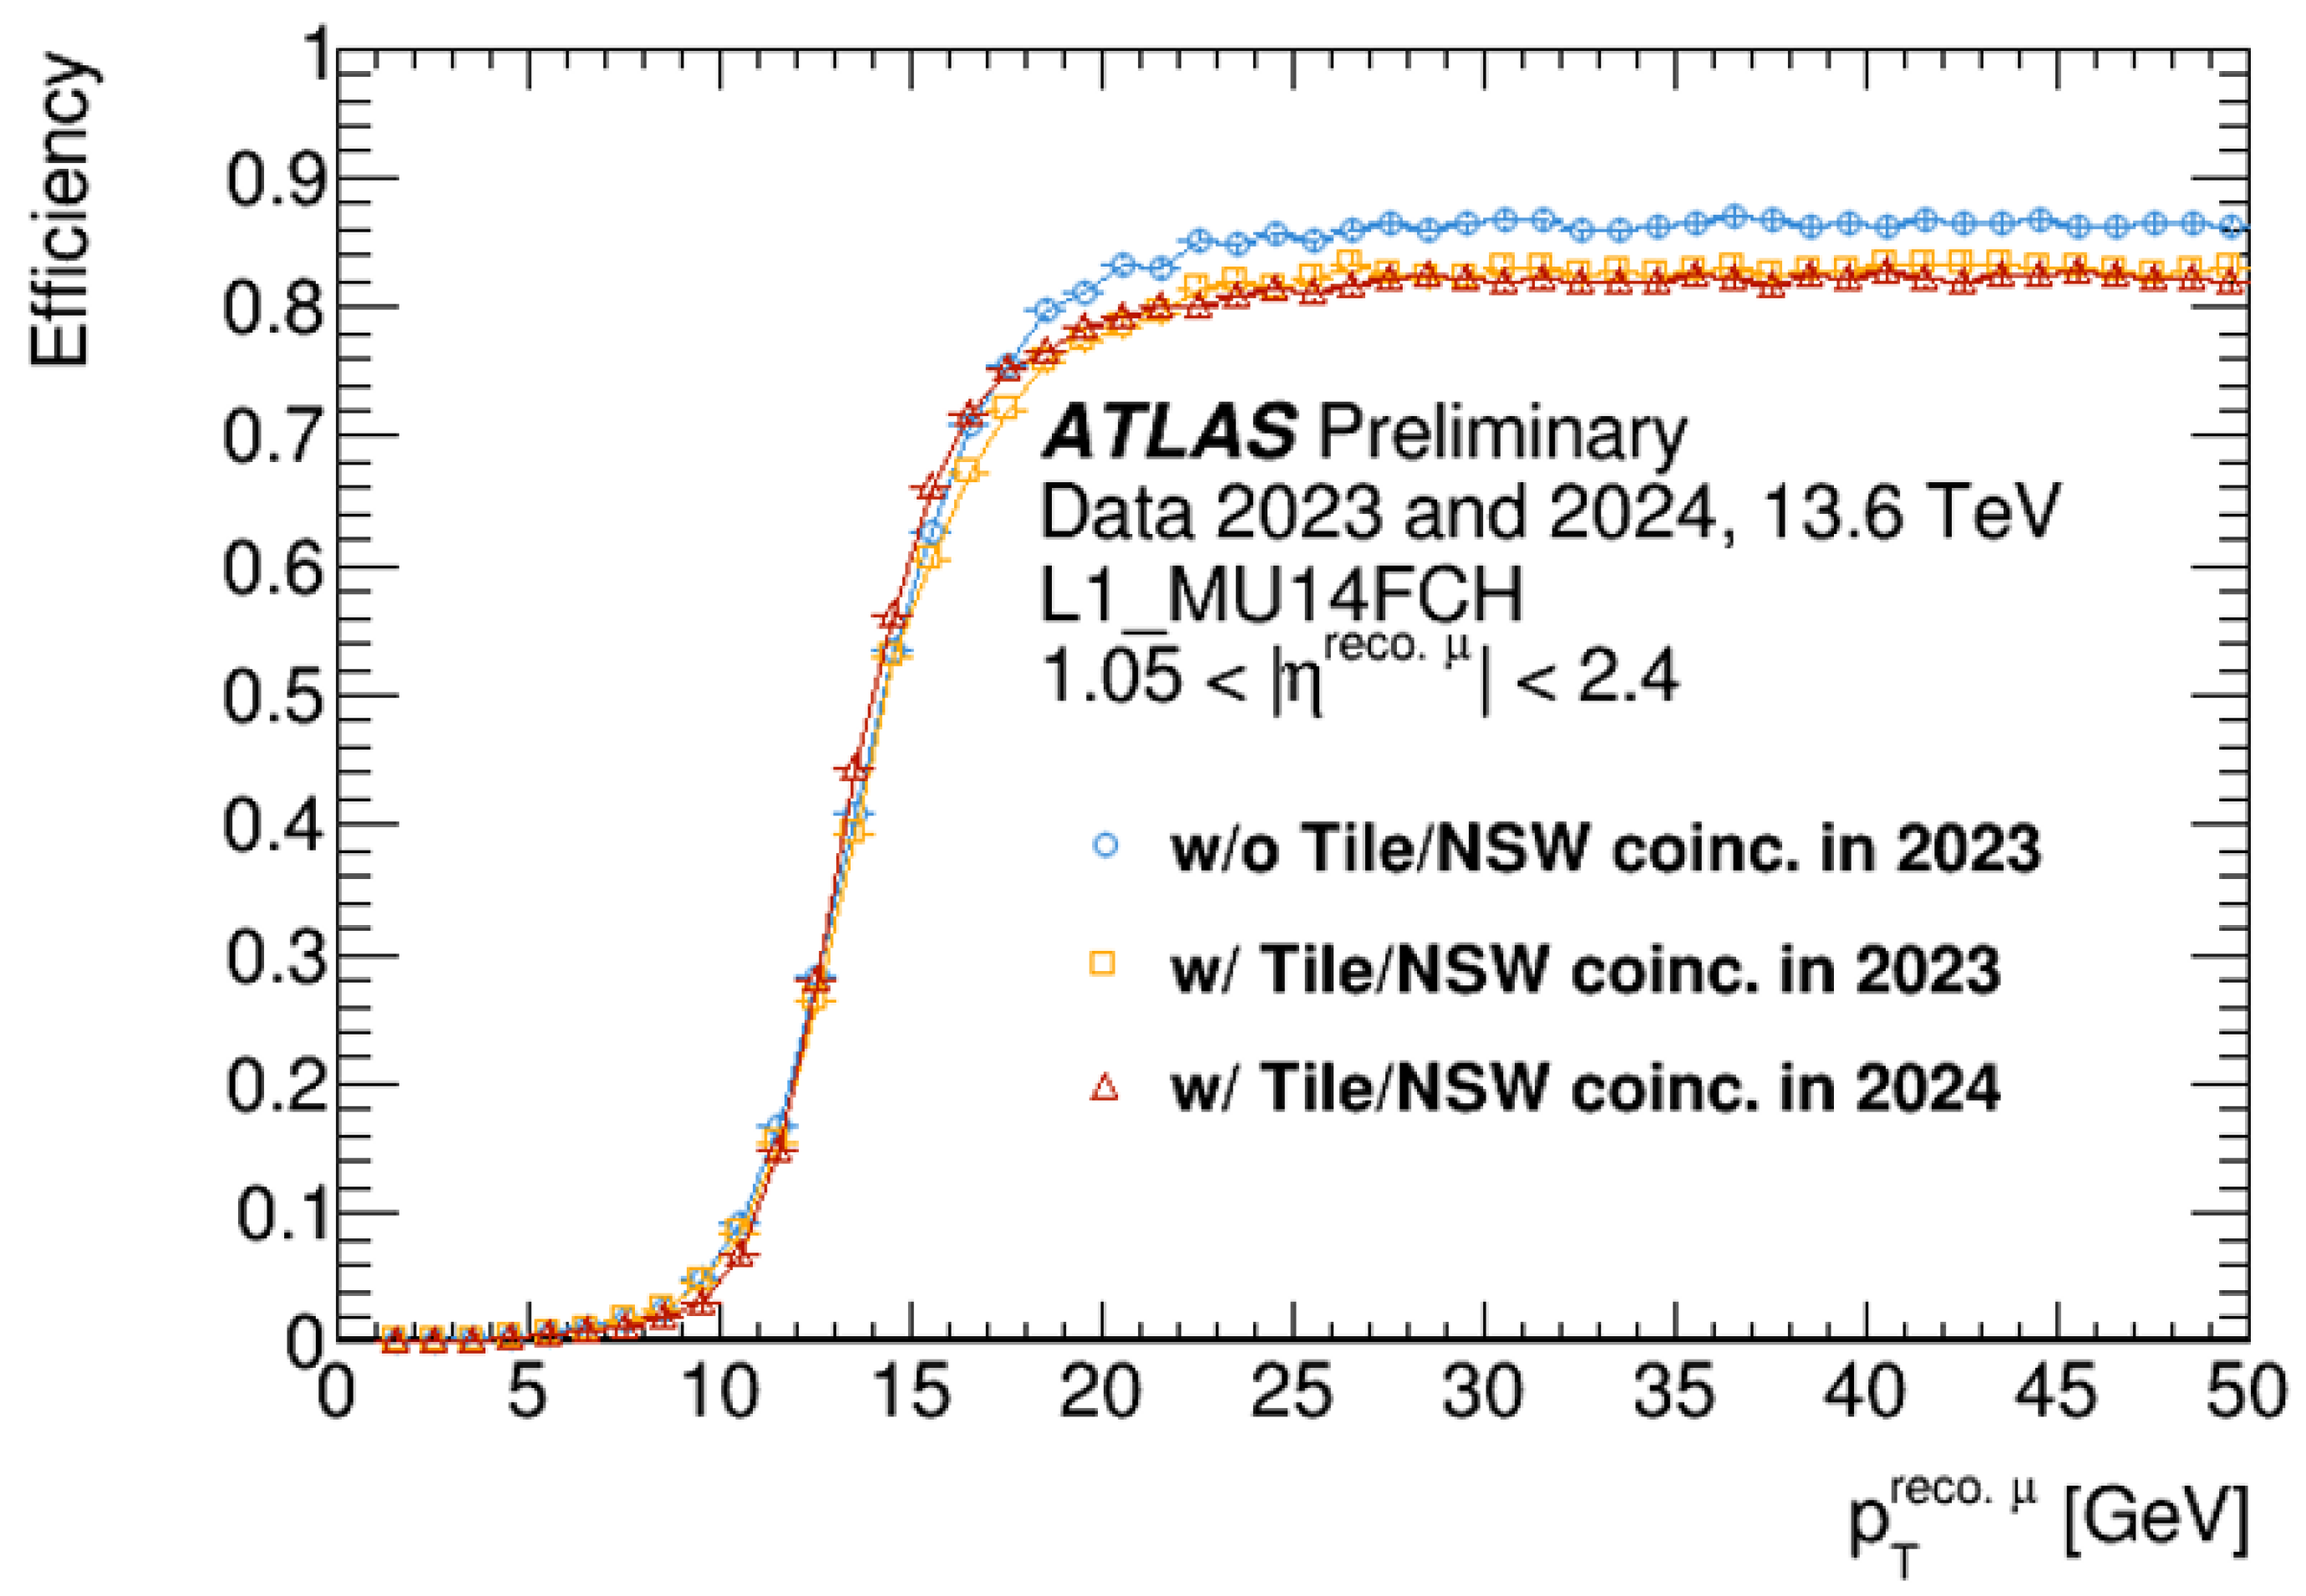
Figure 12.
Efficiency of associating at least four out of the eight MM or sTGC strip layers to an inner detector + MS or MS-only muon track ( > 2.5, > 15 GeV). The colors indicate the detector sides: red corresponds to the A-side and blue to the C-side. Runs with low efficiency can be explained by detector or readout issues at the time of data-taking [10].
4. Muon Trigger System and Integration of the NSW in Run 3
During Run 3, intensive efforts have been made to integrate the NSW into the DAQ systems of the established muon detectors, including timing synchronization. This section focuses on its integration into the trigger system.
4.1. Muon Trigger System
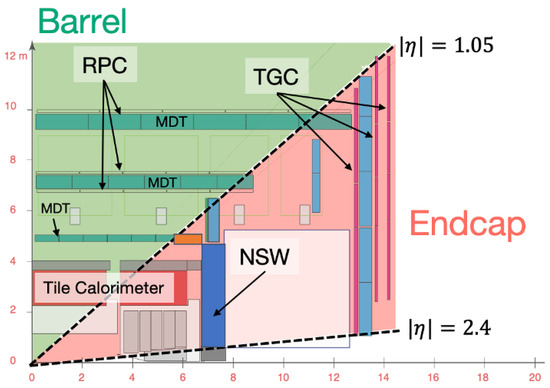
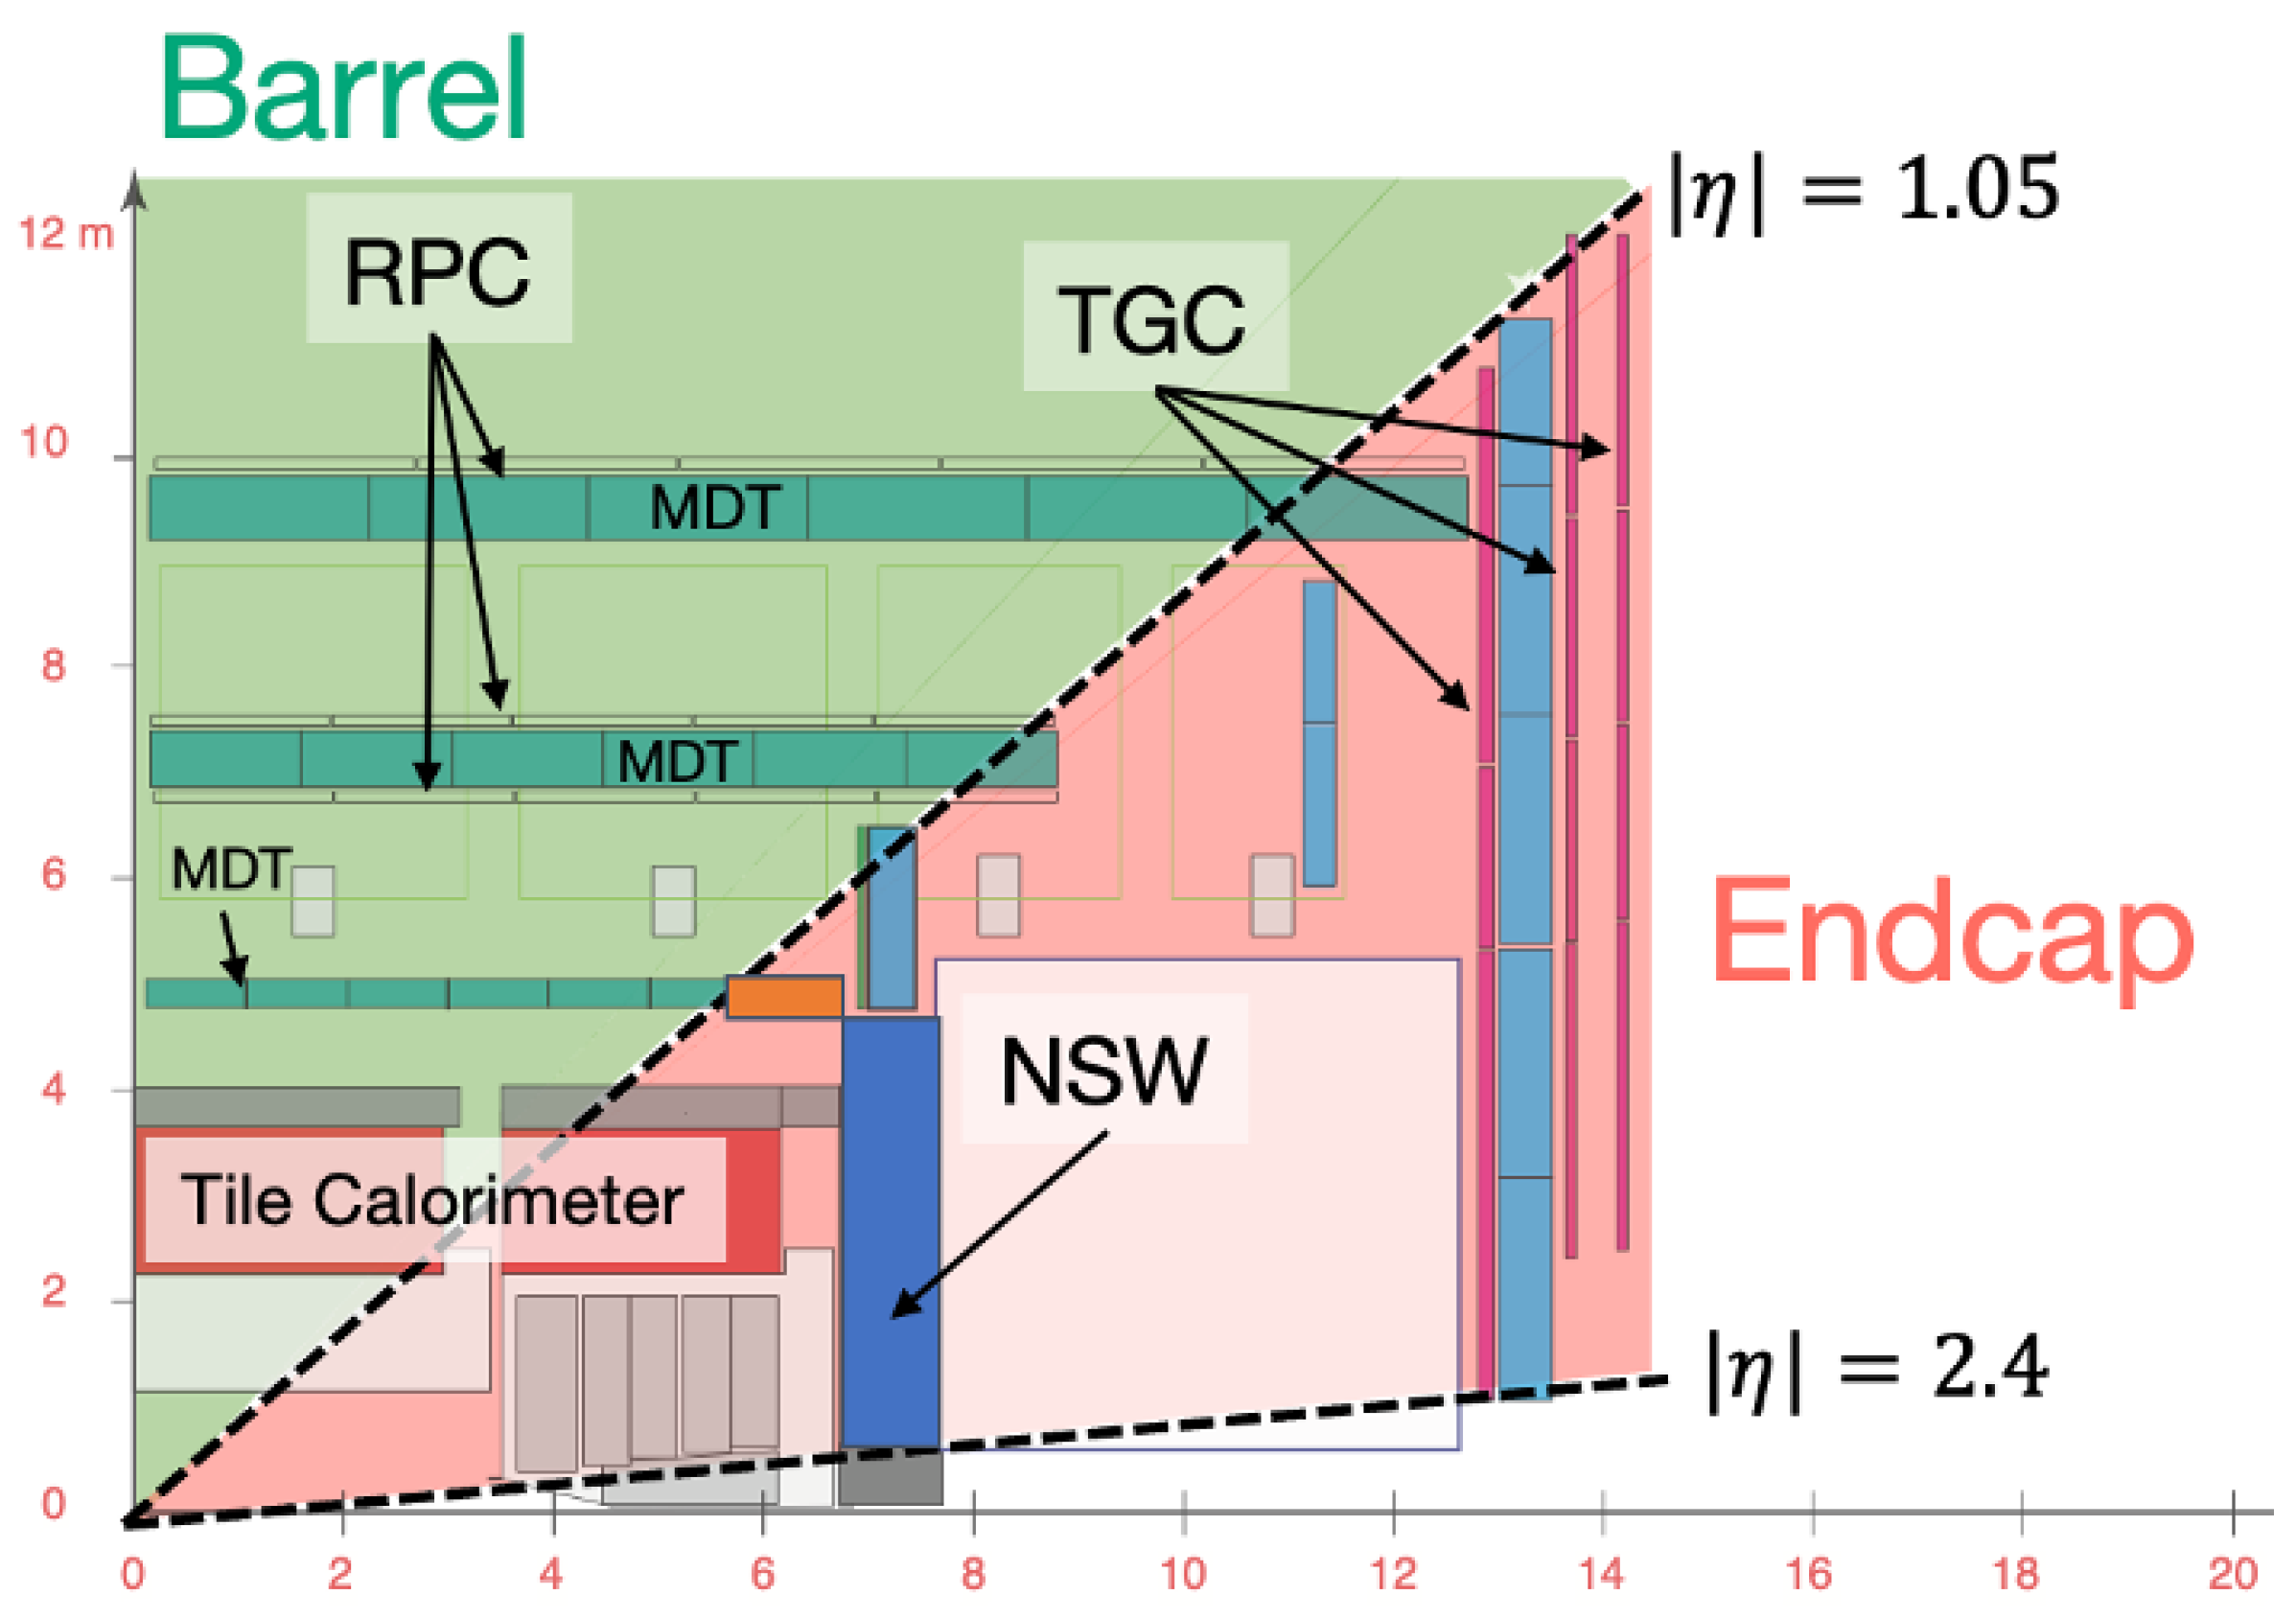
The ATLAS trigger system is composed of two stages: the Level-1 (L1) trigger and the High-Level Trigger (HLT). The L1 trigger is a hardware-based trigger that makes a decision within approximately 2.5 s. In the barrel region ( < 1.05), the L1 trigger uses RPCs, while in the end-cap region (1.05 < < 2.4), it uses TGCs (Figure 13). The of muon candidates is estimated from the curvature of the trajectory, measured by the deviation of hits from a straight (infinite-) track in the RPCs and TGCs. To suppress the background, an additional coincidence with the Tile calorimeter and NSW is required with respect to the TGC signal. When a candidate is found, a Region of Interest (RoI) is identified and passed to the HLT. The HLT is a software-based trigger that refines the event selection by confirming muon candidates using full detector information from the inner detector, calorimeter, and muon spectrometer.
Figure 13.
The division between the barrel and end-cap regions in the ATLAS detector. They are separated at = 1.05, with the barrel trigger provided by the RPC and the end-cap trigger by the TGC, the NSW, and the Tile calorimeter.
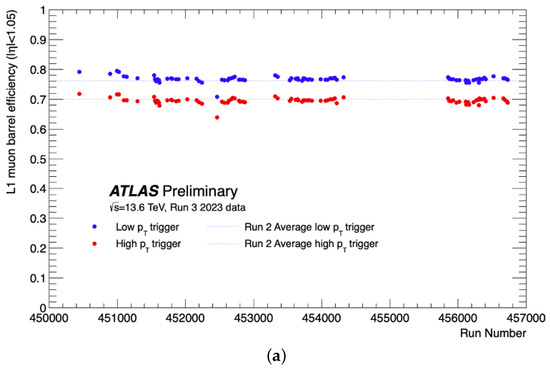
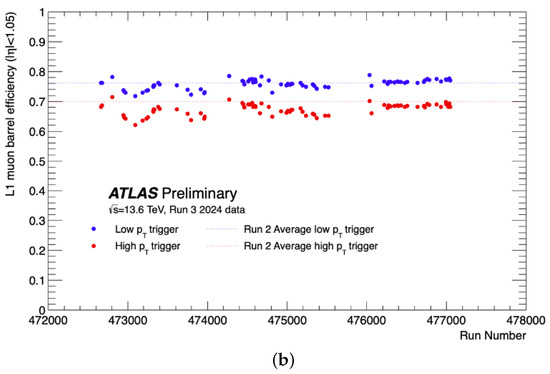
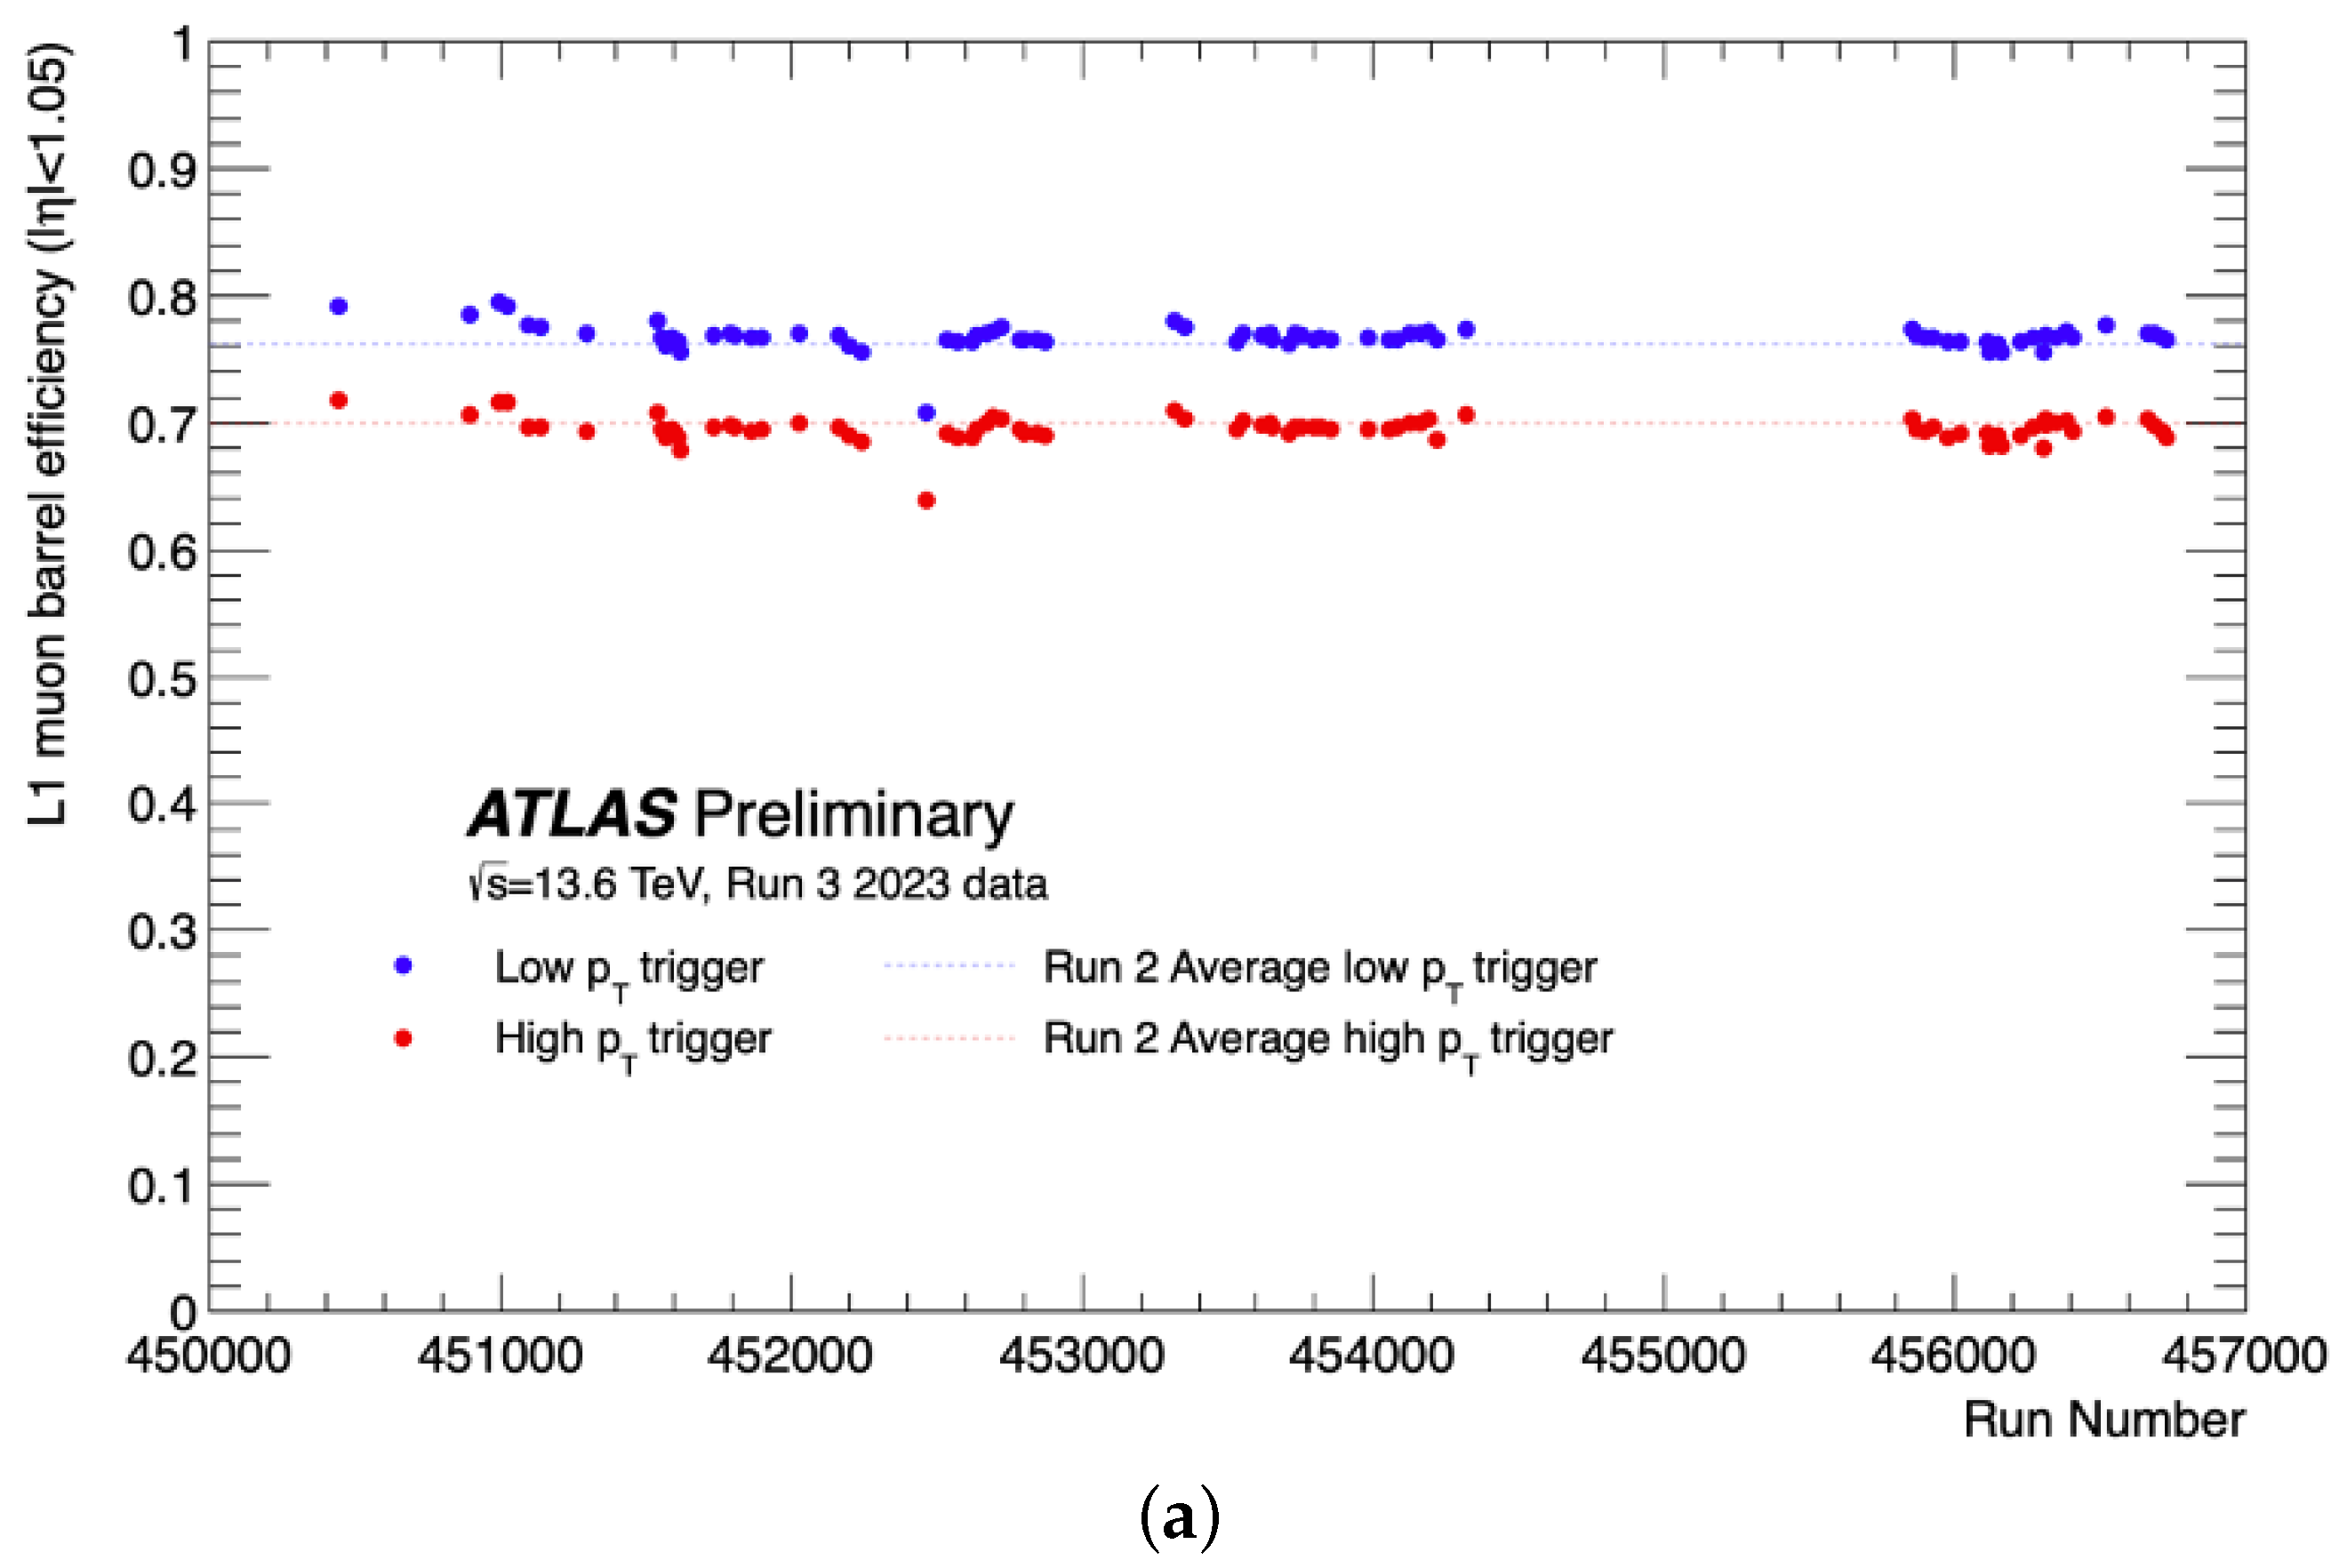
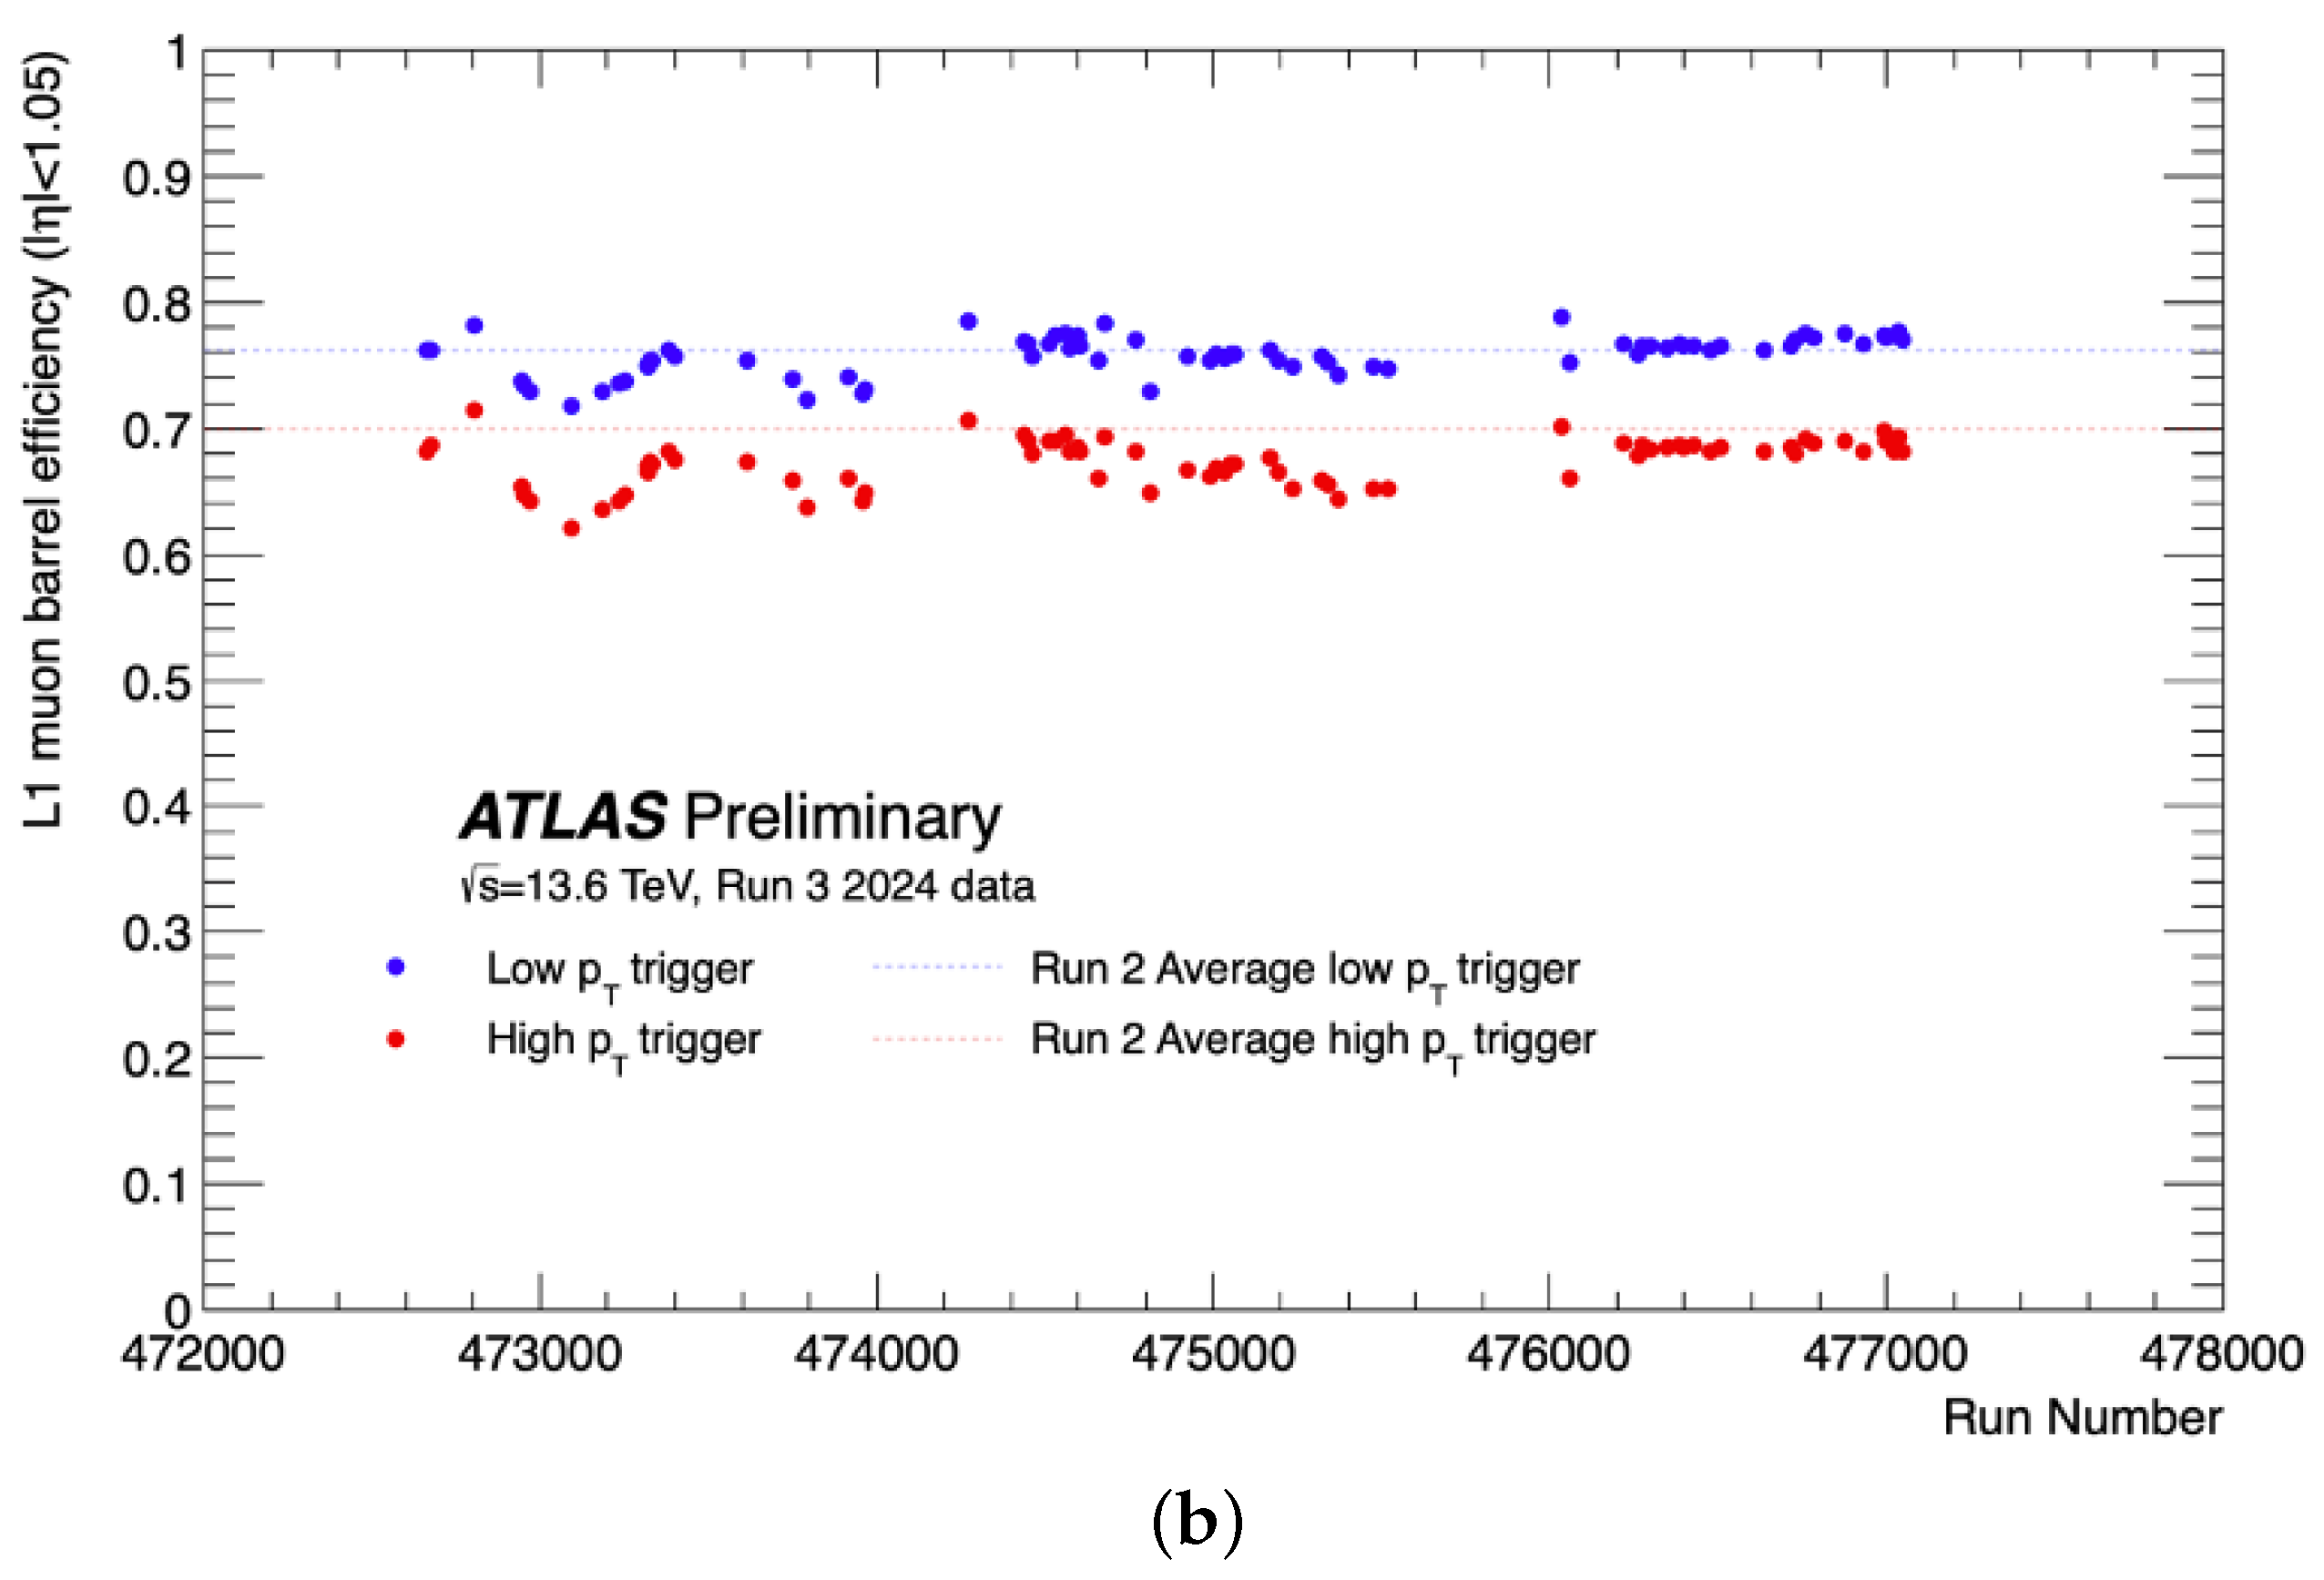
The L1 muon trigger performance in the barrel region, shown in Figure 14, is evaluated using non-muon triggers to provide unbiased measurements. The left plot corresponds to the 2023 data and the right plot to the 2024 data. In early 2024, we observed some instability. This issue was addressed by updating the high-voltage correction factors. After this correction, the efficiency became much more stable.
Figure 14.
The L1 muon barrel trigger efficiency. The red color corresponds to high- (20 GeV threshold) while the blue color to low- (10 GeV threshold). (a) The L1 muon barrel trigger efficiency in 2023. (b) The L1 muon barrel trigger efficiency in 2024. After run 476000, instabilities were resolved by updating the HV correction handling [11].
4.2. NSW Integration into Level-1 Muon Trigger
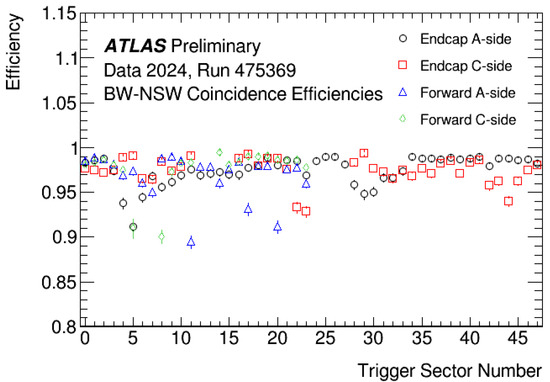
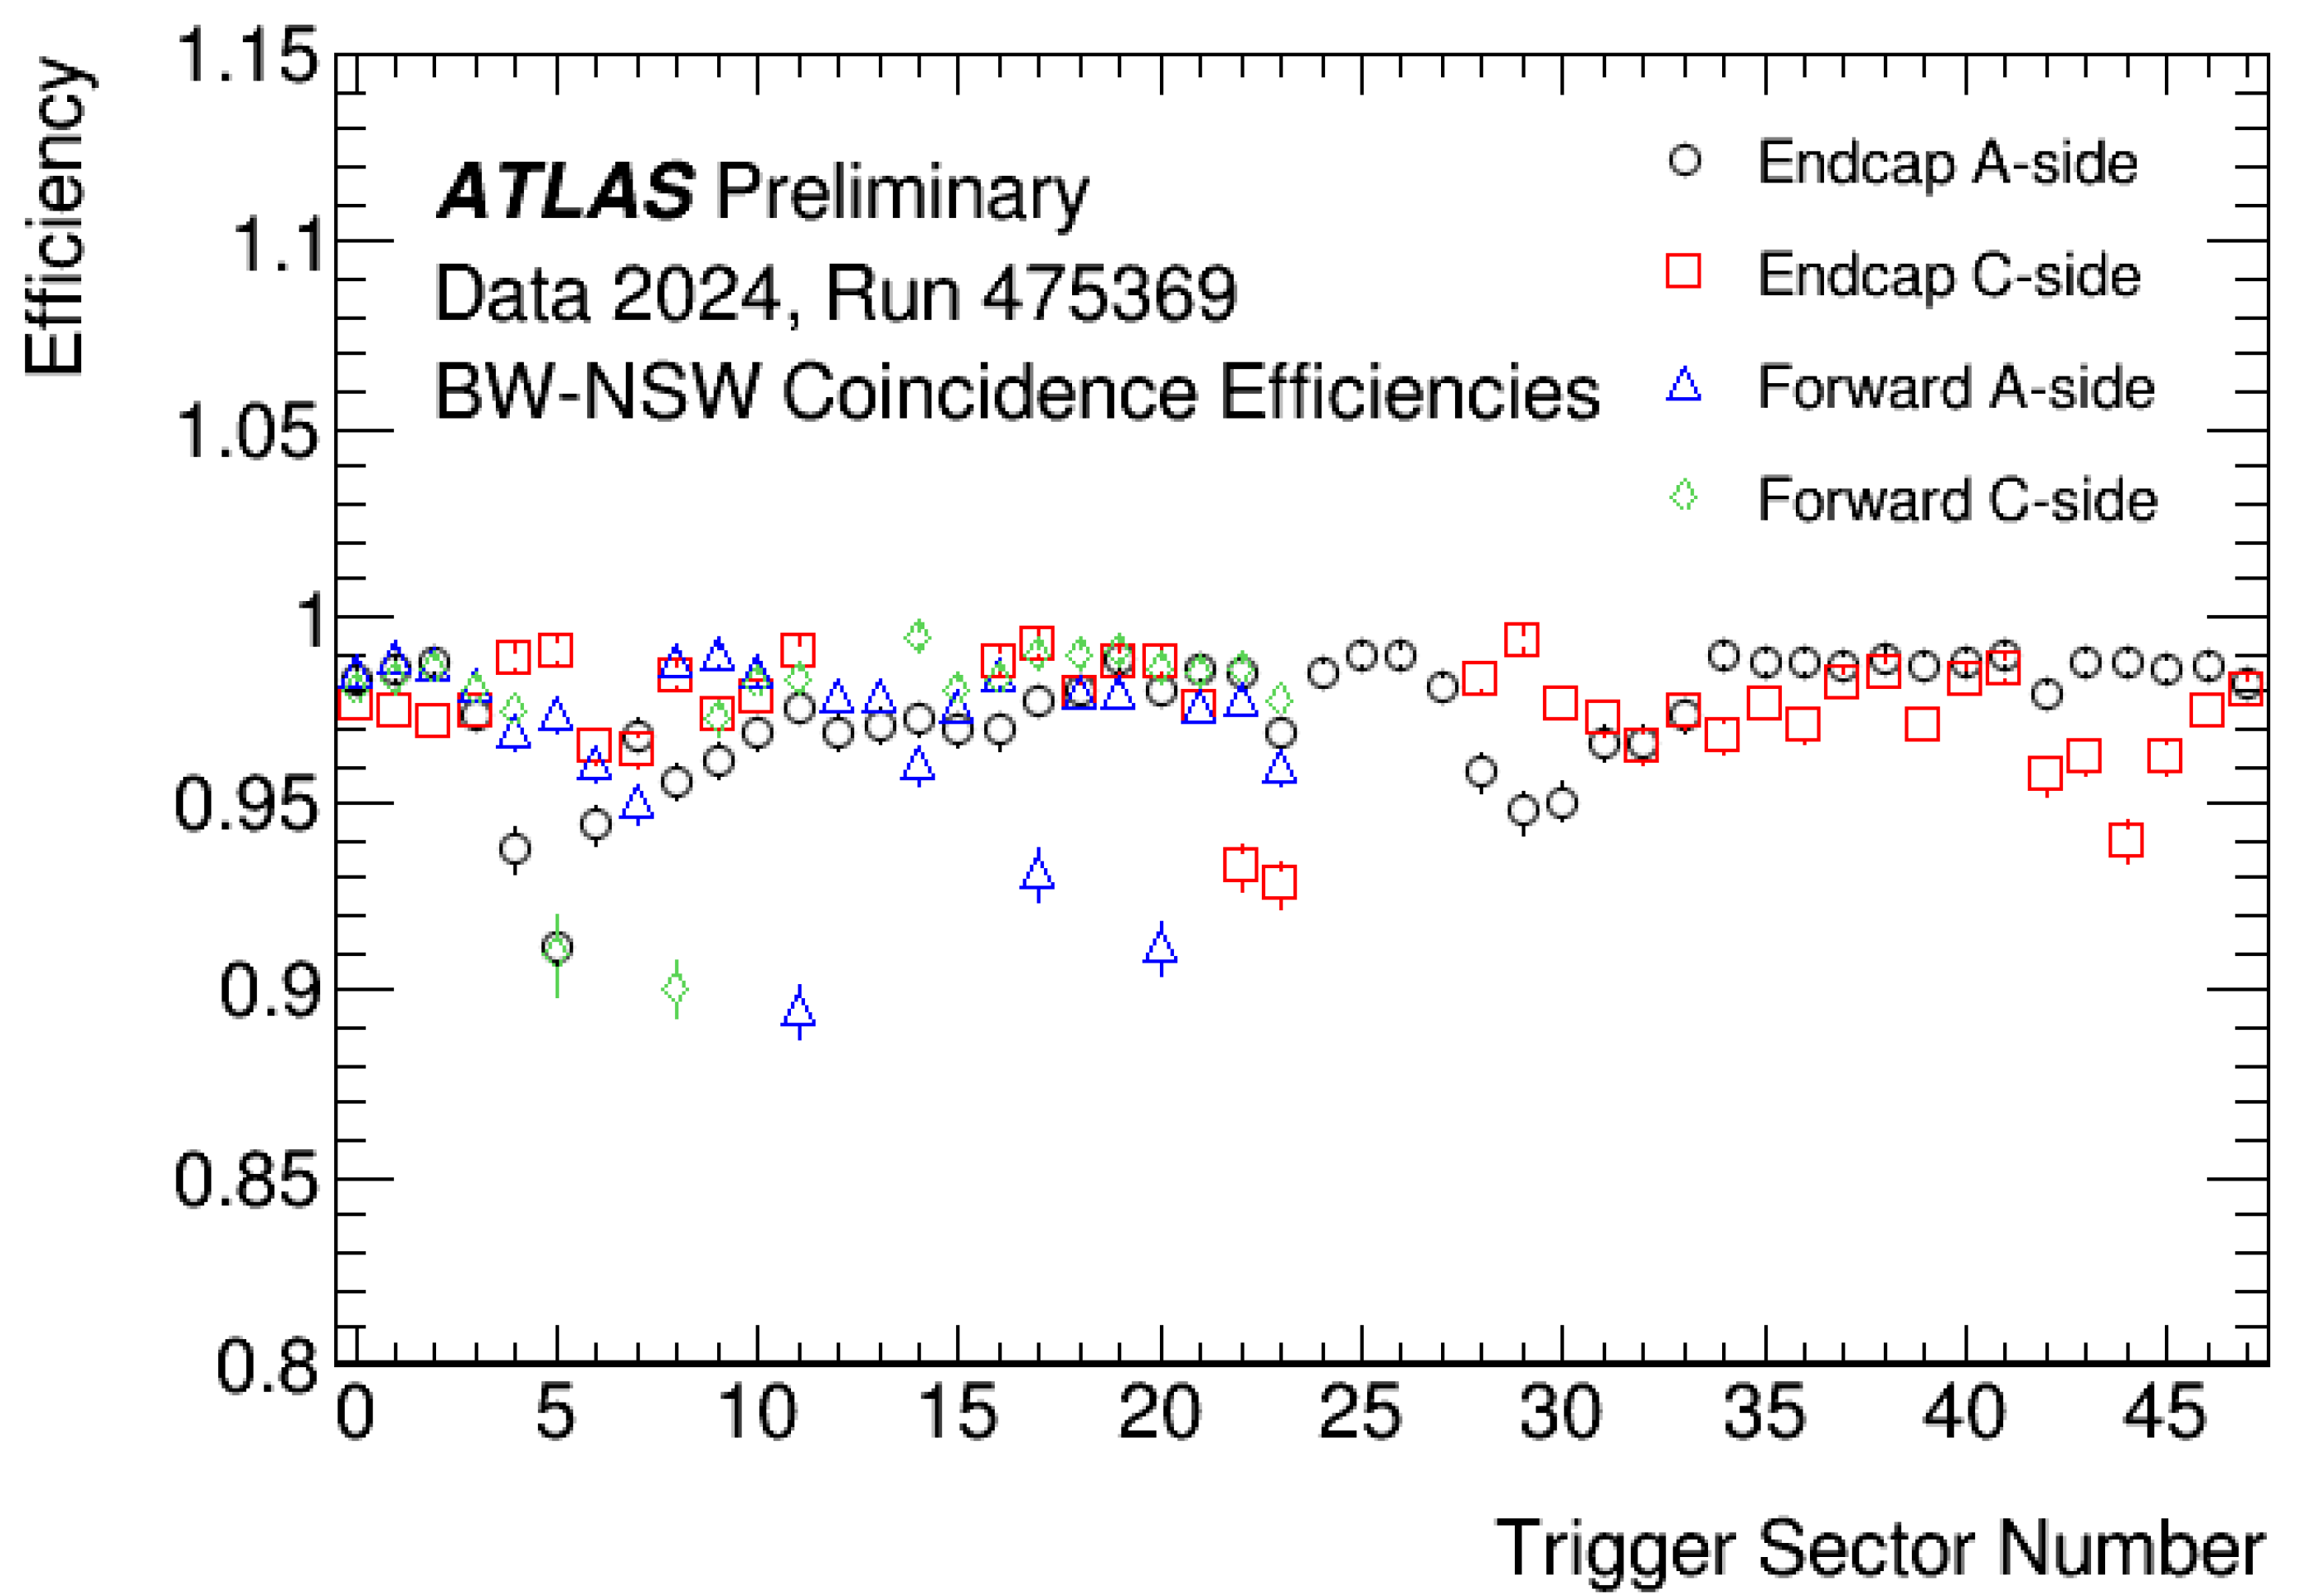
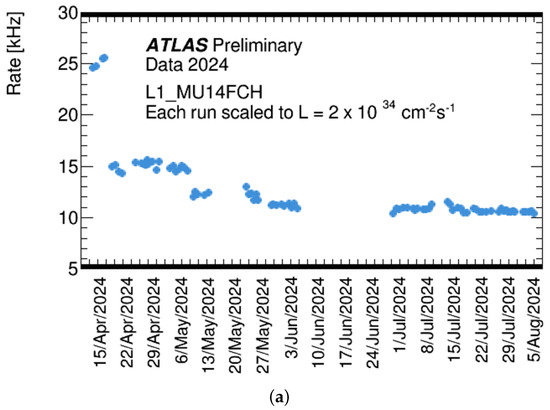
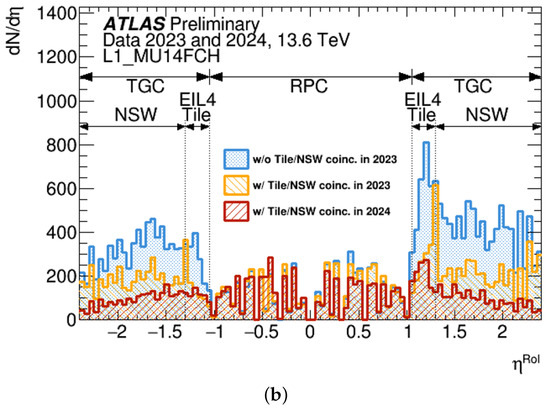
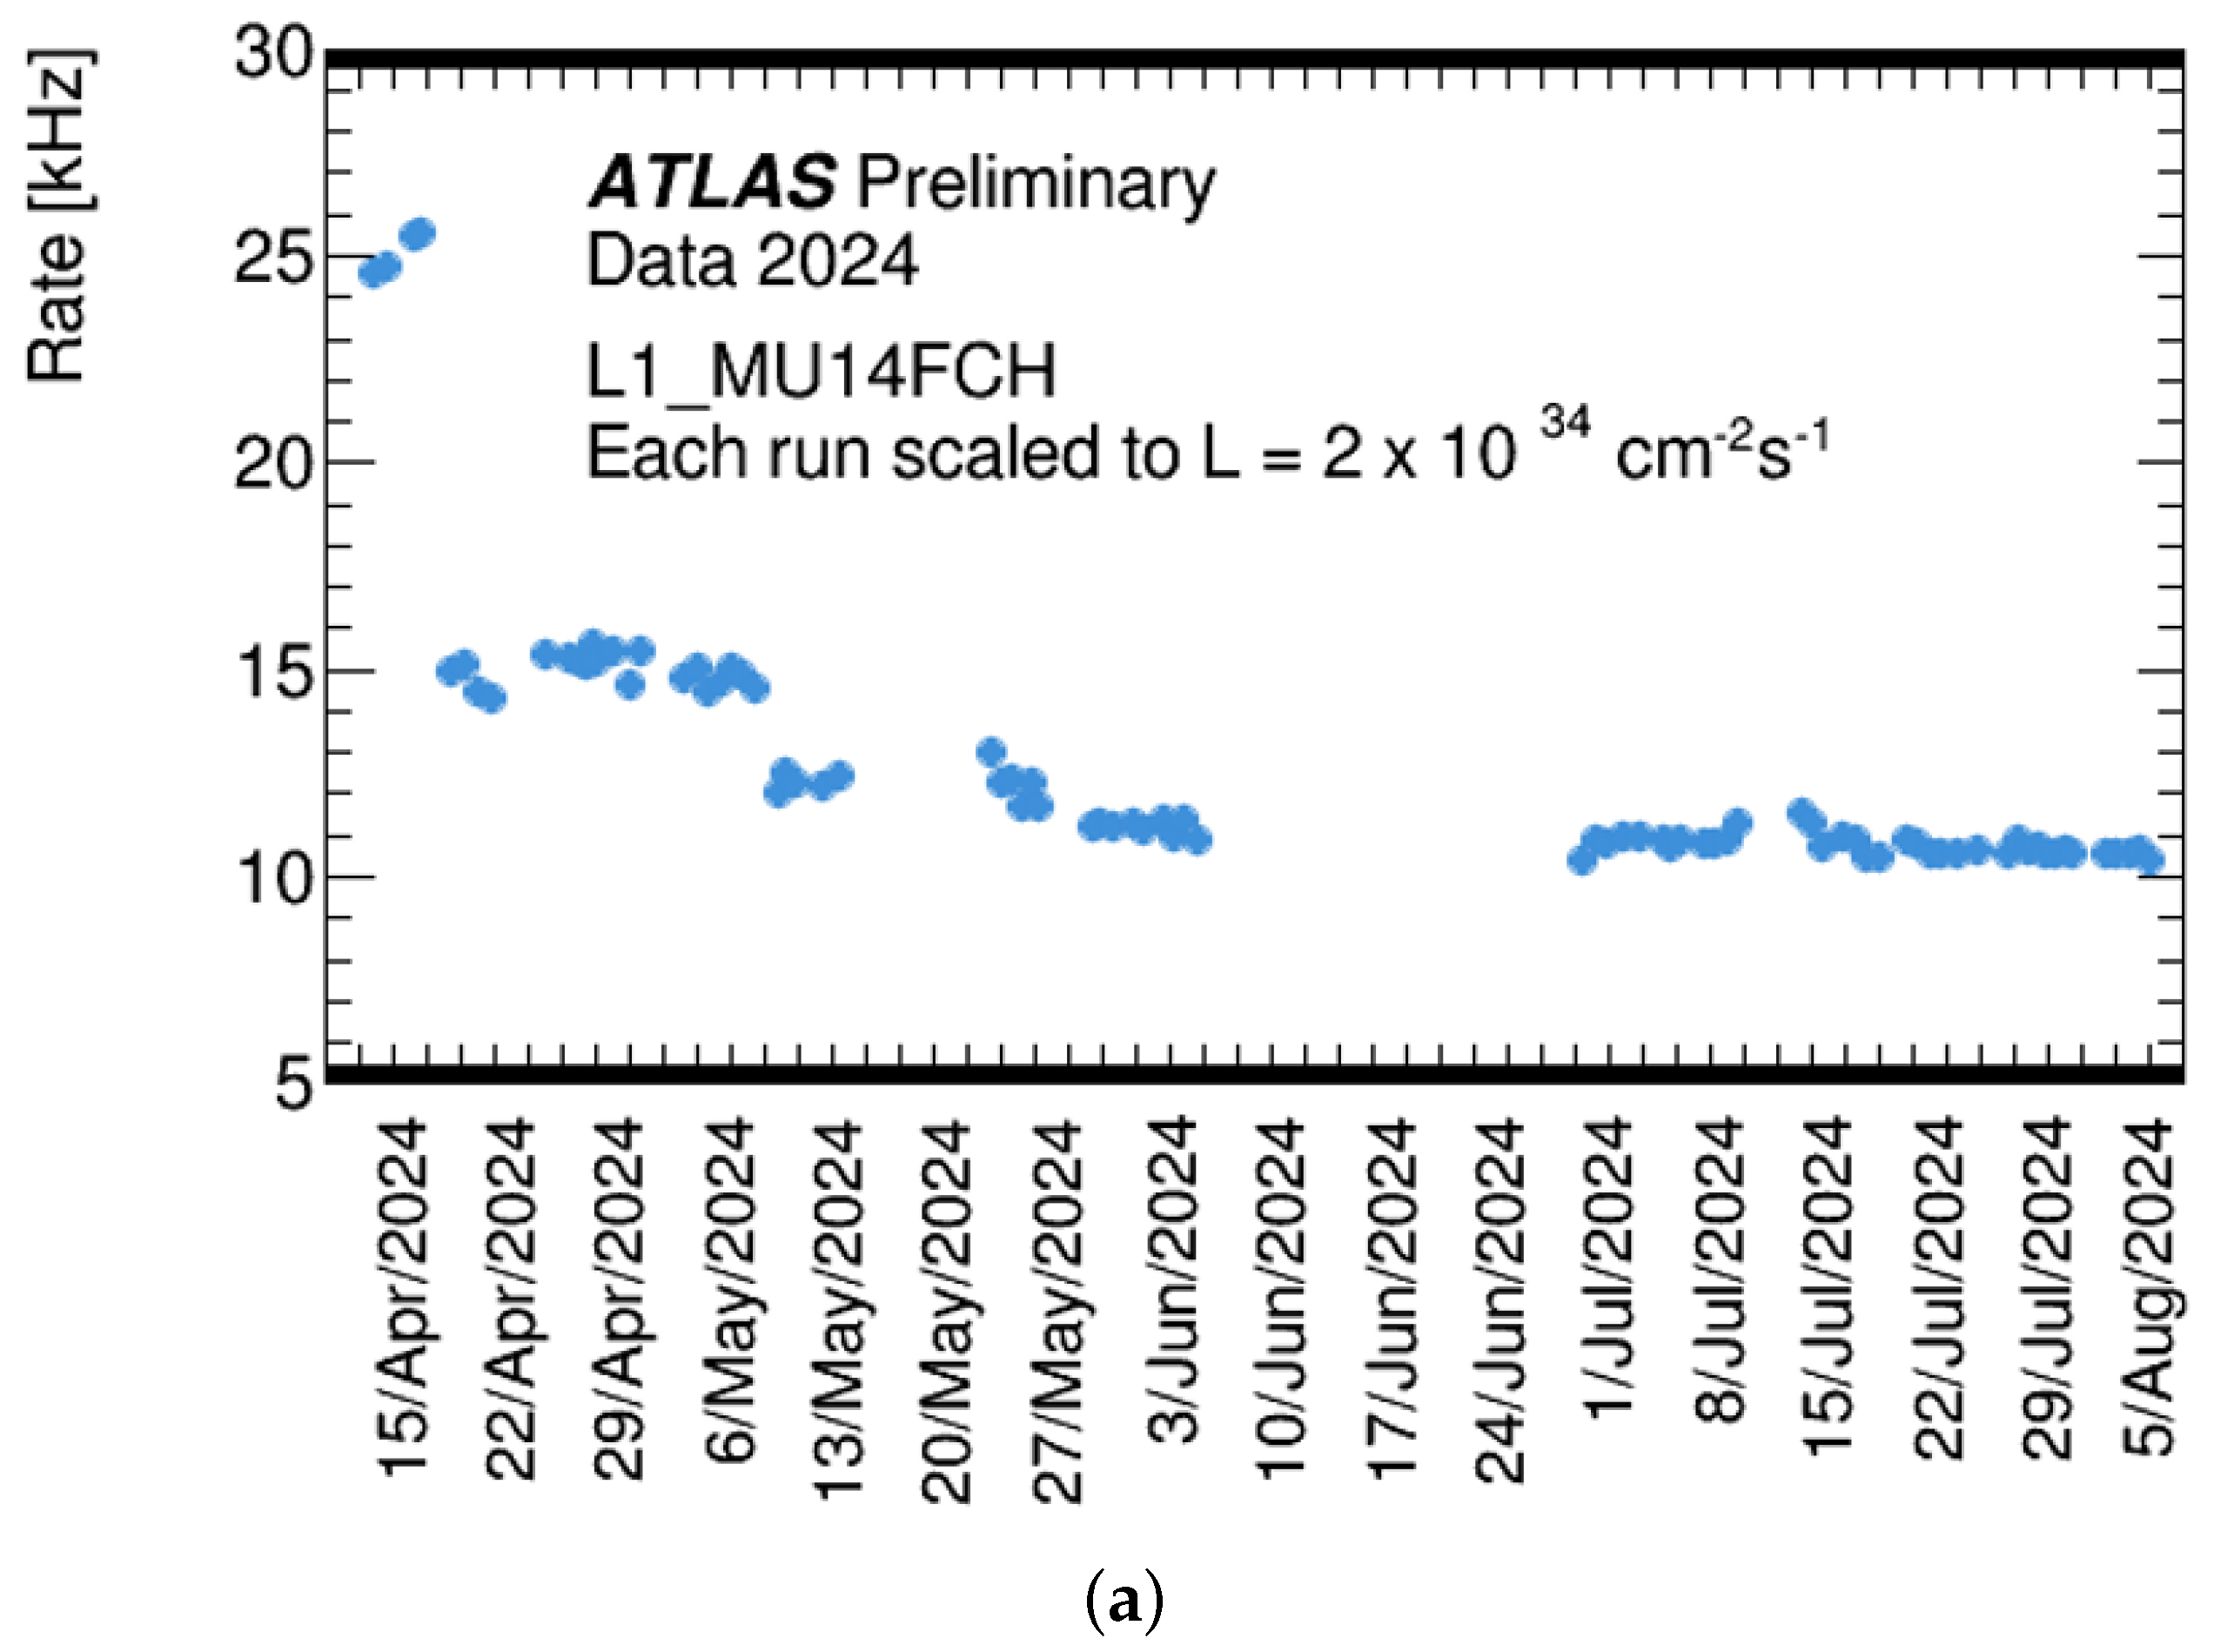
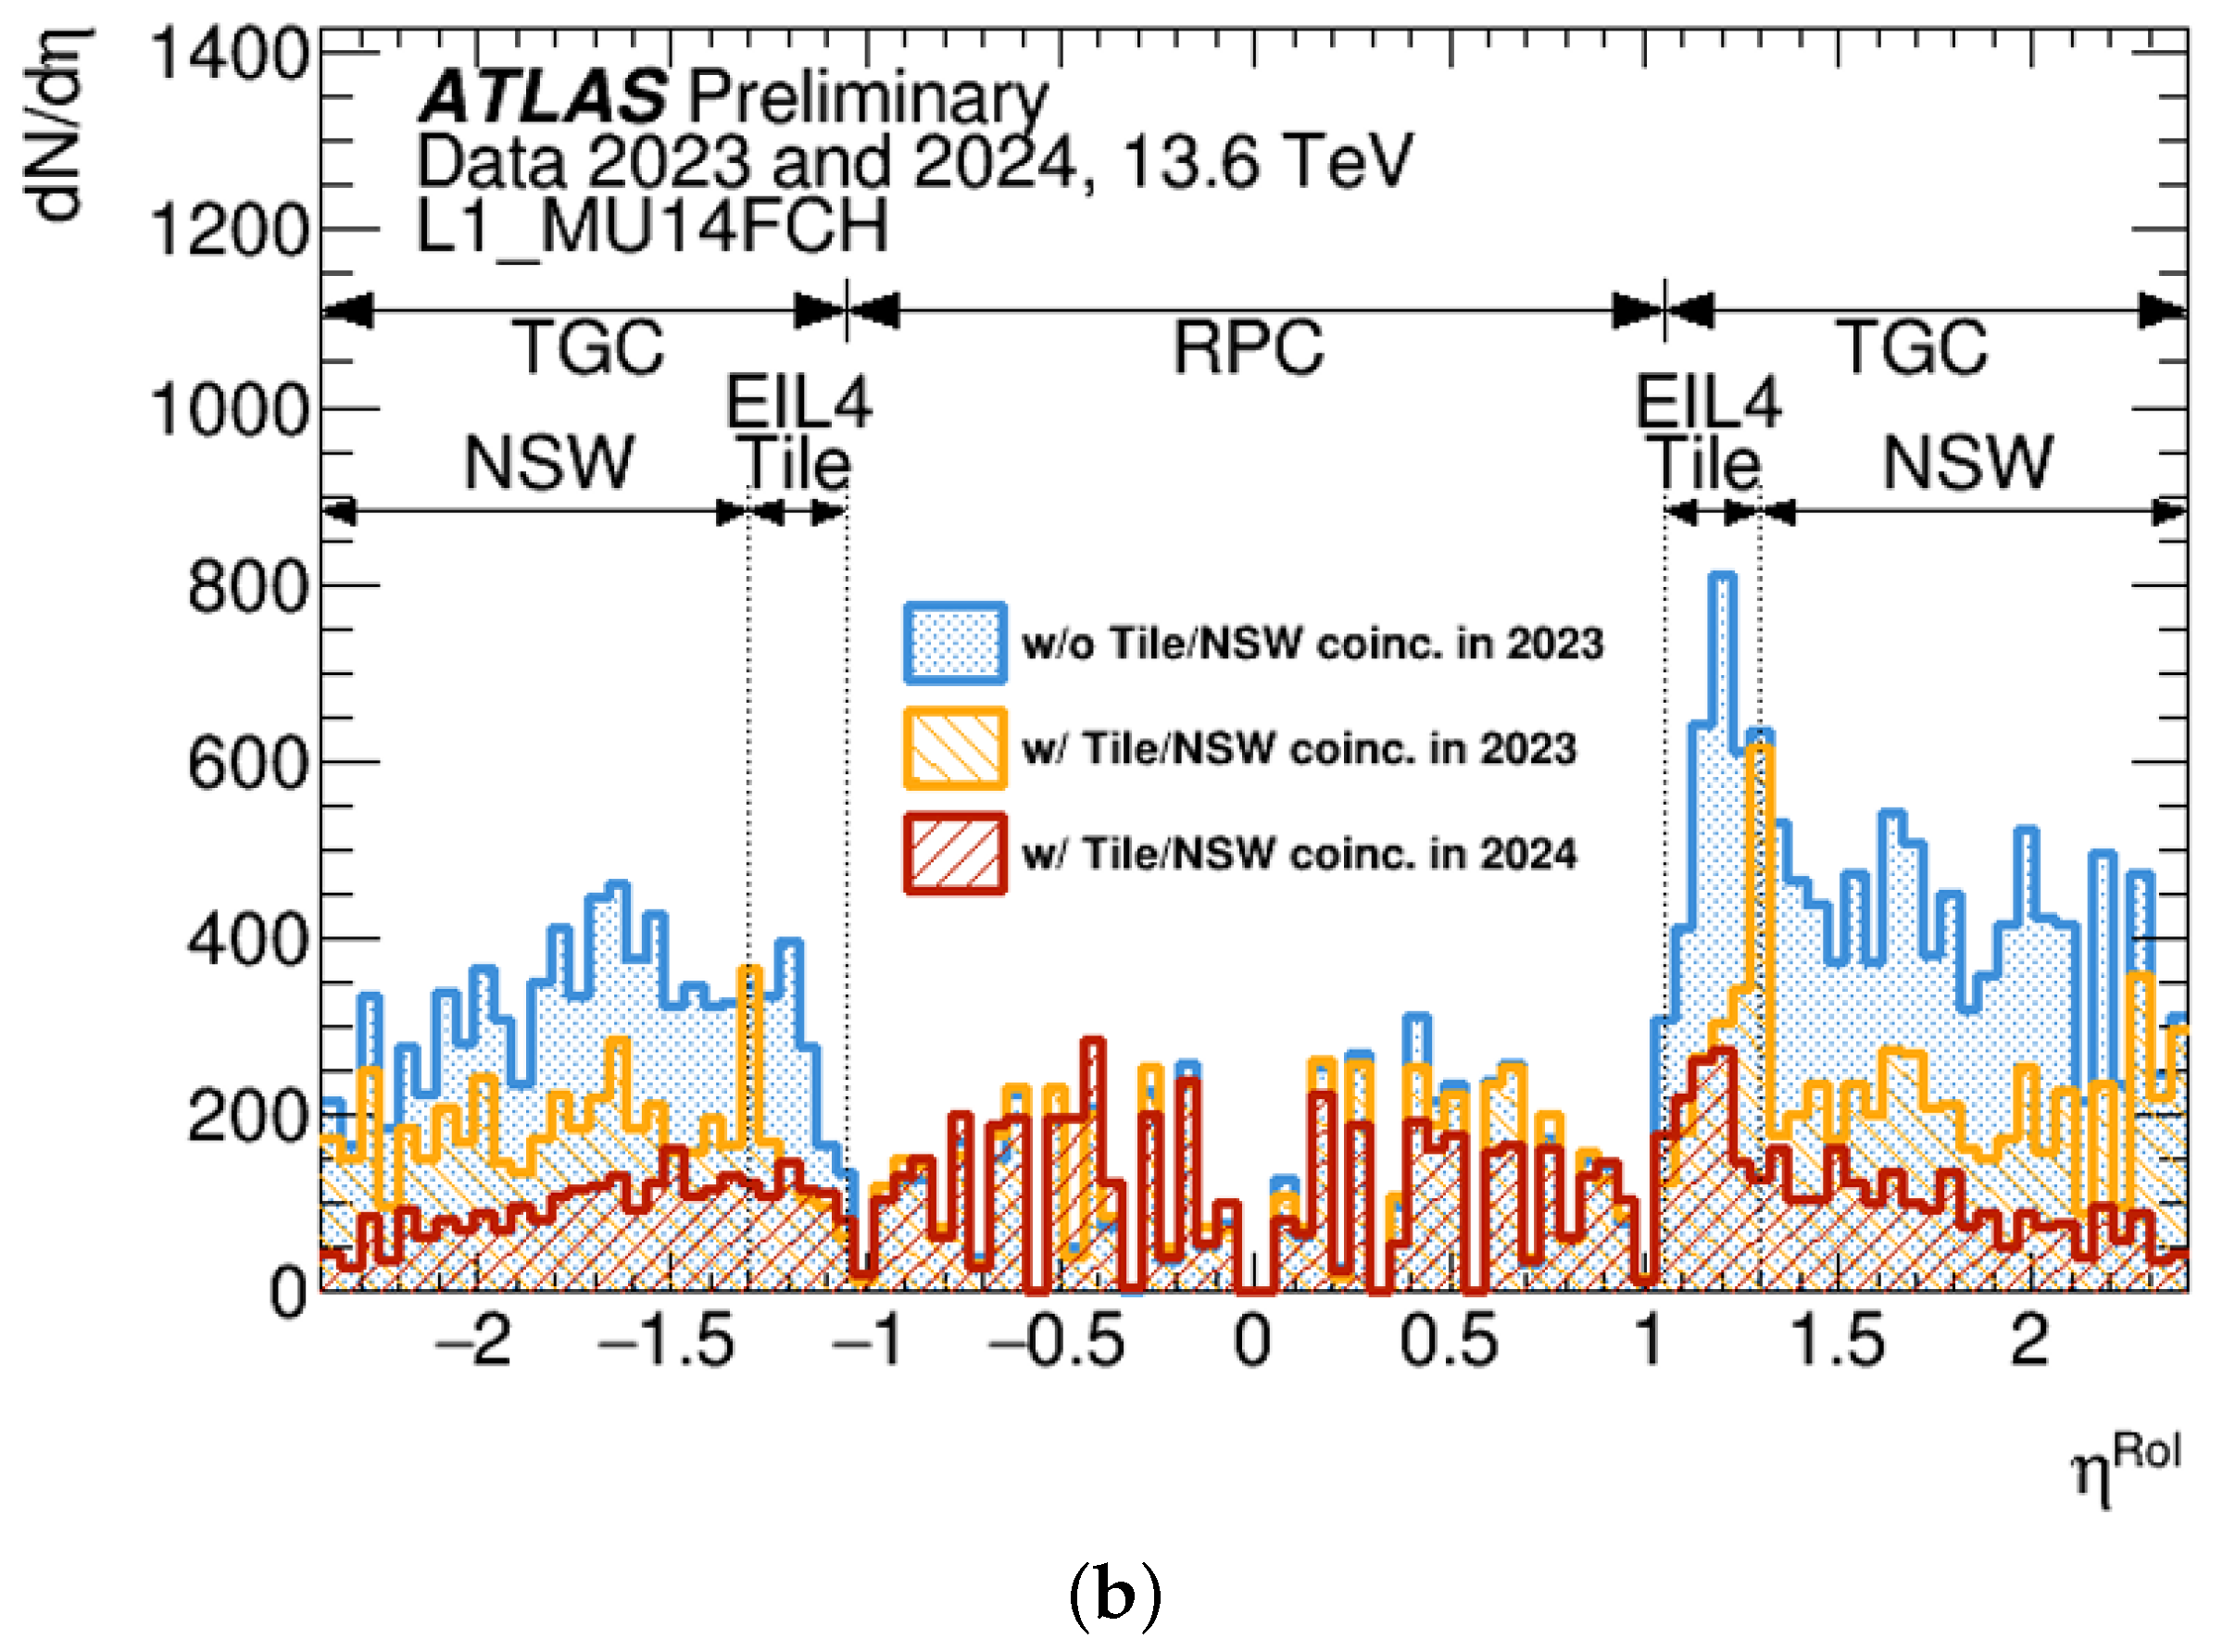
To better handle the increased luminosity and pile-up in Run 3, the NSW detectors are introduced in the end-cap region. They improve the selectivity of the muon trigger. One of the key motivations for the NSW integration is the suppression of fake muons. The L1 trigger algorithm in the end-cap region is structured as follows: First, a coincidence is formed using hits in the seven layers of TGC wires and strips to determine the , which is referred to as the TGC-only trigger. Subsequently, muon segments reconstructed by the NSW Trigger Processor are combined with the TGC information to suppress fake muons. As shown in Figure 15, the relative efficiency of the TGC–NSW coincidence remains stable across all trigger sectors. The trigger efficiency, including the NSW coincidence, is slightly lower than that of the TGC-only configuration due to the coincidence requirement with the NSW (Figure 11) but it remains stable over 80% across all trigger sectors. Furthermore, as shown in Figure 16, the integration of the NSW into the L1 muon trigger in the end-cap region has resulted in a significant reduction in fake muon triggers. The left panel of Figure 16 shows the evolution of the L1 trigger rate throughout 2024. As more NSW sectors were gradually integrated into the trigger system, the rate steadily decreased. In total, the rate was reduced from approximately 25 kHz to 11 kHz, corresponding to a 56% suppression. The right panel shows the muon candidates as a function of . The blue histogram corresponds to the 2023 trigger rate using TGC-only triggers, while the red histogram to the 2024 rate after introducing the TGC–NSW coincidence. As can be seen, the trigger rate in the end-cap region is significantly reduced after the integration of the NSW. A clear reduction appears for > 1.3, where the NSW provides additional track segment information and strongly suppresses fake muon triggers at higher pseudorapidity. In the region , which lies outside the NSW acceptance, a reduction is still observed, mainly due to Tile calorimeter-based selections rather than the NSW.
Figure 15.
Relative efficiency of the coincidence between the TGC Big Wheel (BW) and the NSW detectors, shown as a function of the trigger sector number in the end-cap muon trigger. The trigger sector numbers are arranged along the direction. The efficiency is evaluated with respect to BW-only triggered events. Reduced efficiency in certain sectors is due to local coincidence criteria not being met in the NSW muon segment selection. Only the sTGC pad detector is used. The trigger sector numbers 12–15 and 24–27, which are in the plot, correspond to unstable NSW sectors that are excluded from the efficiency evaluation. In this run, 85% of the end-cap trigger sectors are included in the trigger logic to suppress background [9].
Figure 16.
Suppression of fake muon triggers by the integration of the NSW. (a) As the NSW sectors were gradually integrated into the trigger system, the rate steadily decreased. The full integration was completed in May 2024. In total, the rate was reduced from approximately 25 kHz to 11 kHz. (b) It shows the number of trigger candidates as a function of . As can be seen, the trigger rate in the end-cap region is significantly reduced, demonstrating the strong suppression of fake muon triggers by the integration of the NSW [9].
5. Muon Reconstruction and Performance
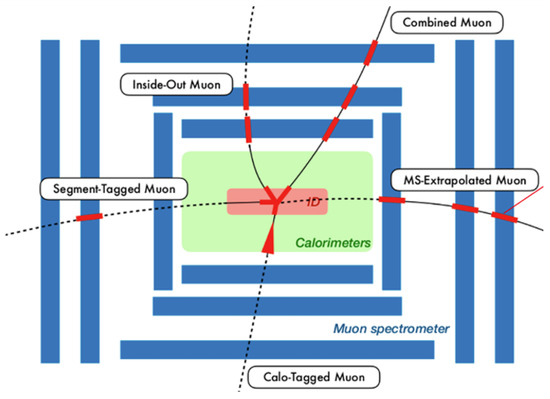
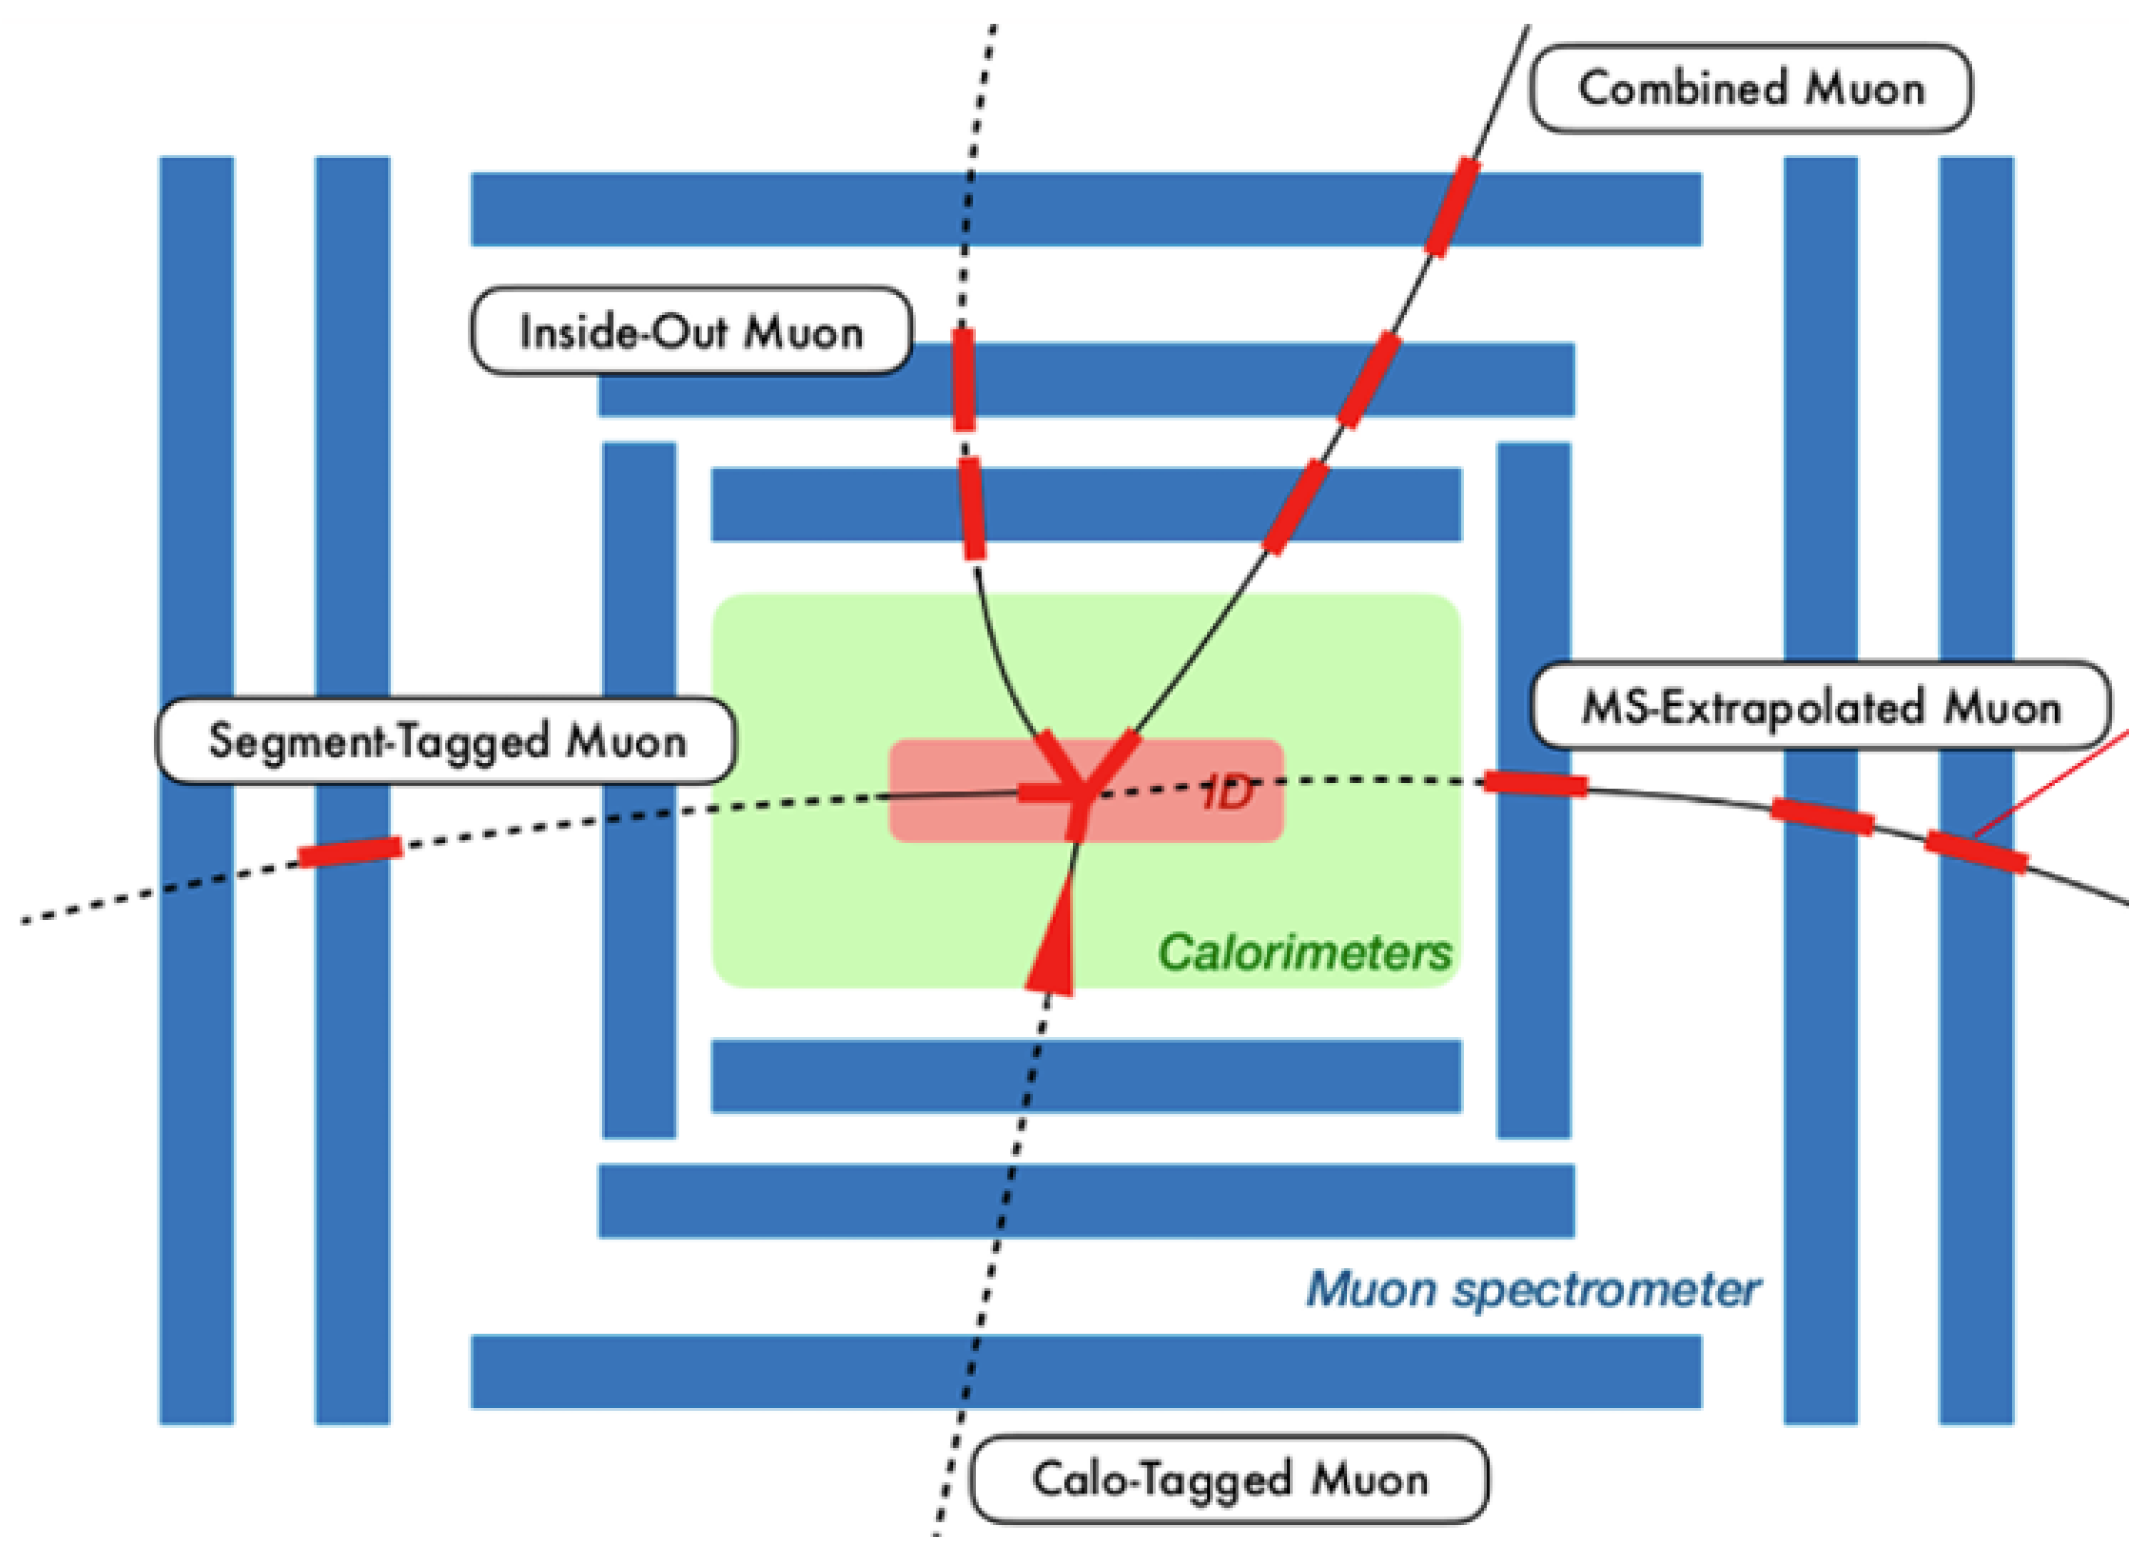
Muons are reconstructed by combining information from the MS, the ID, and the calorimeter (Figure 17) [12]. Depending on the detector coverage and the kinematic properties of the muon, several reconstruction strategies are employed. Here we introduce five of them. The Combined (CB) Muon is reconstructed from matched tracks in both the MS and the ID. It provides the most precise determination of . The MS-Extrapolated (ME) Muon is built using only the MS, typically in regions where ID coverage is limited. The Segment-Tagged (ST) Muon and Inside-Out (IO) Muon rely on partial matching between ID and MS segments and are useful for low- muons or in regions with limited coverage. Lastly, the Calo-Tagged (CT) Muon uses information from the calorimeter to tag ID tracks, helping to improve purity near where MS coverage is decreased. Each method has its strengths and is selected depending on the detector region and muon properties.
Figure 17.
Muons are reconstructed by combining information from the MS, the inner detector, and the calorimeter. Various muon types, such as Combined, MS-Extrapolated, Calo-Tagged, Inside-Out, and Segment-Tagged are defined. This approach allows us to maximize efficiency and precision across the full detector acceptance, especially in challenging regions such as low- or partial coverage areas [13].
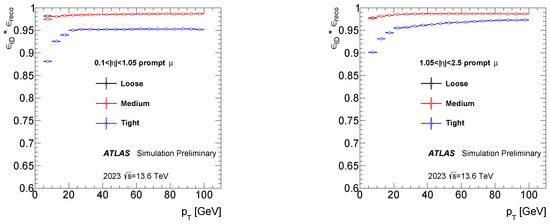
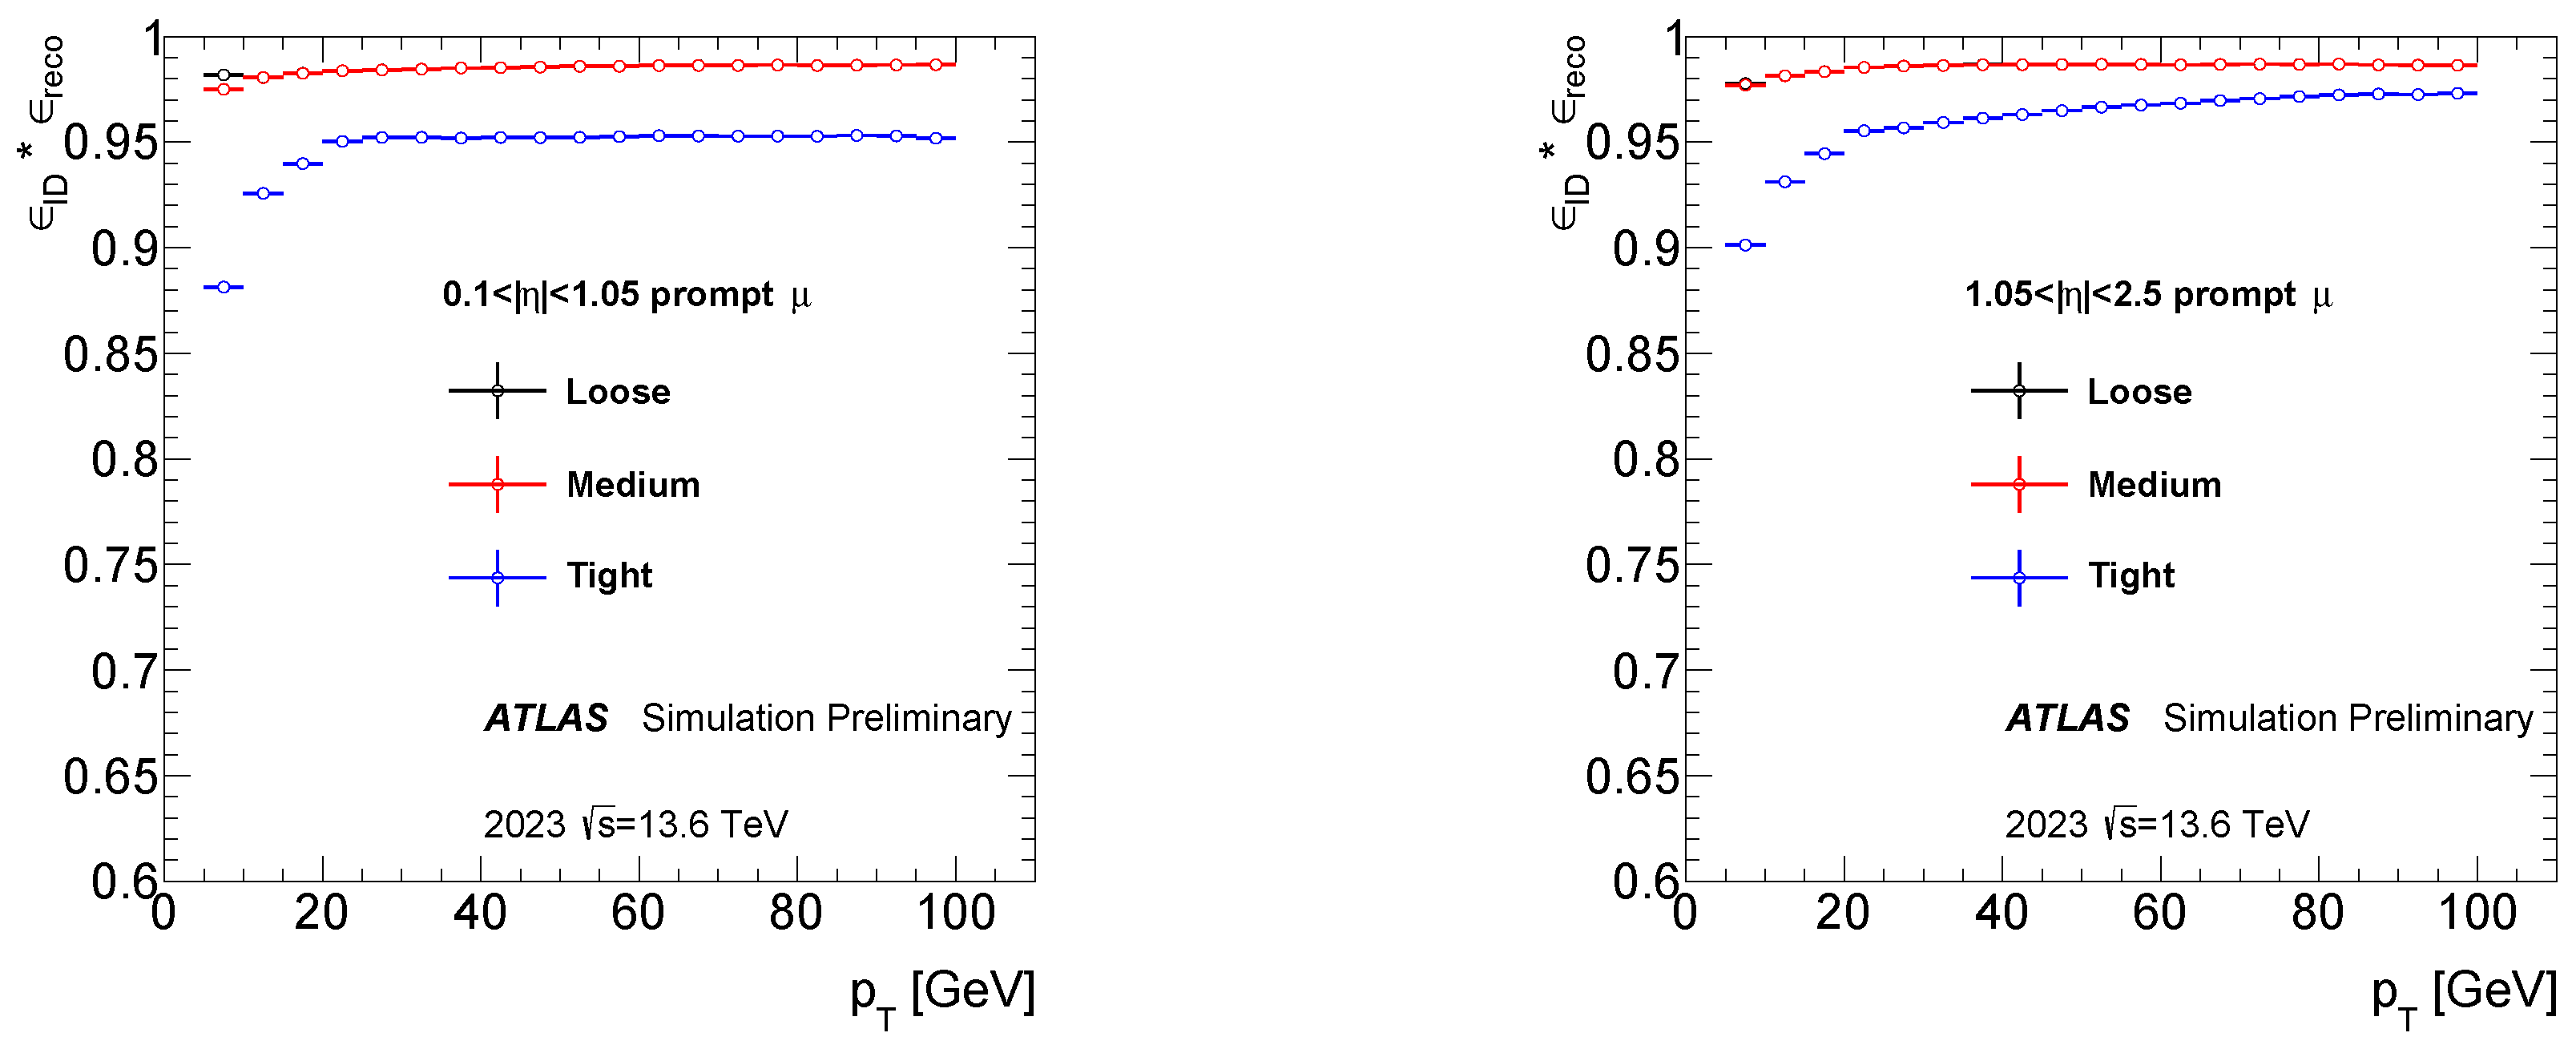
To evaluate the reconstruction efficiency and identification performance, working points (WPs) are employed as the standard muon selection criteria used in physics analyses. There are three main WPs, ‘Loose’, ‘Medium’, and ‘Tight’, presented here. ‘Loose’ uses muons reconstructed with CB, IO, ME, CT, and ST strategies. While it offers the lowest quality in terms of purity, it maximizes acceptance and is suitable for analyses requiring high statistics, such as searches with multiple leptons in the final states. ‘Medium’ uses CB, IO, and ME muons and serves as the standard WP for most analyses. It provides a good balance between efficiency, low fake rates, and small systematic uncertainties. ‘Tight’ uses only CB and IO muons, aiming to maximize purity by strongly rejecting fake muons at the cost of slightly reduced efficiency. The total muon identification efficiency is defined as the product of the reconstruction efficiency and the identification efficiency associated with each WP. As shown in Figure 18, based on simulation, all WPs achieve a total efficiency exceeding 90%.
Figure 18.
Efficiency for reconstructing and identifying muons using the ‘Loose’ (black), ‘Medium’ (red), and ‘Tight’ (blue) identification WPs in the barrel (left) and end-cap (right) regions of the detector as a function of the muon . The black points are consistent with and largely covered by the red points. The results are based on Monte Carlo simulation [14].
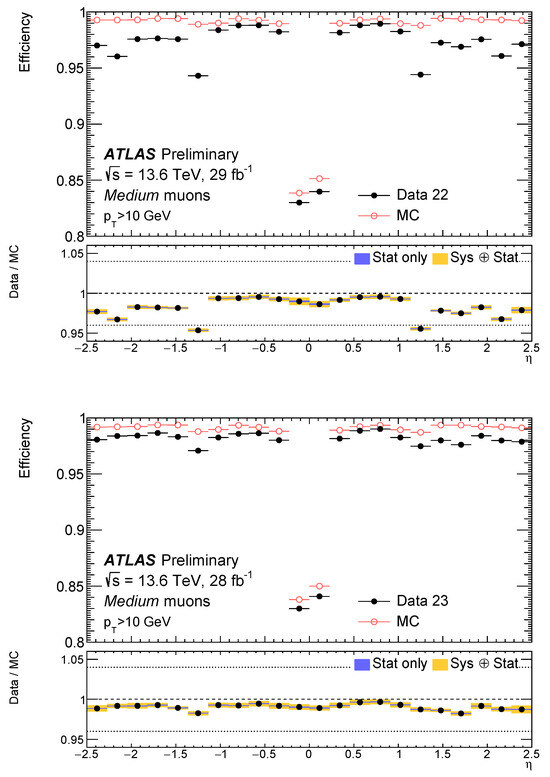
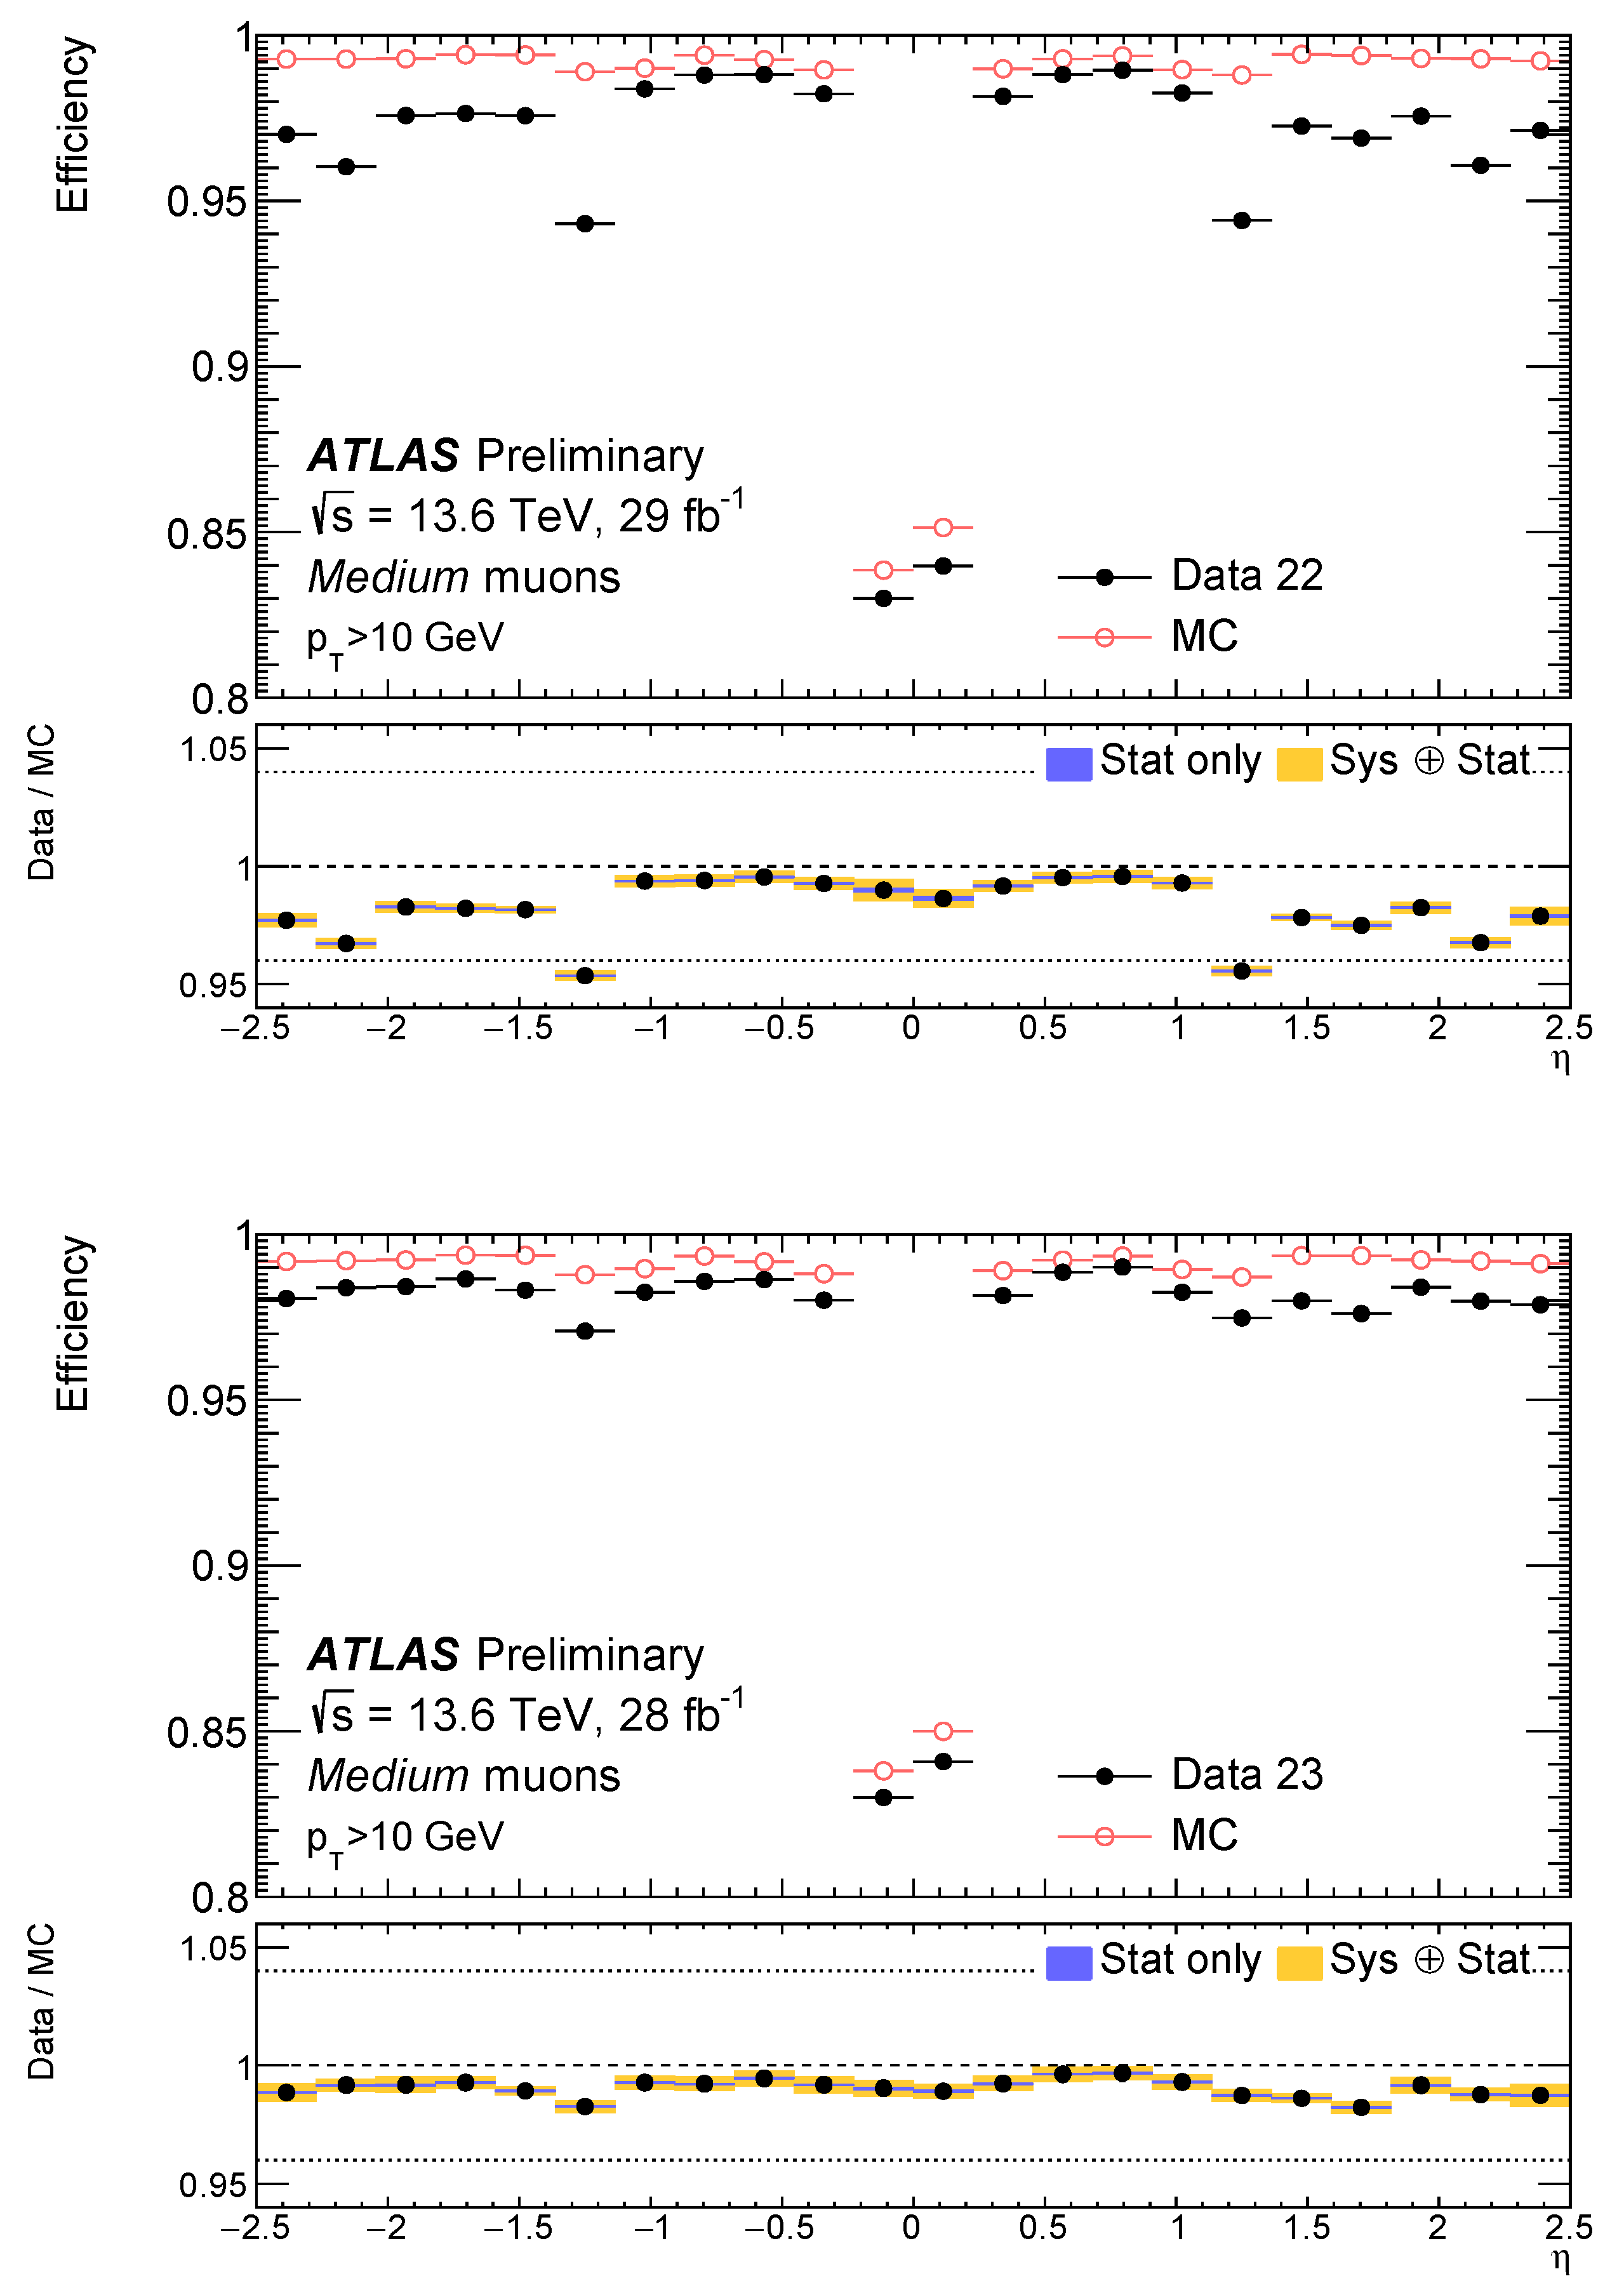
The muon efficiency for above 10 GeV, evaluated using both data and simulation from events, is shown in Figure 19. Compared to the periods before the NSW installation, an improvement in efficiency is observed in the end-cap region. The small acceptance hole around is caused by the limited coverage of the MS. Overall, the efficiency remains above 95% across the entire range and shows good agreement between data and simulation, demonstrating the robustness of the muon performance after the NSW upgrade.
Figure 19.
Efficiency for reconstructing and identifying muons with > 10 GeV using the Medium identification working point, measured in events as a function of pseudorapidity (). The efficiencies are shown for the 2022 (29 , left) and 2023 (28 , right) data. Black dots show the efficiencies measured in the data and red circles show simulation predictions. The lower panels show data-to-simulation ratios with statistical (blue) and total (yellow) uncertainties. Only a small fraction of the 2022 data included hits from the NSW, while it was fully integrated in 2023, resulting in improved efficiency in the end-cap region [14].
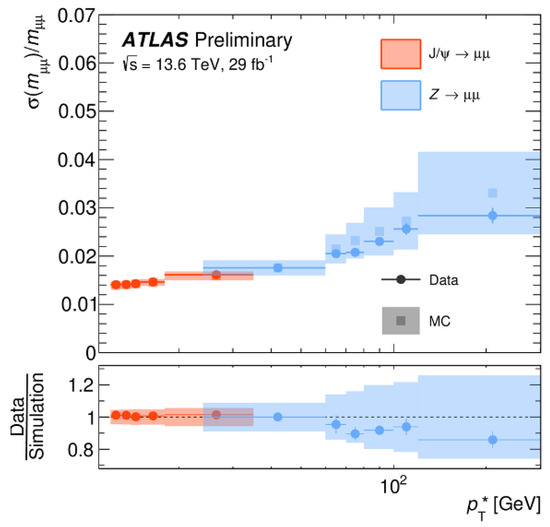
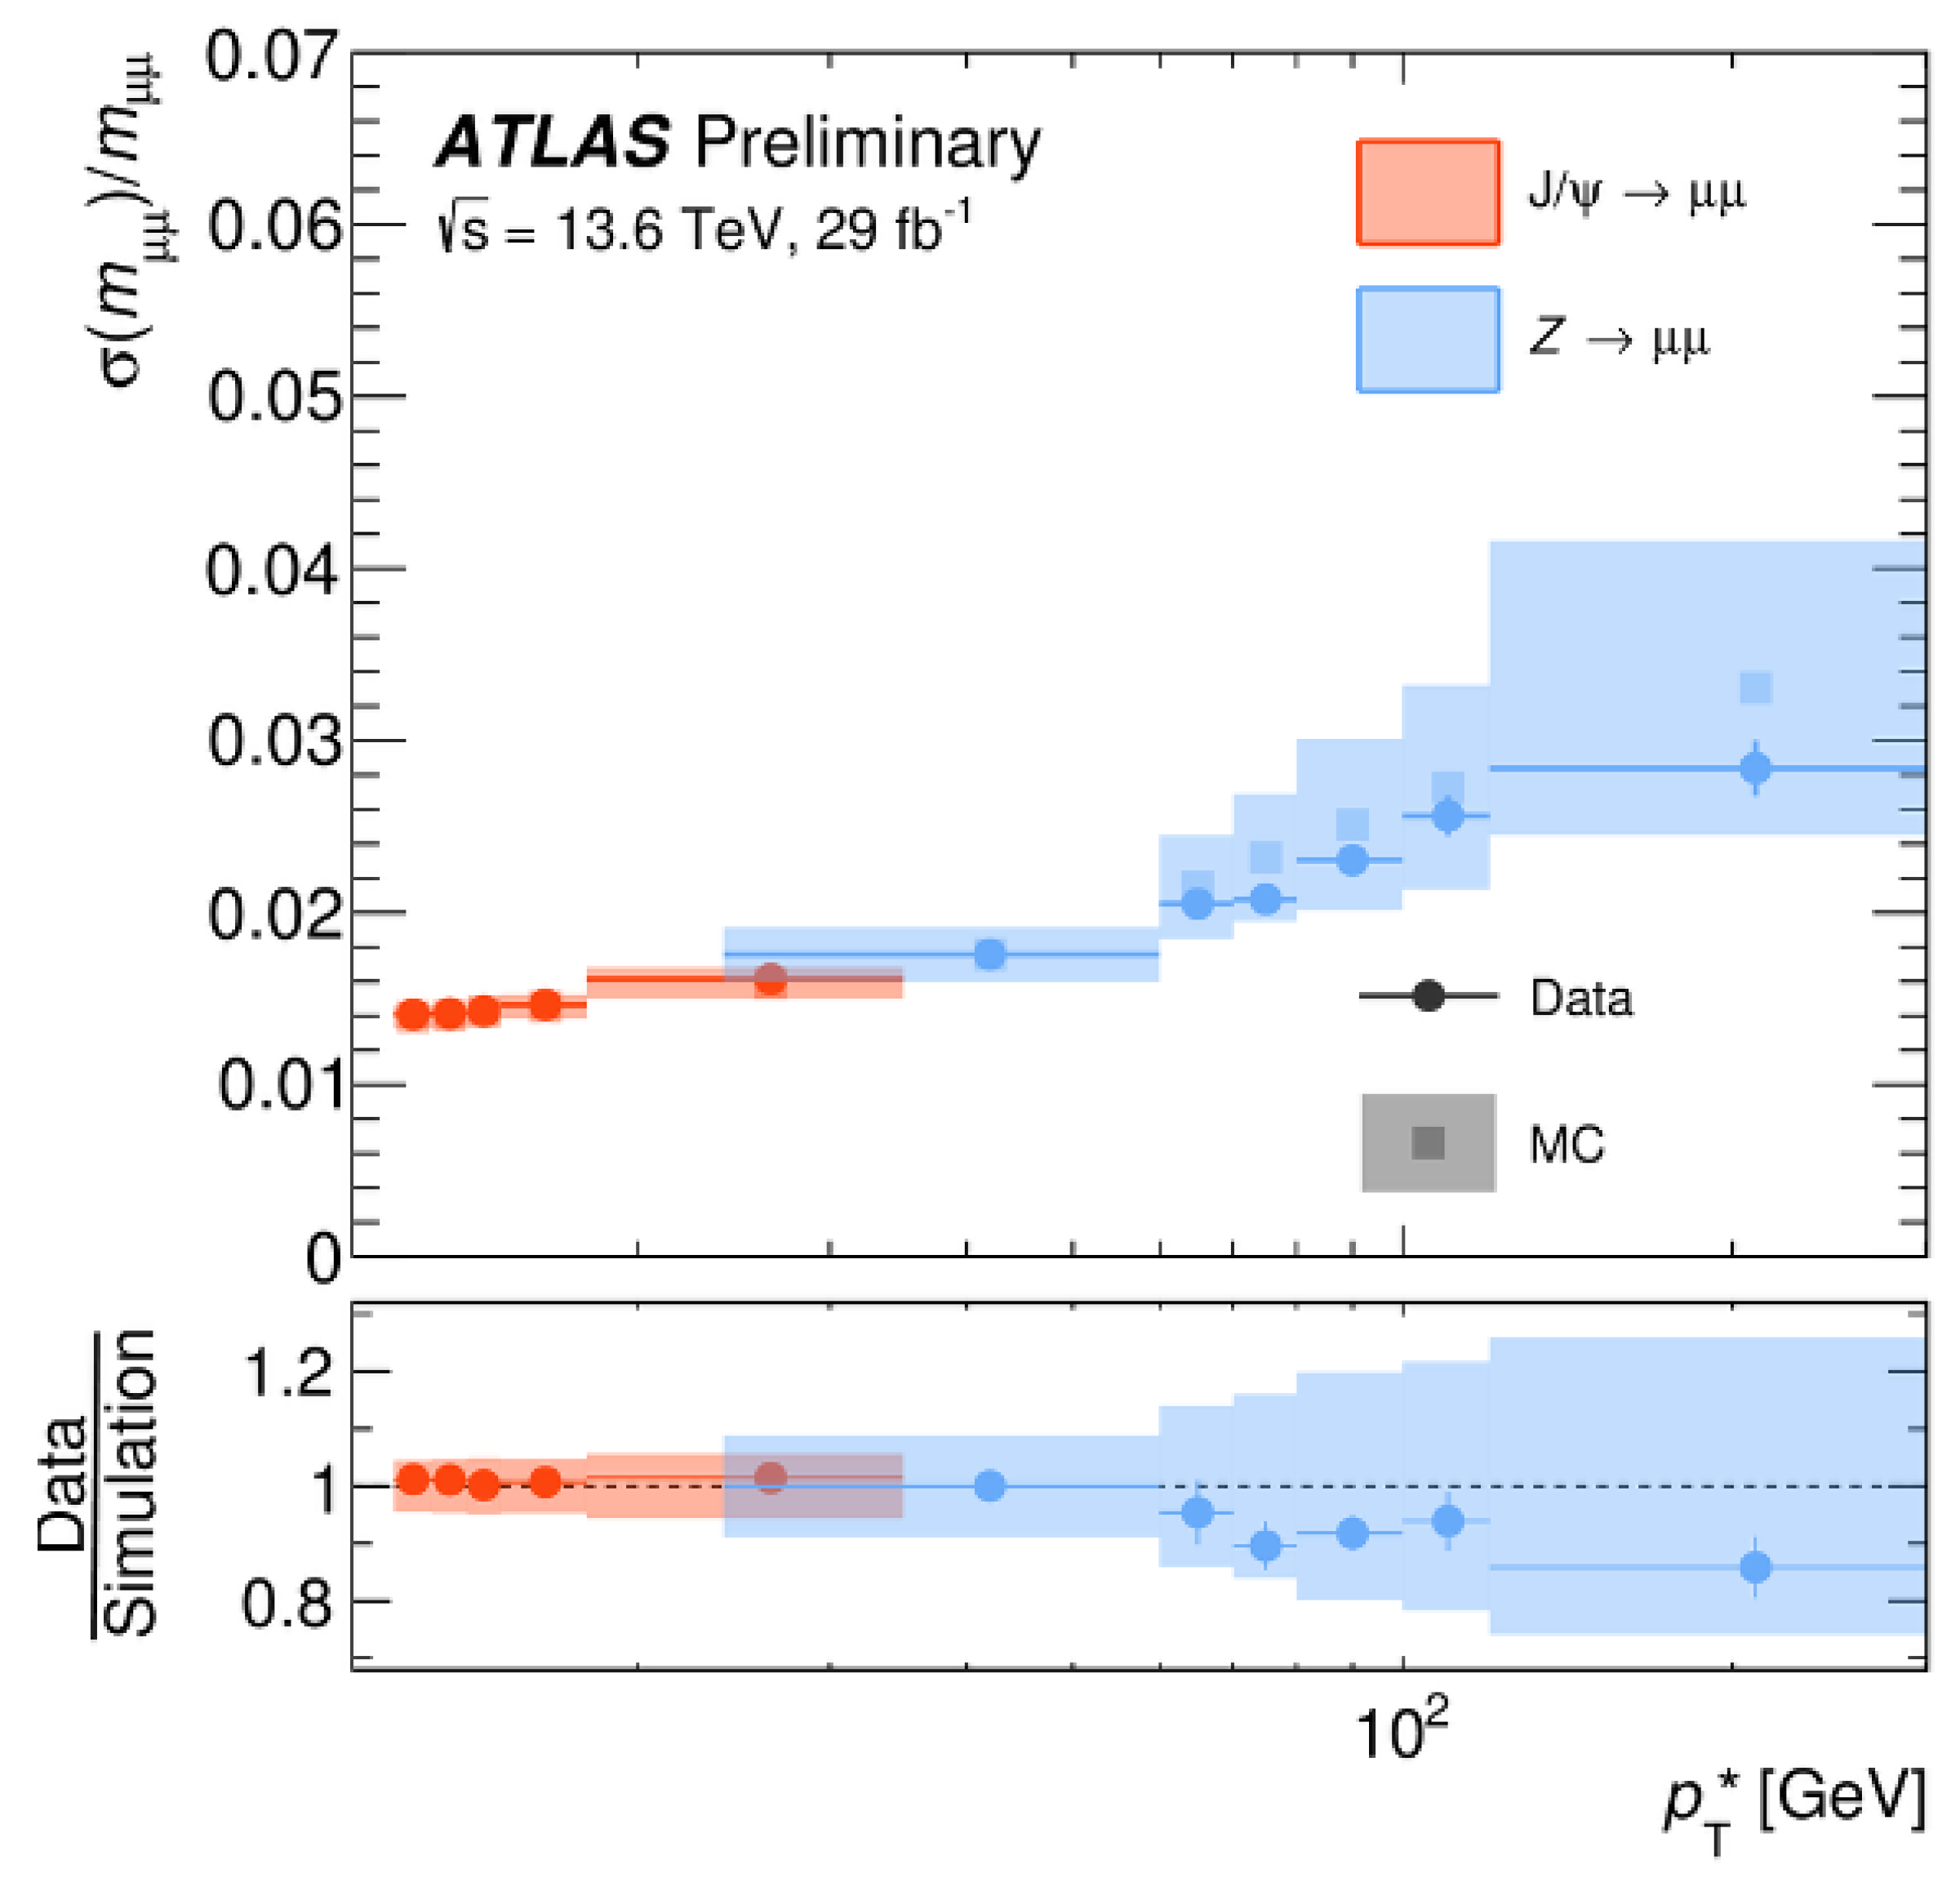
In addition, for the 2024 Run 3 dataset, a new alignment of the ATLAS MS was performed. This updated alignment was derived using cosmic-ray and collision data collected during 2022–2023 with the magnetic field turned off, providing improved constraints on the detector geometry. As a result, the alignment precision was significantly enhanced, reaching the target range of 30–100 m. Such an accurate alignment directly contributes to improved momentum resolution for reconstructed muons. The plot in Figure 20 shows the relative dimuon mass resolution evaluated using and events as a function of . This variable is defined from the dimuon opening angle () and the polar angles () of the two muons as , where is a fixed value corresponding to the known mass of Z or resonance. The resolution varies between approximately 1.2% and 4.0%, depending on , demonstrating the effectiveness of the updated alignment procedure.
Figure 20.
Dimuon mass resolution for CB muons evaluated for and events, shown as a function of , a -like scale derived from the dimuon geometry. Results from the 2022 data (29 ) and the MC simulation reweighted to match luminosity and are compared. Error bars and bands represent statistical and systematic uncertainties, respectively [14].
6. Conclusions
Since the start of Run 3 in 2022, the ATLAS experiment has been taking data from proton–proton collisions at a center-of-mass energy of 13.6 TeV and under the highest luminosity conditions ever achieved at the LHC. Towards Run 3, the ATLAS MS was upgraded with the installation of the NSW as a new inner end-cap detector, complementing the long-standing established detectors that have been in operation for over a decade. This upgrade also served as preparation for the upcoming HL-LHC era starting in 2030, aiming to improve muon tracking and trigger performance under high-background conditions and to reduce fake muon triggers. The established detectors continue to operate reliably thanks to annual maintenance and ongoing efforts to adopt more environmentally friendly gas mixtures. These efforts have ensured high efficiency and stable performance. The NSW was gradually integrated into the trigger system, and full integration across all sectors was completed in 2024. As intended, the NSW has contributed significantly to both tracking and triggering. Based on Run 3 collision data, we achieve a 56% reduction in fake muon trigger rates. Furthermore, the improved alignment of the muon chambers provides improved constraints on the detector geometry and is expected to contribute to better momentum resolution, and further improvements are expected through enhanced NSW-based reconstruction techniques. In 2025, ATLAS achieved its highest-ever recording efficiency, and data-taking continues smoothly toward the conclusion of Run 3 in June 2026, steadily increasing the collected data statistics.
Funding
This research received no external funding.
Data Availability Statement
The data used in this study are available from the ATLAS Collaboration subject to its data access policies.
Conflicts of Interest
The author declares no conflicts of interest.
References
- ATLAS Collaboration. Technical Design Report for the Phase-II Upgrade of the ATLAS Trigger and Data Acquisition System. CERN-LHCC-2017-020, ATLAS-TDR-029 (2017). Available online: https://cds.cern.ch/record/2285584 (accessed on 1 March 2026).
- The ATLAS Collaboration. ATLAS Muon Spectrometer Technical Design Report; CERN-LHCC-97-22, ATLAS-TDR-10; CERN: Geneva, Switzerland, 1997; Available online: https://cds.cern.ch/record/331068 (accessed on 1 March 2026).
- ATLAS Collaboration. ATLAS Detector Schematics; CERN Document Server, Report No. ATLAS-OUTREACH-2021-075; CERN: Geneva, Switzerland, 2021; Available online: https://cds.cern.ch/record/2777214 (accessed on 1 March 2026).
- The ATLAS Collaboration. The ATLAS Experiment at the CERN Large Hadron Collider. J. Instrum. 2008, 3, S08003. [Google Scholar] [CrossRef] [Scilit]
- Codina, E.P. ATLAS New Small Wheel performance studies with first data of LHC Run 3. In Proceedings of the 14th International Conference on Technology and Instrumentation in Particle Physics (TIPP 2023), Cape Town, South Africa, 4–8 September 2023; SISSA Medialab: Trieste, Italy, 2025; Available online: https://indico.tlabs.ac.za/event/112/contributions/3252/attachments/1142/1545/NSW_ATLAS_TIPP23_Estel_v5.pdf (accessed on 1 March 2026).
- Manthos, I.; Maniatis, I.; Maznas, I.; Tsopoulou, M.; Paschalias, P.; Koutsosimos, T.; Kompogiannis, S.; Petridou, C.; Tzamarias, S.E.; Kordas, K.; et al. The Micromegas project for the ATLAS new small wheel. AIP Conf. Proc. 2019, 2075, 080010. [Google Scholar] [CrossRef] [Scilit]
- Simsek, S. Performance and longevity of ATLAS RPCs with new lower GWP mixtures. Nucl. Instrum. Meth. A 2025, 1079, 170618. [Google Scholar] [CrossRef] [Scilit]
- Simsek, S. Mitigation of the ATLAS RPC environmental impact. In Proceedings of the 42nd International Conference on High Energy Physics (ICHEP2024), Prague, Czech Republic, 18–24 July 2024; SISSA Medialab: Trieste, Italy, 2025; Available online: https://pos.sissa.it/476/1238 (accessed on 1 March 2026).
- ATLAS Collaboration. L1 Muon Endcap Inner-Coincidence Performance Plots in 2024. Available online: https://twiki.cern.ch/twiki/bin/view/AtlasPublic/L1MuonTriggerPublicResults (accessed on 1 March 2026).
- ATLAS Collaboration. New Small Wheel Detector Performance with Early 2024 Data. Available online: https://atlas.web.cern.ch/Atlas/GROUPS/MUON/PLOTS/MDET-2024-02/ (accessed on 1 March 2026).
- Su, S.; on behalf of the ATLAS Collaboration. Performance of the ATLAS RPC Detector and Level-1 Muon Barrel Trigger with a New CO2-Based Gas Mixture. Available online: https://cds.cern.ch/record/2919192 (accessed on 1 March 2026).
- ATLAS Collaboration. Studies of the Muon Momentum Calibration and Performance of the ATLAS Detector with pp Collisions at = 13 TeV. Eur. Phys. J. C 2023, 83, 686. [Google Scholar] [CrossRef] [Scilit]
- Cieri, D. Muon reconstruction performance with the ATLAS experiment at the LHC using Run 3 pp collision data. In Proceedings of the 31st International Workshop on Deep Inelastic Scattering (DIS 2024), Grenoble, France, 8–12 April 2024; SISSA Medialab: Trieste, Italy, 2025; Available online: https://lpsc-indico.in2p3.fr/event/3268/sessions/1111/#20240409 (accessed on 1 March 2026).
- ATLAS Collaboration. Muon Reconstruction and Identification Performance of the ATLAS Detector Using 2022 and 2023 LHC pp Collision Data at =13.6 TeV. Available online: https://atlas.web.cern.ch/Atlas/GROUPS/PHYSICS/PLOTS/MUON-2023-02/index.php (accessed on 1 March 2026).
Disclaimer/Publisher’s Note: The statements, opinions and data contained in all publications are solely those of the individual author(s) and contributor(s) and not of MDPI and/or the editor(s). MDPI and/or the editor(s) disclaim responsibility for any injury to people or property resulting from any ideas, methods, instructions or products referred to in the content. |
© 2026 by the author. Licensee MDPI, Basel, Switzerland. This article is an open access article distributed under the terms and conditions of the Creative Commons Attribution (CC BY) license.