


Abstract
Burned-area totals are useful for national monitoring, but they do not reveal how, when or under what social and ecological conditions a landscape burns. We developed an event-based fire-regime and stewardship framework for Eswatini, a topographically compressed southern African country where protected areas, communal rangelands, cropland margins, plantation landscapes and peri-urban interfaces occur in close proximity. Global Fire Atlas event histories for 2001–2025 were organised by fire year and intersected with approximately 10 km2 hexagonal units. The burned-area rate, event frequency, recurrence, seasonality, large-fire dominance, pyrodiversity and trend were used to classify fire-regime types independently of socio-ecological predictors. An XGBoost regression model, evaluated on a 20% held-out test set, was interpreted using exact TreeSHAP diagnostics. Fire activity was strongly seasonal: July–September accounted for 78.2% of the burned area, with August alone accounting for 34.2%. Eight fire-regime types were identified, ranging from low-information and episodic units to frequent small-fire mosaics, large-fire-dominated areas and emerging burned-area intensification regimes. The burned-area-rate model performed well on held-out data (R2 = 0.71; Spearman rho = 0.75). Human modification, goat density, elevation, forest probability, fuelwood dependence and precipitation seasonality ranked among the most influential predictors, but their fitted effects were non-linear and often bidirectional. The combined diagnostics supported six adaptive management zones covering protected-area stewardship, conservation-sensitive management, settlement–livelihood interfaces, late-season risk reduction, monitoring and integrated landscape management. Although the Eswatini results are context-specific, the workflow offers a transferable way to connect fire histories, socio-ecological contexts and place-based stewardship in African mosaic landscapes.
1. Introduction
Fire is both an ecological process and a human practice. It consumes biomass, filters vegetation, releases atmospheric emissions and is used to manage grazing, crops, access and risk [1,2,3,4,5]. Fire occurrence, however, is not the same as a fire regime. A fire regime describes the characteristic timing, frequency, extent and pattern of burning, together with the social and ecological setting in which it occurs.
This distinction exposes the central problem addressed here. Burned-area totals are measurable and comparable, but they compress very different patterns into one number. The same annual total may arise from many small recurrent burns, a few large events, concentrated late-season burning or a heterogeneous mixed-season mosaic. These patterns differ in ecological effect, livelihood meaning and management demand. The issue is therefore not whether burned-area products are useful but whether totals are interpreted as if they fully describe a fire regime. Pyrogeography addresses this wider pattern by examining how climate, fuel continuity, vegetation structure, topography and human activity combine to produce distinct pyromes [4,5,6,7,8,9,10].
This distinction matters, especially in Africa. Grasslands, savannas and scrublands account for a large share of the global burned area, yet many agricultural, pastoral and settlement-adjacent fires are small enough to be missed or under-represented by coarse-resolution products [11,12,13,14,15]. Continental fire datasets remain indispensable because they provide repeated, spatially complete observations over long periods [15,16,17,18,19,20,21]. Their management value increases when the burned area is disaggregated into regime dimensions—frequency, recurrence, timing, event-size structure and trend. Without that step, landscapes dominated by frequent small livelihood fires may be treated like landscapes dominated by infrequent large late-season events even though their consequences and required responses can differ sharply.
African fire research also cautions against treating fire as uniformly destructive. In savanna protected areas, complete exclusion can be ecologically inappropriate and difficult to sustain. In communal landscapes, burning may be embedded in grazing, hunting, crop-residue management and access to ecosystem goods [22,23,24,25]. The practical choice is therefore not simply fire or no fire; it is to distinguish among ecologically functional, livelihood-associated, hazardous and poorly observed regimes. This approach is consistent with work on pyrodiversity, Indigenous and community fire management, coexistence with wildfire and socially credible governance [26,27,28,29].
The biophysical setting still matters. Rainfall, herbivory, soils, woody cover and fire feedbacks regulate African savannas, but their relative influence changes across regions and local environmental gradients [8,9,10]. Composite risk scores can help screen large areas, yet a single score can hide whether high fire activity reflects recurrence, late-season timing, large-event dominance or a particular intersection with ecological sensitivity and human exposure. A wetland, high-elevation grassland, protected woodland, plantation edge and peri-urban rangeland should not be interpreted from the burned area alone.
Eswatini is a compact but demanding test of this argument. Over a short west–east distance, the country grades from cool highveld grasslands and plantation landscapes, through middleveld mosaics to warmer lowveld savannas and the Lubombo range. Fire intersects with biodiversity conservation, livestock-based livelihoods, fuelwood dependence, rain-fed agriculture, urban expansion, invasive alien plants and protected-area management [30,31,32,33]. This compressed environmental and social heterogeneity allows the full fire–ecosystem–people workflow to be tested at a management-relevant grain while retaining national coverage.
We therefore developed an event-based, explainable and policy-facing analysis of Eswatini’s fire regimes. The objectives were to (i) reconstruct fire-year histories from individual event perimeters rather than aggregated totals; (ii) derive fire-regime typologies from fire behaviour alone; (iii) identify non-linear associations between socio-ecological predictors and burned-area rates using interpretable machine learning; and (iv) translate the combined evidence into adaptive stewardship zones for field validation, protected-area planning, livelihood-sensitive management and national coordination. The analytical sequence is deliberate: the description of fire behaviour is kept separate from explanation and policy translation, preserving the multidimensional nature of fire rather than reducing it to one risk score.
2. Materials and Methods
2.1. Study Area and Fire-Management Setting
Eswatini is a landlocked southern African country bordered by South Africa and Mozambique. Its fire geography reflects a steep west–east environmental gradient, a dense settlement and road network relative to the national area, and a close mosaic of protected areas, communal land, commercial agriculture, plantations, rangelands and peri-urban spaces. Here, the national fire-management system refers to that entire spatial and institutional mosaic: the places that burn, the land uses and fuel configurations that shape fire, and the conservation, forestry, agricultural, local-government and disaster-risk institutions that respond. Treating the country as one management system does not imply ecological uniformity; it provides a common national frame within which contrasting regimes and stewardship needs can be compared.
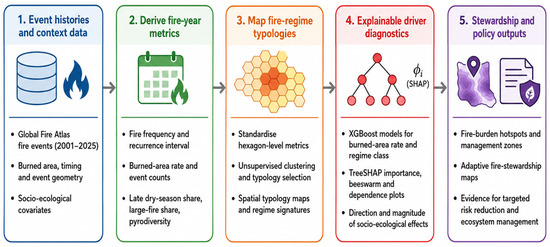
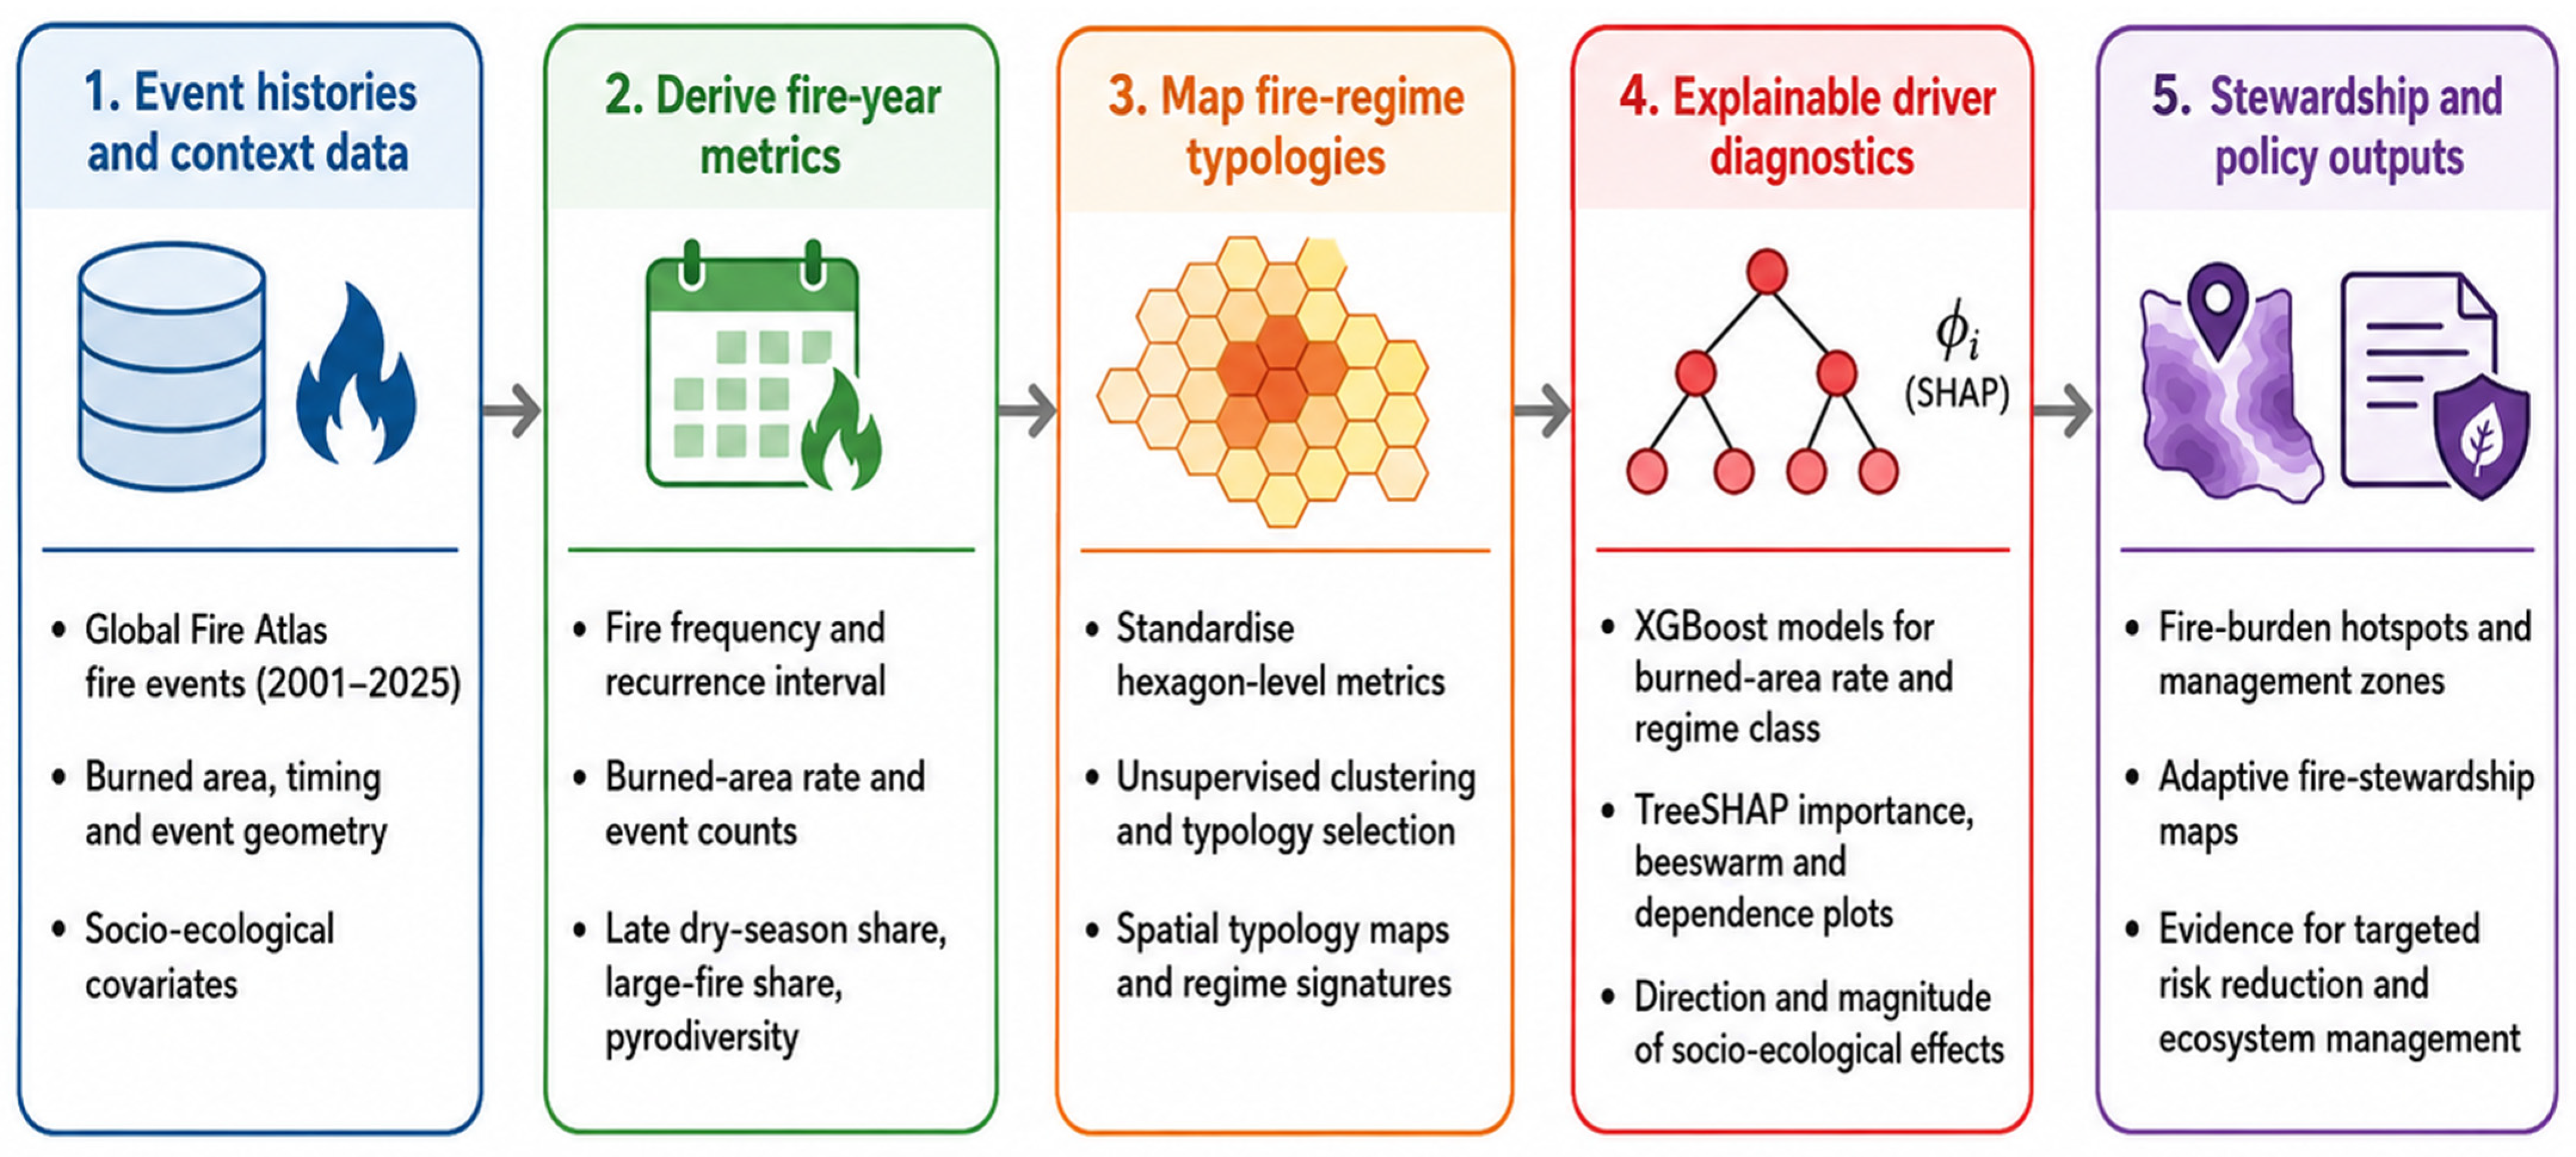
The analysis followed the five stages in Figure 1. First, we compiled fire-event histories and socio-ecological context layers. Second, we reorganised the event record into fire years and calculated hexagon-level regime metrics. Third, we derived fire-regime typologies from fire behaviour alone. Fourth, we screened socio-ecological predictors and fitted explainable models of the burned-area rate without changing the unsupervised typology. Fifth, we combined the two evidence streams for threshold diagnostics, field-validation priorities and stewardship-zone translation. This sequence avoids circular reasoning: the typology records what the fire regime did, and the driver model asks where, and under which observed conditions, the burned-area rate varied.
Figure 1.
Analytical workflow used to move from Global Fire Atlas event histories to fire-year metrics, fire-regime typologies, explainable socio-ecological driver diagnostics and policy-facing fire-stewardship outputs. All analyses and visualizations were conducted using the R software (R Foundation for Statistical Computing, Vienna, Austria).
2.2. Fire-Event Histories and Fire-Year Accounting
The fire-event histories came from the Global Fire Atlas, which reconstructs individual events from the MODIS burned-area record and reports the ignition date, duration, size, daily growth, spread direction and perimeter geometry [16]. The event layer provides a consistent long-term record, but it inherits the limitations of MODIS burned-area observations—small, narrow, short-duration or cloud-obscured burns may be omitted or under-represented [15,17,18,19,20,21]. This is especially important in African landscapes, where small agricultural and livelihood fires can contribute materially to fire activity [11,15].
The event layer was clipped to Eswatini and organised into fire years. Because the main burning season follows the dry-season cycle rather than the calendar year, each fire year ran from May to April. Events ignited from May to December were assigned to the calendar year of ignition; events from January to April were assigned to the preceding fire year. This convention keeps one dry-season cycle within a single reporting year.
2.3. Hexagonal Fire-Regime Units and Fire Metrics
The national boundary was projected to WGS 84/UTM Zone 36S and tessellated into clipped hexagons of approximately 10 km2. This grain balances two competing needs: retaining local variation and accumulating enough repeated observations for stable regime summaries. Hexagons provide near-equal neighbourhood geometry, reduce directional artefacts associated with square grids and are more practical for field planning than individual satellite pixels. The selected grain is an analytical choice, not a natural management boundary, and its scale dependence is addressed in the limitations [34,35].
Fire-event perimeters were intersected with the hexagonal grid. The burned area was defined as the mapped event-perimeter area falling within a hexagon during a given fire year. From the resulting hexagon-by-fire-year histories, we calculated the total burned area, mean annual burned-area rate, mean event frequency, active fire-year share, approximate fire-year recurrence interval, late dry-season event share, large-fire share, burned-area trend and pyrodiversity. Pyrodiversity was expressed as normalised diversity across fire-season and fire-size combinations, following the information-theory logic of Shannon diversity and evenness [36,37,38]. Table 1 gives the operational definition and management rationale for each metric.
Table 1.
Fire-regime metrics used to describe each hexagonal unit before socio-ecological predictors were introduced.
2.4. Fire-Regime Typology
Fire-regime types were derived only from fire metrics; socio-ecological predictors played no role in class assignment. Metrics for active-fire hexagons were standardised and clustered using k-means. Hexagons with no recorded fire were retained as a separate no-recorded-fire/low-information class rather than forced into an active-fire cluster. Candidate solutions were compared using average silhouette diagnostics and repeated-start stability checks [39,40,41]. The retained solution comprised seven active-fire clusters plus the low-information class, giving eight types. Labels were assigned after examining cluster medians, standardised profiles, distribution-sensitive plots and mapped geography. They therefore summarise empirical signatures rather than prespecified ecological categories.
2.5. Socio-Ecological Context, Composite Indices and Driver Screening
Socio-ecological predictors were aggregated to the same hexagonal grid. The candidate set covered topography, climate seasonality, forest probability, wetland and protected-area shares, road density, night-time lights, population density, urban share, rain-fed and irrigated cropland, rangelands, livestock density, fuelwood dependence, poverty, invasive alien plant pressure, carbon stock and human modification. Selection drew on African studies of humanised fire patterns and established spatial products for human modification, night-time lights, forest cover, land cover, rainfall, climate, reanalysis and human footprint [42,43,44,45,46,47,48,49,50]. Eswatini-specific interpretation used the 2017 Population and Housing Census, national biodiversity plans, the Sixth National Report to the Convention on Biological Diversity and national climate policy [30,31,32,33]. Variables were screened for spatial coverage, near-zero variance and conceptual redundancy. Tree-model predictors remained in their native units; standardised values were used only for composite indices and comparative signature plots.
Composite indices were used to translate multiple layers into transparent stewardship surfaces. Each component was rescaled to the observed national range from 0 to 1 and, where necessary, oriented so that larger values represented greater pressure, exposure or sensitivity. The human-pressure index was the equal-weight mean of population density, road access, open burning, night-time lights and human modification. The livelihood-exposure index combined poverty, fuelwood dependence, livestock density and rain-fed cropland/rangeland indicators. The ecological-sensitivity index combined protected-area, wetland, riparian, forest and biodiversity-sensitivity layers. Equal weighting avoided implying unsupported precision; the component variables were retained for separate interpretation.
Fire pressure combined the rescaled regime dimensions most directly related to management exposure: the burned-area rate, event frequency, active fire-year share, late dry-season share, large-fire share and positive burned-area tendency. The socio-ecological fire-burden index was the equal-weight mean of fire pressure, ecological sensitivity, human pressure and livelihood exposure. The fire–ecosystem–people nexus index retained three conceptual pillars by averaging fire pressure, ecological sensitivity and a people component defined as the mean of human pressure and livelihood exposure. Both indices range from 0 to 1. They are prioritisation aids, not causal constructs and not substitutes for the underlying metrics.
2.6. Explainable Modelling of the Burned-Area Rate
We fitted an XGBoost (version 3.2.1.1) regression model to the log1p-transformed burned-area rate using the screened socio-ecological predictors. Gradient boosting was chosen because tree ensembles can represent interactions, thresholds and non-linear responses without imposing one global response form [51,52,53]. The 1832 hexagons were divided into an 80% model-development set (n = 1465) and an untouched 20% test set (n = 367). Candidate combinations of tree depth, learning rate, minimum child weight, row subsampling and column subsampling were compared within the development set using the cross-validated root mean square error; early stopping controlled boosting length. The lowest-error specification was refitted to the full development set and evaluated once on the held-out test set using RMSE, MAE, R2 and Spearman rank correlation.
Exact TreeSHAP values were then calculated for the retained regression model, quantifying each predictor’s contribution to the fitted log1p burned-area-rate prediction for every hexagon [54,55,56]. Global interpretation used the mean absolute SHAP magnitude and beeswarm contribution structure; dependence plots were used to examine non-linearity and potential thresholds. SHAP values explain how the fitted model allocated contributions. They do not identify causal effects, so all process interpretations are presented as hypotheses requiring field and operational evidence.
Interpretation centred on the burned-area-rate regression. A parallel eight-class regime classifier was fitted on the same development/test partition as a diagnostic and evaluated using overall and balanced accuracy. Its held-out performance was weak; it was therefore not used to relabel the unsupervised types or support management conclusions. This distinction is important. The typology describes observed, multidimensional fire behaviour, whereas the regression explains variation in one response dimension: the burned-area rate.
2.7. Empirical Thresholds and Stewardship-Zone Translation
The empirical threshold scan served as a diagnostic prioritisation step. For each continuous predictor or composite index, candidate cut points were tested across the central part of the observed distribution. The score combined the absolute difference in the proportion of high-burden hexagons on either side of a threshold with a balance term that penalised highly unequal splits. These values are separation thresholds for screening and prioritisation, not mechanistic ecological tipping points.
Policy-facing zones were derived through a hierarchical translation of fire-regime typology, seasonality, hotspot score, protected-area share, ecological sensitivity, human pressure and livelihood exposure. Protected-area stewardship was prioritised where active regimes intersected substantial protected-area coverage. Conservation-sensitive management captured other ecologically sensitive landscapes; settlement–livelihood interfaces emphasised high human or livelihood exposure; late-season risk-reduction landscapes emphasised concentrated late dry-season activity and fire hotspots; and low-burn monitoring retained no-recorded-fire and infrequent regimes that require observation rather than automatic classification as low risk. Remaining mixed landscapes formed the integrated landscape-management zone. The translation followed integrated and community-based fire-management principles centred on prevention, preparedness, ecological appropriateness, local legitimacy and learning rather than blanket suppression [57,58,59,60,61]. Each zone is a decision-support class for validation and planning, not a fixed ecological state or an automatic burning prescription.
3. Results
3.1. Seasonal and Interannual Fire Activity
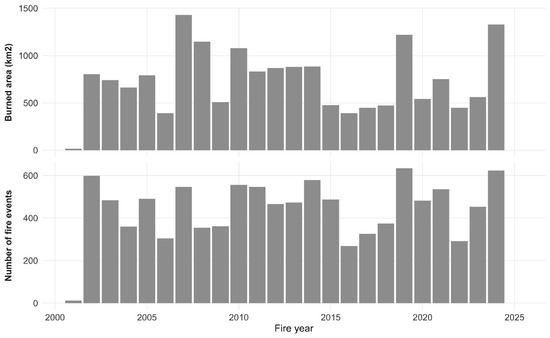
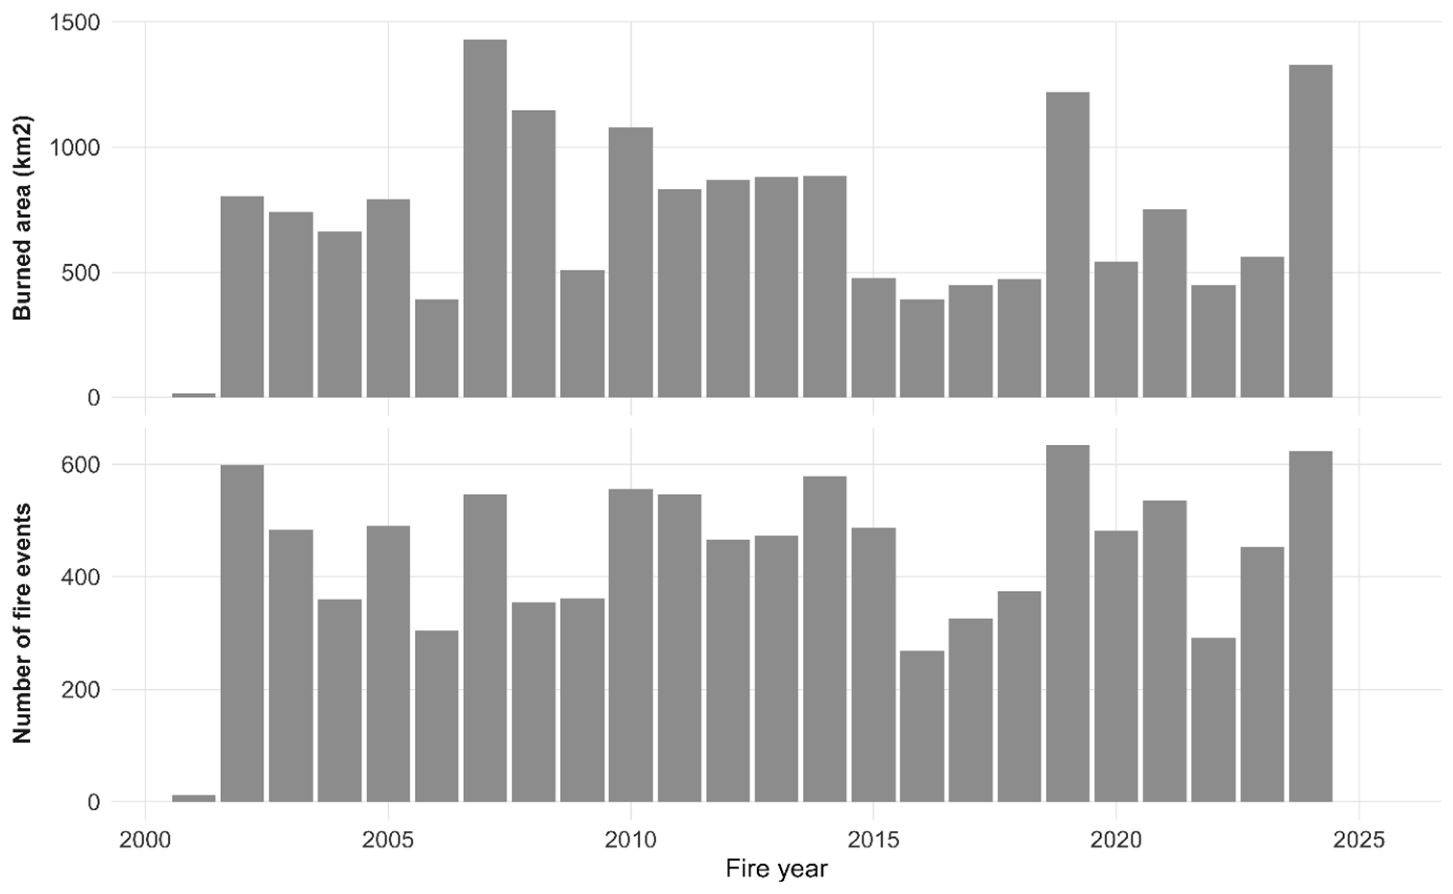
The extraction contained 10,607 fire events and 17,680 km2 of mapped burned area. Because the first and last fire years are incomplete edge years, annual interpretation focused on 2002–2024. Over that period, the mean annual burned area was 768 km2, with marked interannual variation. The burned area peaked in 2007 at 1431 km2, whereas the event count peaked in 2019 at 635 events (Figure 2).
Figure 2.
Fire-year burned area and event counts in Eswatini, 2001–2025.
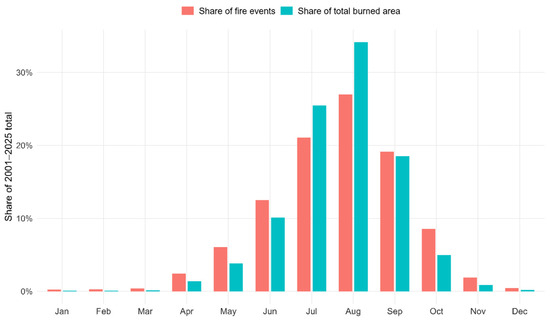
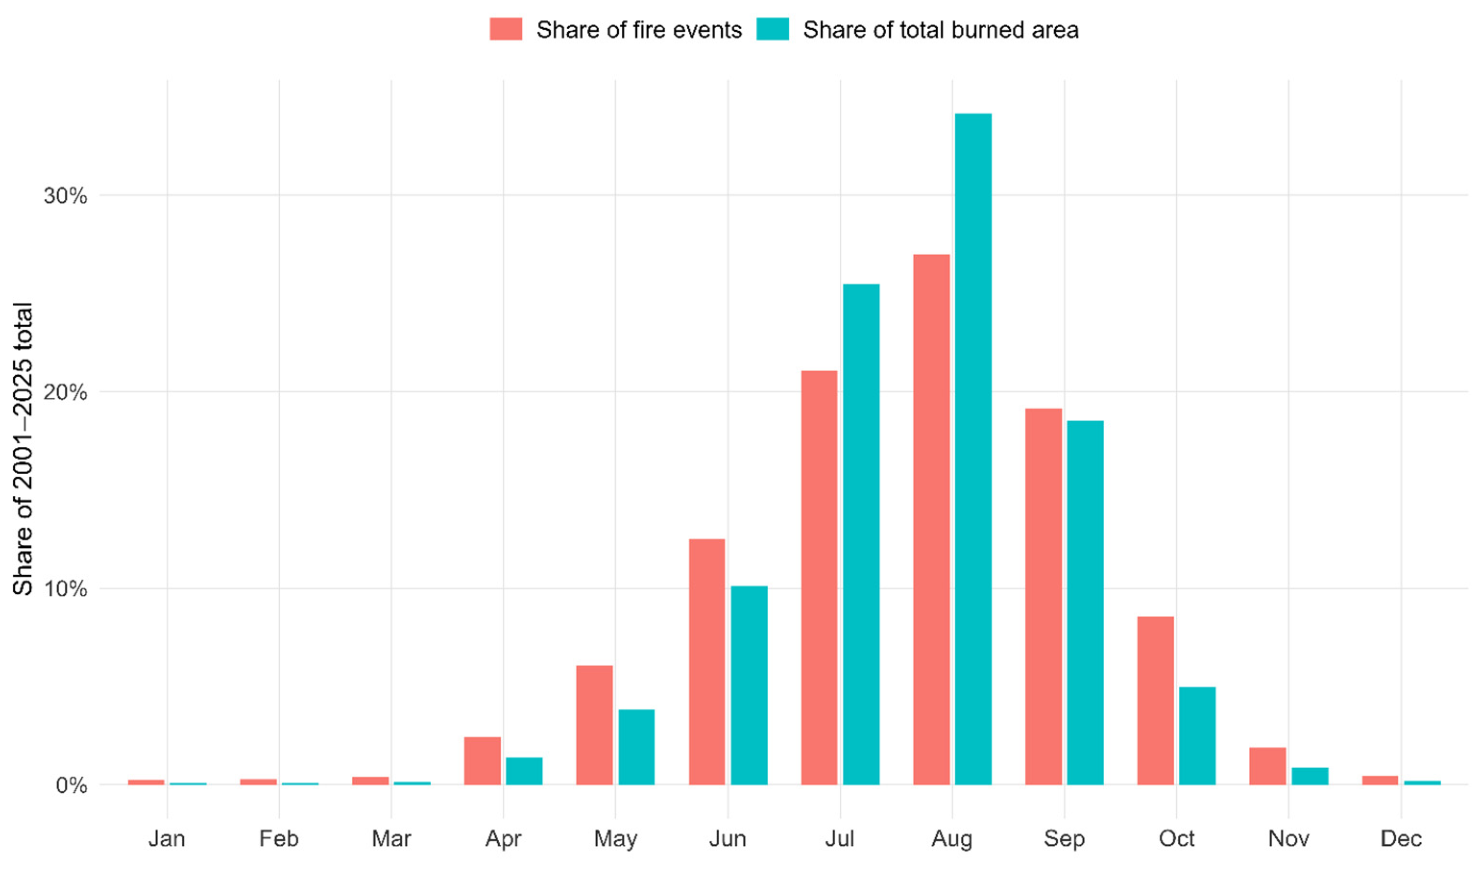
Fire activity was concentrated in a short seasonal window (Figure 3). July–September accounted for 78.2% of the mapped burned area and August alone for 34.2%. The late dry season contributed 57.7% of the burned area and 54.7% of events. This concentration does not mean that every late-season fire was damaging or every earlier fire beneficial; it identifies the period when cured fuels, multiple ignitions and response constraints most often coincide, making preparedness and local interpretation especially important.
Figure 3.
Monthly shares of national burned area and fire-event counts, 2001–2025.
3.2. Fire-Regime Typology
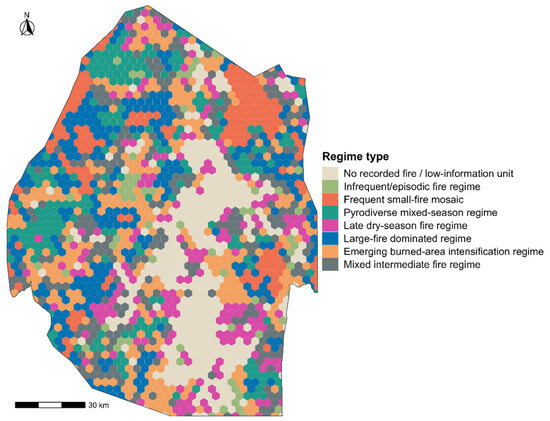
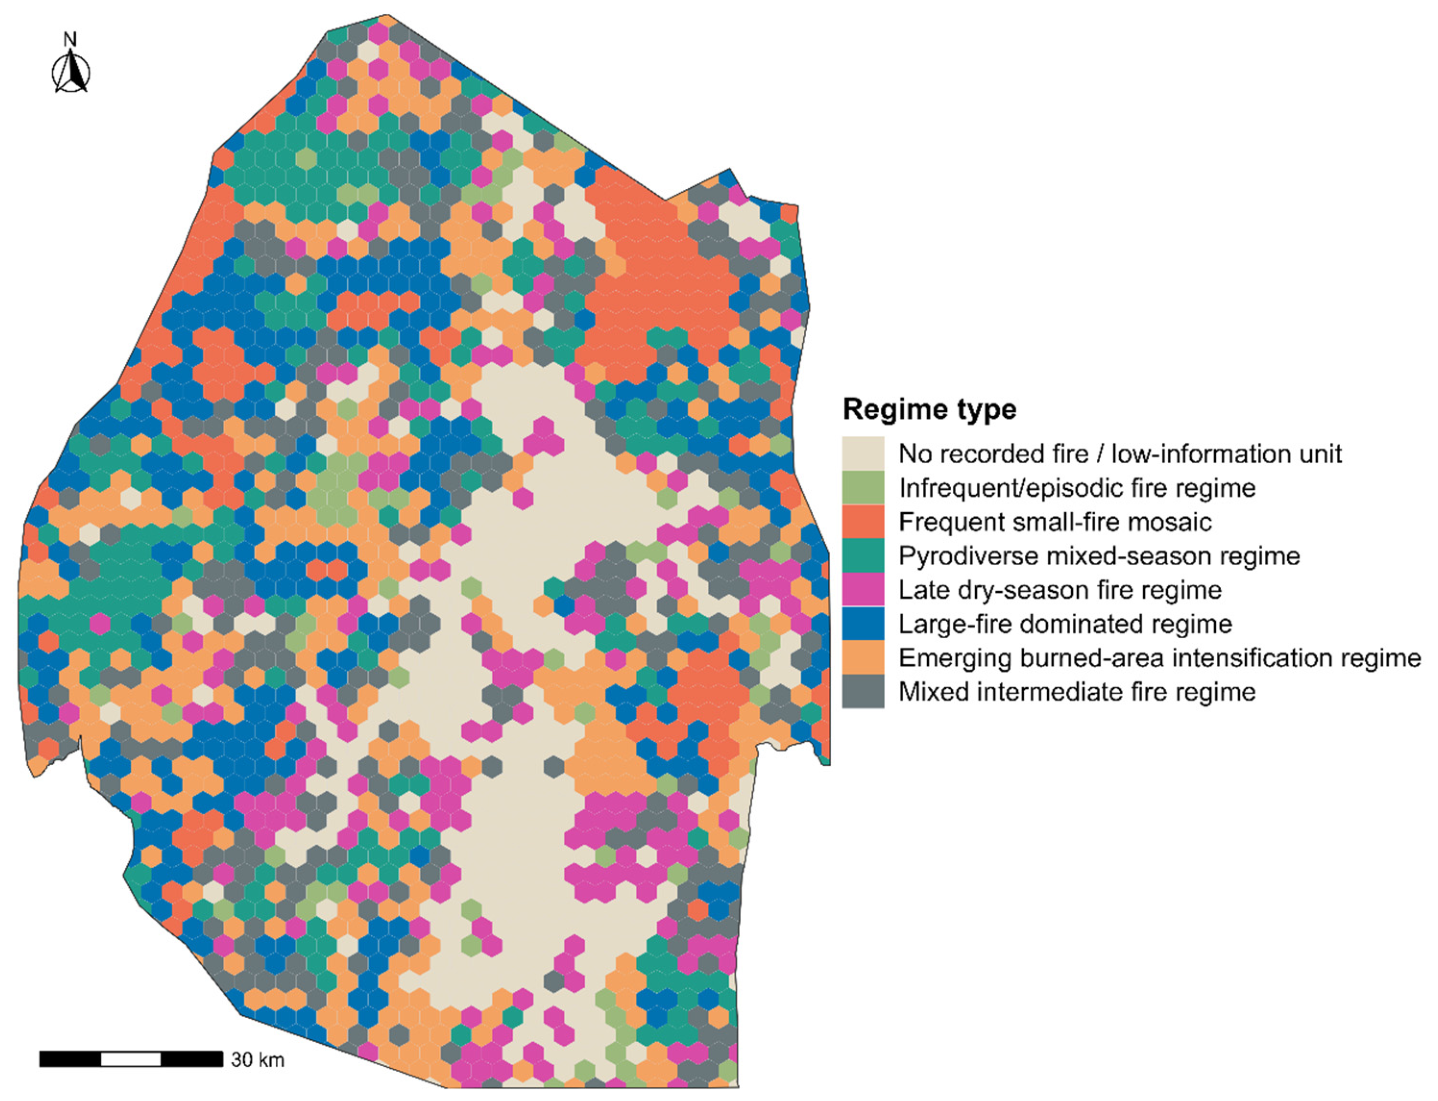
The eight classes represented distinct fire behaviours, not a single low-to-high risk gradient. The typology classified 1832 hexagons covering 17,362 km2 (Figure 4); no-recorded-fire/low-information units occupied 18.4% of the national hex-grid area. Frequent small-fire mosaics combined the highest burned-area rates, event frequencies and active-year shares. Large-fire-dominated regimes paired moderate-to-high burned-area rates with a greater contribution from high-percentile events. Late dry-season regimes were distinguished mainly by timing, whereas emerging intensification regimes combined a modest median burned-area rate with a positive trend (Table 2). The classes therefore separate different pathways to fire pressure rather than ranking every hexagon on one severity scale.
Figure 4.
Fire-regime typologies across Eswatini’s mosaic landscapes. Classes were derived from fire behaviour only; socio-ecological predictors were introduced later for explanation and policy translation.
Table 2.
Median fire-regime signatures by typology class. Class codes: NFI = no recorded fire/low information; INF = infrequent/episodic; FSM = frequent small-fire mosaic; PMS = pyrodiverse mixed season; LDS = late dry season; LFD = large-fire dominated; EBI = emerging burned-area intensification; MIX = mixed intermediate; FYRI = approximate fire-year recurrence interval; BA = burned area.
3.3. Standardised Signatures and Distributions Clarify Typology Contrasts
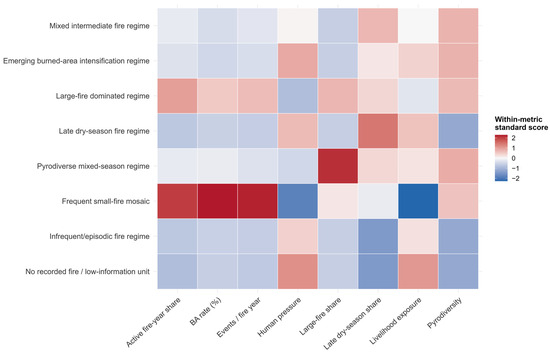
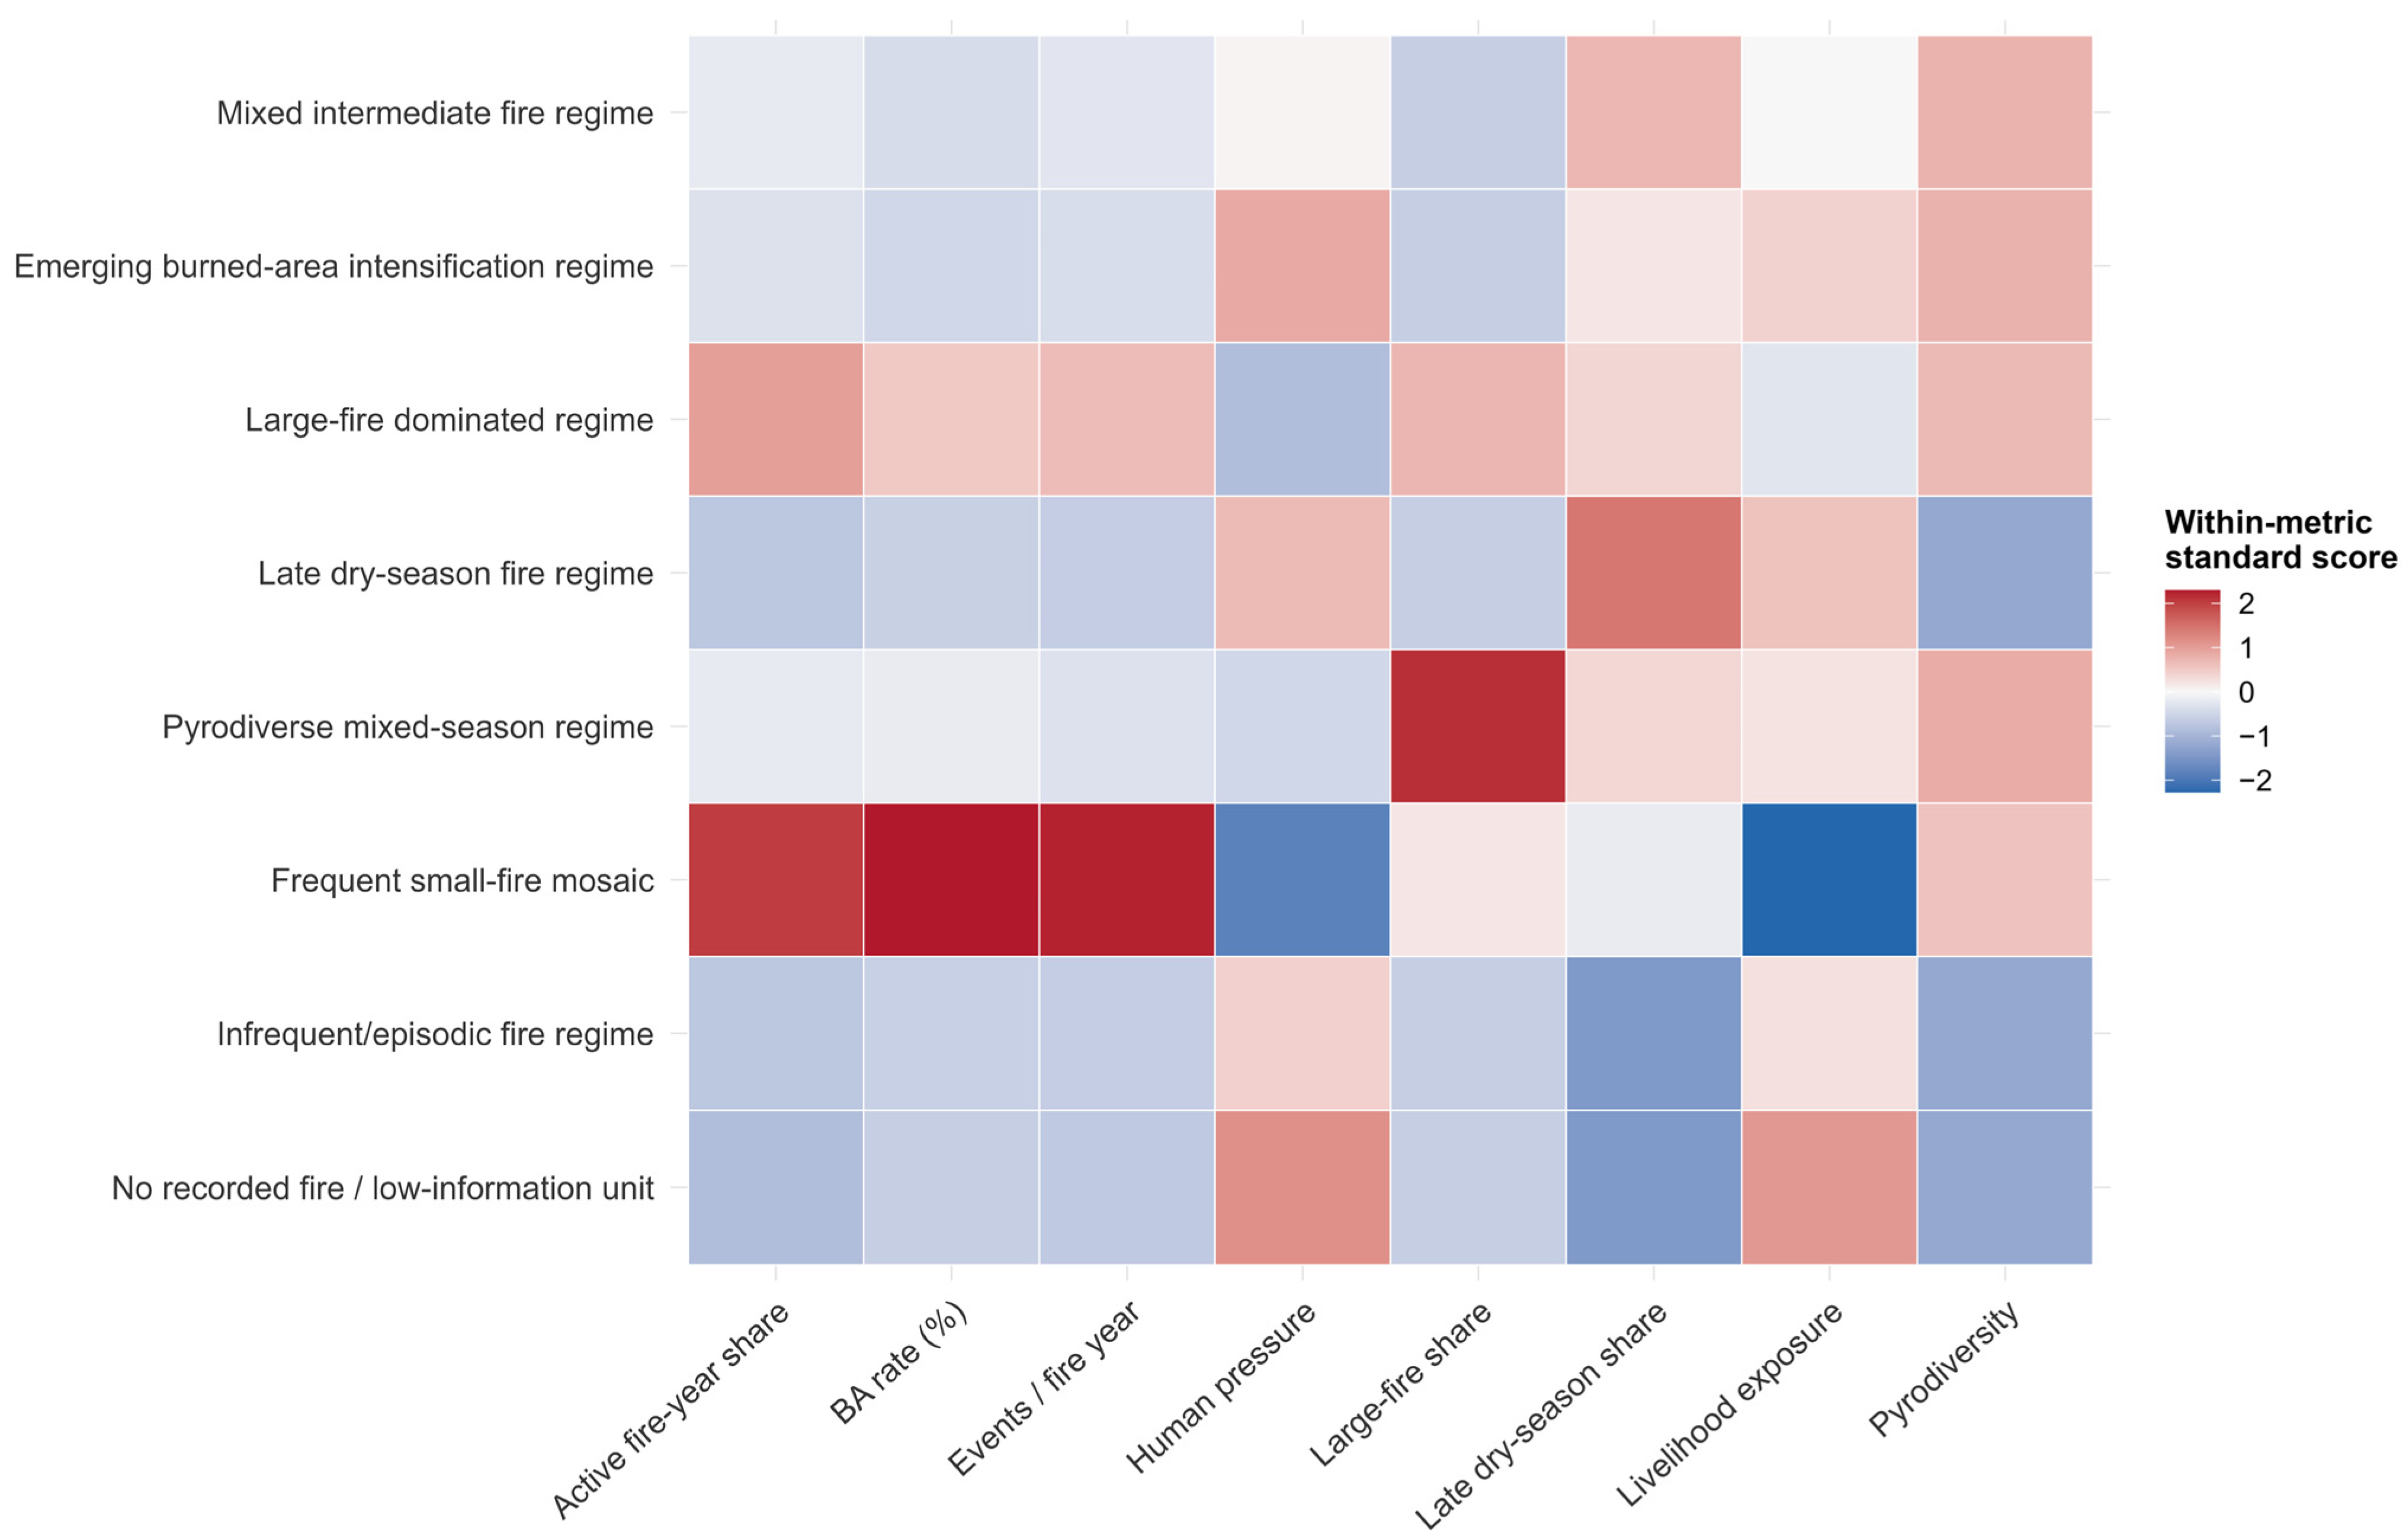
The standardised signature matrix makes the empirical basis of the labels explicit. Frequent small-fire mosaics had the strongest positive scores for active fire-year share, burned-area rate and event frequency but a negative score for livelihood exposure. Pyrodiverse mixed-season regimes were distinguished by high pyrodiversity. Late dry-season regimes were defined by seasonal concentration despite low burned-area and event-frequency scores. Emerging intensification regimes combined above-average human pressure with a positive burned-area tendency but remained distinct from the frequent small-fire mosaic (Figure 5).
Figure 5.
Standardised fire-regime and socio-ecological signatures. Rows are regime types; columns are median metrics standardised within each metric to show relative contrasts.
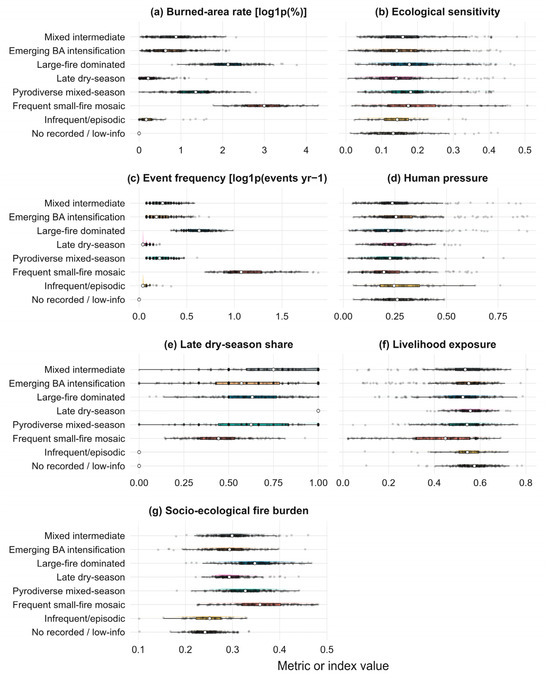
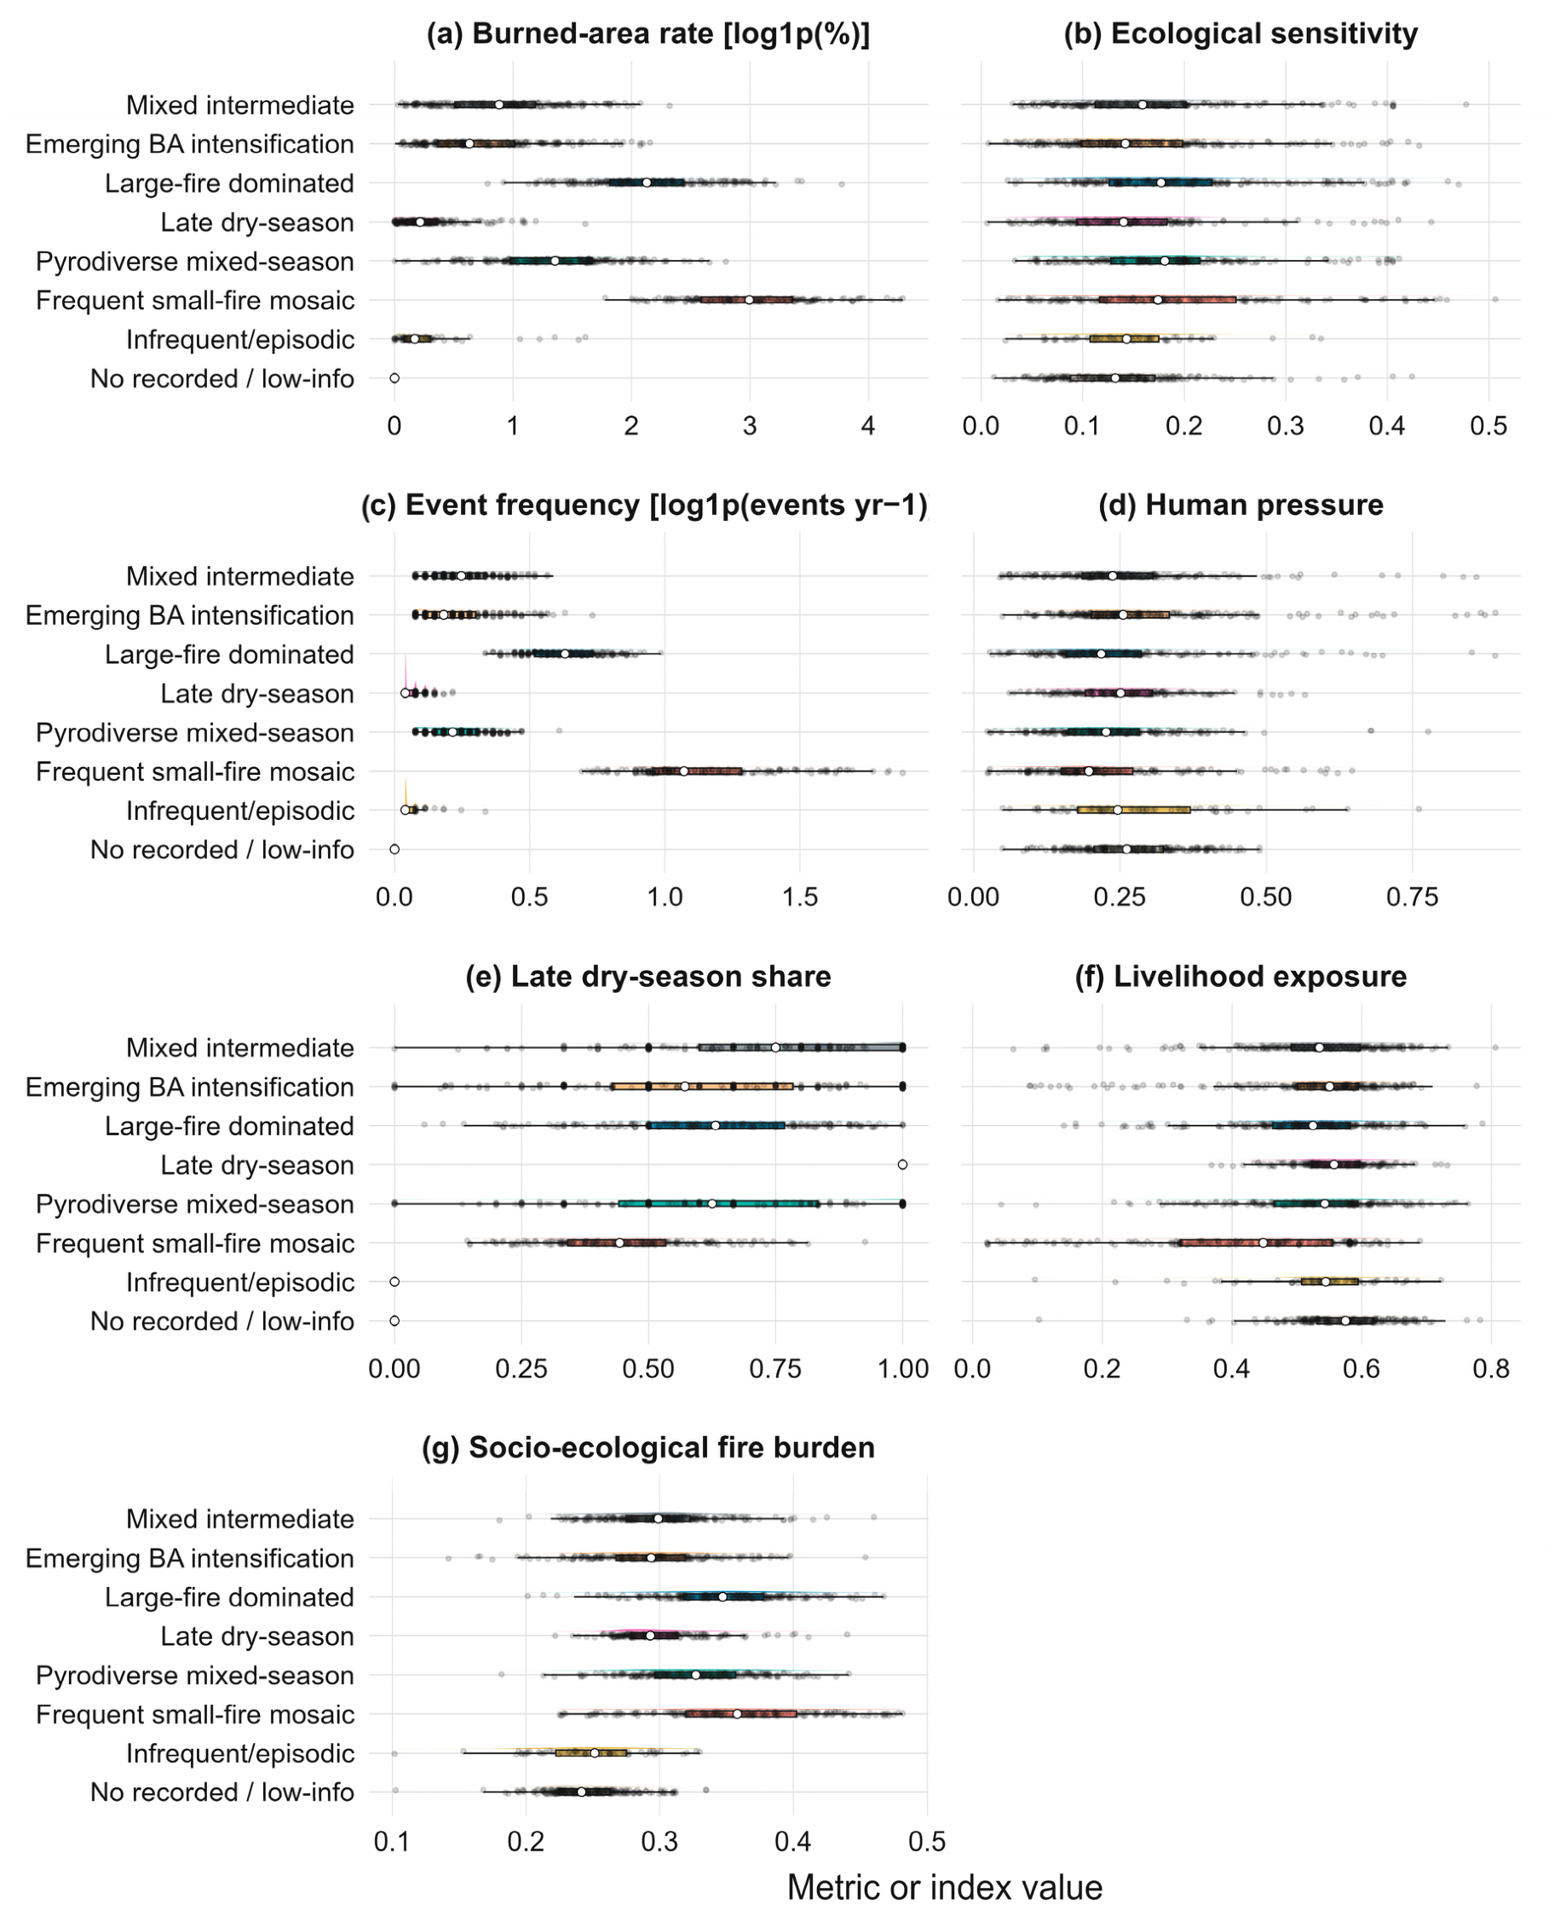
The bean plots show that several contrasts extended across whole distributions rather than being driven by a few outlying hexagons. Frequent small-fire mosaics, for example, were separated from infrequent and low-information classes in both the burned-area rate and event frequency. Livelihood exposure, by contrast, overlapped widely among several regimes. That overlap matters: socio-economic vulnerability cannot be inferred from a fire-behaviour class, reinforcing the decision to keep typology construction separate from socio-ecological interpretation (Figure 6).
Figure 6.
Distribution-sensitive socio-ecological signatures of the fire-regime types. Within each panel, the half-eye density and central box summary use all hexagons, while lightly jittered points show a bounded stratified sample to retain legibility. The white point marks the median. Colours identify the fire-regime classes and are used consistently across panels; they do not encode an additional continuous variable. Broad separation among regime distributions indicates systematic differences, whereas extensive overlap indicates weak discrimination by that metric.
3.4. Explainable Models Identified Non-Linear Socio-Ecological Associations with Burned-Area Rates
On the 367-hexagon held-out test set, the XGBoost model explained substantial variation in burned-area rates (RMSE = 4.21, MAE = 2.37, R2 = 0.71, Spearman rho = 0.75; Table 3). Agreement in both variance explained and rank order indicates that the model captured broad differences rather than only a few extreme observations. The regime classifier, by contrast, had a balanced accuracy of 0.15. This result supports the analytical separation adopted here: socio-ecological covariates helped explain one continuous dimension of fire behaviour but could not reproduce the full multidimensional typology well enough to justify supervised relabelling.
Table 3.
Model diagnostics used to decide which explainable outputs were suitable for scientific interpretation.
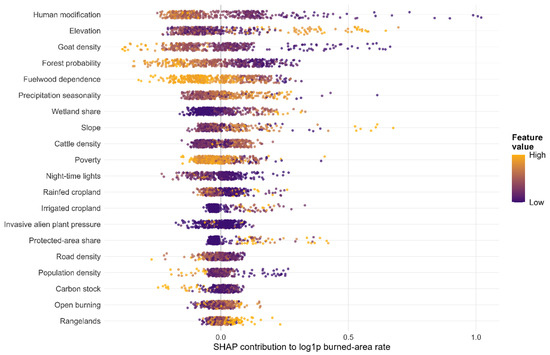
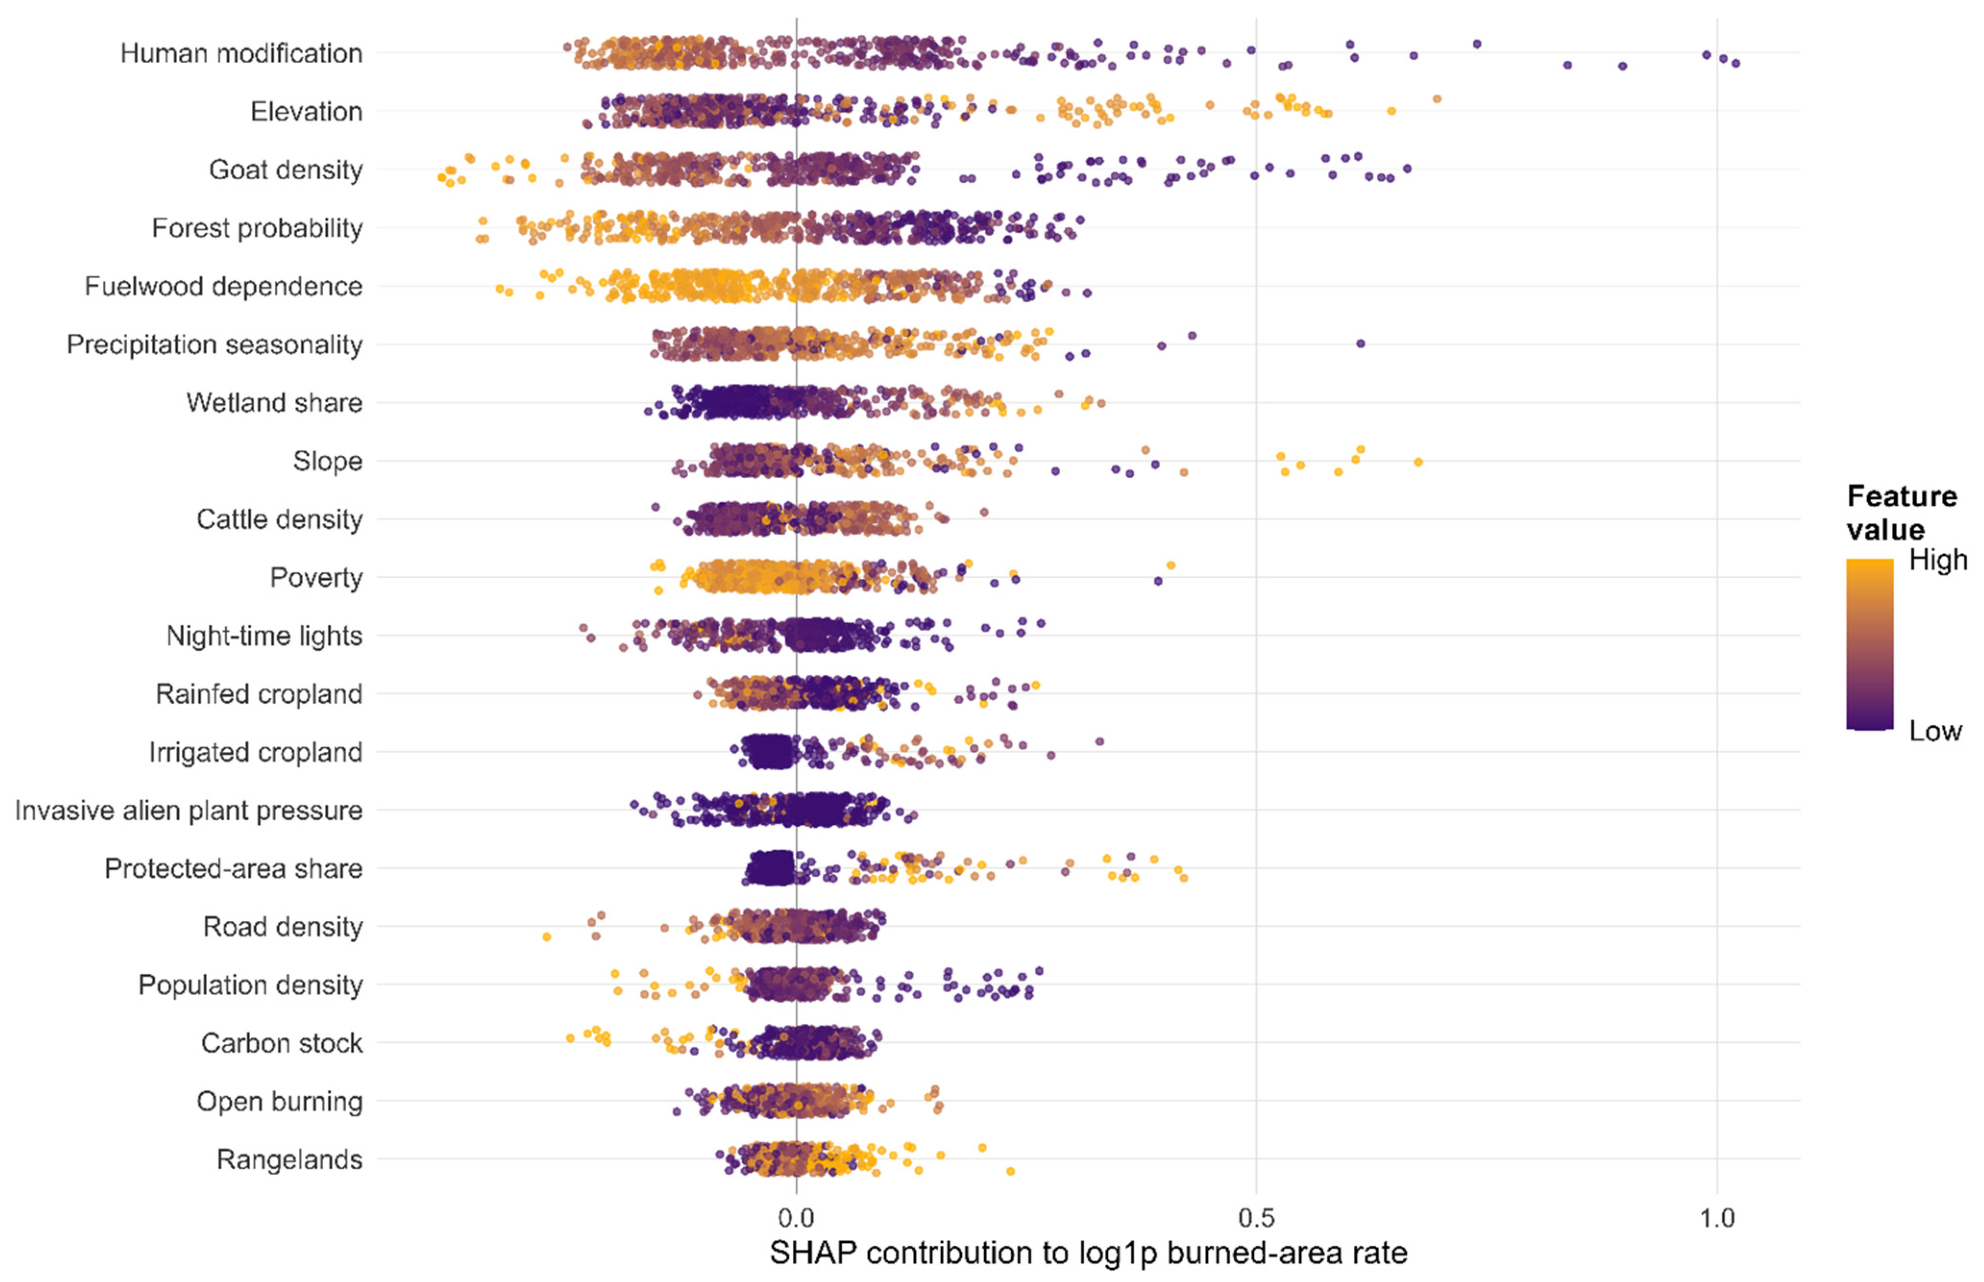
TreeSHAP ranked human modification, goat density, elevation, forest probability, fuelwood dependence and precipitation seasonality as the most influential predictors in the fitted burned-area-rate model. Their effects were not uniform. The same predictor could raise the fitted value over one part of its range and lower it elsewhere, revealing non-linearity, saturation and interaction rather than simple monotonic relationships (Figure 7).
Figure 7.
TreeSHAP contribution structure for burned-area rates. Each point is a hexagon–driver contribution; colour indicates the within-driver feature value. Positive contributions increase the predicted log1p burned-area rate, while negative values decrease it.
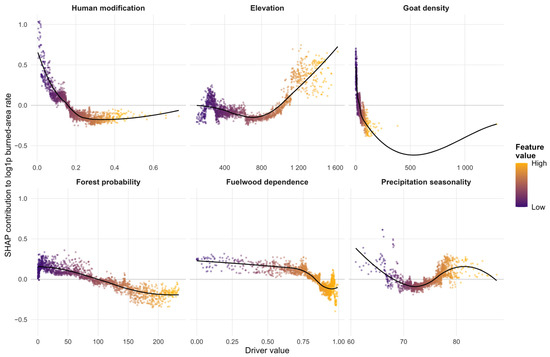
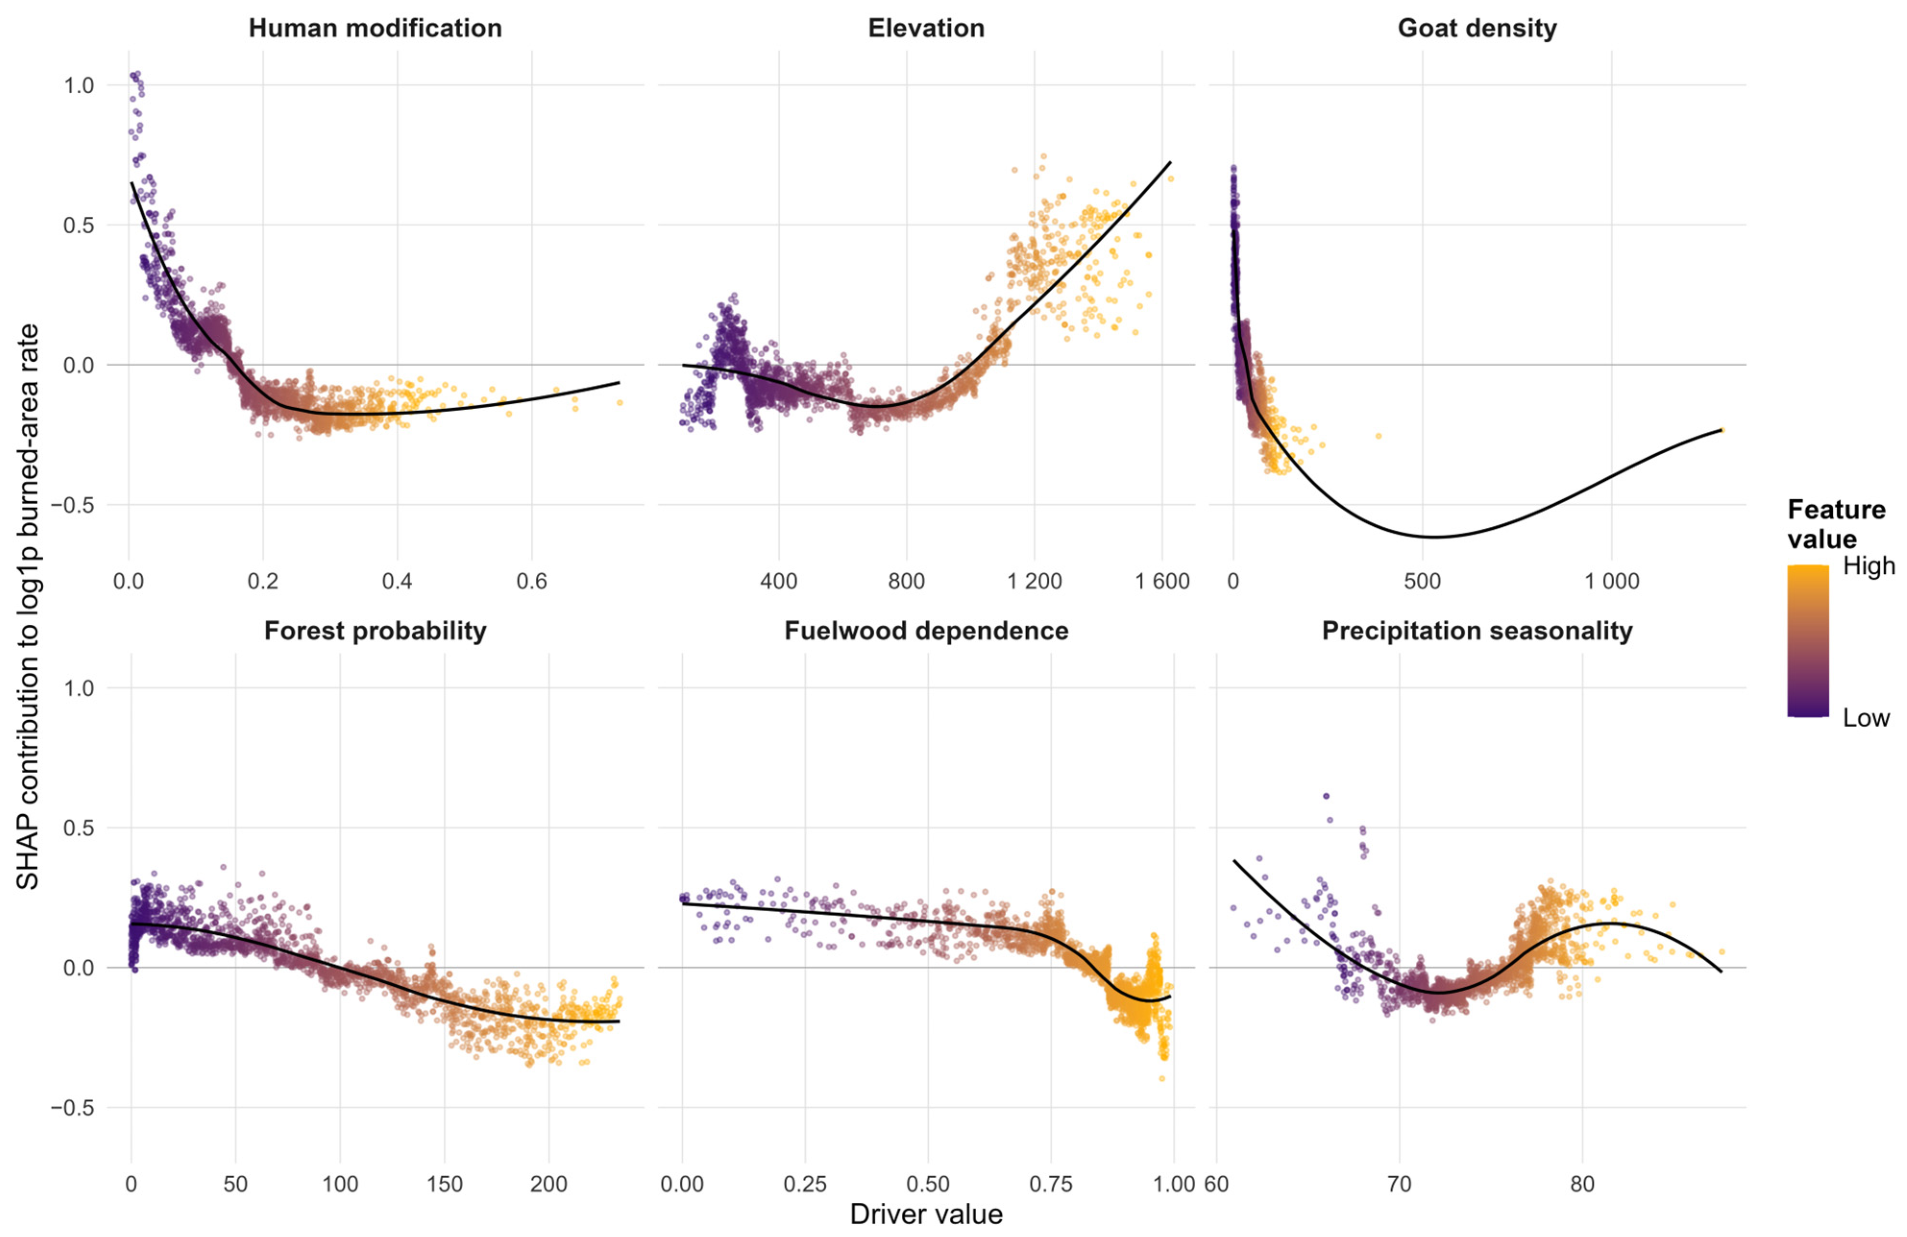
Dependence plots clarified these fitted associations. Human modification showed a steep decline in SHAP contribution beyond the lowest part of its range, a pattern consistent with—but not proof of—fuel fragmentation, access or suppression in more modified landscapes. Goat density and fuelwood dependence also declined non-linearly at higher values. Elevation showed a U-shaped response, with more positive contributions at the lower and upper ends of the observed range. Forest probability was generally associated with more negative contributions, while precipitation seasonality showed a mid-range minimum (Figure 8). These curves describe model behaviour; they are not isolated mechanistic response functions.
Figure 8.
TreeSHAP dependence diagnostics for leading drivers. Curves are LOESS summaries and should be interpreted as model diagnostics rather than mechanistic response functions.
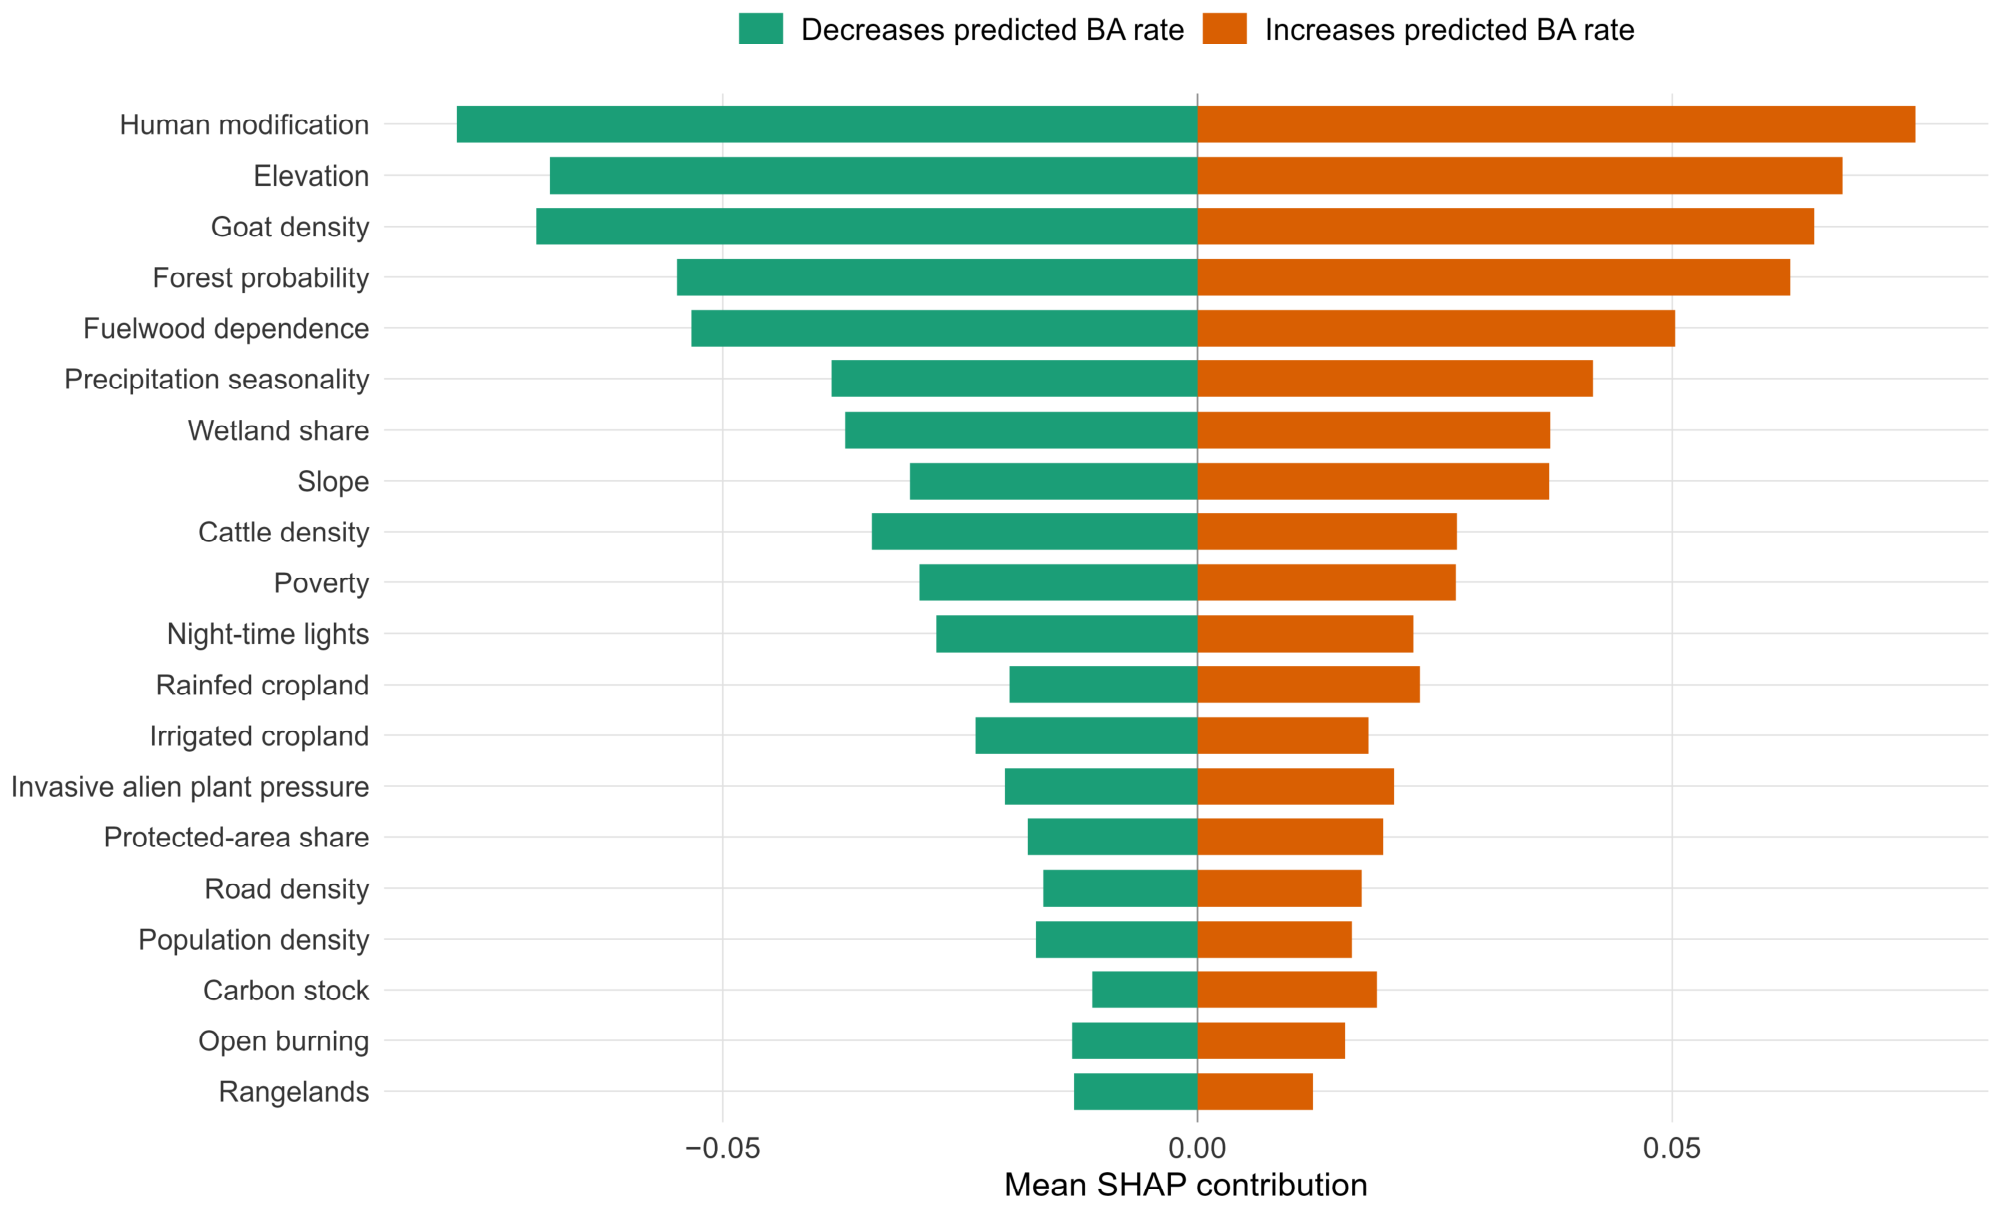
Directional-balance diagnostics led to the same conclusion. Most leading predictors contributed positively in some hexagons and negatively in others, so no effect can be reduced to a single correlation coefficient or universal management rule. Bidirectionality was especially clear for human modification, livestock density, forest probability and precipitation seasonality, where local combinations of fuels, access, land use and climate are likely to matter (Figure 9).
Figure 9.
Directional balance of TreeSHAP effects for screened socio-ecological drivers. Bars show mean positive and negative contributions to the log1p burned-area-rate prediction scale.
3.5. Empirical Separation Thresholds
Fire burden, defined in Section 2.5, is the equal-weight composite of fire pressure, ecological sensitivity, human pressure and livelihood exposure. The threshold scan identified cut points that best separated lower- and higher-burden conditions while penalising highly unbalanced splits. These are prioritisation thresholds, not ecological tipping points in the dynamical-systems sense. The fire–ecosystem–people nexus and socio-ecological fire-burden indices produced the strongest separations, each with a score of 0.50 (Table 4).
Table 4.
Highest-ranked empirical threshold separations for socio-ecological fire burden. Thresholds are diagnostic prioritisation values, not mechanistic tipping points.
3.6. Fire-Stewardship Zones Translate Diagnostics into Action Classes
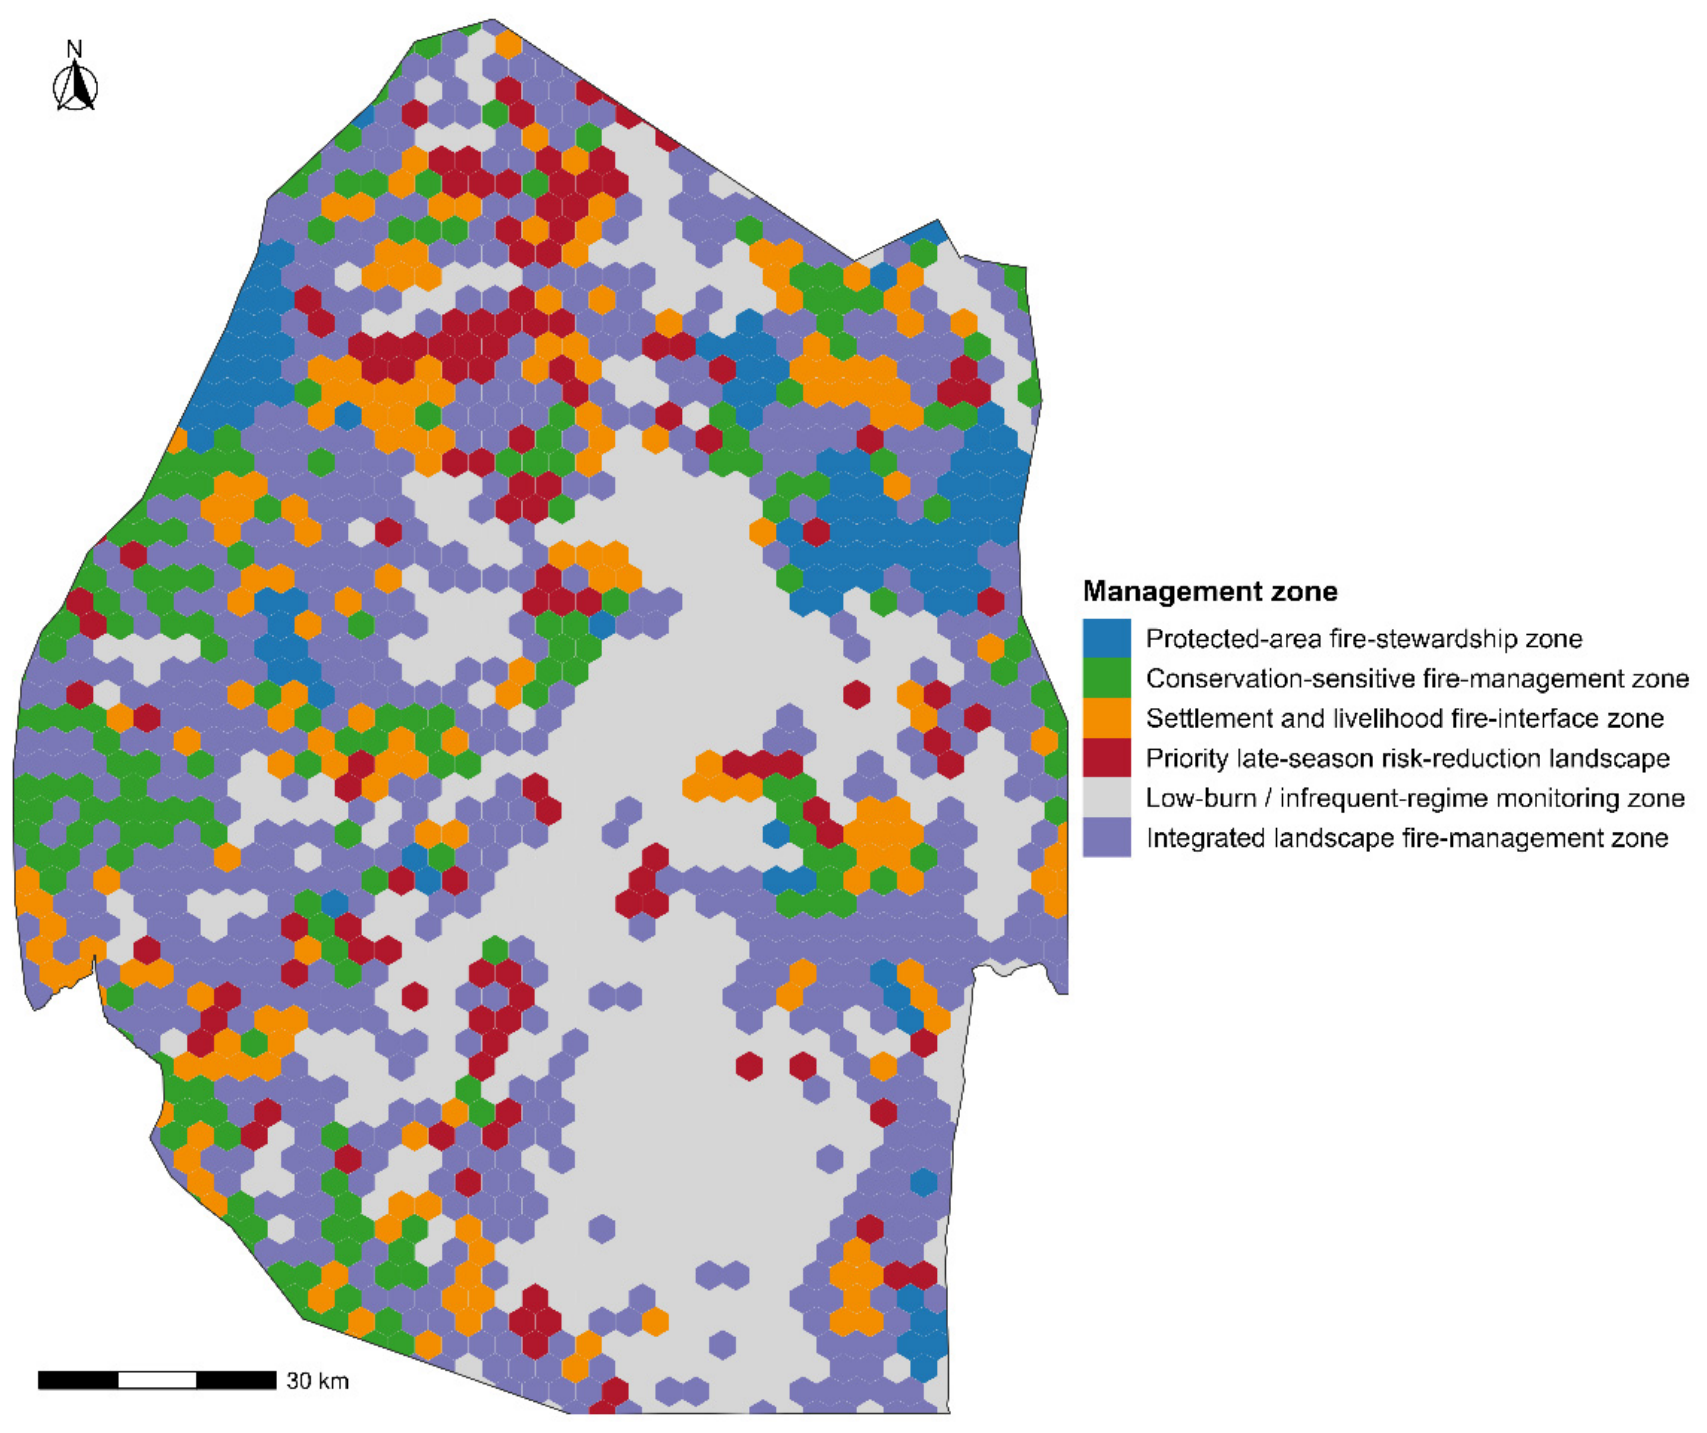
The policy translation produced six action-oriented zones from fire-regime typology, hotspot score, ecological sensitivity, protected-area share, human pressure and livelihood exposure (Figure 10). Integrated landscape management covered the largest share of the national hex grid (35.2%), followed by low-burn/infrequent-regime monitoring (31.3%). Settlement–livelihood interface and conservation-sensitive zones each covered about 10%, whereas late-season risk-reduction and protected-area stewardship zones were smaller and more targeted (Table 5). These areas describe the geography of decision priorities; they do not rank ecological value or hazard severity.
Figure 10.
Adaptive fire-management zones. The classes translate fire-regime typology, ecological sensitivity and people/livelihood exposure into policy-facing stewardship units.
Table 5.
Area share of adaptive fire-management zones derived from the policy-facing translation layer.
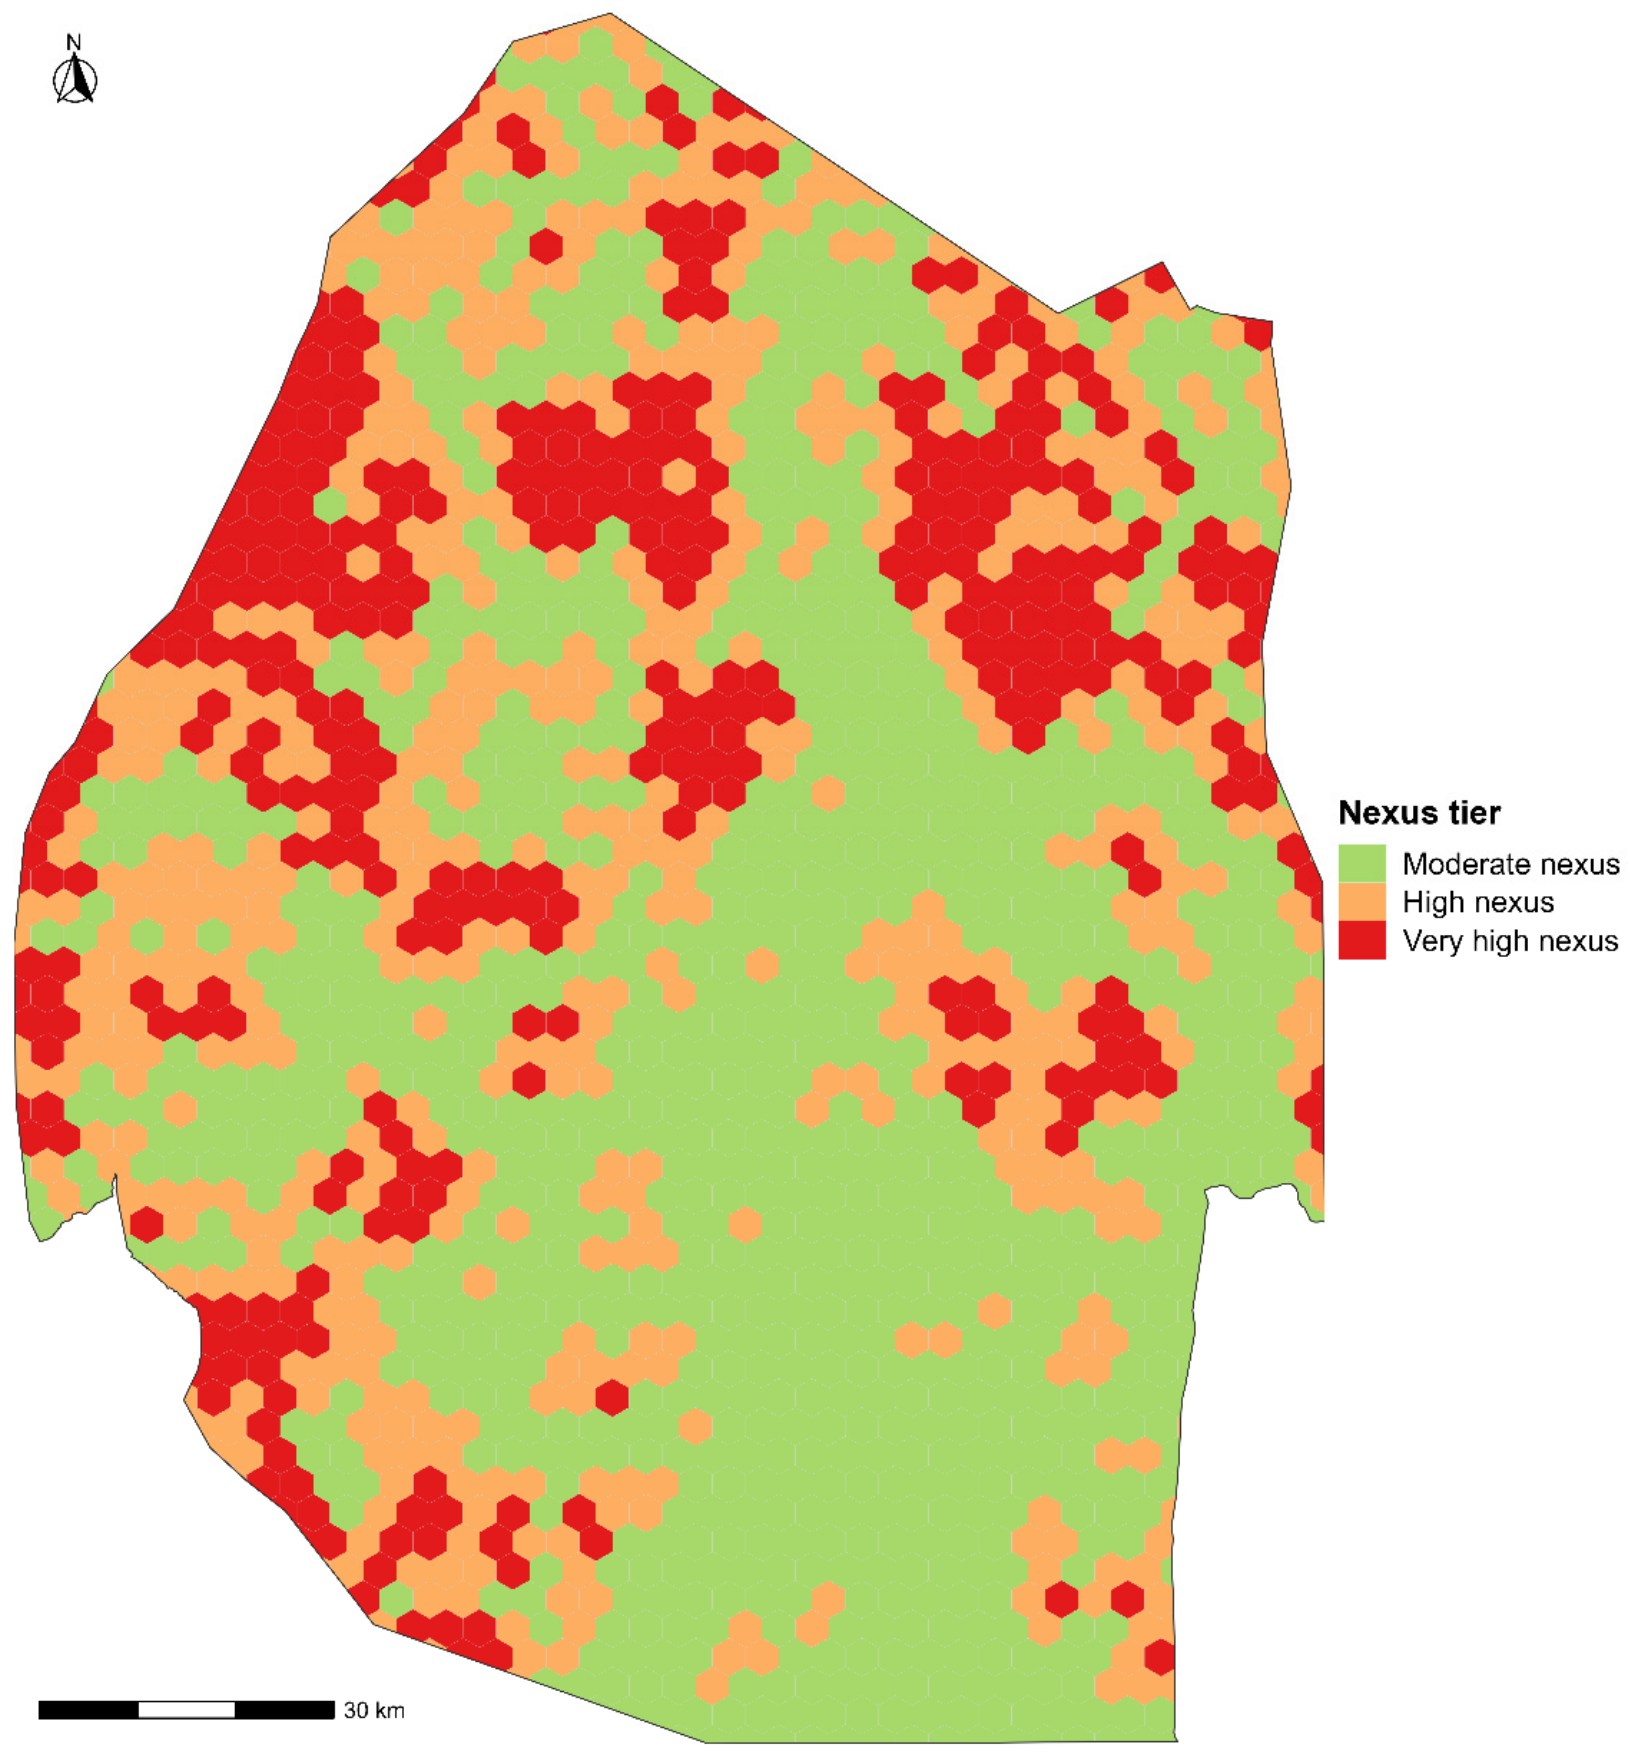
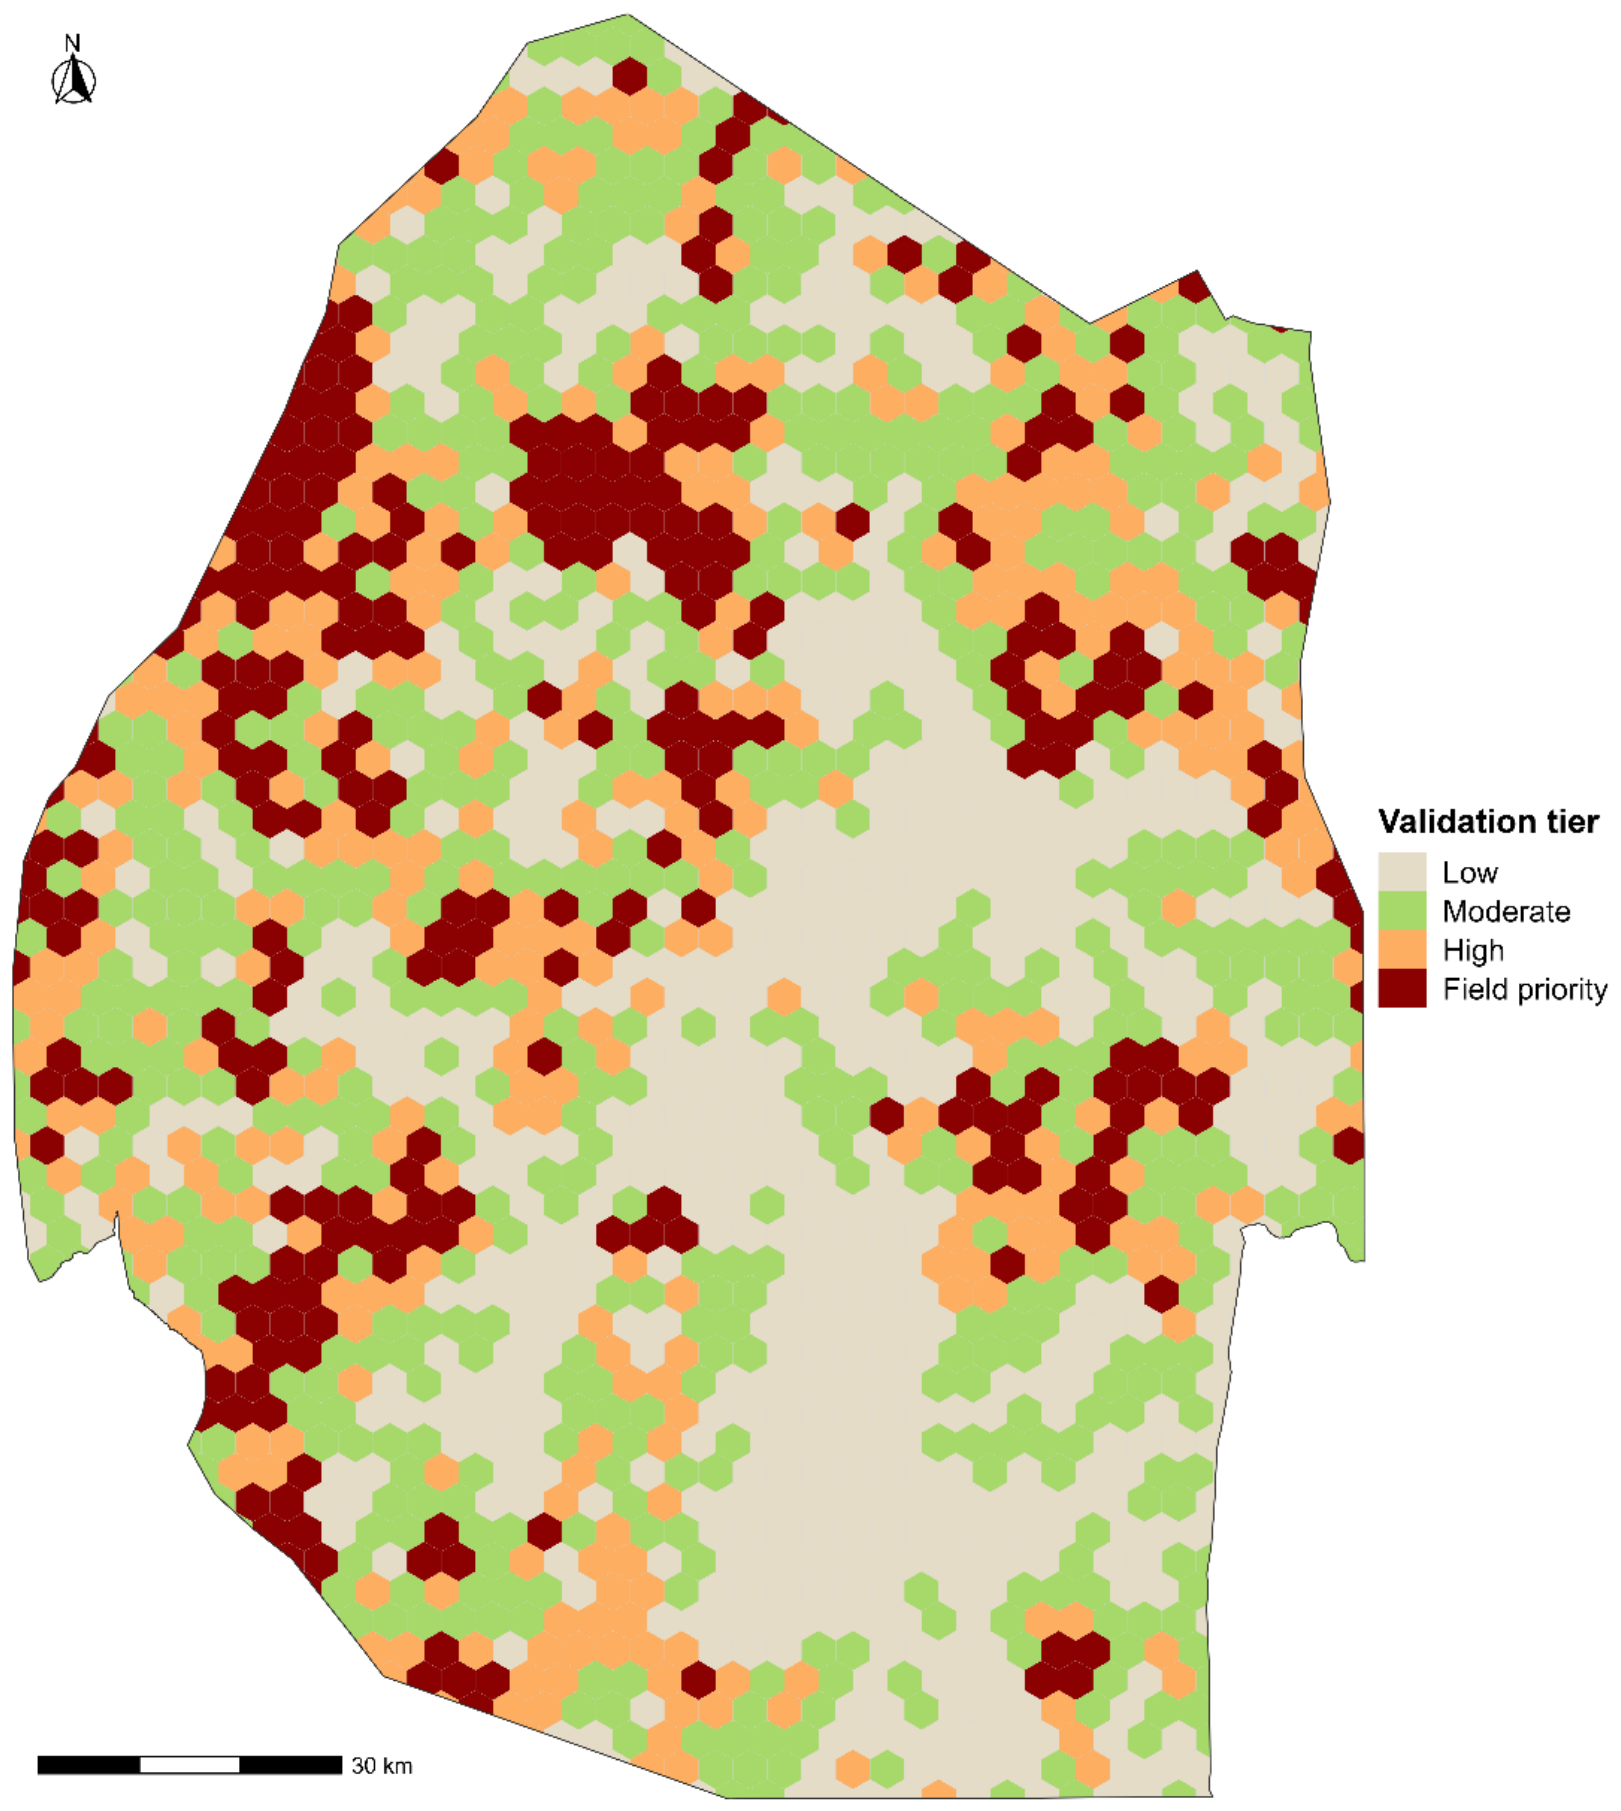
The nexus and field-validation maps provide complementary implementation products. Nexus tiers identify where fire pressure intersects with ecological sensitivity and people/livelihood exposure. Field-validation tiers identify landscapes where practitioner interviews, local fire-use histories and field inspection would add the most interpretive value (Figure 11 and Figure 12). Both outputs are deliberately conservative: they show where local knowledge and independent evidence should be gathered, not where a modelled class should substitute for them.
Figure 11.
Fire–ecosystem–people nexus priority tiers. The map classifies the intersection of fire pressure, ecological sensitivity and people/livelihood exposure.
Figure 12.
Field-validation priority tiers for practitioner interviews, traditional fire-use interpretation and field verification.
4. Discussion
4.1. Heterogeneous Fire Regimes Within a Compact National Mosaic
The eight regime types reveal substantial fire heterogeneity within a small national territory. Frequent small-fire mosaics, large-fire-dominated regimes, late dry-season units, pyrodiverse mixed-season areas and emerging intensification landscapes represent different combinations of frequency, timing, event-size structure and trend. This pattern accords with the pyrome concept, which treats fire regimes as multidimensional syndromes rather than positions on a single burned-area gradient [6,7]. A recent South African analysis similarly identified frequent, infrequent and effectively unburned histories within one mixed grassland–fynbos landscape, showing how abruptly regimes can change across short environmental gradients [62].
The typology also shows why burned-area totals alone are inadequate for stewardship. Coarse-resolution products can under-represent small African fires [11,15], whereas event-based records add information about how burning is organised through time and space [16]. A no-recorded-fire/low-information unit should therefore not be treated automatically as risk free, just as a high burned-area total should not be treated as one homogeneous problem. The relevant questions are place-specific: which pattern occurs, in which ecosystem and season, under what livelihood and governance conditions, and with what consequences [5,22,23,24,25]?
4.2. Seasonal Concentration and Management Windows
Eswatini’s July–September concentration is consistent with the broader southern African dry-season cycle, but the exact timing remains landscape-specific. In a savanna spanning Botswana and South Africa, fires occurred predominantly in the late dry season, from August to November [63]. Mixed grassland–fynbos in South Africa also showed a substantial late-winter and early-spring contribution, although fires occurred throughout the year [62]. At the regional scale, interannual burned areas reflect both climatic controls and strong human modification of fire regimes [64]. Eswatini’s August maximum is therefore plausible within southern Africa, but it should not be converted into a fixed regional fire calendar.
Late-season timing matters because fuels have usually cured, fuel moisture is lower and fires can spread farther or burn more intensely than earlier in the dry season. The same seasonal peak can stretch detection and suppression capacity, particularly near plantations, protected-area boundaries, settlements and rangelands [25,63]. These conditions increase management concern, but they do not make every late-season fire ecologically harmful. Effects depend on vegetation, intensity, recurrence, management purpose and local practice [22,23,24,25]. The results support focused preparedness—pre-positioning, detection, safe-burning agreements and cross-boundary coordination—rather than blanket suppression in a particular month.
4.3. Non-Linear Socio-Ecological Associations and Limits of Explanation
The explainable model shows that associations with the burned-area rate are strongly non-linear. Human modification ranked first, but its contribution changed across the observed gradient. This is compatible with evidence that people can increase ignition opportunities, while roads, settlement, land conversion, grazing and active suppression also fragment fuels or constrain spread [4,5,12,42]. The model cannot separate these mechanisms. Its SHAP pattern is therefore a structured hypothesis about interacting processes, not evidence that human modification has one causal effect.
The same restraint applies to livestock density, fuelwood dependence, forest probability and precipitation seasonality. Grazing and biomass removal can alter fuel continuity, but livestock and fuelwood indicators also proxy livelihood systems, access and settlement. A negative contribution from forest probability does not show that forest is intrinsically protected from fire; it may reflect fuel type, management or covariation with climate and land use. TreeSHAP reveals how the fitted model distributes contributions across observations [54,55], but correlated predictors can share or redistribute attribution. Dependence plots and directional-balance diagnostics are therefore model explanations, not mechanistic dose–response curves.
4.4. From Typologies to Differentiated Stewardship in Eswatini
The clearest management implication for Eswatini is differentiation, not one national prescription. Protected-area stewardship zones require locally defined fire objectives, boundary coordination and monitoring of event size and recurrence. Conservation-sensitive zones require particular care where wetlands, riparian areas, forest patches or biodiversity-sensitive habitats intersect with burning. Settlement–livelihood interfaces call for prevention, negotiated safe-burning windows and attention to grazing, fuelwood and crop-margin practices. Late-season risk-reduction landscapes warrant pre-season preparation because national activity is concentrated in a short dry-season window. These are planning implications, not rules generated automatically by the model [22,23,24,25,57,58,59].
The low-burn/infrequent monitoring zone, which covers 31.3% of the grid, is equally important. Low recorded fire may reflect low flammability, effective suppression, limited fuels, cropping or settlement fragmentation; it may also reflect the observational limits of MODIS-derived products [11,15,17,18,19,20,21]. Monitoring is therefore more defensible than assuming an absence of risk. The large integrated landscape-management zone identifies places where no single ecological or social factor dominates and where coordination among conservation, agriculture, forestry organisations, local authorities, disaster-risk institutions and rural communities is likely to be more useful than sector-specific action. Community-based fire research likewise shows that legitimacy, preparedness and local practice cannot be inferred from remote sensing alone [24,57,58,59].
4.5. Transferability to African Mosaic Landscapes
The broader contribution is the workflow, not the Eswatini thresholds or zone boundaries. Many African countries face the same mismatch between nationally consistent satellite observations and decisions made within mosaics of tenure, livelihood, ecological sensitivity and institutional authority [5,23,24]. The sequence used here—event history, fire-year metrics, behaviour-only typology, independent socio-ecological explanation and explicit policy translation—can be reproduced with widely available fire and environmental data. Cluster labels, thresholds and stewardship rules, however, must be recalibrated for each landscape.
Transferability also depends on how local knowledge enters the analysis. Community perceptions, customary burning practices and institutional capacity can determine whether the same mapped pattern is tolerated, desired or hazardous [24,57,58,59]. Weather–fire relationships also vary across southern Africa and may depend on both antecedent fuel production and conditions during the fire period rather than on one universal driver [10,64]. The field-validation map is therefore not an optional outreach product; it identifies where practitioner evidence and local fire-use histories are needed before strong prescriptions are made.
4.6. Uncertainty, Scale Effects and Future Research
Several limitations bound the interpretation. First, Global Fire Atlas histories inherit MODIS omissions of small, narrow, short-duration and cloud-obscured fires [11,15,16,17,18,19,20,21]. The first and last fire years are also edge years and are not treated as complete annual records. Second, several socio-ecological variables are proxies. Night-time lights, human modification, open-burning indicators and fuelwood dependence describe aspects of pressure, access or livelihood context, but they do not observe ignition motive, fire-use rules or suppression behaviour. Temporal mismatch between some slowly changing context layers and the 2001–2025 fire record further limits causal inference.
Third, both the typology and the model are scale-dependent. Changing hexagon size could alter event counts, recurrence and the apparent dominance of large fires; k-means also imposes discrete classes on patterns that may partly form continuous gradients. The random held-out test measures predictive generalisation to unseen hexagons under the present sample structure, but spatial autocorrelation may make this estimate more optimistic than a geographically blocked evaluation. Sensitivity analysis should therefore compare multiple grains, alternative clustering methods and repeated spatial-block cross-validation. Grouped or conditional attribution would also help assess correlated predictors because SHAP contributions can be redistributed among related variables [54,55,56].
Future work should combine this national framework with Sentinel-2 burned-area mapping, VIIRS active-fire detections, plantation and protected-area records, and a georeferenced national incident database recording ignition source, response, damage and management purpose. Practitioner interviews and community fire histories are needed in field-priority zones to distinguish planned livelihood burning, conservation fire, escaped agricultural fire, arson and other ignition contexts. Stewardship zones should also be updated as new seasons accrue and tested against independent incidents and management outcomes. The next advance is not simply a finer map; it is a learning system in which satellite evidence, operational records and local knowledge are repeatedly compared and used to improve decisions.
5. Conclusions
This study developed a national, event-based and explainable fire-regime framework for Eswatini and translated it into adaptive stewardship zones. The results show why burned-area totals alone cannot describe the country’s fire geography. Regimes differ in frequency, recurrence, seasonality, large-fire dominance, pyrodiversity and trend. The burned-area rate, in turn, is associated non-linearly with both environmental and human-context predictors.
The practical consequence is differentiation rather than uniform treatment. Protected areas, conservation-sensitive habitats, settlement–livelihood interfaces, late-season risk landscapes, low-information units and integrated management zones pose different operational questions and require different evidence. For Eswatini, the framework provides a transparent basis for field validation and national fire-stewardship planning. More broadly, it shows how event-based satellite histories, socio-ecological indicators and explainable modelling can be connected without treating attribution as causality or zones as fixed prescriptions. Its value elsewhere lies in the analytical sequence, which can be recalibrated to local regimes, institutions and knowledge systems.
Supplementary Materials
The following supporting information can be downloaded at: https://www.mdpi.com/article/10.3390/fire9070309/s1, R script used in the analyses and the Geopackage file containing the generated spatial data.
Funding
This research received no external funding.
Institutional Review Board Statement
Not applicable.
Informed Consent Statement
Not applicable.
Data Availability Statement
The processed datasets, model outputs, figure-supporting tables and R scripts used in this study are provided as Supplementary Materials. Primary datasets are publicly available from the original sources cited in the manuscript. Derived spatial layers subject to third-party licensing or national data-use restrictions cannot be redistributed openly but may be requested from the corresponding author, subject to the applicable conditions.
Acknowledgments
The author acknowledges the Central Statistics Office of the Eswatini Government for availing the socio-economic data used in the study.
Conflicts of Interest
The author declares no conflicts of interest.
References
- Bowman, D.M.J.S.; Balch, J.K.; Artaxo, P.; Bond, W.J.; Carlson, J.M.; Cochrane, M.A.; D’Antonio, C.M.; DeFries, R.S.; Doyle, J.C.; Harrison, S.P.; et al. Fire in the Earth system. Science 2009, 324, 481–484. [Google Scholar] [CrossRef] [Scilit] [PubMed]
- Bond, W.J.; Keeley, J.E. Fire as a global herbivore: The ecology and evolution of flammable ecosystems. Trends Ecol. Evol. 2005, 20, 387–394. [Google Scholar] [CrossRef] [Scilit] [PubMed]
- Pausas, J.G.; Keeley, J.E. A burning story: The role of fire in the history of life. BioScience 2009, 59, 593–601. [Google Scholar] [CrossRef] [Scilit]
- Bowman, D.M.J.S.; Balch, J.K.; Artaxo, P.; Bond, W.J.; Cochrane, M.A.; D’Antonio, C.M.; DeFries, R.; Johnston, F.H.; Keeley, J.E.; Krawchuk, M.A.; et al. The human dimension of fire regimes on Earth. J. Biogeogr. 2011, 38, 2223–2236. [Google Scholar] [CrossRef] [Scilit] [PubMed]
- Archibald, S. Managing the human component of fire regimes: Lessons from Africa. Philos. Trans. R. Soc. B 2016, 371, 20150346. [Google Scholar] [CrossRef] [Scilit] [PubMed]
- Krawchuk, M.A.; Moritz, M.A.; Parisien, M.-A.; Van Dorn, J.; Hayhoe, K. Global pyrogeography: The current and future distribution of wildfire. PLoS ONE 2009, 4, e5102. [Google Scholar] [CrossRef] [Scilit] [PubMed]
- Archibald, S.; Lehmann, C.E.R.; Gómez-Dans, J.L.; Bradstock, R.A. Defining pyromes and global syndromes of fire regimes. Proc. Natl. Acad. Sci. USA 2013, 110, 6442–6447. [Google Scholar] [CrossRef] [Scilit] [PubMed]
- Sankaran, M.; Hanan, N.P.; Scholes, R.J.; Ratnam, J.; Augustine, D.J.; Cade, B.S.; Gignoux, J.; Higgins, S.I.; Le Roux, X.; Ludwig, F.; et al. Determinants of woody cover in African savannas. Nature 2005, 438, 846–849. [Google Scholar] [CrossRef] [Scilit] [PubMed]
- Staver, A.C.; Archibald, S.; Levin, S.A. Tree cover in sub-Saharan Africa: Rainfall and fire constrain forest and savanna as alternative stable states. Ecology 2011, 92, 1063–1072. [Google Scholar] [CrossRef] [PubMed]
- Lehmann, C.E.R.; Anderson, T.M.; Sankaran, M.; Higgins, S.I.; Archibald, S.; Hoffmann, W.A.; Hanan, N.P.; Williams, R.J.; Fensham, R.J.; Felfili, J.; et al. Savanna vegetation–fire–climate relationships differ among continents. Science 2014, 343, 548–552. [Google Scholar] [CrossRef] [Scilit] [PubMed]
- Ramo, R.; Roteta, E.; Bistinas, I.; van Wees, D.; Bastarrika, A.; Chuvieco, E.; van der Werf, G.R.; Boschetti, L. African burned area and fire carbon emissions are strongly impacted by small fires undetected by coarse-resolution satellite data. Proc. Natl. Acad. Sci. USA 2021, 118, e2011160118. [Google Scholar] [CrossRef] [Scilit] [PubMed]
- Andela, N.; Morton, D.C.; Giglio, L.; Chen, Y.; van der Werf, G.R.; Kasibhatla, P.S.; DeFries, R.S.; Collatz, G.J.; Hantson, S.; Kloster, S.; et al. A human-driven decline in global burned area. Science 2017, 356, 1356–1362. [Google Scholar] [CrossRef] [Scilit] [PubMed]
- Kelly, L.T.; Giljohann, K.M.; Duane, A.; Aquilué, N.; Archibald, S.; Batllori, E.; Bennett, A.F.; Buckland, S.T.; Canelles, Q.; Clarke, M.F.; et al. Fire and biodiversity in the Anthropocene. Science 2020, 370, eabb0355. [Google Scholar] [CrossRef] [Scilit] [PubMed]
- van der Werf, G.R.; Randerson, J.T.; Giglio, L.; van Leeuwen, T.T.; Chen, Y.; Rogers, B.M.; Mu, M.; van Marle, M.J.E.; Morton, D.C.; Collatz, G.J.; et al. Global fire emissions estimates during 1997–2016. Earth Syst. Sci. Data 2017, 9, 697–720. [Google Scholar] [CrossRef] [Scilit]
- Randerson, J.T.; Chen, Y.; van der Werf, G.R.; Rogers, B.M.; Morton, D.C. Global burned area and biomass burning emissions from small fires. J. Geophys. Res. Biogeosci. 2012, 117, G04012. [Google Scholar] [CrossRef] [Scilit]
- Andela, N.; Morton, D.C.; Giglio, L.; Paugam, R.; Chen, Y.; Hantson, S.; van der Werf, G.R.; Randerson, J.T. The Global Fire Atlas of individual fire size, duration, speed and direction. Earth Syst. Sci. Data 2019, 11, 529–552. [Google Scholar] [CrossRef] [Scilit]
- Giglio, L.; Boschetti, L.; Roy, D.P.; Humber, M.L.; Justice, C.O. The Collection 6 MODIS burned area mapping algorithm and product. Remote. Sens. Environ. 2018, 217, 72–85. [Google Scholar] [CrossRef] [Scilit] [PubMed]
- Roy, D.P.; Boschetti, L.; Justice, C.O.; Ju, J. The Collection 5 MODIS burned area product: Global evaluation by comparison with the MODIS active fire product. Remote Sens. Environ. 2008, 112, 3690–3707. [Google Scholar] [CrossRef] [Scilit]
- Chuvieco, E.; Lizundia-Loiola, J.; Pettinari, M.L.; Ramo, R.; Padilla, M.; Tansey, K.; Mouillot, F.; Laurent, P.; Storm, T.; Heil, A.; et al. Generation and analysis of a new global burned area product based on MODIS 250 m reflectance bands and thermal anomalies. Earth Syst. Sci. Data 2018, 10, 2015–2031. [Google Scholar] [CrossRef] [Scilit]
- Humber, M.L.; Boschetti, L.; Giglio, L.; Justice, C.O. Spatial and temporal intercomparison of four global burned area products. Int. J. Digit. Earth 2019, 12, 460–484. [Google Scholar] [CrossRef] [Scilit] [PubMed]
- Boschetti, L.; Roy, D.P.; Giglio, L.; Huang, H.; Zubkova, M.; Humber, M.L. Global validation of the Collection 6 MODIS burned area product. Remote Sens. Environ. 2019, 235, 111490. [Google Scholar] [CrossRef] [Scilit] [PubMed]
- Nieman, W.A.; van Wilgen, B.W.; Leslie, A.J. A review of fire management practices in African savanna-protected areas. Koedoe 2021, 63, a1655. [Google Scholar] [CrossRef] [Scilit]
- Croker, A.R.; Woods, J.; Kountouris, Y. Changing fire regimes in East and Southern Africa’s savanna-protected areas: Opportunities and challenges for indigenous-led savanna burning emissions abatement schemes. Fire Ecol. 2023, 19, 63. [Google Scholar] [CrossRef] [Scilit]
- Croker, A.R.; Woods, J.; Kountouris, Y. Community-based fire management in East and Southern African savanna-protected areas: A review of the published evidence. Earth’s Future 2023, 11, e2023EF003552. [Google Scholar] [CrossRef] [Scilit]
- van Wilgen, B.W.; Govender, N.; Biggs, H.C.; Ntsala, D.; Funda, X.N. Response of savanna fire regimes to changing fire-management policies in a large African national park. Conserv. Biol. 2004, 18, 1533–1540. [Google Scholar] [CrossRef] [Scilit]
- Parr, C.L.; Andersen, A.N. Patch mosaic burning for biodiversity conservation: A critique of the pyrodiversity paradigm. Conserv. Biol. 2006, 20, 1610–1619. [Google Scholar] [CrossRef] [Scilit] [PubMed]
- Russell-Smith, J.; Cook, G.D.; Cooke, P.M.; Edwards, A.C.; Lendrum, M.; Meyer, C.P.; Whitehead, P.J. Managing fire regimes in north Australian savannas: Applying Aboriginal approaches to contemporary global problems. Front. Ecol. Environ. 2013, 11, e55–e63. [Google Scholar] [CrossRef] [Scilit]
- Moritz, M.A.; Batllori, E.; Bradstock, R.A.; Gill, A.M.; Handmer, J.; Hessburg, P.F.; Leonard, J.; McCaffrey, S.; Odion, D.C.; Schoennagel, T.; et al. Learning to coexist with wildfire. Nature 2014, 515, 58–66. [Google Scholar] [CrossRef] [Scilit] [PubMed]
- Gill, A.M.; Stephens, S.L. Scientific and social challenges for the management of fire-prone wildland–urban interfaces. Environ. Res. Lett. 2009, 4, 034014. [Google Scholar] [CrossRef] [Scilit]
- Kingdom of Eswatini, Central Statistical Office. 2017 Population and Housing Census; Central Statistical Office: Mbabane, Eswatini, 2019.
- Government of the Kingdom of Eswatini. Swaziland’s Second National Biodiversity Strategy and Action Plan 2016–2022; Ministry of Tourism and Environmental Affairs: Mbabane, Eswatini, 2016.
- Government of the Kingdom of Eswatini. Sixth National Report to the Convention on Biological Diversity; Ministry of Tourism and Environmental Affairs: Mbabane, Eswatini, 2019.
- Government of the Kingdom of Eswatini. National Climate Change Policy; Ministry of Tourism and Environmental Affairs: Mbabane, Eswatini, 2016.
- Turner, M.G. Landscape ecology: The effect of pattern on process. Annu. Rev. Ecol. Syst. 1989, 20, 171–197. [Google Scholar] [CrossRef]
- Forman, R.T.T. Land Mosaics: The Ecology of Landscapes and Regions; Cambridge University Press: Cambridge, UK, 1995. [Google Scholar]
- Shannon, C.E. A mathematical theory of communication. Bell Syst. Tech. J. 1948, 27, 379–423, 623–656. [Google Scholar] [CrossRef] [Scilit]
- Pielou, E.C. The measurement of diversity in different types of biological collections. J. Theor. Biol. 1966, 13, 131–144. [Google Scholar] [CrossRef] [Scilit]
- Martin, R.E.; Sapsis, D.B. Fires as agents of biodiversity: Pyrodiversity promotes biodiversity. In Proceedings of the Symposium on Biodiversity of Northwestern California, Santa Rosa, CA, USA, 28–30 October 1991; Kerner, H.M., Ed.; Wildland Resources Center, University of California: Berkeley, CA, USA, 1992; pp. 150–157. [Google Scholar]
- MacQueen, J. Some methods for classification and analysis of multivariate observations. In Proceedings of the Fifth Berkeley Symposium on Mathematical Statistics and Probability, Berkeley, CA, USA, 21 June 1967; Volume 1, pp. 281–297. [Google Scholar]
- Lloyd, S. Least squares quantization in PCM. IEEE Trans. Inf. Theory 1982, 28, 129–137. [Google Scholar] [CrossRef] [Scilit]
- Rousseeuw, P.J. Silhouettes: A graphical aid to the interpretation and validation of cluster analysis. J. Comput. Appl. Math. 1987, 20, 53–65. [Google Scholar] [CrossRef] [Scilit]
- Laris, P. Humanizing savanna biogeography: Linking human practices with ecological patterns in a frequently burned savanna of southern Mali. Ann. Assoc. Am. Geogr. 2011, 101, 1067–1088. [Google Scholar] [CrossRef] [Scilit]
- Kennedy, C.M.; Oakleaf, J.R.; Theobald, D.M.; Baruch-Mordo, S.; Kiesecker, J. Managing the middle: A shift in conservation priorities based on the global human modification gradient. Glob. Change Biol. 2019, 25, 811–826. [Google Scholar] [CrossRef] [Scilit] [PubMed]
- Elvidge, C.D.; Baugh, K.; Zhizhin, M.; Hsu, F.-C.; Ghosh, T. VIIRS night-time lights. Int. J. Remote Sens. 2017, 38, 5860–5879. [Google Scholar] [CrossRef] [Scilit]
- Hansen, M.C.; Potapov, P.V.; Moore, R.; Hancher, M.; Turubanova, S.A.; Tyukavina, A.; Thau, D.; Stehman, S.V.; Goetz, S.J.; Loveland, T.R.; et al. High-resolution global maps of 21st-century forest cover change. Science 2013, 342, 850–853. [Google Scholar] [CrossRef] [Scilit] [PubMed]
- Zanaga, D.; Van De Kerchove, R.; De Keersmaecker, W.; Souverijns, N.; Brockmann, C.; Quast, R.; Wevers, J.; Grosu, A.; Paccini, A.; Vergnaud, S.; et al. ESA WorldCover 10 m 2020 v100. Zenodo 2021. Available online: https://zenodo.org/records/5571936 (accessed on 11 February 2026).
- Funk, C.; Peterson, P.; Landsfeld, M.; Pedreros, D.; Verdin, J.; Shukla, S.; Husak, G.; Rowland, J.; Harrison, L.; Hoell, A.; et al. The Climate Hazards Infrared Precipitation with Stations: A new environmental record for monitoring extremes. Sci. Data 2015, 2, 150066. [Google Scholar] [CrossRef] [Scilit] [PubMed]
- Fick, S.E.; Hijmans, R.J. WorldClim 2: New 1-km spatial resolution climate surfaces for global land areas. Int. J. Climatol. 2017, 37, 4302–4315. [Google Scholar] [CrossRef] [Scilit]
- Hersbach, H.; Bell, B.; Berrisford, P.; Hirahara, S.; Horányi, A.; Muñoz-Sabater, J.; Nicolas, J.; Peubey, C.; Radu, R.; Schepers, D.; et al. The ERA5 global reanalysis. Q. J. R. Meteorol. Soc. 2020, 146, 1999–2049. [Google Scholar] [CrossRef] [Scilit]
- Venter, O.; Sanderson, E.W.; Magrach, A.; Allan, J.R.; Beher, J.; Jones, K.R.; Possingham, H.P.; Laurance, W.F.; Wood, P.; Fekete, B.M.; et al. Global terrestrial human footprint maps for 1993 and 2009. Sci. Data 2016, 3, 160067. [Google Scholar] [CrossRef] [Scilit] [PubMed]
- Friedman, J.H. Greedy function approximation: A gradient boosting machine. Ann. Stat. 2001, 29, 1189–1232. [Google Scholar] [CrossRef] [Scilit]
- Chen, T.; Guestrin, C. XGBoost: A scalable tree boosting system. In Proceedings of the 22nd ACM SIGKDD International Conference on Knowledge Discovery and Data Mining, San Francisco, CA, USA, 13–17 August 2016; pp. 785–794. [Google Scholar] [CrossRef] [Scilit]
- Natekin, A.; Knoll, A. Gradient boosting machines, a tutorial. Front. Neurorobot. 2013, 7, 21. [Google Scholar] [CrossRef] [Scilit] [PubMed]
- Lundberg, S.M.; Lee, S.-I. A unified approach to interpreting model predictions. In Advances in Neural Information Processing Systems 30; Curran Associates: Red Hook, NY, USA, 2017; pp. 4765–4774. [Google Scholar]
- Lundberg, S.M.; Erion, G.; Chen, H.; DeGrave, A.; Prutkin, J.M.; Nair, B.; Katz, R.; Himmelfarb, J.; Bansal, N.; Lee, S.-I. From local explanations to global understanding with explainable AI for trees. Nat. Mach. Intell. 2020, 2, 56–67. [Google Scholar] [CrossRef] [Scilit] [PubMed]
- Molnar, C. Interpretable Machine Learning, 2nd ed.; Independently Published: Munich, Germany, 2022; Available online: https://christophm.github.io/interpretable-ml-book/ (accessed on 13 June 2026).
- Myers, R.L. Living with Fire: Sustaining Ecosystems and Livelihoods Through Integrated Fire Management; The Nature Conservancy: Tallahassee, FL, USA, 2006. [Google Scholar]
- Food and Agriculture Organization of the United Nations. Fire Management: Voluntary Guidelines; Fire Management Working Paper 17; FAO: Rome, Italy, 2006. [Google Scholar]
- Food and Agriculture Organization of the United Nations. Community-Based Fire Management: A Review; FAO Forestry Paper 166; FAO: Rome, Italy, 2011. [Google Scholar]
- Kull, C.A. Isle of Fire: The Political Ecology of Landscape Burning in Madagascar; University of Chicago Press: Chicago, IL, USA, 2004. [Google Scholar]
- Pyne, S.J. World Fire: The Culture of Fire on Earth; University of Washington Press: Seattle, WA, USA, 1995. [Google Scholar]
- Smit, I.P.J.; Baard, J.A.; van Wilgen, B.W. Fire regimes and management options in mixed grassland-fynbos vegetation, South Africa. Fire Ecol. 2024, 20, 29. [Google Scholar] [CrossRef] [Scilit]
- Hudak, A.T.; Brockett, B.H. Trends in fire patterns in a southern African savanna under alternative land use practices. Agric. Ecosyst. Environ. 2004, 101, 307–325. [Google Scholar] [CrossRef] [Scilit]
- Archibald, S.; Nickless, A.; Govender, N.; Scholes, R.J.; Lehsten, V. Climate and the inter-annual variability of fire in southern Africa: A meta-analysis using long-term field data and satellite-derived burnt area data. Glob. Ecol. Biogeogr. 2010, 19, 794–809. [Google Scholar] [CrossRef] [Scilit]

Disclaimer/Publisher’s Note: The statements, opinions and data contained in all publications are solely those of the individual author(s) and contributor(s) and not of MDPI and/or the editor(s). MDPI and/or the editor(s) disclaim responsibility for any injury to people or property resulting from any ideas, methods, instructions or products referred to in the content. |
© 2026 by the author. Licensee MDPI, Basel, Switzerland. This article is an open access article distributed under the terms and conditions of the Creative Commons Attribution (CC BY) license.