


Abstract
A quantitative analysis of larch-dominated Siberian forest regions was conducted to evaluate wildfire characteristics in relation to Fire Radiative Power (FRP), long-term meteorological dynamics, and FRP range ratios. The results were validated against empirical stand mortality data spanning the period 2001–2024, obtained from the Global Forest Change dataset. Spatiotemporal burn characteristics were derived from the standard MODIS burned area product, while FRP data were extracted from the corresponding thermal anomalies product. Increasing trends in extreme FRP values were observed (4.5–17.9% of annual fire pixels), indicating that high-intensity fires progressively drive tree stand mortality statistics (R2 = 0.58, p < 0.01). Seasonal anomalies of the Duff Moisture Code (DMC), surface soil and litter moisture, and the Standardized Precipitation Evapotranspiration Index (SPEI) were the primary predictors of both wildfire intensity and tree cover mortality. Spatiotemporal analysis of FRP and tree cover mortality revealed that the most pronounced positive trends were concentrated in the central and northeastern forest regions of Siberia, which also exhibit high mean FRP values. These regions also experienced intensifying drought, as evidenced by the analysis of meteorological data. Consequently, under projected regional climate change, an escalating prevalence of high-intensity forest fires is anticipated to induce severe, potentially irreversible degradation of these forest stands and ecosystems.
1. Introduction
Forecasting the condition and resilience of boreal forest ecosystems amid documented climate change and fire regime dynamics remains a critical scientific priority. One dimension of this challenge involves analyzing the escalating impact of wildfire frequency and intensity on annual forest stand loss. Consequently, understanding the effect of climate change on fire regime characteristics—specifically fire intensity—and the resilience or susceptibility of forest stands to fatal damage in different natural zones and regions is crucial. Globally, forest stand loss within the boreal zone is primarily driven by vegetation fires [1,2,3,4,5,6,7]. Boreal fire regimes [7,8,9] have been qualitatively altered by observed climate change [10,11,12], suggesting significant negative effects on forest stands, landscapes and ecosystems. Extreme meteorological conditions, recurrently occurring in Siberia [12,13,14], drive the intensive desiccation of forest fuel loads [15] and directly accelerate the proportion of high-intensity combustion [6,16].
The level of heat and atmospheric moisture supply in local regions, precipitation dynamics, and fire season duration are critical factors governing the weather fire danger, and fire activity [8,10,17,18]. Previous research [18] indicates that 55–70% of the interseasonal variance in high-fire-hazard days across Russia is attributable to just three meteorological variables: air temperature, precipitation, and atmospheric humidity. Climate change is driving an expansion of the growing season, which is a phenomenon already in Siberia [10,12,14,18,19], and is projected to increase the fire season by 20–35% by mid-21st century relative to the late 20th century statistical baseline [12]. Furthermore, rising regional temperatures exacerbate the frequency of thunderstorms, which serve as a primary ignition source across the sparsely populated boreal forest zones of Siberia [19].
Current and projected fire regimes determine large-scale post-fire disturbances to Siberian vegetation, with the region accounting for 70–90% of the total annual burned forest area recorded in Russia [13,20]. Long-term satellite monitoring indicates that wildfires within the Siberian permafrost-boreal zone disturb at least 1% of the total forested area annually [4,21]. Furthermore, up to 30% of this affected footprint undergoes stand replacement [22]. Thus, the total area of stand-replacing fires across Siberia encompasses approximately 3.0 million hectares annually [5,23].
The development and implementation of regular monitoring services for post-fire forest stand conditions remains a critical challenge. Modern satellite fire-monitoring technologies enable a shift from a quantitative analysis of Siberian forest flammability [20] to a qualitative analysis of fire impacts [23]. Specialized indices, such as the Normalized Burn Ratio (NBR/dNBR) [24], apply to classifying post-fire forest stand conditions. The ratio of low-, medium-, and high-intensity burning areas in Siberia’s boreal zone has been characterized, with consistent estimates indicating 46%, 40%, and 14% of the total annual fire area are low-, medium-, and high-intensity burning zones, respectively [24]. Alternative methods for assessing fire impacts have been developed using Fire Radiative Power/Fire Radiative Energy (FRP/FRE) data. Fire radiative power (FRP) is the radiant component of the total energy released during the combustion process. It is an indirect measure of fireline reaction intensity that can be quantified using infrared spectral bands available on satellite radiometers (wavelength ~4 μm). Currently, (Collection 6) MODIS FRP is calculated using 4 μm radiance estimates of the fire pixel and neighboring background, i.e., the algorithm measures the excess of thermal radiation from the fire pixel over the background [25]. Instantaneous FRP values during active burning correlate with fire intensity and are proportional to the burned ground cover phytomass [26,27]. A significant relationship between FRP and dNBR indicators has been confirmed [28]; thus, properly calibrated real-time FRP recordings can predict stand mortality and characterize stand-replacing fires [6,23].
In Siberia, the average long-term values of fire-driven vegetation cover loss between 2001 and 2023 are estimated at 20–90% of the total forest stand losses reflected in the Global Forest Change service dataset [23]. An increasing trend in stand-replacing fires across the region has been noted since the early 21st century. This trend is driven partly by climate-induced increases in fire radiative energy characteristics [14]. Over the adjacent intervals of 2001–2012 and 2013–2023, a significant direct relationship (R2 = 0.95, p < 0.01) was found between GFC-derived forest loss areas and increasing fire intensity in Siberia [23].
Several data products dynamically summarize annual changes in vegetation conditions in Siberia. These include the Global Land Cover and Land Use Change catalog (https://glad.umd.edu/dataset/GLCLUC2020, accessed on 15 September 2025), GFC data (https://glad.earthengine.app/view/global-forest-change, accessed on 15 September 2025), and the Vega-Pro service (http://pro-vega.ru/maps/, accessed on 17 June 2026). However, the problem of classifying and predicting stand-replacing fires remains relevant given the wide range of regional differences. In Siberia, significant variability in fire characteristics and post-fire effects is observed, related to forest growth conditions. Widely available vegetation disturbance mapping services allow for comparing of results, assessing the accuracy of tabulated data, and linking additional parameters such as the dNBR and FRP. Using ground-based survey data is generally ineffective due to the sporadic and local nature of field surveys of post-fire areas in Siberia. Therefore, detailing remotely recorded characteristics of fires across various forest stands remains important for calibrating forest stand monitoring services.
Thus, the analysis of fire consequences conducted in this study is relevant for forested areas dominated by larch stands (Larix sibirica, L. gmelinii), where more than 60% of Siberian fire areas are concentrated, and the average long-term relative burned area (RBA) is ~1% of forest area [4].
The main objective of this study was to quantitatively analyze the relationship between the fire energy characteristics in Siberian larch stands and meteorological dynamics. Additionally, the relationship between FRP ranges and actual stand mortality data for 2001–2024 was analyzed. We examined the following aspects:
- (i).
- FRP variations between Siberian forest regions alongside long-term (2001–2024) dynamics of FRP and high-intensity fires;
- (ii).
- Spatiotemporal variations in FRP and climatic factors determining drought conditions;
- (iii).
- Relationship between FRP, fire weather/drought indices, and post-fire tree cover mortality.
2. Materials and Methods
2.1. Study Area
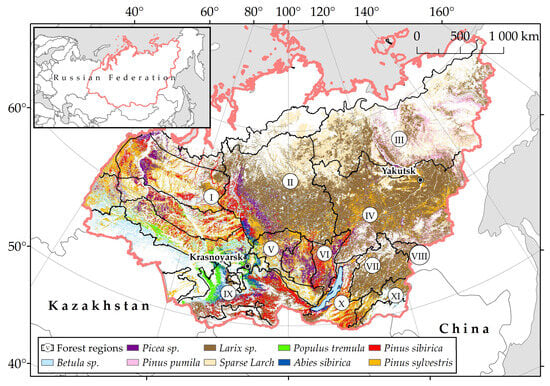
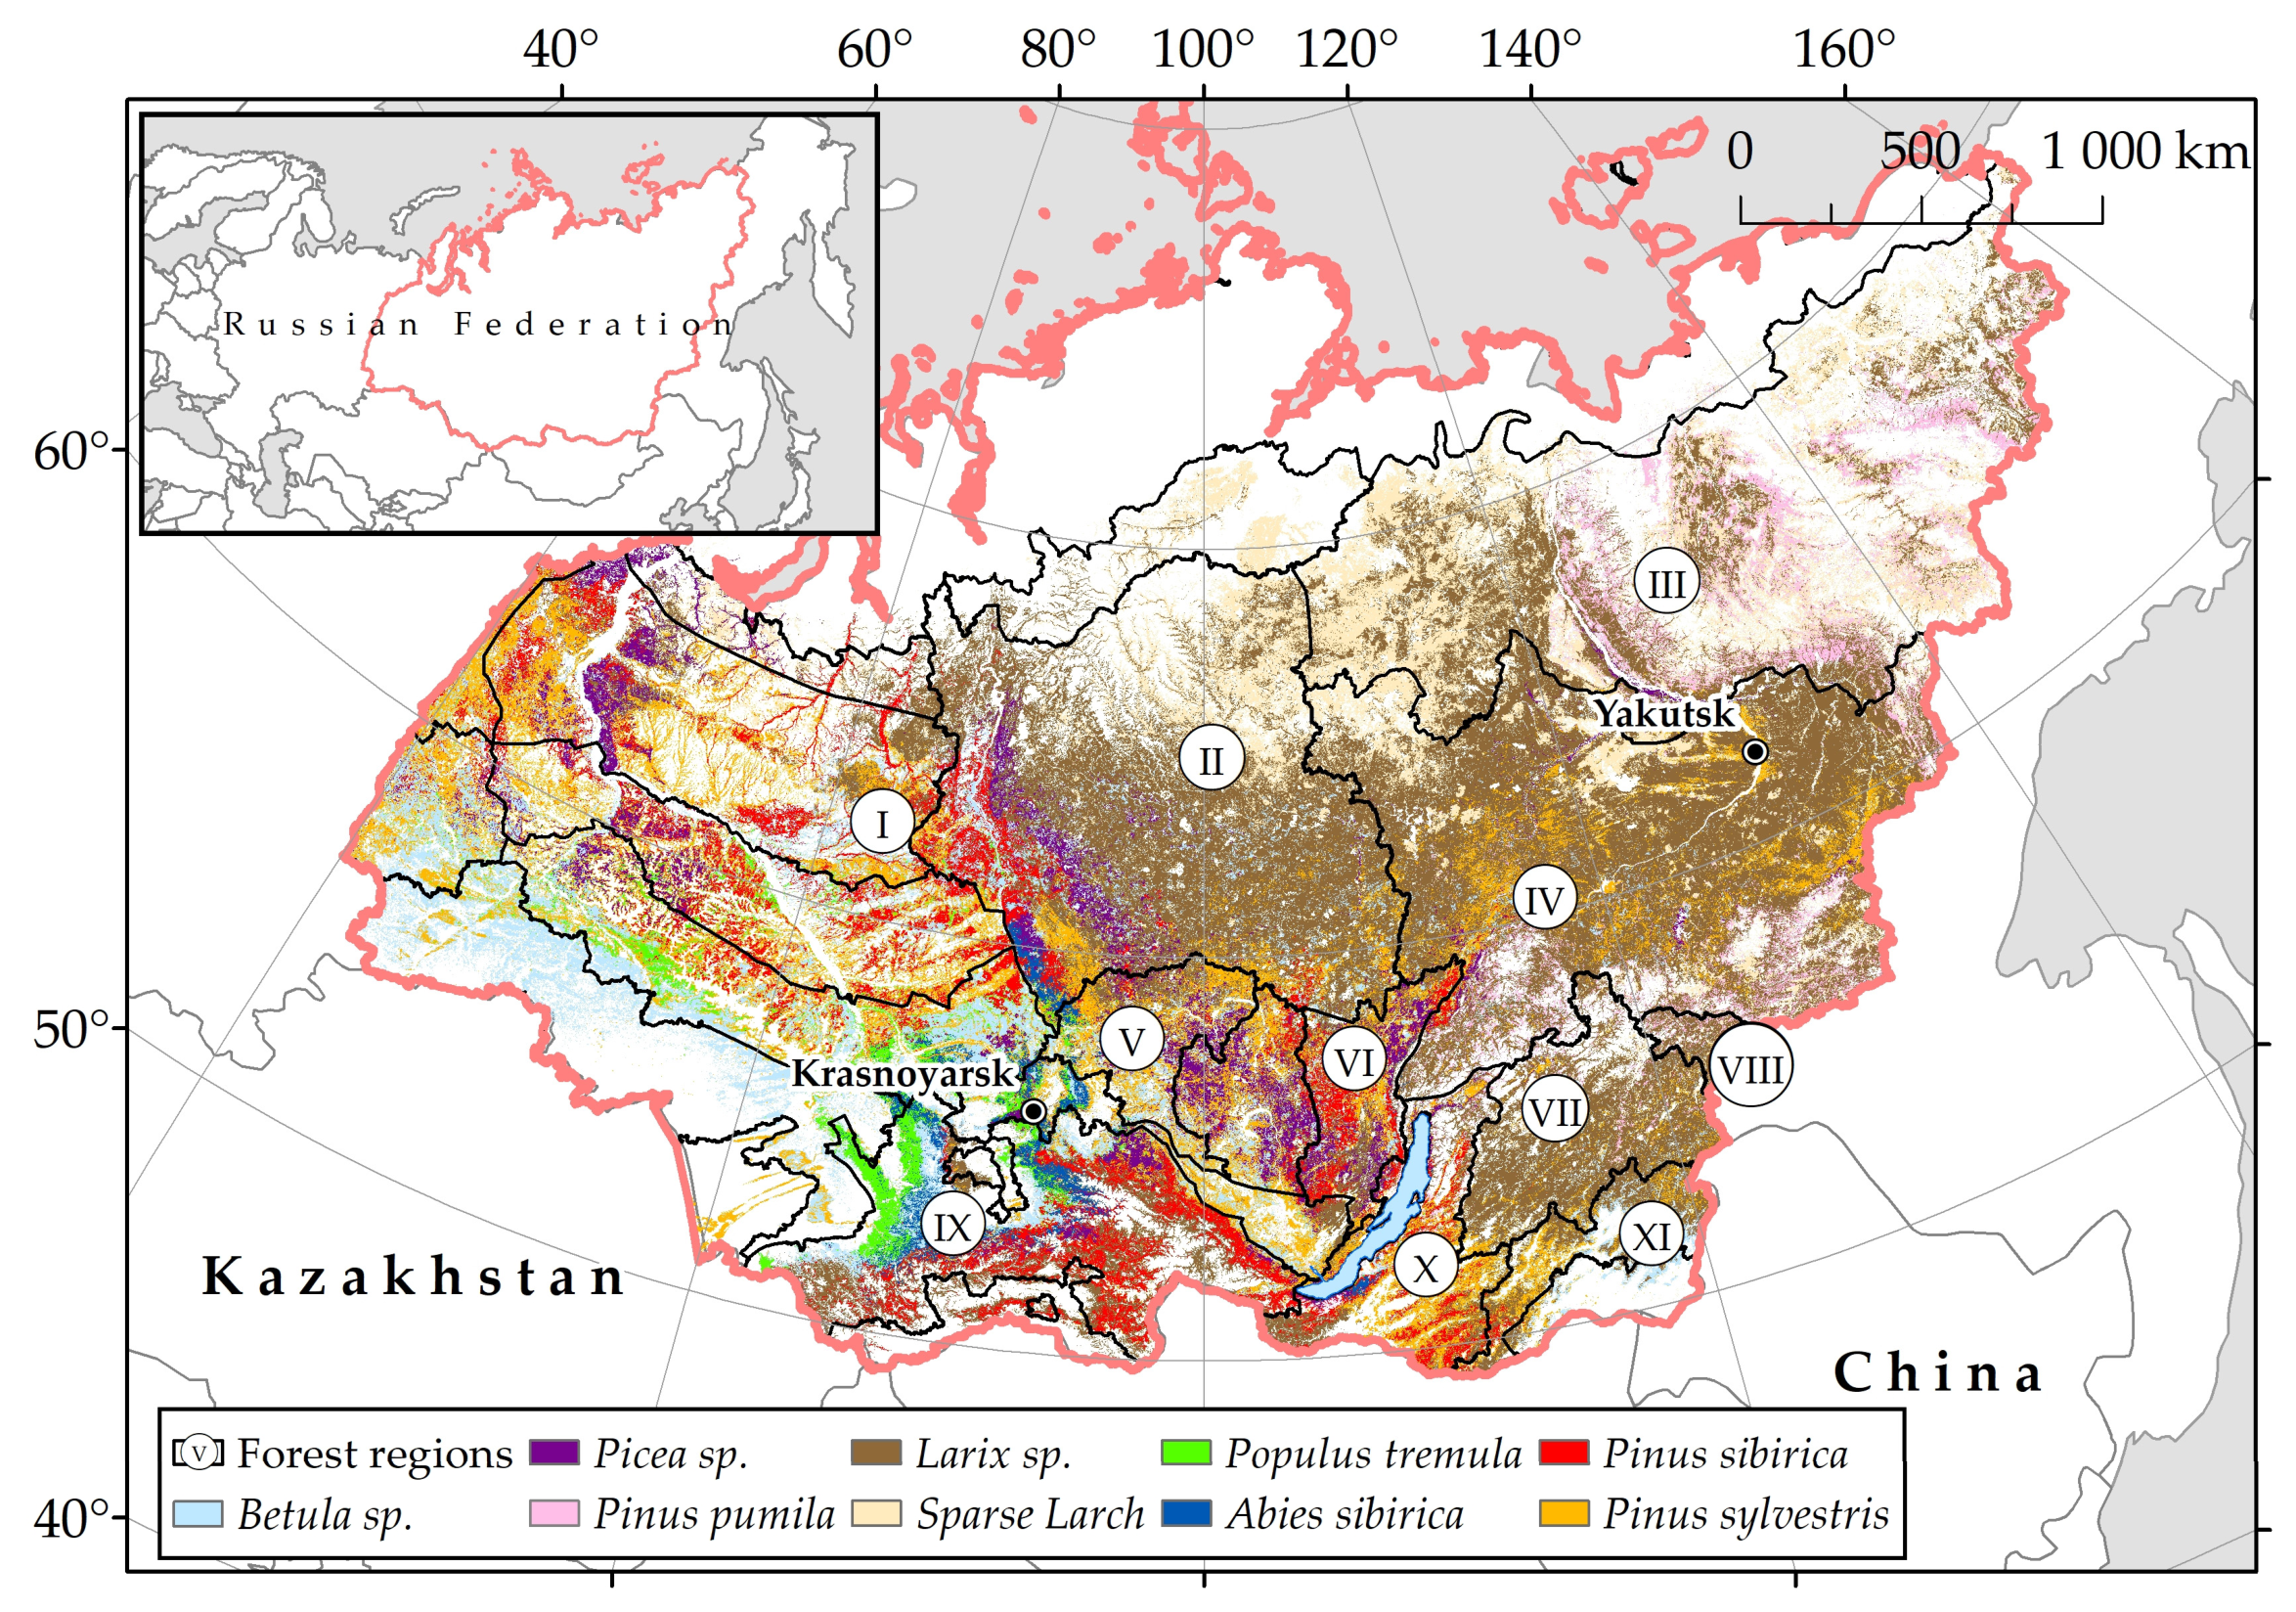
We investigated wildfires and post-fire plots within Siberia (50–75° N, 60–150° E), covering about 9.7 × 10⁶ km2 (Figure 1) and constituting more than 56% of the area of Russia. Siberian forests, including sparse larch stands of the Arctic, are estimated at 6.0 × 10⁶ km2, accounting for about 70% of the forested area of Russia [4]. The forests of Siberia are represented by the northern taiga, middle taiga, southern taiga, and subtaiga zones. The northern taiga is dominated by larch forests (Larix sibirica, Larix gmelinii and Larix cajanderi) with moss and lichen ground cover. The zone of middle taiga is represented by Scots pine (Pinus sylvestris) and larch forests, with some dark-needle coniferous (DNC) stands dominated by Pinus sibirica, Abies sibirica, Picea obovata. Finally, the southern taiga zone is dominated by conifers (larch, pine, DNC stands) as well as deciduous tree species such as Betula pendula, Betula pubescens, and Populus tremula [29,30].
Figure 1.
Territory of Siberia. Main Siberian forest types (based on http://pro-vega.ru/maps/, accessed on 17 June 2026) [31]. Forest regions (I–XI) dominated with larch tree stands.
Based on Vega-service data (Space Research Institute, IKI RAS, Moscow, Russia, http://pro-vega.ru/maps/, accessed on 17 June 2026), larch-dominated forests cover about 2.7–3.0 × 10⁶ km2; the area of Scots pine stands is 0.95–1.0 × 10⁶ km2; dark coniferous stands occupy 0.75 × 10⁶ km2; and deciduous forest covers about 0.77 × 10⁶ km2.
Due to the harsh environment and shallow root system, larch forests on permafrost have mostly low canopy closure and sparse trees, resulting in dominance of surface fires (>90%) [4]. In this study, we analyzed only fires detected in larch-dominated areas, meaning we spatially filtered the fires using a geoinformation layer of dominant forests. We did not consider fires detected in non-forested areas or in dark coniferous forests.
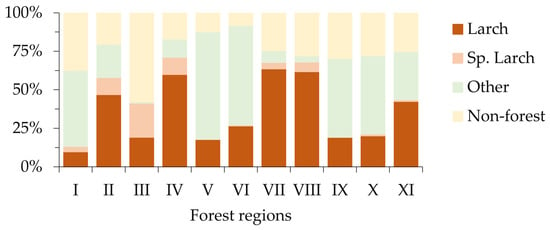
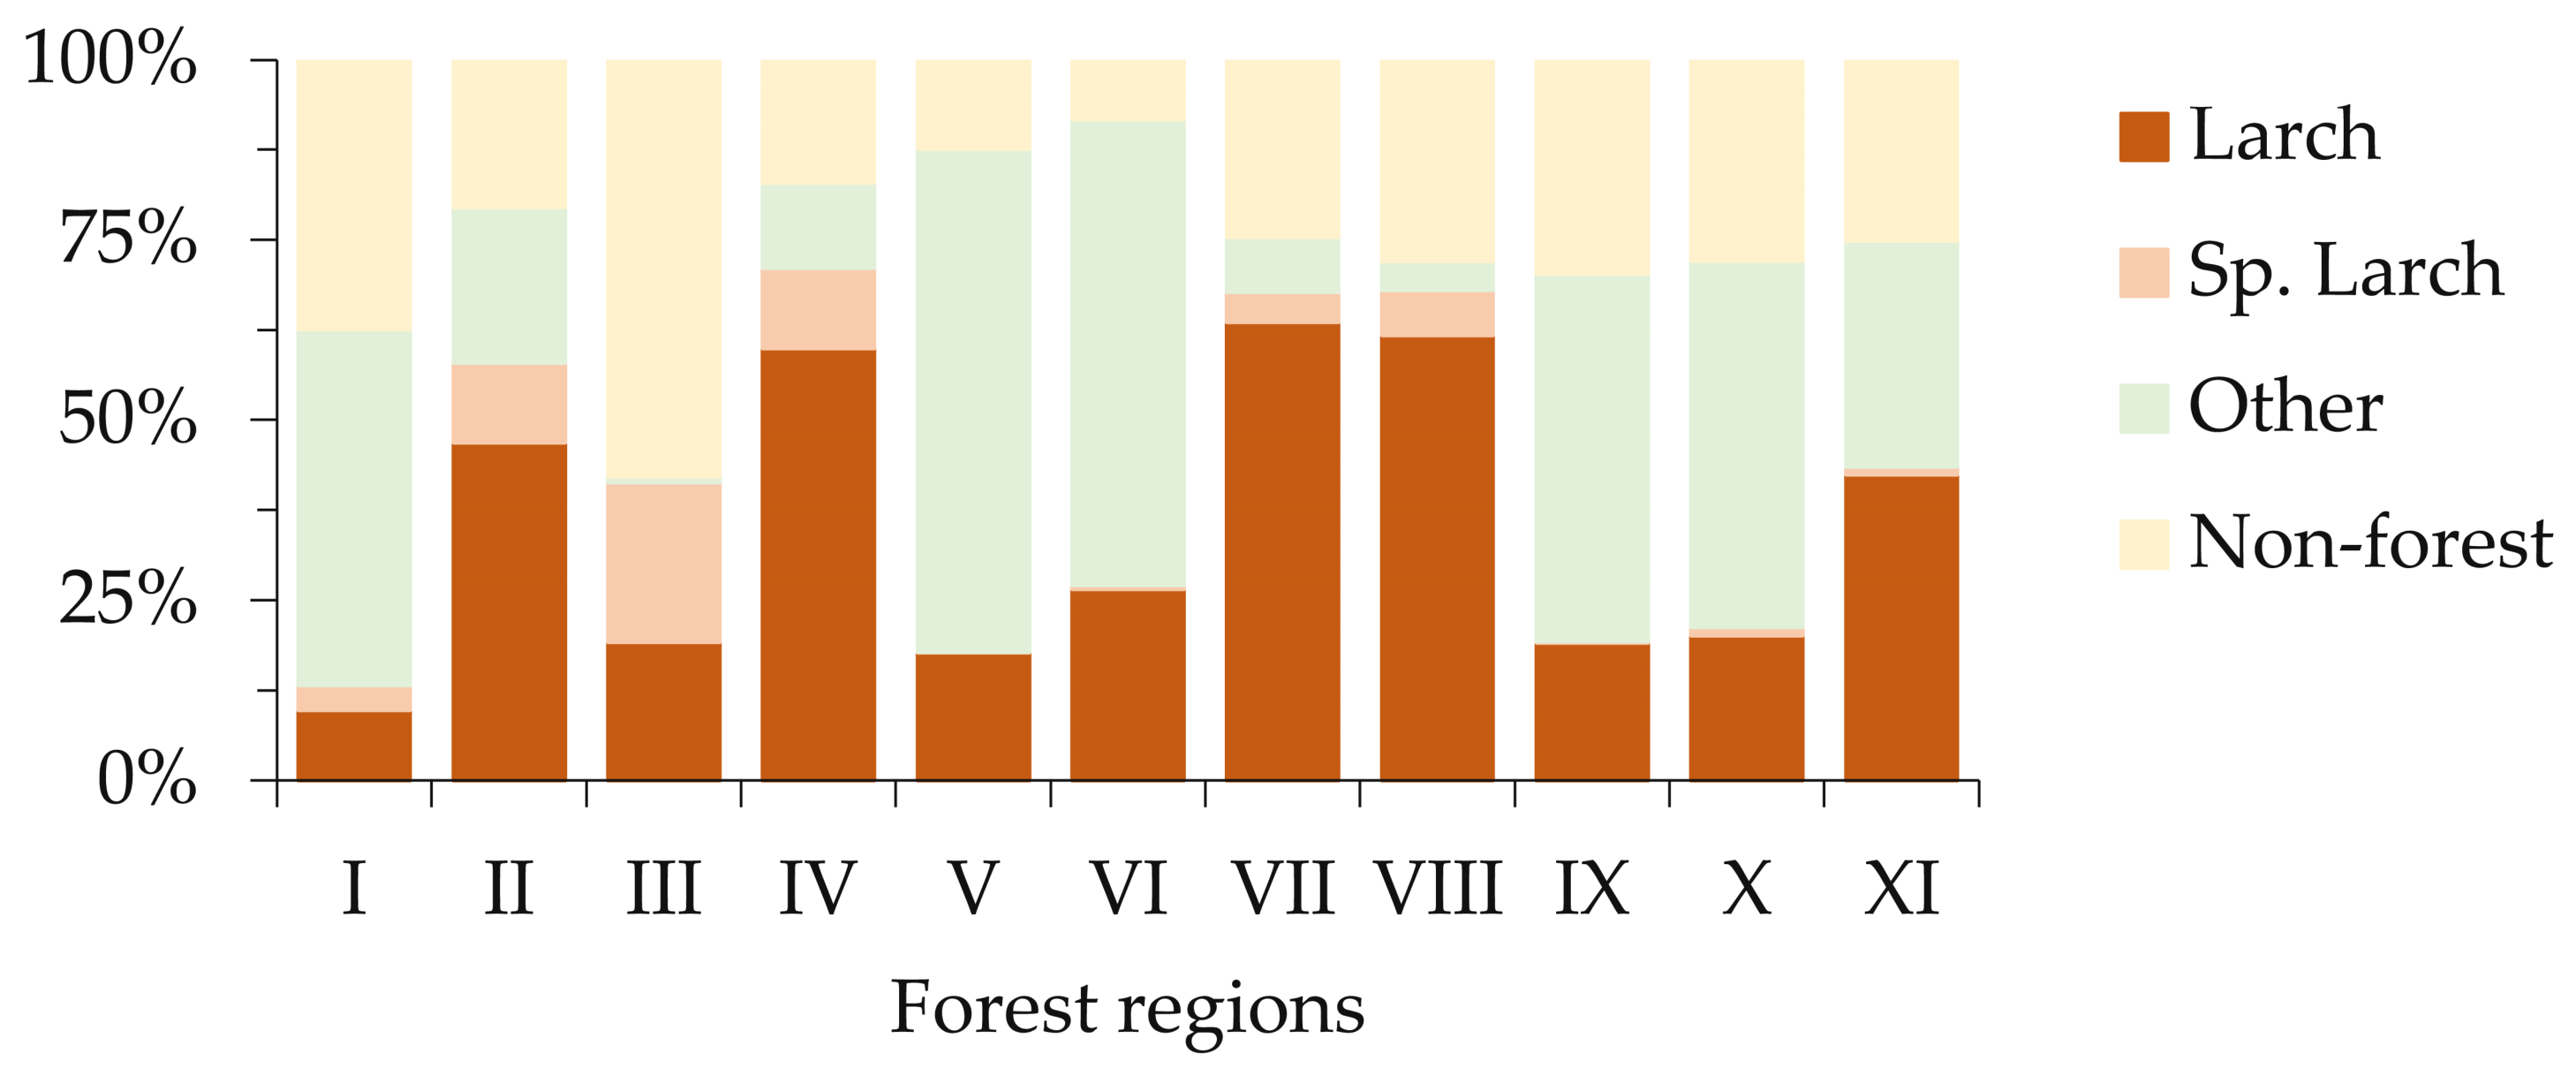
The larch stands examined in this study are distributed across 11 Siberian forest regions (Figure 2). These comprise western—West Siberian plain taiga region (I); central—Central Siberian plateau taiga region (II); eastern—two regions are distinguished: East Siberian region of pre-tundra forests and sparse taiga (III), and East Siberian permafrost taiga (IV); southern—Nizhneangarsky (V) and Verkhnelensky (VI) forest regions; southeastern—Transbaikal mountain-permafrost (VII), Far Eastern taiga (VIII), Baikal (X) and Transbaikal mountain (XI) mountain forest regions, as well as Altai-Sayan mountain-taiga region (IX) were considered.
Figure 2.
The main forest stands ratio (larch, sparse larch, other forest types, non-forested area) in the forest regions (I–XI) of Siberia under consideration (based on http://pro-vega.ru/maps/, accessed on 17 June 2026) [31].
2.2. Data on Burned Area and FRP
The utilized wildfire information consists of a geographic information system (GIS) polygon layer containing coordinates, dates, fire shape, its daily dynamics, and burned areas for 2001–2024 [21]. The approach of Giglio et al. (2003) [32] was applied to pre-process the initial MODIS data. This study considered all wildfires detected across Siberian territories dominated by larch stands for 2001–2024. To determine burned area timing and location data, we utilized the standard MODIS burned area product (MCD64A1), while fire radiative power data were acquired from the MODIS thermal anomalies product (MOD14/MYD14). Both products were downloaded from the Level-1 Atmosphere Archive and Distribution System (LAADS) Distributed Active Archive Center (DAAC) service (https://ladsweb.modaps.eosdis.nasa.gov/, accessed on 15 September 2025). We analyzed datasets on fires detected during the May–September period.
While the nominal spatial resolution of MODIS fire data is ~1 km, the pixel area increases significantly at large scan angles (up to 10 km2 at the swath edges), which results in an increase in FRP values [33]. Therefore, we normalized FRP values by the actual pixel area to prevent overestimation on the swath edges.
For each year from 2001 to 2024, mean annual FRP values were calculated for both the whole study region and for individual forest regions. We also estimated the number of fire pixels with extreme FRP values, using the criterion of FRP ≥ FRPmean + 0.5SDFRP, where FRPmean is the mean FRP value and SDFRP is the standard deviation.
In this study, we used discrete FRP data, which contain gaps during certain phases of wildfire development. This should be recognized as one of the limitations for the generalization of the results. However, the duration of a single fire event in Siberia can regularly be more than 30 days. In our analysis, we consider a multi-day series of FRF data, which indirectly reflects long-term characteristics of fire impact. This technique allows the authors to assume that integrated FRP values projected at the area of interest scale may be, as a first approximation, adequate for the purposes of this study, namely, for the evaluation of stand mortality correlating with potential fire intensity.
We performed spatial analysis of fire radiative power at two spatial scales. First, we considered larch-dominated forest regions of Siberia (Figure 1). Second, we utilized a regular grid with a cell size of 30’ × 30’ (WGS1984 coordinate system). The total number of fire pixels within the grid cells from 2001 to 2024 was ~686,000. Each grid cell was characterized by the annual aggregated FRPsum value registered during 2001–2024, calculated as the sum of the pixel’s FRP values within the cell.
Burned area dynamics within each grid cell were characterized using the relative burned area (RBA) metrics, calculated as: RBA = 100%·Sburned/Slarch, where Sburned is the mean annual burned area within the grid cell (ha) and Slarch is the area of larch forest within the same grid cell (ha).
2.3. Forest Cover Change Data
To identify areas with post-fire forest cover loss, we used the open access Global Forest Change (GFC) product (https://glad.earthengine.app/view/global-forest-change, accessed 15 September 2025) [34,35] of version 1.12. This dataset is derived from 30 m resolution Landsat-7 and -8 imagery incorporating a baseline forest cover layer from the year 2000, and dynamic layers of annual changes (gain or loss) in forest cover spanning 2001–2024 [35].
For each cell of the fire grid, annual values of post-fire tree stand mortality were also calculated. We calculated such estimates as the ratio of the number of GFC pixels showing larch stand mortality to the total number of GFC pixels corresponding to larch forests within a given grid cell.
Because fire-induced stand mortality can occur several years after pyrogenic impact, we applied a 3-year threshold following the standard approach used to study fire disturbances in Russia [22].
2.4. Vegetation Cover Data
Dominant forest stand types were determined using data from the Vega-Pro service (Space Research Institute, IKI RAS, Moscow, Russia, http://pro-vega.ru/maps/, accessed on 17 June 2026) [31]. The forest stand data are updated annually using 230 m Terra and Aqua/MODIS imagery. We selected fires detected in larch-dominant forest stands using the spatiotemporal intersection of the “Fires” and the “Vegetation cover” layer using the open-source QGIS software (Quantum Geographic Information System, ver. 3.16.3, https://www.qgis.org/, accessed 15 September 2025).
2.5. Climatic Data and Fire Danger Indices
To describe the weather conditions, we used average monthly air temperature, precipitation amount, and moisture content of the upper (0–7 cm) litter layer, extracted from the ERA5-Land climate database (https://cds.climate.copernicus.eu/datasets, accessed 10 June 2026), with the resolution of 0.1° × 0.1° [36]. To characterize the seasonal weather fire danger variability across the study area, we also utilized the Canadian Forest Fire Weather Index (FWI) system [37], which comprises six indices describing moisture in different forest fuel layers and fire characteristics. For the analysis, we used the Global FWI database [38] (https://portal.nccs.nasa.gov/datashare/GlobalFWI/, accessed 15 September 2025) to extract data from 1985 to 2024. Additionally, the Standardized Precipitation Evapotranspiration Index (SPEI) was used to characterize the moisture conditions. This index evaluates the difference between precipitation and potential evaporation [39]. SPEI data for the period from 1985 to 2024 were downloaded from http://sac.csic.es/spei/map/maps.html (accessed 15 September 2025).
For the climatic variables and fire danger indices, we calculated mean monthly values for the period 1985–2000 to serve as “background” data and a long-term norm. Then, for each month (May–September) from 2001 to 2024, anomalies of these indices were calculated as the difference between the value for the current year and the mean value for the “background” period. The analysis incorporated climatic data from both the month of fire detection and the preceding month.
To analyze spatiotemporal dynamics, we rescaled climatic data to the 30’ × 30’ spatial grid and calculated temporal trends within each grid cell. This enabled us to identify regions with increasing and decreasing trends in drought conditions.
2.6. Assessment of Importance of Climatic and Drought Variables
We assessed the relative importance of climatic and fire weather variables on probable post-fire tree mortality. This analysis was performed on a monthly temporal scale, using the 30’ × 30’ spatial grid. We utilized “anomalies” of the variables representing the difference between the variable value during the month with fire events (or the preceding month) and the same month in the “background” data. Variables used in this analysis are listed in Table 1.
Table 1.
Anomalies of fire weather and climatic variables used in the analysis.
We used indices (codes) of the Canadian Fire Weather Index (FWI) system, a component of the Canadian Forest Fire Danger Rating System (CFFDRS). The Canadian Fire Weather Index (FWI) is widely used for fire danger assessment, offering an integrated and operationally validated approach that combines temperature, relative humidity, wind speed, and precipitation [37]. Originally developed for Canadian boreal forests, the FWI has been widely applied across many regions of the world, including Siberia [40,41,42]. Primary components include the Fine Fuel Moisture Code (FFMC), the Duff Moisture Code (DMC), and the Drought Code (DC), representing the moisture content of three fuel layers. The FFMC represents the moisture content of litter and other cured fine fuels in a forest stand, with a dry weight layer of approximately 0.25 kg/m2. The DMC represents the moisture content of loosely compacted, decomposing organic matter weighing approximately 5 kg/m2 when dry, and the DC represents a deep layer of compact organic matter weighing approximately 25 kg/m2 when dry [37]. The Initial Spread Index (ISI), derived from the FFMC and wind speed, represents the rate of fire spread. The Build-Up Index (BUI) combines the DMC and DC to estimate total fuel available to the spreading fire. The final Fire Weather Index (FWI) combines the ISI and BUI, and represents fire intensity [37].
Feature importance analysis was performed in Python (version 3.11) using the Scikit-learn machine learning library (version 1.3.2). To quantify feature importance in predicting post-fire forest mortality, we used decision tree ensemble approach, including the Random Forest and the gradient boosting methods implemented in the LightGBM and XGBoost libraries. Feature importance was assessed using information obtained during ensemble generation. Decision tree-based models split data into nodes based on feature values, utilizing impurity metrics to determine the best split by evaluating node class distribution.
The Gini Impurity metric was used to assess the mean decrease in impurity and estimate the relative importance of each feature. Feature importance was further assessed using a random permutation of feature values (the permutation importance function in the Scikit-learn library) by analyzing the impact on regression accuracy. If permuting a feature’s values significantly reduces regression accuracy, the feature is considered important.
3. Results
3.1. Annual Wildfire Statistics for Larch Stands of Siberia
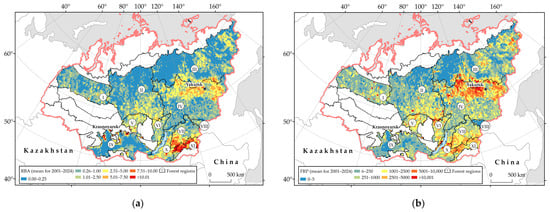
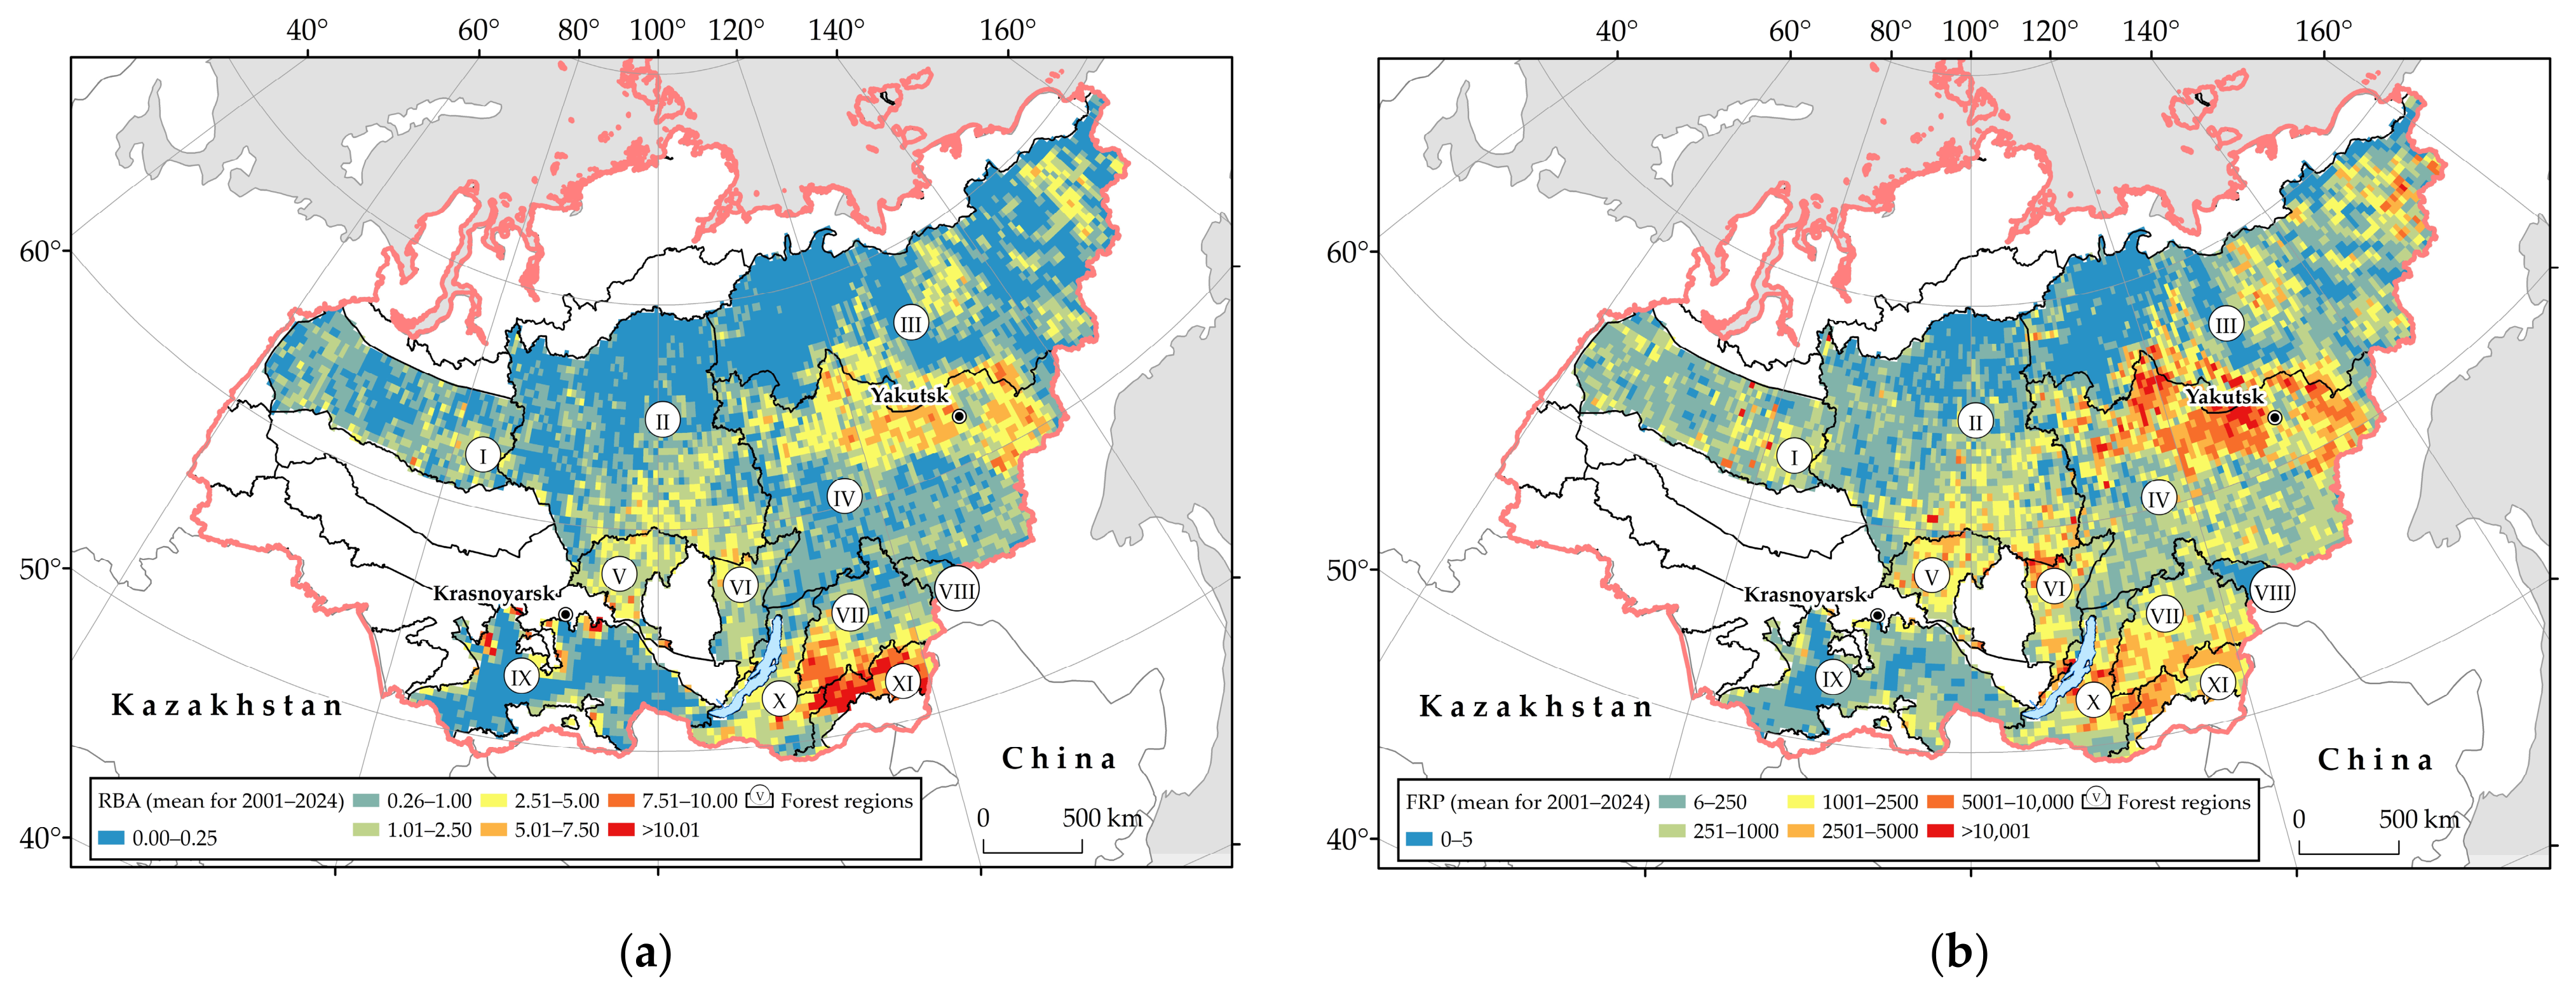
Fires in larch-dominant stands account for up to 60% of the total burned area in Siberia. Between 2001 and 2024, the Relative Burned Area (RBA) doubled (Table 2). The spatial distribution of burned area revealed that the highest RBA values (exceeding 7.5 or even 10) were observed in the southern regions of Siberia, particularly the Transbaikal territory, mainly the Transbaikal mountain forest (XI) region. High RBA values were also recorded in the northern part of the East Siberian permafrost taiga region (IV) (Figure 3a).
Table 2.
Relative burned area (RBA) in 5-year intervals (2001–2024) within selected larch-dominated forest regions of Siberia.
Figure 3.
Spatial distribution of mean annual values (2001–2024) of (a) RBA and (b) FRP values across selected larch-dominated forest regions (I–XI) of Siberia.
Averaged annual FRPsum values vary significantly from <250 MW/year to >10,000 MW/year within individual grid cells across the study area (Figure 3b). The spatial FRP distribution reflects the natural variability of fire effects in Siberian larch stands between 2001 and 2024, with maximum fire impact along the boundary between the East Siberian region of pre-tundra forests and sparse taiga (III) and the East Siberian permafrost taiga region (IV). The Transbaikal mountain forest (XI) region was also characterized by high mean FRP values.
3.2. Wildfire FRP Variations in Larch Stands
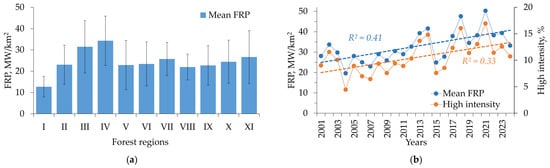
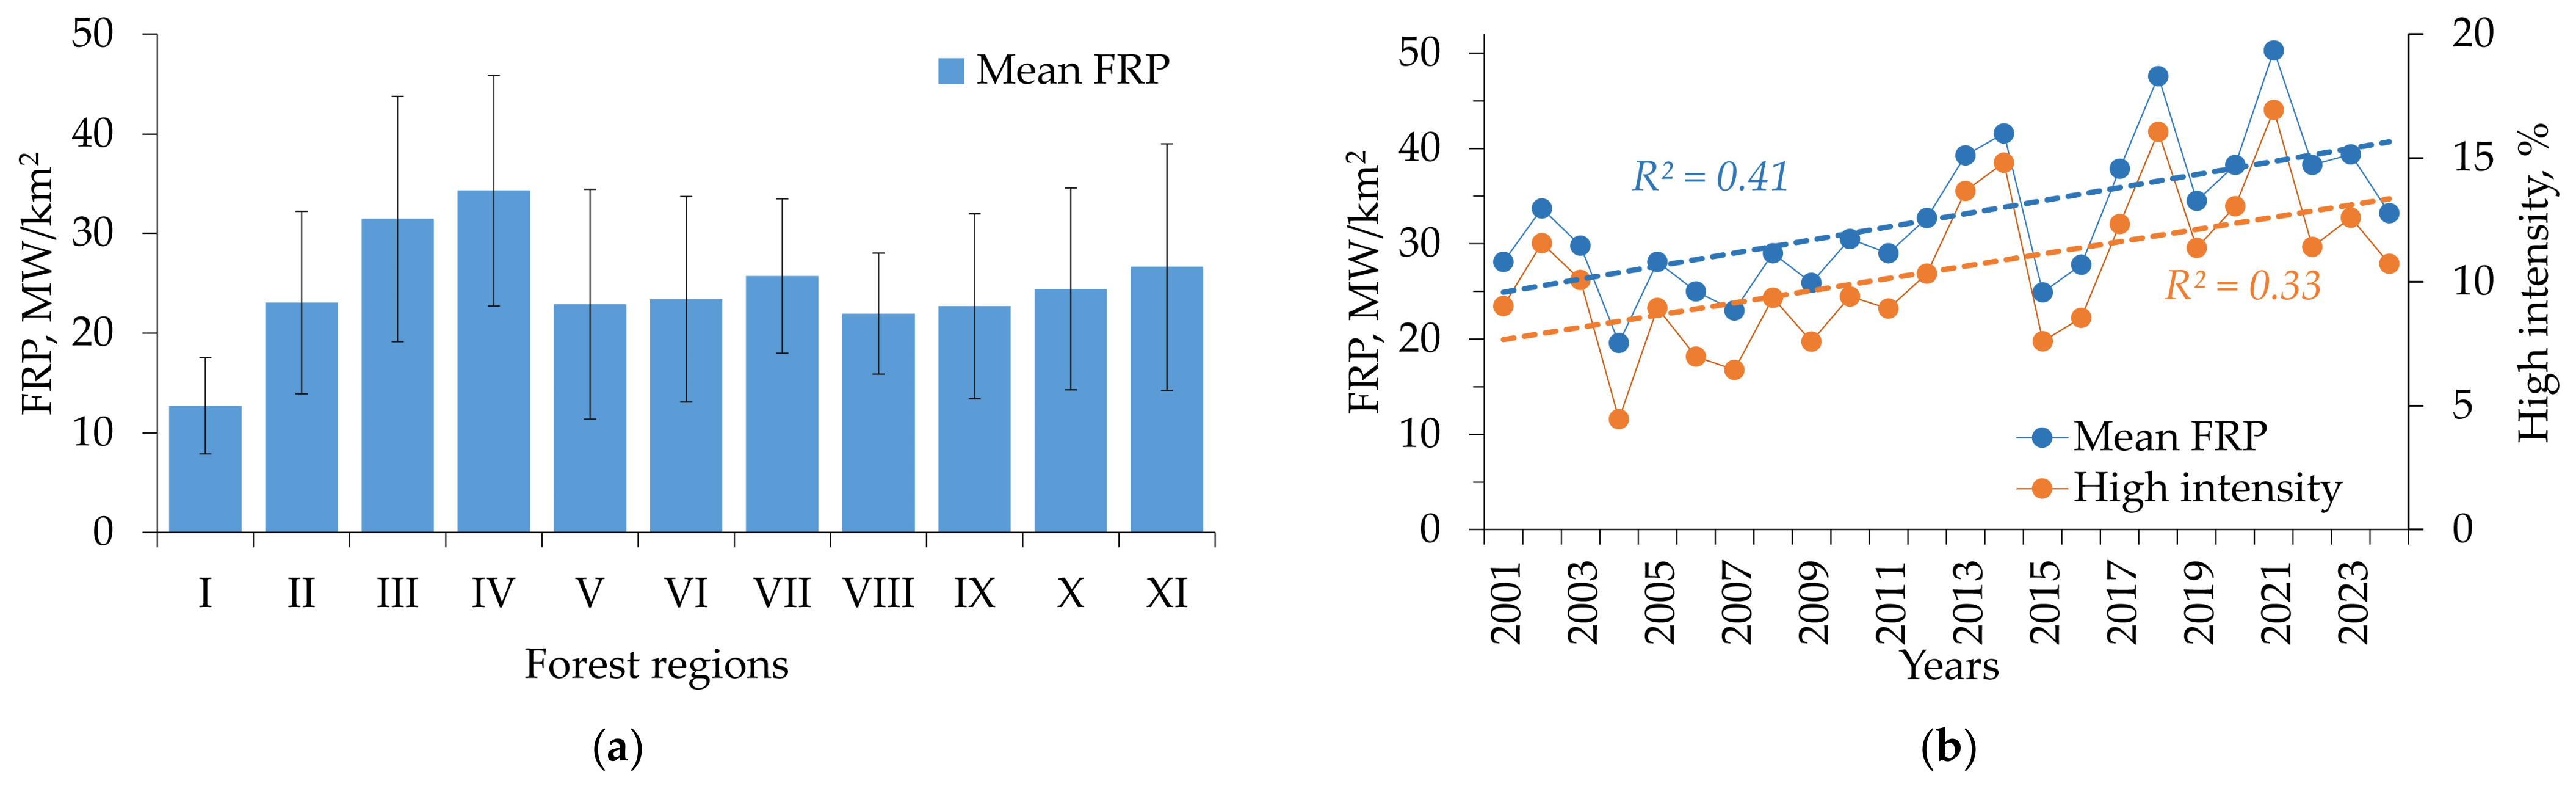
The East Siberian pre-tundra forests and sparse taiga region (III) and the East Siberian permafrost taiga region (IV) were characterized by the highest mean FRP values, exceeding the mean FRP for all of Siberia by ~32% (Figure 4a). The proportion of high intensity fire pixels with FRP values exceeding FRPmean + 0.5SDFRP varied between 4.5 and 17.9% of the total number of fire pixels. Previous estimates indicate that extreme FRP values correspond to the most intense fire events, accounting for 5–15% of fire events in Siberian larch forests [43]. A statistically significant increase was found in both mean FRP (R2 = 0.41, p < 0.01) and the number of high-intensity fire pixels (R2 = 0.33, p < 0.01) across Siberia between 2001 and 2024 (Figure 4b).
Figure 4.
(a) Mean FRP values for individual forest regions in Siberia (I–XI) dominated with larch tree stands. (regions with ≥1000 fire pixels). (b) Dynamics of mean FRP values and percentage of high-intensity fires for Siberia between 2001 and 2024.
Mean fire radiative power in the region was 33 ± 11 MW/km2 with peak values reaching 1700–1800 MW/km2, depending on the fire season (Table 3). The last decade of the study period (2011–2024) showed an increase in fire activity comparing to the previous decade (2001–2010). Mean FRP increased by ~34% and the number of high intensity fire pixels by ~44%. The Mann–Whitney U-test also confirmed that FRP values in 2011–2024 were significantly higher (p < 0.05) than in 2001–2010.
Table 3.
FRP statistics for Siberian larch forests between 2001 and 2024.
3.3. Fire Radiative Power and Drought Indices
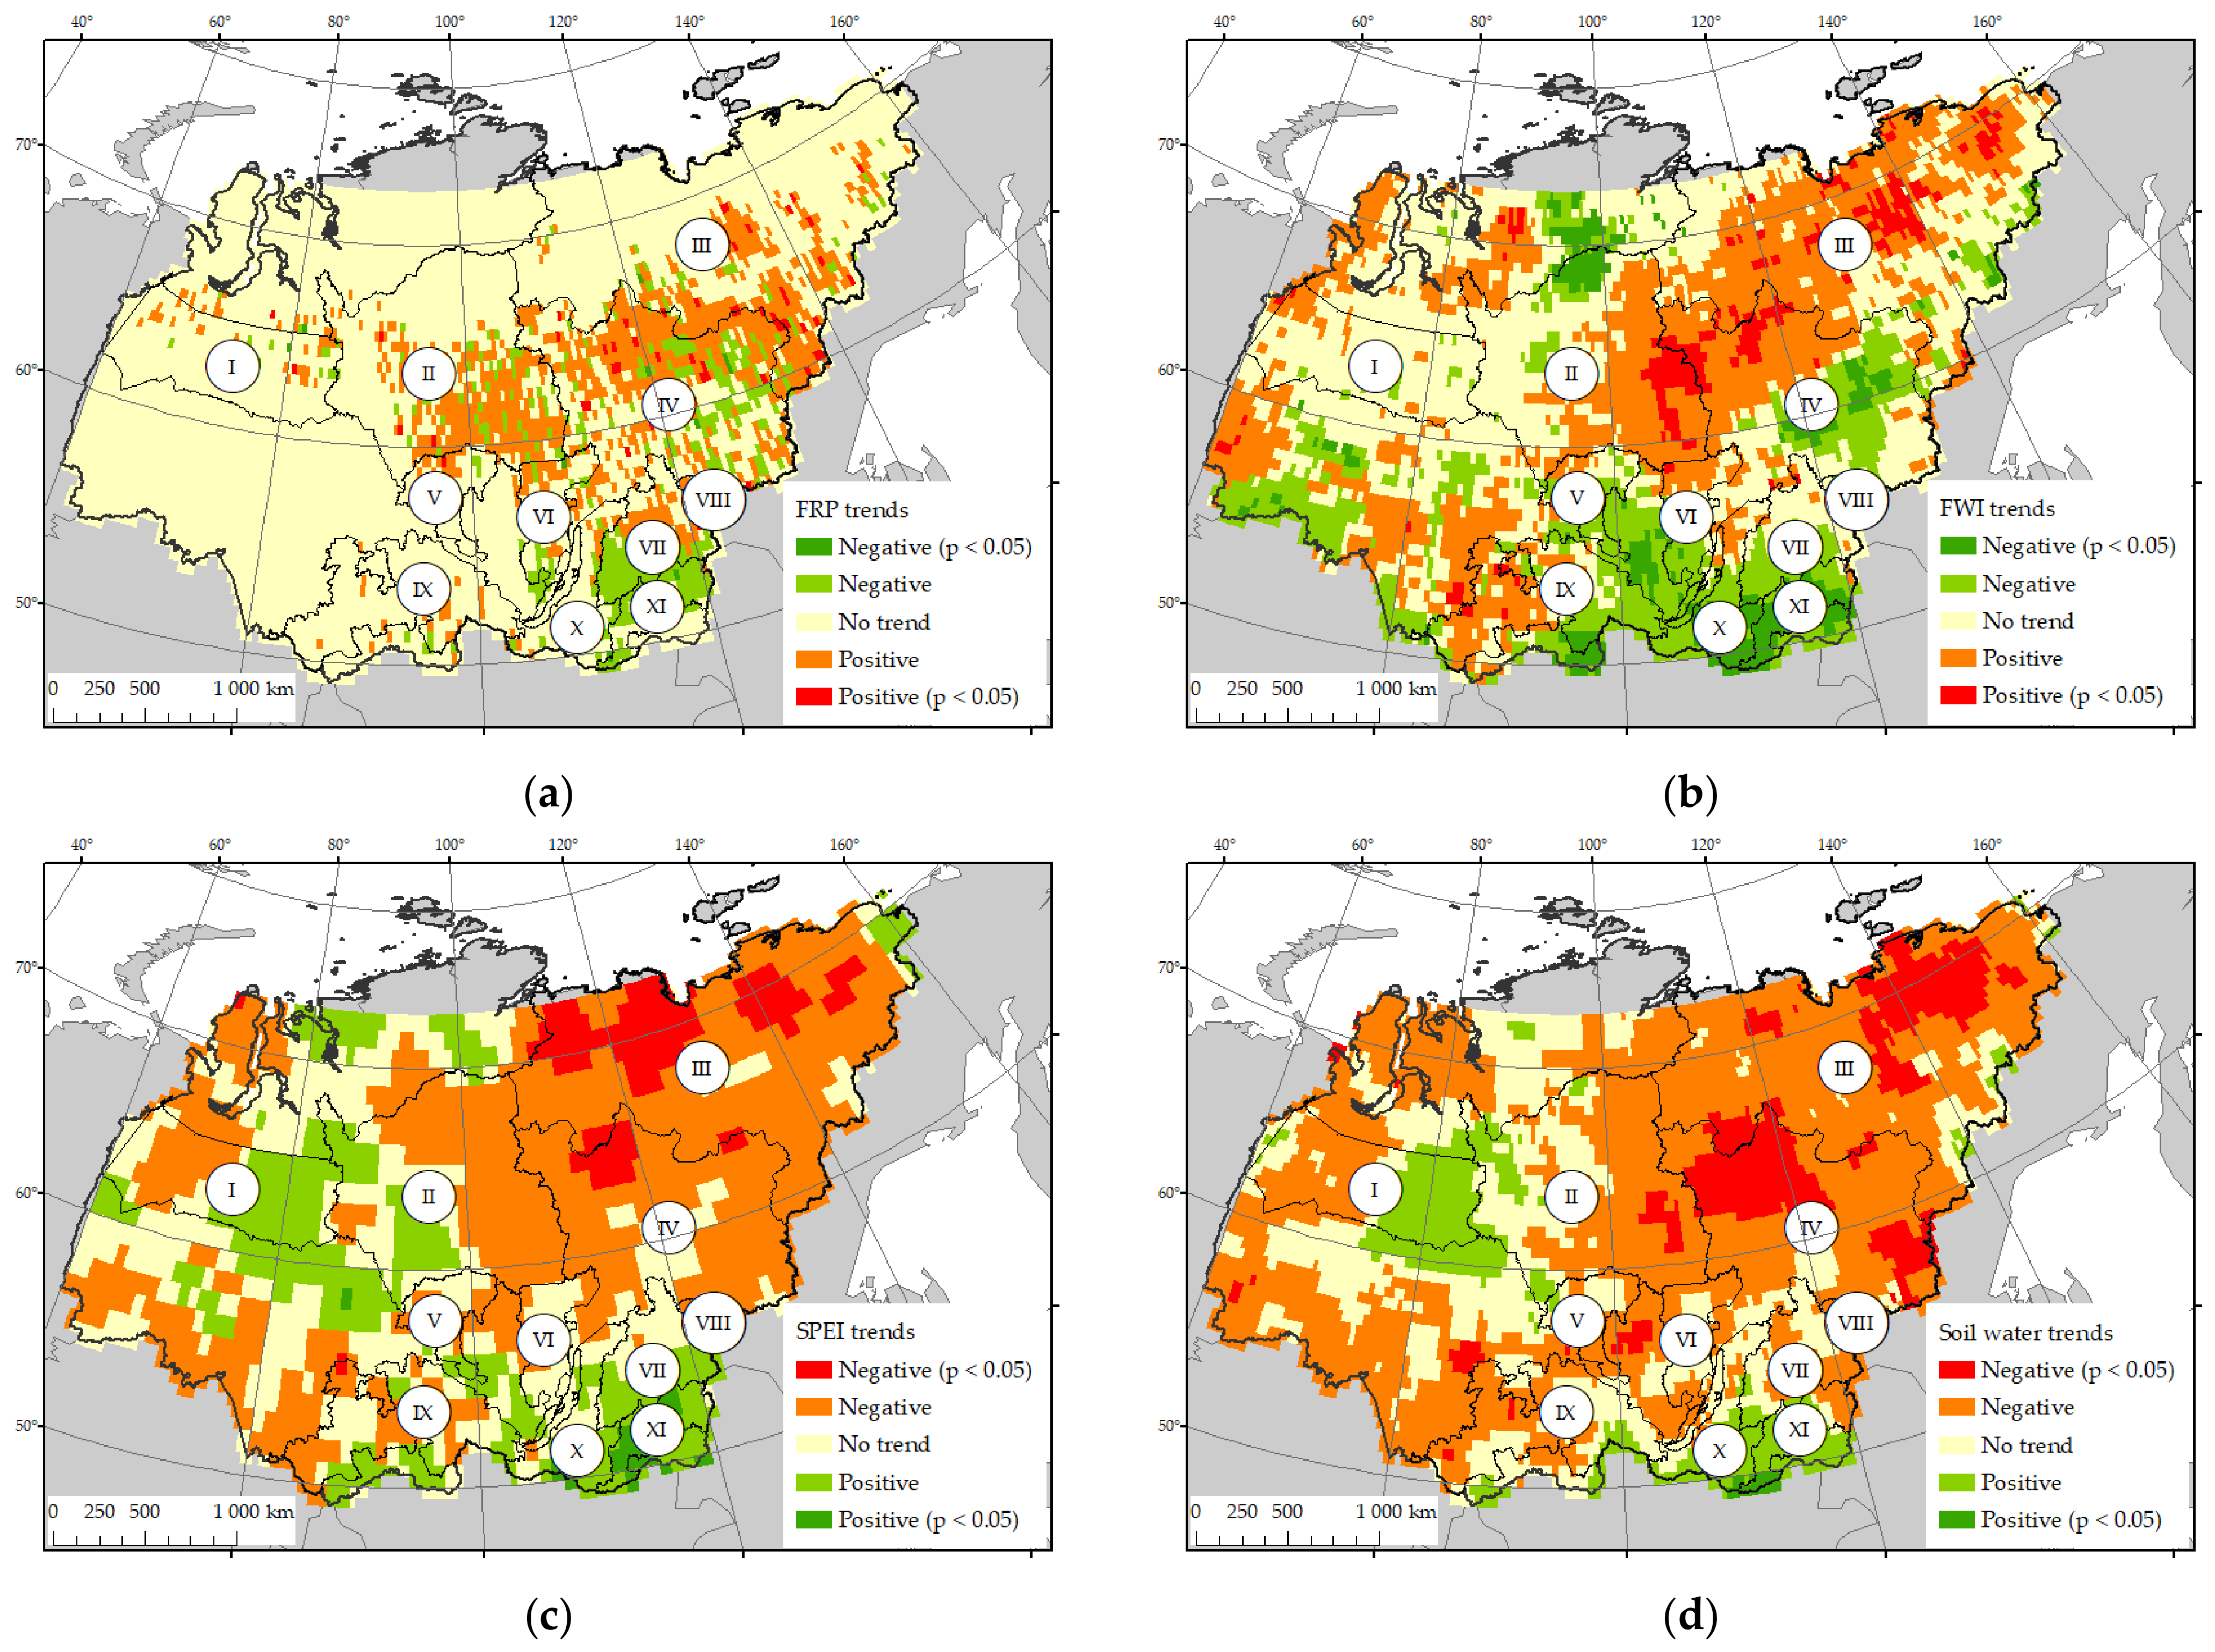
We compared the spatiotemporal dynamics of FRP values with several indices characterizing drought conditions in Siberia. Increasing FRP trends were mainly observed in the northern part of the study area (Central Siberian plateau taiga region (II), East Siberian region of pre-tundra forests and sparse taiga (III) and East Siberian permafrost taiga (IV)) (Figure 5a). In these regions, several years of high fire activity occurred in the second half of the study period (2018–2021 and 2024). In contrast, decreasing FRP trends were observed in the southeastern part of the study area (forest regions VII, X, XI). This part of the study region was also characterized by high RBA values, although high fire activity here was mainly in the early 2000s.
Figure 5.
Spatiotemporal variations in (a) fire radiative power in larch forests; (b) Fire Weather Index; (c) Standardized Precipitation Evapotranspiration Index; (d) soil water content. Areas with statistically significant trends (p < 0.05) are shown separately. For SPEI and soil water content (panels (c,d)), negative trends correspond to increased drought.
An increase in fire radiative power in the northern and northeastern parts of the larch range correlates quite well with the dynamics of indices describing fire danger and moisture conditions (Figure 5b–d). Forest regions III (East Siberian region of pre-tundra forests and sparse taiga), IV (East Siberian permafrost taiga) and the eastern part of region II (Central Siberian plateau taiga region) showed increasing trends in the Fire Weather Index and decreasing trends in Standardized Precipitation Evapotranspiration Index and soil moisture content, indicating drier conditions towards the end of the study period. In contrast, the southeastern part of the study area showed trends indicating wetter conditions, likely driving the decrease in fire activity in this region.
3.4. Wildfire Intensity and Tree Stand Mortality
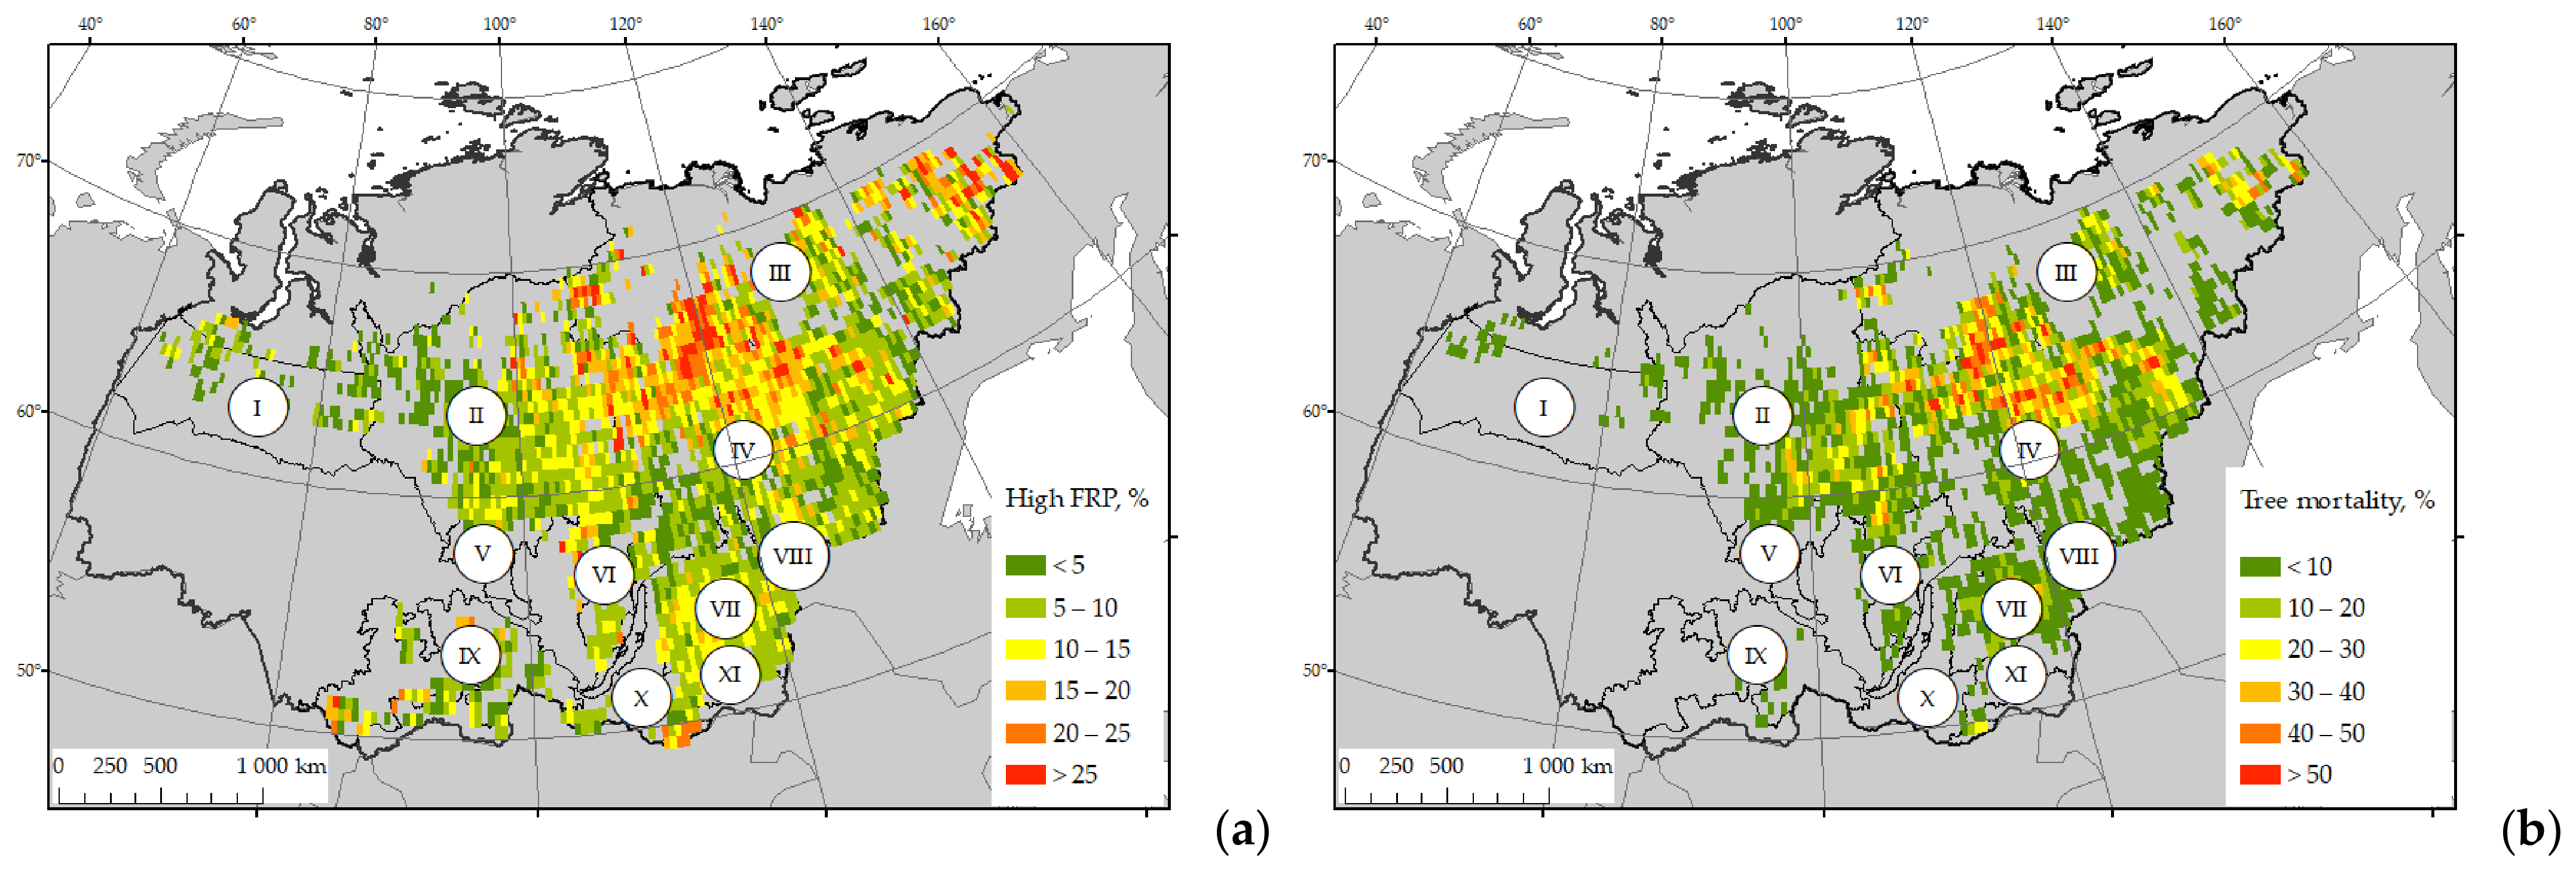
Spatial distribution of tree cover mortality in larch stands was evaluated relative to the number of high-intensity wildfire pixels. Areas with the largest proportion of high-intensity fires (15% to >25%) were mainly located in the central and north-eastern part of Siberia, including forest regions III (East Siberian region of pre-tundra forests and sparse taiga) and IV (East Siberian permafrost taiga) (Figure 6a). In the south-eastern part of the study area (Transbaikal territory including forest regions VII, X, XI), the proportion of high-intensity fires was lower, making up 10–15%.
Figure 6.
Spatial distribution of (a) proportion of high-intensity fires and (b) tree cover mortality within the 30’ × 30’ regular grid. (I–XI)—forest regions of Siberia dominated with larch tree stands.
In current research, interpolation within a regular network should be observed as spatial variability of actual values on the analyzed parameters. Thus, we could assume that the statistical bias introduced by spatial structure did not noise the sub-regional pattern of tree mortality, high intensity fires, fire weather data, etc., in fact.
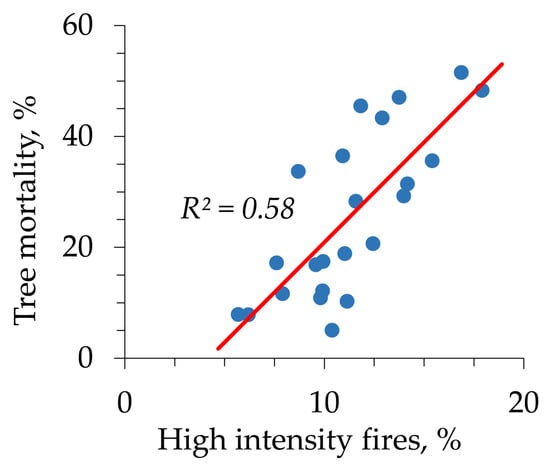
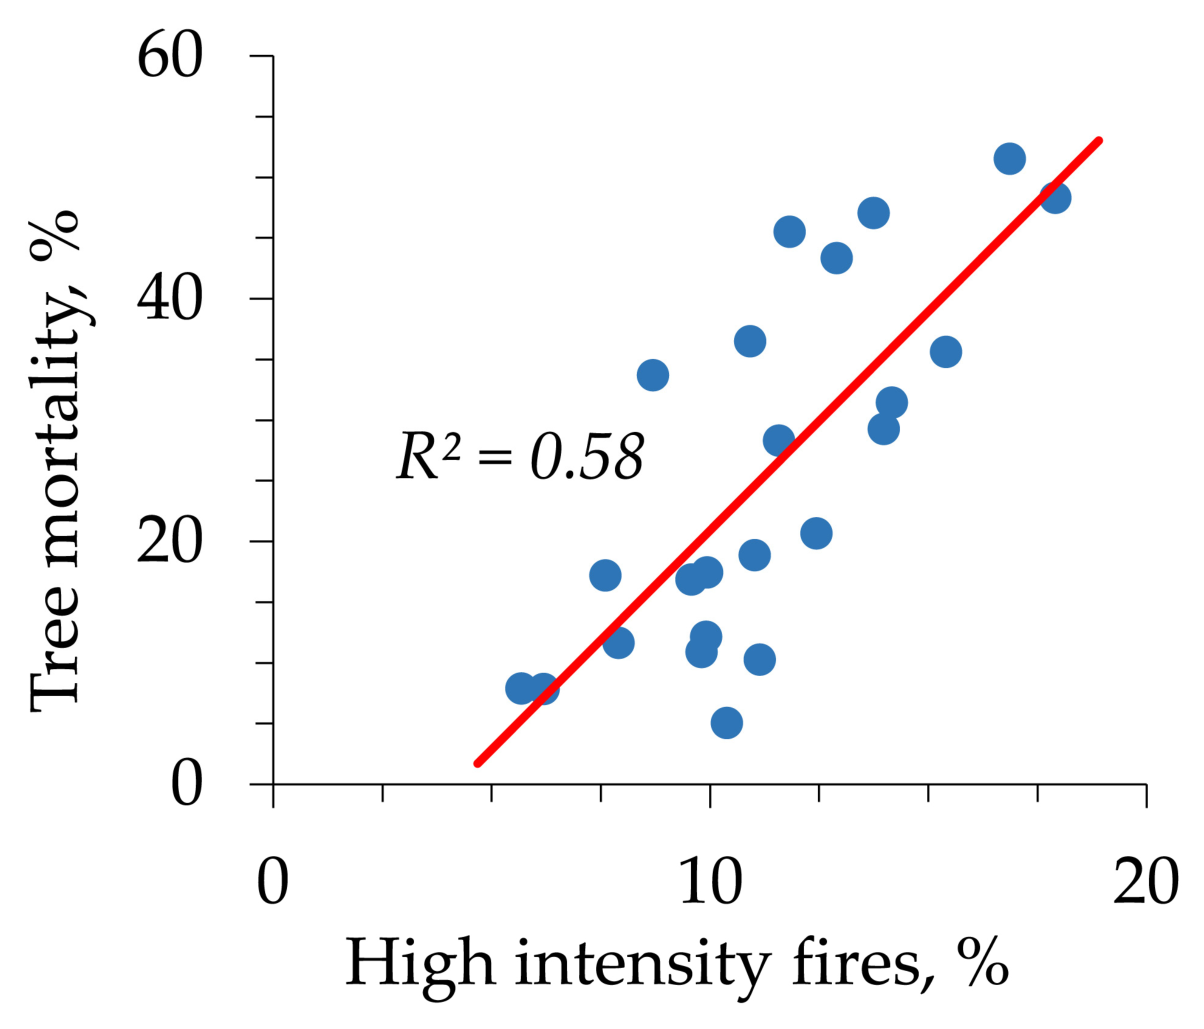
The spatial distribution of fire-induced tree stand mortality generally follows such a pattern (Figure 6b). Areas with high tree mortality values (>30%) were mostly located in the northeastern part of the study region. Figure 7 shows the relationship between the proportion of high-intensity fire pixels and post-fire tree mortality, which is statistically significant and modeled using linear regression (R2 = 0.58, p < 0.05).
Figure 7.
Proportion of high intensity fires (in %) vs. tree mortality (in %) for the larch forests of Siberia. Each data point corresponds to single year within the study period (2001–2024).
The Mann–Whitney U-test confirmed that both the proportion of high-intensity fires and post-fire forest mortality in the second decade of the study period (2011–2024) were significantly (p < 0.05) higher than in 2001–2010 (Table 4).
Table 4.
Proportion of high-intensity fires and post-fire tree mortality between 2001 and 2024.
3.5. Relative Importance of Climatic and Fire Weather Factors in Assessing Tree Stand Mortality
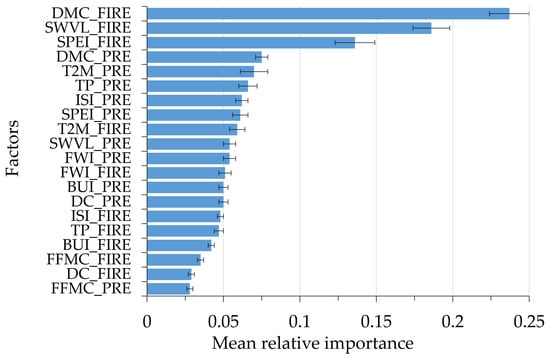
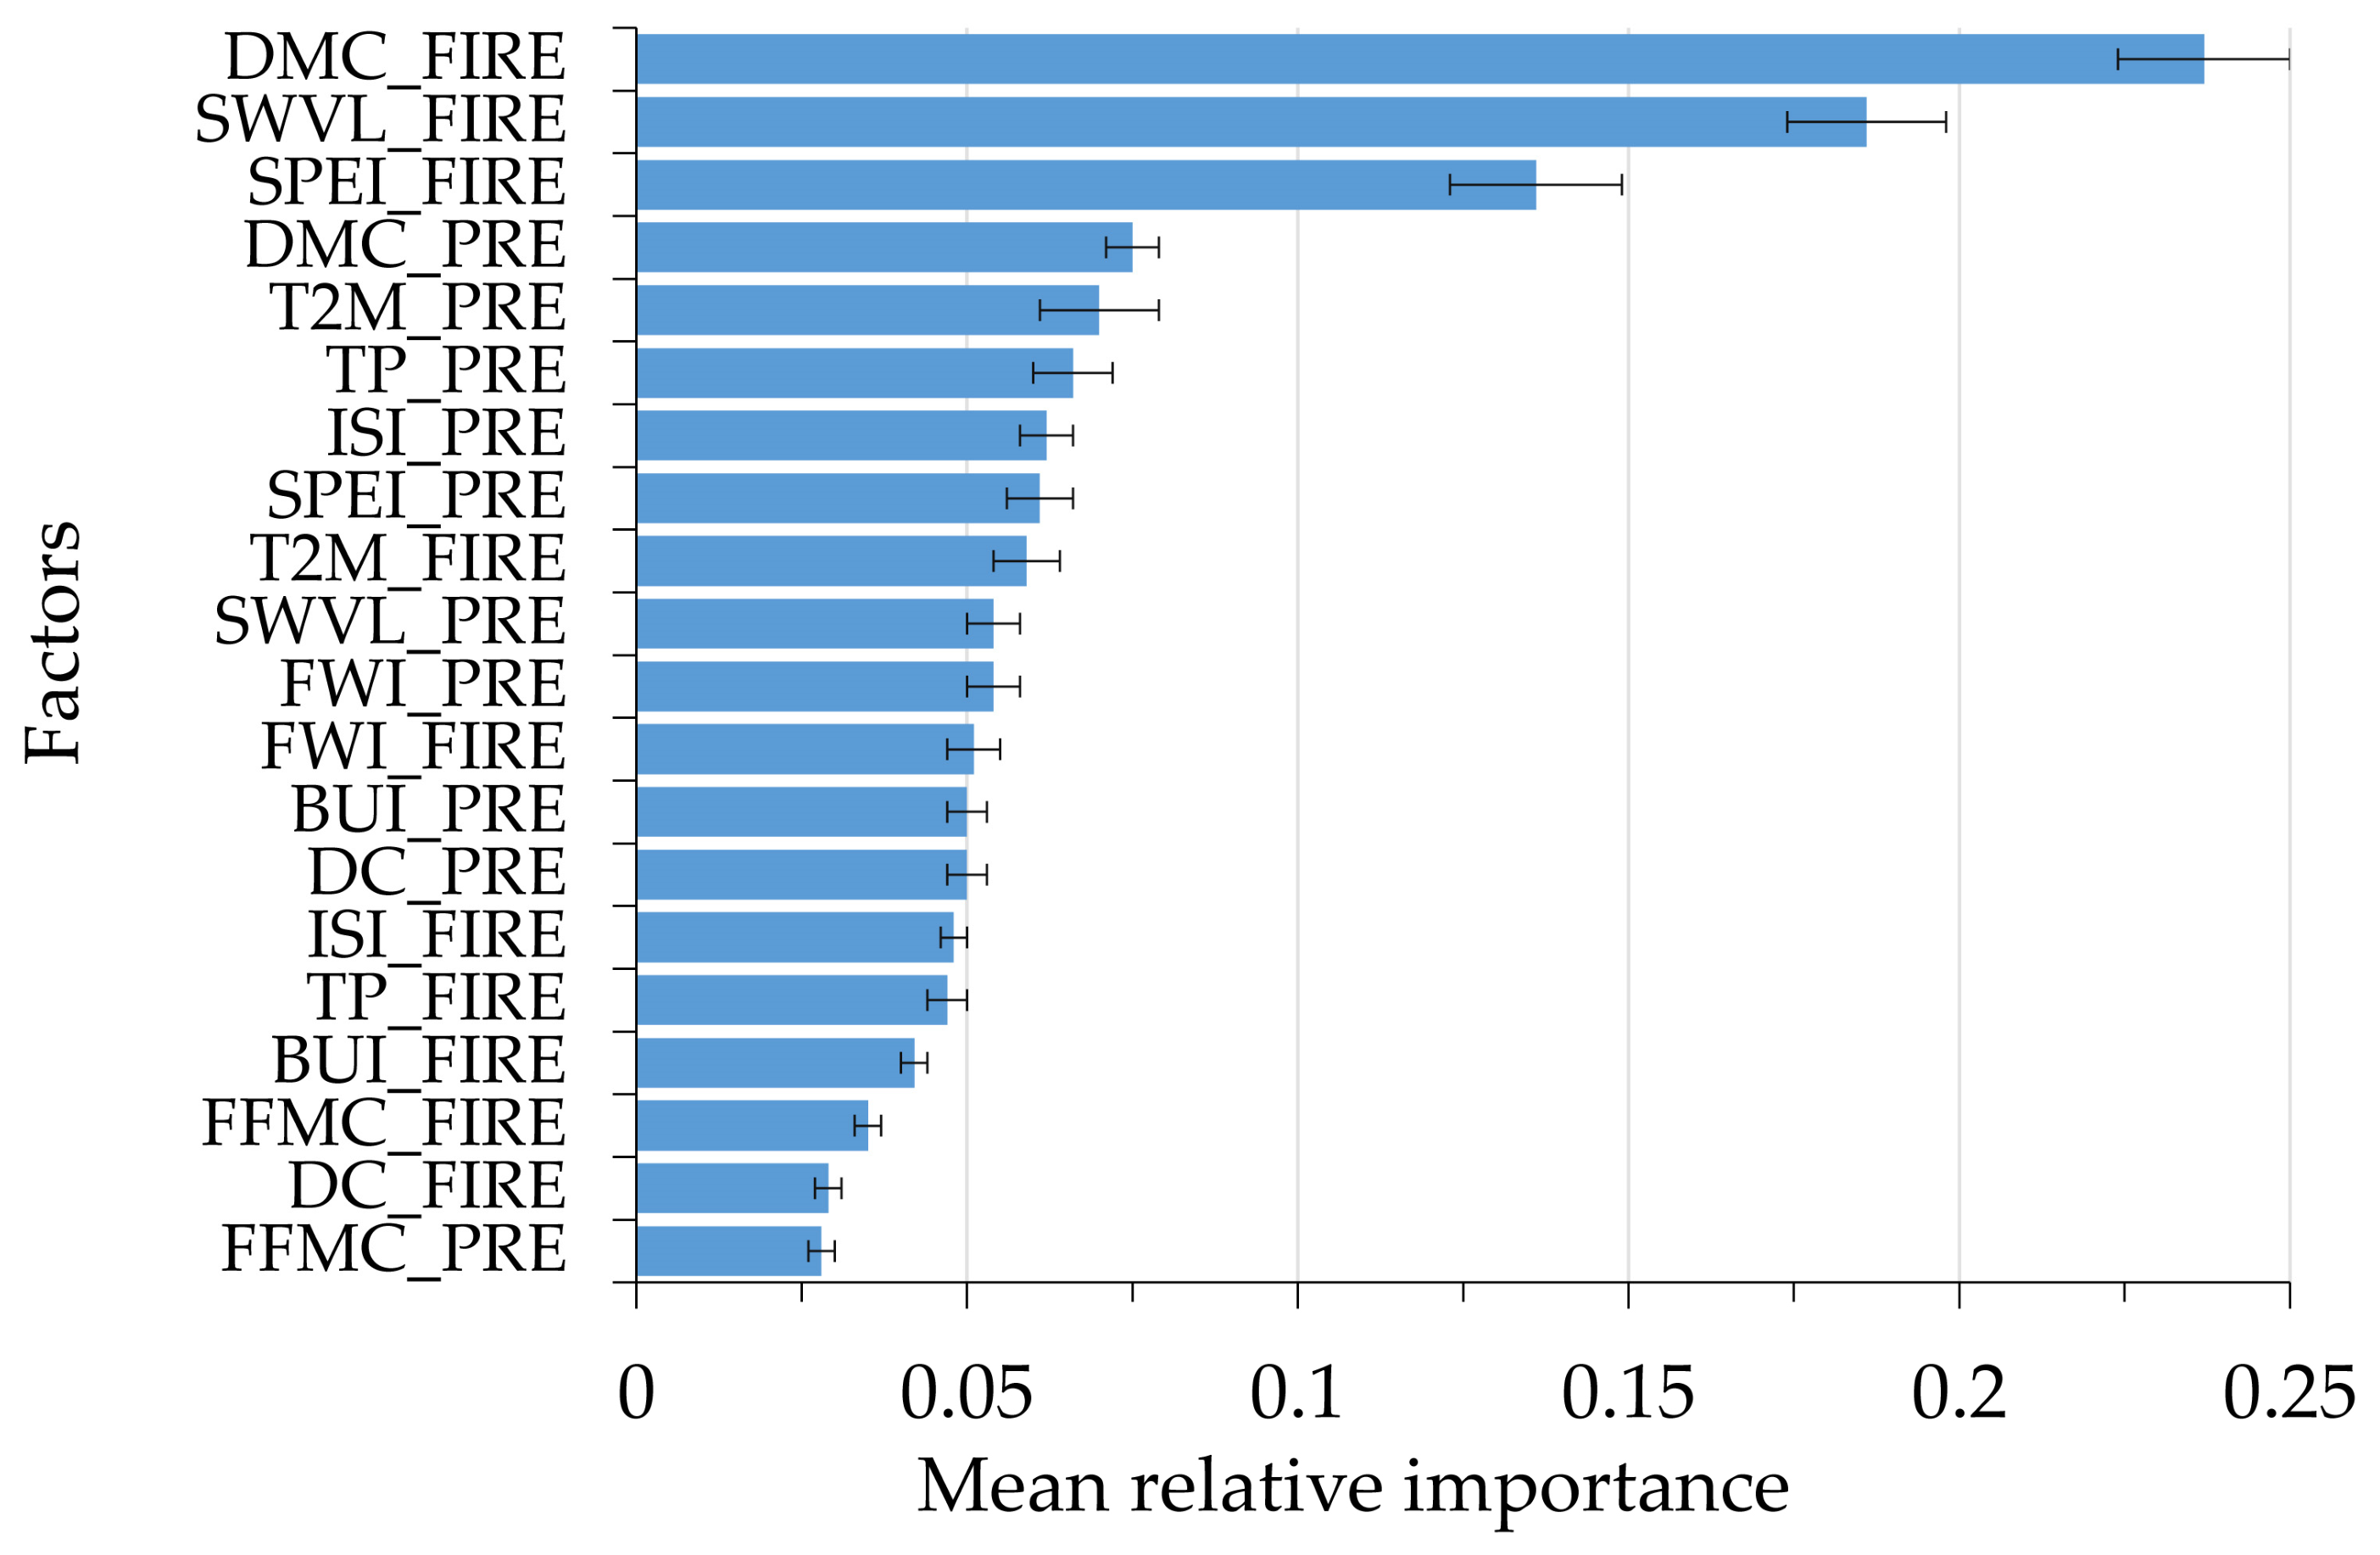
Mean values of predictor feature relative importance are shown in Figure 8. The variables DMC_FIRE, SWVL_FIRE and SPEI_FIRE (Table 1), representing anomalies of the Duff Moisture Code, upper soil and litter water content and the Standardized Precipitation Evapotranspiration Index, showed the highest importance in predicting both the wildfire intensity and tree cover mortality.
Figure 8.
Mean feature importance for climatic and fire weather factors listed in Table 1. Error bars correspond to one standard deviation.
Fire weather, characterized by high temperatures, low humidity, and strong winds, directly influences wildfire severity by drying out fuel and accelerating fire spread. Factors directly determining fuel moisture content, such as the Duff Moisture Code and upper soil layer moisture content, showed the highest relative importance. High importance was also noted for the SPEI, which incorporates both precipitation and potential evapotranspiration, enabling the estimation of drought severity.
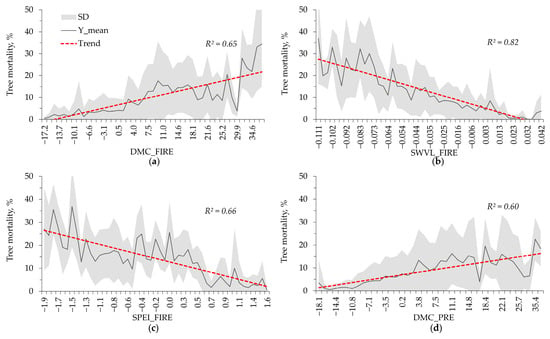
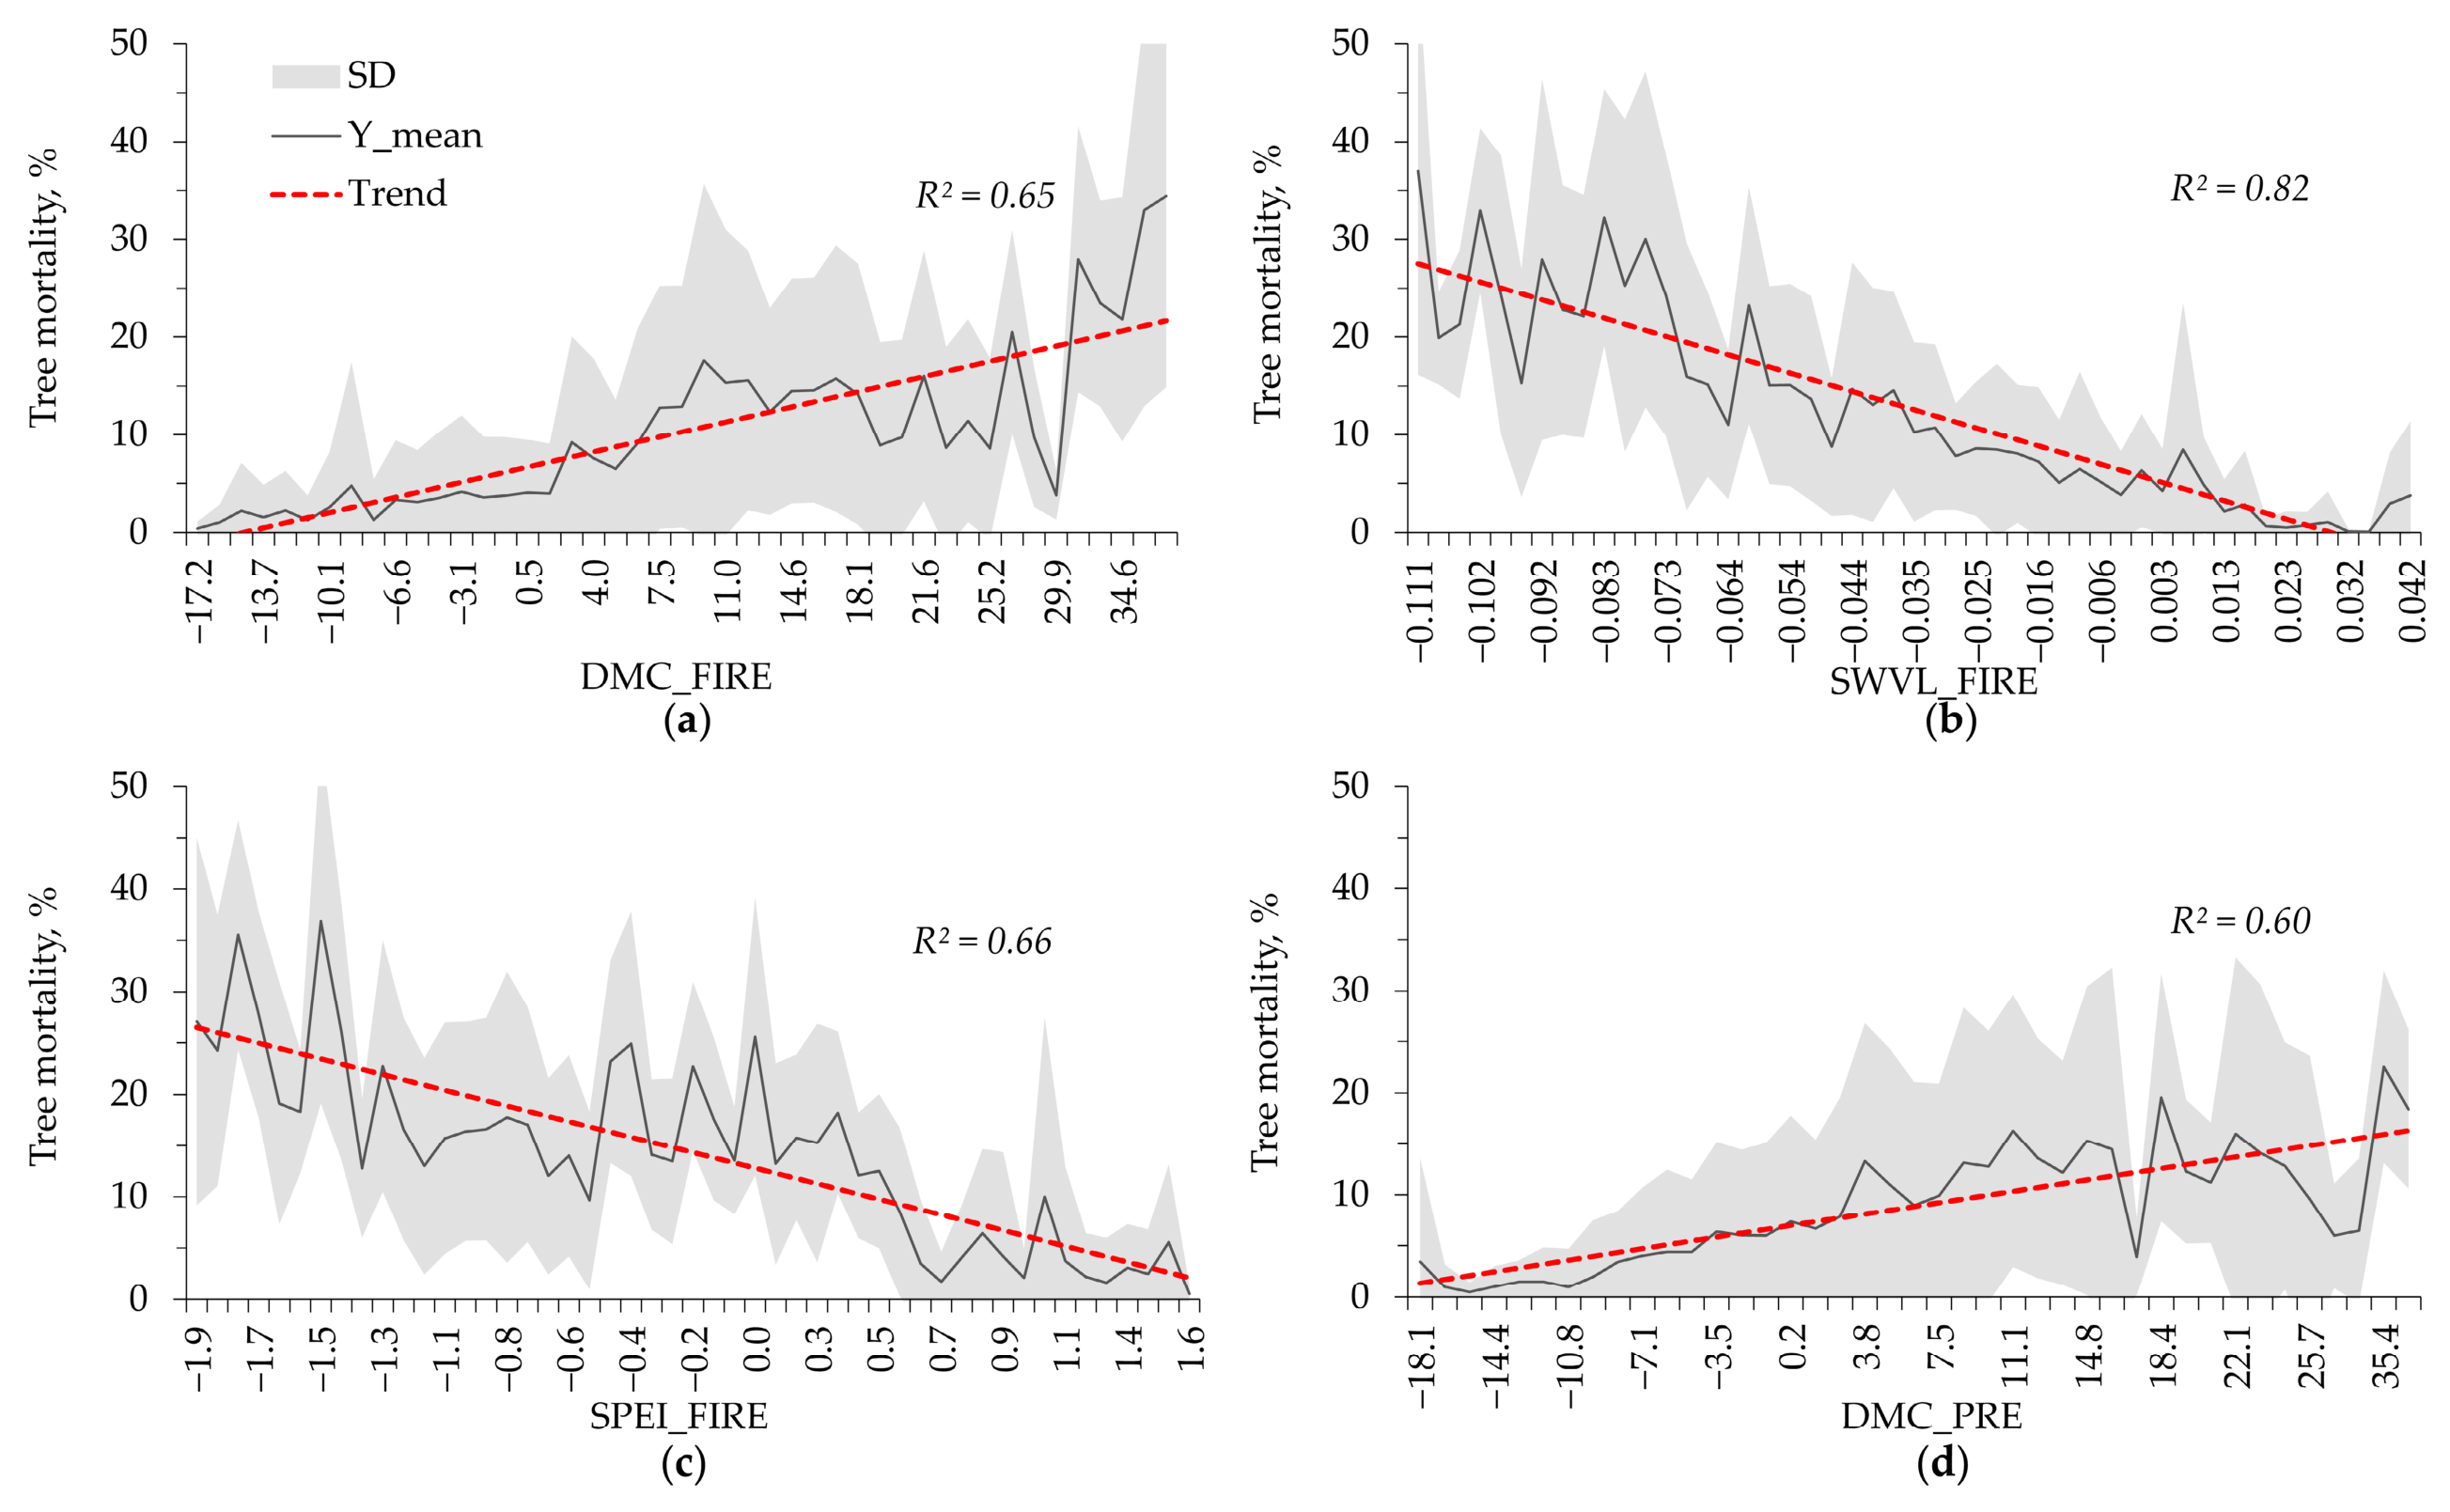
Figure 9a–d shows the partial dependencies between tree mortality and the four features having the highest relative importance (Figure 8). The relationship between area burned by stand-replacing fires and climatic and fire weather factors showed statistically significant trends (R2 = 0.60…0.82, p < 0.01). Considering rising temperatures and changes in heat and moisture supply in the region, these findings allow us to predict an increase in fire intensity and the proportion of stand-replacing fires and extreme fire events [41].
Figure 9.
Tree mortality for the four features with the highest relative importance: DMC_FIRE (a), SWVL_FIRE (b), SPEI_FIRE (c), and DMC_PRE (d). The graphs are arranged in descending order of feature importance (Figure 8). The black solid line represents the mean, the gray area represents the standard deviation, and the trend line is shown by dashed line.
4. Discussion
An analysis of the regression relationships between meteorological parameters and fire characteristics in Siberia shows that the combined contribution of just three meteorological characteristics (air temperature, precipitation, and air humidity) accounts for 55–70% of the interseasonal variance in the number of fire-danger days [18]. This set of relationships in regressions can be expanded, for example, by incorporating indicators such as baric fields [8] or general patterns of atmospheric circulation over land during the fire season [10,44,45,46]. At the same time, it is generally recognized that the most important meteorological indicators determining potential flammability are the heat-moisture indicator, precipitation, and the duration of the fire season [8,10,17,18].
A significant extension of the fire season (up to 115–130 days) is projected across Siberia, reaching up to 75 days in the north of the region [12]. Combined with a decrease in the hydrothermal coefficient (HTC) for large areas of central and eastern Siberia, this will contribute to increased fire hazard conditions throughout the fire season. These changes will likely be particularly significant for the region’s larch forests, where fires largely determine Siberia’s average long-term fire incidence [4,43,47]. The most frequent large fires are recorded in these forests under recurring extreme weather conditions [8,17,44].
Spatial extrapolations based on historical fire data show that current trends are consistent with observed fire dynamics over the past 10 years. The reliability of these trends is 58–67% for extrapolating the rate of change and 53–73% for projecting fire indicators to 2030 [12].
Against this background, the identified trends in extreme FRP values and the relationship between the proportion of stand-replacing fires and meteorological characteristics represent a plausible scenario.
Previously [48], it was shown that fire intensity, estimated in terms of fire radiative power using the FRP method, is increasing in Siberia, with a positive intensity trend characteristic of ~30% of the total area of the region. High-intensity fires are the most significant factor determining tree stand mortality and stand-replacing fires. This direct relationship (Figure 7) has a high reliability of R2 = 0.58. Other studies have similarly reported a relationship between FRP ranges and the degree of post-fire vegetation disturbance based on the NDB/dNBR index [6,28].
During the study period (2001–2024), the proportion of fire-induced vegetation cover loss in Siberia varied 20% and 90% of the total forest stand losses recorded in the Global Forest Change database [23]. In light coniferous forest stands, fires account for 40–90% of total stand loss area according to GFC data. For the study period, GFC indicates that stand-replacing fires account for >40% per year in dark coniferous stands, up to 40% in larch forests, approximately 25% in pine-dominated stands, and <5% in deciduous forests.
A growing trend in burned area in the central and eastern parts of Siberia has been reported in recent decades [41,49]. Spatiotemporal analysis of Fire Radiative Power and tree cover mortality revealed that the most pronounced positive trends occurred in the central and northeastern parts of Siberia (forest regions II, III and IV), which are also characterized by high mean FRP values (Figure 4). Analysis of meteorological conditions further showed that these regions experienced increasing drought conditions (Figure 5), consistent with previous results [8,12,50,51,52].
The significant increase in tree cover loss and areas of stand-replacing fires (Table 4), is associated with an increase in climate aridity and fire intensity in the region. A statistically significant increase in both wildfire intensity and area of stand-replacing fires has been previously reported for Siberia, with the most pronounced increase occurring after 2012 [53,54]. A statistically significant direct relationship (R2 = 0.95; p < 0.01) was also previously recorded between tree cover loss area and wildfire intensity in Siberia was also previously reported for the period 2001–2012, based on GFC product data [23].
Recent studies have noted the influence of climatic factors on the burned area in Siberia. Factors such as air temperature, precipitation, and soil moisture have demonstrated strong correlations with fire frequency and burned area [12,53,55]. Stocks and Hartley (1995) [56] demonstrated the relationship between fire characteristics, including fire intensity, and meteorological parameters determining fire danger. We also focused on calculating fire danger indices based on weather conditions from the Canadian CFFDRS system.
The most significant factors identified include the DMC index of the Canadian CFFDRS system, the SPEI index, and the upper litter layer water content. These variables directly determine the amount of forest fuels available for fire, and the atmospheric moisture deficit, which governs the rate of their drying. Notably, composite indices incorporating multiple meteorological factors, such as the DMC, FWI, and Nesterov index, have been shown to significantly affect the burned area in Siberia [42]. Drought-related variables, including the SPEI index, were also identified as important predictors of tree cover mortality in the central regions of Siberia [57].
In our study, we used standard MODIS products to obtain fire-related information and Global Forest Change product to estimate forest cover loss. The MODIS burned area product excels where fires are large and distinct, which is typical of Siberian wildfires; however, its coarser 500 m resolution means it is less effective at capturing small or low-severity burns. For the boreal forest biome, MODIS burned area product has an omission error of 27.0% and a commission error of 23.9%, which are the lowest error rates across all global biomes [58].
Initial accuracy assessments for the Global Forest Change (GFC) product reported 88% for boreal forests [34]. Studies conducted for other forest conditions have shown product accuracy of 75–94% [59,60]. A study by Druga et al. (2026) [61] that validated the GFC product reported a producer’s accuracy of 95% and a user’s accuracy of 78% in detecting tree cover loss.
Limitations
We also should mention several limitations related to the use of Fire Radiative Power estimated by the MODIS sensor. The low spatial resolution of MODIS data introduces significant underestimation and systematic biases in the FRP estimates due to a combination of mixed pixel effects, detection limits, and viewing geometry. Firstly, MODIS has a minimum detectable FRP threshold of about 5–8 MW per pixel, which leads to the omission of small fires, causing a large undercount of fire pixels [62]. Secondly, even when a fire is large enough to be detected, the FRP assigned to that 1 km2 pixel is lower than the true FRP emitted by the fire itself [62]. The third issue is the sensor’s viewing geometry. The larger footprint area of MODIS pixels located near the swath edge reduces the sensor’s sensitivity, raising the effective detection threshold for fires and introducing negative bias in FRP observations [63]. Another issue related to the use of MODIS data is temporal sampling bias caused by the estimation of instantaneous FRP captured only at the time of a satellite overpass. This can result in the underestimation of the fire’s true peak intensity and energy output if the satellite overpass misses the peak burn time [64]. An instantaneous FRP also takes no account of what happens before or after the observation. It fails to capture sudden spikes in intensity or the transition of a fire into extreme, fast-moving behavior.
We also should note the influence of feature multicollinearity (when features are highly correlated) on the assessment of their significance. Weather features and fire danger indices considered in the article can have a high mutual correlation (R2 = 0.7–0.9). While tree-based methods are robust to correlated predictors in terms of predictive performance, high correlation among features can distort the reliability of feature importance estimates [65,66]. Specifically, when two or more highly correlated features are present, the model may arbitrarily select one feature over another for splitting, leading to a fragmented or diluted distribution of importance scores among the correlated group. Features with more unique values or continuous scales also have more chances to be split by methods based on a decrease in node impurity (e.g., Gini impurity). When combined with multicollinearity, the algorithm may over-credit one feature while under-crediting another.
5. Conclusions
A quantitative analysis of the relationship between the energy characteristics of fires in Siberian larch stands and meteorological dynamics reveals a direct correlation.
The proportion of pixels with maximum FRP in Siberian larch stands ranges from 4.5% to 17.9% of the total number of fire pixels detected annually. FRP extremes correspond to the most intense fire events, accounting for 5–15% of fires in Siberian larch stands [43]. Over the period 2001–2024, an increasing trend in high-intensity fires was recorded (R2 = 0.18–0.31, p < 0.05).
Stand mortality data in Siberian larch stands from the Global Forest Change correlate with extreme FRP values. The recorded FRP extremes are spatially consistent with the actual stand loss recorded by Global Forest Change, with a correlation level of R2 = 0.58. Under projected climate change scenarios, fires in larch forests and the increase in the role of high-intensity combustion will result in significant and potentially irreversible damage to forest stands.
Author Contributions
Conceptualization, E.I.P.; methodology, E.I.P. and E.G.S.; software, E.G.S.; validation, E.I.P. and E.G.S.; formal analysis, E.I.P.; investigation, E.G.S.; resources, E.G.S.; data curation, E.I.P. and E.G.S.; writing—original draft preparation, E.I.P. and E.G.S.; writing—review and editing, E.I.P.; visualization, E.I.P. and E.G.S.; supervision, E.I.P. All authors have read and agreed to the published version of the manuscript.
Funding
Research was conducted according to the project of the Sukachev Institute of Forest SB RAS no. FWES-2024-0023. This research received no external funding.
Institutional Review Board Statement
Not applicable.
Informed Consent Statement
Not applicable.
Data Availability Statement
Publicly available datasets were analyzed in this study. This data can be found here: Level-1 Atmosphere Archive and Distribution System (LAADS) Distributed Active Archive Center (DAAC) service (https://ladsweb.modaps.eosdis.nasa.gov/ (accessed on 15 September 2025), Vega-service (Space Research Institute, IKI RAS, Moscow) http://pro-vega.ru/maps/ (accessed on 17 June 2026), Global Forest Change (GFC) product https://glad.earthengine.app/view/global-forest-change (accessed 15 September 2025), ERA5-Land climate database (https://cds.climate.copernicus.eu/datasets (accessed 10 June 2026)), Global FWI database (https://portal.nccs.nasa.gov/datashare/GlobalFWI/ (accessed 15 September 2025), and the Standardized Precipitation Evapotranspiration Index (SPEI) http://sac.csic.es/spei/map/maps.html (accessed 15 September 2025).
Acknowledgments
Preliminary processing of long-term data on wildfires in Siberia was conducted according to the project of V.N. Sukachev Institute of Forest SB RAS no. FWES-2024-0023. The satellite data-receiving equipment used was provided by the Centre of Collective Usage of Federal Research Center “Krasnoyarsk Science Center, Siberian Branch of Russian Academy of Sciences”, Krasnoyarsk, Russia.
Conflicts of Interest
The authors declare no conflicts of interest.
Abbreviations
The following abbreviations are used in this manuscript:
| FRP | Fire Radiative Power |
| FRE | Fire Radiative Energy |
| GFC | Global Forest Change |
| NBR/dNBR | Normalized Burn Ratio/difference NBR |
| RBA | Relative Burned Area |
| CFFDRS | Canadian Forest Fire Danger Rating System |
| FWI | Canadian Fire Weather Index |
| DMC | Duff Moisture Code |
| SPEI | Standardized Precipitation Evapotranspiration Index |
| SWVL | Upper (0–7 cm) layer moisture content |
References
- de Groot, W.J.; Cantin, A.S.; Flannigan, M.D.; Soja, A.J.; Gowman, L.M.; Newbery, A. A comparison of Canadian and Russian boreal forest fire regimes. For. Ecol. Manag. 2013, 294, 23–34. [Google Scholar] [CrossRef] [Scilit]
- Guindon, L.; Gauthier, S.; Manka, F.; Parisien, M.-A.; Whitman, E.; Bernier, P.; Beaudoin, A.; Villemaire, P.; Skakun, R. Trends in wildfire burn severity across Canada, 1985 to 2015. Can. J. For. Res. 2021, 5, 1230–1244. [Google Scholar] [CrossRef] [Scilit]
- McCarty, J.L.; Aalto, J.; Paunu, V.-V.; Arnold, S.R.; Eckhardt, S.; Klimont, Z.; Fain, J.J.; Evangeliou, N.; Venäläinen, A.; Tchebakova, N.M.; et al. Reviews and syntheses: Arctic fire regimes and emissions in the 21st century. Biogeosciences 2021, 18, 5053–5083. [Google Scholar] [CrossRef] [Scilit]
- Kharuk, V.I.; Ponomarev, E.I.; Ivanova, G.A.; Dvinskaya, M.L.; Coogan, S.C.P.; Flannigan, M.D. Wildfires in the Siberian taiga. Ambio 2021, 50, 1953–1974. [Google Scholar] [CrossRef] [Scilit] [PubMed]
- Bartalev, S.A.; Stytsenko, F.V. An Assessment of the Forest Stands Destruction be Fires Based on the Remote Sensing Data on a Seasonal Distribution of Burnt Areas. Russ. J. For. Sci. 2021, 2, 115–122. (In Russian) [Google Scholar] [CrossRef] [Scilit]
- Loupian, E.A.; Lozin, D.V.; Balashov, I.V.; Bartalev, S.A.; Stytsenko, F.V. A study of the dependence of the degree of forest damage by fires on the intensity of burning according to satellite-monitoring data. Cosm. Res. 2022, 60, S46–S56. [Google Scholar] [CrossRef] [Scilit]
- Zheng, B.; Ciais, P.; Chevallier, F.; Yang, H.; Canadell, J.; Chen, Y.; van der Velde, I.R.; Aben, I.; Chuvieco, E.; Davis, S.J.; et al. Record-high CO2 emissions from boreal fires in 2021. Science 2023, 379, 912–917. [Google Scholar] [CrossRef] [Scilit] [PubMed]
- Hayasaka, H. Rare and Extreme Wildland Fire in Sakha in 2021. Atmosphere 2021, 12, 1572. [Google Scholar] [CrossRef] [Scilit]
- Williams, N.G.; Lucash, M.S.; Ouellette, M.R.; Brussel, T.; Gustafson, E.J.; Weiss, S.A.; Sturtevant, B.R.; Schepaschenko, D.G.; Shvidenko, A.Z. Simulating dynamic fire regime and vegetation change in a warming Siberia. Fire Ecol. 2023, 19, 33. [Google Scholar] [CrossRef] [Scilit]
- Flannigan, M.; Stocks, B.; Turetsky, M.; Wotton, M. Impacts of climate change on fire activity and fire management in the circumboreal forest. Glob. Change Biol. 2009, 15, 549–560. [Google Scholar] [CrossRef] [Scilit]
- Hayasaka, H.; Yamazaki, K.; Naito, D. Weather conditions and warm air masses during active fire-periods in boreal forests. Polar Sci. 2019, 22, 100472. [Google Scholar] [CrossRef] [Scilit]
- Malkanova, A.V.; Ponomarev, E.I. Spatiotemporal Variability of Forest Burning Characteristics in Siberia. Russ. Meteorol. Hydrol. 2025, 50, 437–448. [Google Scholar] [CrossRef] [Scilit]
- Shvidenko, A.Z.; Schepaschenko, D.G. Climate Change and Wildfires in Russia. Contemp. Probl. Ecol. 2013, 6, 50–61. [Google Scholar] [CrossRef] [Scilit]
- Descals, A.; Gaveau, D.L.A.; Verger, A.; Sheil, D.; Naito, D.; Peñuelas, J. Unprecedented fire activity above the Arctic Circle linked to rising temperatures. Science 2022, 378, 532–537. [Google Scholar] [CrossRef] [Scilit] [PubMed]
- Ivanova, G.A.; Kukavskaya, E.A.; Ivanov, V.A.; Conard, S.G.; McRae, D.J. Fuel characteristics, loads and consumption in Scots pine forests of central Siberia. J. For. Res. 2020, 31, 2507–2524. [Google Scholar] [CrossRef] [Scilit]
- Wooster, M.J.; Zhang, Y.H. Boreal Forest fires burn less intensely in Russia than in North America. Geophys. Res. Lett. 2004, 31, 3. [Google Scholar] [CrossRef] [Scilit]
- Valendik, E.N.; Kisilyakhov, E.K.; Ryzhkova, V.A.; Ponomarev, E.I.; Danilova, I.V. Conflagration Fires in Taiga Landscapes of Central Siberia. Geogr. Nat. Resour. 2014, 35, 41–47. [Google Scholar] [CrossRef] [Scilit]
- Sherstyukov, B.G.; Sherstyukov, A.B. Assessment of Increase in Forest Fire Risk in Russia till the Late 21st Century Based on Scenario Experiments with Fifth-generation Climate Models. Russ. Meteorol. Hydrol. 2014, 39, 292–301. [Google Scholar] [CrossRef] [Scilit]
- Romps, D.; Seeley, J.; Vollaro, D.; Molinari, J. Projected increase in lightning strikes in the United States due to global warming. Science 2014, 346, 851–854. [Google Scholar] [CrossRef] [Scilit] [PubMed]
- Loupian, E.A.; Bartalev, S.A.; Balashov, I.V.; Egorov, V.A.; Ershov, D.V.; Kobets, D.A.; Senko, K.S.; Stytsenko, F.V.; Sychugov, I.G. Satellite Monitoring of Forest Fires in the 21st Century in the Territory of the Russian Federation (Facts and Figures Based on Active Fires Detection). Sovrem. Probl. Distantsionnogo Zondirovaniya Zemli Kosmosa 2017, 14, 158–175. (In Russian) [Google Scholar] [CrossRef] [Scilit]
- Ponomarev, E.I.; Ponomareva, T.V. Fire Impact in the Cryolithozone of Siberia for the Period 1996–2023, Certificate of State Registration of the Database No. 2024623184 (RU), 18.07.2024; The Federal Institute of Industrial Property (FIPS): Moscow, Russia, 2024. Available online: https://www.elibrary.ru/item.asp?id=68596026 (accessed on 17 June 2026). (In Russian)
- Krylov, A.; McCarty, J.L.; Potapov, P.; Loboda, T.; Tyukavina, A.; Turubanova, S.; Hansen, M.C. Remote sensing estimates of stand-replacement fires in Russia, 2002–2011. Environ. Res. Lett. 2014, 9, 105007. [Google Scholar] [CrossRef] [Scilit]
- Ponomarev, E.I.; Shvetsov, E.G. Comparison of estimates of post-fire forest mortality in Siberia based on remote sensing data. Cosm. Res. 2025, 63, S213–S220. [Google Scholar] [CrossRef] [Scilit]
- Delcourt, C.J.F.; Combee, A.; Izbicki, B.; Mack, M.C.; Maximov, T.; Petrov, R.; Rogers, B.M.; Scholten, R.C.; Shestakova, T.A.; van Wees, D.; et al. Evaluating the Differenced Normalized Burn Ratio for Assessing Fire Severity Using Sentinel-2 Imagery in Northeast Siberian Larch Forests. Remote Sens. 2021, 13, 2311. [Google Scholar] [CrossRef] [Scilit]
- Giglio, L.; Schroeder, W.; Justice, C.O. The collection 6 MODIS active fire detection algorithm and fire products. Remote Sens. Environ. 2016, 178, 31–41. [Google Scholar] [CrossRef] [Scilit] [PubMed]
- Wooster, M.J.; Roberts, G.; Perry, G.L.W.; Kaufman, Y.J. Retrieval of biomass combustion rates and totals from fire radiative power observations: FRP derivation and calibration relationships between biomass consumption and fire radiative energy release. J. Geophys. Res. 2005, 110, D24311. [Google Scholar] [CrossRef] [Scilit]
- Vermote, E.; Ellicott, E.; Dubovik, O.; Lapyonok, T.; Chin, M.; Giglio, L.; Roberts, G.J. An approach to estimate global biomass burning emissions of organic and black carbon from MODIS fire radiative power. J. Geophys. Res. 2009, 114, D18205. [Google Scholar] [CrossRef] [Scilit]
- Zabrodin, A.N.; Ponomarev, E.I. Assessment of Dependence between the Degree of Fire Impact on Vegetation and the Fire Radiative Power. Cosm. Res. 2024, 62, S165–S171. [Google Scholar] [CrossRef] [Scilit]
- Kukavskaya, E.A.; Soja, A.J.; Petkov, A.P.; Ponomarev, E.I.; Ivanova, G.A.; Conard, S.G. Fire emissions estimates in Siberia: Evaluation of uncertainties in area burned, land cover, and fuel consumption. Can. J. For. Res. 2013, 43, 493–506. [Google Scholar] [CrossRef] [Scilit]
- Shumilova, L.V. Botanical Geography of Siberia; Sergievsky, L.P., Ed.; Tomsk University Press: Tomsk, Russia, 1962. (In Russian) [Google Scholar]
- Loupian, E.A.; Bourtsev, M.A.; Proshin, A.A.; Kashnitskii, A.; Balashov, I.; Bartalev, S.; Konstantinova, A.; Kobets, D.; Radchenko, M.; Tolpin, V.; et al. Usage Experience and Capabilities of the VEGA-Science System. Remote Sens. 2022, 14, 77. [Google Scholar] [CrossRef] [Scilit]
- Giglio, L.; Descloitres, J.; Justice, C.; Kaufman, Y. An enhanced contextual fire detection algorithm for MODIS. Remote Sens. Environ. 2003, 87, 273–282. [Google Scholar] [CrossRef] [Scilit]
- Freeborn, P.H.; Wooster, M.J.; Roy, D.P.; Cochrane, M.A. Quantification of MODIS fire radiative power (FRP) measurement uncertainty for use in satellite-based active fire characterization and biomass burning estimation. Geophys. Res. Lett. 2014, 41, 1988–1994. [Google Scholar] [CrossRef] [Scilit]
- Hansen, M.C.; Potapov, P.V.; Moore, R.; Hancher, M.; Turubanova, S.A.; Tyukavina, A.; Thau, D.; Stehman, S.V.; Goetz, S.J.; Loveland, T.R.; et al. High-Resolution Global Maps of 21st Century Forest Cover Change. Science 2013, 342, 850–853. [Google Scholar] [CrossRef] [Scilit] [PubMed]
- Potapov, P.; Hansen, M.C.; Pickens, A.; Hernandez-Serna, A.; Tyukavina, A.; Turubanova, S.; Zalles, V.; Li, X.; Khan, A.; Stolle, F.; et al. The global 2000-2020 land cover and land use change dataset derived from the Landsat archive: First results. Front. Remote Sens. 2022, 3, 856903. [Google Scholar] [CrossRef] [Scilit]
- Hersbach, H.; de Rosnay, P.; Bell, B.; Schepers, D.; Simmons, A.; Soci, C.; Abdalla, S.; Alonso-Balmaseda, M.; Balsamo, G.; Bechtold, P.; et al. Operational Global Reanalysis: Progress, Future Directions and Synergies with NWP. ECMWF ERA Report Series. 2018. Available online: https://www.ecmwf.int/node/18765 (accessed on 25 September 2025).
- Van Wagner, C.E. Development and Structure of the Canadian Forest Fire Weather Index System; Canadian Forest Service, Petawawa National Forest Institute: Ottawa, ON, Canada, 1987; 37p.
- Field, R.D.; Spessa, A.C.; Aziz, N.A.; Camia, A.; Cantin, A.; Carr, R.; de Groot, W.J.; Dowdy, A.J.; Flannigan, M.D.; Manomaiphiboon, K.; et al. Development of a Global Fire Weather Database. Nat. Hazards Earth Syst. Sci. 2015, 15, 1407–1423. [Google Scholar] [CrossRef] [Scilit]
- Vicente-Serrano, S.M.; Beguería, S.; López-Moreno, J.I. A Multi-scalar drought index sensitive to global warming: The Standardized Precipitation Evapotranspiration Index–SPEI. J. Clim. 2010, 23, 1696–1718. [Google Scholar]
- Jones, M.W.; Abatzoglou, J.T.; Veraverbeke, S.; Andela, N.; Lasslop, G.; Forkel, M.; Smith, A.J.P.; Burton, C.; Betts, R.A.; van der Werf, G.R.; et al. Global and Regional Trends and Drivers of Fire Under Climate Change. Rev. Geophys. 2022, 60, e2020RG000726. [Google Scholar] [CrossRef] [Scilit]
- Huang, X.; Xue, L.; Wang, Z.; Liu, Y.; Ding, K.; Ding, A. Escalating Wildfires in Siberia Driven by Climate Feedbacks Under a Warming Arctic in the 21st Century. AGU Adv. 2024, 5, e2023AV001151. [Google Scholar] [CrossRef] [Scilit]
- Malashin, I.P.; Masich, I.; Nelyub, V.; Borodulin, A.; Gantimurov, A.; Tynchenko, V. Assessing wildfire extents in Siberian forests using machine learning. Sci. Rep. 2025, 15, 32834. [Google Scholar] [CrossRef] [Scilit] [PubMed]
- Ponomarev, E.I.; Shvetsov, E.G.; Usataya, Y.O. Determination of the Energy Properties of Wildfires in Siberia by Remote Sensing. Izv. Atmos. Ocean. Phys. 2018, 54, 979–985. [Google Scholar] [CrossRef] [Scilit]
- Forkel, M.; Thonicke, K.; Beer, C.; Cramer, W.; Bartalev, S.; Schmullius, C. Extreme fire events are related to previous-year surface moisture conditions in permafrost-underlain larch forests of Siberia. Environ. Res. Lett. 2012, 7, 044021. [Google Scholar]
- Mokhov, I.I.; Sitnov, S.A. Connection of Wildfires in Russian Regions to Atmospheric Blockings. Russ. Meteorol. Hydrol. 2023, 48, 624–629. [Google Scholar] [CrossRef] [Scilit]
- Komarov, V.S.; Ilin, S.N.; Lomakina, N.Y.; Lavrinenko, A.V. Linear Trends in Average Seasonal Surface Air Temperature and Modern Changes in the Regional Climate of Siberia. Opt. Atmos. Okeana 2017, 30, 35–41. (In Russian) [Google Scholar] [CrossRef] [Scilit]
- Ivanova, G.A. The History of Forest Fire in Russia. Dendrochronologia 1998, 16–17, 147–161. [Google Scholar]
- Ponomarev, E.I.; Zabrodin, A.N.; Shvetsov, E.G.; Ponomareva, T.V. Wildfire Intensity and Fire Emissions in Siberia. Fire 2023, 6, 246. [Google Scholar] [CrossRef] [Scilit]
- García-Lázaro, J.R.; Moreno-Ruiz, J.A.; Riaño, D.; Arbelo, M. Estimation of Burned Area in the Northeastern Siberian Boreal Forest from a Long-Term Data Record (LTDR) 1982–2015 Time Series. Remote Sens. 2018, 10, 940. [Google Scholar] [CrossRef] [Scilit]
- Tomshin, O.; Solovyev, V. Spatio-temporal patterns of wildfires in Siberia during 2001–2020. Geocarto Int. 2021, 37, 7339–7357. [Google Scholar] [CrossRef] [Scilit]
- Zhu, X.; Xu, X.; Jia, G. Asymmetrical Trends of Burned Area Between Eastern and Western Siberia Regulated by Atmospheric Oscillation. Geophys. Res. Lett. 2021, 48, e2021GL096095. [Google Scholar] [CrossRef] [Scilit]
- Luo, B.; Luo, D.; Dai, A.; Xiao, C.; Simmonds, I.; Hanna, E.; Overland, J.; Shi, J.; Chen, X.; Yao, Y.; et al. Rapid summer Russian Arctic sea-ice loss enhances the risk of recent Eastern Siberian wildfires. Nat. Commun. 2024, 15, 5399. [Google Scholar] [CrossRef] [Scilit] [PubMed]
- Kharuk, V.I.; Shvetsov, E.G.; Buryak, L.V.; Golyukov, A.S.; Dvinskaya, M.L.; Petrov, I.A. Wildfires in the Larch Range within Permafrost, Siberia. Fire 2023, 6, 301. [Google Scholar] [CrossRef] [Scilit]
- Shvetsov, E.G. Assessment of Post-Fire Forest Loss in Siberia Using Satellite Data and Its Relationship with Characteristics of Fires. Contemp. Probl. Ecol. 2024, 17, 488–496. [Google Scholar] [CrossRef] [Scilit]
- Bigio, E.R.; Swetnam, T.W.; Baisan, C.H.; Guiterman, C.H.; Kisilyakhov, Y.K.; Andreev, S.G.; Batotsyrenov, E.A.; Ayurzhanaev, A.A. The influence of land-use activities and regional drought on historical fire regimes of Buryatia, Siberia. Environ. Res. Lett. 2022, 17, 054043. [Google Scholar] [CrossRef] [Scilit]
- Stocks, B.J.; Hartley, G.R. Fire Behavior in Three Jack Pine Fuel Complexes; Poster with text; Canadian Forest Service, Great Lakes Forestry Centre: Sault Ste. Marie, ON, Canada, 1995.
- Shvetsov, E.G. Predicting post-fire forest mortality using remote sensing data and machine learning. Cosm. Res. 2025, 63, S246–S252. [Google Scholar]
- Boschetti, L.; Roy, D.P.; Giglio, L.; Huang, H.; Zubkova, M.; Humber, M.L. Global validation of the collection 6 MODIS burned area product. Remote Sens. Environ. 2019, 235, 111490. [Google Scholar] [CrossRef] [Scilit] [PubMed]
- Galiatsatos, N.; Donoghue, D.N.M.; Watt, P.; Bholanath, P.; Pickering, J.; Hansen, M.C.; Mahmood, A.R.J. An Assessment of Global Forest Change Datasets for National Forest Monitoring and Reporting. Remote Sens. 2020, 12, 1790. [Google Scholar] [CrossRef] [Scilit]
- Sari, I.L.; Weston, C.J.; Newnham, G.J.; Volkova, L. Assessing Accuracy of Land Cover Change Maps Derived from Automated Digital Processing and Visual Interpretation in Tropical Forests in Indonesia. Remote Sens. 2021, 13, 1446. [Google Scholar] [CrossRef] [Scilit]
- Druga, M.; Sagat, V.; Rusinko, A. Accuracy assessment of the Global Forest Change tree cover loss by visual interpretation and comparison with forestry logging records in Slovakia. Environ. Monit. Assess. 2026, 198, 302. [Google Scholar] [CrossRef] [Scilit] [PubMed]
- Peterson, D.; Wang, J.; Ichoku, C.; Hyer, E.J.; Ambrosia, V.G. A sub-pixel-based calculation of fire radiative power from MODIS observations: 1: Algorithm development and initial assessment. Remote Sens. Environ. 2013, 129, 262–279. [Google Scholar] [CrossRef] [Scilit]
- Kaur, I.; Hüser, I.; Zhang, T.; Gehrke, B.; Kaiser, J.W. Correcting Swath-Dependent Bias of MODIS FRP Observations With Quantile Mapping. Remote Sens. 2019, 11, 1205. [Google Scholar] [CrossRef] [Scilit]
- Johnston, J.M.; Jackson, N.; McFayden, C.; Ngo Phong, L.; Lawrence, B.; Davignon, D.; Wooster, M.J.; van Mierlo, H.; Thompson, D.K.; Cantin, A.S.; et al. Development of the User Requirements for the Canadian WildFireSat Satellite Mission. Sensors 2020, 20, 5081. [Google Scholar] [CrossRef] [Scilit] [PubMed]
- Nicodemus, K.K.; Malley, J.D.; Strobl, C.; Ziegler, A. The behaviour of random forest permutation-based variable importance measures under predictor correlation. BMC Bioinform. 2010, 11, 110. [Google Scholar] [CrossRef] [Scilit] [PubMed]
- Nicodemus, K.K.; Malley, J.D. Predictor correlation impacts machine learning algorithms: Implications for genomic studies. Bioinformatics 2009, 25, 1884–1890. [Google Scholar] [CrossRef] [Scilit] [PubMed]

Disclaimer/Publisher’s Note: The statements, opinions and data contained in all publications are solely those of the individual author(s) and contributor(s) and not of MDPI and/or the editor(s). MDPI and/or the editor(s) disclaim responsibility for any injury to people or property resulting from any ideas, methods, instructions or products referred to in the content. |
© 2026 by the authors. Licensee MDPI, Basel, Switzerland. This article is an open access article distributed under the terms and conditions of the Creative Commons Attribution (CC BY) license.