


Abstract
Timely and efficient evacuation is crucial for tunnel fire safety. Previous studies often assumed fixed vehicle spacing and vehicle type ratios, which did not reflect real traffic conditions. Based on high-resolution satellite imagery of congested scenarios nationwide, 1703 sets of static vehicle spacing data were obtained. Descriptive statistical analysis and the K–S test were conducted. As a result, a log-normal distribution model of vehicle spacing was established, with an average spacing of 2.23 m, a logarithmic mean of 0.707, and a logarithmic standard deviation of 0.439. Analysis of 11,211 vehicle samples further revealed an uneven distribution of vehicle types across lanes. Based on the statistical data, a random vehicle arrangement algorithm was developed for highway tunnels, incorporating the log-normal characteristics of vehicle spacing. Using this algorithm, non-uniform vehicle layouts were generated for tunnel evacuation modeling. A total of 120 simulations across 12 different scenarios were then conducted to analyze the impact of log-normal vehicle spacing on evacuation time. Results showed that evacuation time was 2–5% longer under a log-normal distribution than under a uniform distribution. Therefore, future tunnel evacuation simulations should account for the log-normal distribution of vehicle spacing and the actual vehicle type ratio.
1. Introduction
With the rapid development of highway tunnel construction in China, an increasing number of large-scale tunnels have been built [1,2,3,4]. At the same time, the frequency of tunnel fire accidents has also risen [5,6,7,8]. Statistical data indicate that more than 50% of tunnel accident deaths are attributed to fire-related incidents [9]. Due to the enclosed and elongated structure of highway tunnels, evacuation and firefighting during fire emergencies are particularly challenging [10,11,12,13]. As a result, such incidents often lead to severe casualties, substantial social disruption, and significant economic losses [14,15,16,17,18,19,20]. Therefore, investigation of tunnel fire evacuation is of great practical significance for improving the safety of tunnel operations [21,22,23,24].
Existing research on highway tunnel evacuation mainly relies on two research methods, namely field experiments and simulation modeling. Due to the high difficulty and cost of field experiments, most existing studies rely on evacuation simulations, which are favored for their fast computation, convenient application, and low cost [25,26]. Commonly used evacuation simulation software includes FDS+Evac [27], STEPS [28], Simulex [29], Pathfinder [30], and Building EXODUS [30]. Previous tunnel evacuation simulation studies have mainly accounted for factors including fire location [31,32,33,34,35], ventilation and smoke extraction [36,37,38,39], wind speed [24,40], evacuation speed [23,41,42], human behavior during fires [43,44], evacuation spacing [45,46], and vehicle location [9]. As an illustration, FDS and Pathfinder have been employed to simulate tunnel fires and evacuation and to analyze the effects of fire detection time, fire location, and ventilation systems on evacuation outcomes [31]. Using FDS, the effects of smoke extraction area, number, and spacing on transverse ventilation were examined [36]. Furthermore, a tunnel model was developed using FDS and Pathfinder to simulate fire and evacuation scenarios under different longitudinal wind speeds [40]. Simulations of highway tunnel fires and evacuation were conducted, with analyses focusing on smoke and visibility distribution, evacuation routes, and evacuation speed [42]. Another study employed the EvacTunnel 3.0 model to simulate pedestrian behavior during fire scenarios [43]. Previous studies have simulated the fire and evacuation process in a full-scale congested underwater tunnel to explore appropriate evacuation spacing under various speeds [45]. Additionally, the influence of vehicle stop randomness at cross passages on pedestrian escape probability has been examined using FDS and Pathfinder [9]. Existing studies have extensively investigated factors affecting evacuation time. However, the distribution characteristics of vehicle spacing under congested conditions and their impact on tunnel evacuation have rarely been investigated.
When a tunnel fire occurs, the total evacuation time is significantly affected by the evacuation path choices of trapped pedestrians. The presence of stopped vehicles, such as large trucks and buses, obstructs evacuation space, forcing evacuation to occur predominantly through the gaps between vehicles. It is evident that the spacing between parked vehicles affects the available evacuation paths and thus influences the overall evacuation time. Currently, most tunnel fire evacuation simulations assume idealized vehicle spacing parameters, without adequately reflecting real traffic conditions. For instance, a 3D CFD model was developed, and a fixed vehicle spacing of 2.0 m was assumed in the evacuation scenario to analyze asphalt pavement combustion effects on smoke dispersion and evacuation safety [47]. A mathematical evacuation model for tunnel fires was developed and validated using evacuation simulations with fixed vehicle spacings (1.0 m, 1.5 m, and 2.0 m), confirming the high accuracy of the mathematical model [23]. A previous study has employed VISSIM to simulate representative fire scenarios and to examine the effects of traffic volumes, distance from the first row of vehicles to the fire, and vehicle spacing under congestion (1.33 m, 2.00 m, and 3.00 m) on fire spread [48]. In summary, fixed vehicle spacing is commonly assumed in existing tunnel fire evacuation studies. These assumptions are rarely supported by field data, and the impact of vehicle spacing distribution characteristics on evacuation performance in highway tunnels remains largely unexplored.
To improve the accuracy of highway tunnel evacuation simulations, it is essential to incorporate real-world traffic conditions by collecting traffic data and analyzing the distribution characteristics of static vehicle spacing under congested conditions. This provides a more realistic basis for modeling pedestrian evacuation during tunnel fires. In this study, static vehicle spacings under congested conditions were extracted from high-resolution satellite imagery, and their distribution characteristics were analyzed. On this basis, a random vehicle arrangement algorithm that accounts for non-uniform spacing was developed for highway tunnels. Subsequently, a tunnel evacuation model was constructed to analyze the impact of vehicle spacing distribution characteristics on tunnel evacuation.
2. Materials and Methods
2.1. Remote Sensing Image Data Collection
2.1.1. Vehicle Spacing
To obtain static vehicle spacing data under congested and stationary conditions, data collection is conducted in this study based on high-resolution satellite imagery from online maps. This method offers significant advantages, including wide spatial coverage and high data acquisition efficiency. Traffic data from multiple countries and regions can be collected simultaneously without interfering with traffic flow, thereby improving data collection safety and meeting the demand for large-scale and diverse datasets. The present study focuses on the static vehicle spacing when vehicles are stationary under congested conditions. However, in practice, it is difficult to obtain vehicle spacing data in highway tunnels, as such data cannot be directly measured, and access to real tunnel data is limited. Under congested and stationary conditions, traffic flow is generally in a high-density and stable state, and no significant differences are observed in the vehicle arrangement between tunnels and urban roads. Therefore, vehicle spacing data from congested and stationary urban roads are used as a reasonable proxy for vehicle spacing in congested and stationary tunnel environments.
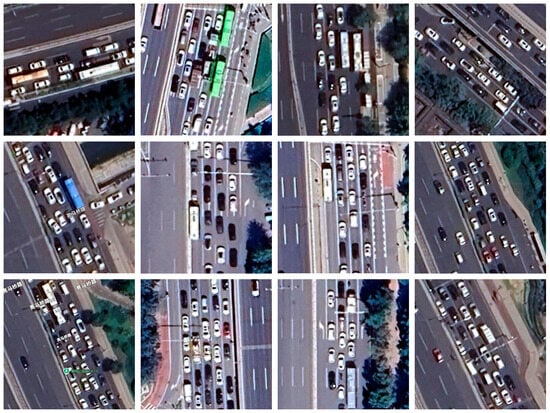
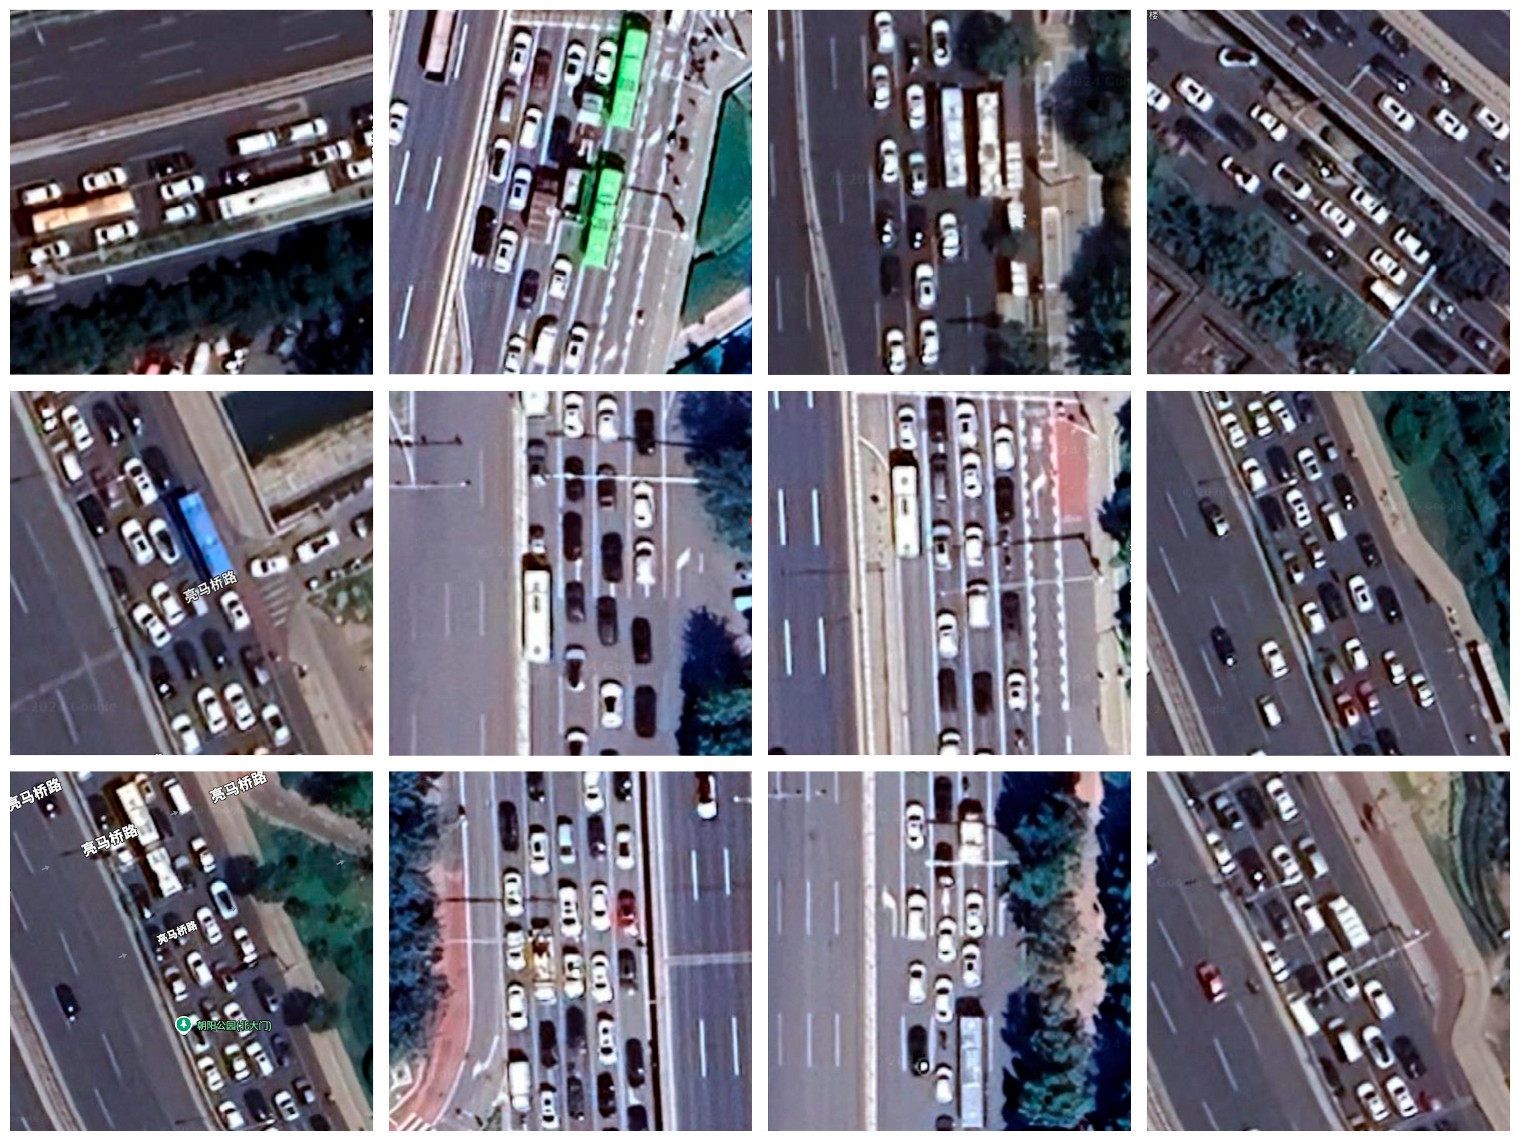
In this study, several representative urban road segments were selected as the study areas. A total of 111 remote sensing images capturing vehicle congestion were collected, each with a resolution of 3830 × 1970 . Representative sample images are shown in Figure 1.
Figure 1.
Representative remoe sensing images under vehicle congestion conditions. “Liangmaqiao Road” denotes the road name, and “Chaoyang Park (North Gate)” indicates the location.
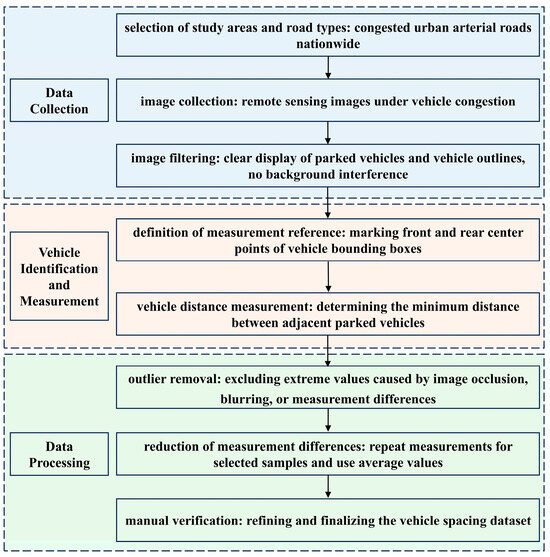
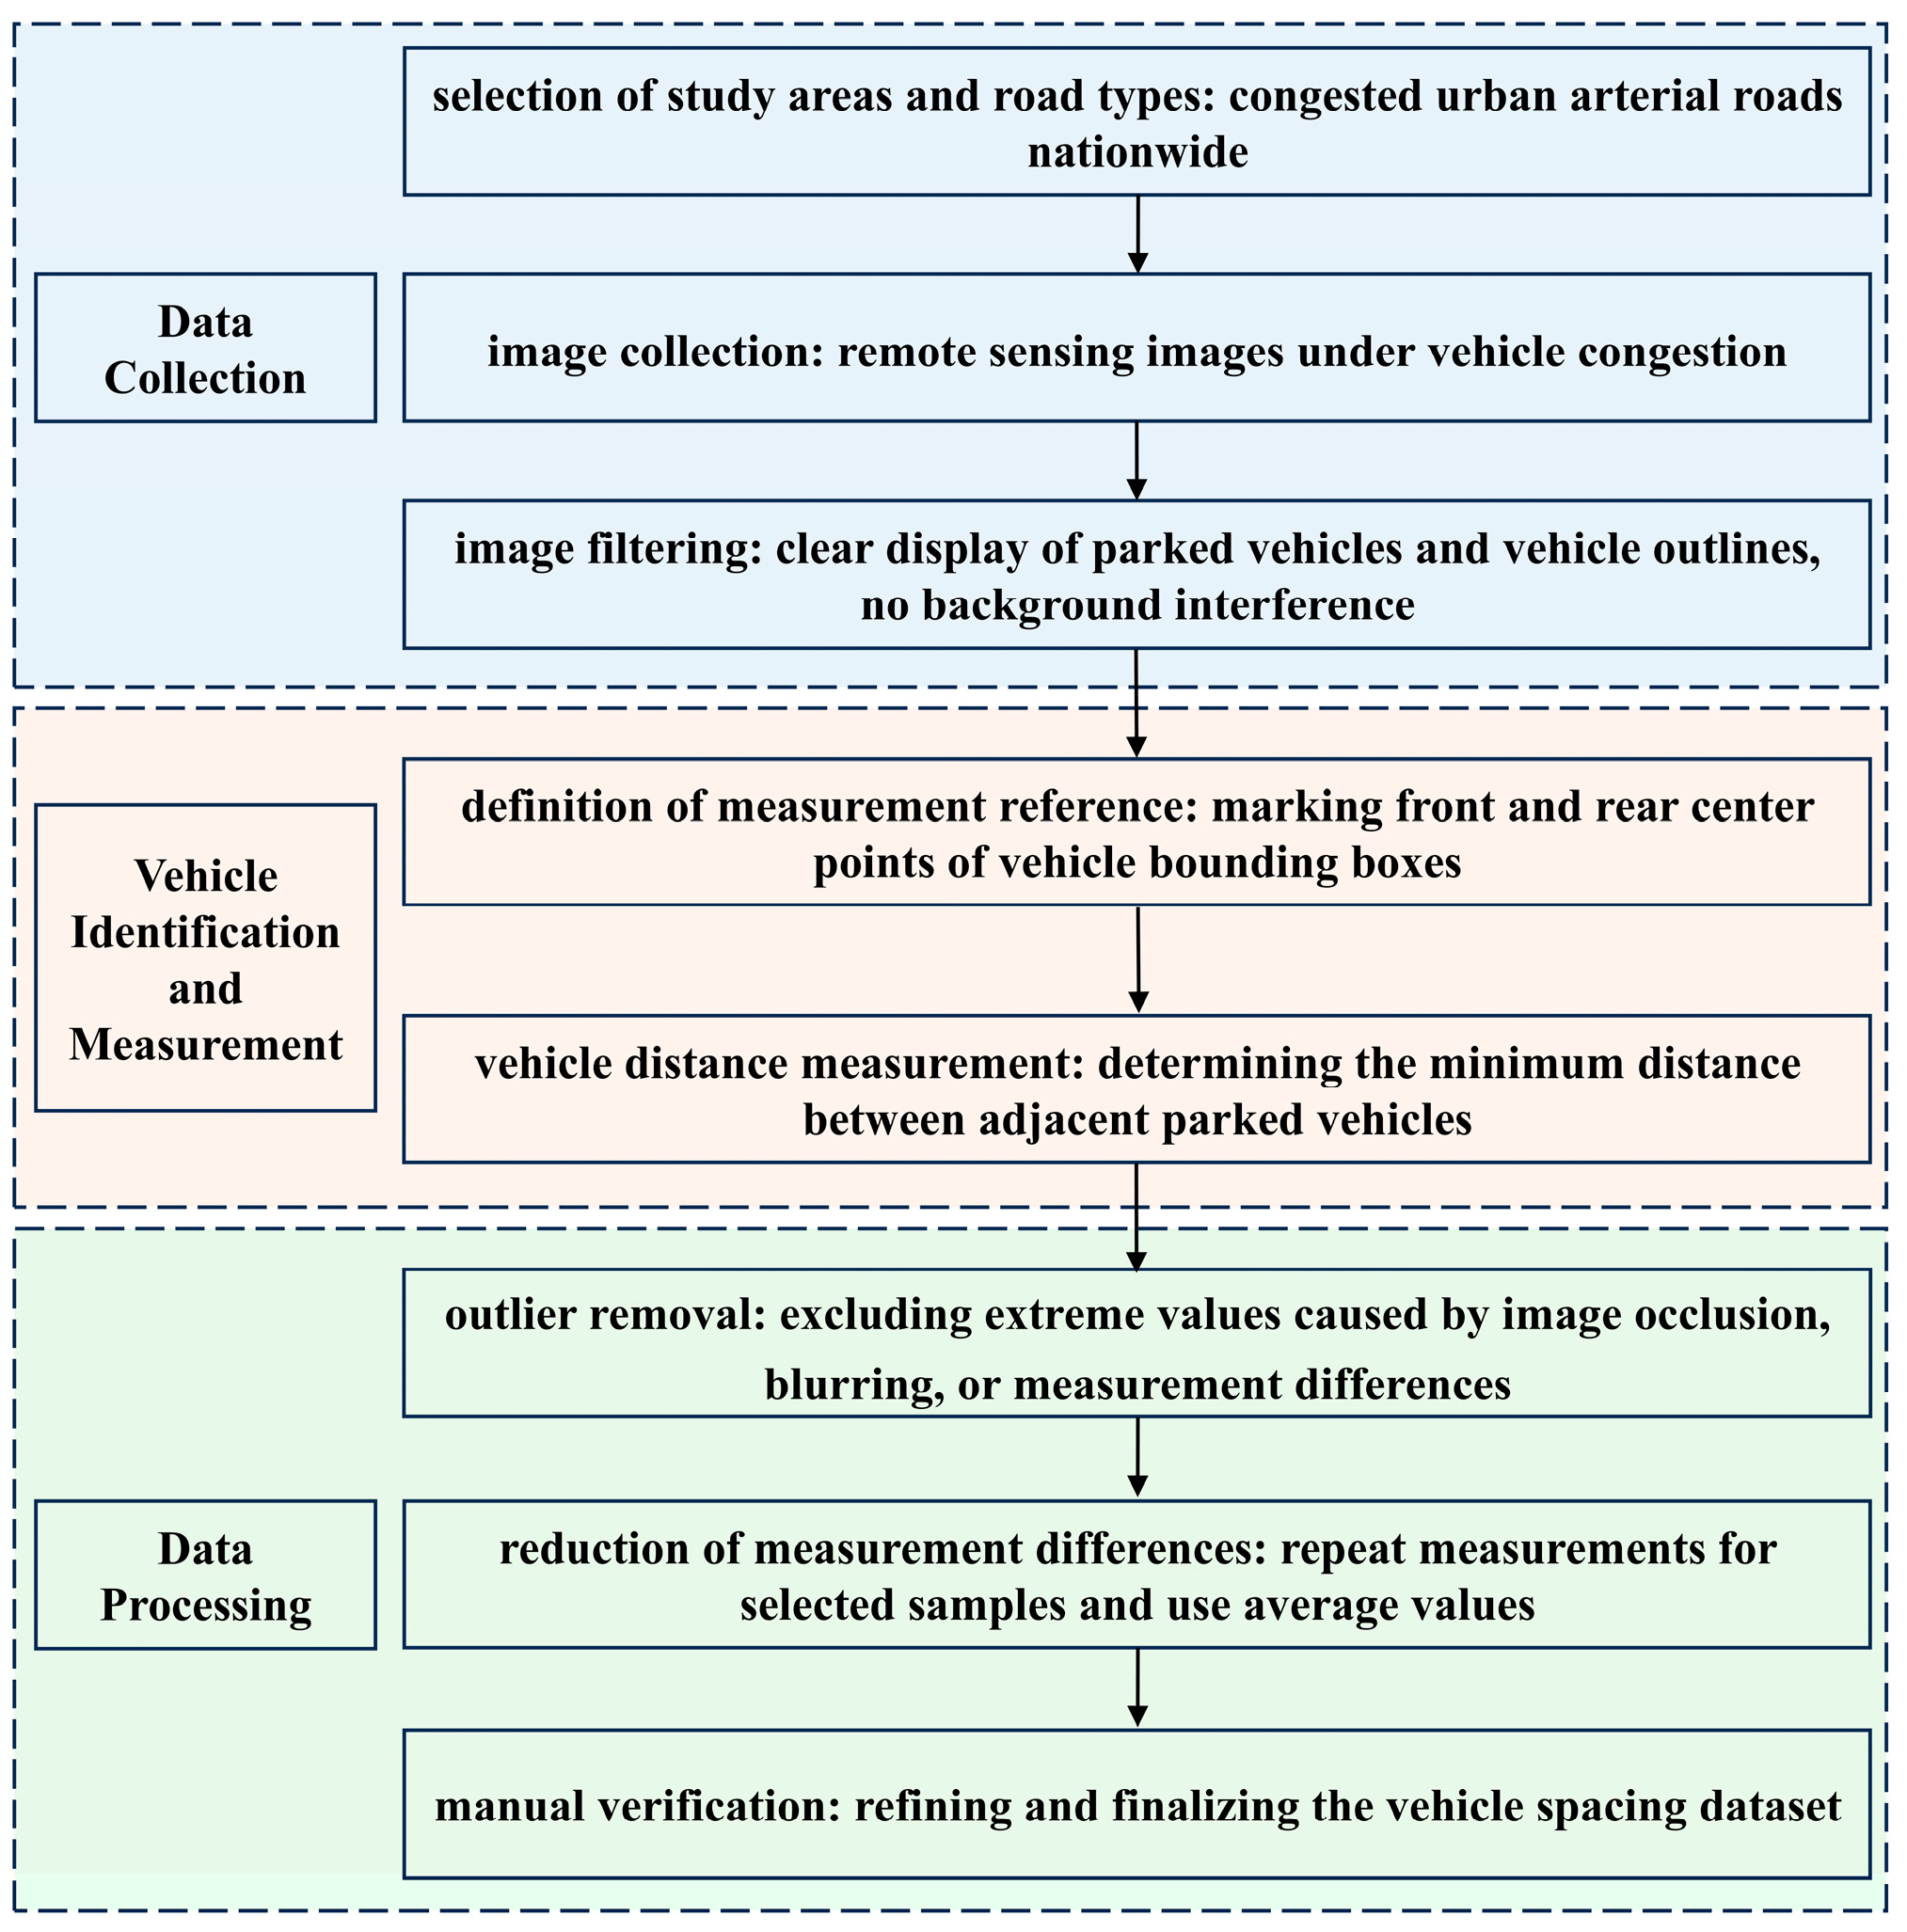
Based on high-resolution satellite imagery from online maps, the collection and processing of vehicle spacing data under congested and stationary conditions are conducted as follows:
- (1)
- Data collection
First, the study area and road type are defined. This study targets regions across the country where congested traffic conditions are observed. Urban roads that are easy to observe are selected as the target road type. Vehicle spacing data are then widely collected when vehicles are in congested and stationary states. To ensure data reliability, images are screened to retain only those in which vehicles are densely distributed, stationary, continuously arranged, and clearly identifiable. In addition, the background should not contain objects similar to vehicles or other sources of interference so that measurement differences can be reduced.
- (2)
- Vehicle identification and measurement
After the sample regions are selected, the satellite images are zoomed to the maximum display scale. The distance measurement tool provided by the online map is then used to measure the spacing between adjacent vehicles one by one. The measurements are further checked using a scale bar (5 m). The spacing is defined as the minimum distance between the outer contours of adjacent vehicles. Clear contour locations are selected as reference points for measurement.
- (3)
- Data processing
Considering that differences may arise from manual identification and measurement, several measures are applied during data processing. First, outliers caused by occlusion or unclear vehicle contours are removed. Second, repeated measurements are conducted for some samples, and average values are calculated. In addition, the sample size is increased to reduce the influence of measurement differences. To ensure data consistency, all vehicle images are cropped and stored with a uniform pixel size. Finally, the data are manually reviewed and corrected with reference to the original images, and a reliable dataset of vehicle spacing under stationary conditions is obtained.
A total of 1703 sets of static vehicle spacing data were extracted from the collected images. The data acquisition and processing procedure is illustrated in Figure 2.
Figure 2.
Detailed process of vehicle spacing data collection and processing.
Through the above steps, a vehicle spacing dataset reflecting real traffic conditions was obtained, providing a reliable basis for subsequent analysis and modeling.
2.1.2. Vehicle Type Ratio Across Lanes
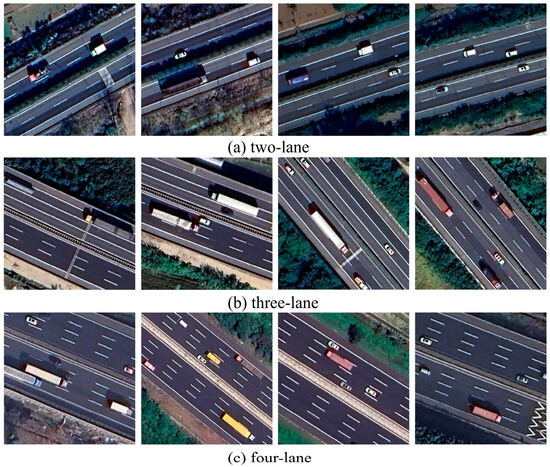
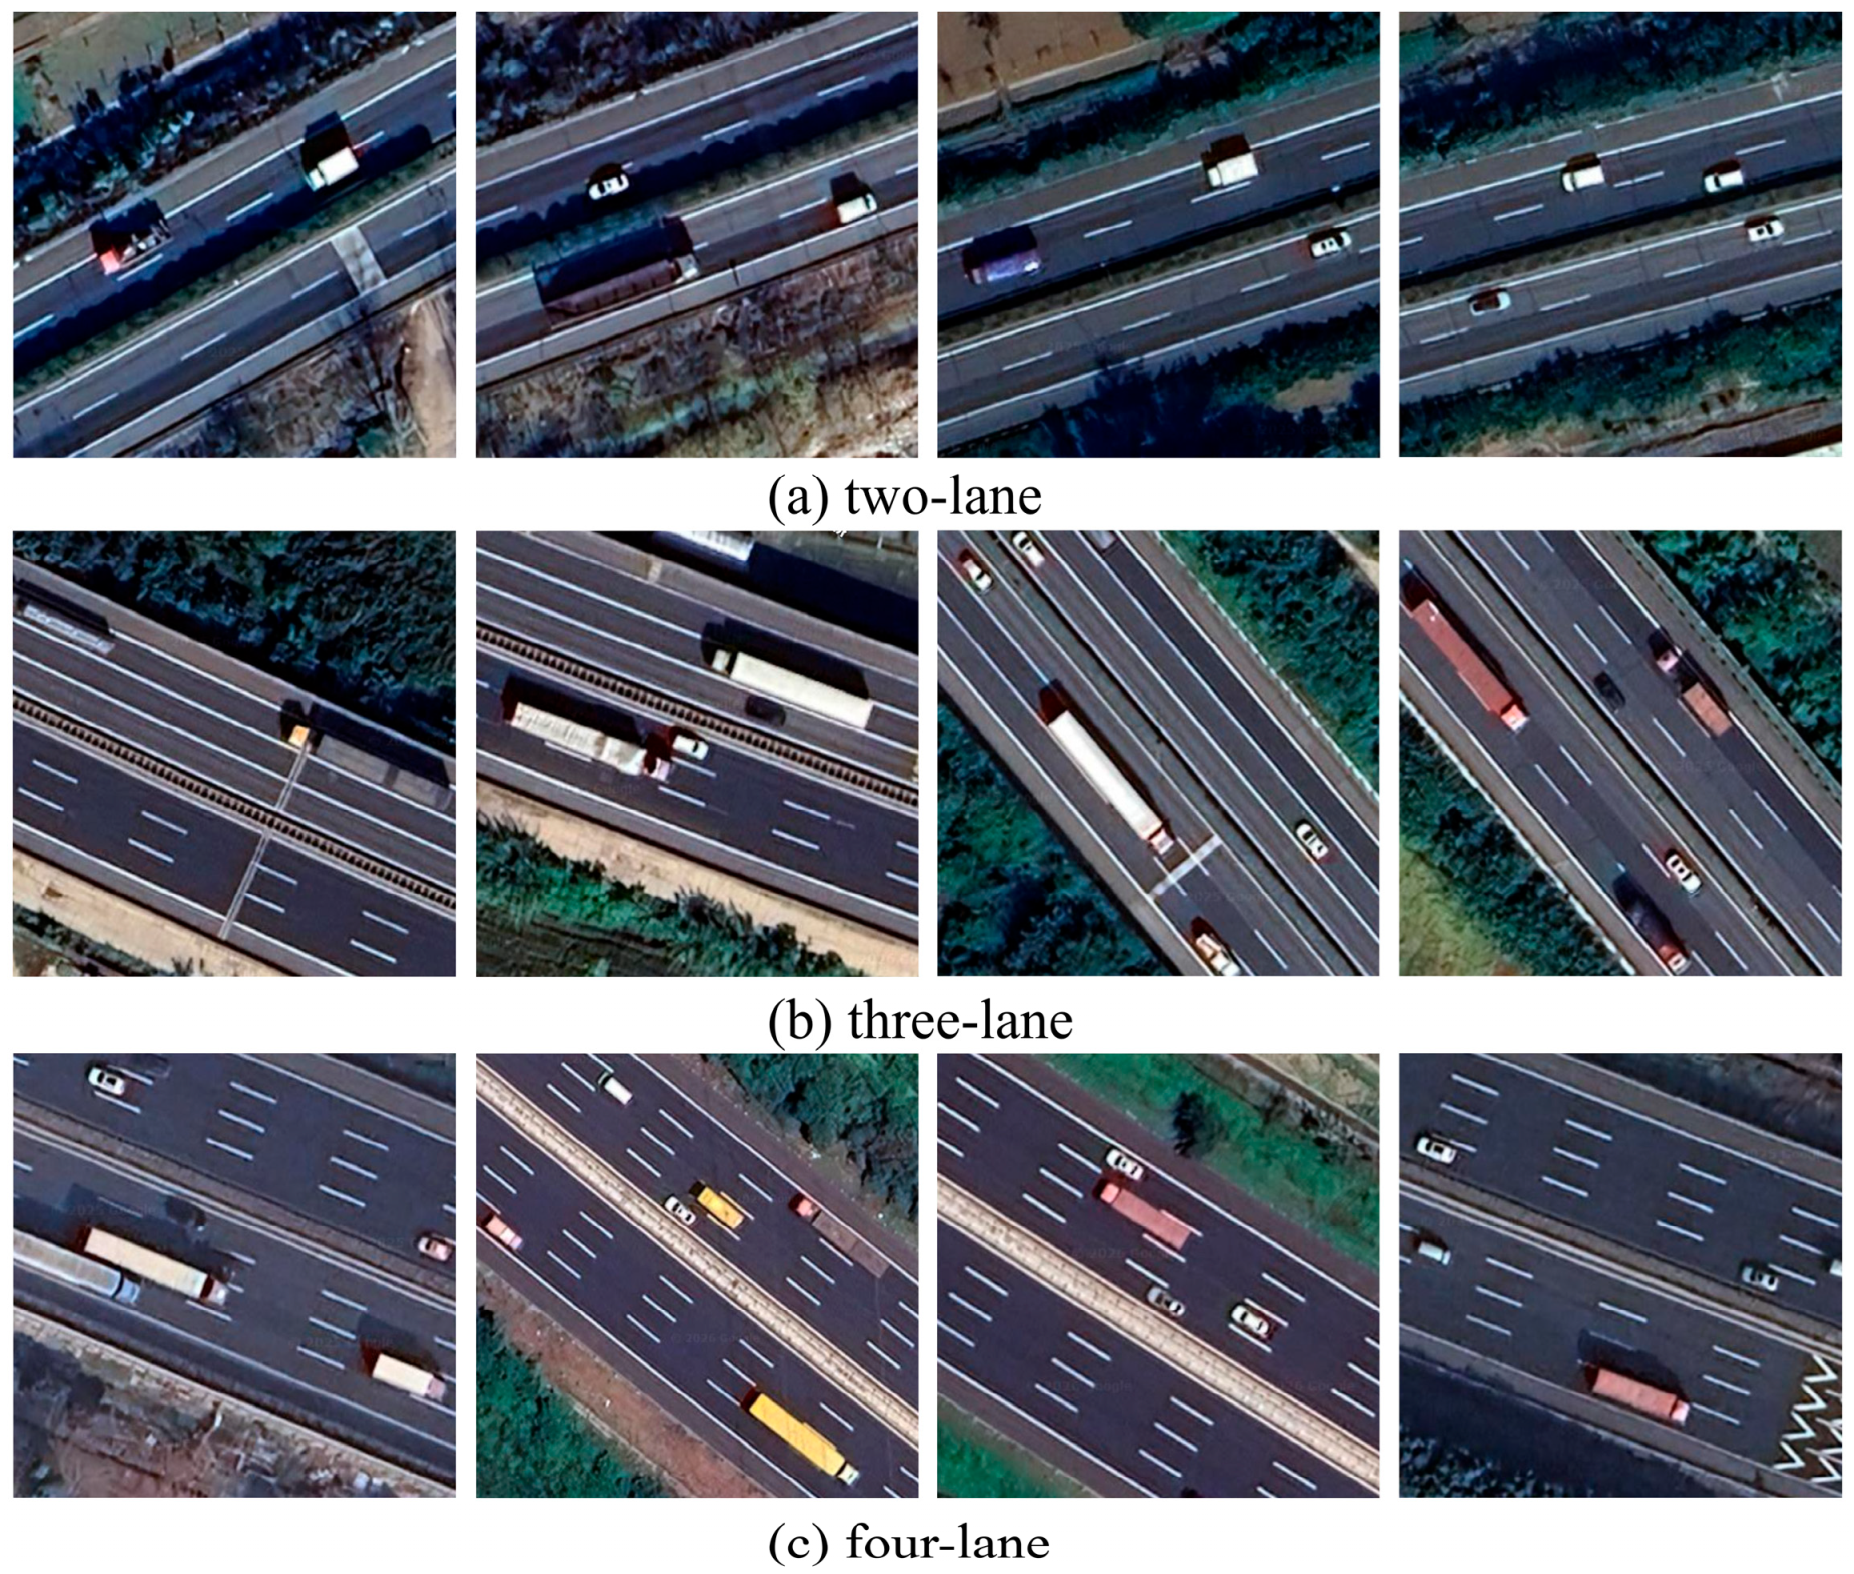
According to the Consolidated Resolution on the Construction of Vehicles (R.E.3), the Road Traffic Management—Types of Motor Vehicles, and actual traffic conditions, vehicles can be categorized into four types: passenger car, tourist coach, container truck, and general truck. In real traffic scenarios, vehicle types are unevenly distributed across different lanes. Typically, a higher proportion of small vehicles, such as passenger cars, is observed in the overtaking lane, whereas a greater number of large vehicles, including tourist coaches, container trucks, and general trucks, tend to occupy the slow lane. Based on this observation, more than a thousand high-resolution satellite images of two-lane, three-lane, and four-lane expressways were collected from online maps (see Figure 3), and the actual vehicle type ratio across lanes was calculated.
Figure 3.
High-resolution satellite imagery of vehicles on various highway lanes.
2.2. Statistical Analysis
2.2.1. Distribution of Vehicle Spacing
The statistical distribution of the 1703 collected static vehicle spacing data points is summarized in Table 1. It is observed that the majority of vehicle spacing values fall within the range of 0.50 m to 3.50 m, accounting for 89.02% of the total dataset.
Table 1.
Distribution of vehicle spacing data.
Further statistical analysis of the sample was conducted, as shown in Table 2. Both the skewness and kurtosis of vehicle spacing are greater than one, indicating a peaked and right-skewed distribution. The probability density curve exhibits a right-tailed pattern, suggesting that the data are consistent with the characteristics of a log-normal distribution.
Table 2.
Statistical analysis of vehicle spacing data.
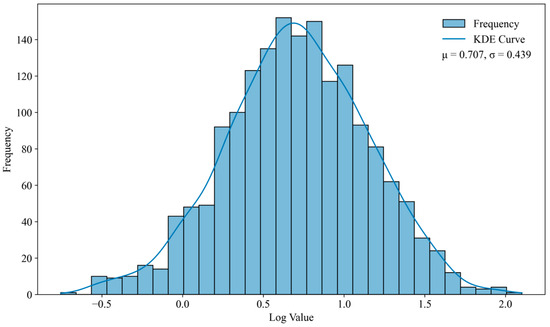
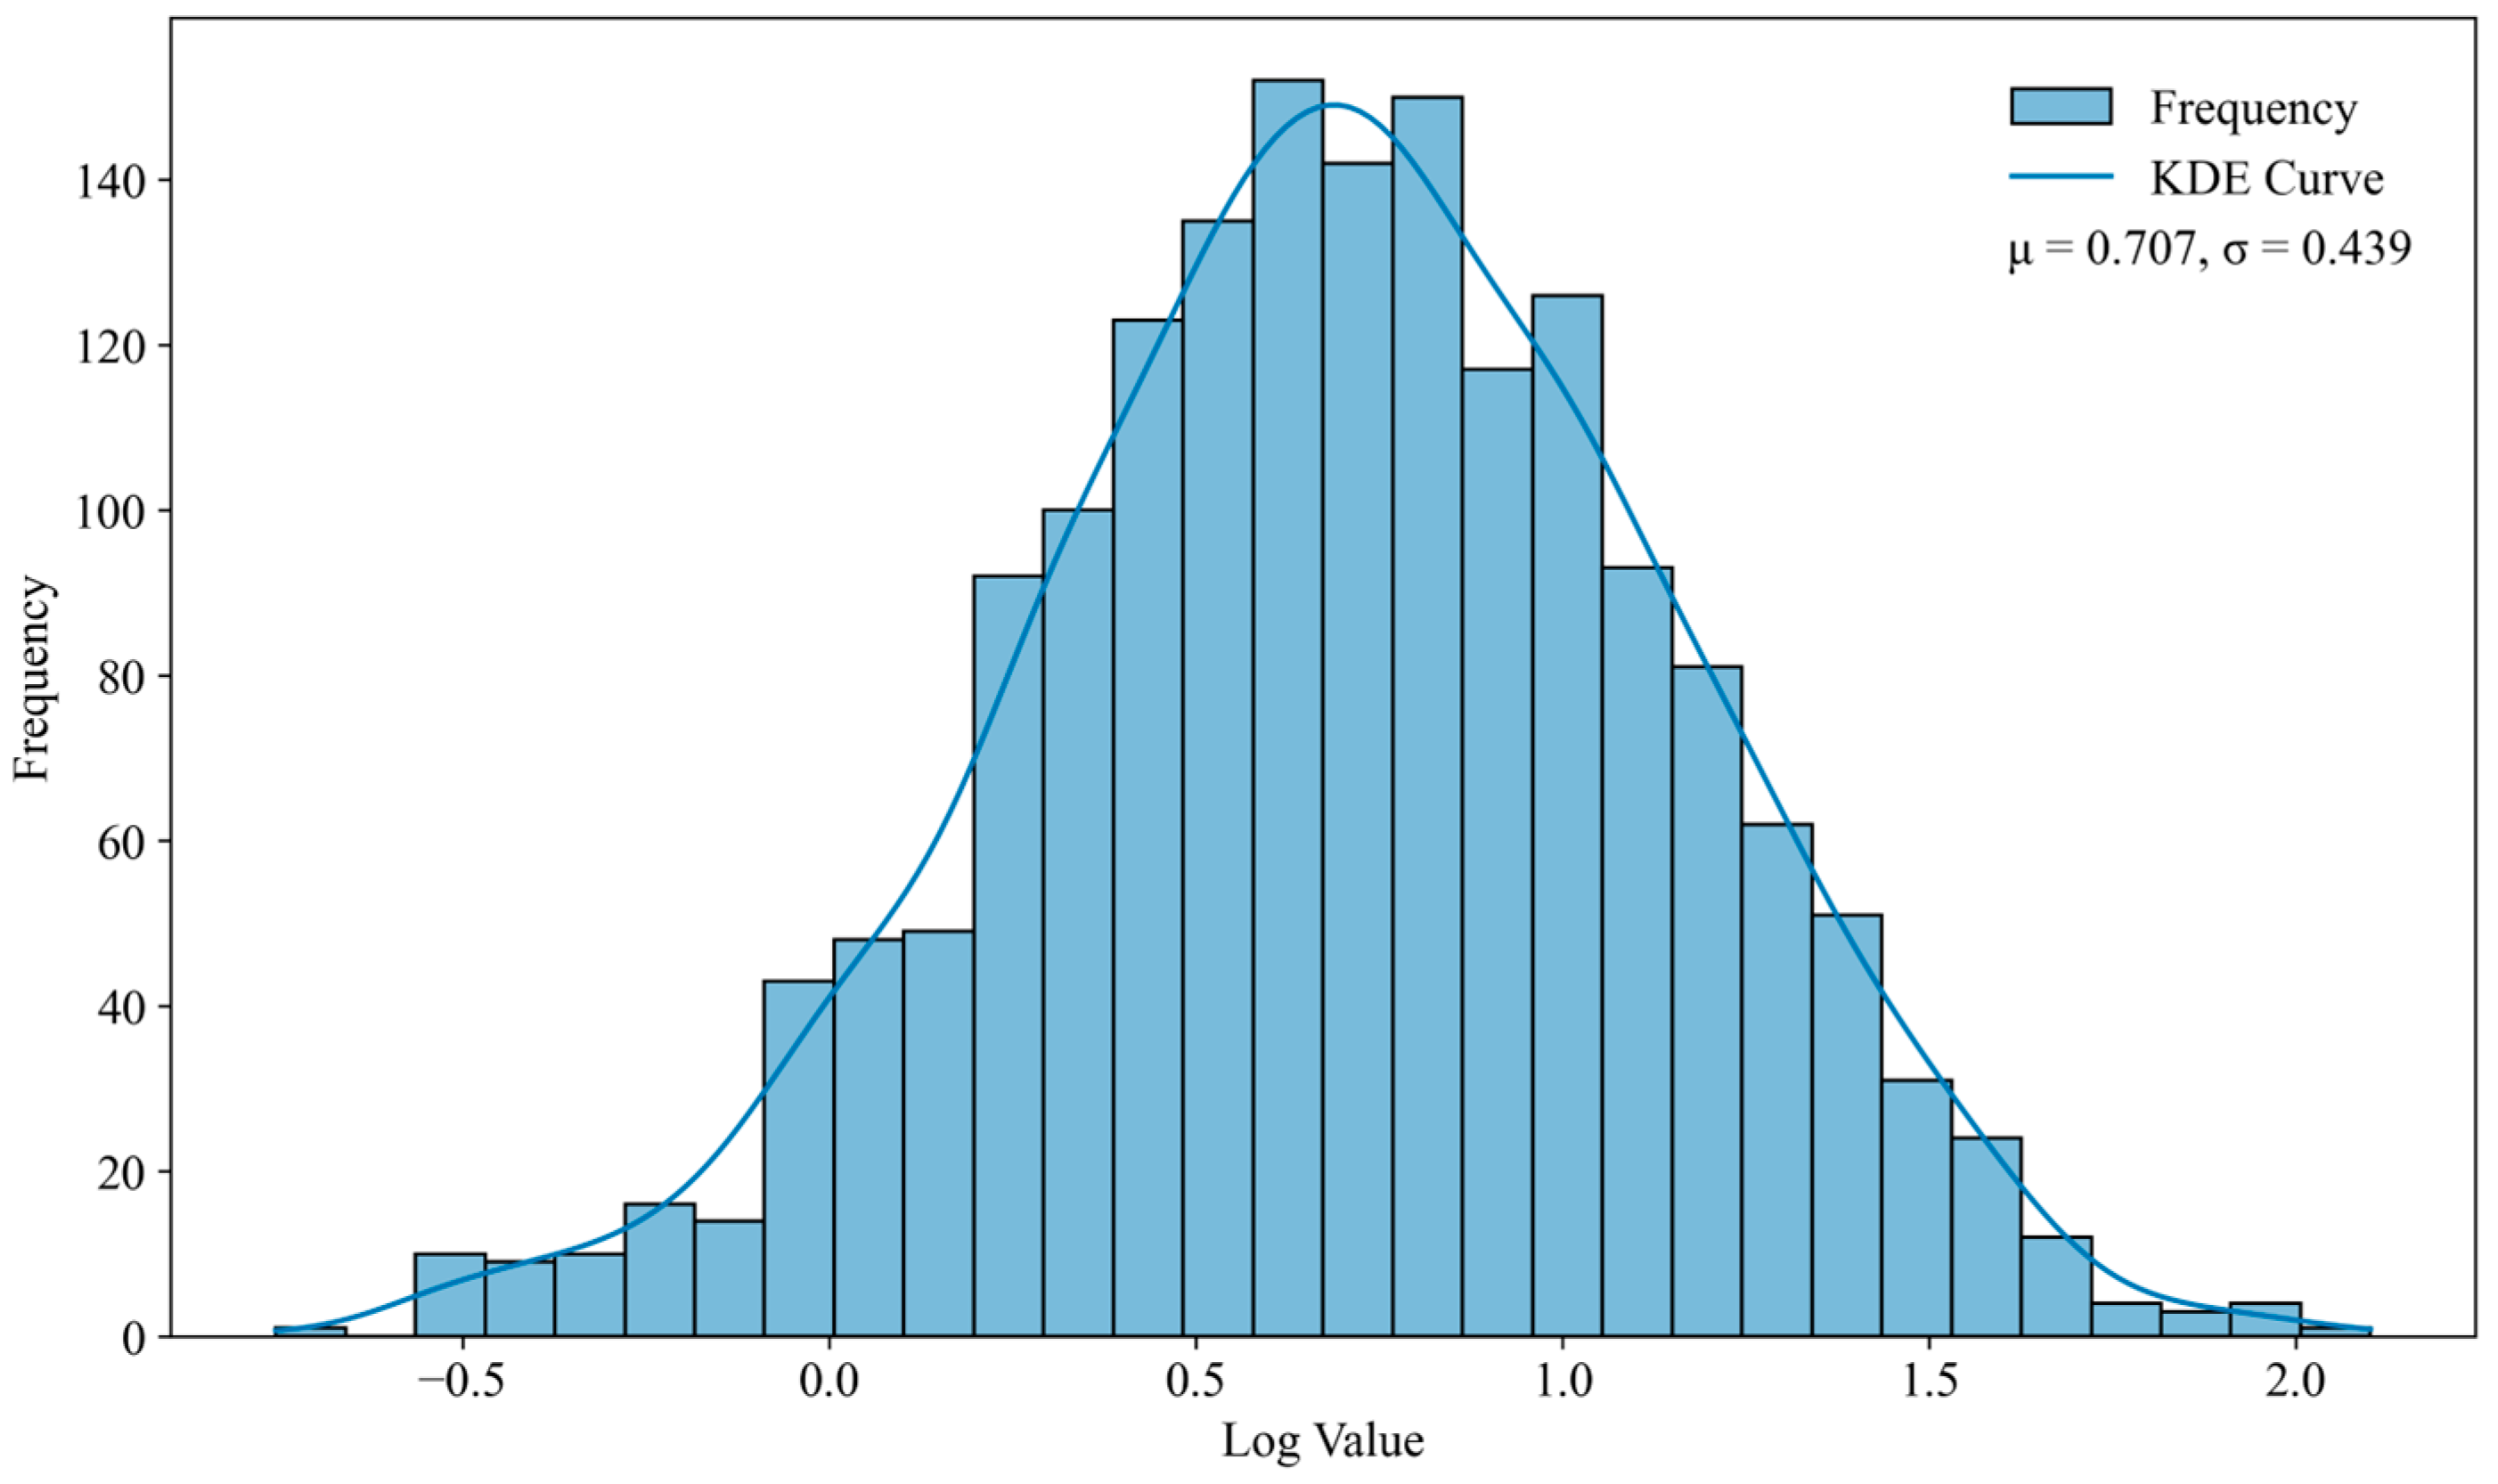
Logarithmic transformation is commonly used to make data distributions more symmetrical, reduce skewness and the influence of extreme values, and better meet the assumptions of statistical models. In this study, a histogram of the log-transformed vehicle spacing data was constructed, as shown in Figure 4. The x-axis represents the log-transformed values of vehicle spacing, and the y-axis denotes the frequency of each log-transformed value.
Figure 4.
Histogram of log-transformed vehicle spacing data.
As shown in Figure 4, the histogram of the log-transformed vehicle spacing data is observed to exhibit an approximately symmetric, unimodal, bell-shaped distribution. The data are primarily concentrated within the log-value range of −0.5 to 2.0. The curve in the figure is represented by the kernel density estimation (KDE), which provides a non-parametric estimate of the probability density function. For a set of log-transformed vehicle spacing values (), the expression of the kernel density estimation is written using Equation (1):
where and represent the log-transformed values of vehicle spacing and the estimated value of the probability density function at position x, respectively; denotes the number of vehicle spacing observations. is the bandwidth, which is calculated using Scott’s Rule, as expressed in Equation (2):
where denotes the standard deviation of the vehicle spacing values. The kernel function is represented by , which is typically a Gaussian kernel. Its general expression is given in Equation (3):
The fitted kernel density estimation (KDE) curve closely matches the shape of the histogram, indicating a smooth underlying distribution characterized by a sharp peak and gradually decaying tails. The frequencies of both small and large spacing values, corresponding to extreme observations, are relatively low, suggesting that the data are well concentrated. It can be preliminarily inferred that the log-transformed data exhibit characteristics consistent with a normal distribution. Accordingly, the original vehicle spacing values follow a log-normal distribution.
2.2.2. Distribution of Vehicle Type Ratio Across Lanes
Three types of expressways were selected, including two-lane, three-lane, and four-lane expressways, with the Jiliao Expressway, Jiguang Expressway, and Beijing–Hong Kong–Macao Expressway serving as study cases. The number of passenger cars, tourist coaches, container trucks, and general trucks in each lane was counted. In total, 3139 vehicles were recorded on two-lane expressways, 3677 on three-lane expressways, and 4395 on four-lane expressways. The detailed vehicle counts and distribution ratios for each lane are presented in Table 3, Table 4 and Table 5. The ratios of vehicle types in each lane are expressed in colon-separated form, with the sum of the ratios in each row equal to one. For two-lane expressways, the lane types are categorized as an overtaking lane and a slow lane; for three-lane expressways, as an overtaking lane, a driving lane, and a slow lane; and for four-lane expressways, as an overtaking lane, two driving lanes, and a slow lane.
Table 3.
Vehicle counts and distribution ratios on two-lane expressways.
Table 4.
Vehicle counts and distribution ratios on three-lane expressways.
Table 5.
Vehicle counts and distribution ratios on four-lane expressways.
As shown in Table 3, Table 4 and Table 5, passenger cars have the highest proportion in the overtaking lane. On two-lane, three-lane, and four-lane expressways, the proportions of passenger cars in the overtaking lane are 0.65, 0.48, and 0.38, respectively. A decreasing trend in the proportion of passenger cars is observed from the overtaking lane to the slow lane. In contrast, general trucks are found to be most concentrated in the slow lane, with proportions of 0.84, 0.63, and 0.62 on two-lane, three-lane, and four-lane expressways, respectively. An increasing trend in the proportion of general trucks is observed from the overtaking lane to the slow lane. For tourist coaches and container trucks, the highest proportions are found in the slow lane on two-lane expressways, with values of 0.64 and 0.75, respectively. On three-lane and four-lane expressways, these two vehicle types are mainly concentrated in the driving lanes near the slow lane. This differentiated distribution pattern is closely related to vehicle types and their operating characteristics. Passenger cars, due to greater flexibility and higher travel speeds, are more likely to use the overtaking lane to improve traffic efficiency. In contrast, large vehicles such as tourist coaches, container trucks, and general trucks, due to their heavier weight and longer braking distances, are more likely to travel in the slow lanes to ensure driving safety. This pattern is consistent with the actual characteristics of highway traffic flow. The lane-specific vehicle type distribution ratios obtained in this study therefore provide realistic and valid input data for tunnel evacuation research.
2.3. Log-Normal Test of Vehicle Spacing
Based on the statistical analysis results of vehicle spacing presented above, it can be inferred that vehicle spacing may follow a log-normal distribution. Therefore, further verification is conducted in this section. The Kolmogorov–Smirnov (K-S) test is a non-parametric statistical method commonly used to determine whether a sample follows a normal distribution. The K-S test evaluates the maximum difference between the empirical cumulative distribution function (CDF) of the sample and the CDF of the corresponding theoretical normal distribution. The test results are primarily interpreted based on the test statistic D and the corresponding p-value. The test statistic D represents the maximum deviation between the empirical CDF of the sample and the theoretical CDF, as defined in Equation (4):
where and represent the empirical CDF of the sample and the theoretical CDF, respectively. A smaller value indicates a smaller difference between the sample data and the theoretical distribution, suggesting a better fit to the theoretical model.
The significance of the difference between the sample data and the theoretical distribution is reflected by the p-value. A p-value greater than or equal to 0.050 indicates that the difference is not statistically significant, suggesting that the data are consistent with the theoretical distribution. In this study, the K-S test applied to the log-transformed vehicle spacing data yielded . This result indicates that the log-transformed data follow a normal distribution.
2.4. Log-Normal Distribution Modeling
A log-normal distribution is defined as a probability distribution in which the logarithm of a random variable is assumed to follow a normal distribution. If a continuous random variable X is restricted to positive values and is assumed to follow a log-normal distribution with probability density function , then
where µ and σ represent the mean and standard deviation of lnX, respectively.
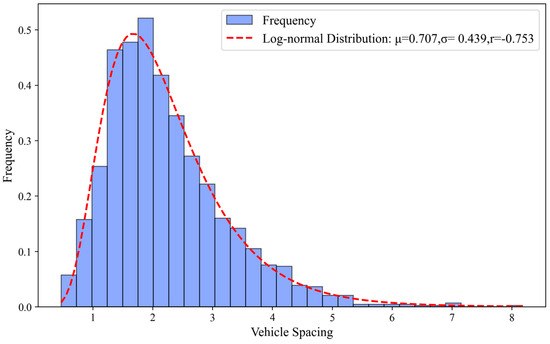
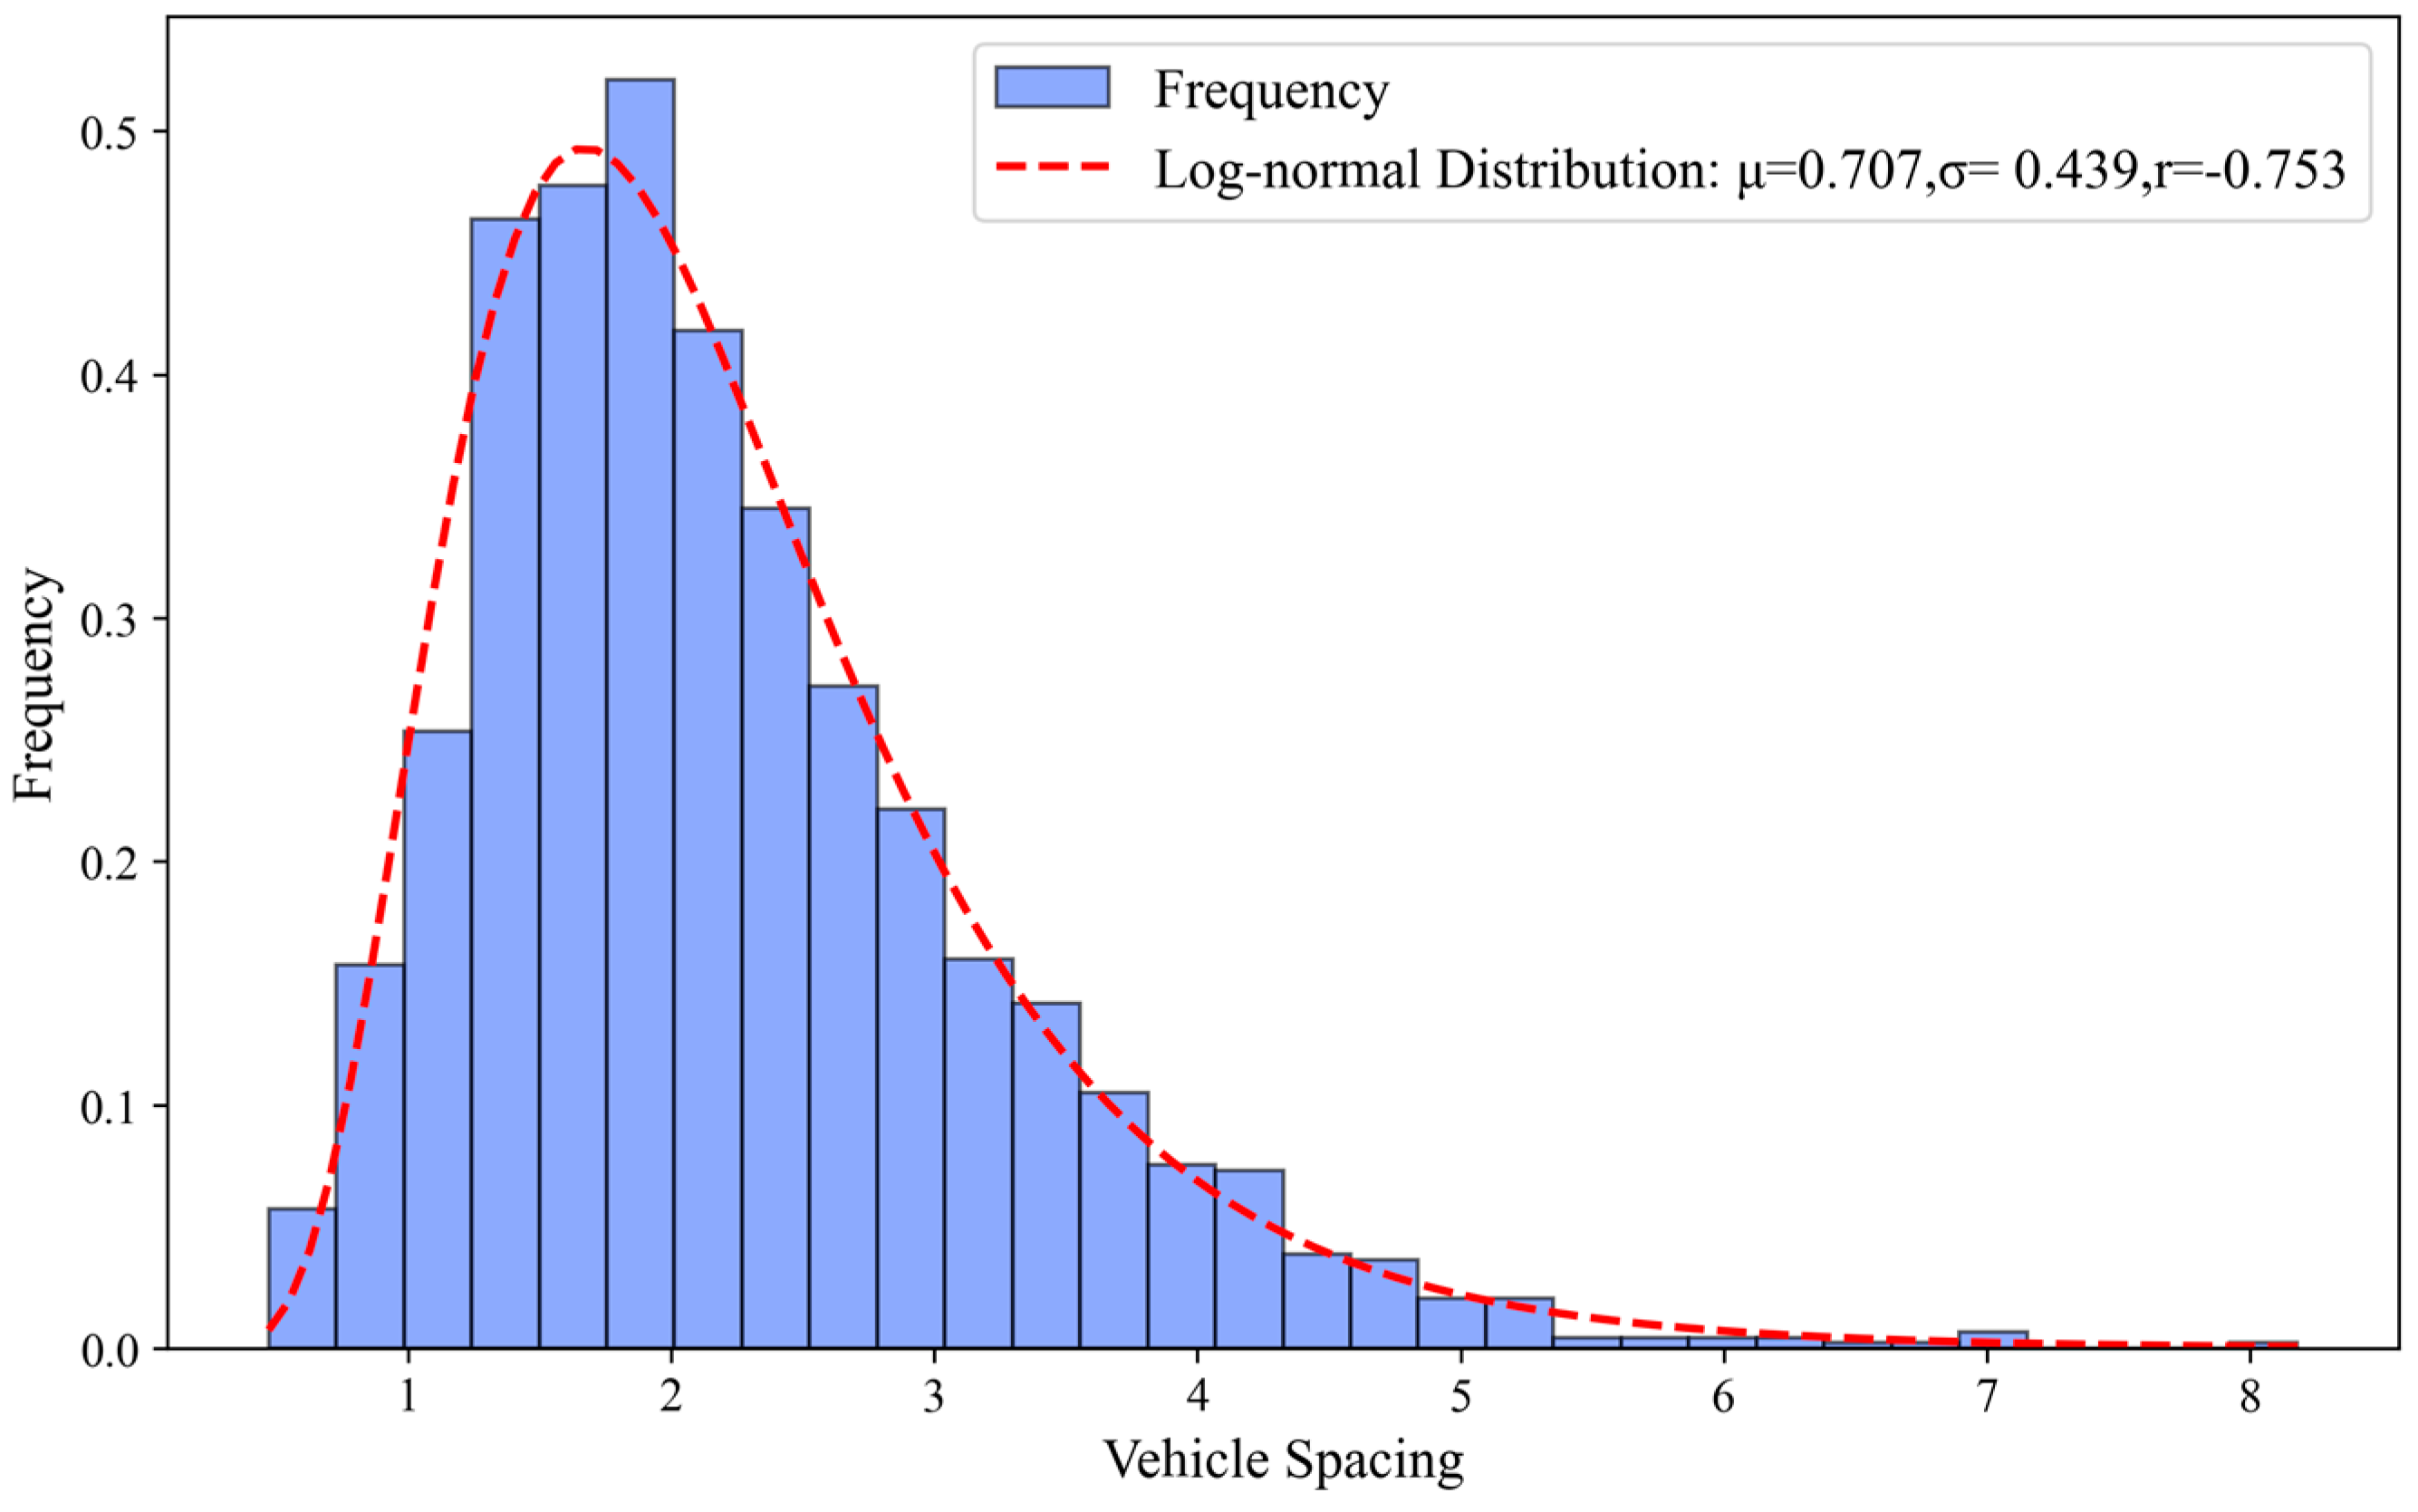
The collected vehicle spacing data were fitted using a log-normal distribution model. The fitting results are presented in Figure 5, in which the x-axis represents vehicle spacing values, and the y-axis denotes the frequency of the data distribution.
Figure 5.
Log-normal distribution fitting curve.
In Figure 5, the correlation coefficient between vehicle spacing values and the frequency of the data distribution is defined in Equation (6):
where and represent the vehicle spacing values and the frequency, respectively; and denote the mean values of vehicle spacing and frequency, respectively.
As shown in Figure 4, the fitted probability density curve closely matches the histogram of vehicle spacing frequencies, indicating a good fit. The correlation coefficient was calculated as = −0.753. The absolute value of the correlation coefficient exceeds 0.750, suggesting a strong correlation. The results indicate that vehicle spacing can be adequately described by a log-normal distribution, with a log-mean of = 0.707 and a log-standard deviation = 0.439.
2.5. Vehicle Spacing Arrangement Algorithm Design
To effectively utilize the collected field data and achieve a random vehicle arrangement that reflects non-uniform vehicle spacing consistent with real traffic flow characteristics, a random arrangement algorithm for tunnel vehicles under non-uniform vehicle spacing conditions was developed. The implementation steps of the algorithm are as follows:
- (1)
- Vehicle spacing parameter setting
The vehicle spacing, denoted as ,…,, is assumed to follow a log-normal distribution, and the average spacing is represented by . The random vehicle spacing values following a log-normal distribution are generated using Equation (7):
where µ and σ denote the mean and standard deviation of , respectively. Two independent random numbers, and , are generated following a uniform distribution, i.e., . The variable follows a log-normal distribution, denoted as .
The average vehicle spacing is calculated according to Equation (8):
- (2)
- Vehicle type parameters setting
Assume there are vehicle types, denoted as …,, The length and proportion of the i-th vehicle type are represented by and , respectively. The proportions of all vehicle types must satisfy the constraint in Equation (9), such that the sum equals one.
- (3)
- Spatial parameters of the highway tunnel numerical model setting
The longitudinal direction of the highway tunnel physical model is assumed to be the X-axis; the tunnel length can be obtained as , where and are the starting and ending coordinates along the X-axis, respectively.
- (4)
- Lane-specific distribution of different vehicle types setting
The lane-specific distribution is defined as the proportion of each vehicle type distributed across different lanes. For vehicle type , the proportion of its quantity on lane relative to its total quantity is denoted as . Also, the sum of the distribution ratios of vehicle type across all lanes must be equal to one, described by Equation (10):
- (5)
- Vehicle quantity calculation algorithm
According to Equation (11), the proportion of vehicle type on lane relative to the total number of all vehicle types is denoted as .
The number of vehicles on lane is calculated according to Equation (12).
The total number of all vehicle types in the highway tunnel numerical model is calculated according to Equation (13).
The number of vehicle types on lane , denoted as , is calculated according to Equation (14).
Following the steps outlined above, vehicle spacing conforming to a log-normal distribution can be generated. Based on this spacing, the number of vehicles in each lane, the total number of all vehicle types, and the number of each vehicle type in each lane are recalculated. Vehicle layouts with non-uniform spacing conditions are then implemented according to the generated log-normally distributed spacing.
2.6. System Integration
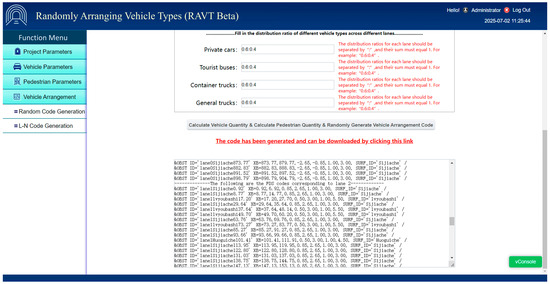
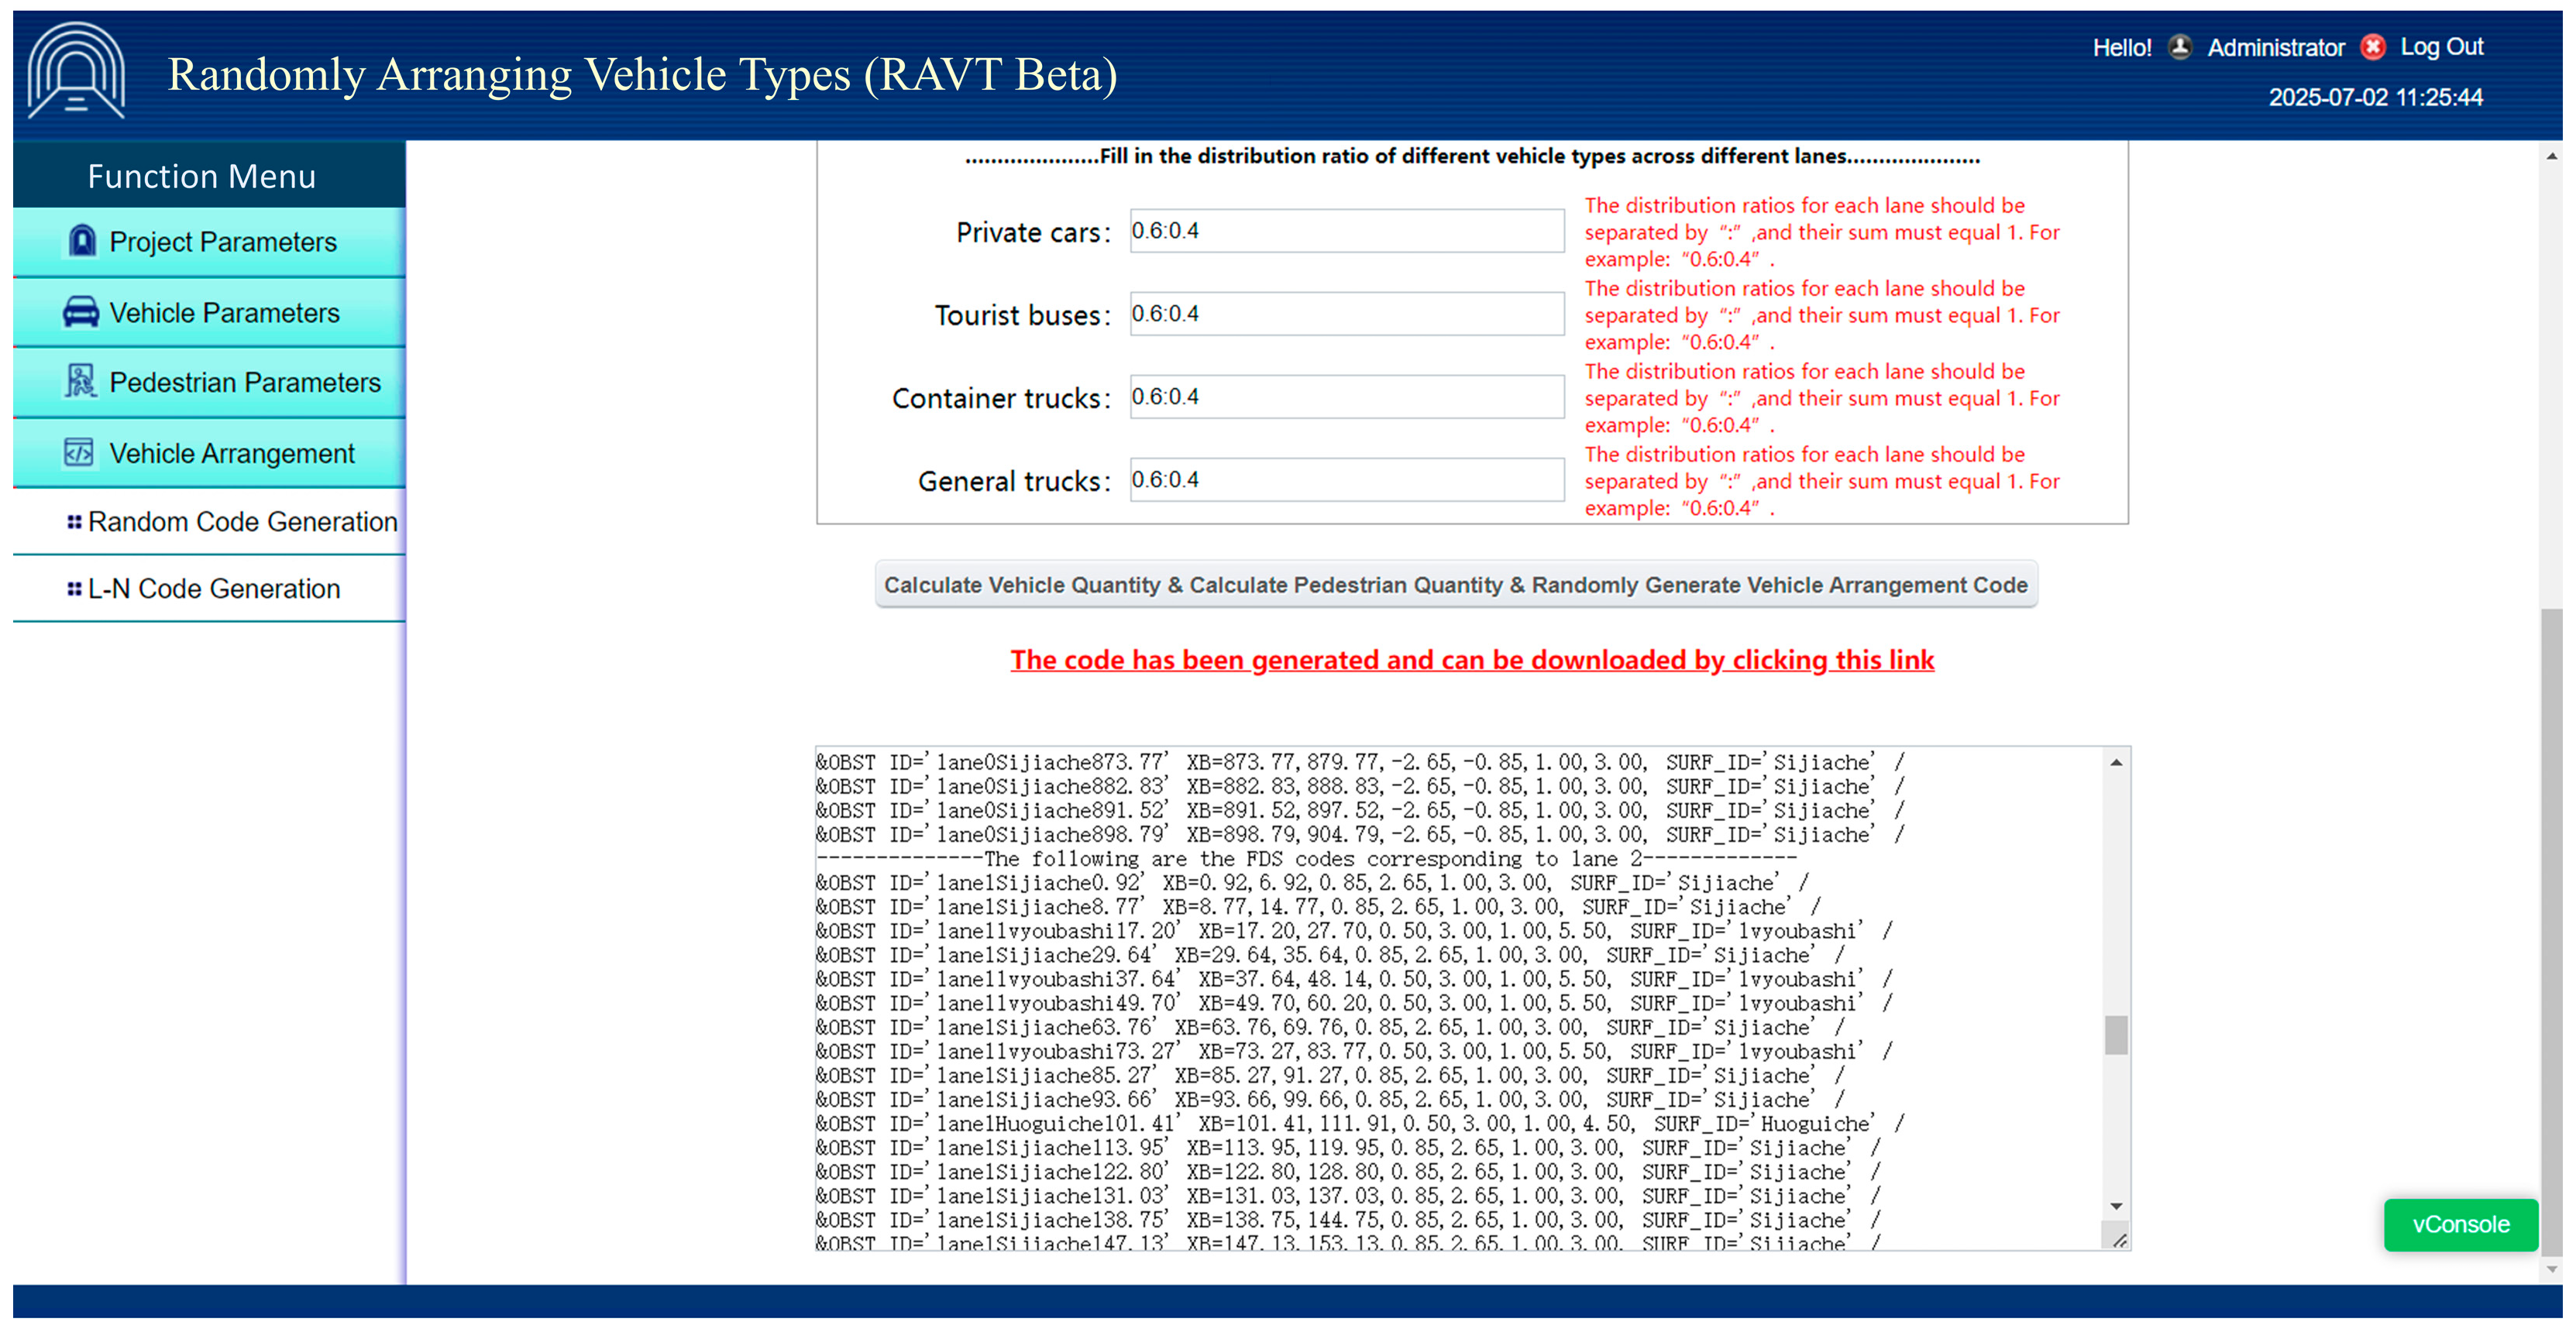
Based on the algorithm described in Section 4.1, it was integrated into an existing self-developed system—Randomly Arranging Vehicle Types (RAVTs)—as shown in Figure 6. The RAVT system was developed using HTML5, CSS, and JavaScript and consists of four main functional modules: the project parameter setting module, the vehicle type parameter setting module, the pedestrian type parameter setting module, and the random vehicle arrangement calculation module. By inputting parameters such as the spatial coordinates of the tunnel geometry model, vehicle dimensions, vehicle type ratios, and lane-specific vehicle type distributions, the system can rapidly calculate the vehicle layout parameters and pedestrian load parameters. The corresponding vehicle model FDS code was then automatically generated and imported into Pathfinder for evacuation simulation so that vehicles could be arranged efficiently and accurately in highway tunnel fire and evacuation models [25]. The RAVT system was originally designed to support only idealized vehicle arrangements with uniformly distributed spacing. After the integration of the proposed random arrangement algorithm, the system has been upgraded to support vehicle layout under non-uniform spacing conditions. The applicability of the system in complex traffic scenarios has been significantly enhanced, providing a more realistic and efficient tool for highway tunnel fire and evacuation simulation.
Figure 6.
Interface of RAVT.
3. Simulation Study
3.1. Tunnel Evacuation Model Parameters
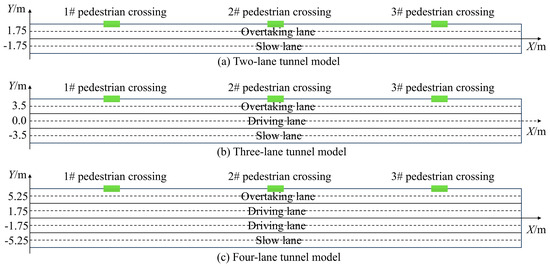
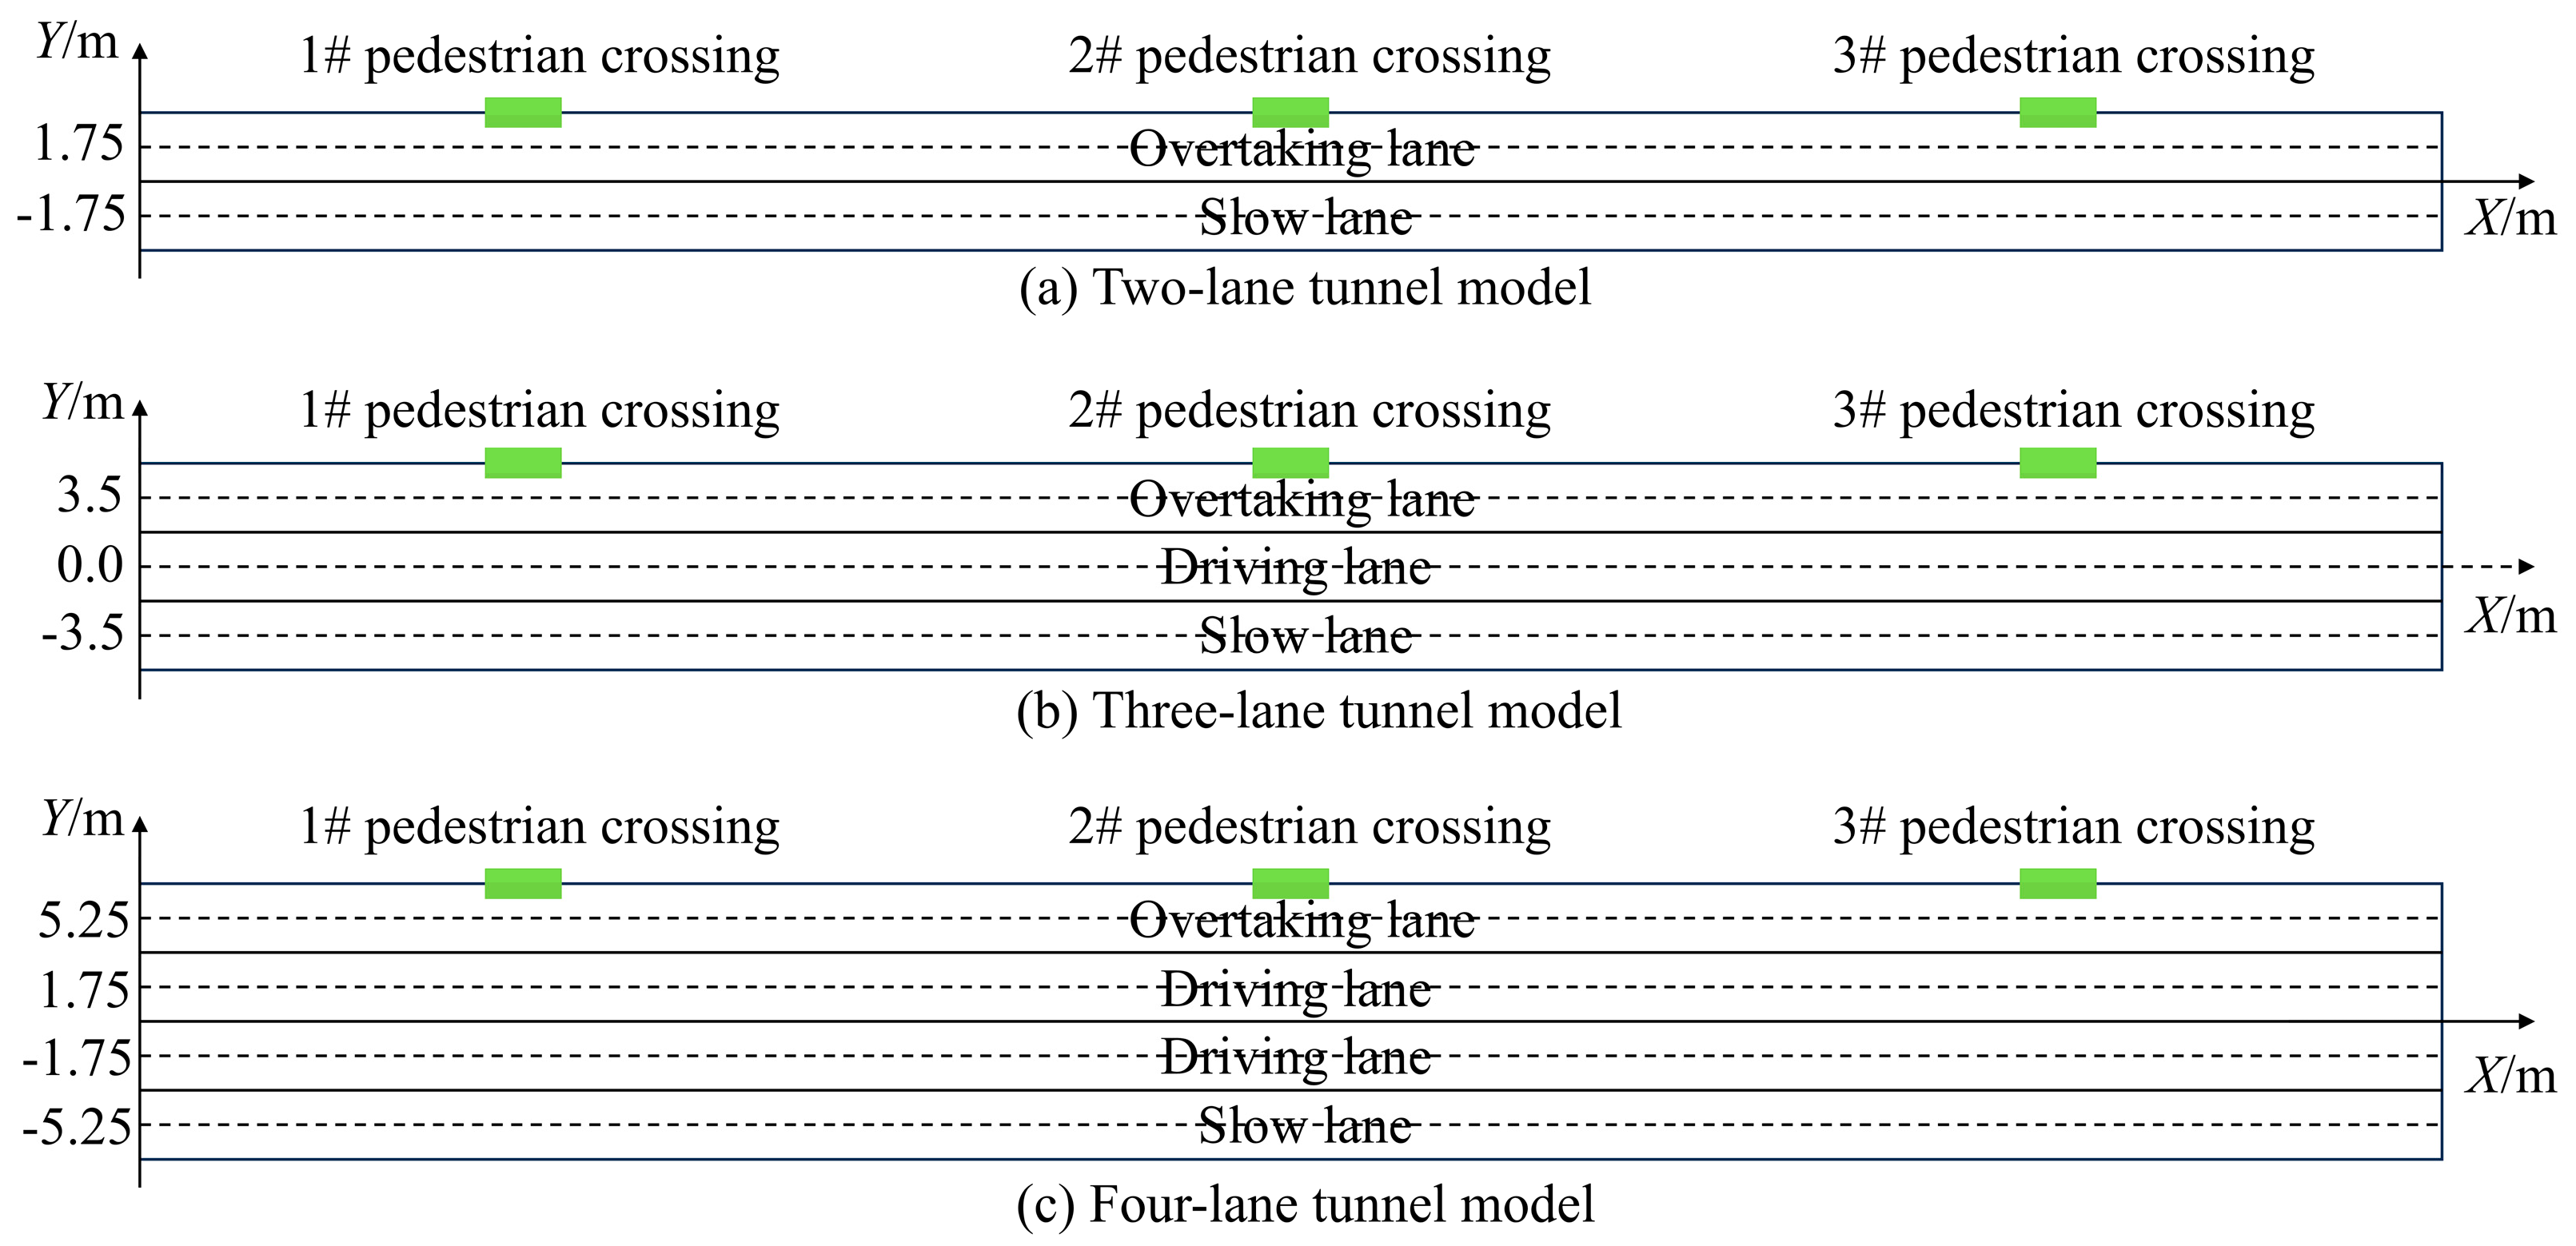
To investigate the impact of the log-normal distribution characteristics of vehicle spacing on tunnel fire evacuation, Pathfinder was used to conduct the evacuation simulations in this study. Tunnel evacuation models for two-lane, three-lane, and four-lane scenarios were established. The tunnel model width and the Y-coordinate of the centerline of each lane for each scenario are provided in Table 6, with the Y-coordinates separated by commas. The tunnel model length was determined based on different distances between pedestrian crossings, as shown in Table 7. In all scenarios, a 0.50 m wide maintenance platform was placed on the overtaking lane side. A schematic diagram of the tunnel layout in the horizontal plane is presented in Figure 7.
Table 6.
Parameters of the tunnel evacuation model.
Table 7.
Parameters of the pedestrian crossing.
Figure 7.
Schematic plan view of tunnel model lanes.
3.2. Vehicle and Pedestrian Composition
Based on the above discussion, the vehicle types, dimensions, passenger capacity, and type distribution ratio in the tunnel were defined, as shown in Table 8. In this study, it was assumed that all vehicles were fully occupied.
Table 8.
Basic parameters of vehicle types.
According to the SFPE Handbook of Fire Protection Engineering, the pedestrian types in the tunnel evacuation model were classified into adult males, adult females, children, and elderly individuals. The composition ratio, evacuation speed, and shoulder width for each pedestrian type are listed in Table 9.
Table 9.
Pedestrian composition ratio, evacuation speed, and shoulder width.
3.3. Evacuation Simulation Scenarios
In this study, 12 evacuation simulation scenarios were set up, as listed in Table 10. Considering the randomness of vehicle parking positions, 10 random vehicle arrangements and evacuation simulations were conducted for each scenario, resulting in a total of 120 evacuation simulations. For scenarios assuming uniform vehicle spacing, the vehicle spacing value was set as 2.23 m. The vehicle type ratio across lanes was assigned according to the actual statistics. The total number of vehicles and the total number of pedestrians were automatically generated in the FDS code. The code was then imported into Pathfinder, through which evacuation simulations could be conducted. During the simulation, pedestrians were randomly distributed according to the number of pedestrians per lane and placed accordingly.
Table 10.
Designs of evacuation simulation scenarios.
4. Results and Discussion
4.1. Evacuation Results
In this section, the RAVT system and Pathfinder (Version 2023.2.0816) software are used to perform evacuation simulations. For each scenario, the average, maximum, and minimum evacuation times, as well as the variance, standard deviation, and pedestrian crossing capacity, are summarized in Table 11. The percentage differences in the average evacuation times between each group of scenarios, as calculated using Equation (15), are listed in Table 12.
Table 11.
Statistical results of the evacuation time.
Table 12.
Percentage difference in average evacuation time across scenario groups.
Here, denotes the percentage difference in the average evacuation times for the n-th scenario group. and represent the average evacuation time in the i-th scenario and the -th scenario, respectively.
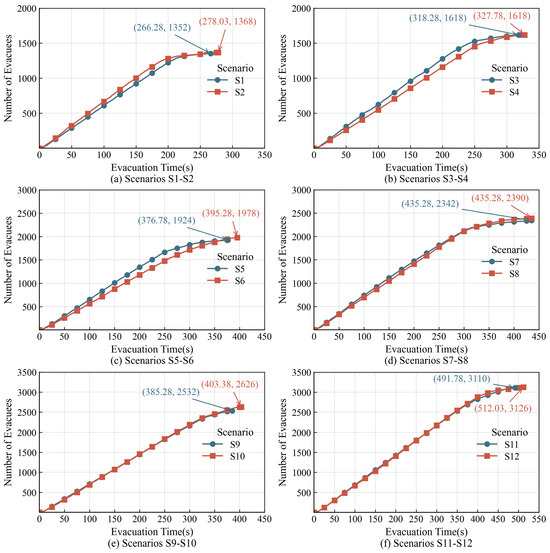
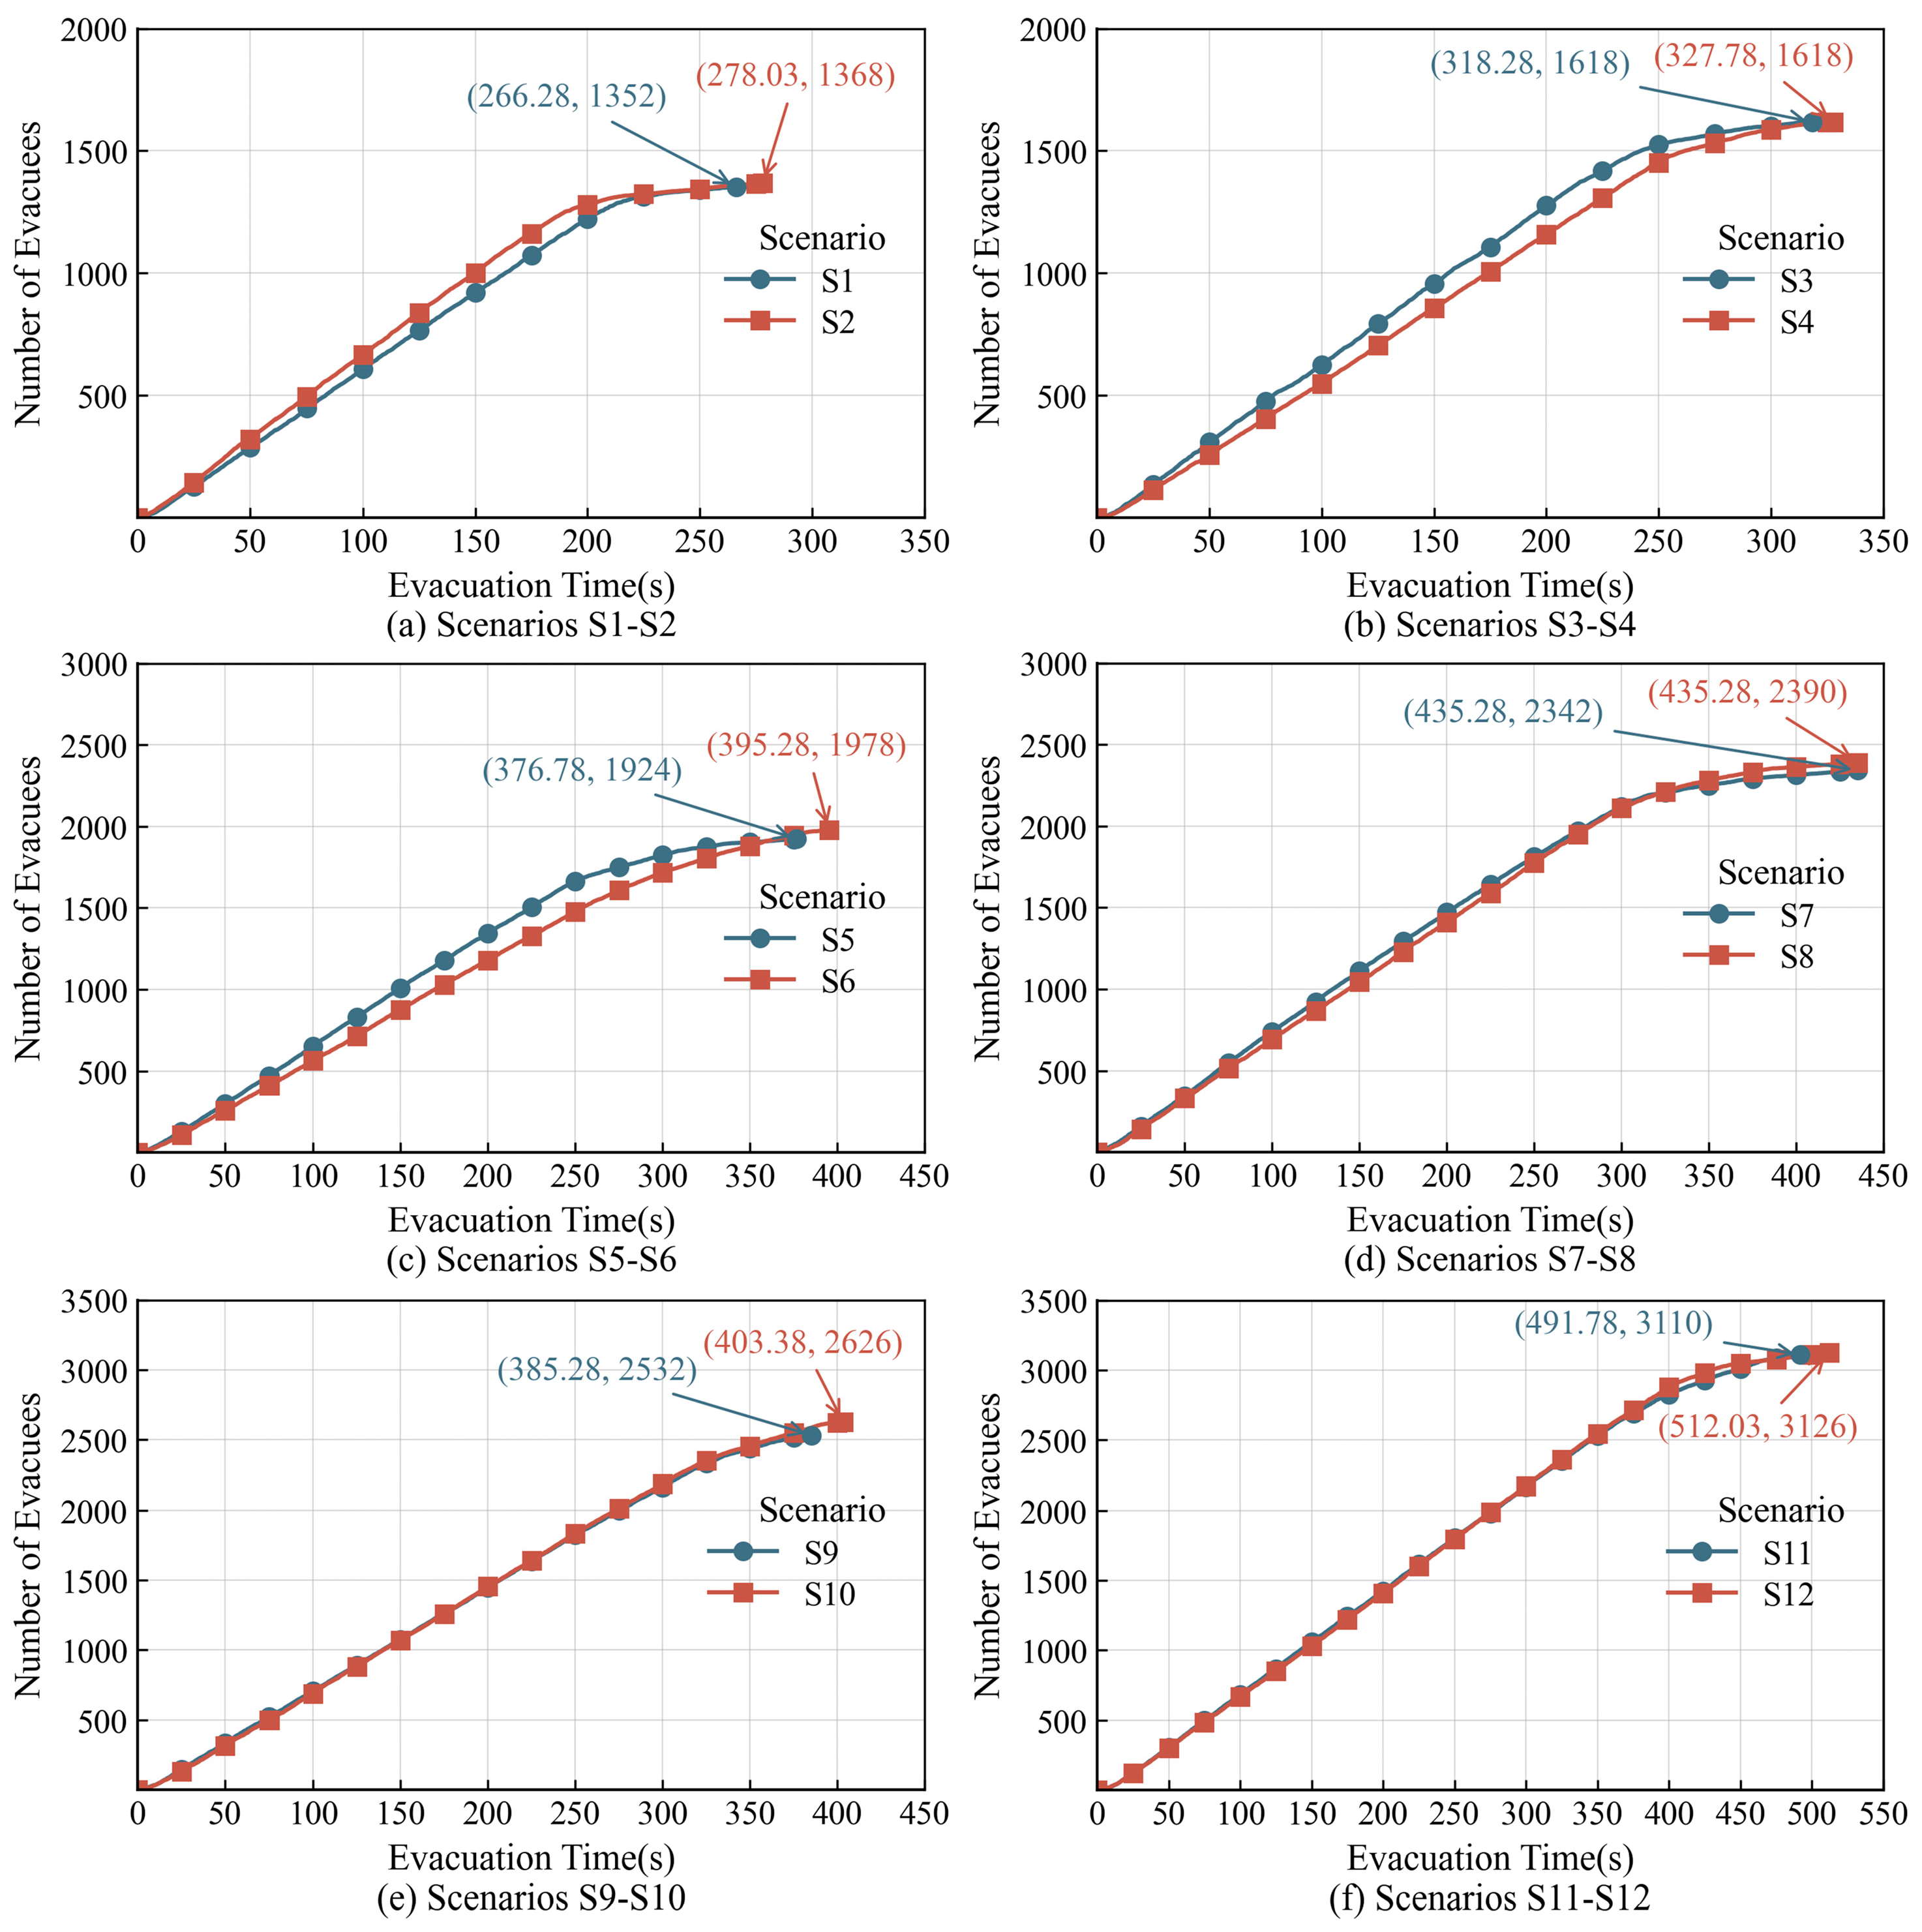
For each scenario, the random simulation whose evacuation time was closest to the average was selected as the representative simulation. In Figure 8, the variation in the number of evacuated pedestrians over time during the representative evacuation simulations for scenarios S1 to S12 is illustrated.
Figure 8.
Variation in the number of evacuees in simulations of scenarios S1–S12.
4.2. Analysis of Evacuation Results
As shown in Table 11 and Figure 8a–f, for the same number of lanes and distance between pedestrian crossings, the average evacuation time was longer when vehicle spacing followed a log-normal distribution compared to uniform vehicle spacing. Moreover, it can be seen from Table 12 that the differences in average evacuation times between the two vehicle spacing distributions within each scenario group were relatively small, ranging from 2% to 5%. This may be attributed to the more stable traffic flow under uniform vehicle spacing, allowing evacuees to move in a manner closer to an ideal continuous flow. In contrast, the log-normal distribution generates uneven vehicle spacing, resulting in areas with larger or smaller gaps. Consequently, evacuees are more likely to detour or temporarily pause during movement, inducing localized congestion and flow instability, thereby increasing the overall evacuation time.
Table 11 indicates that in the two-lane scenario, the pedestrian crossing capacity remains nearly identical at crossing distances of 250 m and 300 m, at approximately five persons per second.
From Table 11, in the two-lane scenario, pedestrian crossing capacities at crossing distances of 250 m and 300 m were similar, at approximately five persons per second. This indicates that, under conditions of relatively low vehicle and pedestrian volumes, evacuation efficiency is not significantly affected by changes in crossing spacing. However, in the three-lane and four-lane scenarios, crossing capacity varies with crossing spacing. Under medium traffic density (i.e., S5–S8), a pedestrian crossing spacing of 300 m alleviates localized congestion and results in higher capacity. In contrast, under high-density traffic conditions (i.e., S9–S12), a spacing of 250 m facilitates faster pedestrian evacuation, reduces congestion near the crossings, and improves evacuation efficiency.
5. Conclusions
Previous studies of highway tunnel evacuation simulations often assumed fixed vehicle spacing and vehicle type ratios across lanes, which limits the realism and accuracy of the evacuation models. In this study, real-world static vehicle spacing and vehicle type data were extracted from high-resolution satellite imagery under congested and stationary conditions. A log-normal spacing model was then developed, and a random vehicle arrangement algorithm was implemented in a self-developed system. Based on this framework, evacuation models for two-, three-, and four-lane tunnels were built in Pathfinder to assess the impact of realistic vehicle spacing on tunnel evacuation. The main conclusions are as follows:
- (1)
- Vehicle spacing under congested and stationary conditions follows a log-normal distribution, with an average vehicle spacing of 2.23 m, a logarithmic mean () of 0.707, and a logarithmic standard deviation () of 0.439.
- (2)
- A statistical analysis of the real vehicle type ratio across lanes showed that small vehicles, such as passenger cars, accounted for a higher proportion in the overtaking lane, while large vehicles, such as tourist coaches, container trucks, and general trucks, were more concentrated in the slow lane. This distribution aligns with real-world traffic flow characteristics.
- (3)
- With the number of lanes and the distance between pedestrian crossings remaining the same, evacuation time is longer when vehicle spacing follows a log-normal distribution compared to uniform spacing. The average difference in evacuation time ranges from 2% to 5%.
Based on the above findings, it is recommended that tunnel evacuation simulations account for the log-normal distribution characteristics of vehicle spacing and the actual vehicle type ratio across lanes. In future work, the authors will further investigate the effects of vehicle occupancy and pedestrian composition on evacuation efficiency in highway tunnels.
Author Contributions
Conceptualization, D.L.; methodology, Y.C.; software, D.L.; validation, J.W., J.L. and L.W.; formal analysis, Y.C.; investigation, Y.C., J.W., J.L. and L.W.; resources, D.L., R.B., W.L. and Y.H.; data curation, D.L., Y.C., J.W., J.L. and L.W.; writing—original draft, Y.C.; writing—review and editing, D.L. and R.B.; visualization, Y.C.; supervision, W.L.; project administration, D.L. and W.L.; funding acquisition, D.L., R.B. and Y.H. All authors have read and agreed to the published version of the manuscript.
Funding
This research was funded by the National Natural Science Foundation of China (Nos. 52204202 and 52504201) and the Hunan Provincial Natural Science Foundation of China (Nos. 2024JJ5046, 2025JJ60366 and 2026JJ40069).
Institutional Review Board Statement
Not applicable.
Informed Consent Statement
Not applicable.
Data Availability Statement
Data are available upon request.
Conflicts of Interest
The authors declare no conflicts of interest.
References
- Li, Y.; Liu, D.; Jiang, H.; Chen, S.; Liu, W.; Zhu, S.; Wang, J.; Zhou, T. Evaluating Tunnel Users’ Literacy on Expressway Tunnel Fire Safety: Questionnaire Analysis and Policy Decisions. Fire 2023, 6, 458. [Google Scholar] [CrossRef] [Scilit]
- Tomar, M.S.; Khurana, S. Impact of passive fire protection on heat release rates in road tunnel fire: A review. Tunn. Undergr. Space Technol. 2019, 85, 149–159. [Google Scholar] [CrossRef] [Scilit]
- Pervez, A.; Lee, J.Y.; Huang, H.L. Exploring factors affecting the injury severity of freeway tunnel crashes: A random parameters approach with heterogeneity in means and variances. Accid. Anal. Prev. 2022, 178, 106835. [Google Scholar] [CrossRef] [Scilit] [PubMed]
- Porzycki, J.; Schmidt-Polonczyk, N.; Was, J. Pedestrian behavior during evacuation from road tunnel in smoke condition—Empirical results. PLoS ONE 2018, 13, e0201732. [Google Scholar] [CrossRef] [Scilit] [PubMed]
- Ren, R.; Zhou, H.; Hu, Z.; He, S.; Wang, X. Statistical analysis of fire accidents in Chinese highway tunnels 2000–2016. Tunn. Undergr. Space Technol. 2019, 83, 452–460. [Google Scholar] [CrossRef] [Scilit]
- Liu, J.; Yang, X.; Yang, Y.; Wang, W.; Chen, Z.; Ding, F.; Zhu, H. Research on fire risk quantification for extralong highway tunnels based on Wuli–Shili–Renli theory, dempster–shafer theory, and bayesian network. Reliab. Eng. Syst. Saf. 2025, 264, 111414. [Google Scholar] [CrossRef] [Scilit]
- Bergmeister, K.; Brunello, P.; Pachera, M.; Pesavento, F.; Schrefler, B.A. Simulation of fire and structural response in the Brenner Base Tunnel by means of a combined approach: A case study. Eng. Struct. 2020, 211, 110319. [Google Scholar] [CrossRef] [Scilit]
- Lee, J.Y.; Kirytopoulos, K.; Pervez, A.; Huang, H.L. Understanding drivers’ awareness, habits and intentions inside road tunnels for effective safety policies. Accid. Anal. Prev. 2022, 172, 106690. [Google Scholar] [CrossRef] [Scilit]
- Li, X.; Guo, M.; Wang, H.; Li, J.; Chuai, E. Study on personnel escape probability in road tunnel based on randomness of vehicle parking. J. Saf. Environ. 2023, 23, 1689–1698. (In Chinese) [Google Scholar] [CrossRef]
- Lu, C.; Liu, D.; Huang, Y.; Li, Y.; Chen, S.; Liu, W.; Wang, J. Enhancing Fire Safety Knowledge among Underwater Road Tunnel Users: A Survey in China. Fire 2024, 7, 333. [Google Scholar] [CrossRef] [Scilit]
- Li, Y.; Song, X.; Lin, F.; Fang, X. Enhanced flame detection in virtual tunnels using DEV-YOLOv8 and digital twin systems. Simul. Model. Pract. Theory 2025, 143, 103143. [Google Scholar] [CrossRef] [Scilit]
- Yan, G.; Wang, M.; Yan, T.; Qin, P. Evacuation speed of human beings in road tunnels at different altitudes. Tunn. Undergr. Space Technol. 2022, 128, 104651. [Google Scholar] [CrossRef] [Scilit]
- Zhang, X.; Chen, L.; Jiang, J.; Ji, Y.; Han, S.; Zhu, T.; Xu, W.; Tang, F. Risk analysis of people evacuation and its path optimization during tunnel fires using virtual reality experiments. Tunn. Undergr. Space Technol. 2023, 137, 105133. [Google Scholar] [CrossRef] [Scilit]
- Kallianiotis, A.; Papakonstantinou, D.; Tolias, I.C.; Benardos, A. Evaluation of fire smoke control in underground space. Undergr. Space 2022, 7, 295–310. [Google Scholar] [CrossRef] [Scilit]
- Schmidt-Polończyk, N.; Wąs, J.; Porzycki, J. What Is the Knowledge of Evacuation Procedures in Road Tunnels? Survey Results of Users in Poland. Buildings 2021, 11, 146. [Google Scholar] [CrossRef] [Scilit]
- Zhang, Y.; Huang, X. A review of tunnel fire evacuation strategies and state-of-the-art research in China. Fire Technol. 2024, 60, 859–892. [Google Scholar] [CrossRef] [Scilit]
- Sun, H.; Zhu, K.; Zhang, W.; Ke, Z.; Hu, H.; Wu, K.; Zhang, T. Emergency path planning based on improved ant colony algorithm. J. Build. Eng. 2025, 100, 111725. [Google Scholar] [CrossRef] [Scilit]
- Haddad, R.K.; Harun, Z. Development of a Novel Quantitative Risk Assessment Tool for UK Road Tunnels. Fire 2023, 6, 65. [Google Scholar] [CrossRef] [Scilit]
- Ntzeremes, P.; Kirytopoulos, K.; Leopoulos, V. Development of a risk-based method for predicting the severity of potential fire accidents in road tunnels based on real-time data. Environ. Res. 2020, 189, 109895. [Google Scholar] [CrossRef] [Scilit] [PubMed]
- Bjelland, H.; Njå, O.; Heskestad, A.W.; Braut, G.S. Emergency preparedness for tunnel fires—A systems-oriented approach. Saf. Sci. 2021, 143, 105408. [Google Scholar] [CrossRef] [Scilit]
- Sun, J.; Lu, Z.; Zhou, D. Optimization analysis of evacuation facility parameters in interval tunnels under subway train fire accidents. Phys. A 2024, 651, 130020. [Google Scholar] [CrossRef] [Scilit]
- Li, J.; Sun, S.; Wang, J.; Yang, Y.; Wu, J. Optimizing fire evacuation design for highway tunnels with varying lane numbers. Tunn. Undergr. Space Technol. 2026, 173, 107601. [Google Scholar] [CrossRef] [Scilit]
- Zhang, S.; Haotian, Z.; Huanhuan, Z. Research on the evacuation of people from a road tunnel fire based on a mathematical model. Heliyon 2024, 10, e23016. [Google Scholar] [CrossRef] [Scilit]
- Yamamoto, K.; Sawaguchi, Y.; Nishiki, S. Simulation of Tunnel Fire for Evacuation Safety Assessment. Safety 2018, 4, 12. [Google Scholar] [CrossRef] [Scilit]
- Liu, D.; Li, Y.; Xu, Z.; Liu, W.; Huang, Y. Impact of differences in vehicle type distribution across lanes on tunnel evacuation time. Tsinghua Univ. Sci. Technol. 2024, 64, 1007–1015. (In Chinese) [Google Scholar] [CrossRef]
- Fu, Z.; Xiong, X.; Luo, L.; Yang, Y.; Feng, Y.; Chen, H. Influence of rotation on pedestrian flow considering bipedal features: Modeling using a fine discrete floor field cellular automaton. Phys. A 2022, 605, 128027. [Google Scholar] [CrossRef] [Scilit]
- Khaksari, R.; Harun, Z.; Fielding, L.; Aldridge, J. Numerical Simulation of the Evacuation Process in a Tunnel during Contraflow Traffic Operations. Symmetry 2021, 13, 2392. [Google Scholar] [CrossRef] [Scilit]
- Yuan, D.-j.; Jin, H.; Chen, Z.-c.; Liu, S.-n. Evacuation experiment study in up and down escape staircase of underground road. Adv. Civ. Eng. 2021, 2021, 8834180. [Google Scholar] [CrossRef] [Scilit]
- Li, Z.; Qiu, S.; Wang, X.; Zhao, L. Modeling and Simulation of Crowd Pre-Evacuation Decision-Making in Complex Traffic Environments. Int. J. Environ. Res. Public Health 2022, 19, 16664. [Google Scholar] [CrossRef] [Scilit]
- Li, X.; Chen, R.; Zhu, Y.; Jim, C.Y. Emergency fire evacuation simulation of underground commercial street. Simul. Model. Pract. Theory 2024, 134, 102929. [Google Scholar] [CrossRef] [Scilit]
- Król, A.; Król, M. The factors determining the number of the endangered people in a case of fire in a road tunnel. Fire Saf. J. 2020, 111, 102942. [Google Scholar] [CrossRef] [Scilit]
- Xu, Z.; Wang, J.; Yu, Z.; Zhao, J. Study on Temperature Distribution and Smoke Spreading Behavior of Different Fire Source Locations in the Underwater W-Shaped Island-Crossing Tunnel. Front. Heat Mass Transf. 2024, 22, 1129–1151. [Google Scholar] [CrossRef] [Scilit]
- Wang, Y.; Ma, J.; Liu, Y.; Bai, Y.; Xu, L. Optimal exit choice during highway tunnel evacuations based on the fire locations. PLoS ONE 2021, 16, e0256523. [Google Scholar] [CrossRef] [Scilit]
- Zhou, Q.; Zhu, K.; Mao, H.; Yu, X.; He, Q.; Yang, Z.; Hua, W.; Ye, D.; Zhang, T.; Wu, K. Statistical Analysis of Vehicle Tunnel Fire Incidents in Zhejiang Province, China, from 2020 to 2024. Fire Technol. 2026, 62, 27. [Google Scholar] [CrossRef] [Scilit]
- Wang, J.; Li, J.; Lu, H.; Wang, S.; Ye, R.; Wu, J. Optimization on escape exit selection for personnel in highway tunnel fires. Tunn. Undergr. Space Technol. 2026, 167, 107081. [Google Scholar] [CrossRef] [Scilit]
- Chen, J.-J.; Fang, Z.; Yuan, J.-P. Numerical Simulation about Smoke Vent Arrangement Influence on Smoke Control in Double-decked Tunnel. Procedia Eng. 2013, 52, 48–55. [Google Scholar] [CrossRef] [Scilit]
- Seike, M.; Kawabata, N.; Hasegawa, M. Quantitative assessment method for road tunnel fire safety: Development of an evacuation simulation method using CFD-derived smoke behavior. Saf. Sci. 2017, 94, 116–127. [Google Scholar] [CrossRef] [Scilit]
- Peng, M.; Zhou, Y.; Ming, Y.; Song, C.; He, K.; Wu, Z.; Zhu, G. Study on the influence of air supply and smoke exhaust on full transverse exhaust of long highway tunnel. Fire Mater. 2024, 48, 299–310. [Google Scholar] [CrossRef] [Scilit]
- Zhang, X.; Luo, M.; Tao, L.; Zeng, Y.; Yuan, Y.; Zhang, Z. Analysis of the influence of exhaust vent leakage on the efficiency of tunnel smoke evacuation. Fire Saf. J. 2025, 154, 104399. [Google Scholar] [CrossRef] [Scilit]
- Wang, K.; Hu, J.; Chen, R.; Wang, J. A Study on the Evacuation of an Extra-Long Highway Tunnel Fire—A Case Study of Chengkai Tunnel. Sustainability 2023, 15, 4865. [Google Scholar] [CrossRef] [Scilit]
- Liu, C.; Mao, Z.-l.; Fu, Z.-m. Emergency evacuation model and algorithm in the building with several exits. Procedia Eng. 2016, 135, 12–18. [Google Scholar] [CrossRef] [Scilit]
- Halawa, T. Numerical simulation of the evacuation process and smoke propagation due to a fire in a road tunnel with transverse ventilation system. J. Therm. Sci. Eng. Appl. 2021, 13, 031015. [Google Scholar] [CrossRef] [Scilit]
- Alonso, V.; Abreu, O.; Cuesta, A.; Alvear, D. An Evacuation model for risk analysis in Spanish Road Tunnels. Procedia Soc. Behav. Sci. 2014, 162, 208–217. [Google Scholar] [CrossRef] [Scilit]
- Vidmar, P. Risk evaluation in road tunnels based on CFD results. Therm. Sci. 2022, 26, 1435–1450. [Google Scholar] [CrossRef] [Scilit]
- Na, W.; Chen, C. A study on the evacuation spacing of undersea tunnels in different ventilation velocity conditions. Fire 2022, 5, 48. [Google Scholar] [CrossRef] [Scilit]
- Xu, Y.; Liao, S.; Liu, M. Simulation and assessment of fire evacuation modes for long underwater vehicle tunnels. Fire Technol. 2019, 55, 729–754. [Google Scholar] [CrossRef] [Scilit]
- Caliendo, C.; Russo, I. CFD simulation to assess the effects of asphalt pavement combustion on user safety in the event of a fire in road tunnels. Fire 2024, 7, 195. [Google Scholar] [CrossRef] [Scilit]
- Zhang, Y.; Ye, J. Simulation Study on Tunnel Temperature Field Evolution Considering Vehicle-to-Vehicle Fire Spread in Real Traffic Scenarios. Fire Technol. 2025, 61, 4557–4579. [Google Scholar] [CrossRef] [Scilit]

Disclaimer/Publisher’s Note: The statements, opinions and data contained in all publications are solely those of the individual author(s) and contributor(s) and not of MDPI and/or the editor(s). MDPI and/or the editor(s) disclaim responsibility for any injury to people or property resulting from any ideas, methods, instructions or products referred to in the content. |
© 2026 by the authors. Licensee MDPI, Basel, Switzerland. This article is an open access article distributed under the terms and conditions of the Creative Commons Attribution (CC BY) license.