


Abstract
Predictive quality systems are central to Industry 4.0 manufacturing, yet detecting rare defects that pass established quality gates remains an open problem. This study addresses post-quality-gate failure detection in automotive brake manufacturing, where 310 faulty units (1.20%) among 25,756 production records create a naturally occurring extreme class imbalance of 1:82. Fault labels are derived from warranty reports and linked to multi-station production line measurements, while negative samples may include latent failures, motivating a recall-focused evaluation. We propose a Quality 4.0 machine learning framework that compares five resampling methods (ADASYN, SMOTE-Tomek, KMeans-SMOTE, CTGAN, and TVAE) plus a no-resampling baseline across 24 classifiers and stacking ensembles. In total, 504 configurations are tested on a held-out test set. The proposed SVM-RBF model trained on ADASYN-augmented data achieves recall of 0.871, specificity of 0.982, balanced accuracy of 0.926, and ROC-AUC of 0.952, producing only 93 false positives (FPR = 1.8%). Stacking ensembles provide alternative operating points maximizing the detection rate (93.5%) and a separate operating point with the highest discrimination capacity (ROC-AUC = 0.975). Feature importance analysis through Permutation Importance and SHAP identifies Force Increment as the leading feature under both attribution methods. Friedman and Wilcoxon tests confirm statistically significant differences among strategies. The framework offers a practical way to add predictive capability to existing quality control systems.
1. Introduction
1.1. Background
Industry 4.0 has transformed the manufacturing sector through smart monitoring and real-time data processing, achieved via Cyber–Physical Systems (CPS) and the Internet of Things (IoT), thereby enabling connectivity across all links in the value chain [1]. Total Quality Management has reached Quality 4.0 in the final stage of the digital transformation journey [2], and quality digitalization has been defined as a four-dimensional framework encompassing predictive quality, mass customization, and smart quality management [3]. Early defect detection and zero-defect production have been made possible through AI and big data, and recent studies have confirmed their applicability in automotive manufacturing [4].
In the production processes of safety-critical products, the products undergo final inspection and statistical process tests as required by Six Sigma. Yet, a small fraction of defective units still reaches customers, posing the most challenging case for predictive quality and motivating deployable systems that work alongside existing quality infrastructure.
1.2. Problem Statement—Post-Quality-Gate Rare Failures
Modern automotive production lines employ multiple quality control mechanisms designed to eliminate defects before shipment. Units reaching the customer are not random defects; they are highly filtered residual failures that have passed all quality controls, which makes them inherently difficult to detect. We define these cases as post-quality-gate failures, defects that remain invisible to existing inspection systems but later appear as field failures. Most existing studies sidestep this difficulty by relying on benchmark datasets or moderately imbalanced scenarios (1:5 to 1:20), where defects were caught during production rather than escaped it. This study examines a real-world automotive brake assembly line where 310 out of 25,756 vehicles (1.20%) were confirmed to be defective through post-delivery warranty service reports, resulting in a natural imbalance of 1:82. Another characteristic of the collected data was the asymmetry in label reliability. While faults confirmed under warranty have high reliability, negative examples are vehicles for which no complaints have been reported, and an unknown portion of them may contain hidden or unreported defects. This label asymmetry limits the reliability of precision-focused evaluation and motivates an assessment framework that prioritizes recall and specificity. The integration of data collected from multi-station production areas with warranty records to establish end-to-end defect traceability has rarely been addressed in the literature.
1.3. Research Gap
Existing studies have used resampling strategies [5,6], generative models [7,8], and ensemble methods [9] to address the imbalanced classification problem. But most studies rely on comparison datasets or moderate imbalances (1:5 to 1:20), which results in insufficient investigation of extreme natural ratios (≥1:50). In particular, in studies within the manufacturing sector, systematic comparisons of CTGAN and TVAE with established methods (ADASYN, SMOTE-Tomek, KMeans-SMOTE) within a uniform framework remain limited [4,10,11,12]. The integration of multi-station production data with warranty records in subsequent stages has rarely been addressed, and only a few studies have presented their findings as a practical Quality 4.0 framework.
Considering these gaps, this study has three research objectives:
O1. To develop a failure detection framework for post-quality gates that integrates multi-station production line measurements with warranty-confirmed labels in order to identify faulty units that have passed traditional quality control stages.
O2. To comparatively evaluate deep generative resampling methods (CTGAN, TVAE) against traditional methods (ADASYN, SMOTE-Tomek, KMeans-SMOTE) under conditions of extreme natural class imbalance (1:82) within a consolidated experimental framework that integrates both individual classifiers and ensemble stacking.
O3. To present practical operating points accompanied by statistically validated recommendations, enabling quality engineers to select appropriate configurations while balancing the facility’s specific fault detection capabilities with the burden of false alarms.
1.4. Contributions
The main contributions of this study can be summarized as follows:
(1) A Quality Warning System for detecting rare post-quality-gate failures in safety-critical manufacturing is presented. The framework integrates measurements from four production line inspection stations with post-delivery warranty records, applying the predictive quality management dimension of Quality 4.0 [3] alongside conventional quality gates.
(2) An evaluation protocol is introduced that accounts for label asymmetry between warranty-confirmed positives and unverified negatives, prioritizing recall and specificity over precision-centric metrics.
(3) A systematic comparison of CTGAN and TVAE against traditional resampling under extreme imbalance (1:82) across 504 trained configurations (24 baseline, 24 undersampling, 120 oversampling, and 336 stacking ensembles).
(4) Four deployment operating points are identified, each optimized for a different operational objective, allowing quality engineers to select the configuration most suited to their facility’s constraints.
(5) The findings are validated using Friedman and Wilcoxon tests, with feature importance assessed via Permutation Importance and SHAP.
The remainder of this paper is organized as follows. Section 2 reviews related work. Section 3 describes the production line, data, and methodology. Section 4 presents the results, and Section 5 discusses Quality 4.0-related implications and limitations. Section 6 is the conclusion part of the article. A preliminary version of this work was presented at the INFUS 2021 conference [13].
2. Related Work
2.1. Class Imbalance in Manufacturing Quality Control
Rather than sampling errors, the problem of class imbalance, which originates from the nature of production systems, is a common feature of modern industrial datasets. As production lines have improved, the rate of defective products has decreased significantly. This situation requires machine learning models to learn from datasets in which failures are rare but of critical operational importance [3,14]. This issue has been reported in automotive welding, semiconductor manufacturing, steel production, and pump fault detection [10,14,15,16]. A common issue is the likelihood that standard classifiers will misclassify rare but critical errors as statistical noise; this typically occurs because they prioritize the majority class while attempting to optimize the overall accuracy [17]. In safety-critical environments, this bias can lead to the omission of failures that could result in serious consequences [10]. While most studies examine imbalance ratios in the range of 1:10 to 1:30, extreme imbalance scenarios exceeding 1:50 remain relatively unexamined [18]. Among publicly available manufacturing datasets, extreme imbalance ratios exceeding 1:50 are rare. The Scania APS failure dataset exhibits a 1:59 ratio, where recent work has explored cost-sensitive transformers with focal loss [19] and novel linear classifiers [20], while a new SCANIA Component X prognostics dataset has recently been released [21]. The Bosch Production Line dataset presents an even more extreme 1:172 ratio [22], and semiconductor fault detection studies have applied SMOTE/ADASYN with interpretability methods under moderate imbalance [23]. The present study operates at a 1:82 ratio with proprietary multi-station brake data, filling the gap between these public benchmarks and real-world multi-source manufacturing environments where post-delivery warranty labels introduce additional label uncertainty.
2.2. Multi-Station Data Integration and Label Sourcing in Manufacturing
Comparatively less attention has been given to integrating distributed manufacturing data across multiple inspection stations. Modern production lines employ several stations capturing force, vibration, acoustic emission, and temperature signals; integrating these heterogeneous streams improves diagnostic performance over single-source analysis [24,25,26,27]. Most studies still rely on single-station data and lack standardized cross-station integration protocols [28], with sampling-rate differences and calibration drift remaining open challenges [29]. An additional issue is the source of ground-truth labels. Most studies use in-line inspection outcomes or expert annotation [25,28], which only confirm defects detectable by existing systems. Post-delivery warranty data, in contrast, provide field-confirmed indicators of real-world failures [30]. Despite this, integrating delayed warranty records with upstream multi-station data for end-to-end traceability remains rare [18].
2.3. Traditional Resampling Methods (SMOTE Family)
The most established response to class imbalance operates at the data level through synthetic minority oversampling. SMOTE [31,32] generates artificial minority samples based on nearest-neighbor interpolation, while its variants such as Borderline-SMOTE and ADASYN focus on samples near decision boundaries or difficult regions [32,33]. Hybrid approaches further combine oversampling with cleaning, including SMOTE-Tomek and KMeans-SMOTE [34,35].
Despite extensive adoption, these methods face limitations under extreme imbalance and high dimensionality [17,36], with evidence of degraded performance at high ratios that motivates deep generative alternatives [33,37]. The success of these methods in detecting rare defects at a 1:82 ratio must be experimentally verified.
2.4. Deep Generative Models for Tabular Data (CTGAN, TVAE)
Owing to the limitations of distance-based interpolation, researchers have explored deep generative models that learn the entire distribution of data rather than relying on the local geometry. Generative Adversarial Networks (GANs) and Variational Autoencoders (VAEs) constitute the two main architectural families for tabular expansions [11,38,39]. Beyond the capabilities of the SMOTE family methods, these models can capture nonlinear dependencies and complex feature interactions [40,41].
The development of specialized architectures, such as CTGAN, is necessary because standard GANs suffer from issues such as training instability and poor handling of discrete features. Although CTGAN can generate realistic samples, its classification performance generally lags behind that of traditional or cost-sensitive methods, and the results depend heavily on the characteristics and structure of the dataset [5,11,40,41]. These observations suggest that deep generative models require careful tuning and may not consistently outperform simpler approaches in cases of extreme imbalances.
2.5. Cost-Sensitive Learning
Cost-sensitive learning, as an alternative to data-level resampling, addresses class imbalance at the algorithmic level by penalizing the misclassifications of minority classes more severely than that of majority classes. This approach preserves the original data and prevents information loss owing to undersampling and noise caused by oversampling [42,43]. In implementations, this is achieved through class weighting (e.g., ‘class_weight’, ‘scale_pos_weight’) or algorithm-level modifications, such as RUSBoost and balanced ensemble methods [4,44]. Nevertheless, it is rarely possible to determine the optimal cost settings in advance, and empirical tuning is required [42]. However, excessive weighting can increase false positives and reduce the overall performance [43,45]. Therefore, cost-sensitive learning is more effective when used in conjunction with, rather than replacing, the sampling method; this motivated the joint evaluation in this study.
2.6. Ensemble Stacking and Hybrid Approaches
In imbalanced classification, ensemble methods are widely used because they combine the strengths of diverse base models [12,46]. The Stacking method, in which meta-learners combine baseline predictions, performs best when the models are both accurate and diverse [47,48]. This property is often achieved through selection strategies that reduce the error correlation. In imbalanced environments, the Stacking method consistently outperformed individual models across multiple applications [8,12].
Recent studies have integrated resampling into stacking architectures to preserve baseline learner diversity and train each model independently on resampled data [49,50]. Hybrid approaches combine generative models with traditional resampling, thus further improving the recall rate [9]. These designs increase the model complexity and typically require careful tuning, often performed through Bayesian search or Optuna [47,50].
Table 1 presents a structured comparison of the representative studies. This table highlights that no previous study has simultaneously addressed extreme natural imbalance (≥1:50), multi-station data integration with warranty-based labels, systematic comparison of generative and conventional resampling, stacking ensemble construction, and statistical validation. This study considers these factors while taking label asymmetry into consideration.
Table 1.
Comparative Summary of Related Work on Imbalanced Classification in Manufacturing.
3. Materials and Methods
3.1. Production Line and Data Acquisition
3.1.1. Brake Assembly Line Description
The braking system examined in this study was from a mid-size sedan equipped with an ABS-assisted hydraulic braking system. Depending on the model, this system features front disc brakes and either rear disc or drum brakes, as well as a mechanically operated parking-brake system. All vehicles were manufactured at a single production facility in Bursa, Turkey, and operated by a Tier 1 automotive manufacturing company. The manufacturing facility has a quality management infrastructure comprising ISO 9001 [51] and IATF 16949 [52] quality management systems, supported by statistical process control, Six Sigma practices, and end-of-line functional testing, all of which are aimed at minimizing potential defect rates.
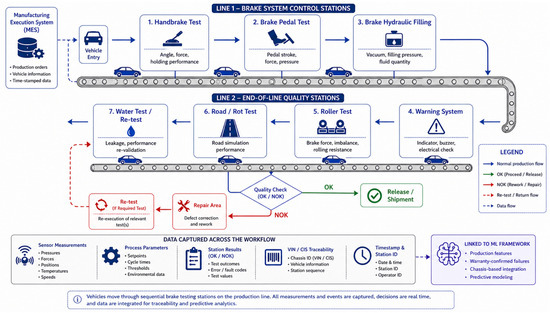
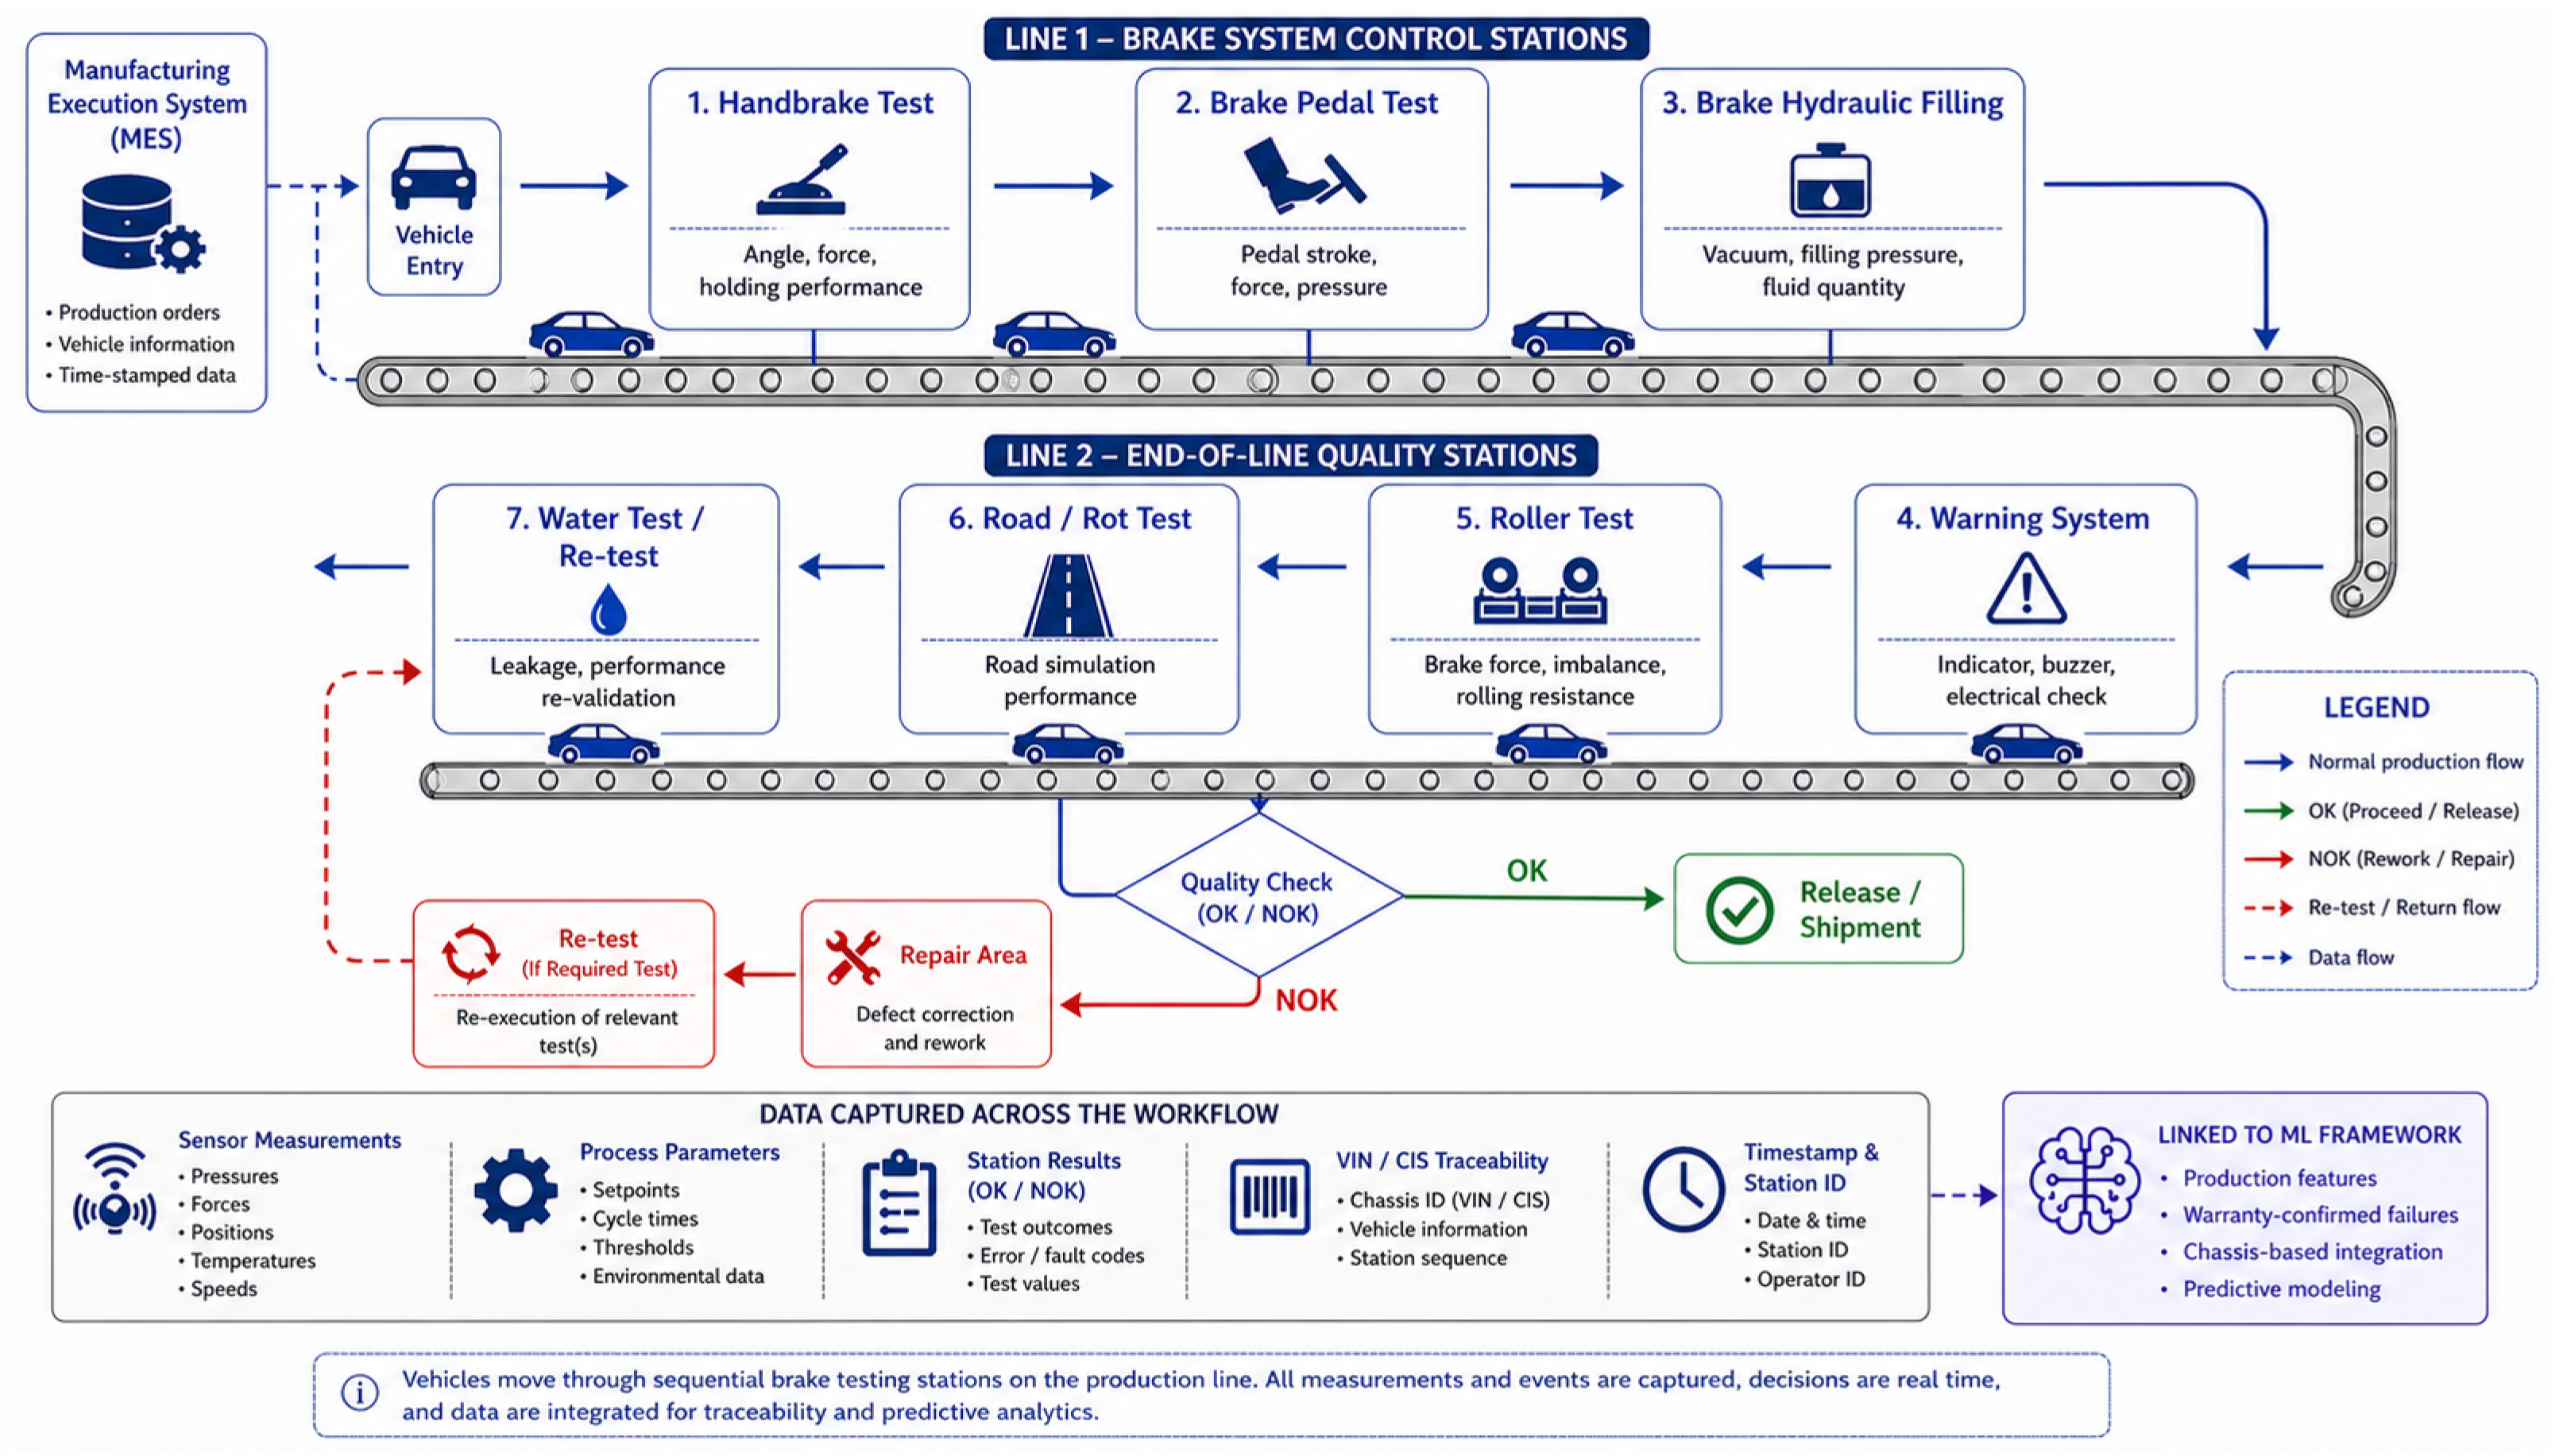
Four specialized quality control stations on the production line evaluate various aspects of the brake system’s performance. The Brake Hydraulic Filling Station evaluates hydraulic functionality (e.g., pressure, fluid level, and leakage), the Brake Pedal Test Station measures mechanical behavior (e.g., pedal travel and force), the Hand Brake Test Station checks static safety parameters (e.g., angle and force balance), and the Roller Test Station performs dynamic testing under simulated driving conditions, including rolling resistance and brake force response. When these stations are linked together, they perform a comprehensive brake system performance check that covers hydraulic, mechanical, and dynamic characteristics. The sequence and layout of these stations in the production area are shown in Figure 1.
Figure 1.
Schematic overview of the brake system end-of-line test stations.
Each unit must receive a “pass” determination from every station before being released into the market. This provided us with a complete dataset free of missing values. It also ensures that all units are verified as conforming to the existing quality infrastructure. Consequently, any failure observed in the field represents a true post-quality-gate event.
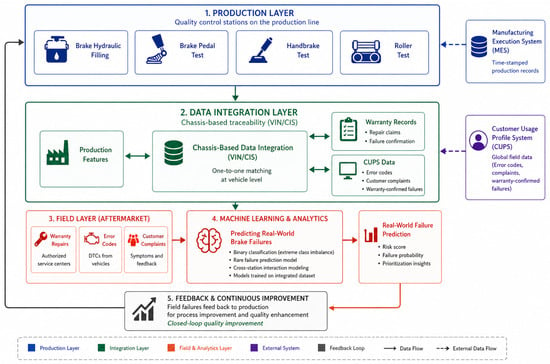
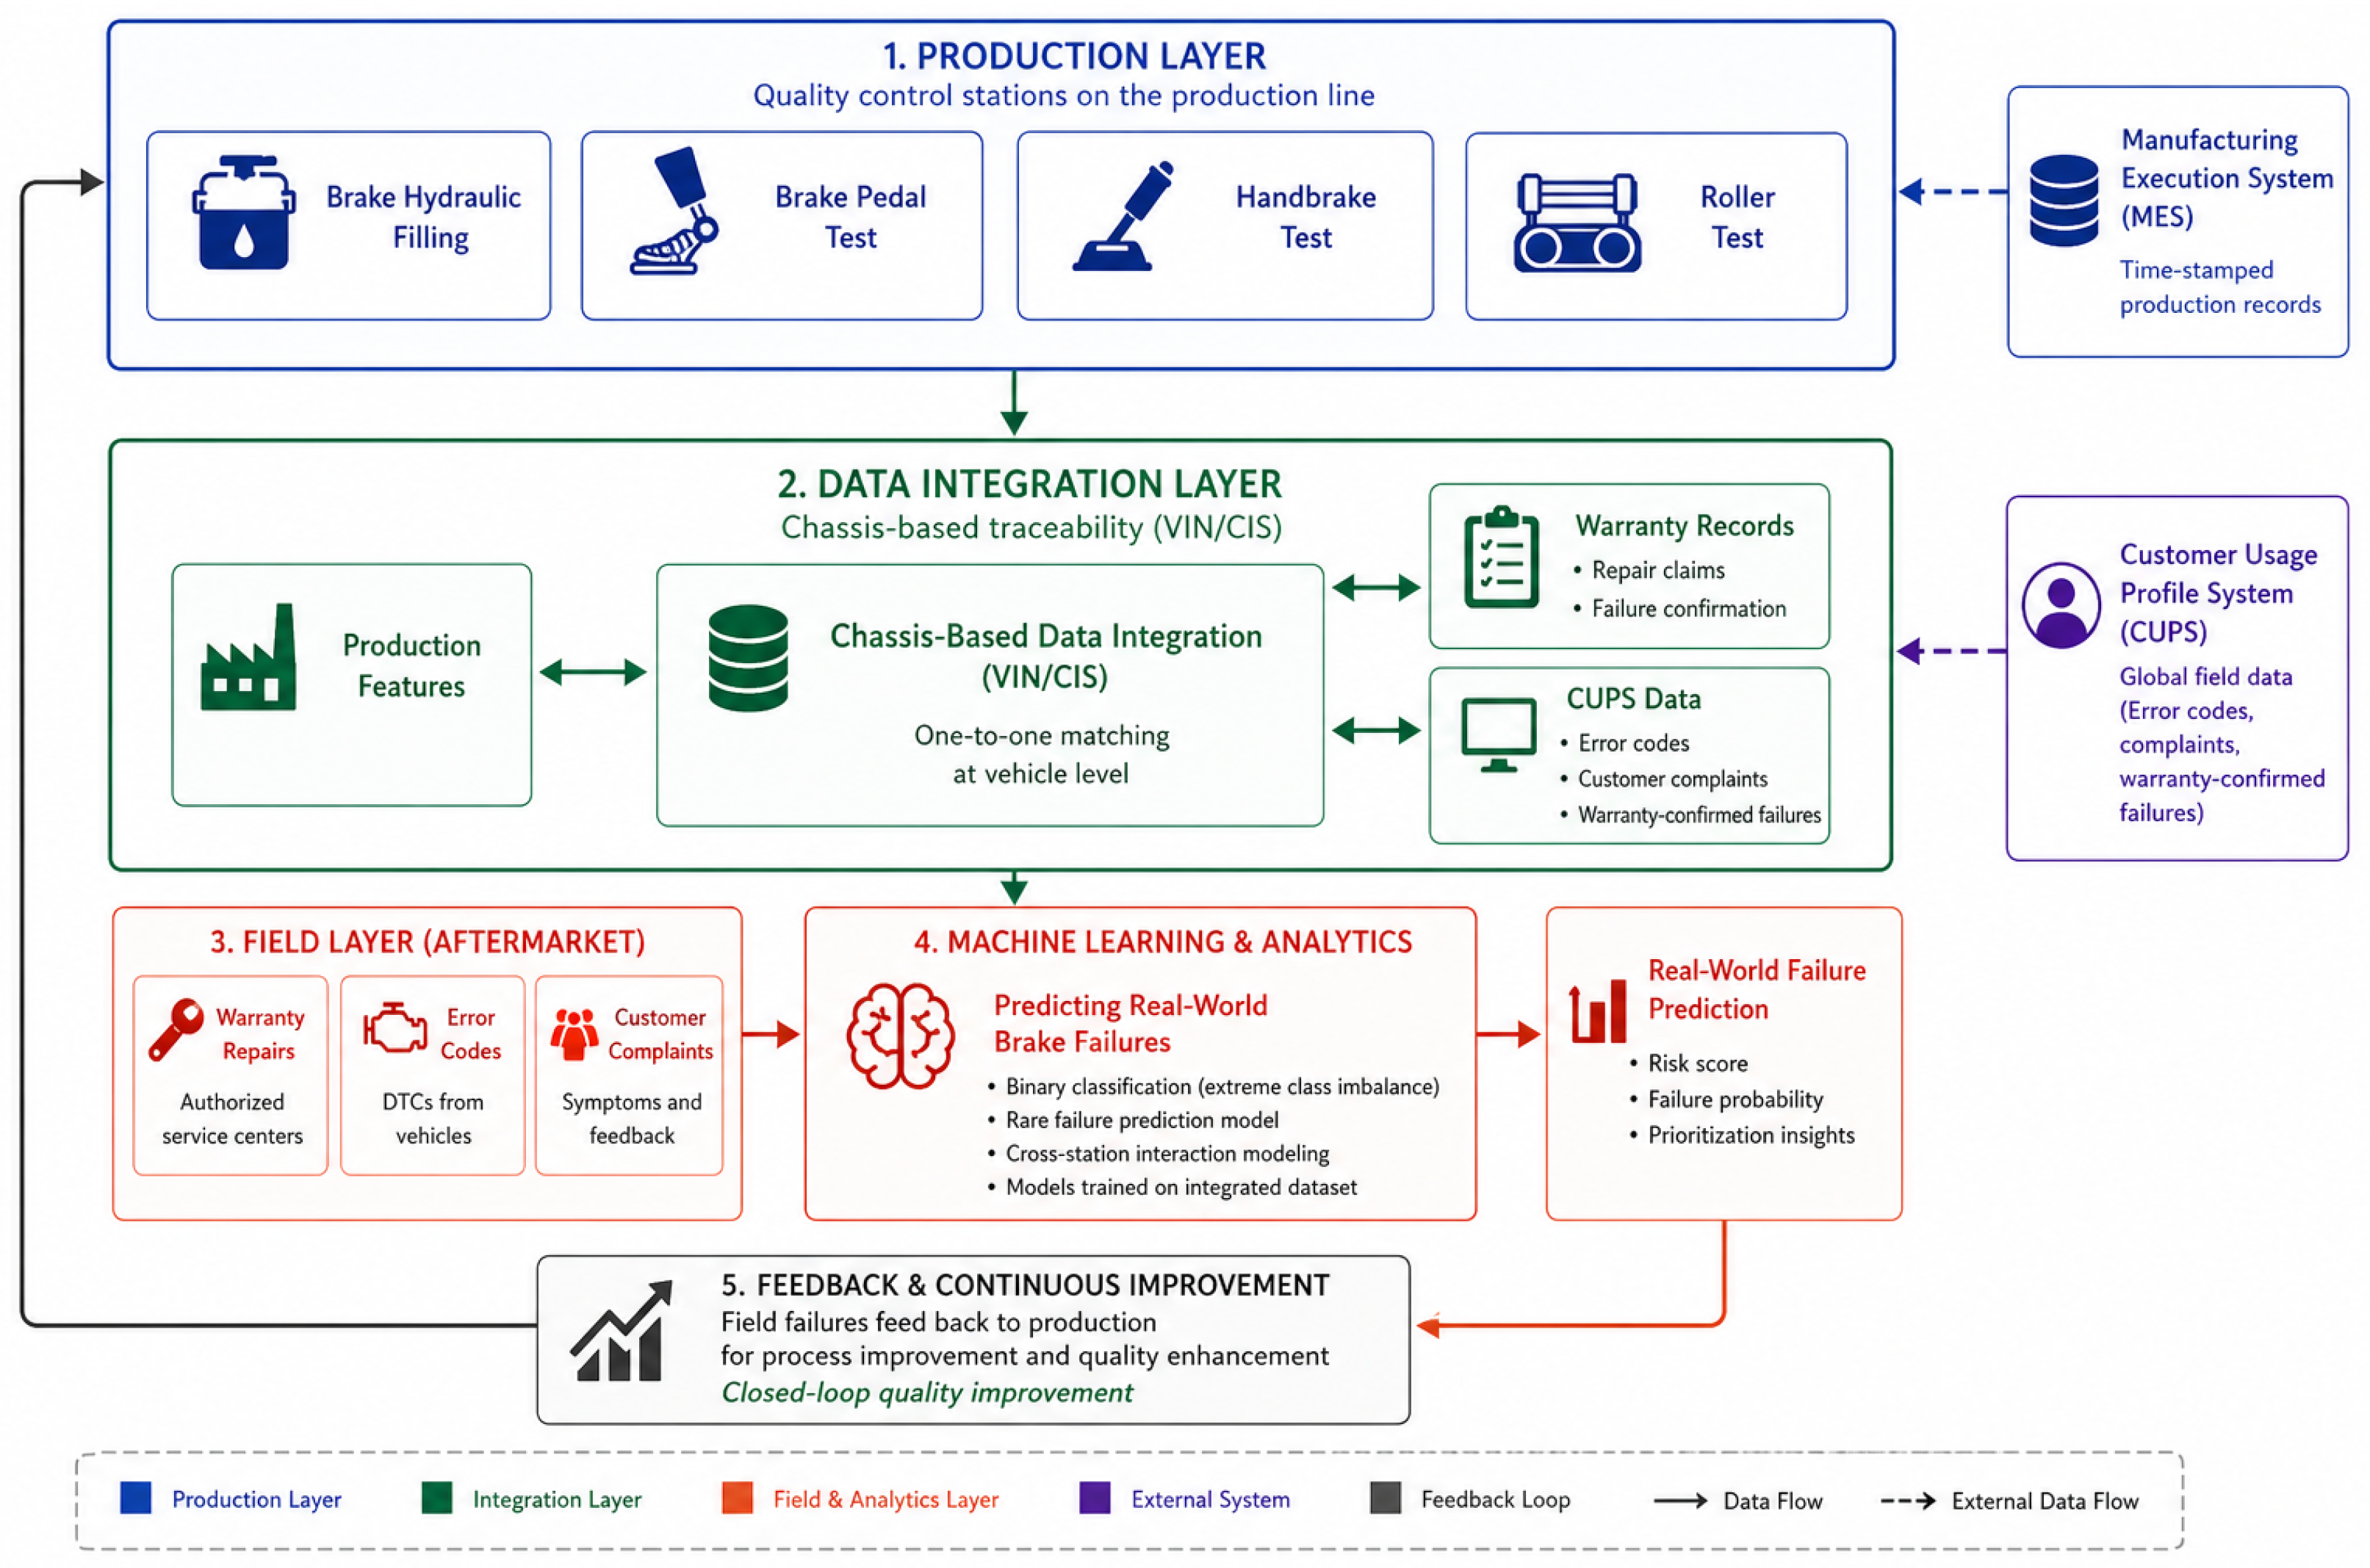
Production data from multiple quality control stations are integrated with warranty and customer complaint data through chassis-based traceability (VIN/CIS), enabling prediction of rare real-world failures under extreme class imbalance conditions. The resulting end-to-end data architecture is shown in Figure 2.
Figure 2.
End-to-end data architecture for post-quality gate failure prediction. Production data from four quality control stations (of which three contribute features to the final dataset) is merged with warranty complaint labels. Brake Hydraulic Filling Station measurements were excluded due to the lack of operational variability.
3.1.2. Data Collection Process
Production data were collected from all four quality control stations over a two-month period, yielding 25,756 completed production records. Data acquisition is performed through Programmable Logic Controller (PLC) and Supervisory Control and Data Acquisition (SCADA) systems and stored in Manufacturing Execution System (MES) platforms on a chassis basis.
Each vehicle is uniquely identified through a chassis-based identifier within the Chassis Integration System (CIS), linked to the Vehicle Identification Number (VIN). This ID enables the total traceability of measurements throughout the vehicle’s lifecycle by facilitating the integration of production stations, MES platforms, and post-sales databases.
The dependent variable in this study was derived from post-delivery warranty service records. Vehicles that reported brake system error codes and were repaired at authorized service centers under warranty were selected as faulty cases. Warranty coverage is defined as defects occurring within the first year of service or before 10,000 km. Warranty and complaint data obtained from service centers in 20 countries and sourced from warranty tracking databases and the Customer Usage Profile System (CUPS) were matched with production records using a common VIN/CIS-based chassis identifier. This enabled record-level integration between the production process conditions and field failures. All vehicles were manufactured on the same production line in Bursa, and failure data were collected from numerous international markets. This supports the external validity of the predictive model.
After excluding complaints unrelated to manufacturing from the warranty claims corresponding to the selected sample period, 310 remained. When these confirmed defects were combined with the 25,446 units for which no complaints were reported, a final dataset of 25,756 records was formed, with a natural class imbalance ratio of 1:82.
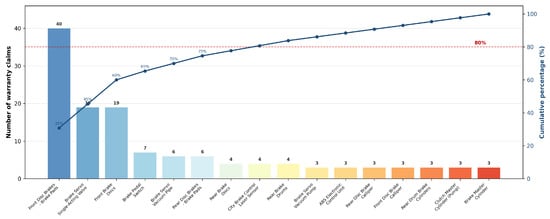
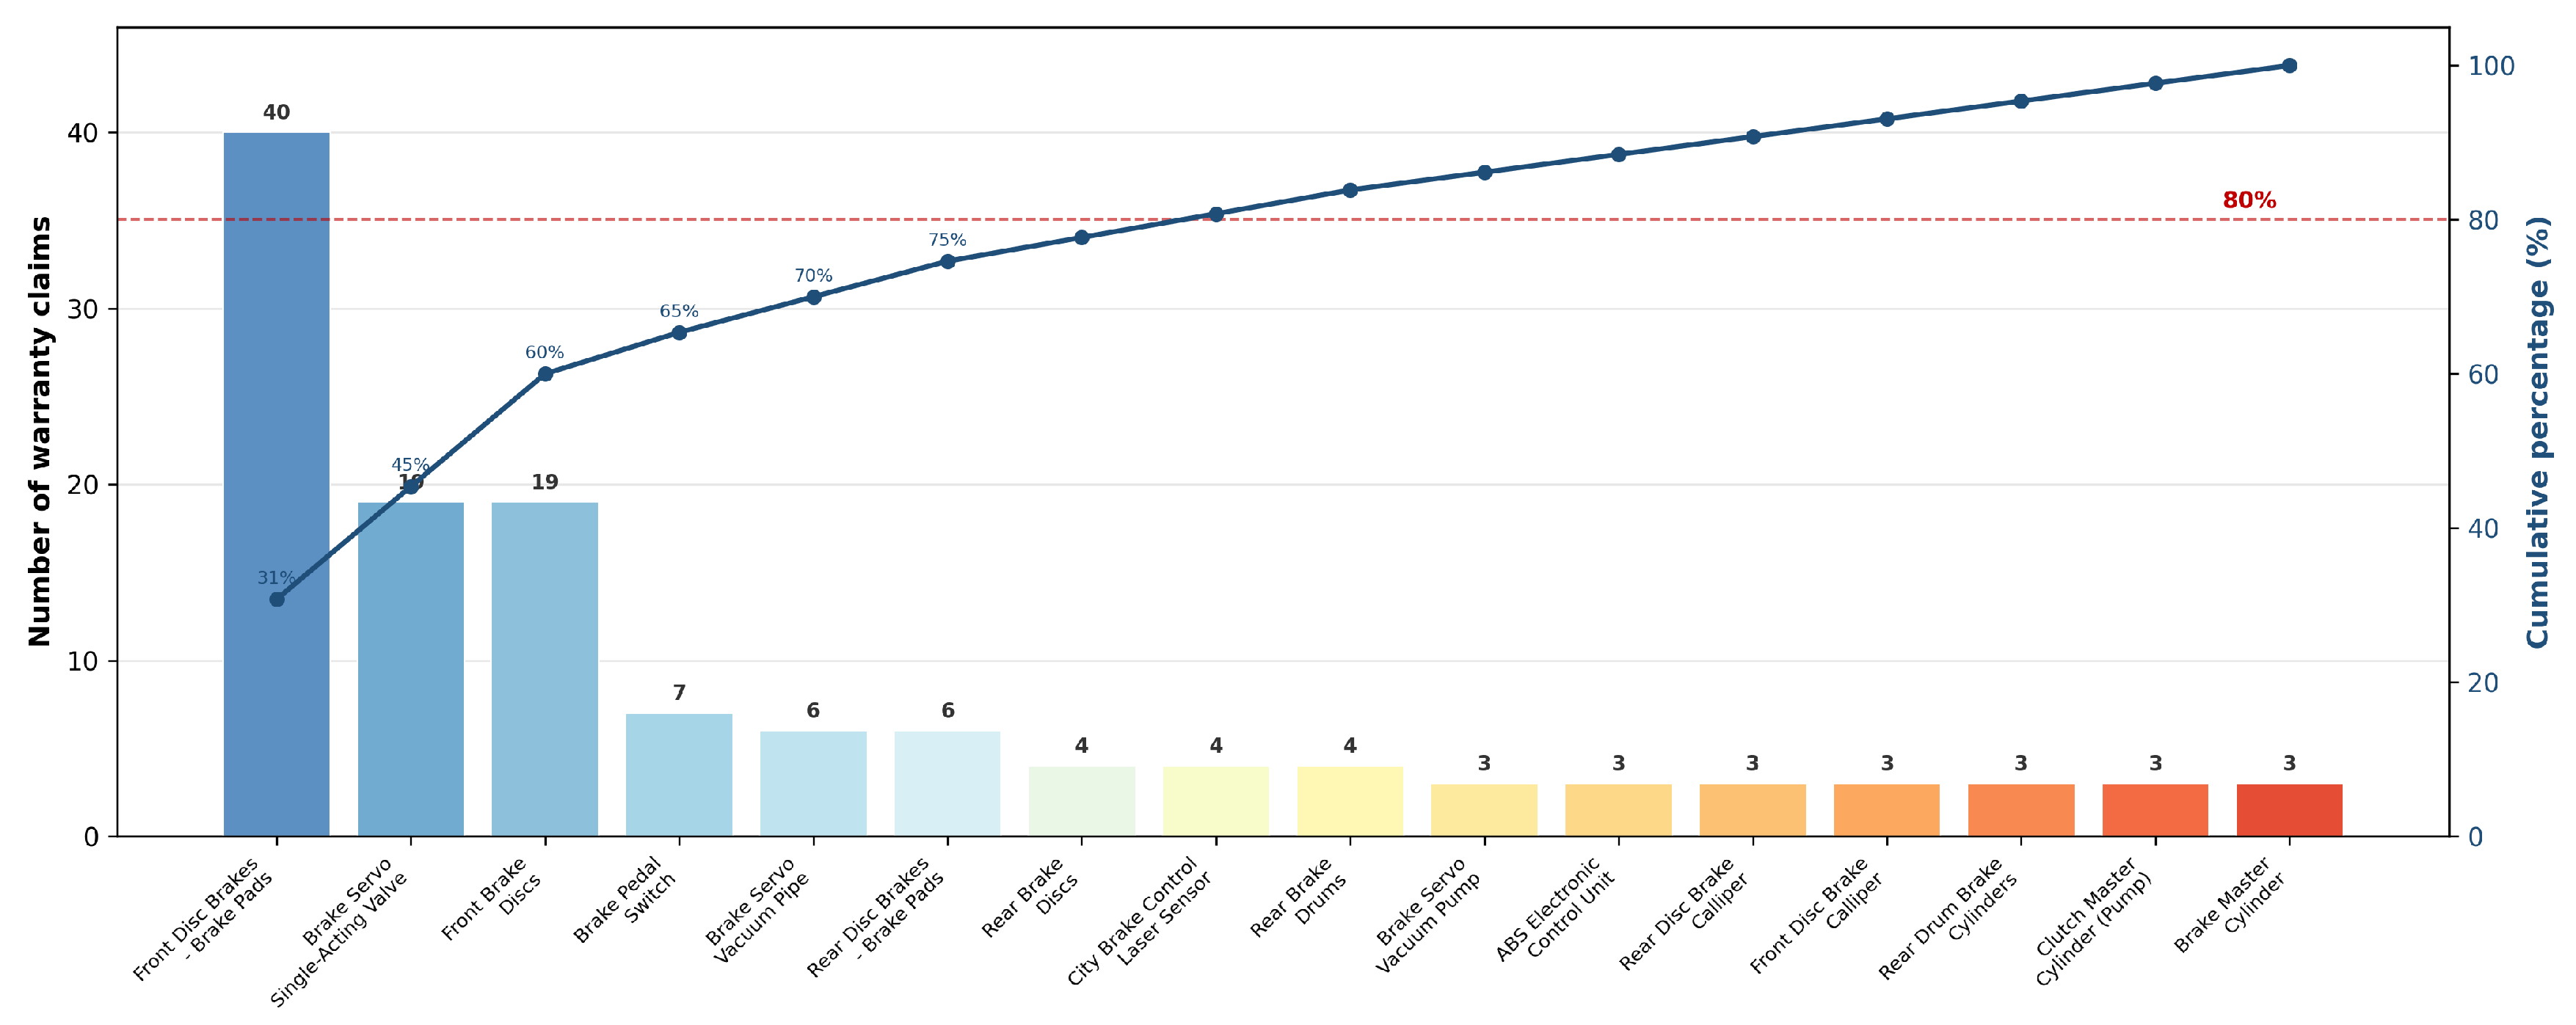
A Pareto analysis conducted at the component level on the defects cited as the basis for warranty claims (Figure 3) shows that most failures stem from a small number of components and that the most common categories account for approximately 75% of the identified defects. The main symptoms of these issues include faulty operation, noise, vibration, and wear-related deterioration.
Figure 3.
Defective component Pareto analysis of brake related warranty claims ().
3.1.3. Post-Quality-Gate Rare Event Definition
This distinction defines post-quality-gate failure as a subtle defect that cannot be detected by Statistical Process Control (SPC), Six Sigma, or End-of-Line (EOL) testing. These defects remain hidden within existing Total Quality Management (TQM) frameworks and only become apparent as actual failures after the product reaches the customer. The resulting 1:82 defect rate reflects the actual residual defect rate of a mature production line operating under low-defect manufacturing conditions. Detecting such failures requires learning discriminative patterns from production parameters that, by design, remain within the acceptable limits of each existing quality gate. This is a far more difficult task than detecting errors that existing systems are designed to catch.
Not all warranty claims necessarily originate from manufacturing defects; some may result from customer usage patterns, road conditions, or maintenance practices. To address this, the warranty dataset was filtered through a two-stage expert validation process. First, authorized service center technicians diagnose the failure and submit the claim with technical documentation. Second, the manufacturer’s quality control and after-sales service engineers review each claim, assessing whether the reported failure is consistent with a manufacturing-origin defect given the vehicle’s mileage and usage conditions. Claims attributed to external damage, accidents, or abnormal usage patterns are rejected at this stage. Only claims approved through this expert validation are classified as positive instances in the dataset.
3.2. Dataset Description
The final dataset consisted of 25,756 production records, each corresponding to a single vehicle that completed the entire brake system quality control sequence. Of these production records, 310 units (1.20%) were confirmed to be faulty through warranty service records, whereas 25,446 (98.80%) records had no reported brake-related issues. This naturally revealed a class imbalance ratio of 1:82.
Each record contained 65 features derived from measurements taken at four quality control stations (Table 2). Of the initial 74 parameters, nine operationally invariable features (e.g., program identifiers and configuration constants) were excluded during preprocessing because they did not provide distinctive information. This includes all measurements from the Brake Hydraulic Filling Station, which did not vary across the vehicle variants under investigation. All stored features represent raw sensor measurements selected according to internal quality testing standards without any additional feature engineering. Because every vehicle must complete all inspection stages before being released to the market, there are no missing values in the dataset.
Table 2.
Dataset description and feature groups. The dataset comprises 65 features organized into 17 groups across the test stations.
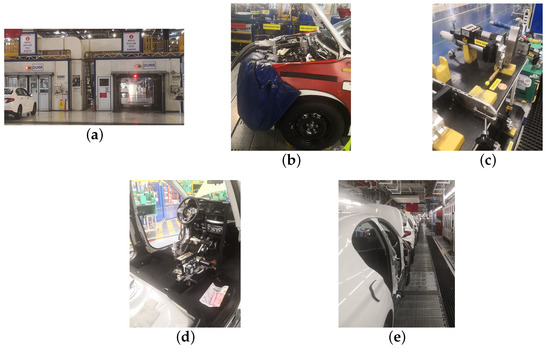
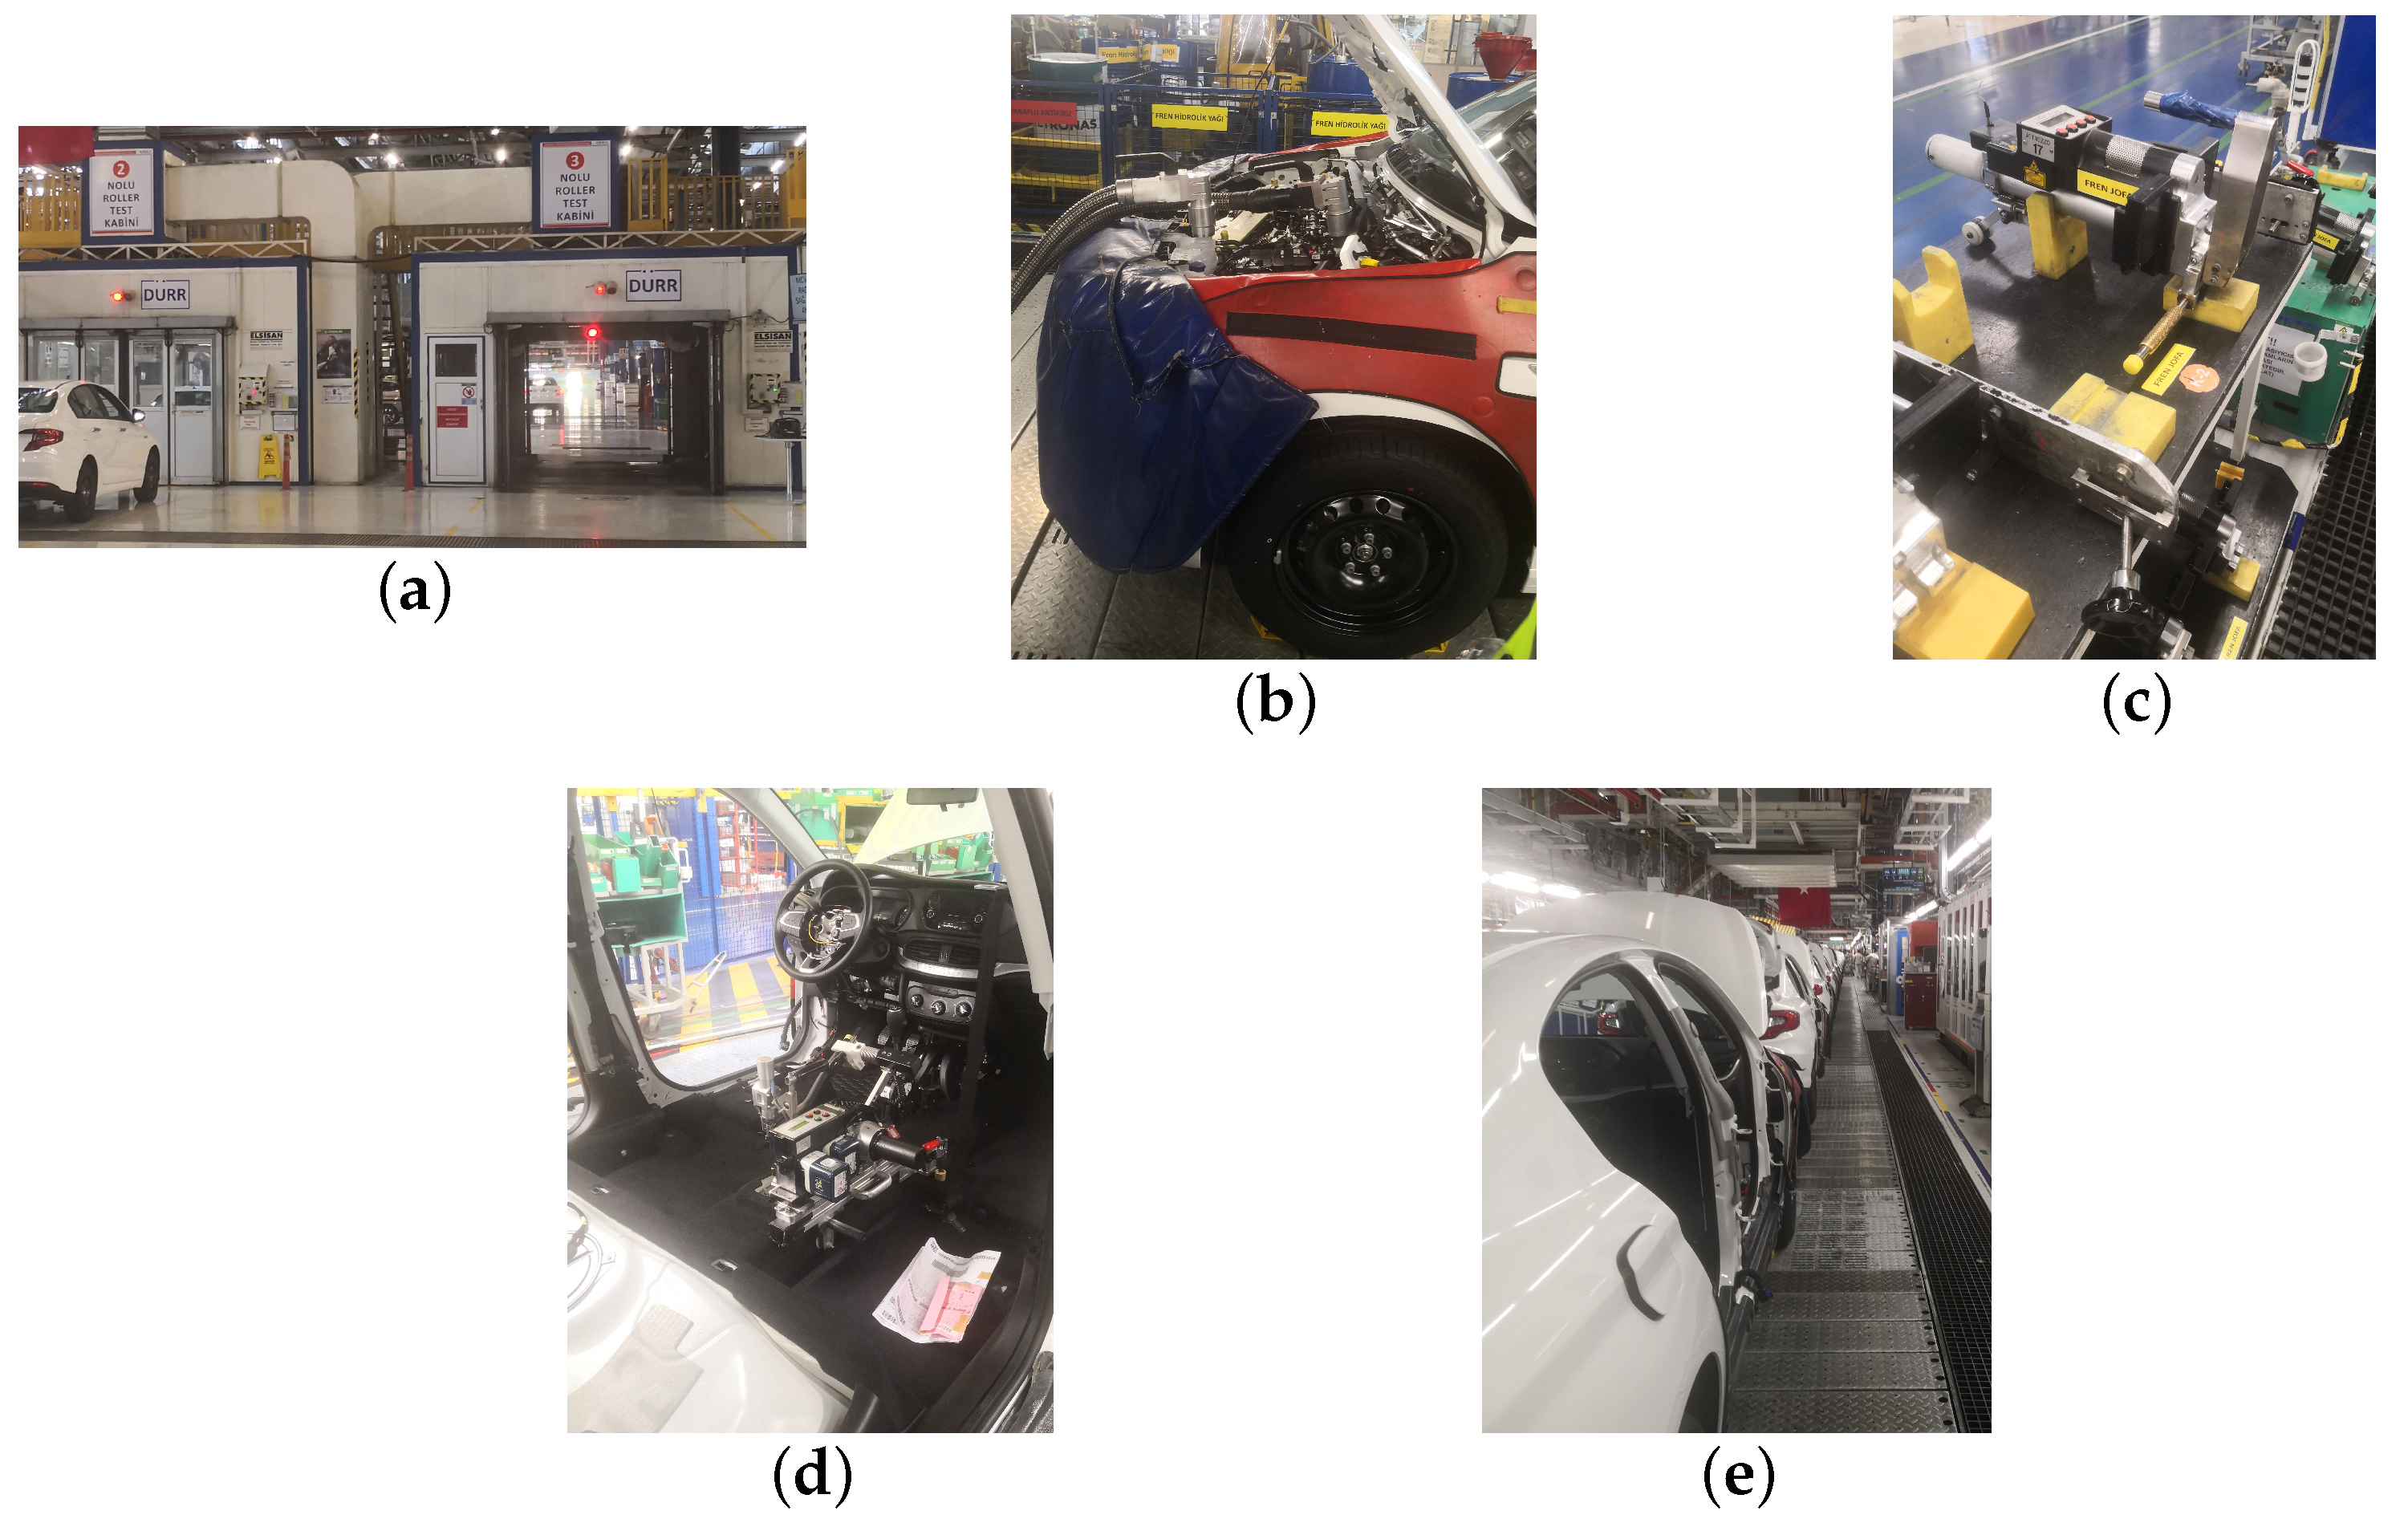
The features were divided into 17 groups according to their physical meaning and place of origin (Table 2). These groups cover the fundamental aspects of brake system behavior, such as force dynamics, brake distribution, rolling resistance, and handbrake performance. The relevant quality control stations, as shown in Figure 4, have a feature set that is predominantly numerical (approximately 90%) with a small number of categorical and binary indicators. The dataset was divided into training (80%, n = 20,604) and test (20%, n = 5152) sets using stratified sampling (random state = 42) while maintaining the original class distribution. The summary statistics are presented in Table 3.
Figure 4.
Quality control stations on the brake assembly line: (a) Roller Test Station, (b) Brake Hydraulic Filling Station, (c) Brake Pedal Test Equipment, (d) Hand Brake Test Station, (e) Production Line.
Table 3.
Summary statistics of the production dataset.
3.3. Experimental Pipeline Architecture
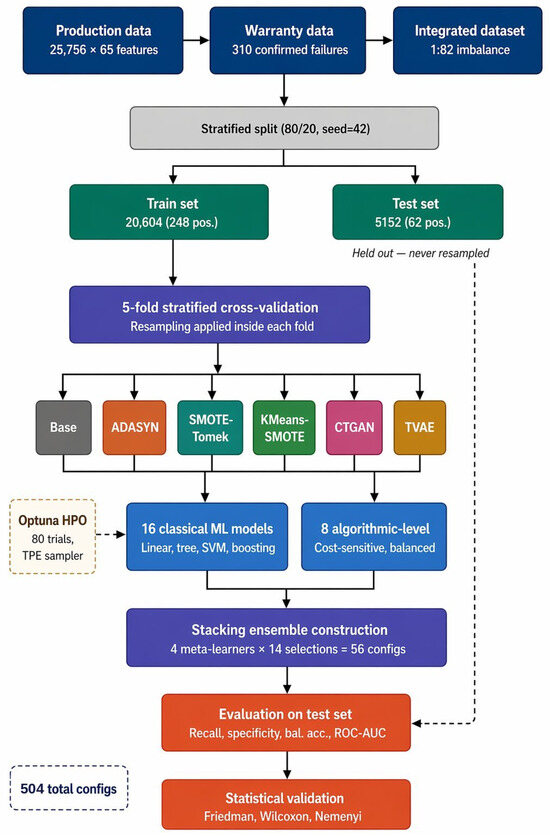
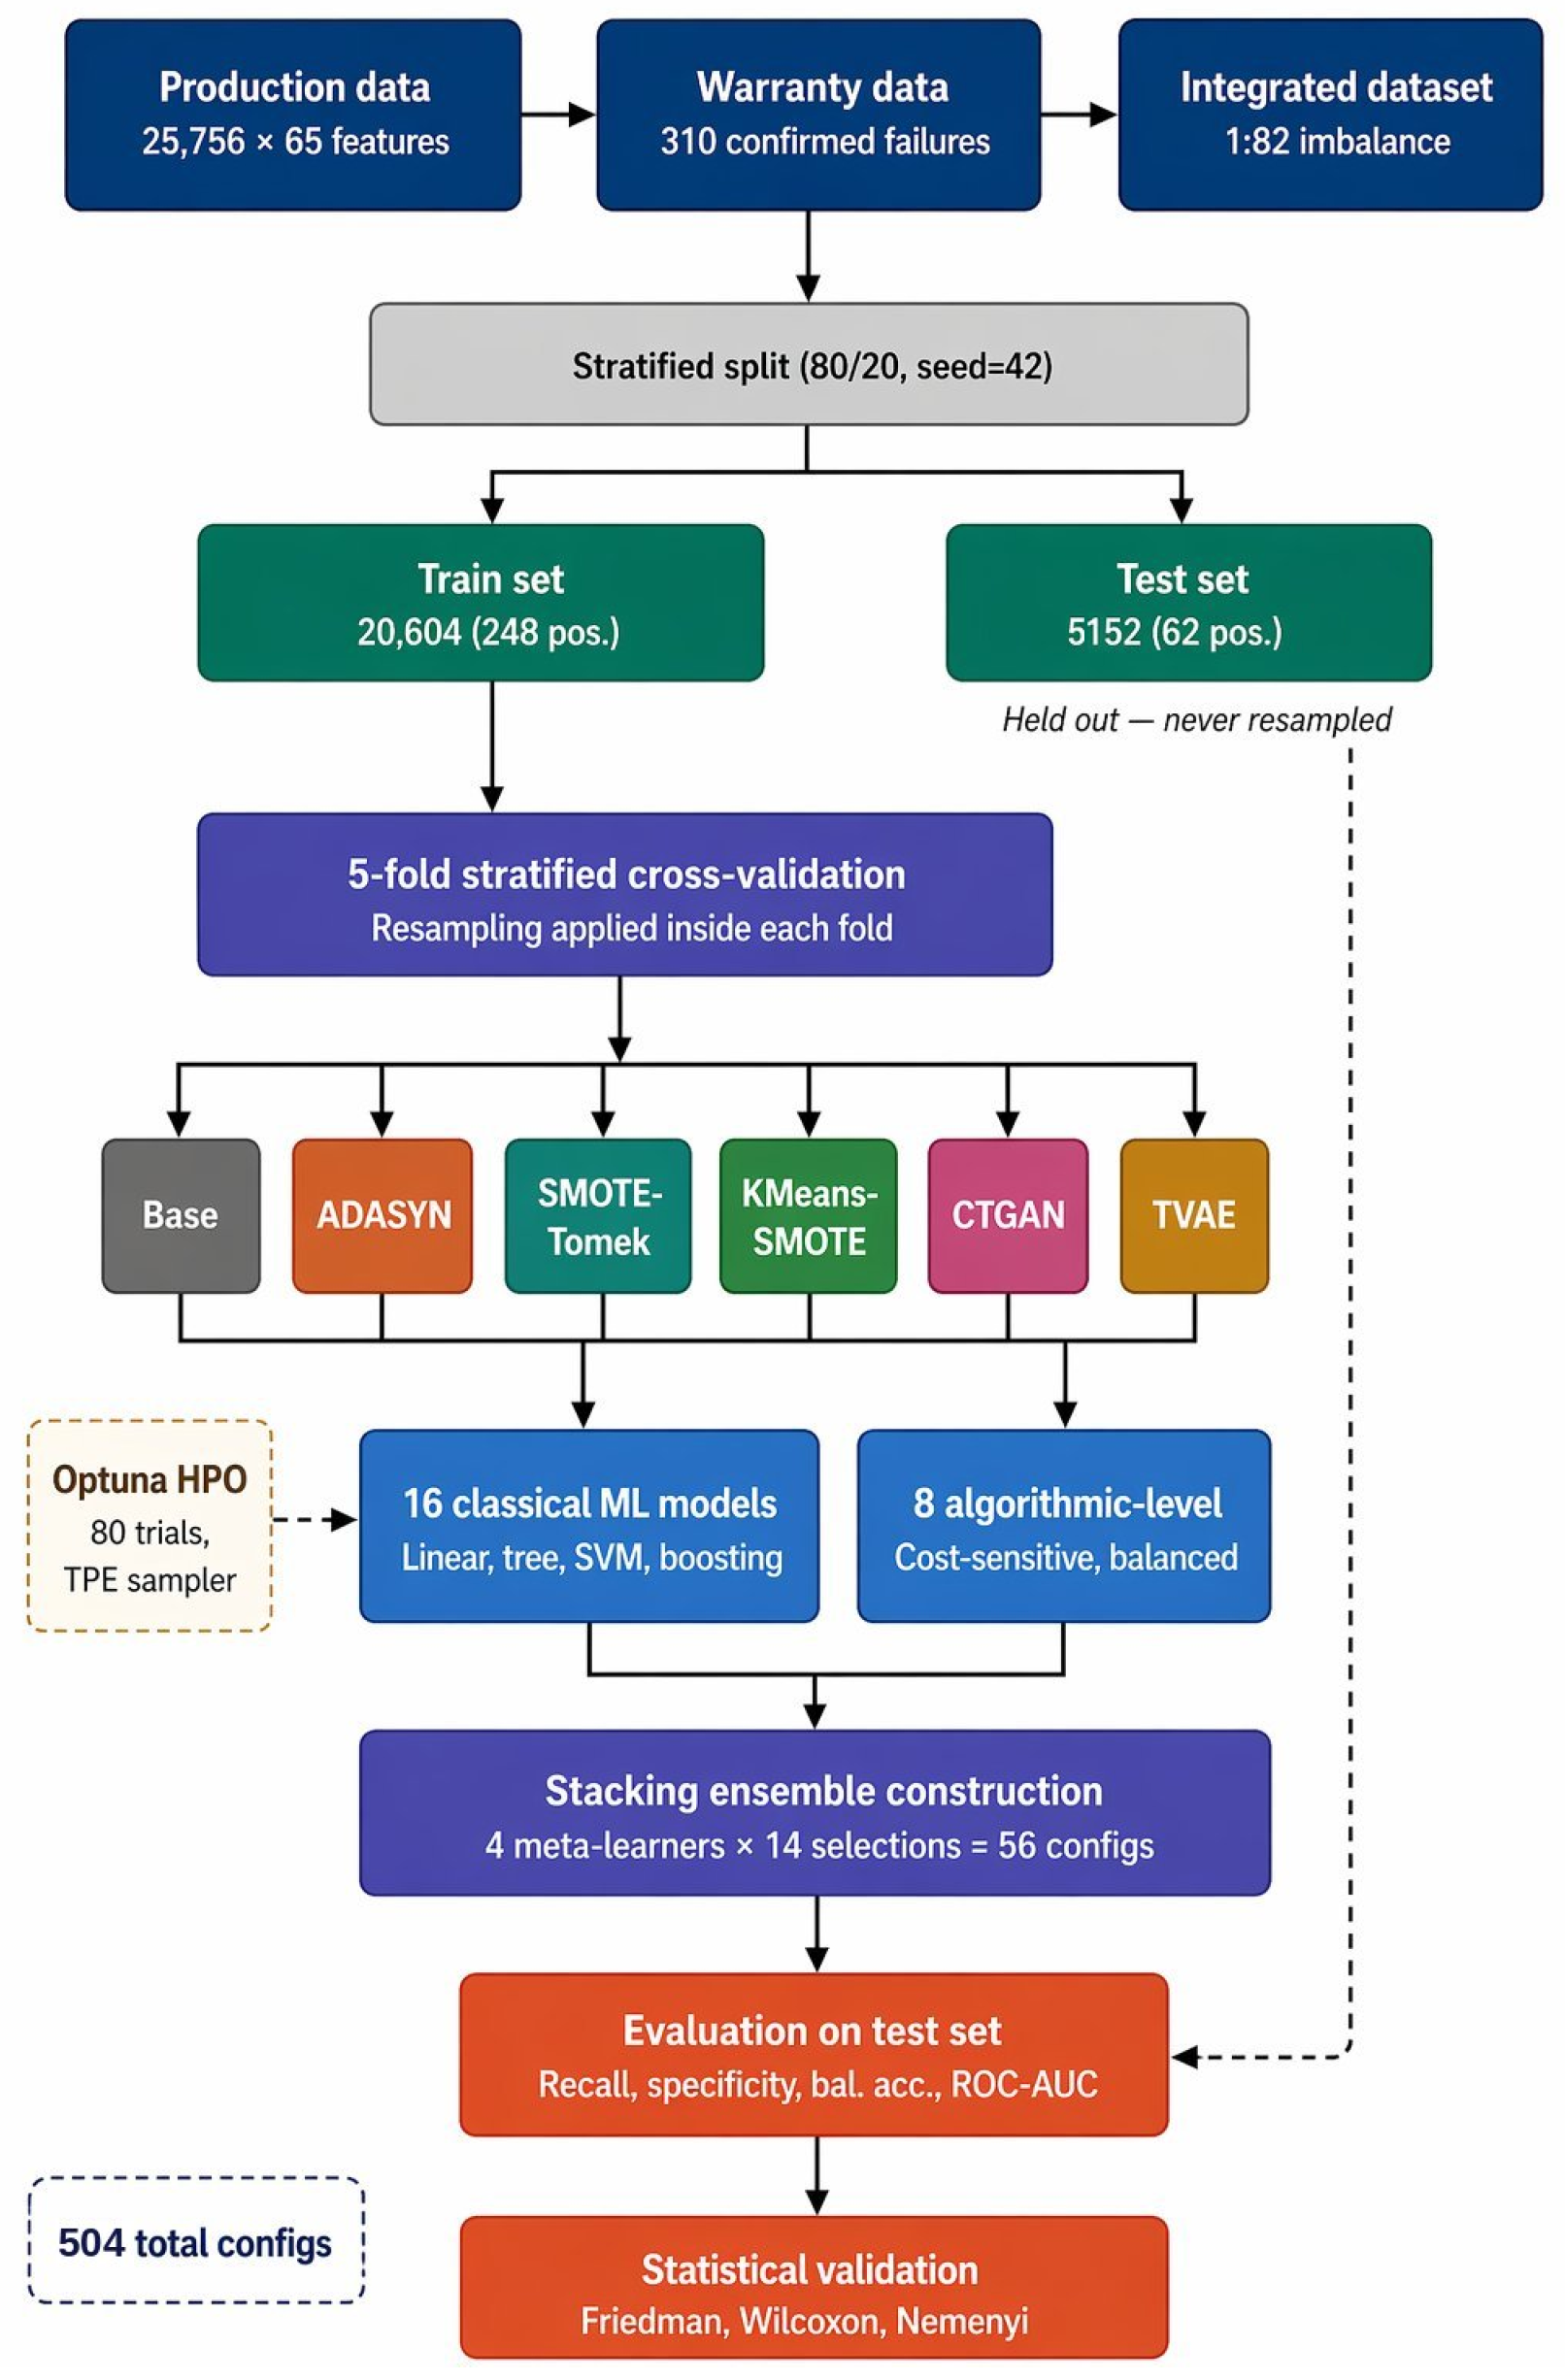
The experimental framework utilized a two-pipeline design to assess the impact of the preprocessing order on the model performance. In Pipeline I, the training data are randomly undersampled to a 1:9 class ratio and used directly for model training. In Pipeline II, the same undersampling step is followed by minority-class oversampling within each cross-validation fold. Critically, both undersampling and oversampling operations were performed inside each cross-validation fold rather than on the full training set, ensuring that no synthetic samples derived from the validation data influenced the model fitting and preventing optimistic bias in the performance estimates. This design allowed for a controlled comparison between baseline class balancing and the generation of additional synthetic data. The complete five-stage pipeline is shown in Figure 5.
Figure 5.
Five-stage experimental pipeline (baseline, undersampling, modeling, oversampling, stacking).
The 1:9 undersampling ratio was selected to balance majority-class information preservation with manageable synthetic sample generation. At the original 1:82 ratio, direct oversampling to 1:1 would require generating approximately 20,000 synthetic samples from only 248 originals, risking noise amplification and overfitting to a small seed population. The 1:9 ratio reduces this requirement to approximately 2000 synthetic samples while retaining sufficient majority-class diversity for boundary learning. This two-stage approach follows the recommendation of Chawla et al. [31], who demonstrated that combining oversampling with majority-class reduction yields better results than either technique alone, and is consistent with recent hybrid frameworks that apply intermediate undersampling before synthetic augmentation [19,36].
3.4. Resampling Strategies
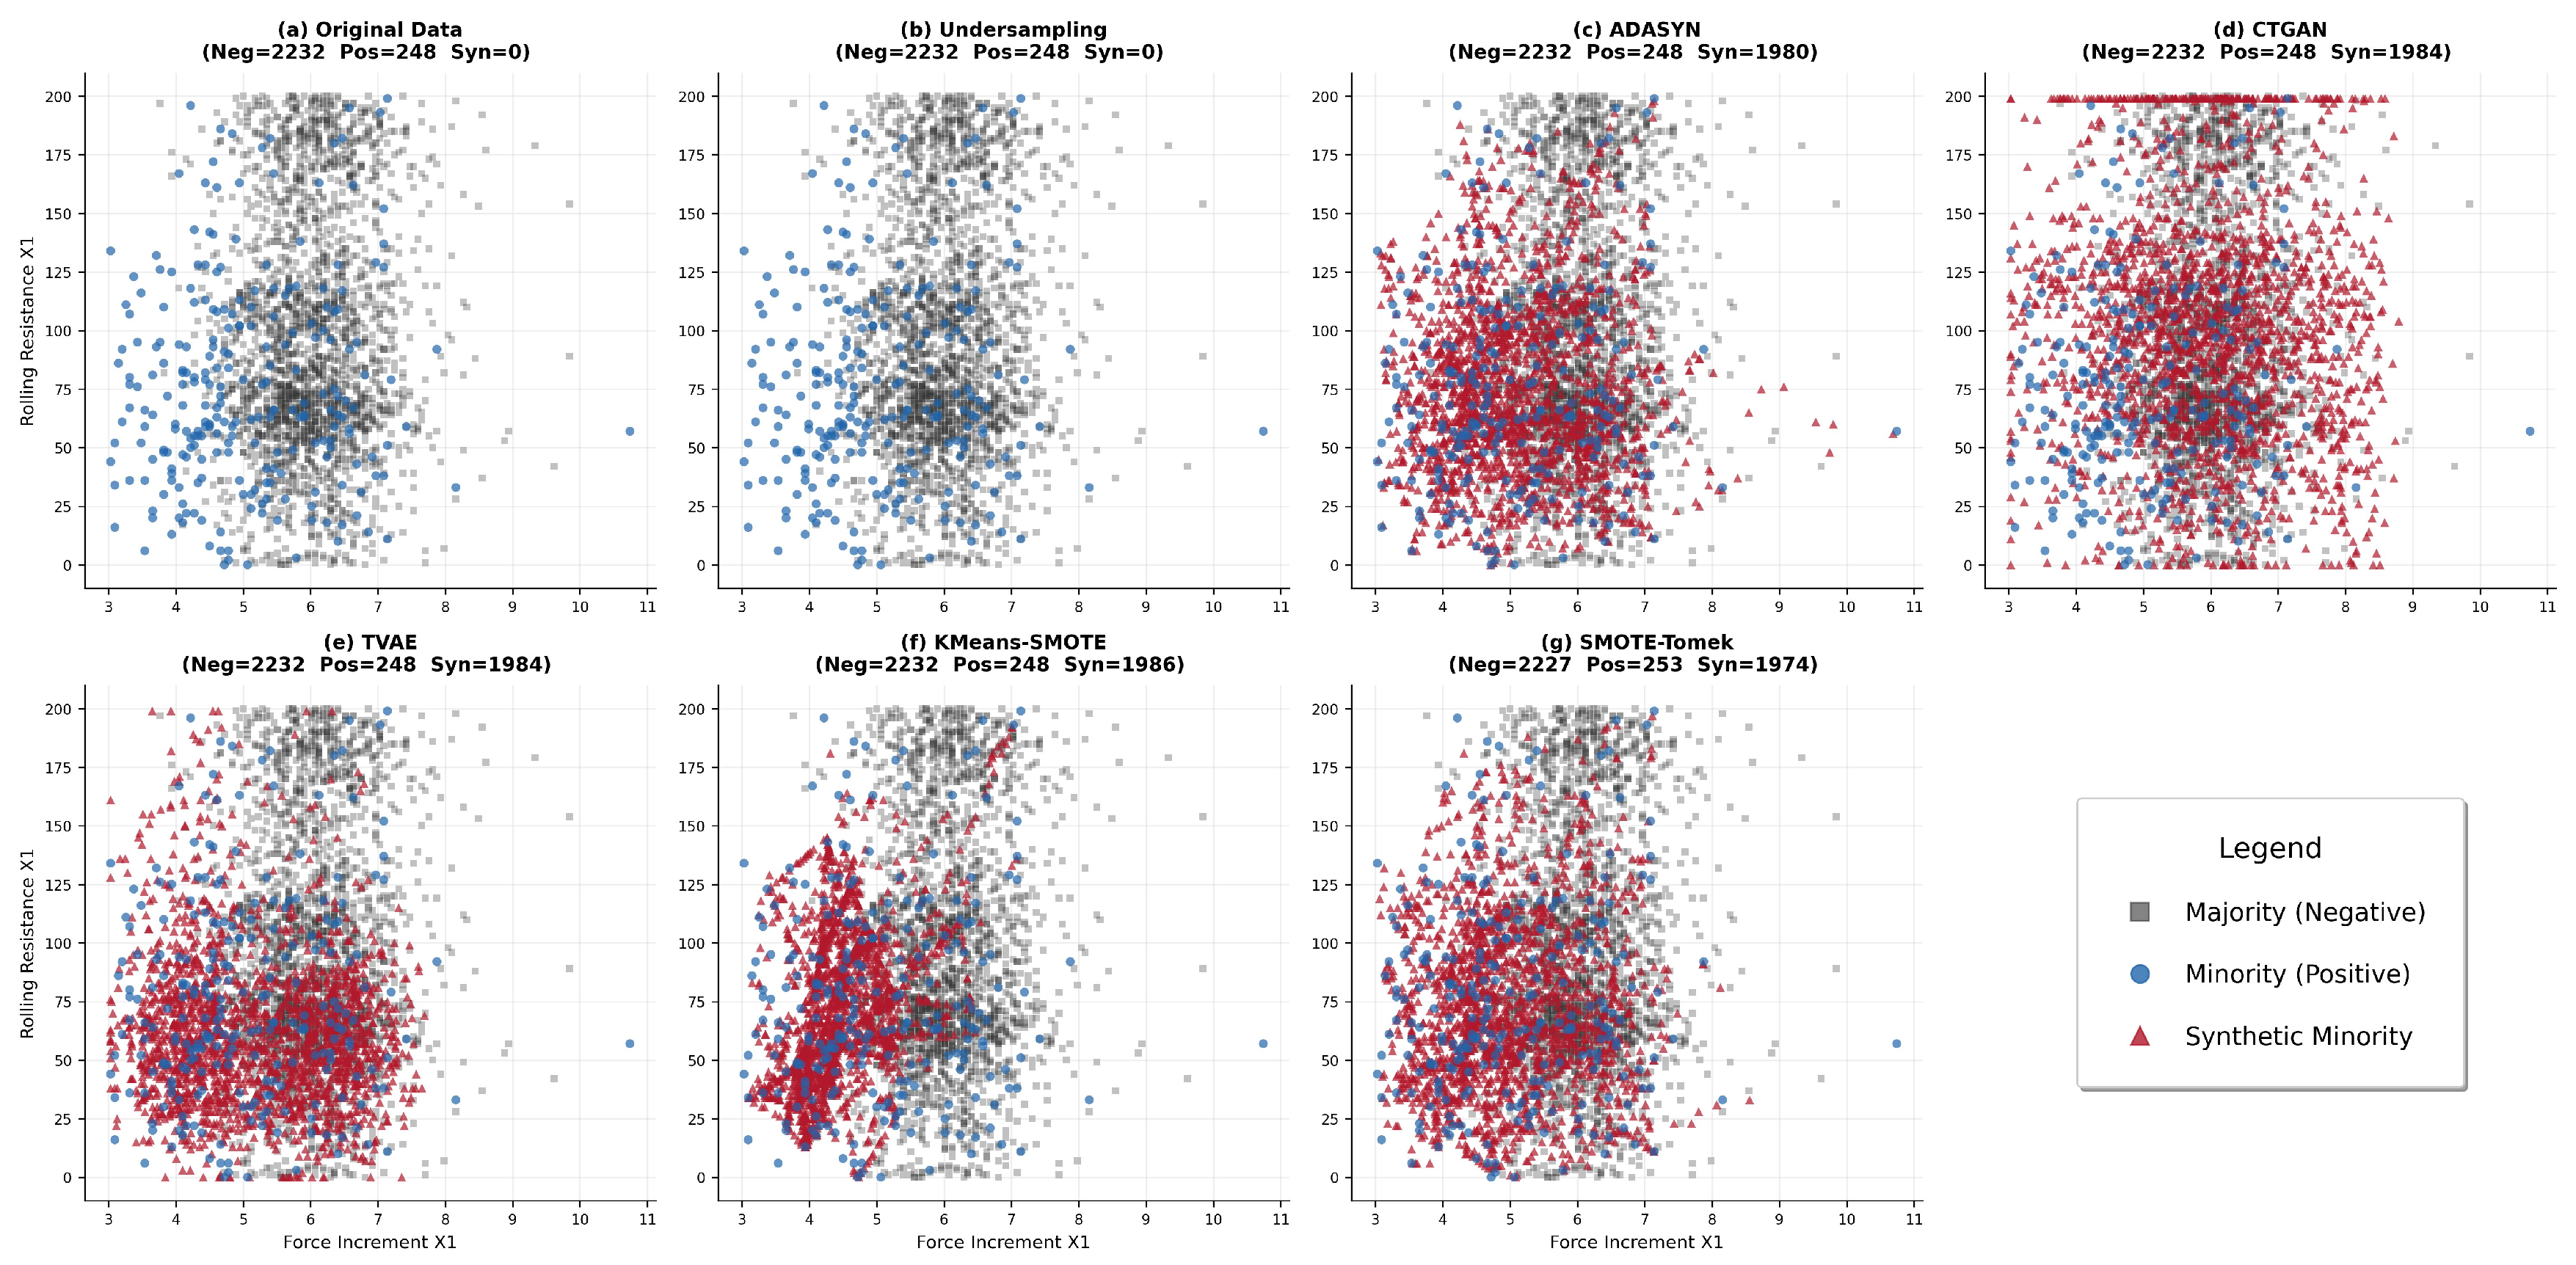
Six resampling strategies were evaluated, including traditional oversampling, hybrid methods, and deep generative models. The assessed strategies are summarized in Table 4, with detailed configurations presented in Table 5. All methods target an approximately balanced class distribution (≈1:1) and are applied within each cross-validation fold to prevent information leakage. The effect of resampling on the feature space is illustrated in Figure 6.
Table 4.
Resampling strategies evaluated in the experimental pipeline.
Table 5.
Sampling strategies, configurations, and resulting training set sizes.
Figure 6.
Visualization of resampling effects on selected features.
ADASYN focuses on difficult minority instances by generating synthetic samples based on local class imbalance, while SMOTE-Tomek combines oversampling with boundary cleaning to improve class separation. KMeans-SMOTE applies cluster-based synthesis to reduce noise in sparse regions. Deep generative models, including CTGAN and TVAE, learn the underlying data distribution to generate synthetic samples for tabular data. CTGAN and TVAE were applied with the default configurations of the SDV library, which prior comparative studies have used as standard baselines for tabular synthesis [6,41].
Hyperparameter tuning (Optuna, 80 trials per model) was applied exclusively to the 24 classifiers. No resampling method received hyperparameter optimization; all used fixed library-recommended default parameters to ensure a fair comparison under identical conditions. For CTGAN and TVAE, the architectural parameters follow the SDV library defaults [53]. CTGAN was trained using the standard adversarial loss (generator and discriminator cross-entropy), while TVAE used reconstruction loss combined with KL divergence regularization, both without modification. The epoch count (100) was empirically selected based on preliminary convergence observation where the discriminator loss stabilized given the small minority-class training size. The primary constraint on generative quality was not the architectural configuration but the limited sample size relative to the 65-dimensional feature space, which restricts the models’ ability to learn the joint distribution regardless of hyperparameter settings. Synthetic data quality was assessed through end-to-end downstream classification performance rather than standalone fidelity metrics, consistent with recent recommendations in the synthetic data evaluation literature [11,40].
3.5. Classification Models
Twenty-four classification algorithms are evaluated across two categories. The first includes sixteen classical ML models that rely on external resampling for class-balance correction, spanning linear, probabilistic, instance-based, tree-based, and ensemble methods. The second category comprises eight algorithmic-level models that incorporate cost-sensitive mechanisms (e.g., class weighting, balanced sub-sampling) to directly penalize minority-class misclassifications [43,44,45].
This diversity ensures that performance differences across resampling strategies are not artifacts of a single model class. A complete list of models is provided in Table 6. Deep learning models are excluded due to the limited minority sample size and extreme class imbalance (1:82), which increase the risk of overfitting.
Table 6.
Classification models grouped by learning paradigm. Sixteen classical and eight algorithmic-level models are evaluated.
Deep learning architectures were not included as base classifiers because the limited minority class sample size and extreme 1:82 imbalance create a high overfitting risk for parameter-heavy models, where gradient-based optimization tends to favor majority class predictions. Deep learning classifiers (MLP, CNN, LSTM) were excluded because they require large labeled training sets for supervised classification, and the available 248 minority-class training samples are insufficient for reliable gradient-based optimization of classification networks. In contrast, CTGAN and TVAE serve as data generation tools rather than classifiers: they learn the minority-class distribution from the available samples to produce synthetic training data, which is then used by conventional classifiers. This functional distinction between deep generative data augmentation and deep supervised classification motivates their inclusion despite the limited sample size.
3.6. Hyperparameter Optimization
Hyperparameter tuning is performed using Optuna with a Tree-structured Parzen Estimator (TPE) sampler and 80 trials per optimization run. Trials failing to reach a minimum recall threshold are pruned, and the final decision threshold is optimized using balanced accuracy on out-of-fold predictions. The optimization objective is recall-oriented to reflect the operational importance of capturing warranty-confirmed failures.
3.7. Stacking Ensemble Construction
Stacking ensembles are constructed using out-of-fold (OOF) predictions as inputs to a second-level meta-learner. Four meta-learners are evaluated (Logistic Regression, ElasticNet, shallow LightGBM, and HillClimbing optimization), together with fourteen base-model selection strategies covering performance-based, diversity-based, and hybrid criteria.
This design yields 56 stacking configurations per resampling strategy. It enables a systematic evaluation of model combination strategies. Each ensemble inherits the resampling scheme of its base models. Selection strategies and meta-learner configurations are detailed in Table 7.
Table 7.
Stacking ensemble selection strategies and meta-learner configurations.
3.8. Performance Metrics
Model performance is evaluated using seven metrics selected to address the asymmetric label structure. Recall is the primary metric, capturing the proportion of correctly identified failures, while Specificity reflects the ability to avoid false alarms. Balanced Accuracy provides a class-balanced summary measure. The score emphasizes recall in accordance with the detection objective. PR-AUC and ROC-AUC evaluate ranking performance across thresholds, with PR-AUC being valuable in rare-event scenarios.
3.9. Test Protocol
All model development steps, including preprocessing, resampling, optimization, and ensemble construction, are performed exclusively on the training data. The held-out test set is reserved for final evaluation only, ensuring a leak-free assessment of generalization performance. The dataset was partitioned into training (80%) and test (20%) sets using stratified random sampling with a fixed random seed (seed = 42), preserving the original 1:82 class ratio in both subsets to ensure reproducibility.
3.10. Statistical Analysis
Statistical significance across resampling strategies was assessed using non-parametric tests on cross-validation results. The Friedman test was first applied to compare strategies across 22 valid models using mean recall. When significant, pairwise Wilcoxon signed-rank tests with Bonferroni correction were conducted, and Cohen’s d was reported to quantify effect size. Two models (QDA and LDA) were excluded because of convergence problems under CTGAN-based sampling. The complete research setup is presented in Table 8. This setup is referenced in Section 4 when comparing the results by strategy.
Table 8.
Summary of experimental configurations.
4. Results
4.1. Incremental Effect of Framework Components
Table 9 summarizes the incremental performance improvements from the raw baseline to the final model configuration, where each step addresses a distinct challenge, including class imbalance, cost asymmetry, minority sparsity, and model complementarity.
Table 9.
Incremental performance progression from baseline to recommended low-FPR operating point: best configuration per stage on the held-out test set.
The baseline Random Forest model, trained on the original 1:82 distribution without resampling, achieved a recall of 0.597 and detected 37 of 62 faulty units, indicating that post-quality-gate failures are partially detectable even under extreme imbalance. Applying undersampling (1:9 ratio) led to a substantial increase in recall (0.935), improving detection coverage from 59.7% to 93.5%, albeit with reduced specificity (0.849). Incorporating algorithmic-level weighting (RF_Weighted) improved this trade-off, increasing specificity to 0.900 while maintaining recall, resulting in a balanced accuracy of 0.918.
The strongest individual-model performance was achieved using SVM-RBF with ADASYN, which detected 54 of 62 failures (recall = 0.871) while achieving the highest specificity (0.982) and the lowest false positive rate (1.8%) across all configurations. This confirms that ADASYN-based augmentation combined with kernel methods is particularly effective under extreme imbalance. Finally, stacking ensembles further improved detection coverage. The framework produces two distinct top-performing stacking configurations from two different pipelines. From the oversampling pipeline, ElasticNet with A3 selection trained on KMeans-SMOTE data achieved the highest ROC-AUC of 0.960 with recall of 0.935, detecting 58 of 62 failures. From the undersampling-only pipeline, ElasticNet/A1_low_corr achieved a higher ROC-AUC of 0.975, indicating that the undersampling-based base learners provided more discriminative probability estimates for the meta-learner. Although stacking did not outperform the SVM-RBF model in terms of specificity and score, it maximized recall and overall ranking performance, highlighting the benefits of meta-learning for improving coverage under asymmetric risk. Table 9 presents the best-performing configurations at each stage.
4.2. Model Selection and Proposed Configuration
The highest-ranked configuration is an SVM-RBF model trained with ADASYN, achieving recall of 0.871 and specificity of 0.982. This corresponds to detecting 54 of 62 failures while generating only 93 false positives (FPR = 1.8%), demonstrating strong discrimination under extreme imbalance. This confirms that ADASYN-based augmentation combined with kernel methods is particularly effective under extreme imbalance.
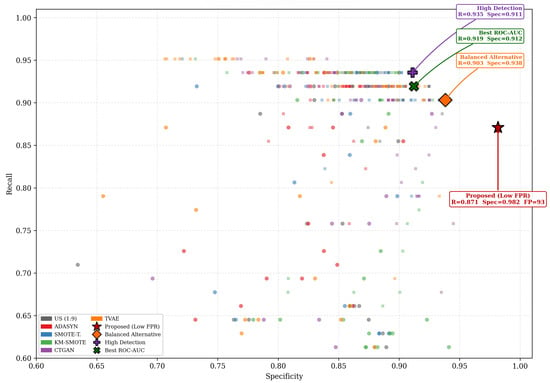
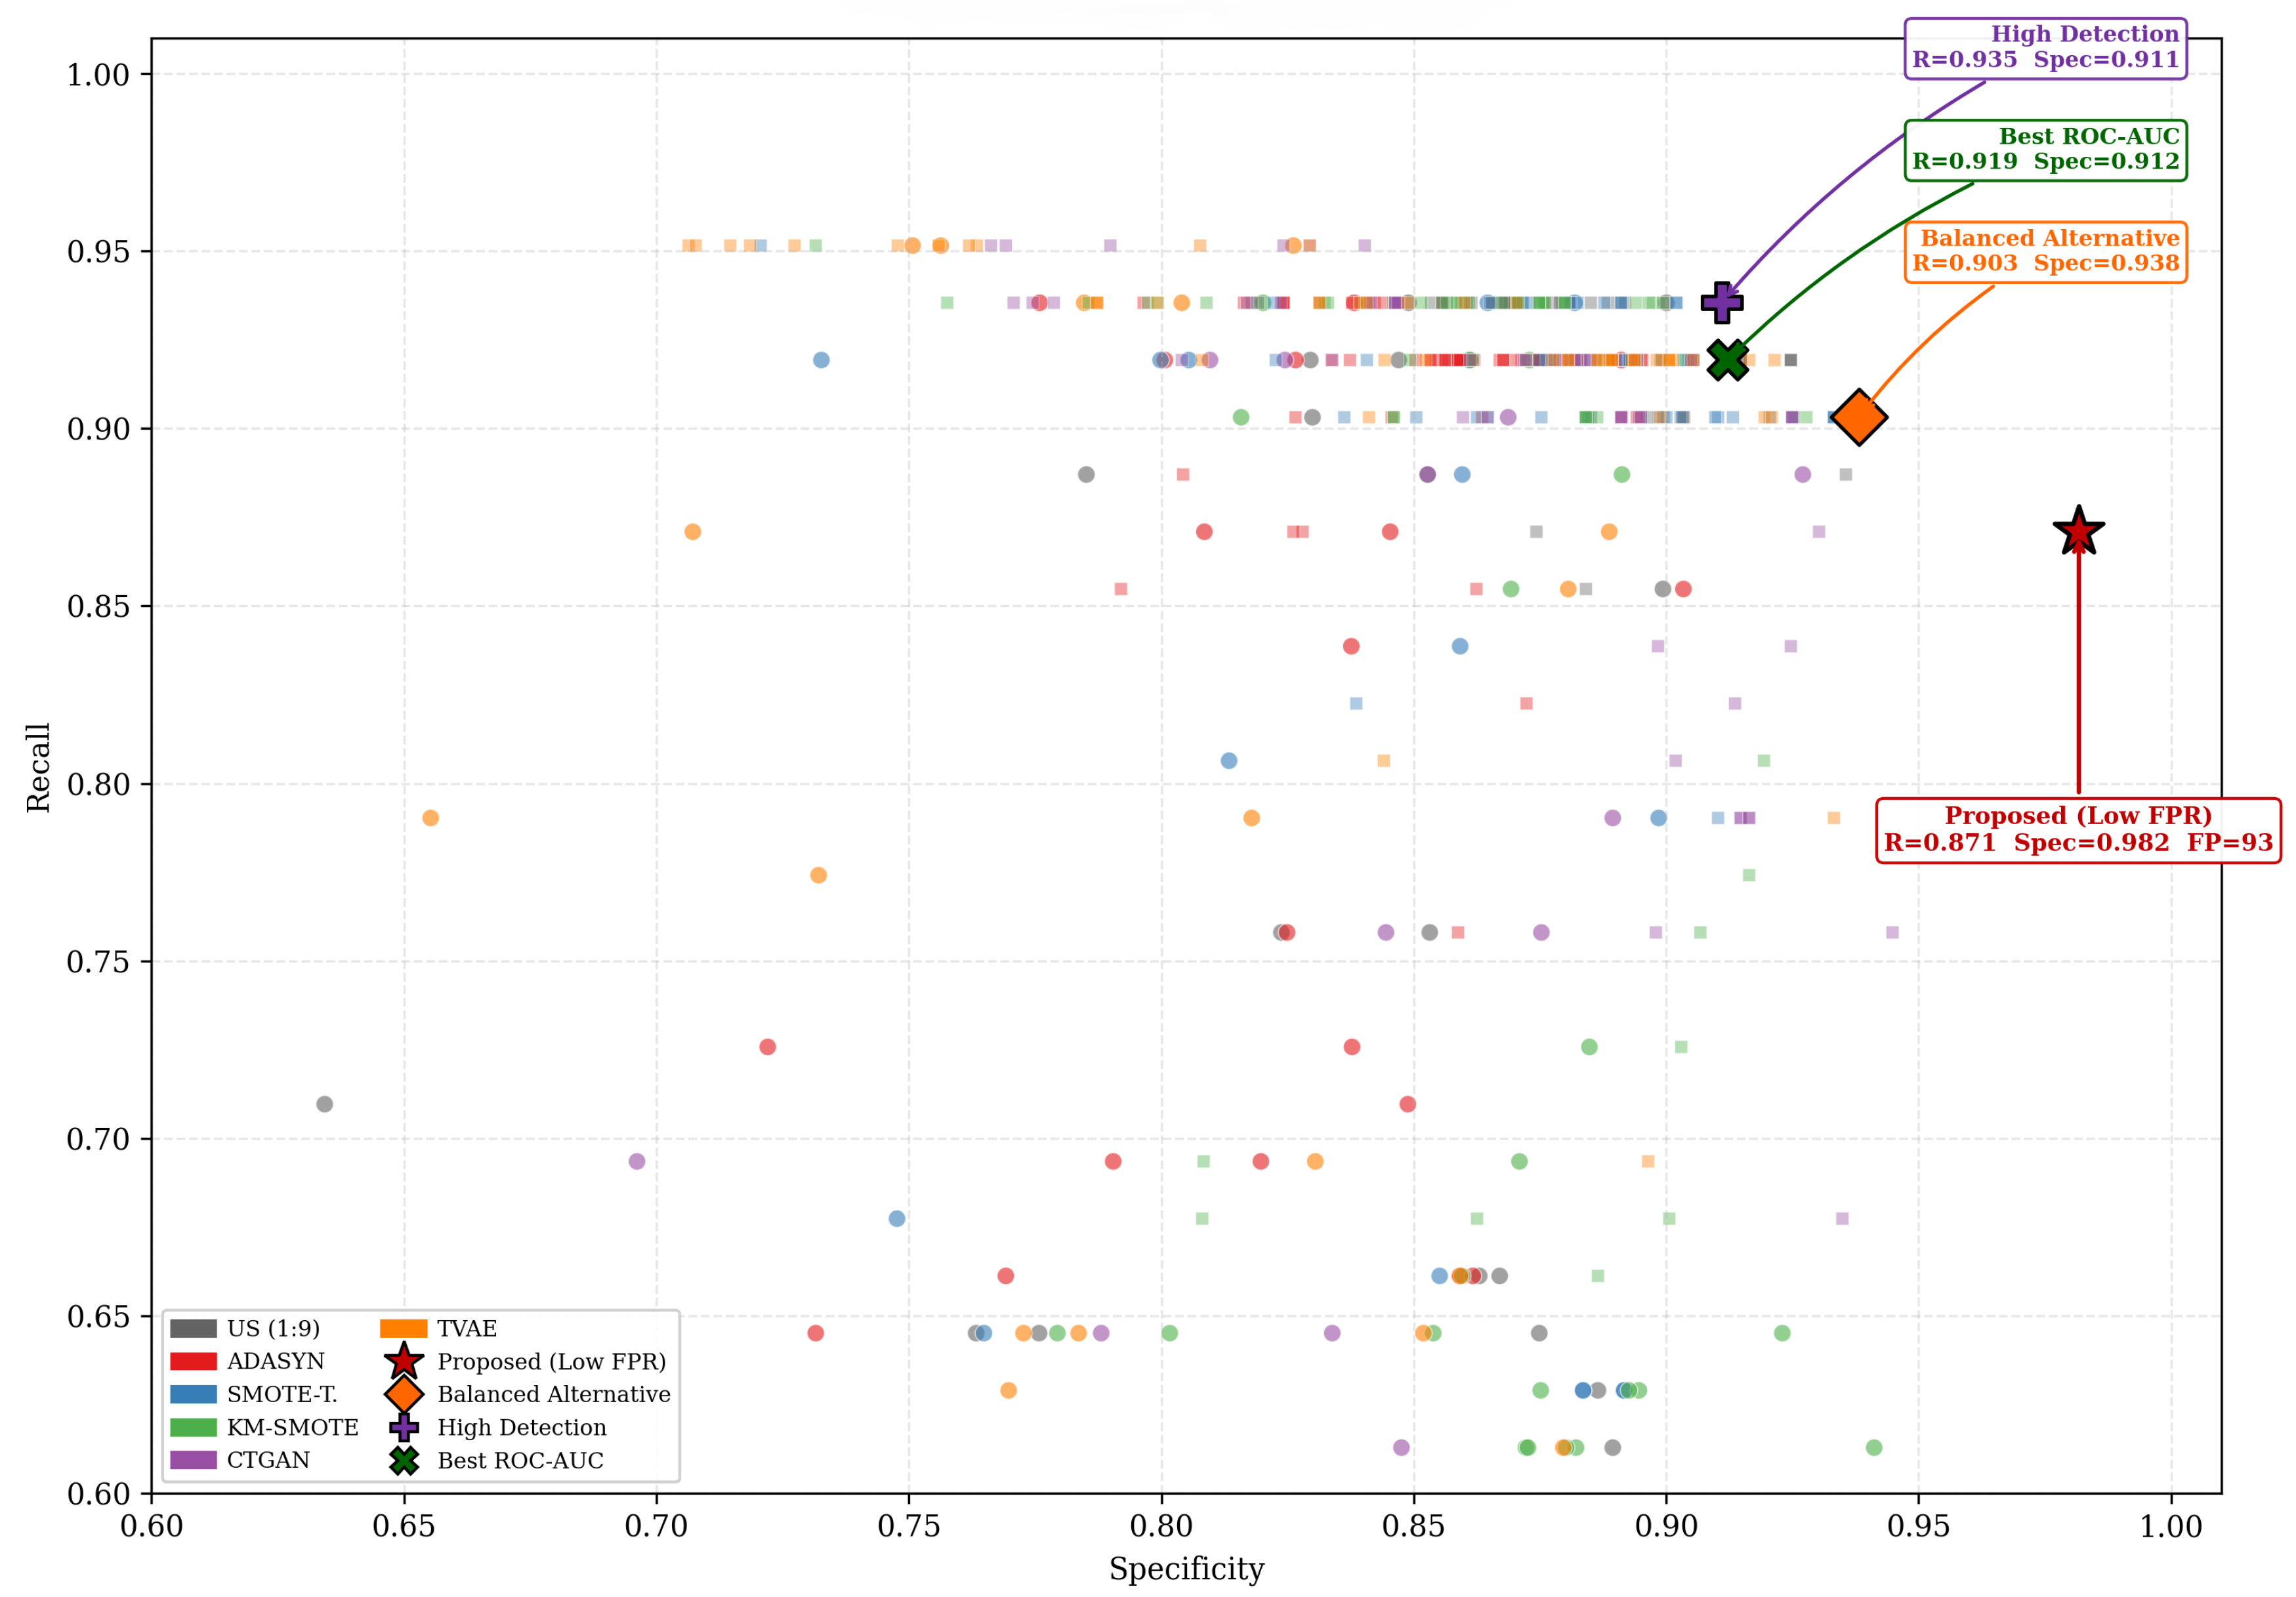
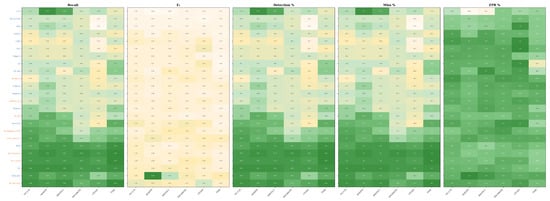
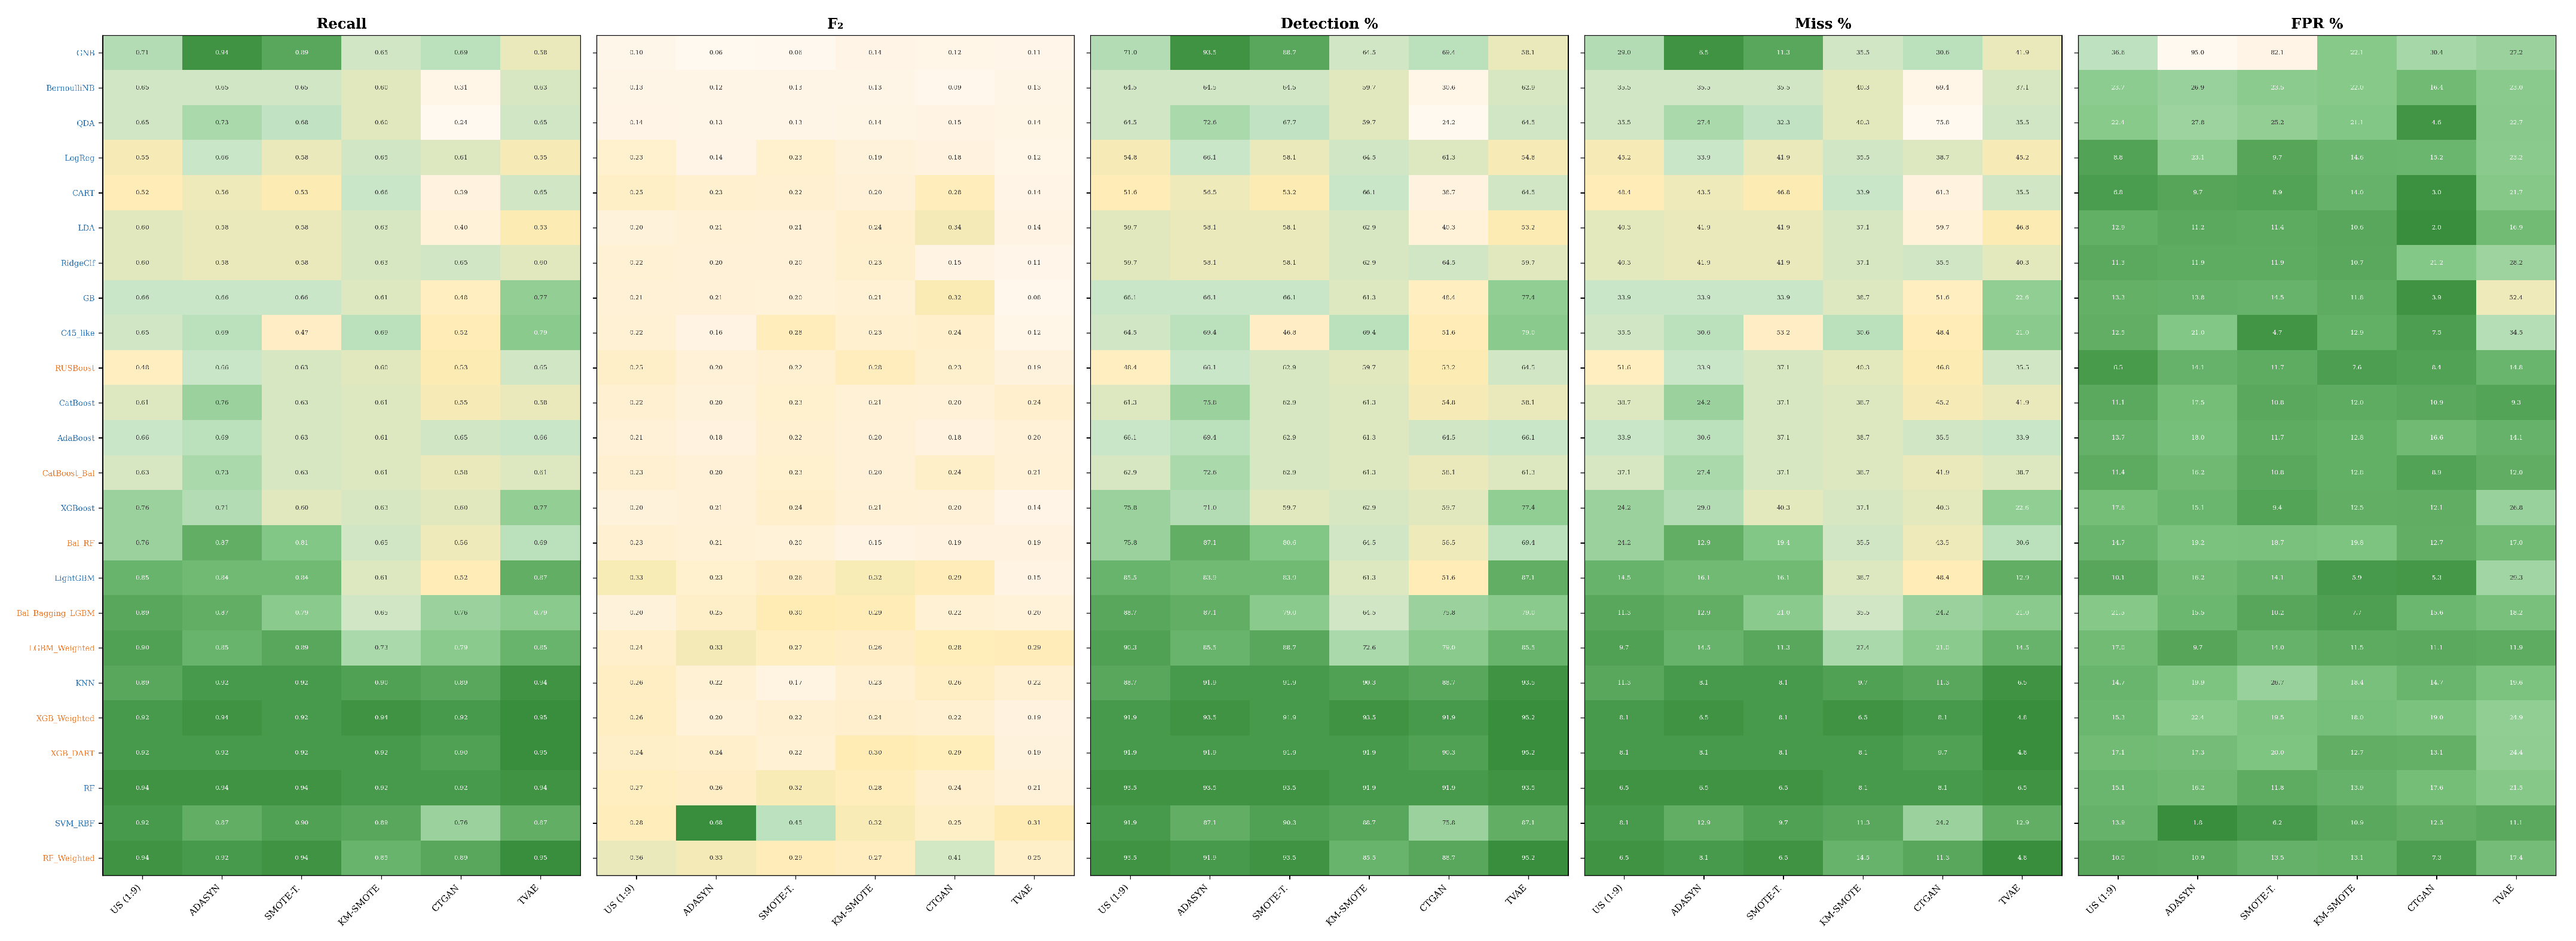
Figure 7 illustrates the recall–specificity trade-off across all configurations, where the recommended low-FPR operating point occupies the upper-right region, selected as the primary deployment recommendation due to its low false-positive rate (FPR = 1.8%) rather than achieving the highest score on every metric. This behavior is further supported by the performance heatmap in Figure 8, which consistently achieves high recall with minimal loss of specificity. From an operational perspective, the proposed model detects 87.1% of post-quality-gate failures while maintaining a very low false alarm rate. The balanced accuracy of 0.926 confirms that this performance is not driven by bias toward a single class.
Figure 7.
Recall–specificity trade-off across all evaluated configurations. Four operating points are highlighted: proposed (⋆), balanced (♦), high detection (+), and best ROC-AUC (×).
Figure 8.
Performance heatmap of 24 models × 6 resampling strategies. Panels show Recall, , Detection Rate (%), Missed Fault Rate (%), and False Positive Rate (%).
The second-ranked configuration (SVM-RBF with SMOTE-Tomek) achieves higher recall (0.903) but at the cost of reduced specificity (0.938), highlighting the trade-off between detection coverage and false positives. Interestingly, 8 of the top 10 configurations are ensemble models, confirming the effectiveness of meta-learning. However, none outperform the recommended low-FPR operating point in terms of specificity or score. This confirms that this configuration’s primary strength is false alarm suppression, while facilities prioritizing maximum detection rate or threshold-independent discrimination should consider the alternative operating points.
These results should be interpreted in the context of the extreme class imbalance. At a base rate of 1.20%, even high-specificity models yield moderate precision, a mathematical consequence of rarity rather than model deficiency. The proposed model operates near the theoretical precision ceiling imposed by a 1:82 base-rate. Therefore, the score should be read as a property of the imbalance regime, not as evidence of weak discrimination. The observed recall represents a substantial improvement over random detection, confirming that the model captures meaningful predictive signals from production data. Table 10 summarizes the top configurations.
Table 10.
Top 10 configurations on the held-out test set. R = Recall; Spec. = Specificity; Bal. Acc. = Balanced Accuracy; ROC-AUC = Area Under ROC Curve; Det.% = Detection Rate; FPR% = False Positive Rate; T = Model type (I = Individual model, S = Stacking ensemble).
4.3. Comparison of Resampling Strategies
Figure 8 presents the performance heatmap across all 24 models and six resampling strategies. Specifically, ADASYN and SMOTE-Tomek consistently achieved the highest recall across the model categories. ADASYN yielded the best single model (SVM-RBF), whereas SMOTE-Tomek contributed the largest number of top-performing stacking configurations.
A key finding from the results is the relative underperformance of the deep generative models. In fact, CTGAN produced the lowest mean recall among all strategies, performing worse than both the no-resampling baseline and traditional oversampling methods. The performance of TVAE was somewhat comparable to the baseline, but did not match the gains achieved by ADASYN or SMOTE-Tomek. This outcome suggests that, under conditions of extreme imbalance (1:82), a limited number of minority samples is insufficient for generative models to learn a reliable distribution (Figure 6).
The poor classification performance of CTGAN and TVAE strategies can be attributed to insufficient distribution learning under small-sample conditions. With only 248 minority-class training samples distributed across 65 features, these deep generative models face a fundamental sample-to-dimension ratio challenge: learning the full joint distribution, including pairwise and higher-order feature correlations, from such a limited pool produces synthetic samples that fail to preserve the statistical structure of the original minority class. As shown in Figure 6, CTGAN-generated samples show notably weaker overlap with the true minority distribution compared to ADASYN and SMOTE-Tomek, particularly in the Force Increment X1 and Rolling Resistance X1 feature space. In contrast, traditional interpolation-based methods such as ADASYN operate locally in feature space, generating synthetic samples between existing neighbors without attempting to learn a global distribution, which performs better at this sample size. These findings are consistent with recent comparative studies reporting that CTGAN and similar architectures require substantially larger minority populations to produce high-fidelity tabular data [5,11,40]. This suggests an applicable boundary: traditional adaptive oversampling methods are preferable when the minority class contains fewer than approximately 300 samples in high-dimensional settings, while deep generative approaches may become competitive as the available minority data grows.
Among the traditional methods, ADASYN and SMOTE-Tomek achieved comparable overall performances, both outperforming K-means-SMOTE. Algorithmic-level models generally exhibit higher recall than classical models, indicating that cost-sensitive mechanisms provide additional benefits when combined with resampling. Table 11 provides a detailed comparison of the best-performing configurations across all resampling strategies, confirming the superior performance of ADASYN in individual models and the competitiveness of SMOTE-Tomek and KMeans-SMOTE in stacking ensembles.
Table 11.
Best-performing individual and stacking configurations per resampling strategy.
Table 11 summarizes the representative best-performing configurations. ADASYN produces the top-ranked individual model, whereas SMOTE-Tomek and KMeans-SMOTE dominate the stacking performance. In the top 10 configurations, SMOTE-Tomek and KMeans-SMOTE each contributed three entries, followed by undersampling and ADASYN and TVAE.
No single resampling strategy dominated the individual and ensemble settings. ADASYN performed best with kernel-based models, suggesting that its adaptive sampling reinforced local decision boundaries. In contrast, SMOTE-Tomek and KMeans-SMOTE are more effective for stacking ensembles, where cleaner or more diverse synthetic samples enhance meta-learning.
Deep generative approaches have shown limited effectiveness. Although CTGAN achieves competitive balanced accuracy in some configurations, it does not appear in the top 10, and TVAE contributes only one entry. These results indicate that traditional adaptive oversampling is more effective than deep generative synthesis under extreme imbalances. This is particularly evident when the minority samples are limited.
CTGAN’s weaker performance should be interpreted with caution, given its sensitivity to hyperparameter settings and training stability. In particular, generative models for tabular data require sufficient minority class representation to accurately learn conditional distributions, and their performance can vary significantly depending on tuning choices, such as batch size, training epochs, and normalization strategies. Given the limited number of minority samples in this study, these constraints likely restricted the ability of the CTGAN to generate high-quality synthetic data.
4.4. Individual Models Versus Stacking Ensembles
A key question is whether the stacking ensembles provide a systematic advantage over the individual models. The results indicate that neither approach dominates all metrics, and each serves different operational objectives. The proposed SVM-RBF model achieved the highest specificity (0.982) and score (0.517), producing only 93 false positives. Other stacking configurations did not achieve this level of false-alarm suppression performance. In contrast, the stacking ensemble achieved a higher recall and better threshold-independent performance. The best stacking model detected 58 of 62 faults (recall = 0.935) and captured four additional failures compared to the proposed model.
Eight of the top 10 configurations were stacking ensembles (Table 10), confirming the effectiveness of meta-learning. However, the top two ranked models are SVM-RBF configurations, and both outperform the stacking models in terms of specificity and score. This indicates that stacking improves the detection coverage, whereas kernel-based models better control false positives.
ElasticNet stands out as the most effective meta-learning algorithm, and features in many of the best configurations. Diversity-aware selection strategies consistently outperform the simple inclusion of all models, demonstrating that selective model combinations improve the generalization ability under extreme imbalances. Overall, the framework supports operationally guided model selection by offering alternative configurations for different balances between detection coverage and false alarm burden.
4.5. Trade-Off Analysis and Deployment Recommendations
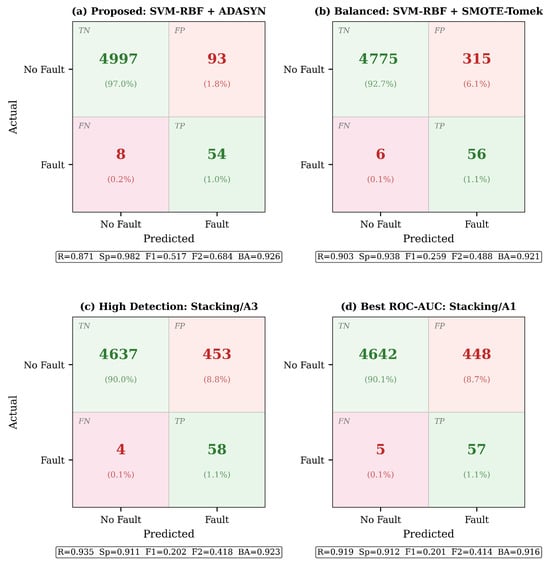
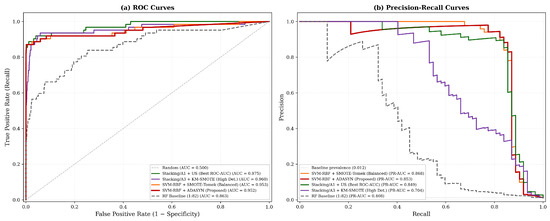
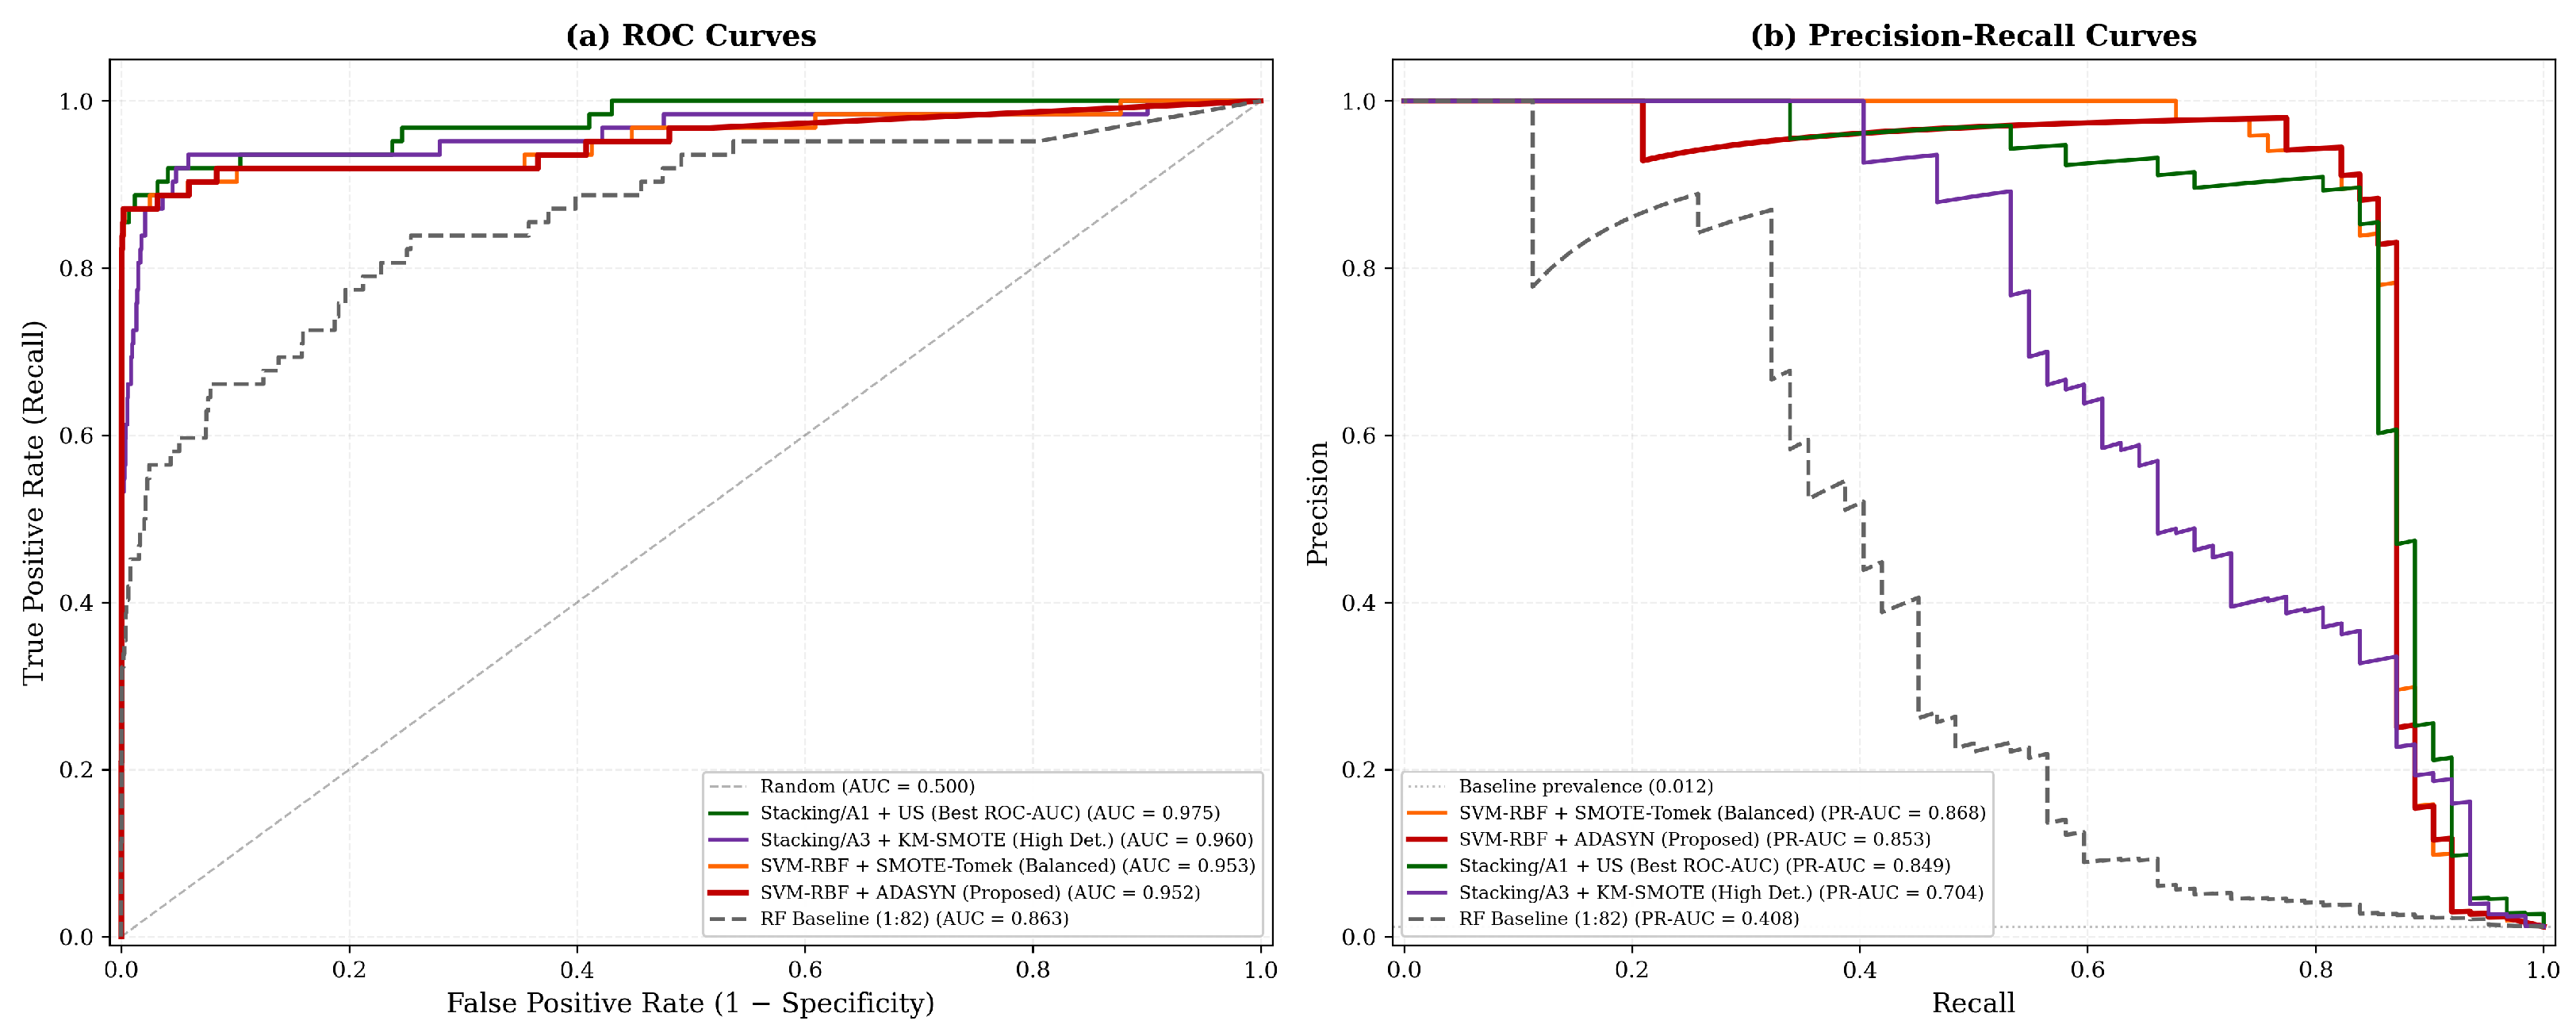
The results presented in Section 4.2, Section 4.3 and Section 4.4 show that no single configuration dominates all the evaluation metrics. Individual models and stacking ensembles exhibit different strengths depending on the operational objectives. To translate these findings into practical deployment guidance, four representative operating points were identified, each optimizing a distinct trade-off profile (Table 12), with the corresponding confusion matrices shown in Figure 9 and ROC curves in Figure 10.
Table 12.
Four deployment operating points derived from the framework. Each profile optimizes a different operational objective.
Figure 9.
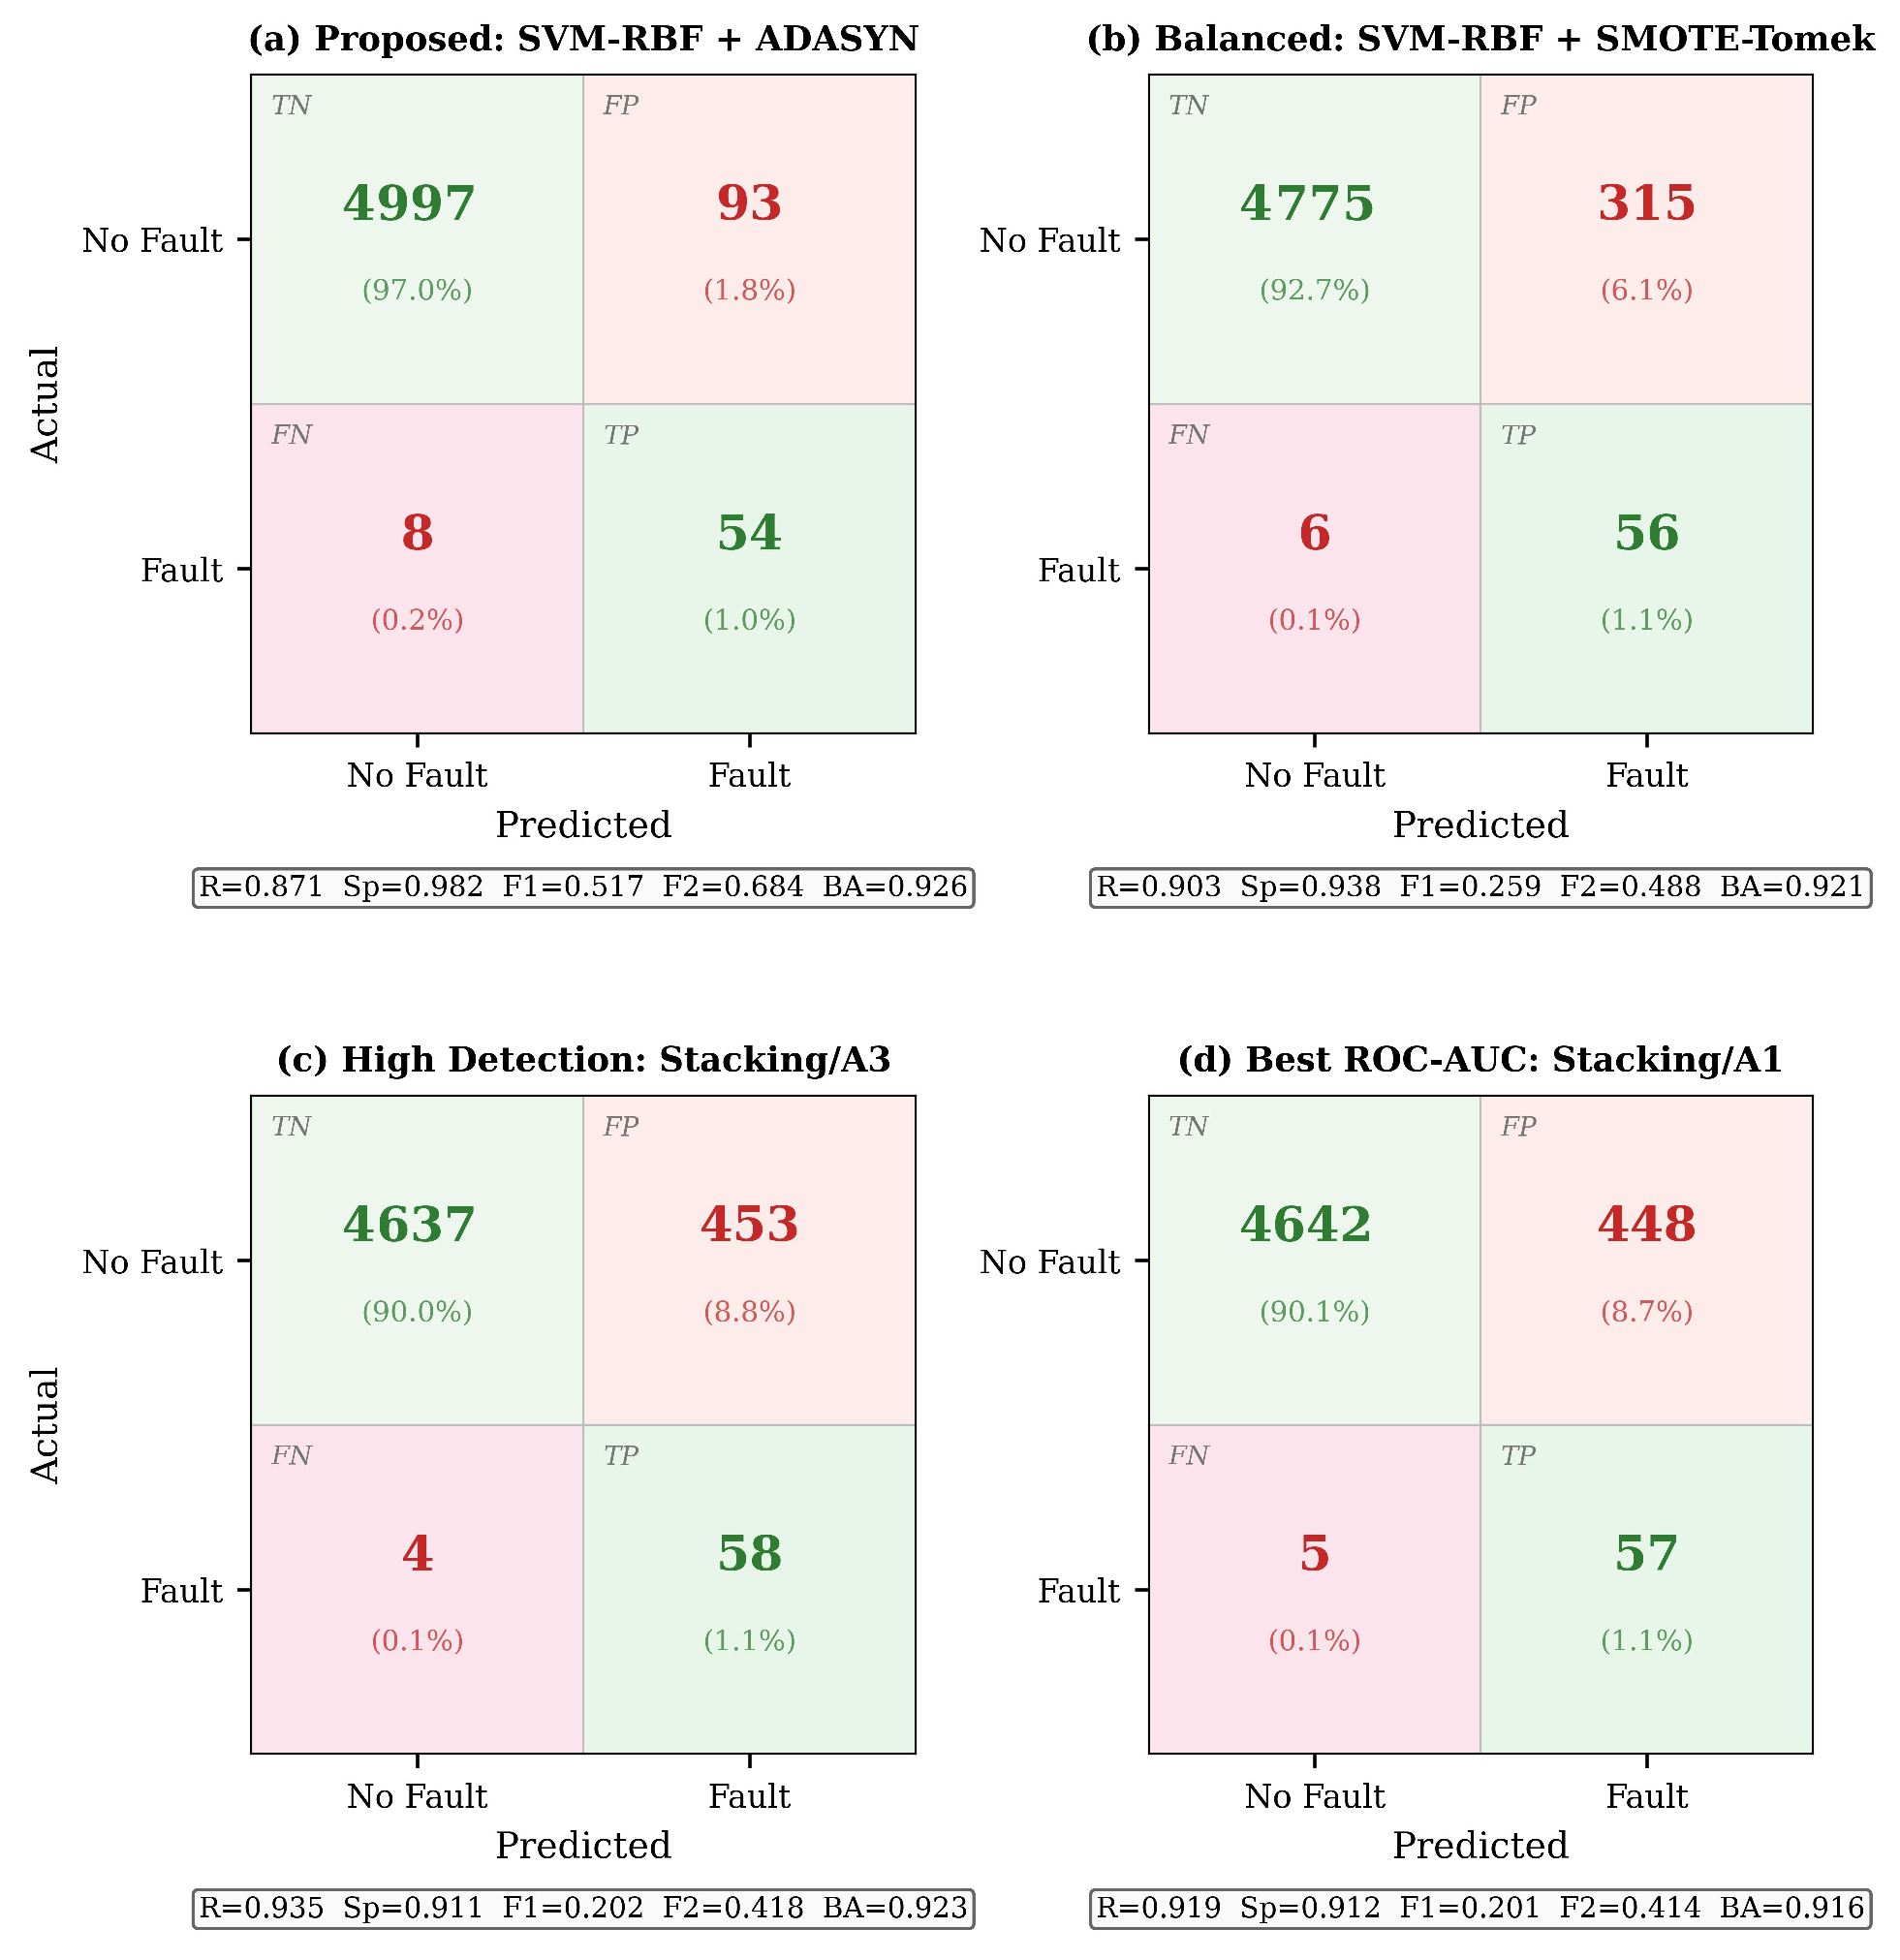
Confusion matrices for four operating points on the held-out test set.
Figure 10.
ROC and Precision–Recall curves for operating point models (Test Set: 5152 units). (a) ROC curves with AUC values; (b) Precision–Recall curves with PR-AUC values and baseline prevalence reference line.
The first operating point, designated as the recommended low-FPR configuration, was the individual SVM-RBF classifier trained with ADASYN. This configuration was selected as the primary recommendation because it achieved the lowest false-positive rate in the benchmark (FPR = 1.8%), correctly identifying 54 of 62 faulty units (recall = 0.871) while generating only 93 false alarms. Alternative operating points offering higher recall or higher ROC-AUC are presented below for facilities with different operational priorities. Its high specificity (0.982) leads to the highest score among all configurations (0.517), making it particularly suitable for environments with limited inspection capacity, where excessive false alarms would disrupt operations.
The second operating point, the balanced alternative, employs the same SVM-RBF architecture with SMOTE-Tomek augmentation. It improves the detection coverage (recall = 0.903, 56 of 62 faults detected) while maintaining a reasonable false-positive rate (FPR = 6.2%). This configuration provides a practical compromise between the detection performance and operational efficiency.
The third operating point maximizes fault detection using a stacking ensemble (ElasticNet with A3 selection on K-means-SMOTE data). It achieved the highest recall (0.935), detecting 58 of 62 faulty units, but at the cost of increased false positives (FPR = 8.9%). This configuration is preferable in high-risk scenarios, where missing a defective unit carries significant safety or financial consequences.
The fourth operating point focuses on the discrimination performance. A stacking ensemble (ElasticNet with A1 selection on undersampled data) achieved the highest ROC-AUC (0.975), indicating stable performance across threshold settings. At the selected threshold, 57 of 62 faulty units were detected (recall = 0.919) with a specificity of 0.912, making it suitable for adaptive deployment scenarios in which thresholds may be adjusted post-deployment.
Figure 9 illustrates the operational implications of these configurations. The proposed model exhibited a significantly smaller false-positive region, whereas the high-detection configuration minimized missed faults. Figure 10 further confirms that all the operating points outperform the baseline, with the stacking ensembles achieving slightly higher AUC values than the individual models. The availability of multiple operating points is a key strength of the proposed framework. Rather than prescribing a single optimal model, this approach enables practitioners to select configurations based on inspection capacity, risk tolerance, and operational constraints.
4.6. Statistical Validation
The Friedman test applied to cross-validation recall across the 22 models confirms statistically significant differences among resampling strategies (Table 13A). Full results across all metrics, including pairwise Wilcoxon tests with Bonferroni correction and effect sizes, are provided in Table 13.
Table 13.
Statistical validation of resampling strategy differences.
Pairwise comparisons show that both ADASYN and SMOTE-Tomek significantly outperform CTGAN, TVAE, and KMeans-SMOTE with large effect sizes. No significant difference is observed between ADASYN and SMOTE-Tomek, forming a homogeneous top-performing group. CTGAN is significantly outperformed by all strategies except the baseline. These findings confirm that resampling strategy selection has a statistically significant impact under extreme imbalance, and that traditional adaptive oversampling methods outperform deep generative approaches in this setting.
4.7. Feature Importance Analysis
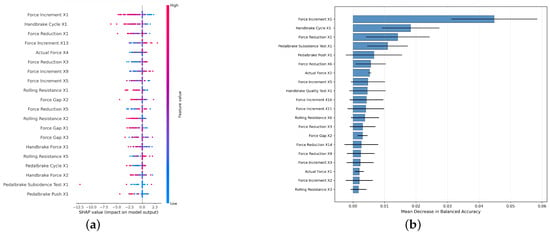
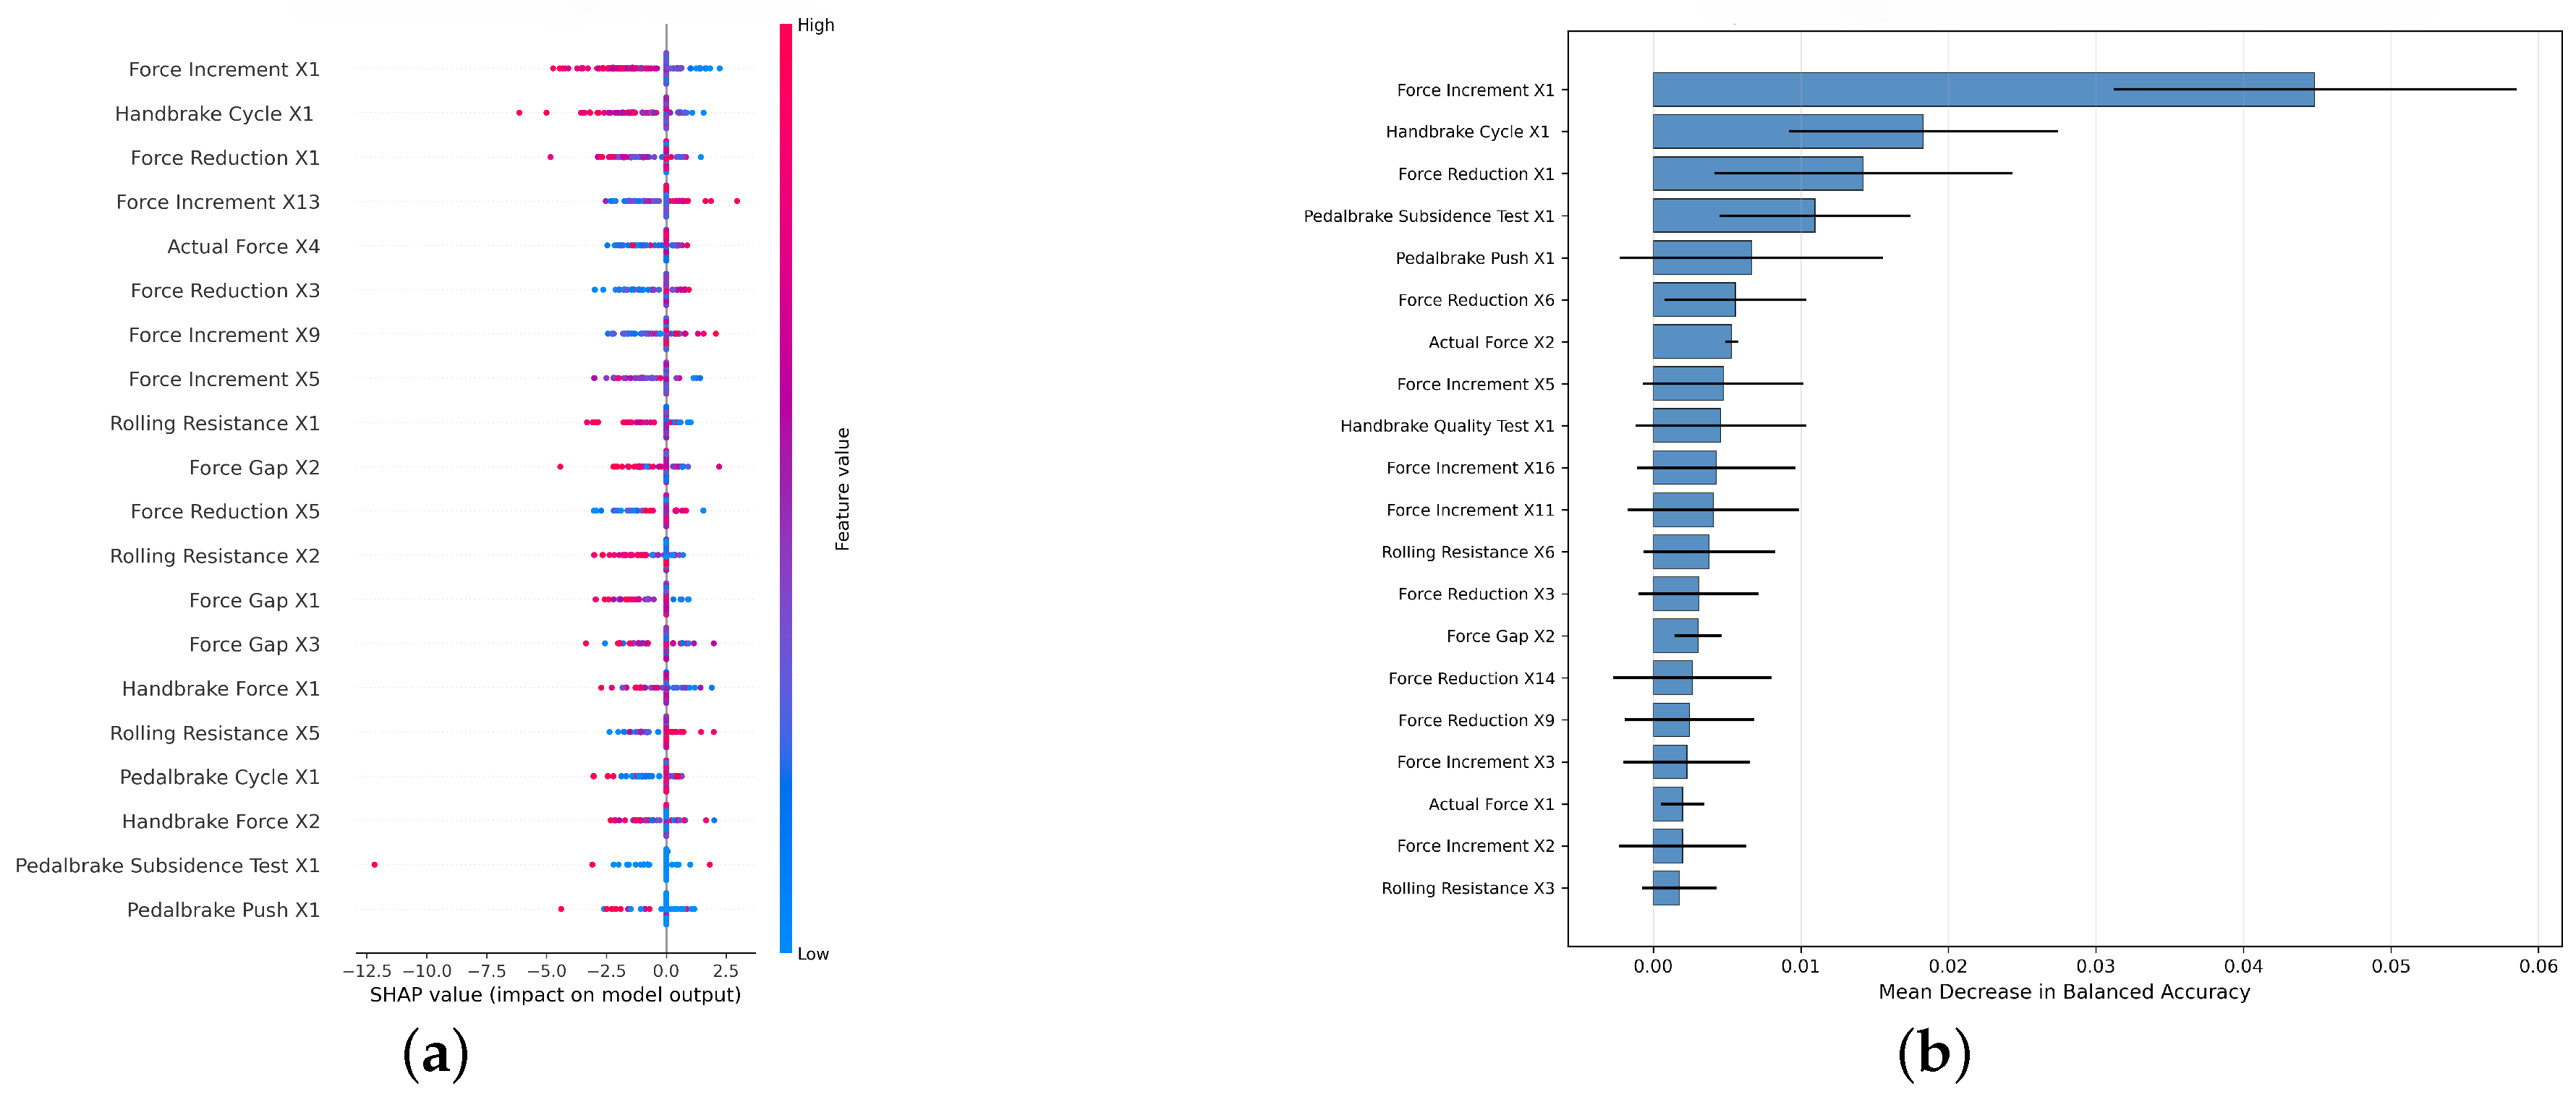
Feature importance is assessed using both permutation importance and SHAP for the proposed SVM-RBF model to identify predictors that are robust across different attribution mechanisms. Figure 11 presents the top-ranked features based on SHAP values. The most important feature is Force Increment X1, which captures the dynamic buildup of braking force during the initial phase of brake application at the Roller Test Station. This feature also ranks first under permutation importance, so it appears at the top under both attribution methods. Two additional features show consistent importance in both approaches: Force Reduction X1, representing force release dynamics, and Force Increment X5, reflecting force behavior at a later stage of braking. The consistent ranking of these features indicates that both the application and release phases of braking carry critical predictive signals for post-quality-gate failures.
Figure 11.
Feature importance analysis: (a) SHAP-based top 20 features for the proposed SVM-RBF model; (b) Permutation importance top 20 features for the proposed SVM-RBF model.
Both approaches identify the same key predictors, which suggests that these characteristics represent meaningful predictors rather than just a by-product of a single attribution method. From a system-level perspective, feature importance is distributed across multiple test stations. The Roller Test Station contributes the majority of top-ranked features, including all predictors consistently identified by both methods, highlighting the importance of dynamic braking behavior. The relevant predictors are also obtained from the Handbrake Test Station and the Brake Pedal Test Station; this demonstrates that static calibration parameters and driver interaction measurements also contribute to fault prediction. Since the results are not limited to a single measurement domain for predictive indicators, this highlights the importance of integrating heterogeneous production data.
Overall, these findings indicate that post-quality-gate failures show the strongest statistical association with subtle variations in dynamic force behavior, particularly during braking application and release phases, while also reflecting contributions from multiple subsystems. This supports the effectiveness of the multi-station data integration approach. It should be noted that SHAP and permutation importance measure statistical association between features and model predictions, not causal relationships. The identified features represent the strongest predictive signals in the dataset rather than confirmed physical causes of failure.
5. Discussion
5.1. Key Findings
The study revealed three key findings. First, traditional adaptive oversampling methods, particularly ADASYN, demonstrated significantly better performance than deep generative models (CTGAN, TVAE) under conditions of extreme imbalance. This was also validated using statistical tests. Second, the proposed SVM-RBF model achieves the best precision–recall trade-off, whereas the stacking ensembles provide alternative configurations that maximize the detection rate or threshold-independent discrimination. Third, post-quality-gate failure detection was performed using only data from the production line in operation, without the need to set up an additional detection infrastructure.
5.2. Implications for Industry 4.0 and Quality 4.0 Implementation
In a production batch of 5152 vehicles, the proposed model flags 147 units (2.9%), intercepting 87.1% of eventual failures. This represents a minimal inspection burden relative to its detection benefit. For high-risk scenarios, the high-detection configuration (Table 12) increases coverage to 93.5% at the cost of a higher inspection rate (9.9%). These results demonstrate that the framework supports flexible deployment depending on operational priorities.
5.3. Physical Interpretation and Comparison with Prior Work
Feature importance analysis identifies Force Increment X1 as the leading feature under both SHAP and permutation importance, with Force Reduction and Handbrake Test features also ranking highly, indicating that failures are statistically associated with dynamic force evolution patterns. The fact that top-ranked features come from multiple stations supports the multi-station integration approach. These findings align with prior work showing the effectiveness of SMOTE-based methods over generative models and extend them to a more extreme imbalance setting.
The component-level warranty analysis supports the feature importance findings. Front disc brake pad complaints, the most frequent defective component at 30.8% of component-identified claims, are mechanically linked to the Force Increment and Force Reduction features that dominate the importance rankings, as pad-disc friction dynamics directly govern force buildup and release behavior. Similarly, brake servo vacuum pipe failures align with the ABS–Brake Pressure features, while handbrake-related complaints correspond to the Handbrake Angle and Handbrake Force groups. The observation that noise, vibration, and faulty operation collectively account for over 46% of all complaint symptoms is consistent with the model’s reliance on dynamic force evolution patterns rather than static threshold violations.
The dominance of Force Increment X1 as the top predictor can be interpreted through brake dynamics principles. During the roller test, the brake caliper applies clamping force to the disc, and Force Increment measures the rate of force buildup during the initial phase of brake application. An unusual force increment profile may indicate irregular disc–pad contact caused by surface defects on the pad material, disc thickness variation, or disc runout, all of which affect the uniformity of the friction interface and can lead to field complaints such as vibration or reduced braking efficiency. Force Reduction X1, ranked third by both methods, captures the force release behavior when the brake pedal is released. Abnormal residual force during release is associated with caliper piston sticking, seal degradation, or hydraulic return path obstruction, conditions that may not trigger an end-of-line rejection but can produce progressive performance degradation during customer use. The presence of Handbrake Test features among the top predictors, particularly Handbrake Cycle X1, reflects the mechanical adjustment quality of the parking brake cable and lever mechanism; deviations in the force–travel relationship during handbrake cycling indicate improper cable tension or ratchet mechanism wear that may pass static acceptance criteria but fail under repeated field use.
5.4. Limitations
The study is based on a single production facility, limiting generalizability but ensuring real-world validity. The small number of positive samples constrains statistical power, although cross-validation mitigates this. Label uncertainty in negative samples remains an inherent limitation. Deep learning models were not considered in this study due to the extremely limited number of minority-class samples. Under such conditions, high-capacity models are prone to overfitting and unstable optimization, often leading to majority-class biased predictions. The warranty observation window is limited to one year or 10,000 km; a longer follow-up period could reveal additional failures and alter the observed class ratio. Despite the two-stage expert validation process for warranty labels, some residual contamination from non-manufacturing failure causes cannot be fully excluded, which may affect both recall and specificity estimates.
The dataset originates from a single manufacturing facility producing a single vehicle model family, which limits the generalizability of the findings to other production lines, vehicle platforms, or manufacturers. Differences in equipment calibration, supplier components, production volumes, and workforce practices across facilities may affect both the feature distributions and the failure patterns. Consequently, while the specific feature importance rankings and decision boundaries reported here are structurally optimized for this line’s sensor architecture, the underlying hybrid framework (resampling + stacking ensemble) remains methodologically transferable to other discrete manufacturing contexts with extreme class imbalance. The dataset was partitioned using random stratified splitting rather than temporal splitting. As a result, training and test samples may share similar production conditions such as batch effects, equipment calibration states, and seasonal environmental factors, potentially inflating performance estimates relative to a strictly temporal validation where the model is trained on earlier production periods and tested on later ones. Temporal validation would provide a more realistic assessment of deployment performance and is recommended for future work. The use of fixed generative model parameters without a dedicated hyperparameter search and the absence of standalone synthetic data quality evaluation (e.g., distribution fidelity tests, correlation preservation metrics) are limitations. However, the primary bottleneck was the limited minority-class sample size rather than the architectural configuration, as deep generative models require substantially larger populations to capture high-dimensional inter-feature dependencies. Future research should focus on multi-facility validation, integration of time-series data, adaptive threshold optimization, hyperparameter optimization of generative models, bootstrap-based confidence intervals, and online learning for continuous model updates. The choice of 1:9 as the undersampling ratio was not optimized through sensitivity analysis across alternative ratios (e.g., 1:5, 1:15), as each ratio would require retraining all 504 configurations. Exploring the effect of this ratio is left for future work. The proposed framework is not limited to brake systems; it can be extended to other automotive subsystems such as HVAC systems where multi-station production data can be linked with post-delivery warranty records.
6. Conclusions
This study presents a Quality 4.0 framework for detecting post-quality-gate rare failures in automotive brake manufacturing. Using a real-world dataset (1:82 imbalance), six resampling strategies and 24 models were systematically evaluated. Three main conclusions emerge. First, under extreme imbalance (1:82) with limited minority samples (n = 248), traditional adaptive oversampling (ADASYN) significantly outperforms deep generative approaches (Friedman = 67.84, p = 2.88 × ). Second, the proposed SVM-RBF model achieves strong performance (recall = 0.871, specificity = 0.982) with minimal false alarms, while stacking ensembles provide alternative configurations optimizing detection or discrimination. Third, feature importance analysis identifies dynamic force behavior across multiple stations as the strongest statistical predictor of failure, confirming the value of integrated production data. Beyond model comparison, the study demonstrates a deployable framework with multiple operating points, enabling practitioners to balance detection coverage and operational constraints. This provides a practical pathway for integrating predictive capability into Industry 4.0 quality systems.
These findings suggest that, in manufacturing settings with extreme class imbalance and fewer than 300 minority-class training samples, simple adaptive oversampling methods may be a more reliable option than complex generative approaches whose capacity to learn high-dimensional feature correlations is constrained by the available sample size.
Author Contributions
Conceptualization, M.H.Y. and H.B.S.; methodology, M.H.Y.; software, M.H.Y.; validation, M.H.Y.; formal analysis, M.H.Y.; investigation, M.H.Y.; data curation, M.H.Y.; writing—original draft preparation, M.H.Y.; writing—review and editing, H.B.S.; visualization, M.H.Y.; supervision, H.B.S. All authors have read and agreed to the published version of the manuscript.
Funding
Muhammed Hakan Yorulmuş and Hür Bersam Sidal are supported by Scientific Research Projects Department of Istanbul Technical University, project number: MDK-2020-42720.
Institutional Review Board Statement
Not applicable.
Data Availability Statement
The data used in this study were obtained from an industrial partner with formal permission within the scope of a research collaboration. Due to confidentiality agreements and proprietary restrictions, the data are not publicly available. Access to the data may be granted upon reasonable request, subject to approval by the data owner.
Acknowledgments
The authors would like to acknowledge a leading automotive manufacturer and relevant domain experts for their valuable support, collaboration, and for providing access to the dataset used in this research. During the preparation of this manuscript, the authors used AI-based tools (Anthropic Claude 4.5 Opus) for language editing and the generation of graphical figures. All outputs were carefully reviewed, validated, and refined by the authors, who take full responsibility for the content of this publication.
Conflicts of Interest
The authors declare no conflicts of interest.
Abbreviations
The following abbreviations are used in this manuscript:
| ABS | Anti-lock Braking System |
| ADASYN | Adaptive Synthetic Sampling |
| AUC | Area Under the Curve |
| Bal. Acc. | Balanced Accuracy |
| CIS | Chassis Integration System |
| CPS | Cyber–Physical Systems |
| CTGAN | Conditional Tabular Generative Adversarial Network |
| CV | Cross-Validation |
| GAN | Generative Adversarial Network |
| IoT | Internet of Things |
| KMeans-SMOTE | K-Means Synthetic Minority Oversampling Technique |
| LightGBM | Light Gradient Boosting Machine |
| MES | Manufacturing Execution System |
| OOF | Out-of-Fold |
| PLC | Programmable Logic Controller |
| PR-AUC | Area Under the Precision–Recall Curve |
| RUSBoost | Random Undersampling Boosting |
| SCADA | Supervisory Control and Data Acquisition |
| SMOTE | Synthetic Minority Oversampling Technique |
| SMOTE-Tomek | Synthetic Minority Oversampling Technique with Tomek Links |
| SPC | Statistical Process Control |
| SVM | Support Vector Machine |
| TPE | Tree-structured Parzen Estimator |
| TQM | Total Quality Management |
| TVAE | Tabular Variational Autoencoder |
| VAE | Variational Autoencoder |
| VIN | Vehicle Identification Number |
| XGBoost | Extreme Gradient Boosting |
References
- Ahuett-Garza, H.; Kurfess, T. A brief discussion on the trends of habilitating technologies for Industry 4.0 and Smart manufacturing. Manuf. Lett. 2018, 15, 60–63. [Google Scholar] [CrossRef] [Scilit]
- Sisodia, R.; Villegas Forero, D. Quality 4.0—How to Handle Quality in the Industry 4.0 Revolution. Master’s Thesis, Chalmers University of Technology, Gothenburg, Sweden, 2019. Available online: https://odr.chalmers.se/items/92cf2cde-d03d-4361-baee-960a586d8596 (accessed on 11 June 2026).
- Liu, H.C.; Liu, R.; Gu, X.; Yang, M. From total quality management to Quality 4.0: A systematic literature review and future research agenda. Front. Eng. Manag. 2023, 10, 191–205. [Google Scholar] [CrossRef] [Scilit]
- Mahale, Y.; Kolhar, S.; More, A.S. Enhancing predictive maintenance in automotive industry: Addressing class imbalance using advanced machine learning techniques. Discov. Appl. Sci. 2025, 7, 340. [Google Scholar] [CrossRef] [Scilit]
- Zhou, B.; Zhou, Q.; Li, Z. Addressing data imbalance in crash data: Evaluating generative adversarial network’s efficacy against conventional methods. IEEE Access 2024, 13, 2929–2944. [Google Scholar] [CrossRef] [Scilit]
- Bae, W.D.; Alkobaisi, S.; Horak, M.; Bankar, S.; Bhuvaji, S.; Kim, S.; Park, C.S. Synthetic data generation and evaluation techniques for classifiers in data starved medical applications. IEEE Access 2025, 13, 16584–16602. [Google Scholar] [CrossRef] [Scilit]
- Majeed, A.; Hwang, S.O. CTGAN-MOS: Conditional generative adversarial network based minority-class-augmented oversampling scheme for imbalanced problems. IEEE Access 2023, 11, 85878–85899. [Google Scholar] [CrossRef] [Scilit]
- Gurcan, F.; Soylu, A. Learning from imbalanced data: Integration of advanced resampling techniques and machine learning models for enhanced cancer diagnosis and prognosis. Cancers 2024, 16, 3417. [Google Scholar] [CrossRef] [Scilit] [PubMed]
- Zhang, M.; Wang, Y.; Hung, J.L.; Wang, J.; Duan, C. An early warning method based on blending of deep generative model and oversampling model for online learning. IEEE Access 2025, 13, 72248–72268. [Google Scholar] [CrossRef] [Scilit]
- Dorbane, A.; Harrou, F.; Sun, Y. Enhancing defect detection in steel plate manufacturing with explainable machine learning and SMOTE for imbalanced data. J. Mater. Eng. Perform. 2025, 34, 9212–9233. [Google Scholar] [CrossRef] [Scilit]
- Fan, S.K.S.; Tsai, D.M.; Yeh, P.C. Effective variational-autoencoder-based generative models for highly imbalanced fault detection data in semiconductor manufacturing. IEEE Trans. Semicond. Manuf. 2023, 36, 205–214. [Google Scholar] [CrossRef] [Scilit]
- Chatterjee, S.; Byun, Y.C. Highly imbalanced fault classification of wind turbines using data resampling and hybrid ensemble method approach. Eng. Appl. Artif. Intell. 2023, 126, 107104. [Google Scholar] [CrossRef] [Scilit]
- Yorulmuş, M.H.; Bolat, H.B.; Bahadır, Ç. Predictive quality defect detection using machine learning algorithms: A case study from automobile industry. In Intelligent and Fuzzy Techniques for Emerging Conditions and Digital Transformation (INFUS 2021); Lecture Notes in Networks and Systems; Springer: Cham, Switzerland, 2021; Volume 307, pp. 263–270. [Google Scholar]
- Dai, W.; Cai, C.; Sun, X.; Long, L.; Lin, B. A framework of balanced conditional flow matching and domain-aware classification for imbalanced automotive welding defect inspection. J. Manuf. Process. 2026, 162, 347–359. [Google Scholar] [CrossRef] [Scilit]
- Park, S.; Kim, K.; Kim, H. Prediction of highly imbalanced semiconductor chip-level defects using uncertainty-based adaptive margin learning. IISE Trans. 2022, 55, 147–155. [Google Scholar] [CrossRef] [Scilit]
- Luo, F.; Xia, T.; Li, Y.; Li, R.; Si, G.; Pan, E.; Xi, L. Imbalanced industrial data-oriented fault detection for valves in reciprocating pumps based on weighted downsampling strategy and multi-scale convolutional neural networks. Measurement 2025, 257, 118959. [Google Scholar]
- Altalhan, M.; Algarni, A.; Alouane, M.T.H. Imbalanced data problem in machine learning: A review. IEEE Access 2025, 13, 13686–13699. [Google Scholar] [CrossRef] [Scilit]
- Rydzi, S.; Zahradnikova, B.; Sutova, Z.; Ravas, M.; Hornacek, D.; Tanuska, P. A predictive quality inspection framework for the manufacturing process in the context of industry 4.0. Sensors 2024, 24, 5644. [Google Scholar] [CrossRef] [Scilit] [PubMed]
- Beikmohammadi, A.; Hamian, M.H.; Khoeyniha, N.; Lindgren, T.; Steinert, O.; Magnússon, S. A cost-sensitive transformer model for prognostics under highly imbalanced industrial data. arXiv 2024, arXiv:2402.08611. [Google Scholar]
- Syed, M.N.; Hassan, M.R.; Ahmad, I.; Hassan, M.M.; De Albuquerque, V.H.C. A novel linear classifier for class imbalance data arising in failure-prone air pressure systems. IEEE Access 2020, 9, 4211–4222. [Google Scholar] [CrossRef] [Scilit]
- Kharazian, Z.; Lindgren, T.; Magnússon, S.; Steinert, O.; Andersson Reyna, O. SCANIA component X dataset: A real-world multivariate time series dataset for predictive maintenance. Sci. Data 2025, 12, 493. [Google Scholar] [CrossRef] [Scilit] [PubMed]
- Mangal, A.; Kumar, N. Using big data to enhance the bosch production line performance: A kaggle challenge. In Proceedings of the 2016 IEEE International Conference on Big Data; IEEE: New York, NY, USA, 2016; pp. 2029–2035. [Google Scholar]
- Srisailam, S.; Mandal, P.; Aditya, K.L.; Pankajakshan, P.; Rajamani, K.T. Fault Detection in Semiconductor Manufacturing Using Advanced Machine Learning Techniques with Interpretability. In Proceedings of the International Conference on Advanced Network Technologies and Intelligent Computing; Springer: Berlin/Heidelberg, Germany, 2024; pp. 98–123. [Google Scholar]
- Yang, X.; Zhang, Q.; Bao, J.; Wang, X.; Wu, N.; Tao, Q.; Wu, H.; Liu, L. Predicting Car-Engine Manufacturing Quality with Multi-Sensor Data of Manufacturing Assembly Process. Sensors 2026, 26, 1651. [Google Scholar] [CrossRef] [Scilit] [PubMed]
- Xiao, X.; Li, C.; He, H.; Huang, J.; Yu, T. Rotating machinery fault diagnosis method based on multi-level fusion framework of multi-sensor information. Inf. Fusion 2025, 113, 102621. [Google Scholar] [CrossRef] [Scilit]
- Ma, L.; Yang, Q.; Peng, K. A unified representation and fusion framework of multi-source heterogeneous data for fault diagnosis in industrial processes. Adv. Eng. Inform. 2025, 67, 103539. [Google Scholar] [CrossRef] [Scilit]
- Peng, X.; Wang, L.; Li, Y.; Bao, Q.; Wang, Q. A Data-Softmax-LightGBM based fault diagnosis approach for metal additive manufacturing circulation filtration systems. Measurement 2025, 254, 117900. [Google Scholar] [CrossRef] [Scilit]
- Gawde, S.; Patil, S.; Kumar, S.; Kotecha, K. A scoping review on multi-fault diagnosis of industrial rotating machines using multi-sensor data fusion. Artif. Intell. Rev. 2023, 56, 4711–4764. [Google Scholar]
- Li, Y.; Jiang, W.; Shi, Z.; Yang, C. A soft sensor model of sintering process quality index based on multi-source data fusion. Sensors 2023, 23, 4954. [Google Scholar] [CrossRef] [Scilit] [PubMed]
- Gupta, S.K.; Chattopadhyay, G. Early detection of reliability related problems from two-dimensional warranty data considering labour code priority index. Reliab. Eng. Syst. Saf. 2022, 225, 108588. [Google Scholar] [CrossRef] [Scilit]
- Chawla, N.V.; Bowyer, K.W.; Hall, L.O.; Kegelmeyer, W.P. SMOTE: Synthetic minority over-sampling technique. J. Artif. Intell. Res. 2002, 16, 321–357. [Google Scholar] [CrossRef] [Scilit]
- He, H.; Garcia, E.A. Learning from imbalanced data. IEEE Trans. Knowl. Data Eng. 2009, 21, 1263–1284. [Google Scholar] [CrossRef] [Scilit]
- Ren, Z.; Lin, T.; Feng, K.; Zhu, Y.; Liu, Z.; Yan, K. A systematic review on imbalanced learning methods in intelligent fault diagnosis. IEEE Trans. Instrum. Meas. 2023, 72, 3508535. [Google Scholar] [CrossRef] [Scilit]
- Carvalho, M.; Pinho, A.J.; Brás, S. Resampling approaches to handle class imbalance: A review from a data perspective. J. Big Data 2025, 12, 71. [Google Scholar] [CrossRef] [Scilit]
- Yadav, S.; Joshi, D.; Mulye, S.; Udmale, S.S.; Bhole, G.P. SMOTEHashBoost: Ensemble Algorithm for Imbalanced Dataset Pattern Classification. IEEE Access 2025, 13, 58092–58107. [Google Scholar] [CrossRef] [Scilit]
- Yadav, S.; Joshi, D.; Mulye, S.; Asari, L.; Udmale, S.S.; Bhole, G.P. CSRBoost: Clustered Sampling with Resampling Boosting for Imbalanced Dataset Pattern Classification. IEEE Access 2025, 13, 175078–175093. [Google Scholar] [CrossRef] [Scilit]
- Chen, W.; Yang, K.; Yu, Z.; Shi, Y.; Chen, C.P. A survey on imbalanced learning: Latest research, applications and future directions. Artif. Intell. Rev. 2024, 57, 137. [Google Scholar] [CrossRef] [Scilit]
- Goodfellow, I.J.; Pouget-Abadie, J.; Mirza, M.; Xu, B.; Warde-Farley, D.; Ozair, S.; Courville, A.; Bengio, Y. Generative adversarial nets. Adv. Neural Inf. Process. Syst. 2014, 27, 2672–2680. [Google Scholar]
- Sauber-Cole, R.; Khoshgoftaar, T.M. The use of generative adversarial networks to alleviate class imbalance in tabular data: A survey. J. Big Data 2022, 9, 98. [Google Scholar] [CrossRef] [Scilit]
- Engelmann, J.; Lessmann, S. Conditional Wasserstein GAN-based oversampling of tabular data for imbalanced learning. Expert Syst. Appl. 2021, 174, 114582. [Google Scholar] [CrossRef] [Scilit]
- Won, D.H.; Shin, K.S.; Youm, S. Synthetic Data Augmentation for Imbalanced Tabular Data: A Comparative Study of Generation Methods. Electronics 2026, 15, 883. [Google Scholar] [CrossRef] [Scilit]
- Tang, J.; Li, Y.; Hou, Z.; Fu, S.; Tian, Y. Robust two-stage instance-level cost-sensitive learning method for class imbalance problem. Knowl.-Based Syst. 2024, 300, 112143. [Google Scholar] [CrossRef] [Scilit]
- Cao, Y.; Jia, M.; Zhao, X.; Yan, X.; Feng, K. Cost-sensitive learning considering label and feature distribution consistency: A novel perspective for health prognosis of rotating machinery with imbalanced data. Expert Syst. Appl. 2024, 250, 123930. [Google Scholar] [CrossRef] [Scilit]
- Seiffert, C.; Khoshgoftaar, T.M.; Van Hulse, J.; Napolitano, A. RUSBoost: A hybrid approach to alleviating class imbalance. IEEE Trans. Syst. Man-Cybern.-Part Syst. Hum. 2009, 40, 185–197. [Google Scholar] [CrossRef] [Scilit]
- Shih, M.S.; Chen, J.C.; Chen, T.L.; Hsu, C.L. Two-phase cost-sensitive-learning-based framework on customer-side quality inspection for TFT-LCD industry. J. Intell. Manuf. 2025, 36, 4251–4267. [Google Scholar]
- Chen, H.C.; Zhang, Y. Dissolved gas analysis using knowledge-filtered oversampling-based diverse stack learning. IEEE Trans. Instrum. Meas. 2025, 74, 2505211. [Google Scholar] [CrossRef] [Scilit]
- Xu, Y.; Li, S.; Yan, X.; He, J.; Ni, Q.; Sun, Y.; Wang, Y. Multiattention-based feature aggregation convolutional networks with dual focal loss for fault diagnosis of rotating machinery under data imbalance conditions. IEEE Trans. Instrum. Meas. 2024, 73, 3506211. [Google Scholar] [CrossRef] [Scilit]
- Hou, S.; Liu, Y.; Yang, Q. Real-time prediction of rock mass classification based on TBM operation big data and stacking technique of ensemble learning. J. Rock Mech. Geotech. Eng. 2022, 14, 123–143. [Google Scholar] [CrossRef] [Scilit]
- Tian, C.; Li, R. Predicting Bond Defaults in China: A Double-Ensemble Model Leveraging SMOTE for Class Imbalance. Big Data Cogn. Comput. 2026, 10, 81. [Google Scholar] [CrossRef] [Scilit]
- Waqar, M.; Kim, Y.W.; Byun, Y.C. A stacking ensemble framework leveraging synthetic data for accurate and stable crop yield forecasting. IEEE Access 2025, 13, 136909–136926. [Google Scholar] [CrossRef] [Scilit]
- ISO 9001:2015; Quality Management Systems—Requirements. International Organization for Standardization: Geneva, Switzerland, 2015.
- IATF 16949:2016; Quality Management System Requirements for Automotive Production and Relevant Service Parts Organizations. International Automotive Task Force: Southfield, MI, USA, 2016.
- Xu, L.; Skoularidou, M.; Cuesta-Infante, A.; Veeramachaneni, K. Modeling tabular data using conditional gan. Adv. Neural Inf. Process. Syst. 2019, 32, 7335–7345. [Google Scholar]

Disclaimer/Publisher’s Note: The statements, opinions and data contained in all publications are solely those of the individual author(s) and contributor(s) and not of MDPI and/or the editor(s). MDPI and/or the editor(s) disclaim responsibility for any injury to people or property resulting from any ideas, methods, instructions or products referred to in the content. |
© 2026 by the authors. Published by MDPI on behalf of the International Institute of Knowledge Innovation and Invention. Licensee MDPI, Basel, Switzerland. This article is an open access article distributed under the terms and conditions of the Creative Commons Attribution (CC BY) license.