


Abstract
This study investigated how gifted and regular high school students employ different cognitive strategies and integrate information during scientific problem solving, using eye-tracking techniques. Eighteen multiple-choice items were selected from the Investigating Scientific Thinking and Reasoning (iSTAR) assessment developed at The Ohio State University, including nine text-only questions (tMCQs) and nine picture-embedded questions (pMCQs). The items were chosen to ensure clear spatial separation among text, image, and answer areas, allowing reliable region-based eye-movement analysis. Eye-tracking data were analyzed using two indices: fixation time ratio (FTR), reflecting relative attention allocation, and saccade count ratio (SCR), capturing cross-region information integration. The results revealed clear group differences. Gifted students devoted a larger proportion of attention to pictorial information (0.38 vs. 0.32) and showed more frequent transitions between picture and answer regions (0.15 vs. 0.12), indicating more integrative processing and mental model construction. In contrast, regular students spent more time focusing on textual regions and exhibited higher within-text saccade activity, consistent with a direct translation strategy. Furthermore, SCR-based machine learning classification using a Random Forest model demonstrated meaningful discriminative capability between the two groups, particularly for picture-embedded questions, achieving an accuracy of 77.5%. Overall, the findings provide empirical evidence that question format influences students’ cognitive strategies during scientific reasoning. Methodologically, this study combines a validated reasoning assessment, a carefully defined ROI-based eye-tracking design, and interpretable behavioral indicators, offering practical implications for differentiated science instruction.
1. Introduction
In recent years, science education has increasingly emphasized the development of students’ scientific thinking [1] rather than the simple transmission of factual knowledge [2,3]. Skills such as critical reasoning, knowledge application, and problem solving are now widely regarded as central learning outcomes [4,5]. Within this context, differences in students’ problem-solving performance are often closely linked to how problems are internally represented and processed [6].
According to Mayer’s cognitive problem-solving framework [6,7], effective problem solving depends on the construction of an appropriate mental representation that goes beyond the literal surface features of a problem. Learners must reorganize textual and visual information into a coherent mental model that captures the underlying structure of the task [8]. Prior research has consistently shown that students with different ability levels adopt markedly different representational strategies. For instance, studies by Hegarty et al. [9] demonstrated that less successful problem solvers—similar to the regular student group examined in this study—often rely on a direct translation strategy. These learners tend to focus heavily on keywords or numerical values in the text and attempt to map them directly onto solution procedures, frequently overlooking the deeper conceptual relationships embedded in the problem. In contrast, higher-ability learners and domain experts devote more cognitive resources to integrating information across representations, aiming to construct a structured and meaningful mental model [6]. This integrative process often involves coordinated attention to both textual and pictorial information, with gaze shifting flexibly across modalities to support conceptual understanding [10].
Identifying observable indicators that distinguish these representational strategies is therefore essential for advancing research on scientific reasoning. In particular, differences in how learners allocate visual attention and transition between information regions may provide valuable insight into the cognitive mechanisms underlying problem representation [11,12]. At the same time, such behavioral patterns may also reflect individual differences in reading ability, familiarity with visual representations, or test-taking habits. Taken together, these factors suggest that a nuanced analysis of visual attention can contribute to a more refined understanding of students’ learning processes and inform differentiated instructional approaches.
Eye tracking has become an important methodological tool for investigating these issues in educational research [13]. As a non-invasive technique, it allows researchers to capture learners’ moment-to-moment visual attention during problem solving by analyzing fixations [14], saccades [15], and gaze trajectories [16]. Unlike retrospective reports or outcome-based measures, eye tracking provides direct temporal evidence of how learners attend to, prioritize, and integrate information as they engage with complex tasks [17]. In science education, this approach has been particularly useful for distinguishing novice and expert strategies, revealing differences in how learners process textual explanations, interpret diagrams, and coordinate multiple sources of information.
Despite its potential, relatively few studies have used eye tracking to directly compare gifted and regular students across problem types that differ in representational format. Existing research often examines general eye-movement characteristics or focuses on a single task type, without systematically analyzing transitions between distinct regions of interest (ROIs) containing different kinds of information. Many studies rely primarily on global metrics such as total fixation count or mean fixation duration [17,18,19], which provide limited insight into how learners integrate information across text, images, and answer options during problem solving.
The present study addresses this gap by examining how students with different cognitive profiles engage with scientific multiple-choice questions that vary in representational structure. Using the iSTAR (Investigating Scientific Thinking and Reasoning) framework developed at The Ohio State University, this study incorporates both text-only multiple-choice questions (tMCQs) and picture-embedded multiple-choice questions (pMCQs). By defining spatially distinct ROIs for text, images, and answer options, the study investigates how gifted and regular students differ in their processing of textual and pictorial information and how these differences are reflected in measurable visual-attention patterns [6,9].
Specifically, the study pursues three objectives: (1) to identify group differences in fixation- and saccade-based attention across predefined information regions; (2) to examine how question format influences information-integration strategies; and (3) to interpret these visual-attention patterns in relation to established models of problem representation and mental-model construction. Grounded in prior research on cognitive strategy differentiation [6,9], the study adopts a coherent design that aligns the selected iSTAR items, ROI definitions, and eye-movement metrics with the underlying theoretical framework.
2. Materials and Methods
2.1. The System Architecture for Eye-Tracking Recording During Students’ Problem-Solving State
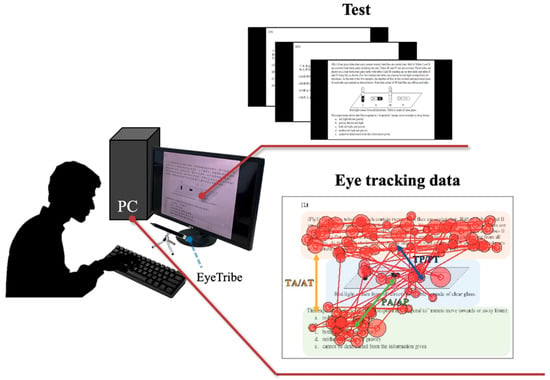
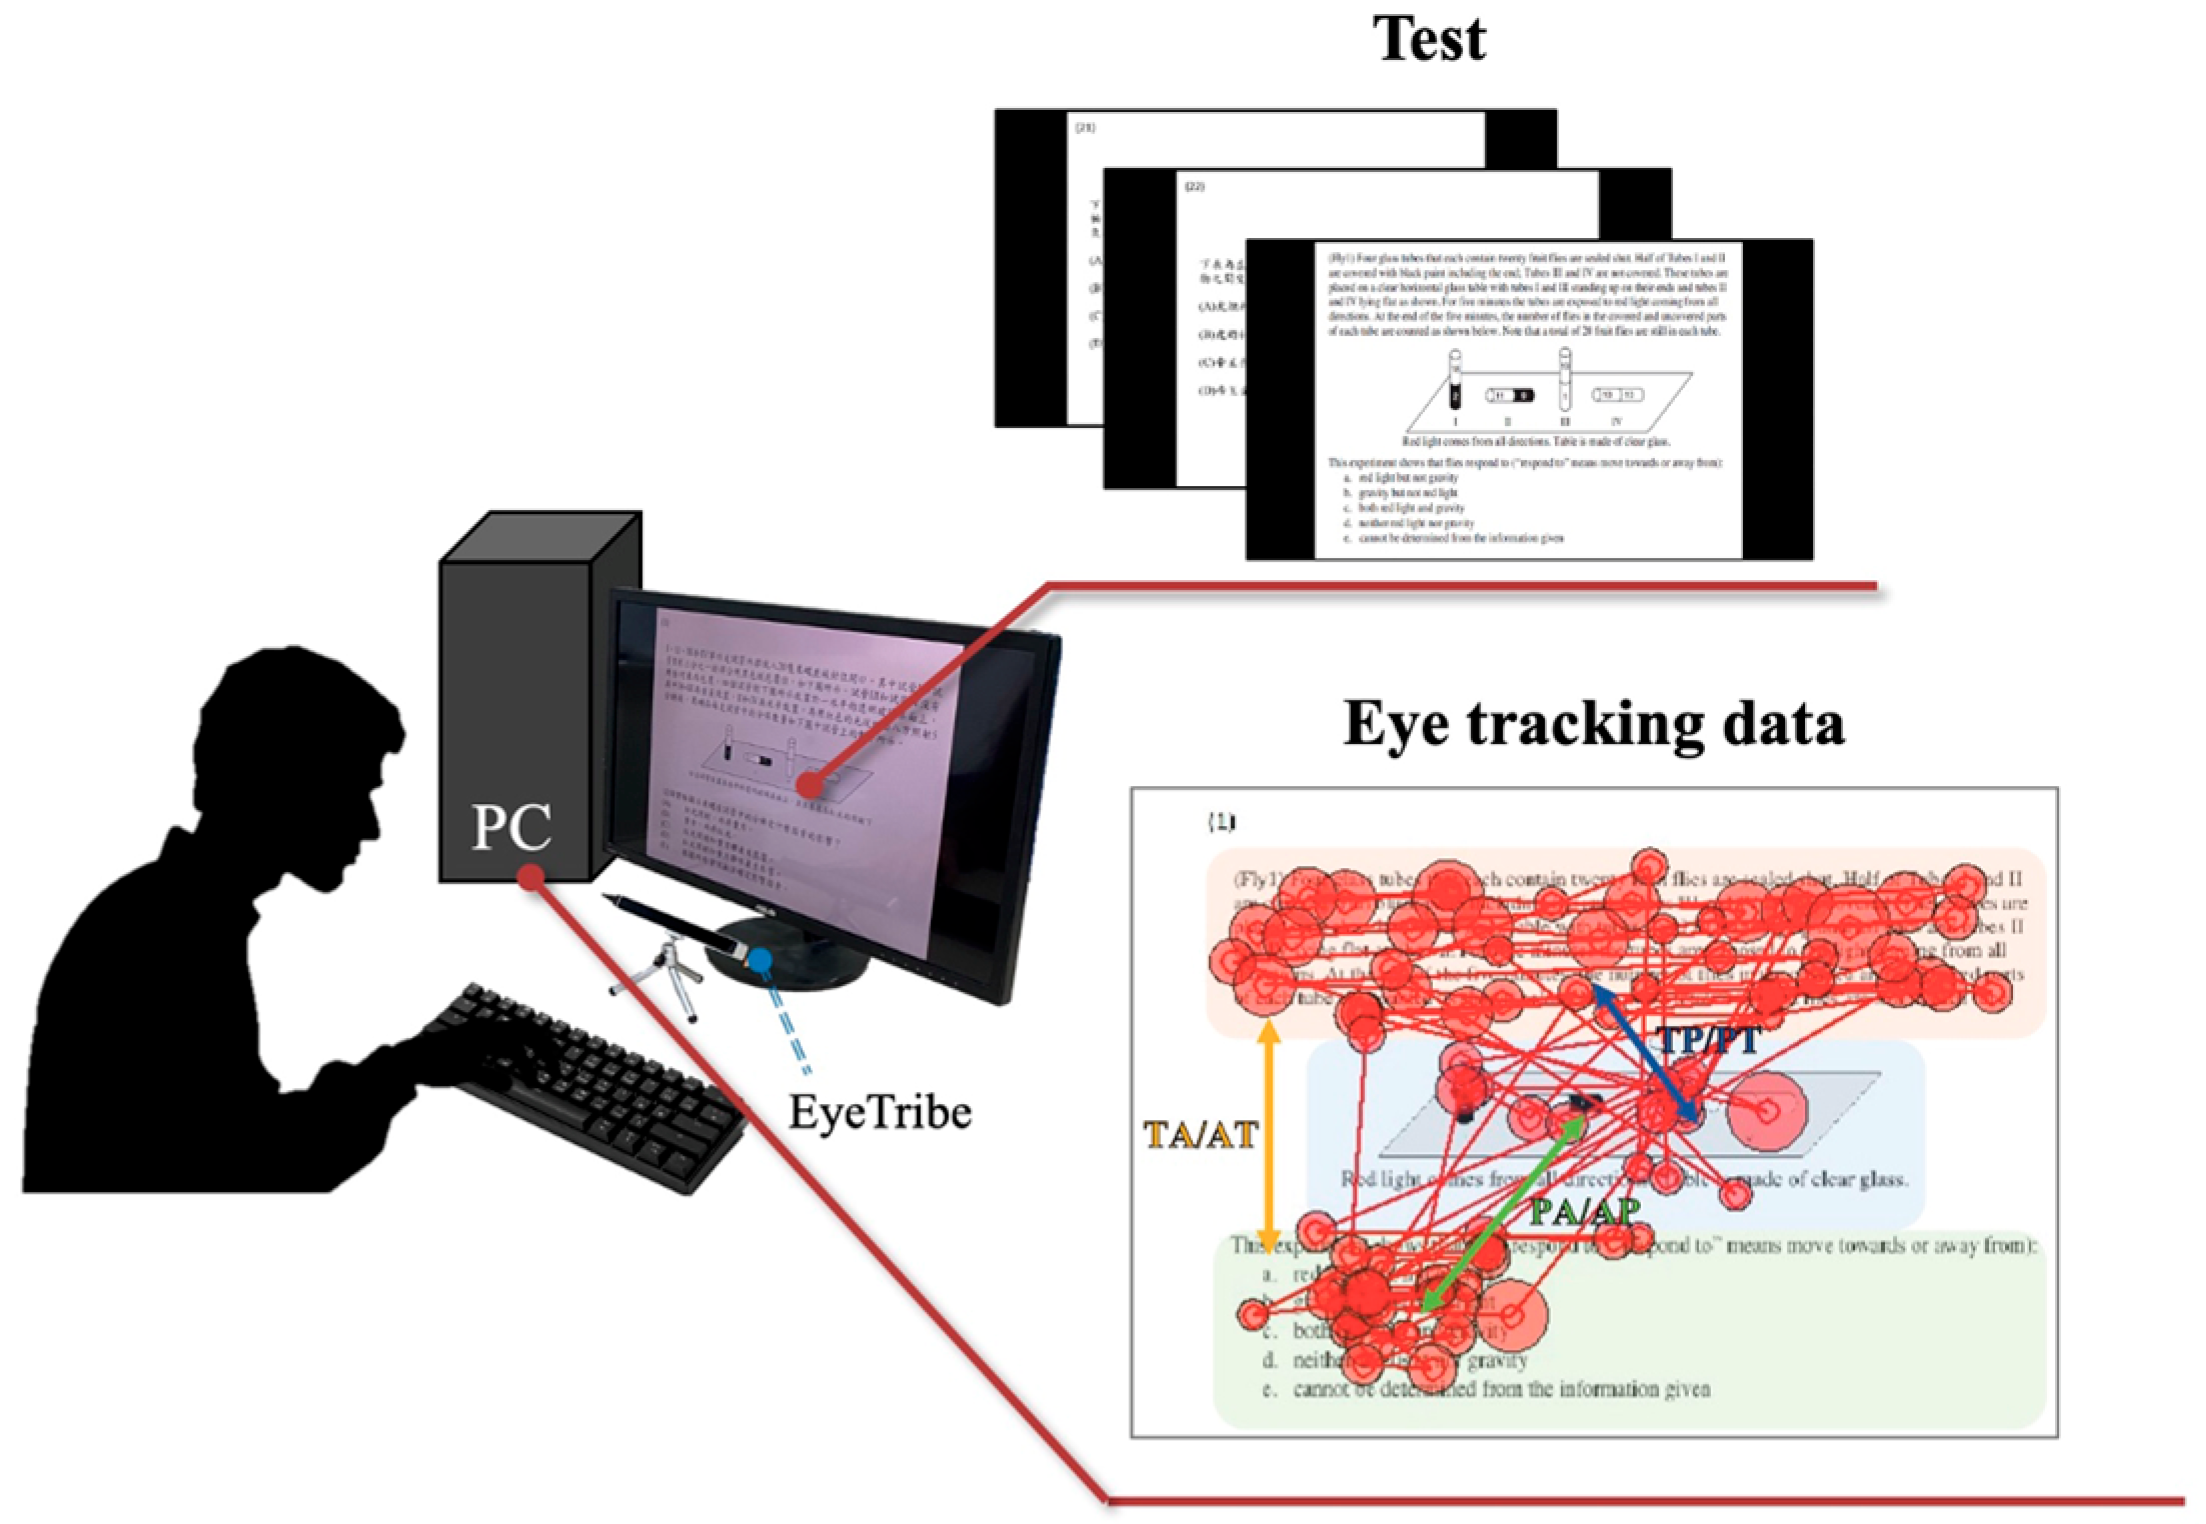
To investigate students’ visual attention patterns during scientific reasoning, this study employed an eye-tracking system to measure and compare the problem-solving strategies of gifted and regular high school students. The primary objective was to capture detailed, real-time data on how participants visually interacted with different types of information—such as text, diagrams, and answer options—while solving structured multiple-choice science questions. As illustrated in Figure 1, the experimental setup consisted of an EyeTribe eye-tracking device (The EyeTribe Co., Copenhagen, Denmark), a 28-inch LCD monitor (1920 × 1080 resolution, 60 Hz refresh rate; Asustek Computer Inc., Taipei, Taiwan) and a standard PC with a mouse interface for student responses. The eye-tracking system has a spatial accuracy of approximately 0.5° to 1.0° of visual angle, according to manufacturer specifications. During the calibration procedure, the system computed the user’s gaze coordinates within this accuracy range. Given a standard viewing distance of approximately 60 cm, this corresponds to an on-screen average error of 0.5 to 1.0 cm. This level of precision ensured that gaze points could be reliably assigned to predefined regions of interest (ROIs) and supported the validity of fixation-based indicators such as fixation time ratio (FTR) and saccade count ratio (SCR) used in the analysis. To ensure data quality and minimize the inclusion of non-informative glances or artifacts, a minimum fixation duration threshold of 200 milliseconds was applied, consistent with conventions in cognitive and educational eye-tracking research.
Figure 1.
System architecture of the eye-tracking measurement.
2.2. Experiment Protocol and Subjects
This research involved 38 first-year high school students (18 males and 20 females) with an average age of 15.5 ± 0.51, from Mingdao High School in Taichung, Taiwan. Among the 38 students, 20 students were classified as gifted, having achieved percentile ranks (PR) exceeding 95 in their entrance examinations, while the remaining 18 were categorized as regular students, with their PRs ranging from 40 to 60. Ensuring comprehensive inclusion criteria, all participants were free from neurological or psychological disorders (such as epilepsy, autism, schizophrenia, Attention Deficit Hyperactivity Disorder, Tourette’s syndrome, etc.) and had no significant visual impairments (e.g., cataracts, strabismus). To maintain consistency in the study, both gifted and regular students were subjected to identical experimental conditions.
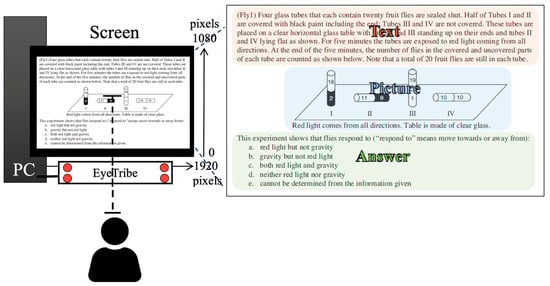
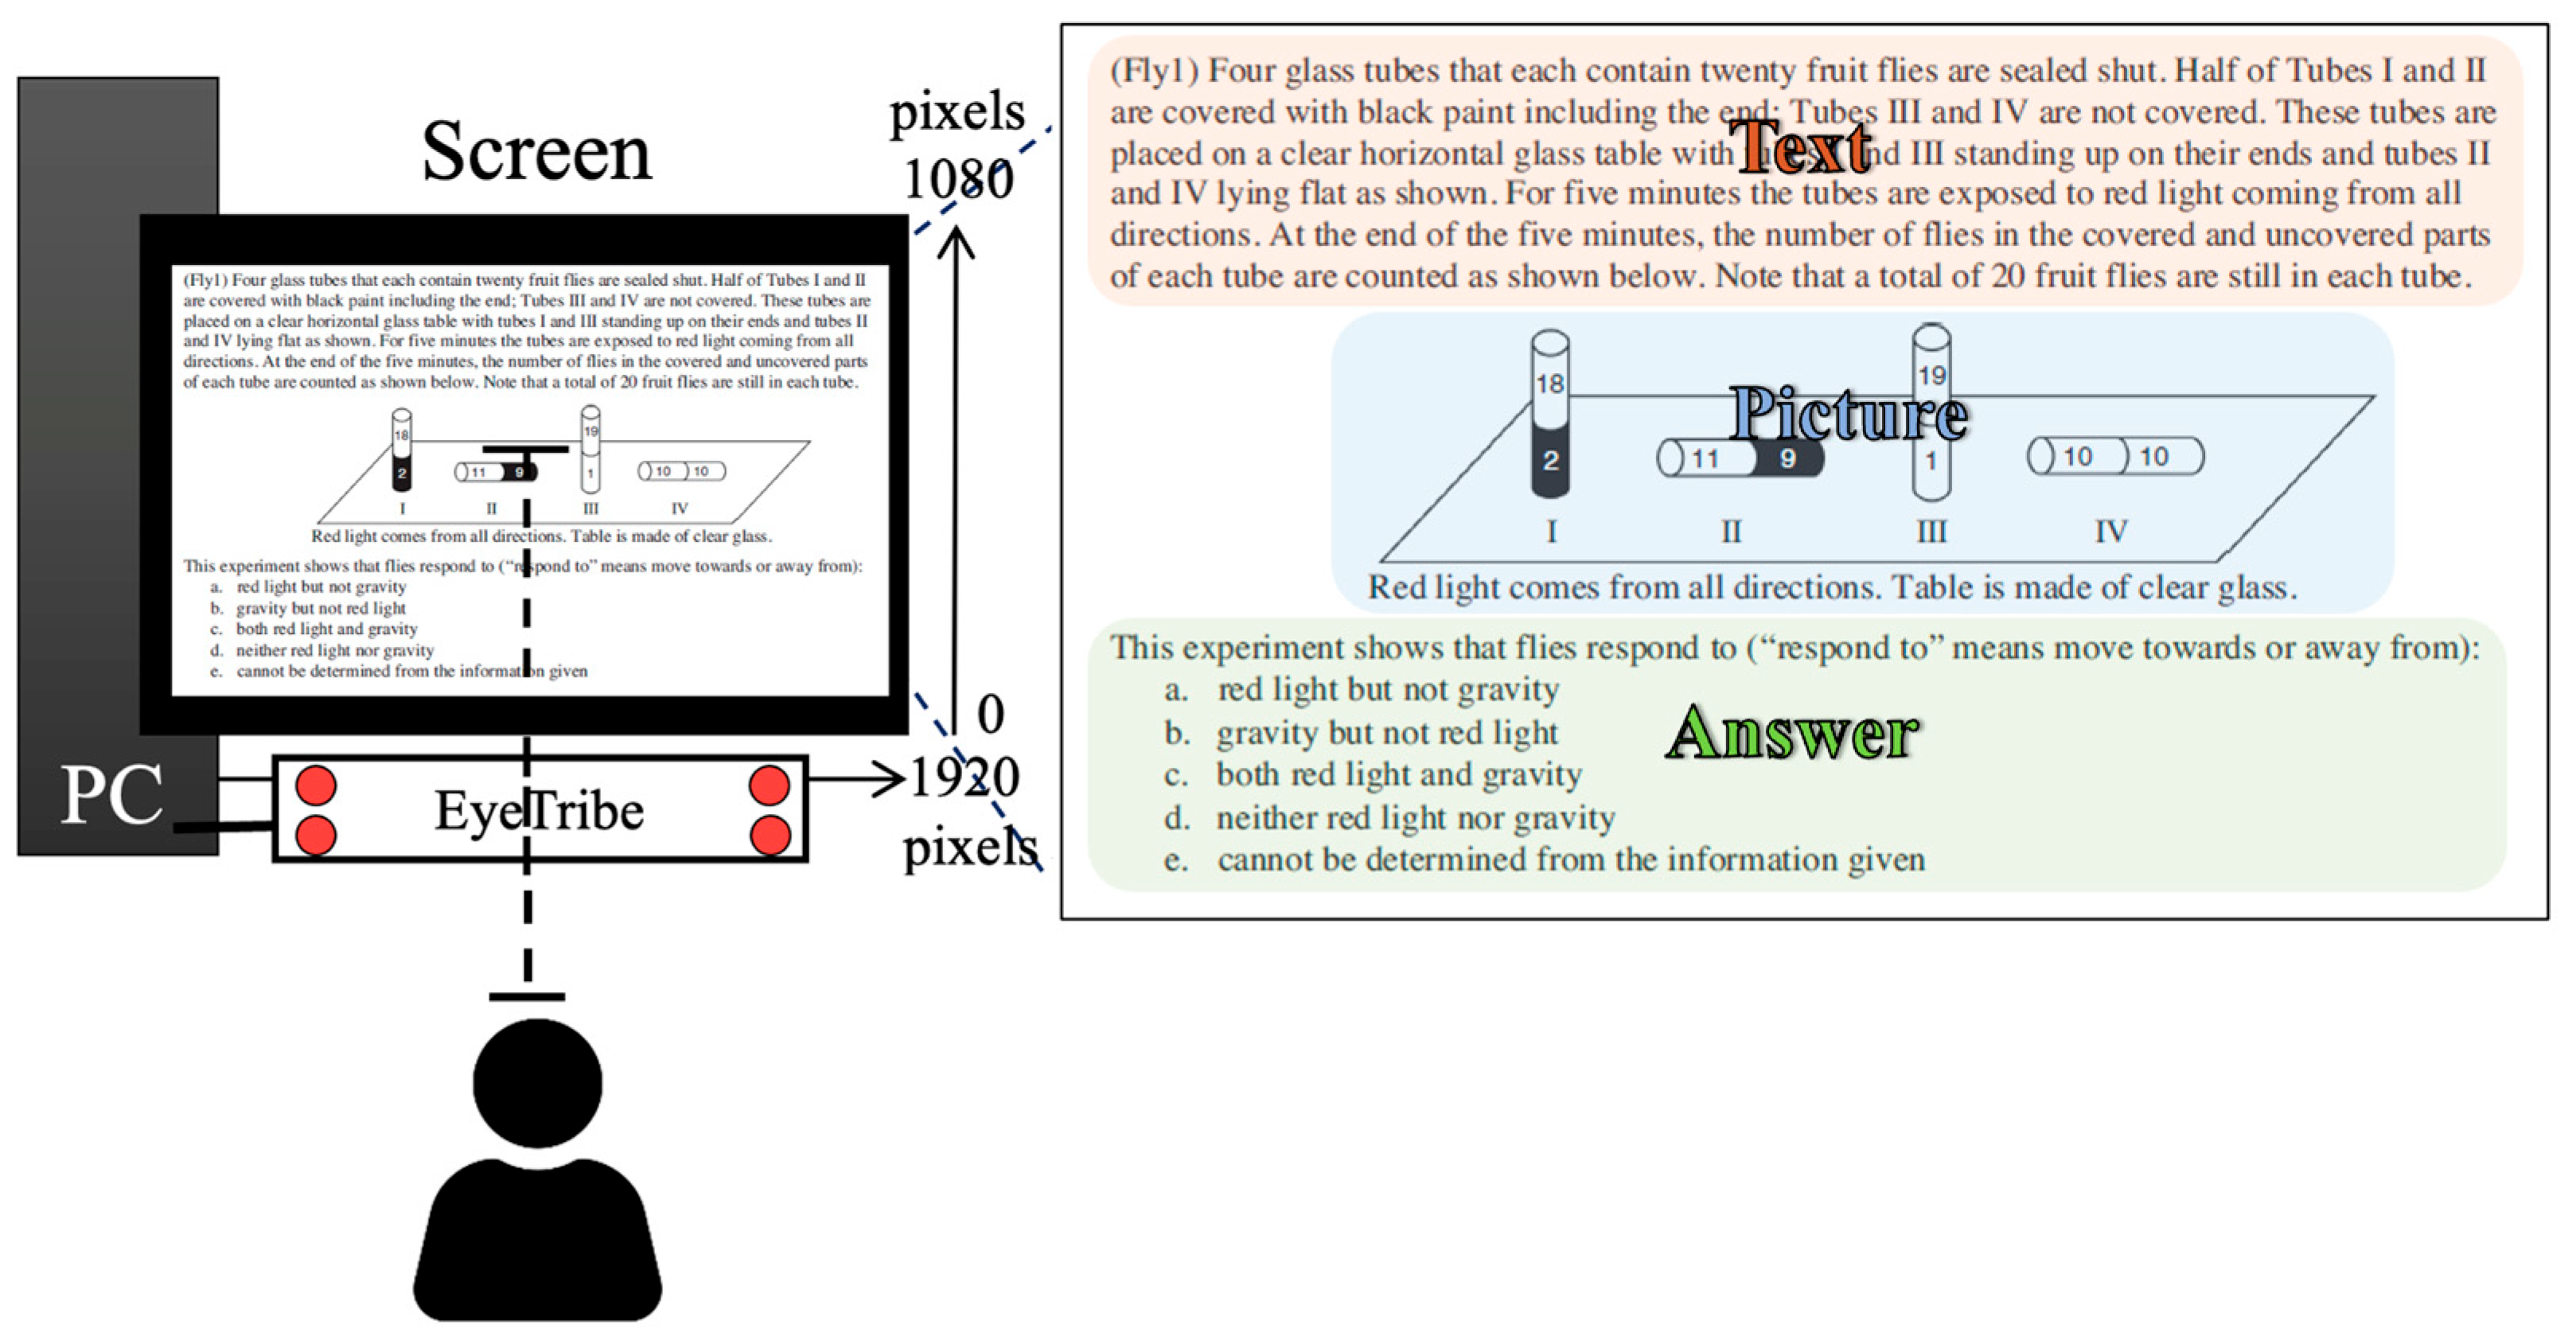
Figure 2 illustrates the experimental setup employed in this study. In this study, participants were individually seated in a quiet room, positioned approximately 60 cm from the display screen. A chin rest was used to minimize head and body movement. Each student underwent a nine-point calibration to ensure the accuracy of the eye-tracking system. In this study, we utilized the iSTAR assessment [20] as our test questions, which is an assessment instrument focusing on scientific and reasoning skills. The iSTAR assessment was provided by Prof. Lei Bao from the Department of Physics at The Ohio State University, USA. According to the overall design framework of iSTAR, the full assessment consists of 35 items. Based on the item classification reported by Lei Bao (2022) [21], the original 35 items can be restructured into a short version of approximately 20 items to reduce participants’ testing time and to minimize potential measurement bias caused by cognitive fatigue or attention decline during lengthy assessments. The primary aim of this study is to examine the differences in information-integration behaviors between gifted and regular students while they respond to assessment items, under conditions that minimize the influence of prior knowledge. Therefore, we intentionally selected items of moderate difficulty (logit scale between −2.5 and 2.5) as the main basis for our analysis, ensuring that neither overly easy nor overly difficult items would obscure the genuine differences in students’ information-integration strategies.
Figure 2.
The experimental setup and ROI layout of this study.
Specifically, within the 20-item short version of the iSTART assessment, the test originally includes 17 moderate-difficulty items and 3 high-difficulty items. Considering the goal of comparing cognitive strategies between gifted and regular students in higher-level reasoning situations, we removed two of the three difficult items and retained only one item with a difficulty level above 3 on the logit scale, serving as a key indicator for cognitive challenge. From this refined pool, we then selected 18 questions: 9 picture-based MCQs (pMCQs) and 9 text-based MCQs (tMCQs). These were chosen based on clear spatial separation between text, image, and answer areas, which was essential for precise eye-tracking ROI analysis. Additionally, we excluded overly simple items by removing those with mean response times below 30 s, ensuring that retained items reflected genuine reasoning efforts.
The test questions were displayed on a screen directly facing the participants, who then provided their responses using a computer mouse. Conversational interactions were not permitted during the experiment to maintain focus. There was no time limit imposed on the participants for answering the questions, allowing participants to respond at their own pace. Each student was required to respond to 18 questions, with only one attempt allowed per question. For each question, the participant had to choose one answer from four to five options. Once an answer was selected for a question, the screen automatically advanced to the next question, with no option to return to the previous one. The 18 questions comprised two types: one included text, images, and answers (multiple-choice questions with an informative picture, pMCQ), and the other consisted only of text and answers (text-only multiple-choice questions, tMCQ), with nine questions of each type. The content and order of the questions were identical for all participants, and none of them had previously encountered these 18 questions.
In our study, we focused on questions containing pictorial content, which included three specific regions of interest (ROI): the text zone, the picture zone (which could be a graph, an illustration, or a table/chart), and the answer zone. The text zone was positioned at the upper part of the screen display, the picture zone in the middle, and the answer zone at the bottom of the question. To gain insights into the problem-solving strategies of the students, we utilized eye-tracking technology to assess the fixation duration time within each ROI and measured the proportion of saccades transitioning among these zones. This methodology enabled us to conduct an in-depth comparison of how gifted and regular students interact differently with both the textual and pictorial components of the questions, thereby highlighting distinct behavioral patterns in their problem-solving approach.
At the outset of the experiment, participants were presented with a prompt on the screen to prepare for answering, with the timing beginning upon their mouse click. The response time was calculated as the duration from the conclusion of one question to the selection of an answer for the succeeding one. The protocol mandated that participants sequentially address a series of 18 questions, with the experiment ending once all were completed. To maintain the integrity of the eye-tracking data, participants were advised to restrict bodily movements and minimize blinking. On average, the completion of the experiment took around one hour per participant. All participants voluntarily participated in the experiment and signed an informed consent form. This study was approved by the IRB (Project number: 202206EM019) of National Taiwan Normal University, Taiwan.
2.3. Eye Tracking and Data Analysis
In this study, the EyeMMV toolbox [22] was utilized for analysis. Further statistical analysis of the fixations and saccades across various regions of interest (ROIs) was undertaken. The fixation duration, quantified in milliseconds (ms), signifies the period during which the eyes are fixated on a specific point. Saccades, the swift eye movements that occur as the gaze transitions from one point to another, such as during reading or observing various objects or scenes, were also analyzed. In terms of fixations, the proportion of time that the participants’ gaze stayed on each ROI was computed, defined as the fixation time ratio (FTR). This includes the fixation time ratios on the text area (FText), picture area (FPicture), and answer area (FAnswer). The methodology for computing FTR is depicted in the formula below.
where FROI represents the gaze time ratio in different ROIs, i.e., text, picture, or answer; the FTROI denotes the gaze time in the specified ROI area; and the FTTotal = FTText + FTPicture + FTAnswer is the sum of fixation times across all ROI areas.
In examining saccadic behavior during problem solving, we calculated the proportion of saccade counts occurring within the same ROI or across different ROIs, defined as the saccade count ratio (SCR). This encompasses the saccade count ratio for text-to-text (TT), text-to-picture (TP), picture-to-picture (PP), picture-to-answer (PA), answer-to-answer (AA), and answer-to-text (AT) transitions. The methodology for calculating SCR is illustrated in the formula provided below.
where SEvent quantifies the proportion of saccade counts across various gaze transition events, including saccade counts for text-to-text (STT), text-to-picture (STP), picture-to-picture (SPP), picture-to-answer (SPA), answer-to-answer (SAA), and answer-to-text (SAT), with SEvent for the number of saccades occurring in each specific transition type and STotal for the aggregation counts of all transitions, i.e., STotal = STT + STP + SPP + SPA + SAA + SAT.
Within the scope of pMCQ, the fixation time ratio (FTR) and saccade count ratio (SCR) adhere to the aforementioned definitions. However, for tMCQ where pictorial content is absent, variables such as FPicture, SPP, STP, and SPA are deemed non-applicable and thus set to zero. The definitions of FTR, SCR, and their respective parameters are outlined in Table 1.
Table 1.
Overview of eye-movement metrics in problem-solving tasks.
2.4. Construction of Random Forest to Classify Gifted and Regular Students on FTR or SCR Features
In this study, an attempt was made to classify the problem-solving strategy differences between gifted students and regular students based on their FTR or SCR data, further exploring the differences in eye-movement behaviors between these two groups in terms of FTR and SCR. The FTR and SCR from both pMCQ and tMCQ were utilized as input features for the Random Forest (RF) [23], aimed at classifying the eye-movement behaviors of the two student groups. The study encompassed 38 participants (20 gifted students and 18 regular students), with the questions comprising 9 pMCQs and 9 tMCQs. To ensure the accuracy and reliability of the study results, data from students with poor eye-tracking quality were excluded. Specifically, exclusion criteria included (1) a low valid gaze ratio, resulting in insufficient usable fixation data; (2) head displacement leading to systematic calibration drift, such that gaze points could not be reliably mapped to the predefined regions of interest (ROIs); and (3) frequent head movements or excessive blinking during task performance, which caused substantial data loss or signal noise [24]. As a result, data from 4 gifted students and 5 regular students were excluded. Therefore, the final dataset consisted of 30 students, including 16 gifted students and 14 regular students. Each of these students contributed eye-tracking data from 18 questions, yielding a total of 270 pMCQ instances and 270 tMCQ instances for classification analysis. For the pMCQ dataset, a selection of three FTR and six SCR was used to construct classifiers using RF. For the tMCQ dataset, two FTR and three SCR features were applied towards the same end. The importance of input features was also investigated through the classification results of Random Forest (RF) [23].
To assess the classification performance, we employed a repeated leave-two-out cross-validation strategy, where one gifted and one regular student were held out of each iteration. One gifted student and one regular student were randomly selected from the final sample of 16 gifted and 14 regular students to form a test dataset, while the remaining 28 students were used to construct the training dataset. This procedure was repeated 20 times to ensure robust performance estimation. In each repetition, separate RF classifiers were built for pMCQ and tMCQ datasets using the corresponding FTR and SCR features. The average classification accuracy over the 20 repetitions was computed and reported. Furthermore, feature importance scores derived from the trained RF models were analyzed to determine the most informative features for distinguishing between gifted and regular students under both question types.
The methodology for constructing the RF classifier comprised the following steps:
- ➓
- Set a number m for the number of decision trees.
- ➓
- Randomly extract two-thirds of the data from the training dataset to form a training subset.
- ➓
- For each training subset, randomly choose k features () from the eye-tracking features (FTR or SCR), in which k = 2 for FTR and k = 3 for SCR were used to build a decision tree, and the decision at each node of the tree was based on these features.
- ➓
- The process described above was repeated m times, generating m (m = 5) decision trees.
- ➓
- The predictions of all decision trees were integrated, and the classification outcome was determined by a majority vote.
Through this methodology, the importance of each feature in distinguishing between the problem-solving strategies of gifted and regular students was also ranked.
3. Results
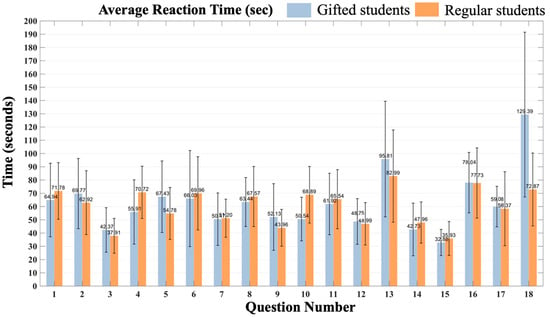
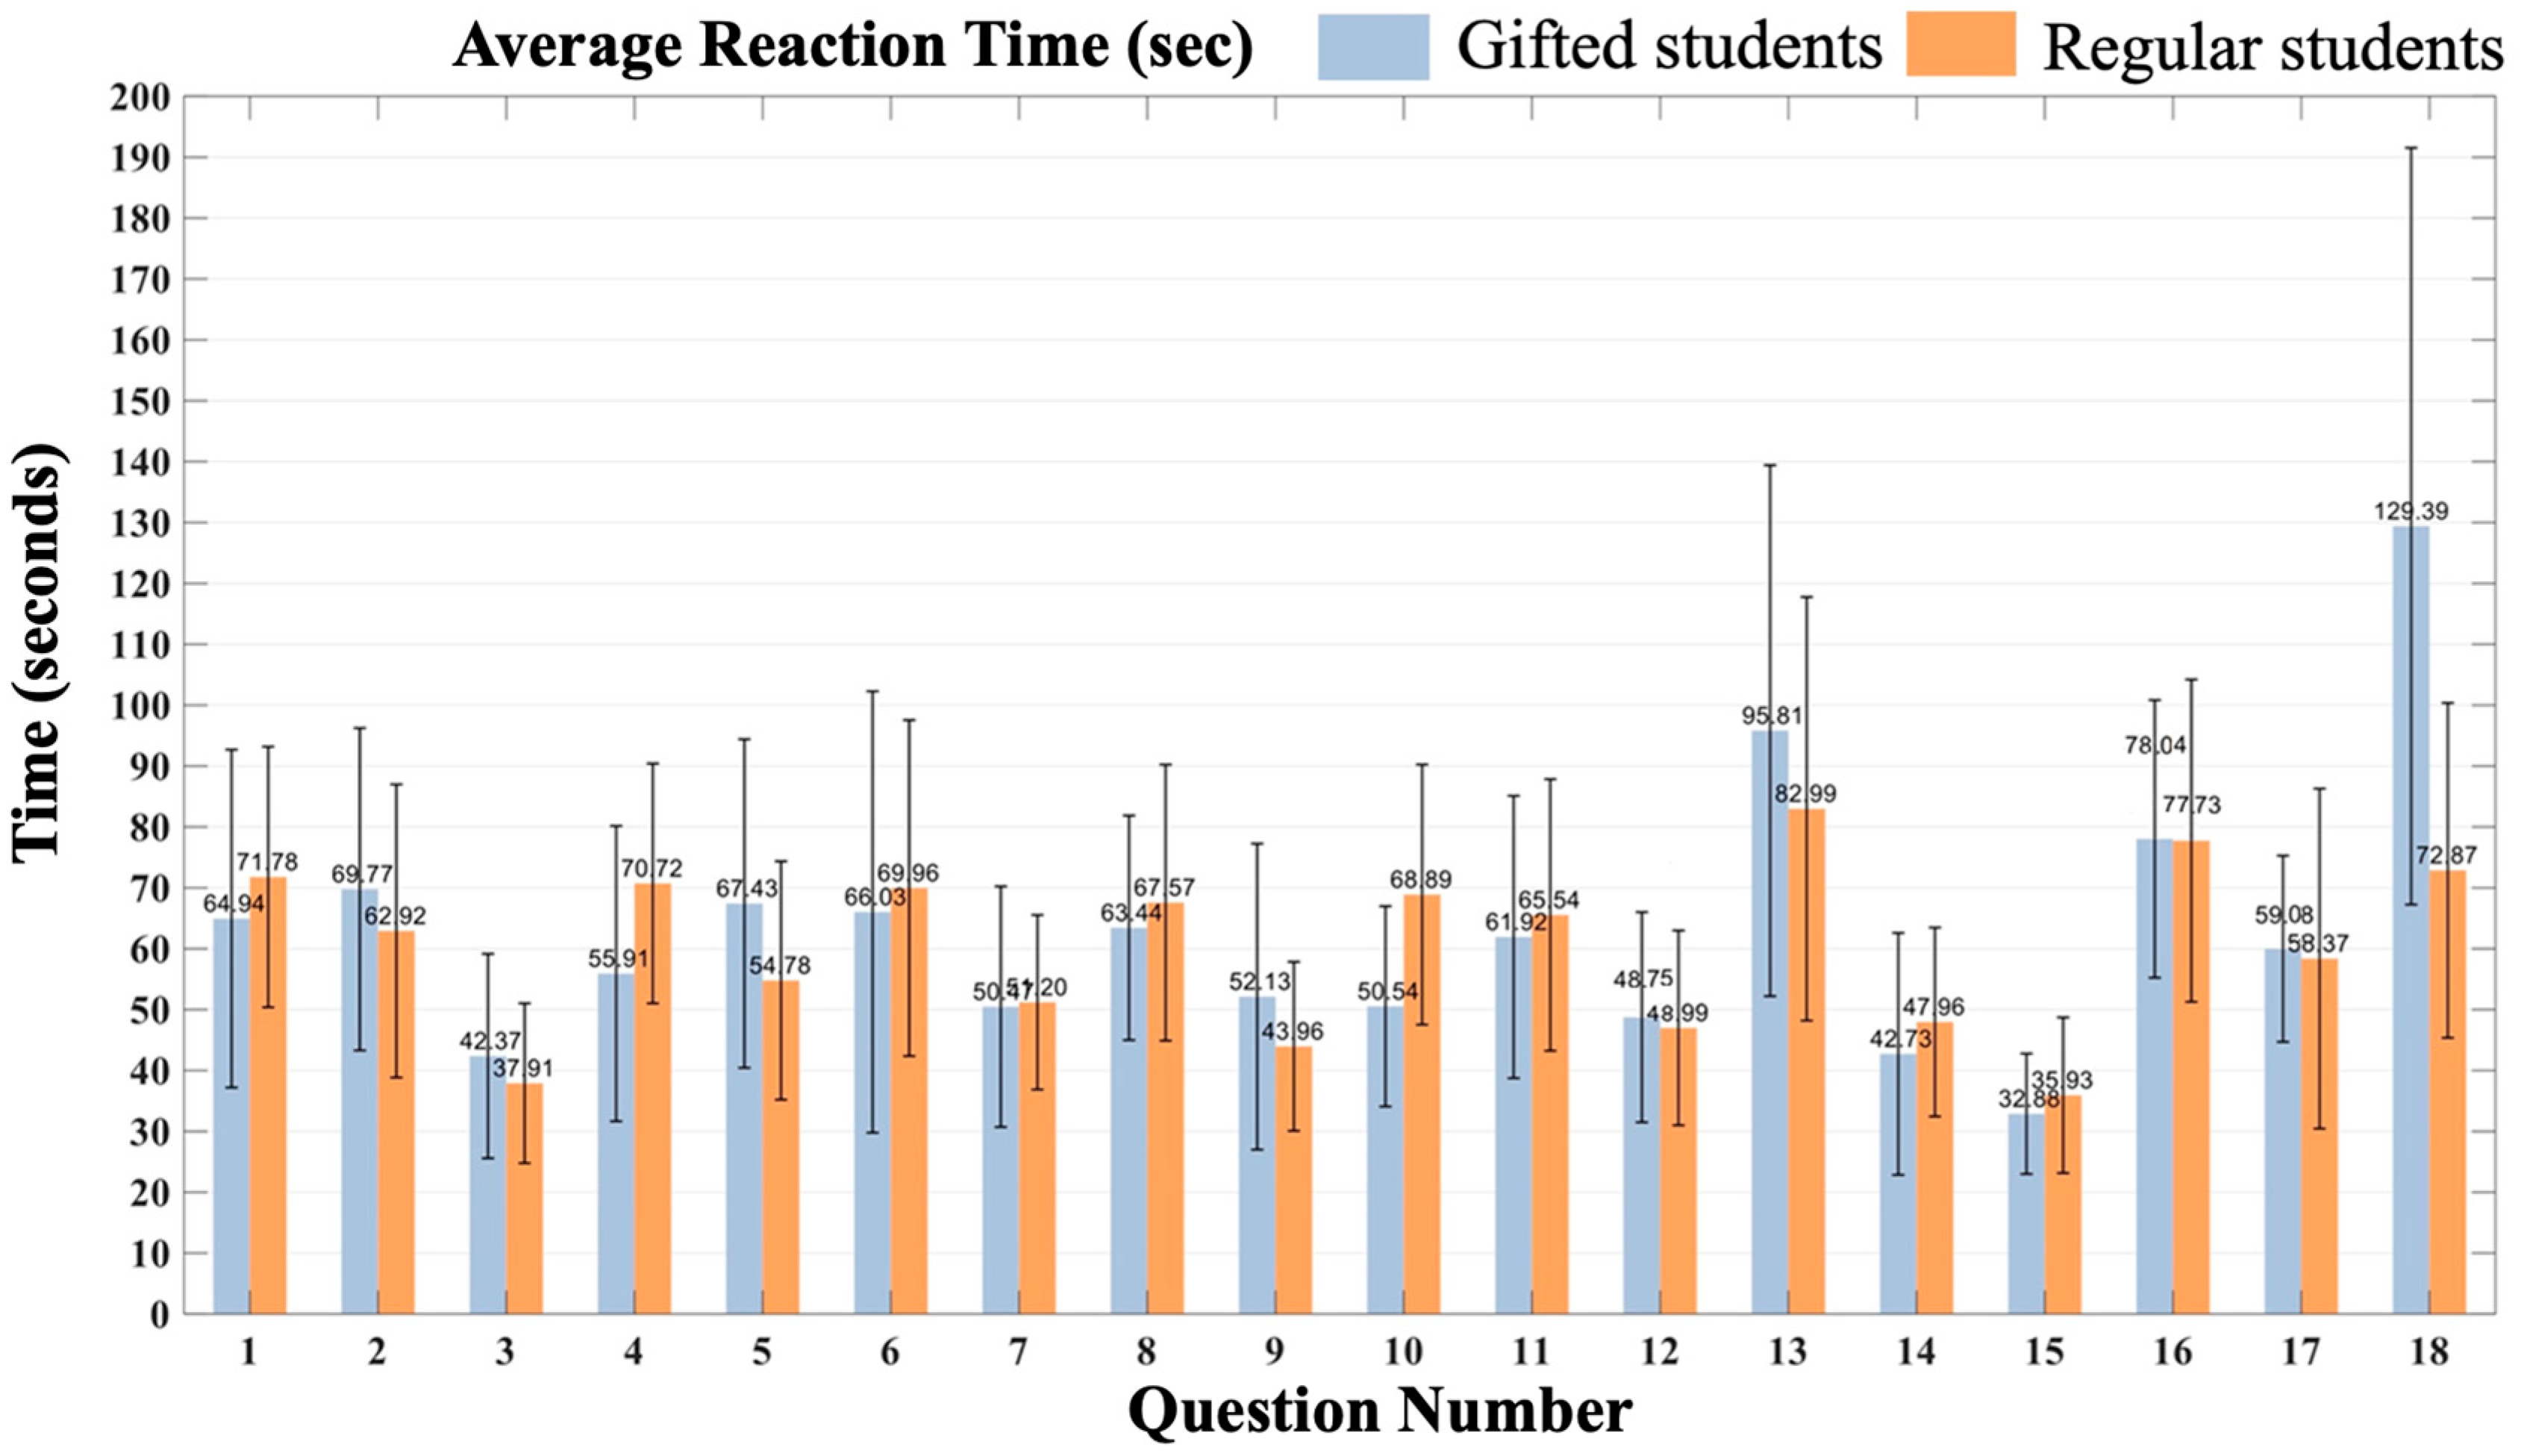
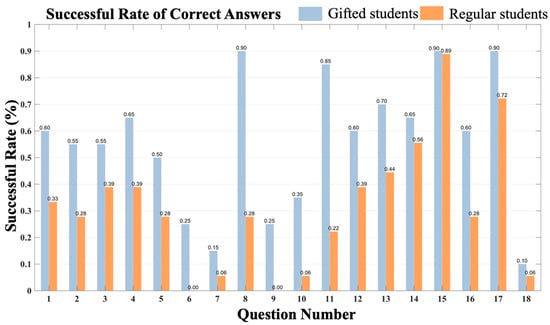
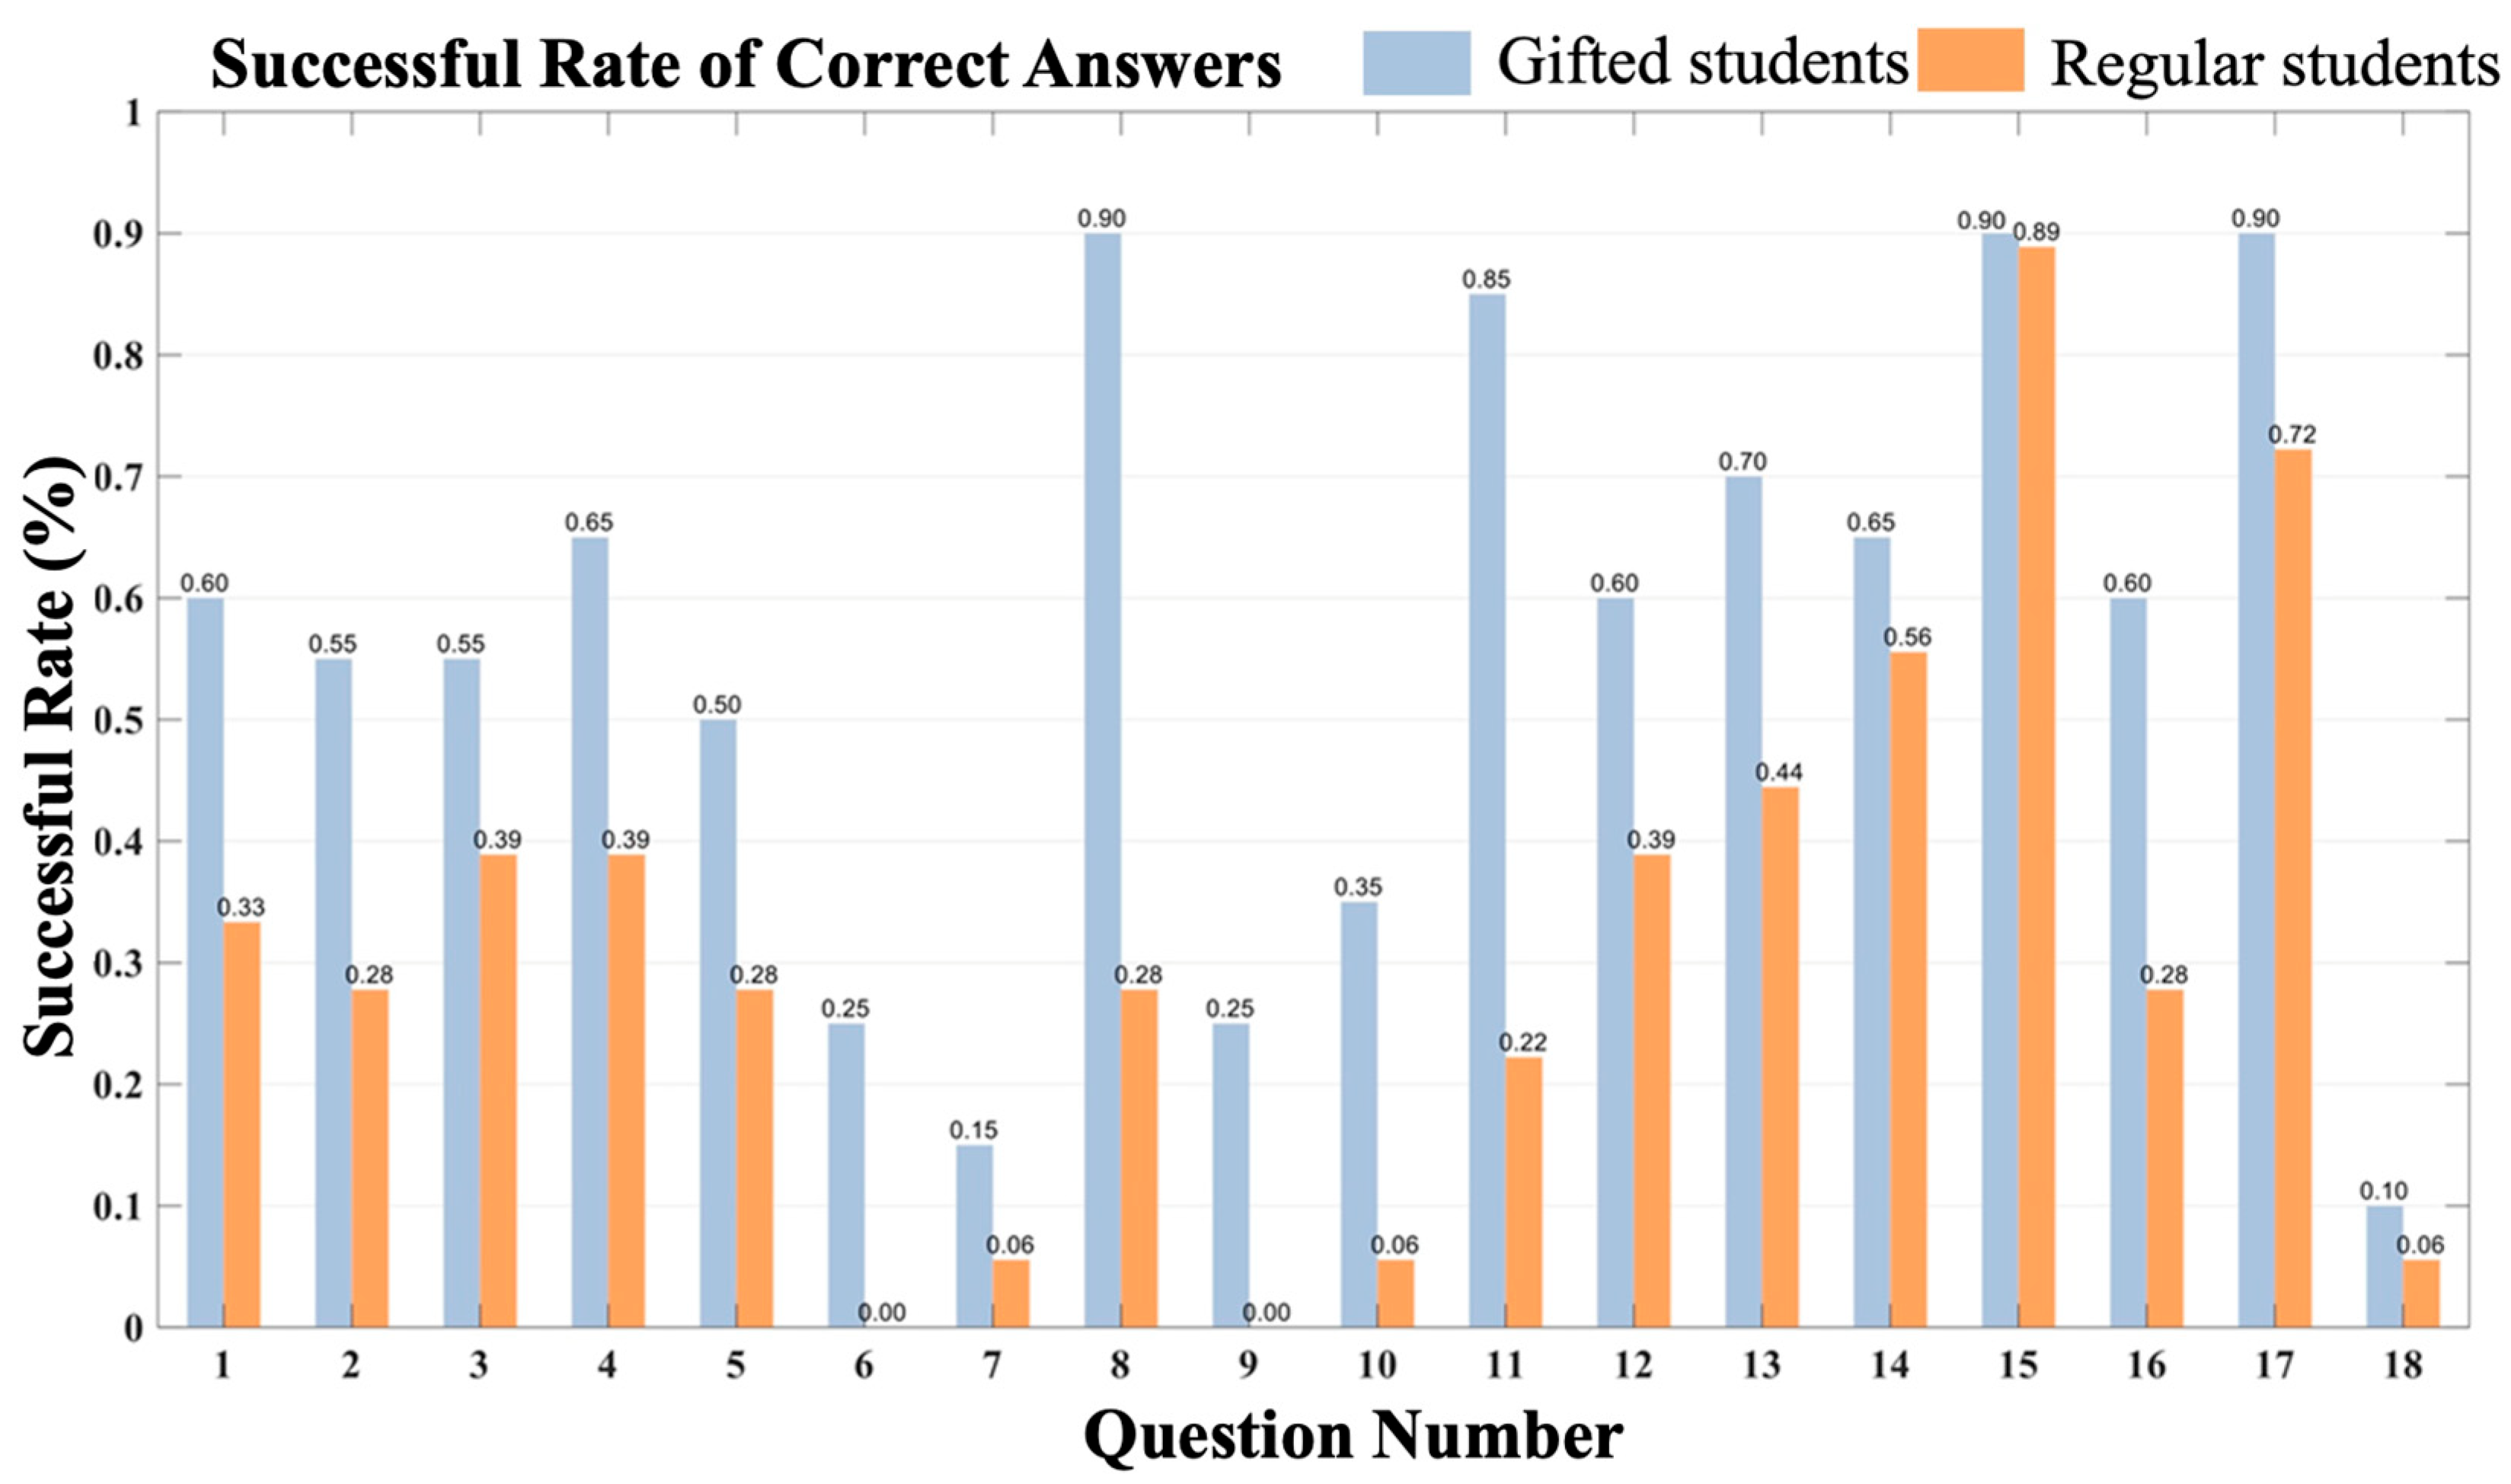
Figure 3 displays the average response time for different questions between gifted students (blue bar) and regular students (orange bar), where the average response times were 62.919 ± 21.998 s and 60.449 ± 13.889 s, respectively (p = 0.0887). The response time indicates that, in terms of answering speed, gifted students are not actually superior to regular students. This also demonstrates that the iSTAR assessment used in this study emphasizes scientific and reasoning skills, requiring students to think before answering. Figure 4 illustrates the success rate of correct answers for both groups. The average accuracy rates for gifted and regular students were 0.558 ± 0.253 and 0.312 ± 0.243, respectively (p < 0.01). In our assessment, questions 2, 5, 6, 7, 9, 10, and 18 were identified as more challenging questions, resulting in a general success rate lower than 40%. The response times and answer success rates were 69.395 ± 27.769 vs. 60.653 ± 10.888 s (p < 0.05; Student’s t-test) and 0.307 ± 0.169 vs. 0.103 ± 0.243 (p < 0.01; Student’s t-test) for gifted and regular students, respectively. In contrast, for other less challenging questions, the response times for gifted and regular students were 58.798 ± 17.662 vs. 60.319 ± 16.023 s (p = 0.5718), with accuracy rates of 0.718 ± 0.140 vs. 0.444 ± 0.203 (p < 0.01; Student’s t-test). Particularly for question 18, which was the most difficult question of them all, the average answer accuracies for gifted and regular students were 0.100 and 0.060, respectively. Additionally, the average response time for gifted students was 56.526 s higher than for regular students, potentially indicating differences in their approaches to problem representation and inference stages.
Figure 3.
The average reaction time of gifted students compared to that of regular students.
Figure 4.
The success rate of correct answers for gifted students compared to regular students.
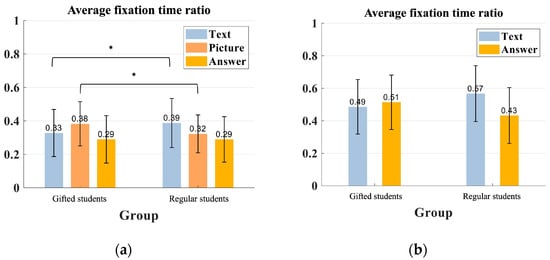
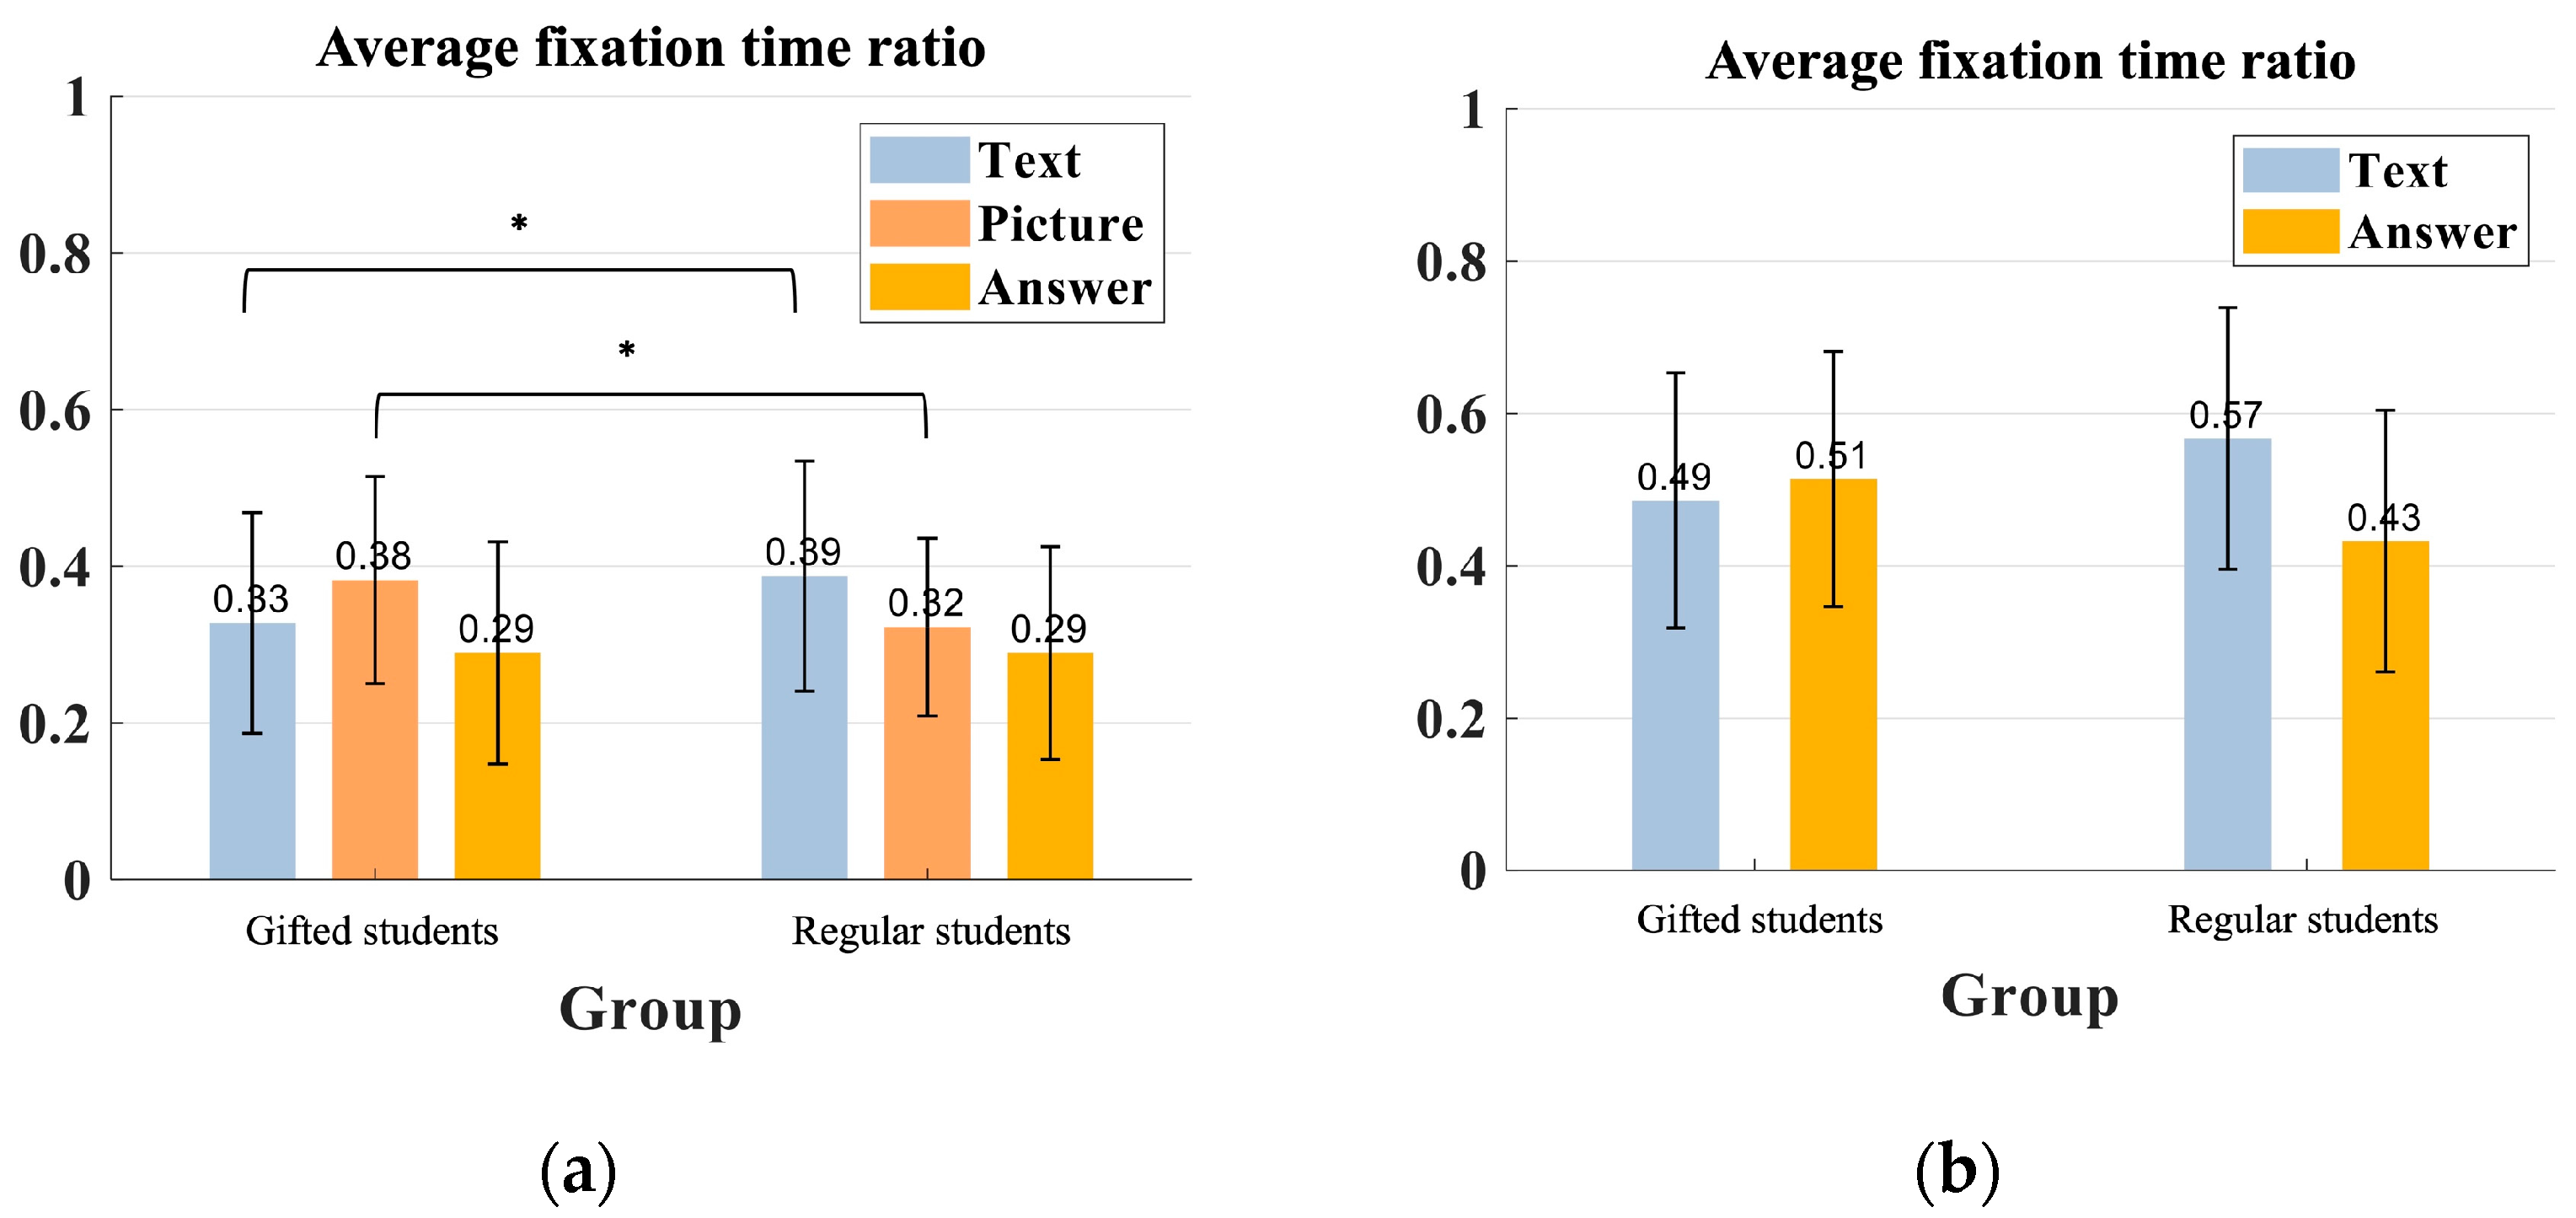
In this study, characteristics of eye-movement behaviors were classified into the FTR and SCR indices. Analyses were conducted on these two eye-movement behaviors in gifted and regular students while answering pMCQ and tMCQ questions. For the FTR behavior feature, Figure 5 illustrates the proportion of students’ FTRs spent on the text, picture, and answer zones. When answering the pMCQs, the FTRs for the 20 gifted students were 0.328 ± 0.141, 0.383 ± 0.132, and 0.290 ± 0.142 in the text, picture, and answer zones, respectively. In comparison, the FTRs for the 18 regular students were 0.388 ± 0.147, 0.323 ± 0.113, and 0.290 ± 0.136 in the text, picture, and answer zones, respectively. For the tMCQs, the FTRs for gifted students were 0.486 ± 0.167 and 0.514 ± 0.167 in the text and answer zones, respectively, while those for regular students were 0.567 ± 0.172 and 0.433 ± 0.172 in the text and answer zones, respectively.
Figure 5.
(a) The average fixation time ratio in pMCQ. (b) The average fixation time ratio in tMCQ. * p < 0.05.
From Figure 5, it can be observed that there are differences in FTR between gifted and regular students across different answer zones during the answering process. In the pMCQ questions, the FTR for gifted students was significantly higher than that for regular students in the picture zone (p < 0.05), while regular students had a higher proportion of fixation time in the text zone compared to gifted students (p < 0.05). Similarly, in the tMCQ questions, regular students also had a higher proportion of fixation time in the text zone compared to gifted students, although this difference was not statistically significant (p = 0.32). This could be attributed to the fact that in tMCQ, students are required to focus on either the text or the answer zone only, unlike pMCQ, which includes graphical information, providing students with more options to understand the questions.
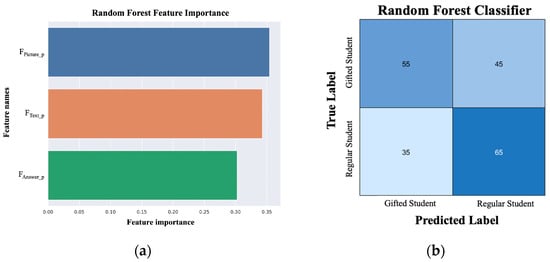
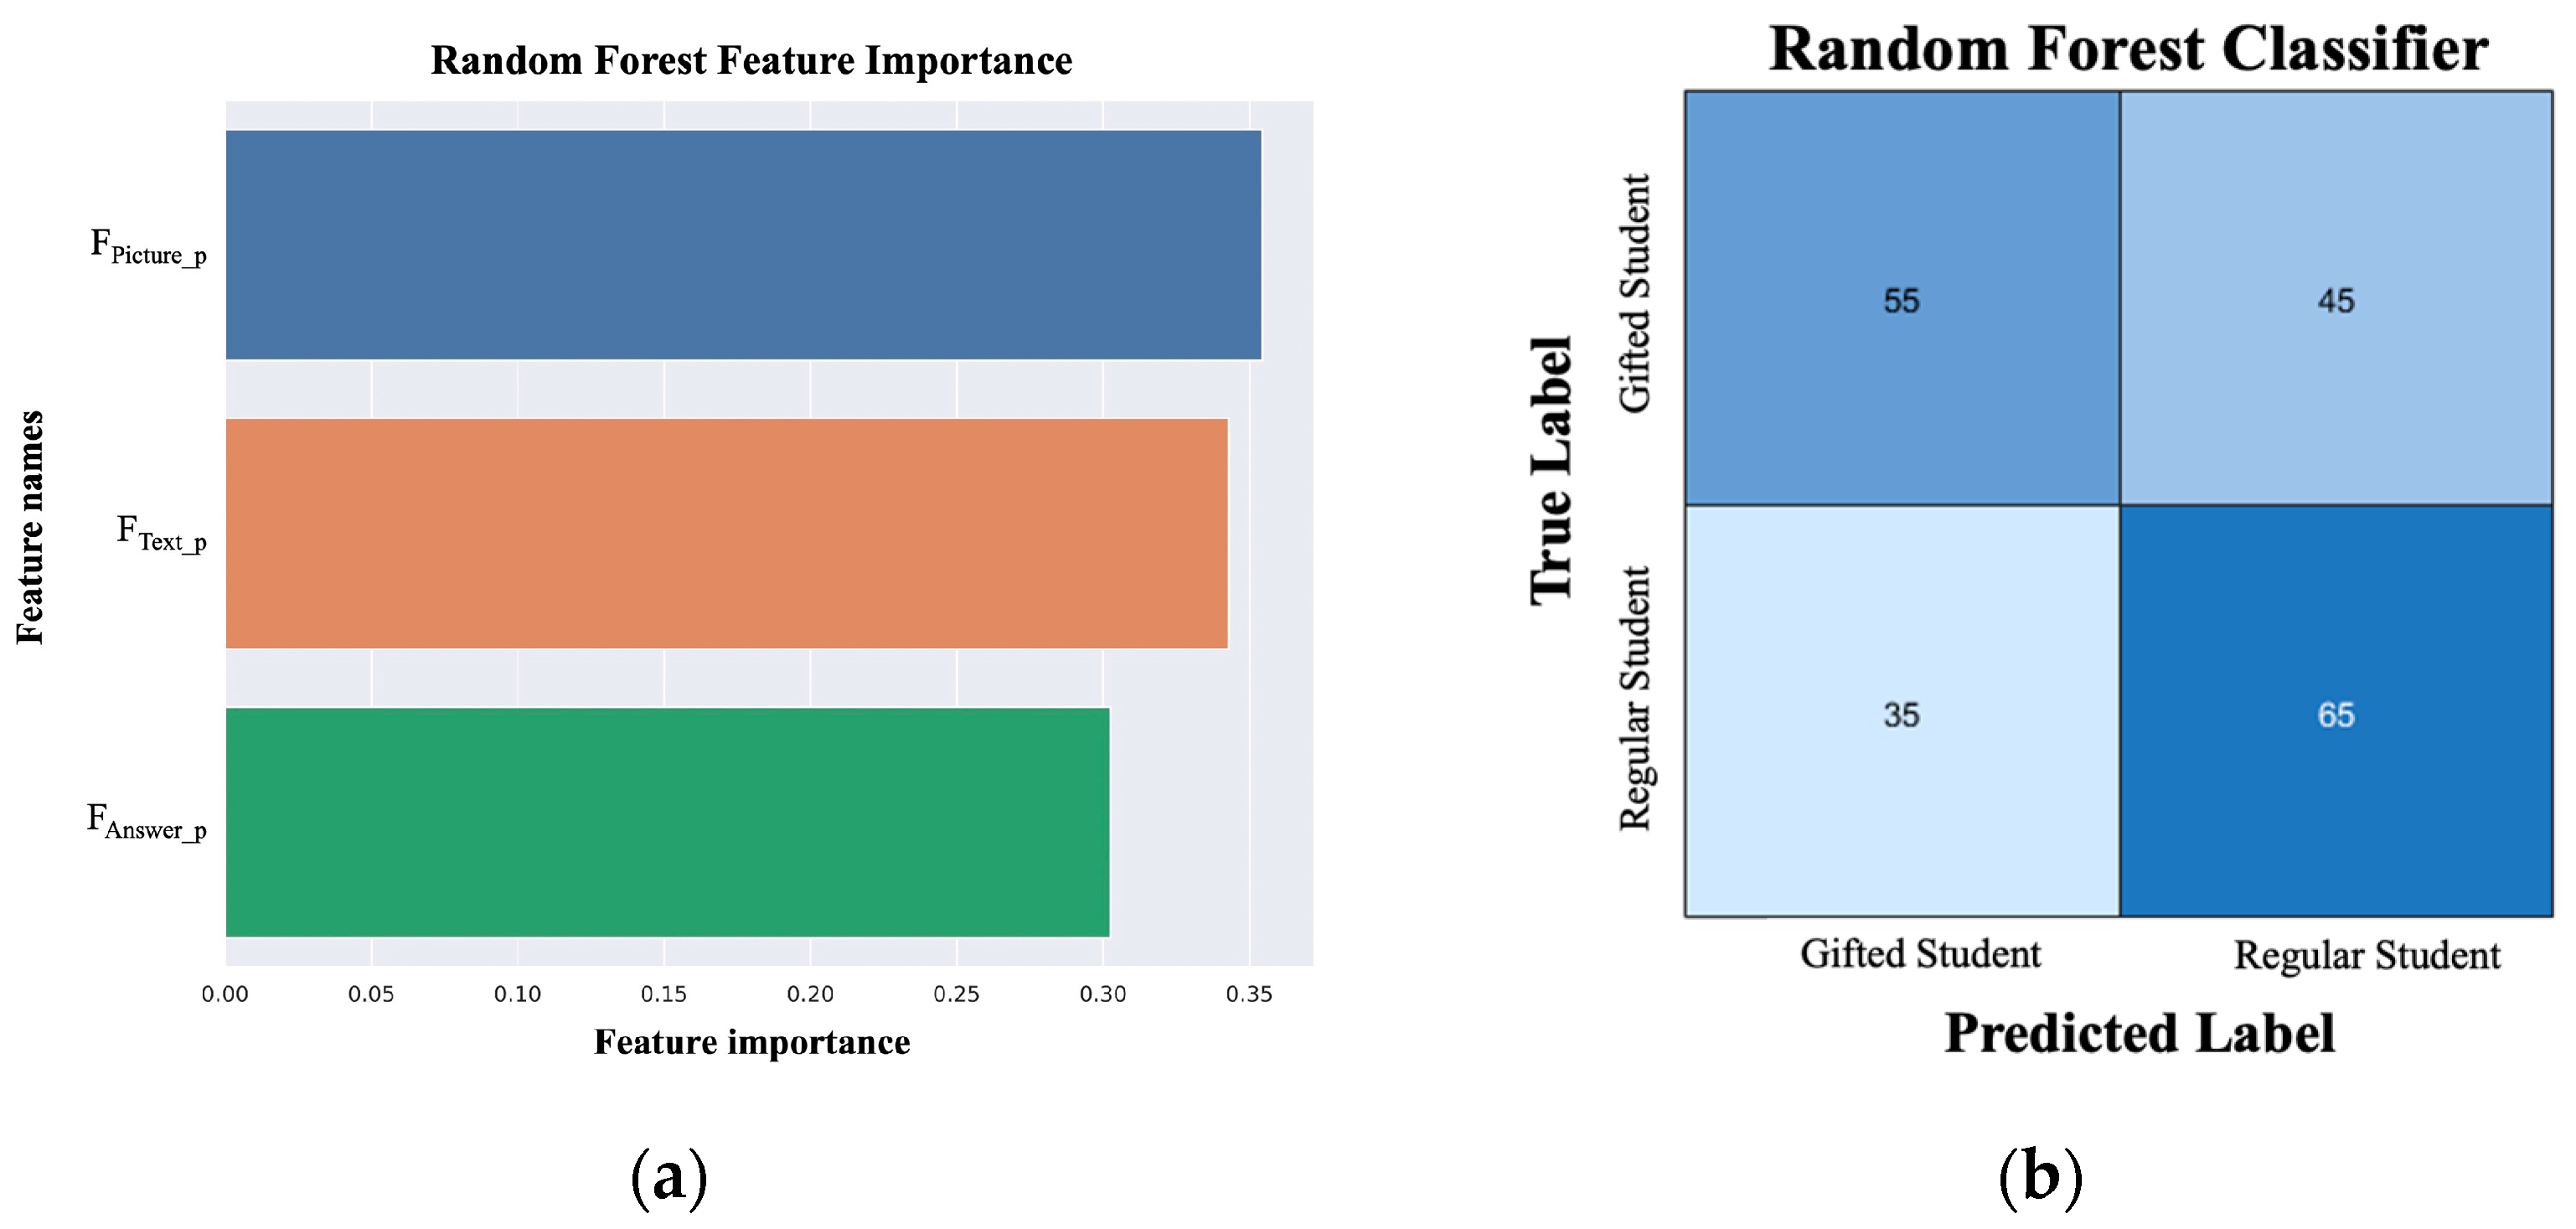
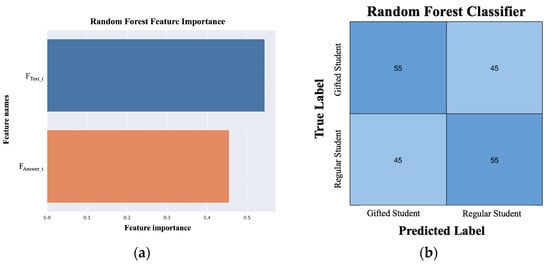
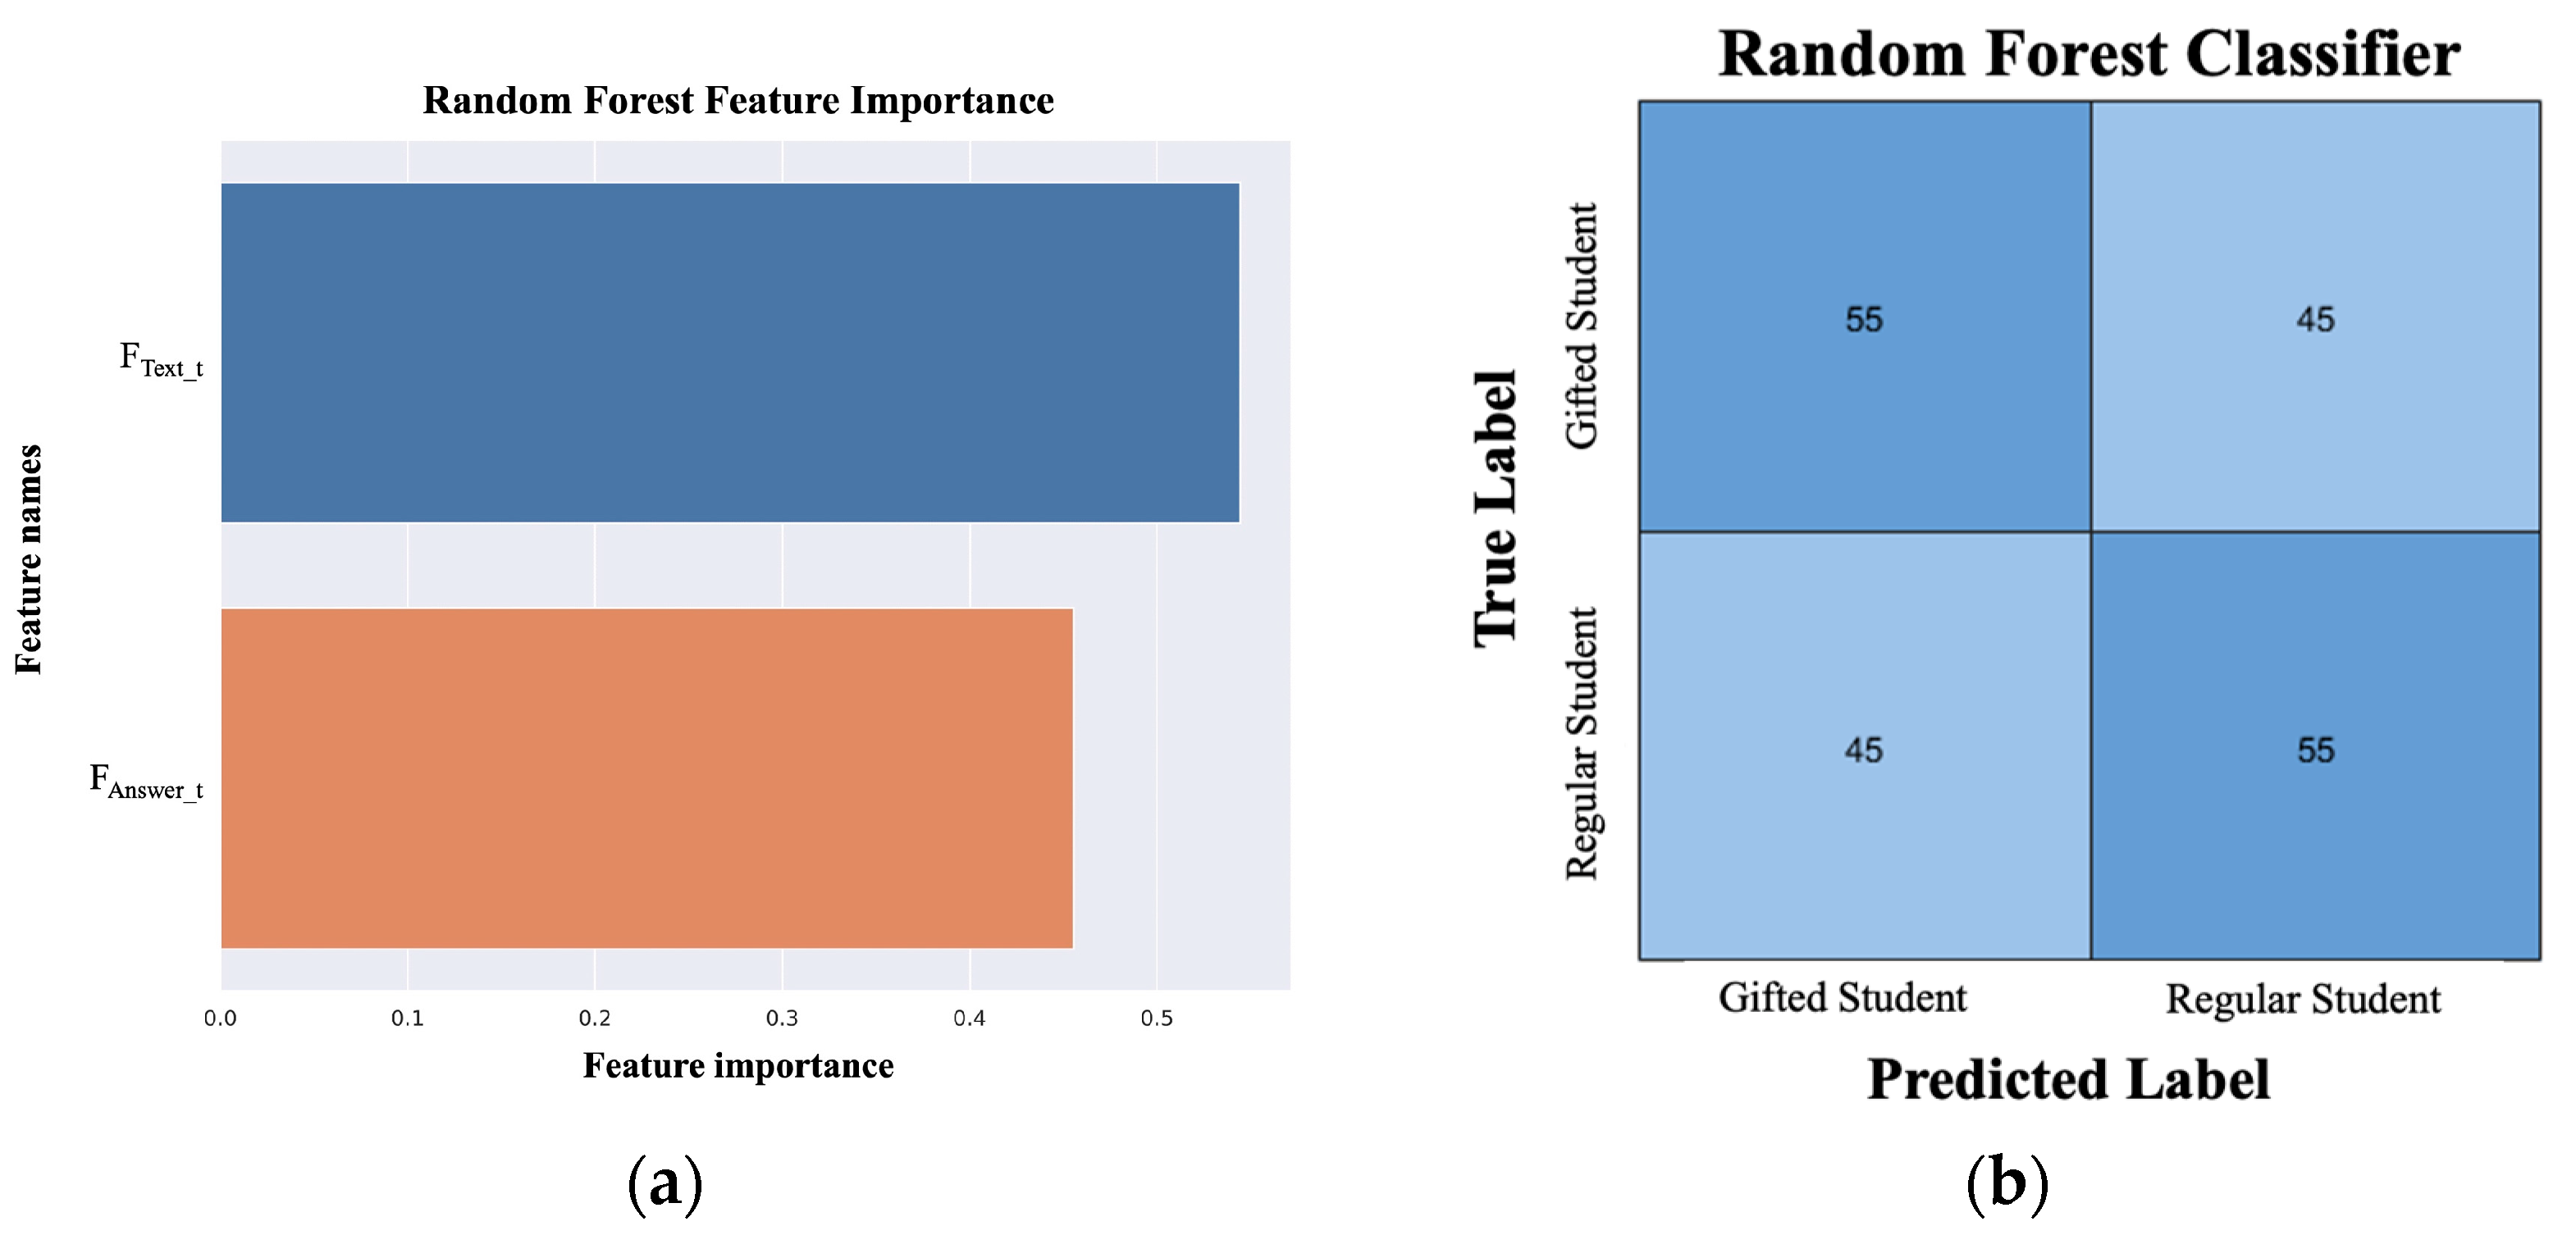
To evaluate the discriminative potential of FTR, we employed Random Forest (RF) to distinguish between gifted students and regular students, enabling us to rank the significance of various FTR features. Figure 6 and Figure 7 depict the classification outcomes and feature importance in pMCQ and tMCQ questions, respectively. Utilizing FTRs of text, picture, and answer as input features achieved a classification accuracy of 60% in pMCQ. The feature importance values were 0.343, 0.354, and 0.303 for FText_p, FPicture_p, and FAnswer_p, respectively (with the sum of feature importance normalized to one). In tMCQ, using FTRs of text and answer yielded a discrimination accuracy of 55%, with feature importance values of 0.545 and 0.455 for FText_t and FAnswer_t, respectively (with the sum of feature importance normalized to one). These findings suggest distinct problem-solving strategies between gifted and regular students, especially in questions involving graphical information, which exhibited greater discriminatory power in distinguishing between the two groups.
Figure 6.
Outcomes of the Random Forest using FTR from pMCQ as input features. (a) Feature importance as output by the Random Forest. (b) Confusion matrix of the Random Forest classification results.
Figure 7.
Outcomes of the Random Forest using FTR from tMCQ as input features. (a) Feature importance as output by the Random Forest. (b) Confusion matrix of the Random Forest classification results.
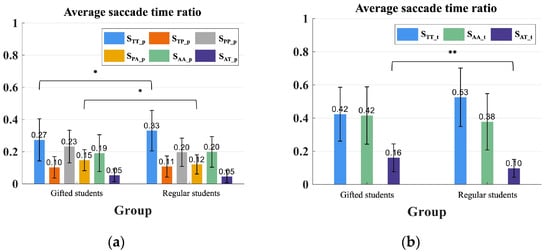
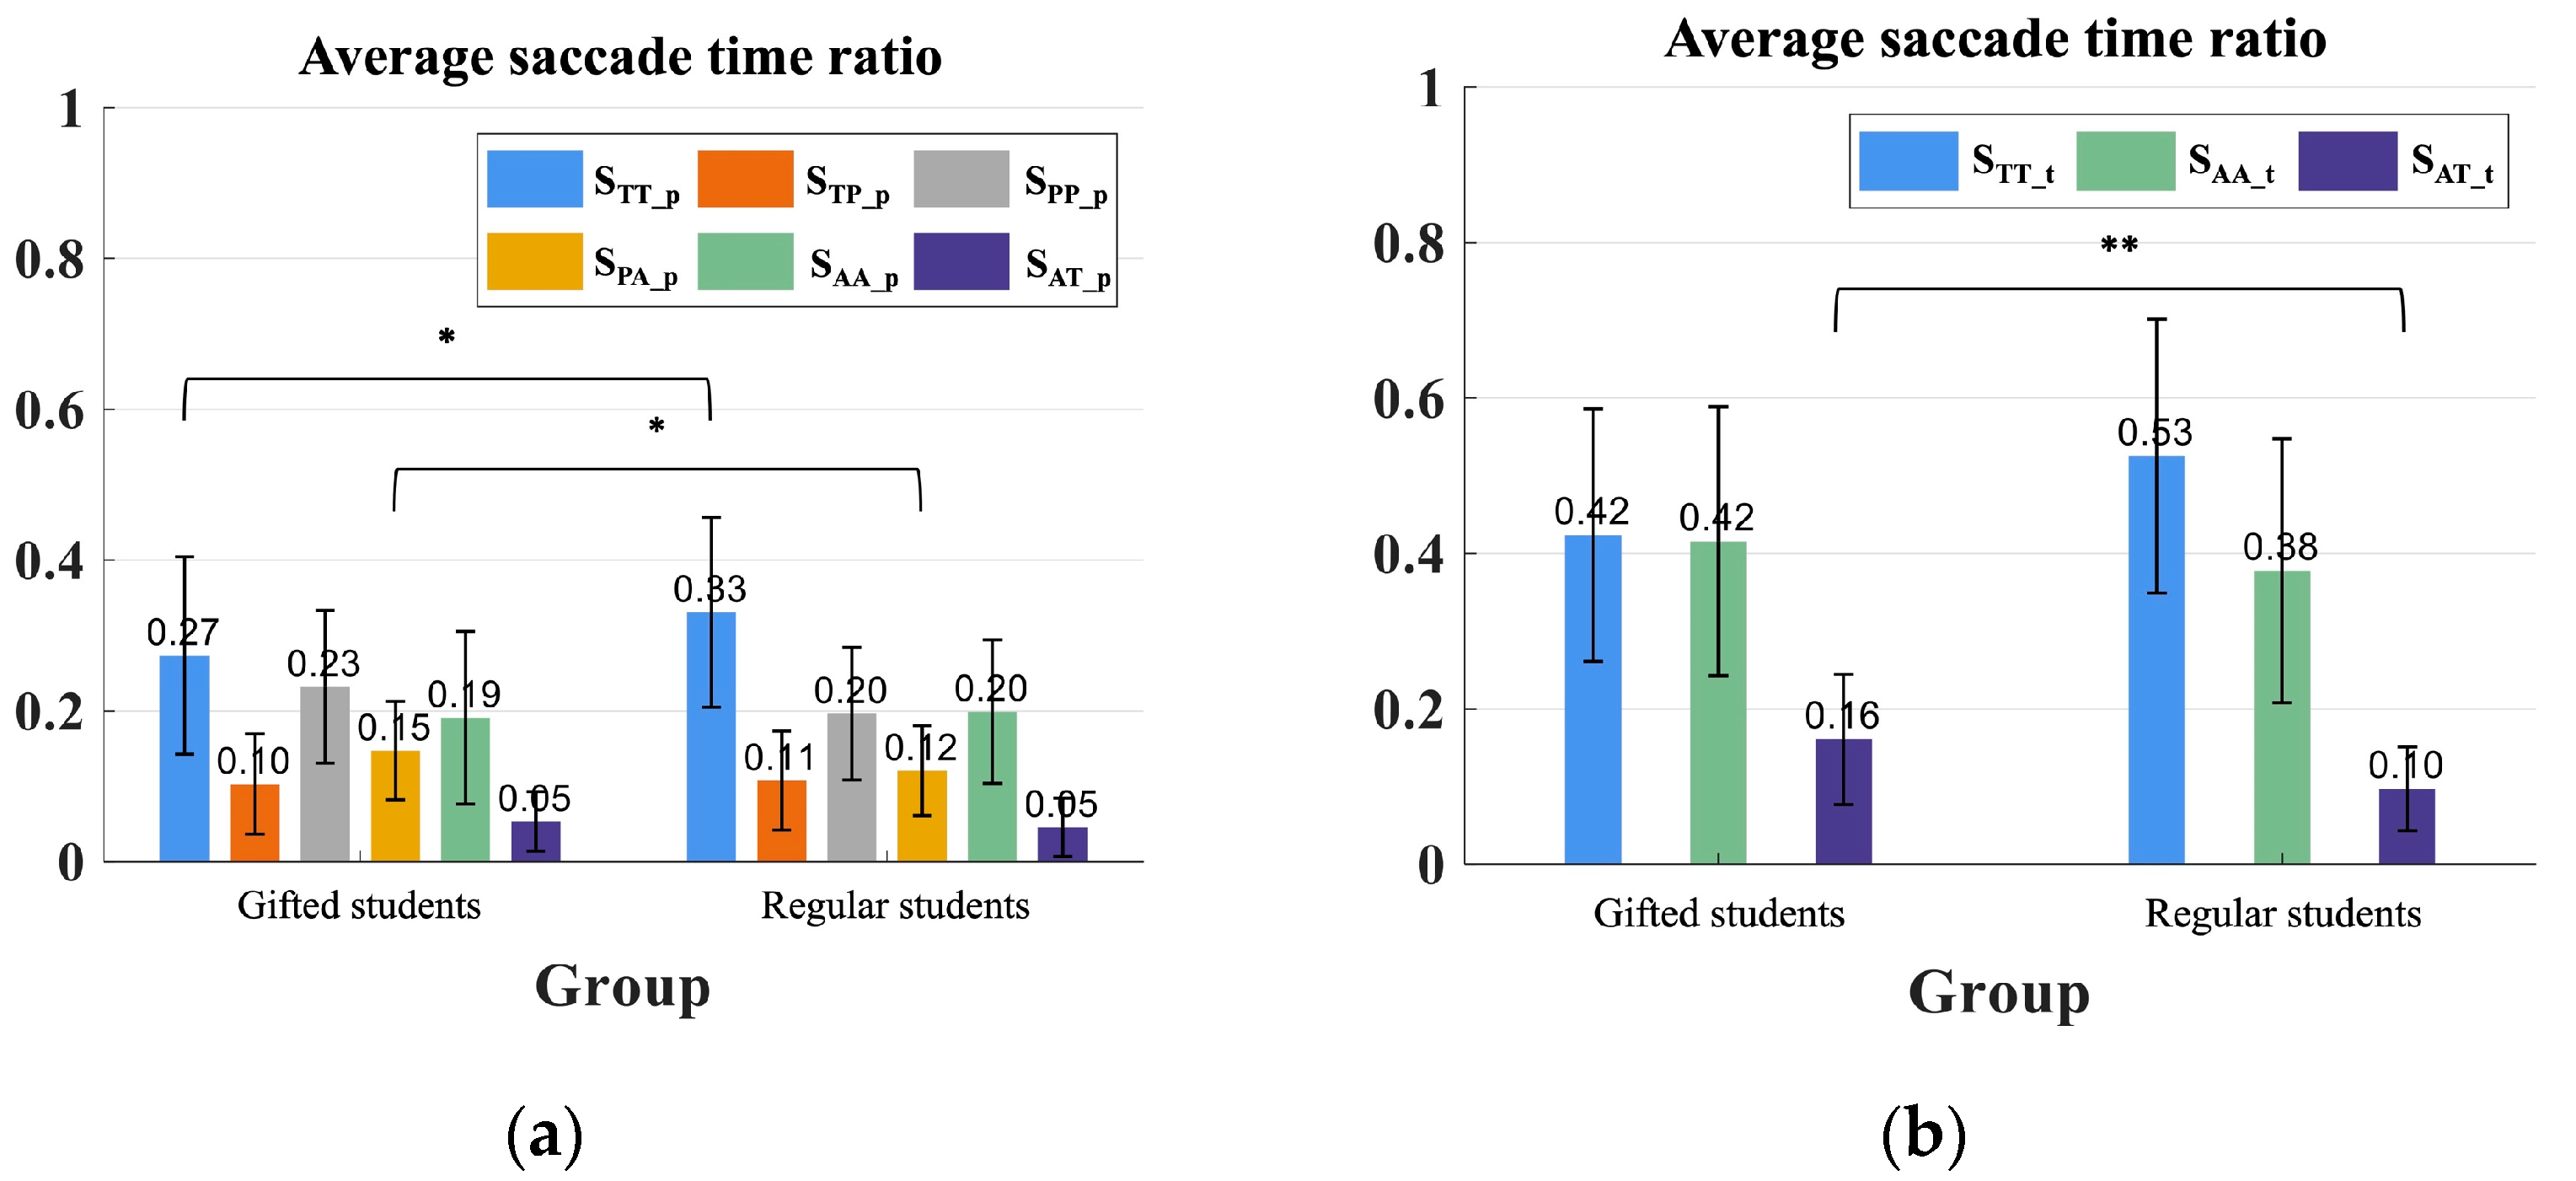
Regarding the evaluation of the discriminative potential of SCR, Figure 8 illustrates the SCR in answering the pMCQs and tMCQs. In Figure 8a, the SCRs for STT_p, STP_p, SPP_p, SPA_p, SAA_p, and SAT_p were 0.274 ± 0.131, 0.103 ± 0.067, 0.232 ± 0.101, 0.147 ± 0.065, 0.191 ± 0.114, and 0.053 ± 0.040, respectively, for the 20 gifted students, and were 0.331 ± 0.126, 0.108 ± 0.066, 0.197 ± 0.088, 0.121 ± 0.060, 0.199 ± 0.095, and 0.046 ± 0.039, respectively, for the 18 regular students. Significant differences were found in the SCR features of text-to-text and picture-to-answer transitions (p < 0.05). It was observed that regular students exhibited more eye-movement transitions in the text, whereas gifted students demonstrated more saccades between the picture and answer zones, indicating their active extraction of information from these areas.
Figure 8.
(a) The average saccade count ratios in pMCQ. (b) The average saccade count ratios in tMCQ. * p < 0.05; ** p < 0.01.
In the answering of tMCQ, Figure 8b displays the SCRs for eye-movement transitions of text-to-text, answer-to-answer, and text-to-answer. The SCRs of the three aforementioned features were 0.424 ± 0.163, 0.416 ± 0.173, and 0.161 ± 0.084, respectively, for the gifted students, and were 0.525 ± 0.176, 0.378 ± 0.170, and 0.097 ± 0.054, respectively, for the regular students. It can be observed that regular students exhibited a behavior pattern similar to that of pMCQ in their response to tMCQ, with a higher proportion of SCR spent on text-to-text eye-movement transitions (STT_p). Although the difference in STT_t between the two student groups did not reach statistical significance (p = 0.13), it is evident that regular students allocated more gaze time (FTR) and engaged in more eye-movement transitions (SCR) in understanding the problem representation. In contrast, gifted students demonstrated higher eye-movement transitions between the picture and answer zones (SPA_t), indicating that they invested more effort in integrating text and answer information, which significantly differed from regular students (p < 0.01).
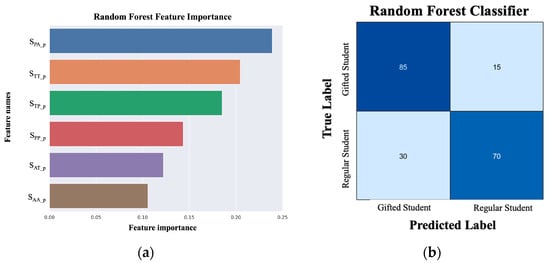
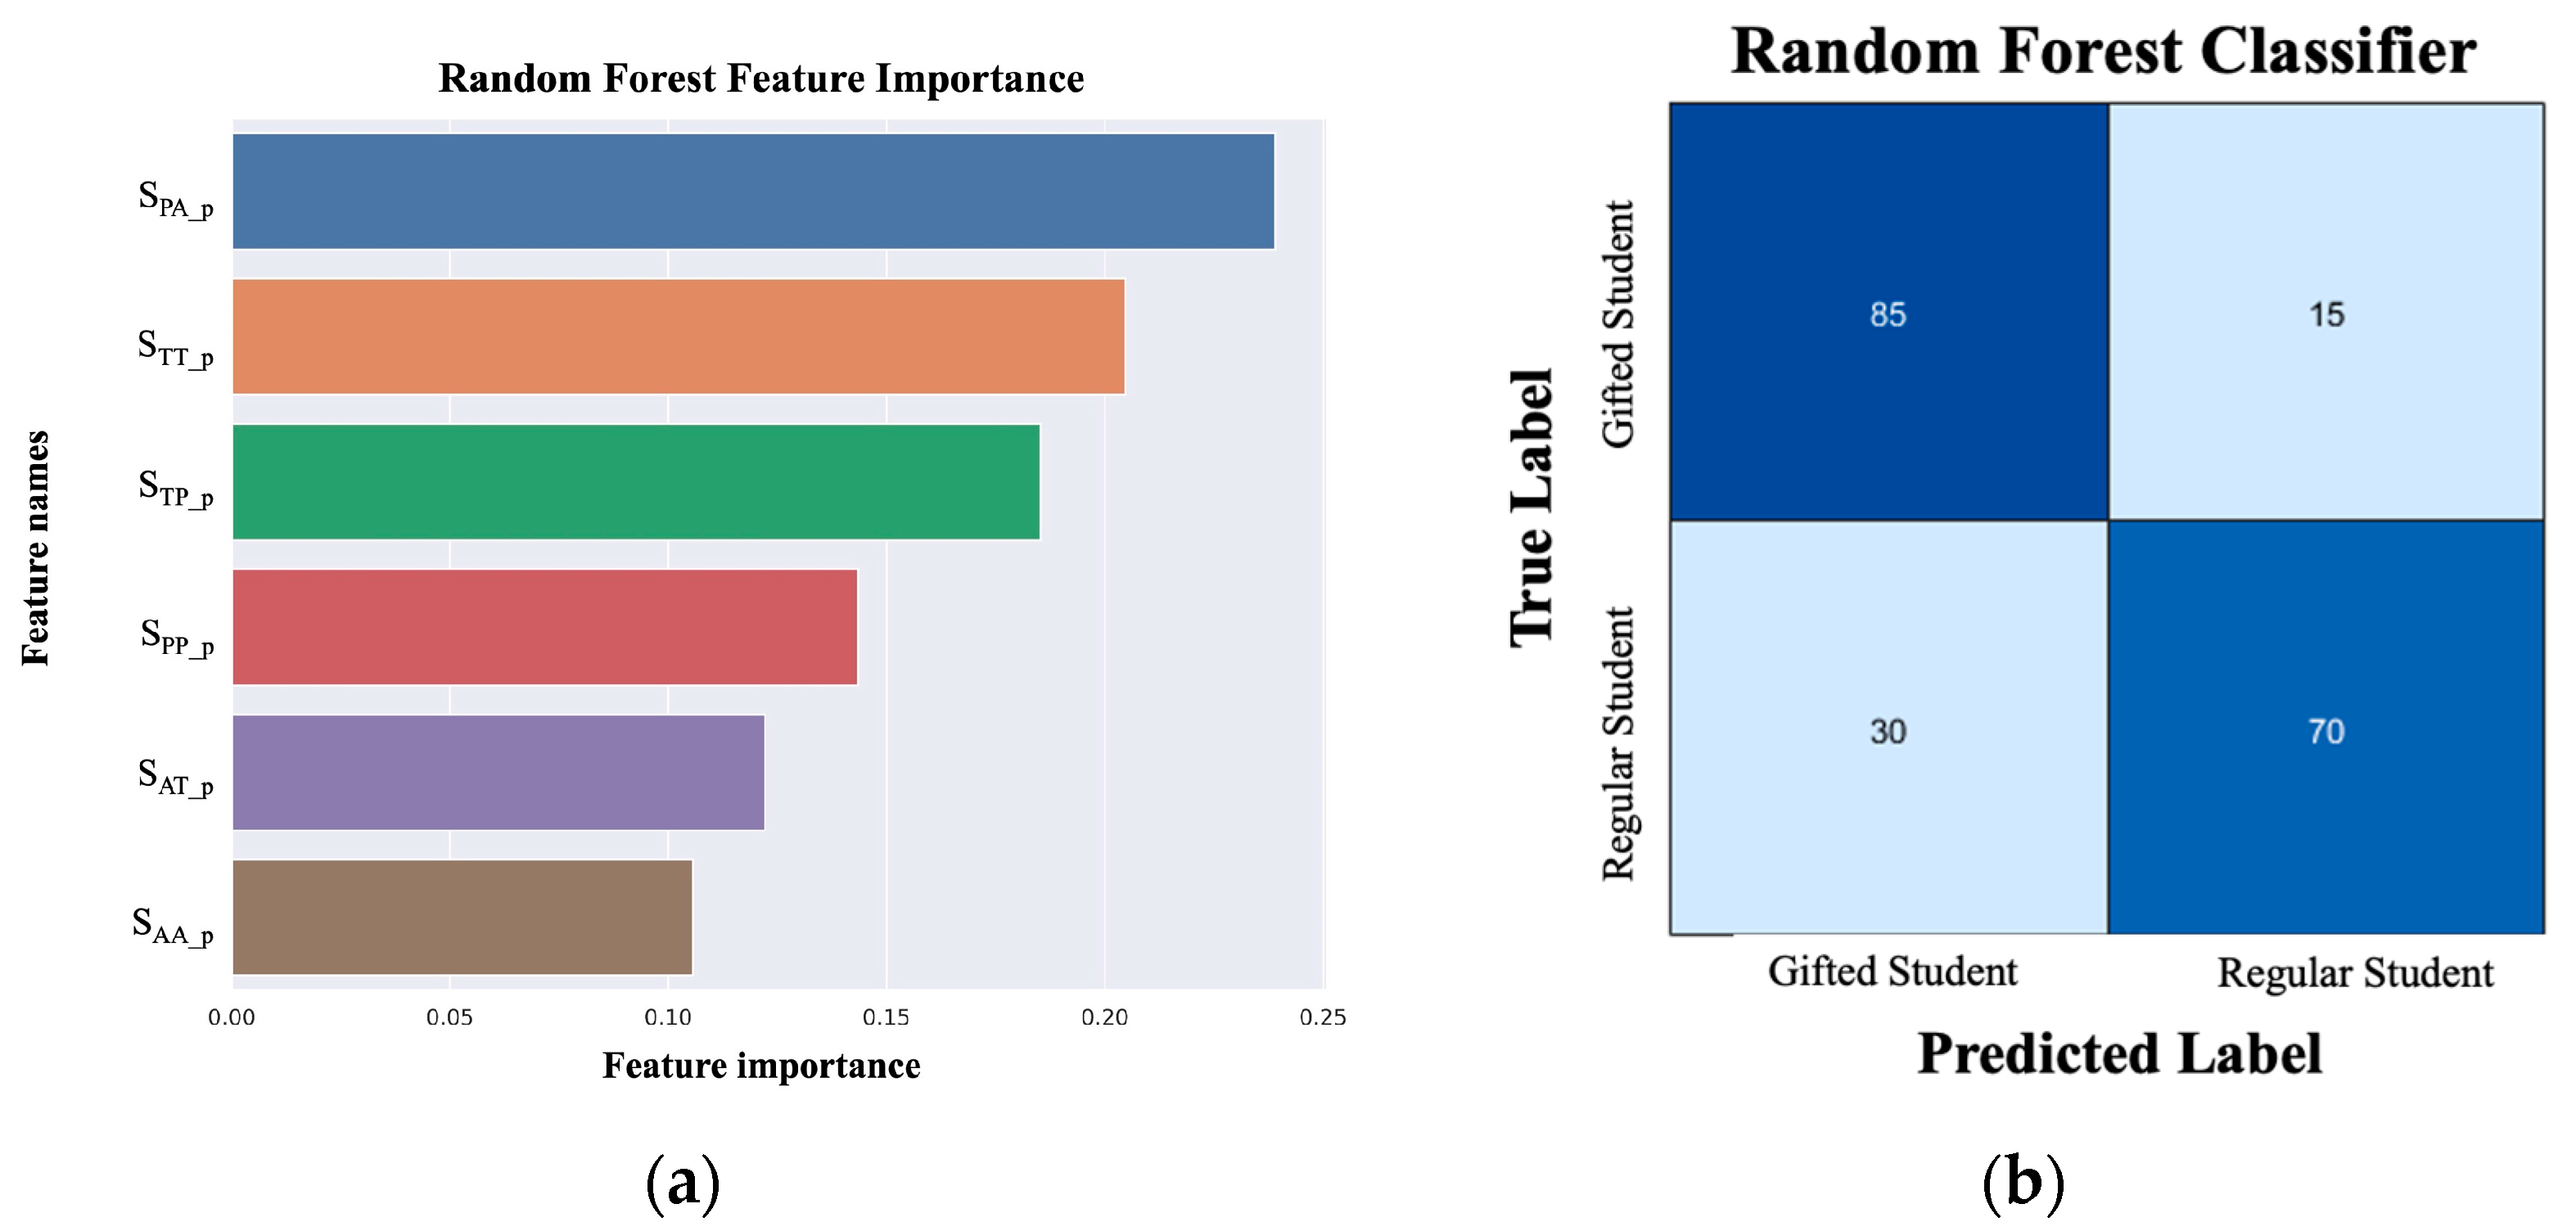
By inputting the SCR obtained from answering pMCQ and tMCQ into the RF, we can observe the differences in these two types of saccade features between the two groups of students. Figure 9 illustrates the classification results of inputting the six SCR features from pMCQ into the RF. The results indicate that using the six SCR features from pMCQ achieves a discrimination accuracy of 77.5%, demonstrating significant differences in these SCR features between gifted students and regular students. Further ranking the importance of these six features, Figure 9a shows that the importance values for STT_p, STP_p, SPP_p, SPA_p, SAA_p, and SAT_p were 0.205, 0.185, 0.143, 0.239, 0.106, and 0.122, respectively, with the sum of feature importance normalized to one. Particularly noteworthy is that SPA_p, STP_p, and STT_p had higher importance than SPP_p, SAT_p, and SAA_p features. It is worth noting that although SPA_p may not have the highest proportion of eye-movement transitions in SCR, its discriminative importance between gifted and regular students is the highest.
Figure 9.
Outcomes of the Random Forest using SCR from pMCQ as input features. (a) Feature importance as output by the Random Forest. (b) Confusion matrix of the Random Forest classification results.
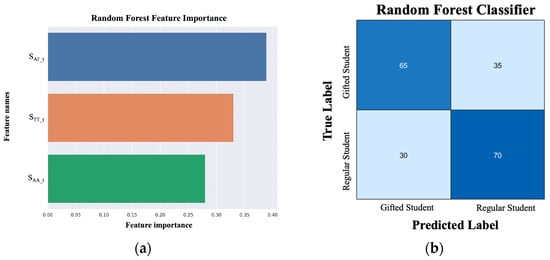
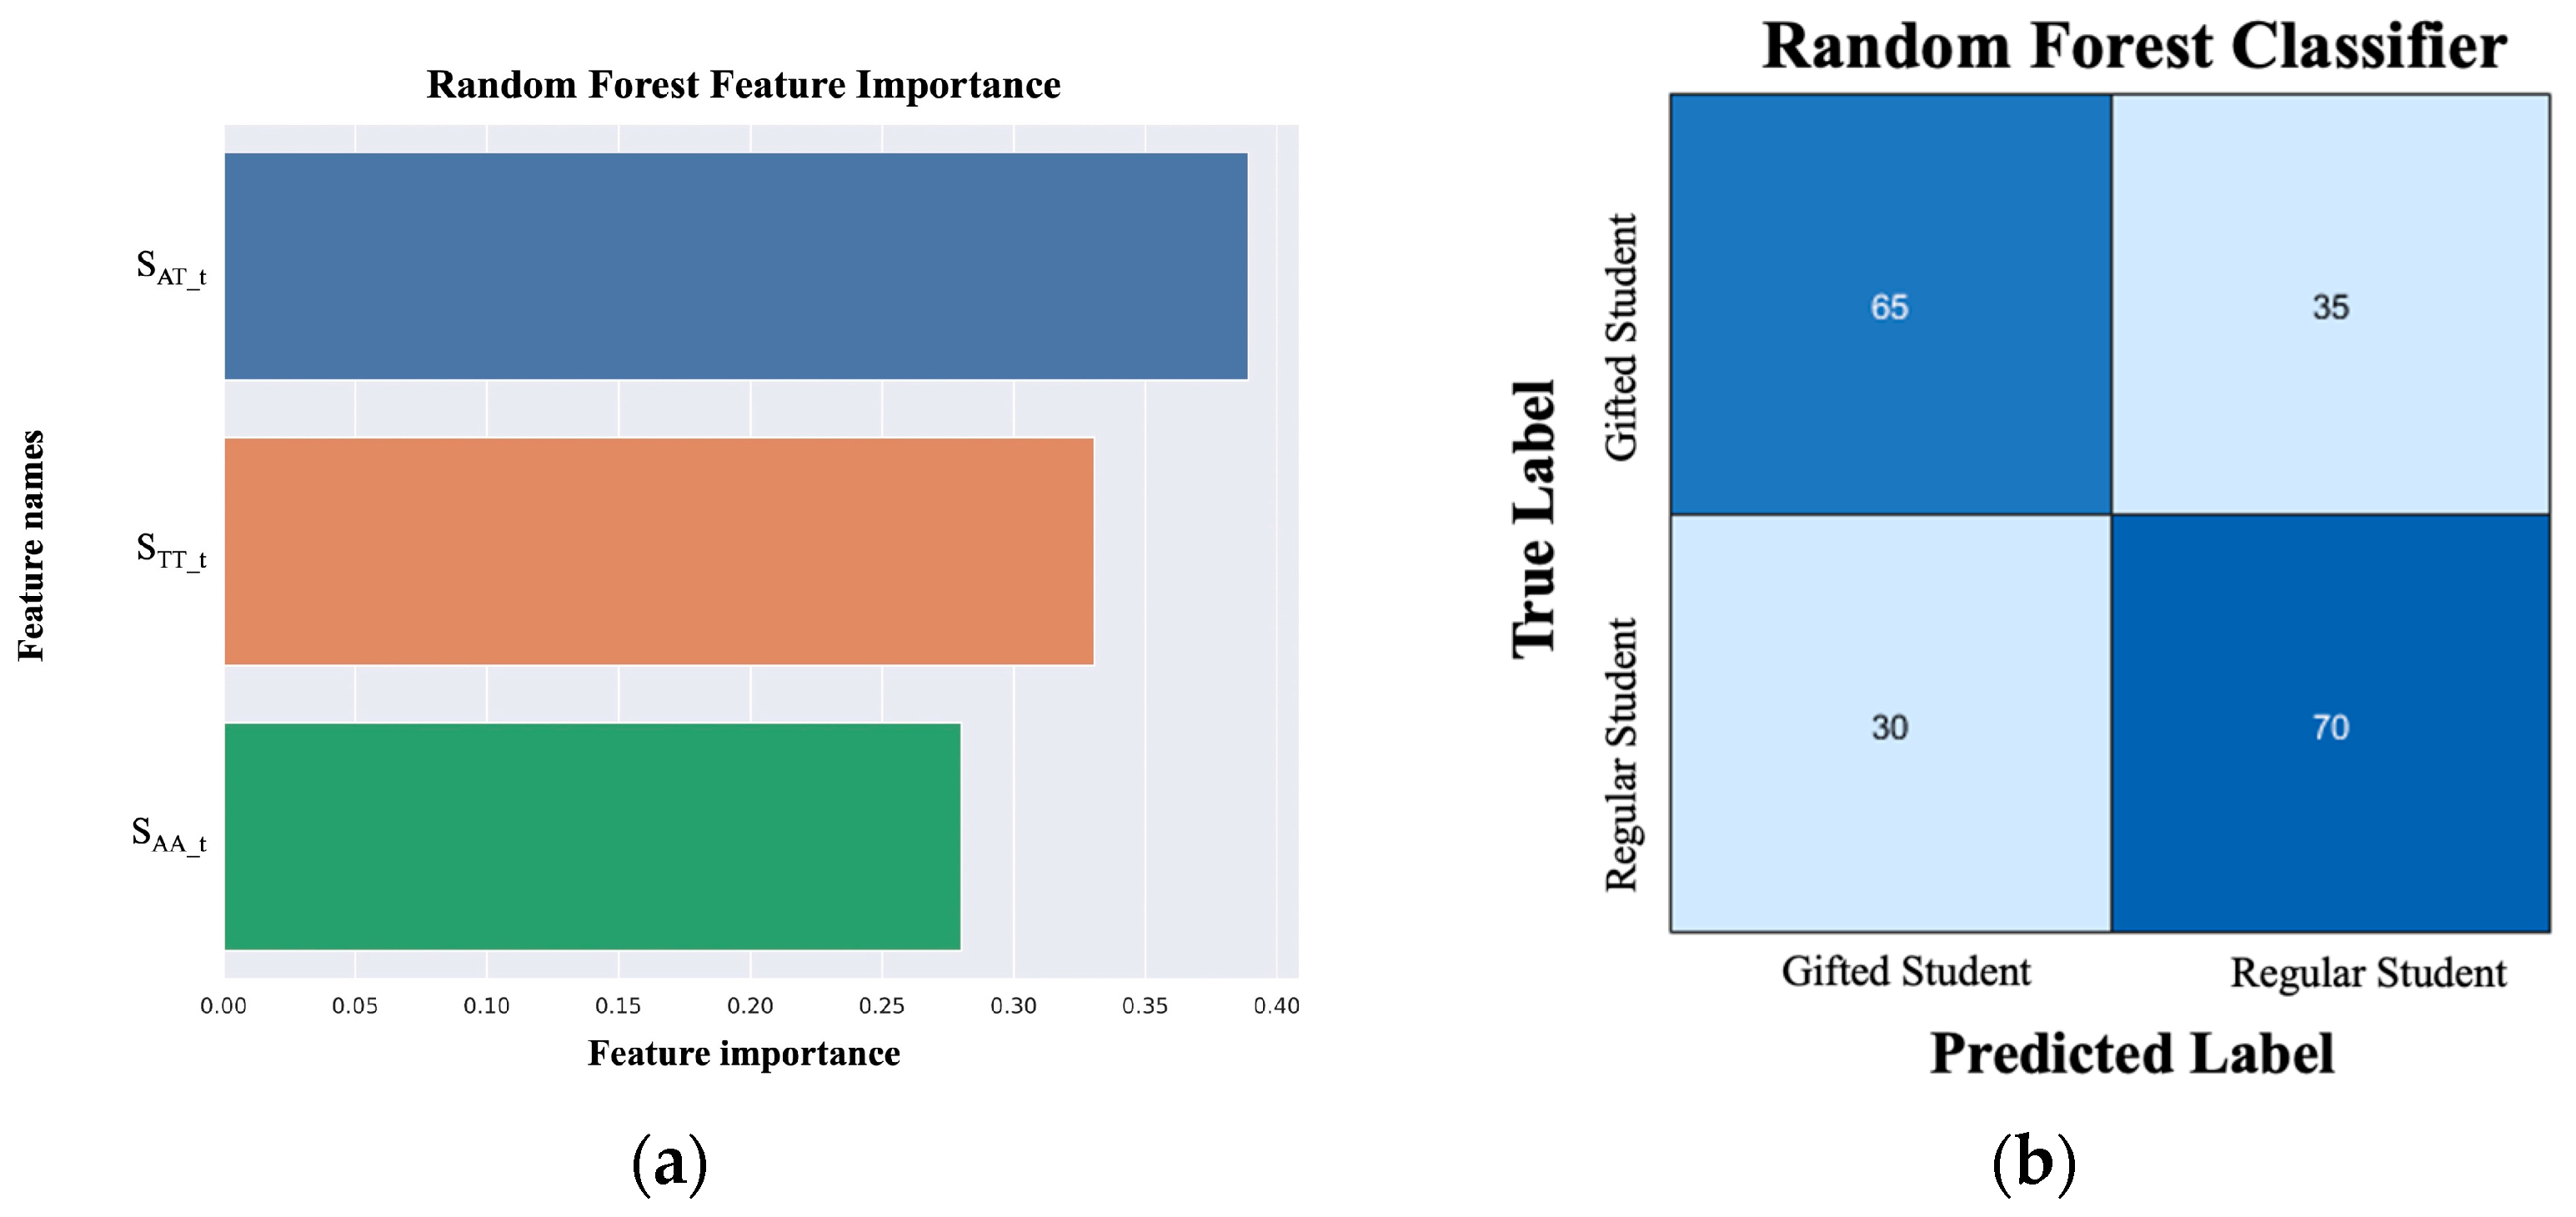
Inputting the SCR obtained from tMCQ into the RF also revealed a high classification accuracy of 67.5% with eye-movement transition features of text-to-text, answer-to-answer, and text-to-answer (see Figure 10b). The feature importance values for STT_t, SAA_t, and SAT_t were 0.331, 0.280, and 0.389, respectively, with the sum of feature importance normalized to one (see Figure 10a). The high importance of SAT_t echoes the significance of SPA_p in pMCQ, suggesting that gifted students attempted to integrate the relationships between pictures, text, and answers after understanding the problem. This observation is consistent in tMCQ, where SPA_t was also identified as the most important feature for distinguishing between the two groups of students.
Figure 10.
Outcomes of the Random Forest using SCR from tMCQ as input features. (a) Feature importance as output by the Random Forest. (b) Confusion matrix of the Random Forest classification results.
4. Discussion
In this study, eye-tracking technology was employed to explore how students, matched in age and prior knowledge and spanning both gifted and average abilities, construct strategies for problem-solving tasks. The analysis of behavioral data aimed to illuminate the distinct strategies elicited by problem-solving tasks. Based on the eye–mind hypothesis and the immediacy hypothesis (Just & Carpenter, 1980) [25], it is posited that the location of eye fixations is associated with cognitive processes at that location, suggesting that eye movements can reflect mental information processing. Furthermore, the immediacy hypothesis contends that information processing occurs immediately upon perception. Research suggests that the frequency and duration of eye fixations on ROIs, quantified by the frequency of gaze entries and exits, along with the total fixation time within an ROI, reveals the significance of the ROI in reading and the perceived amount of information [26,27]. Moreover, the transitions between ROIs, or the frequency of eye movements from one ROI to another, are considered an integration of the content presented within the ROIs [28]. This study hypothesized that gifted and regular students would employ different problem-solving strategies for various question structures. According to Hegarty et al. (1995) [9], gifted students answer questions by constructing problem models, whereas regular students employ a direct translation strategy, searching for answers within the text area. This rationale underpins the design of questions with and without informative pictures to observe whether students from different groups utilized pictorial information to achieve problem-solving objectives. Gifted students were believed to value the integration of information related to pictures, text, and answer options, whereas regular students focused more on the direct correlation between text and answers.
By analyzing the average response time and accuracy of gifted and regular students in both pMCQ and tMCQ formats, we found that although there was no significant difference in the time taken to answer the questions between the two groups, the accuracy in discriminating gifted students from regular students was significantly higher in pMCQ than in tMCQ. In the pMCQ condition using the SCR feature, the average accuracy for identifying gifted and regular students was 85% and 70%, respectively, while in the tMCQ condition using the SCR feature, it was 65% and 70%, respectively. This indicates that for regular students, the classification performance did not differ significantly between pMCQ and tMCQ. However, for gifted students, incorporating images with informational content into the questions greatly improved the machine learning model’s ability to distinguish them. It can be observed that gifted students exhibit more distinct SCR feature patterns in eye-tracking data compared to regular students when solving pMCQs, whereas such differences are less pronounced in tMCQs. This discrepancy led to a drop in the classification accuracy for gifted students from 85% in pMCQ to 65% in tMCQ. These findings suggest that using image-based questions results in better identification of student groups, highlighting the positive impact of visual information on answer accuracy.
Comparing the answer accuracies obtained from pMCQ and tMCQ, the average accuracy was 0.68 vs. 0.46 in gifted students and was 0.38 vs. 0.27 in regular students. This suggests that gifted students are more adept at utilizing picture information in problem solving. From Figure 5a and Figure 8a, it can be observed that gifted students had higher FTR in pictures than regular students (0.38 ± 0.13 vs. 0.32 ± 0.11; p < 0.05, Student’s t-test), while in the text zone, gifted students had lower fixation time ratios compared to regular students (0.33 ± 0.14 vs. 0.39 ± 0.15; p < 0.05). There was no difference in the answer zone between the two groups of students (0.29 ± 0.14 vs. 0.29 ± 0.14; p = 0.9854). In terms of SCR features, gifted students also exhibited significantly higher eye-movement transitions between pictures and answers compared to regular students. This pattern suggests that gifted students may have engaged in greater cross-referencing between textual and pictorial information during problem solving, whereas regular students tended to devote relatively more visual attention to processing textual representations.
Many studies suggest saccade features between different ROIs are important indicators in cognitive process analysis [28,29,30]. Compared with high-end eye-tracking systems operating at sampling frequencies of 250–1000 Hz, this study employed the EyeTribe device with a sampling rate of 30 Hz. The rationale for this choice lies in the nature of our analytical requirements, which do not involve high-frequency oculomotor features such as micro-saccades, saccade velocity profiles [31], or other fine-grained dynamic eye-movement parameters. Instead, the study focuses on fixation time ratio (FTR) and saccade count ratio (SCR), both of which represent region-level, low-frequency measures of information-integration behavior. These indicators require substantially lower temporal resolution than what is needed in high-frequency eye-movement research. According to a methodological synthesis by Holmqvist et al. (2011) [24], fixation durations typically range from approximately 200–300 ms, while saccades generally last about 30–80 ms. Given these temporal characteristics, eye-tracking devices operating at 30–60 Hz are sufficient for reliably measuring ROI-based fixation behavior and cross-region saccade transitions, as these measures do not require capturing high-speed ocular micro-movements. Furthermore, recent educational studies—including research on reading comprehension [32], cognitive load [33], and scientific reasoning [34]—have successfully employed 30 Hz Tobii or EyeTribe devices and have reported robust and valid region-level eye-movement indicators. Therefore, within the framework of this study, which centers on “cross-region information-integration behavior,” the EyeTribe device, despite not being a high-end eye-tracker, provides adequate sampling resolution and spatial accuracy to support analyses of fixation distribution and cross-region saccade patterns. Its performance is fully sufficient to generate interpretable and reliable findings aligned with the study’s objectives.
Inhoff & Radach (1998) [35] further proposed that the saccadic state during problem solving reflects the integration of information across different ROI areas. Given that participants may differ in their response times, we adopted the ratio of saccade counts (SCR), rather than absolute saccade numbers, to better capture the behavioral differences between gifted and regular students. As shown in Figure 9b, SCR exhibited stronger discriminative power than FTR. In contrast to studies relying solely on fixation duration for cognitive-process analysis, fixation-based metrics may include periods of cognitive idleness or processes unrelated to problem solving, potentially causing ambiguity in interpretation. By comparison, SCR provides a more sensitive and stable indicator of how students transition across information regions while constructing problem representations.
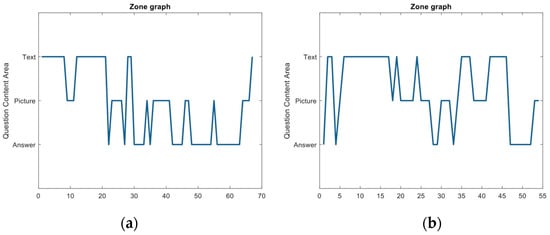
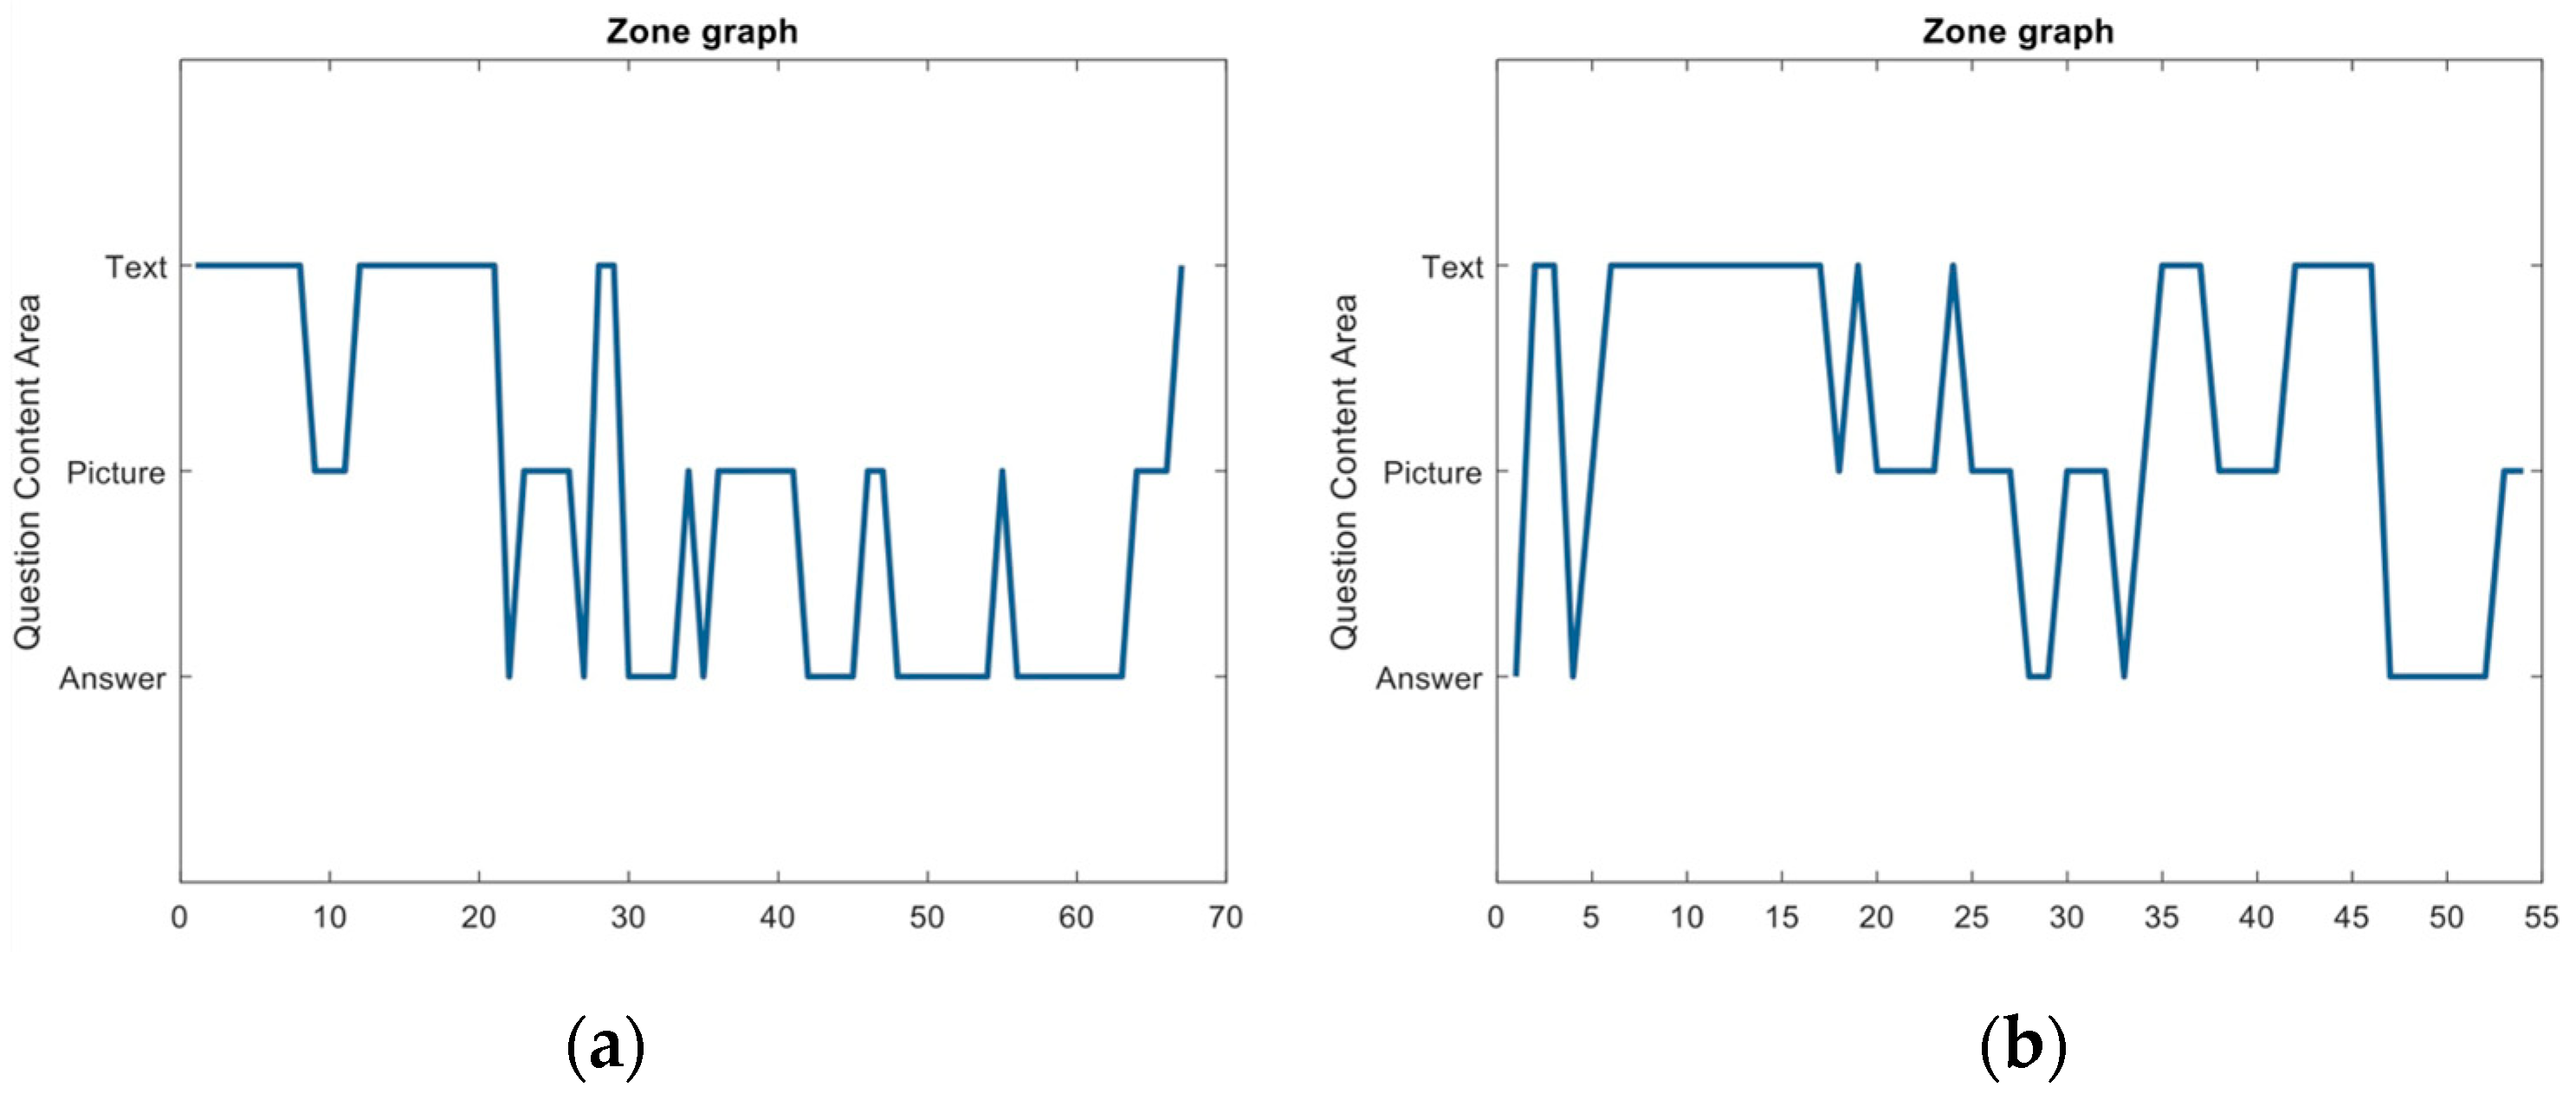
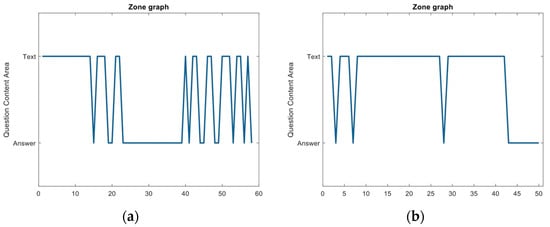
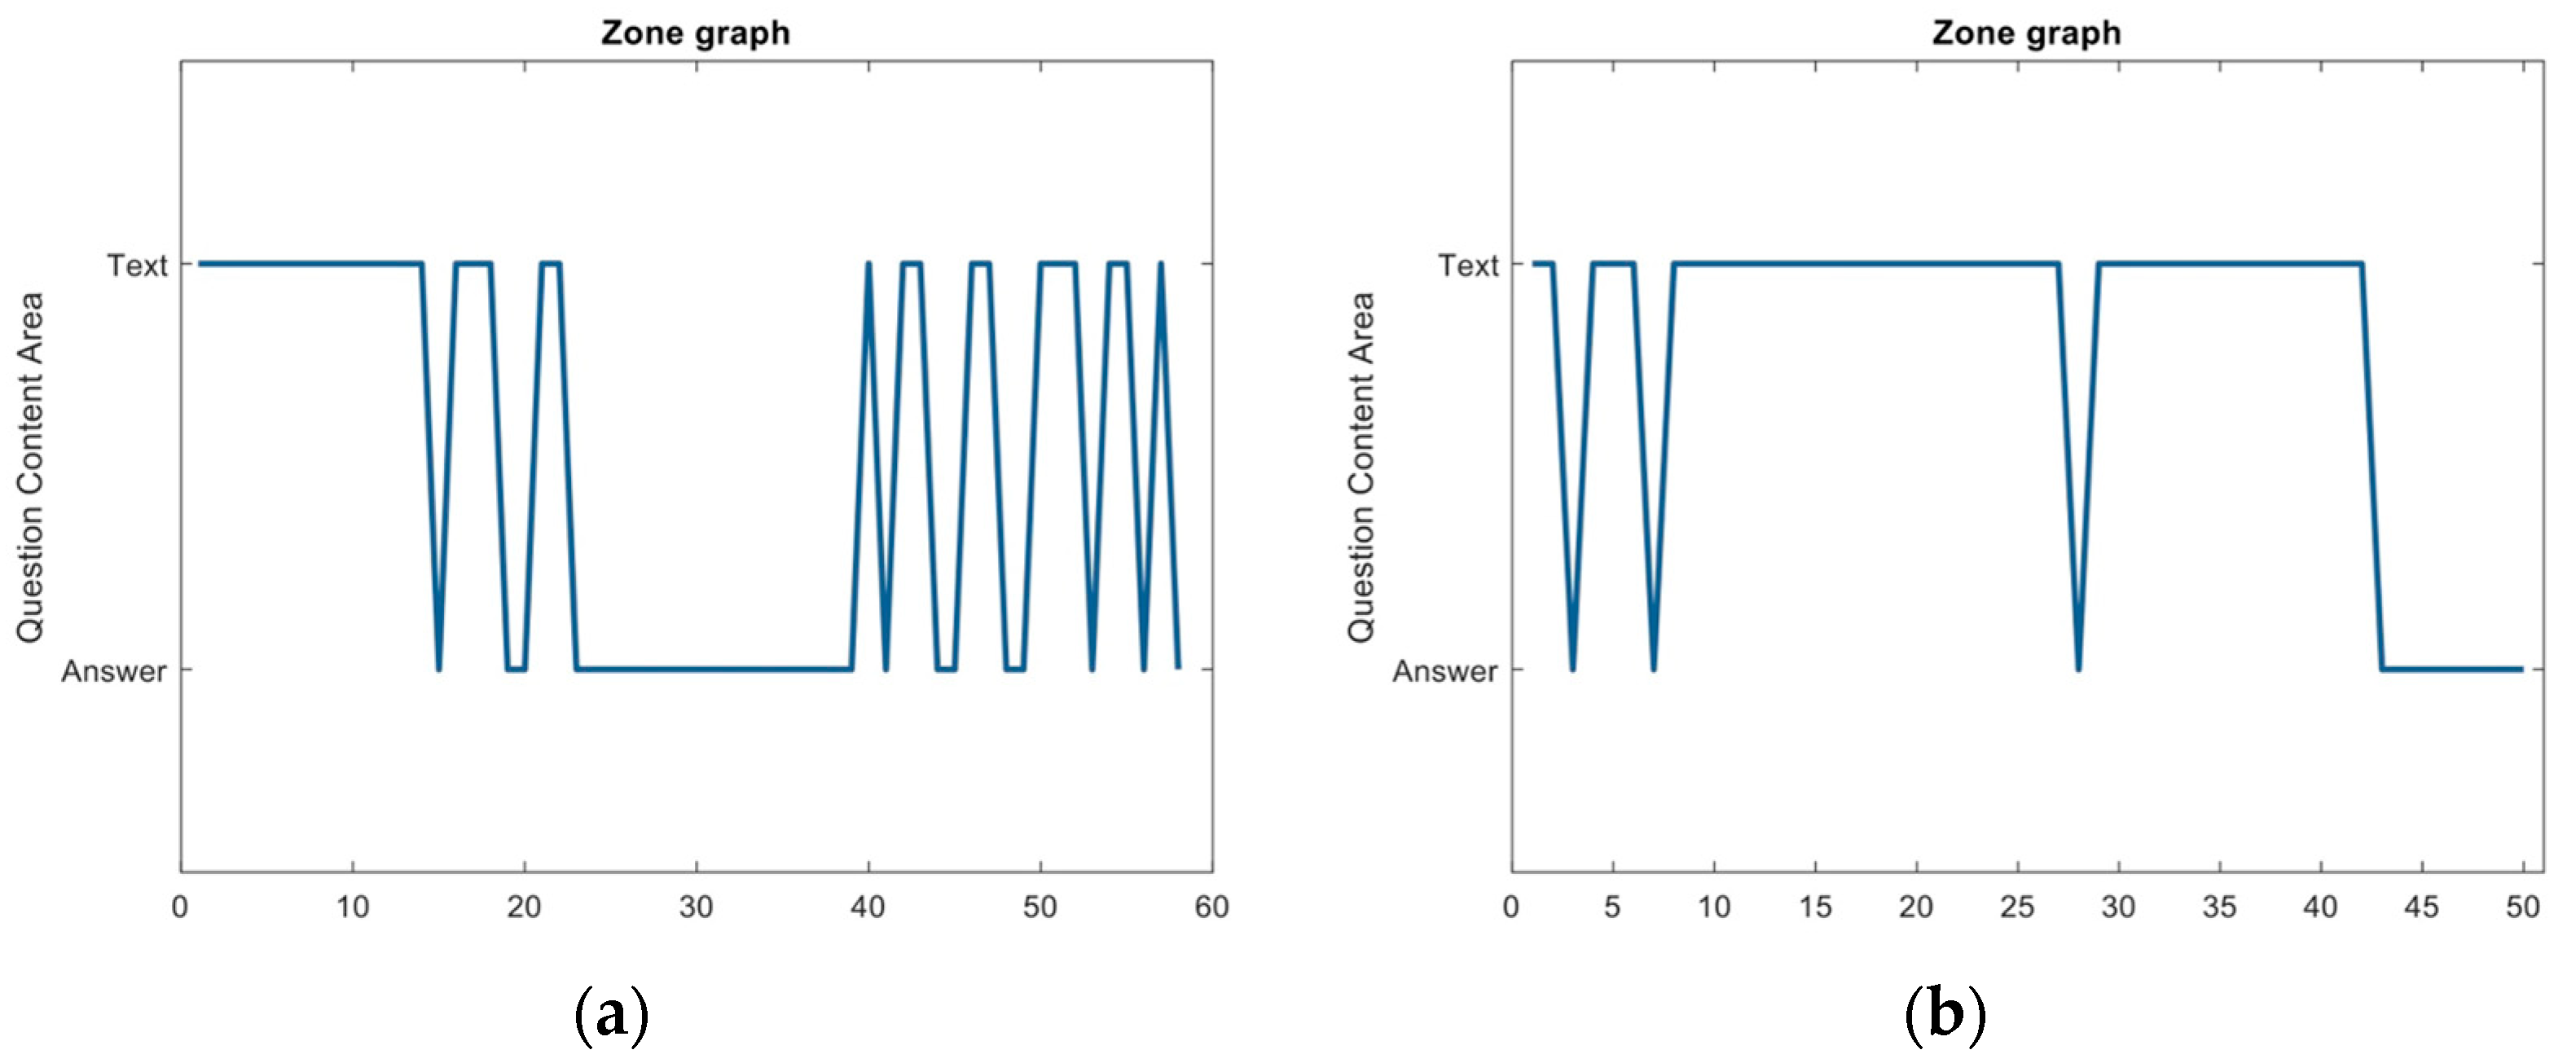
In order to comprehend the differences in problem-solving strategies between gifted and regular students, the eye-tracking zone graphs of a gifted student (Participant 12) and a regular student (Participant 30) in the first question of pMCQ and the tenth question of tMCQ are demonstrated. Eye-tracking zone graphs illustrate the gaze-shifting patterns of participants over time, recording changes in their eye movements. Figure 11 shows the zone graphs of two students while solving a pMCQ. The gifted student spent 70.20 s and answered the question correctly, whereas the regular student spent 56.66 s and provided an incorrect answer. During the problem-solving process, the gifted student’s gaze frequently shifted between the picture and the answer zones, while the regular student devoted more time to the text zone, indicating a deeper focus on understanding the problem representation. Figure 12 presents the zone graphs of a gifted student and a regular student during tMCQ tasks. As illustrated, the gifted student showed relatively more frequent gaze transitions between the text and answer regions, whereas the regular student tended to maintain their gaze predominantly within the text region. This pattern reflects differences in visual attention allocation across regions rather than direct evidence of underlying cognitive processes. Specifically, the regular student devoted a larger proportion of visual attention to the text region, while the gifted student demonstrated more frequent shifts between the question content and answer options. These gaze behaviors are consistent with differing approaches to information use during problem solving, although no direct inference about internal cognitive strategies can be made based on eye-tracking data alone.
Figure 11.
Comparison of zone graphs for pMCQ. (a) The zone graph of a gifted student. (b) The zone graph of a regular student.
Figure 12.
Comparison of zone graphs for tMCQ. (a) The zone graph of a gifted student. (b) The zone graph of a regular student.
To further investigate how gifted and regular students differ in their problem-solving strategies, this study employed a RF classifier to analyze the FTR and SCR features. The use of RF represents an important methodological contribution in eye-tracking studies, as traditional statistical analyses typically examine variables independently and therefore cannot capture the multivariate, interaction-based nature of cognitive strategies [36,37,38,39]. In contrast, RF integrates predictions from multiple decision trees, enhancing model stability and generalization while effectively identifying complex, nonlinear patterns within eye-movement data. Consistent with this analytical advantage, our results revealed that SCR features—particularly those from pMCQ items—achieved a classification accuracy of 77.5%, substantially outperforming FTR features and all tMCQ-based features. These findings suggest that saccade-based measures may be more sensitive to differences in observable information-transition behavior than fixation-duration metrics, particularly because fixation time can include intervals not directly related to active task engagement. In contrast, saccade transitions capture changes in gaze location across regions, which are more closely associated with shifts in visual attention at the behavioral level. The feature-importance analysis further indicated that transitions such as picture-to-answer and text-to-picture transitions contributed more strongly to classification performance, highlighting their relative importance in distinguishing gaze-transition patterns between student groups. Overall, the use of machine learning approaches such as RF Classifier provides a complementary analytical framework for examining multivariate eye-movement features. Rather than replacing conventional analyses, these methods offer an exploratory means of characterizing differences in problem-solving-related visual behavior between gifted and regular learners.
To address concerns regarding the credibility and robustness of the classification results, we implemented a thorough validation strategy and baseline model comparison. Specifically, the choice of using a RF classifier with 15 decision trees (m = 15) was not arbitrary; it was based on empirical evaluation across a range of configurations (m = 1–99), using leave-two-out cross-validation (i.e., each fold held out one gifted and one regular student). This setup allowed us to balance model simplicity, accuracy, and generalizability, mitigating the risk of overfitting despite the modest dataset size. As summarized in Table 2, the RF classifier outperformed the other three baseline classifiers—Support Vector Machine (SVM), Bayesian Classifier (BC), and Linear Discriminant Analysis (LDA)—achieving the highest classification accuracy for both pMCQ and tMCQ tasks. Furthermore, across all four classifiers, the classification accuracy was consistently higher when using the pMCQ-derived features compared to those from tMCQ, suggesting that visual information (i.e., image-based questions) enhances the ability to distinguish between gifted and regular students. On average, pMCQ features yielded a 12.95% improvement in classification accuracy over tMCQ features, indicating a substantial performance gap and reinforcing the discriminative value of image-enhanced reasoning questions in eye-tracking-based cognitive modeling.
Table 2.
Classification accuracies of four models (Random Forest, Support Vector Machine, Bayesian Classifier, and Linear Discriminant Analysis) for pMCQ and tMCQ eye-tracking features.
Based on the feature-importance outputs of the Random Forest analysis, differences were observed in the relative contribution of specific eye-movement features to classification performance. For the pMCQ condition, several SCR features, including SPA_p, STT_p, and STP_p, showed stronger influence on the classifier’s predictions, indicating that transitions involving text, picture, and answer regions were particularly informative for distinguishing between student groups. In the tMCQ condition, SCR features related to transitions between text and answer regions contributed more prominently to classification performance, suggesting that gaze shifts between these regions played a larger role when pictorial information was absent. Across both question types, regular students exhibited higher proportions of fixation time within the text region, whereas gifted students demonstrated relatively more cross-region gaze transitions. These patterns reflect differences in observable visual-attention allocation and information-navigation behavior during problem solving. It is noteworthy that while certain transition features showed limited importance in pMCQ, they became more influential in tMCQ, highlighting the task-dependent nature of gaze-transition patterns. This observation underscores that the relative importance of eye-movement features varies with question format rather than reflecting a single, generalized strategy. Regarding the most difficult item in the assessment (Question 18), which yielded the lowest overall accuracy, gifted students exhibited longer response times than regular students, despite similarly low correctness rates in both groups. This difference in response duration suggests variation in task engagement or response behavior under challenging conditions [40], although no direct inference about underlying cognitive strategies or motivational factors can be drawn from response time data alone.
5. Conclusions
This study examined eye-movement behaviors of gifted and regular students across two types of scientific reasoning questions. Although SCR were associated with group differences and classification performance, the present study does not establish a causal link between gaze transitions and specific cognitive operations. Accordingly, eye-tracking measures are interpreted as indicators of observable visual-attention behavior rather than direct measures of cognitive depth or reasoning processes. In addition, the observed patterns may also be influenced by factors beyond problem-solving strategy, such as reading proficiency, familiarity with visual representations, and individual test-taking styles. Four main findings can be summarized. First, in picture-embedded multiple-choice questions (pMCQs), gifted students allocated a greater proportion of fixation time to picture regions, whereas regular students devoted relatively more attention to text regions, reflecting differences in attention distribution across information sources. Second, group differences were more evident in saccade-based measures (SCR) than in fixation-based measures (FTR), suggesting that cross-region gaze transitions are particularly informative for distinguishing visual-attention patterns. Third, these differences were less pronounced in text-only questions (tMCQs), underscoring the task-dependent nature of eye-movement behavior. Fourth, Random Forest analyses showed higher discriminative performance for pMCQ-derived features than for tMCQ-derived features; however, these results should be interpreted conservatively as reflecting relative feature sensitivity rather than diagnostic capability. Overall, these findings indicate that eye tracking, when combined with exploratory machine learning analysis, can provide a useful framework for examining differences in problem-solving-related visual behavior. At the same time, caution is warranted in extending these observations to claims about underlying cognitive strategies or diagnostic distinctions between student groups.
Author Contributions
P.-L.L., S.-T.H., C.-Y.C., and L.B.; methodology, S.-T.H.; software, P.-L.L., S.-T.H., and P.-H.C.; validation, P.-L.L.,S.-T.H.,T.-K.Y., and L.-C.L.; formal analysis, P.-L.L., S.-T.H., P.-H.C., C.-Y.C., and L.B.; investigation, C.-Y.C. and L.B.; resources, P.-L.L.; data curation, S.-T.H.; writing—original draft preparation, P.-L.L. and S.-T.H.; writing—review and editing, C.-Y.C. and L.B.; visualization, S.-T.H.; supervision, C.-Y.C. and L.B.; project administration, C.-Y.C. and L.B.; funding acquisition, P.-L.L. All authors have read and agreed to the published version of the manuscript.
Funding
This work was supported by the National Science and Technology Council, Taiwan, under Grant NSTC 113-2640-B-008-001, 111-2217-E-008-001-MY3, 111-2221-E-008-102-MY3, 111-2622-E-008-013, 111-2410-H003-032-MY3, MOST110-2511-H-003-024 MY3, MOST110-2423-H-003-003, 110-2823-E-008-002-MY3, 110-2221-E-008-095-MY3.
Data Availability Statement
The collected data are still in processing for next paper.
Acknowledgments
We express our gratitude to Lei Bao, the Department of Physics at The Ohio State University, USA, for providing the iSTAR assessment, which contributed to the completion of this research. We also appreciate the assistance of Mingdao High School in Taiwan for their support in recruiting participants for this study.
Conflicts of Interest
The authors declare no conflicts of interest.
Abbreviations
The following abbreviations are used in this manuscript:
| pMCQ | Multiple-choice questions with an informative picture |
| tMCQ | Multiple-choice questions with text only |
| FText_p | The proportion of fixation time on the text region in pMCQ |
| FPicture_p | The proportion of fixation time on the picture region in pMCQ |
| FAnswer_p | The proportion of fixation time on the answer region in pMCQ |
| STT_p | The proportion of text-to-text transitions in pMCQ |
| STP_p | The proportion of text-to-picture transitions in pMCQ |
| SPP_p | The proportion of picture-to-picture transitions in pMCQ |
| SPA_p | The proportion of picture-to-answer transitions in pMCQ |
| SAA_p | The proportion of answer-to-answer transitions in pMCQ |
| SAT_p | The proportion of answer-to-text transitions in pMCQ |
| FText_t | The proportion of fixation time on the text region in tMCQ |
| FAnswer_t | The proportion of fixation time on the answer region in tMCQ |
| STT_t | The proportion of text-to-text transitions in tMCQ |
| SAA_t | The proportion of answer-to-answer transitions in tMCQ |
| SAT_t | The proportion of answer-to-text transitions in tMCQ |
References
- Kuhn, D. Science as argument: Implications for teaching and learning scientific thinking. Sci. Educ. 1993, 77, 319–337. [Google Scholar] [CrossRef] [Scilit]
- Driver, R.; Newton, P.; Osborne, J. Establishing the norms of scientific argumentation in classrooms. Sci. Educ. 2000, 84, 287–312. [Google Scholar] [CrossRef]
- Zohar, A.; Nemet, F. Fostering students’ knowledge and argumentation skills through dilemmas in human genetics. J. Res. Sci. Teach. 2002, 39, 35–62. [Google Scholar] [CrossRef] [Scilit]
- Branscomb, A.W. Knowing how to know. Sci. Technol. Hum. Values 1981, 6, 5–9. [Google Scholar] [CrossRef] [Scilit]
- Laugksch, R.C. Scientific literacy: A conceptual overview. Sci. Educ. 2000, 84, 71–94. [Google Scholar] [CrossRef] [Scilit]
- Mayer, R.E. Thinking, Problem Solving, Cognition; WH Freeman/Times Books/Henry Holt & Co.: New York, NY, USA, 1992. [Google Scholar]
- Lewis, A.B.; Mayer, R.E. Students’ miscomprehension of relational statements in arithmetic word problems. J. Educ. Psychol. 1987, 79, 363–371. [Google Scholar] [CrossRef]
- Alibali, M.W.; Phillips, K.M.; Fischer, A.D. Learning new problem-solving strategies leads to changes in problem representation. Cogn. Dev. 2009, 24, 89–101. [Google Scholar] [CrossRef] [Scilit]
- Hegarty, M.; Mayer, R.E.; Monk, C.A. Comprehension of arithmetic word problems: A comparison of successful and unsuccessful problem solvers. J. Educ. Psychol. 1995, 87, 18–32. [Google Scholar] [CrossRef]
- Zhang, C.; Tsimpli, I.; Schmidt, E. Text and picture integration during bridging information processing: A comparison of English and Chinese L1 and L2 speakers. Mem. Cogn. 2025, 53, 2451–2473. [Google Scholar] [CrossRef] [Scilit]
- Agrawal, J.; Morin, L.L. Evidence–based practices: Applications of concrete representational abstract framework across math concepts for students with mathematics disabilities. Learn. Disabil. Res. Pract. 2016, 31, 34–44. [Google Scholar] [CrossRef] [Scilit]
- Duke, N.K.; Carlisle, J. The development of comprehension. In Handbook of Reading Research, Volume IV; Routledge: Oxfordshire, UK, 2011; pp. 199–228. [Google Scholar]
- Tóthová, M.; Rusek, M. Eye Tracking in Science Education Research: Comprehensive Literature Review: M. Tóthová and M. Rusek. Sci. Educ. 2025, 34, 4583–4626. [Google Scholar] [CrossRef] [Scilit]
- Daumiller, M.; Böheim, R.; Alijagic, A.; Lewalter, D.; Gegenfurtner, A.; Seidel, T.; Dresel, M. Guiding attention in the classroom: An eye-tracking study on the associations between preservice teachers’ goals and noticing of student interactions. Br. J. Educ. Psychol. 2025, 95, S115–S132. [Google Scholar] [CrossRef] [Scilit]
- Shahnabati, F.; Sabourifard, A.; Amiri, S.H.; Bosaghzadeh, A.; Ebrahimpour, R. Cognitive load and visual attention assessment using physiological eye tracking measures in multimedia learning. PLoS ONE 2025, 20, e0337195. [Google Scholar] [CrossRef] [Scilit]
- Mesmoudi, S.; Hommet, S.; Peschanski, D. Eye-tracking and learning experience: Gaze trajectories to better understand the behavior of memorial visitors. J. Eye Mov. Res. 2020, 13, 1–15. [Google Scholar] [CrossRef] [Scilit] [PubMed]
- Goldberg, J.H.; Stimson, M.J.; Lewenstein, M.; Scott, N.; Wichansky, A.M. Eye tracking in web search tasks: Design implications. In Proceedings of the 2002 Symposium on Eye Tracking Research & Applications, New Orleans, LA, USA, 25–27 March 2002; pp. 51–58. [Google Scholar]
- Trabulsi, J.; Norouzi, K.; Suurmets, S.; Storm, M.; Ramsøy, T.Z. Optimizing fixation filters for eye-tracking on small screens. Front. Neurosci. 2021, 15, 578439. [Google Scholar] [CrossRef] [Scilit]
- Kochhar, P. Visual Social-Emotional Attention in ADHD Including the Impact of Autism. Ph.D. Thesis, University of Nottingham, Nottingham, UK, 2020. [Google Scholar]
- Bao, L.; Koenig, K. Physics education research for 21st century learning. Discip. Interdiscip. Sci. Educ. Res. 2019, 1, 2. [Google Scholar] [CrossRef] [Scilit]
- Bao, L.; Koenig, K.; Xiao, Y.; Fritchman, J.; Zhou, S.; Chen, C. Theoretical model and quantitative assessment of scientific thinking and reasoning. Phys. Rev. Phys. Educ. Res. 2022, 18, 010115. [Google Scholar] [CrossRef] [Scilit]
- Krassanakis, V. PeyeMMV: Python implementation of EyeMMV’s fixation detection algorithm. Softw. Impacts 2023, 15, 100475. [Google Scholar] [CrossRef] [Scilit]
- Breiman, L. Random forests. Mach. Learn. 2001, 45, 5–32. [Google Scholar] [CrossRef] [Scilit]
- Holmqvist, K.; Nyström, M.; Andersson, R.; Dewhurst, R.; Jarodzka, H.; Van de Weijer, J. Eye Tracking: A Comprehensive Guide to Methods and Measures; OUP Oxford: Oxford, UK, 2011. [Google Scholar]
- Just, M.A.; Carpenter, P.A. A theory of reading: From eye fixations to comprehension. Psychol. Rev. 1980, 87, 329–354. [Google Scholar] [CrossRef] [PubMed]
- Jacob, R.J.; Karn, K.S. Eye tracking in human-computer interaction and usability research: Ready to deliver the promises. In The Mind’s Eye; Elsevier: Amsterdam, The Netherlands, 2003; pp. 573–605. [Google Scholar]
- Friedman, A.; Liebelt, L.S. On the time course of viewing pictures with a view towards remembering. In Eye Movements; Routledge: Oxfordshire, UK, 2017; pp. 137–155. [Google Scholar]
- Johnson, C.I.; Mayer, R.E. An eye movement analysis of the spatial contiguity effect in multimedia learning. J. Exp. Psychol. Appl. 2012, 18, 178–191. [Google Scholar] [CrossRef] [Scilit]
- Lallé, S.; Conati, C.; Azevedo, R. Prediction of student achievement goals and emotion valence during interaction with pedagogical agents. In Proceedings of the 17th International Conference on Autonomous Agents and MultiAgent Systems, Stockholm, Sweden, 10–15 July 2018; pp. 1222–1231. [Google Scholar]
- Holsanova, J.; Holmberg, N.; Holmqvist, K. Reading information graphics: The role of spatial contiguity and dual attentional guidance. Appl. Cogn. Psychol. 2009, 23, 1215–1226. [Google Scholar] [CrossRef] [Scilit]
- Di Stasi, L.L.; Marchitto, M.; Antolí, A.; Cañas, J.J. Saccadic peak velocity as an alternative index of operator attention: A short review. Eur. Rev. Appl. Psychol. 2013, 63, 335–343. [Google Scholar] [CrossRef] [Scilit]
- Sinha, A.; Kumar Saha, S.; Basu, A. Assessment of reading material with flow of eyegaze using low-cost eye tracker. In Computational Intelligence in Pattern Recognition: Proceedings of CIPR 2019; Springer: Berlin/Heidelberg, Germany, 2019; pp. 497–508. [Google Scholar]
- Čegovnik, T.; Stojmenova, K.; Jakus, G.; Sodnik, J. An analysis of the suitability of a low-cost eye tracker for assessing the cognitive load of drivers. Appl. Ergon. 2018, 68, 1–11. [Google Scholar] [CrossRef] [Scilit] [PubMed]
- Guan, T.; Yang, W.; He, Y. Eye-tracking technology in science education: A systematic review. Sci. Insights Educ. Front. 2025, 29, 4715–4738. [Google Scholar] [CrossRef] [Scilit]
- Inhoff, A.W.; Radach, R. Definition and computation of oculomotor measures in the study of cognitive processes. In Eye Guidance in Reading and Scene Perception; Elsevier: Amsterdam, The Netherlands, 1998; pp. 29–53. [Google Scholar]
- Akshay, S.; Megha, Y.; Shetty, C.B. Machine learning algorithm to identify eye movement metrics using raw eye tracking data. In Proceedings of the 2020 Third International Conference on Smart Systems and Inventive Technology (ICSSIT), Tirunelveli, India, 20–22 August 2020; pp. 949–955. [Google Scholar]
- Zemblys, R. Eye-movement event detection meets machine learning. In Proceedings of the 2016 1st International Conference on Biomedical Engineering (IBIOMED 2016), Yogyakarta, Indonesia, 5–6 October 2016; Volume 2017, p. 20. [Google Scholar]
- Zemblys, R.; Niehorster, D.C.; Komogortsev, O.; Holmqvist, K. Using machine learning to detect events in eye-tracking data. Behav. Res. Methods 2018, 50, 160–181. [Google Scholar] [CrossRef] [Scilit]
- Shojaeizadeh, M.; Djamasbi, S.; Paffenroth, R.C.; Trapp, A.C. Detecting task demand via an eye tracking machine learning system. Decis. Support Syst. 2019, 116, 91–101. [Google Scholar] [CrossRef] [Scilit]
- Keskin, M.; Ooms, K.; Dogru, A.O.; De Maeyer, P. Exploring the cognitive load of expert and novice map users using EEG and eye tracking. ISPRS Int. J. Geo-Inf. 2020, 9, 429. [Google Scholar] [CrossRef] [Scilit]

Disclaimer/Publisher’s Note: The statements, opinions and data contained in all publications are solely those of the individual author(s) and contributor(s) and not of MDPI and/or the editor(s). MDPI and/or the editor(s) disclaim responsibility for any injury to people or property resulting from any ideas, methods, instructions or products referred to in the content. |
© 2026 by the authors. Published by MDPI on behalf of the International Institute of Knowledge Innovation and Invention. Licensee MDPI, Basel, Switzerland. This article is an open access article distributed under the terms and conditions of the Creative Commons Attribution (CC BY) license.