


Abstract
This study presents a novel methodology integrating high-resolution X-ray computed tomography, digital volume correlation and statistical visualisation mapping, to perform microscale observations and correlate delamination fracture mechanisms in heterogeneous materials. To demonstrate the utility of this integrated approach, it is applied to study the damage behaviour of aerospace carbon/epoxy composite laminates with an open hole, subjected to quasi-static tension and fatigue at a load ratio of 1:10. The study also explores the applicability of a Paris law type relationship to determine effective macroscopic fatigue delamination resistance in the load-bearing plies. The X-ray imaging for both load cases revealed extensive formation of delaminated fracture surfaces surrounding both glass fibre interlacing weaves and entrained voids within them, acting as preferential sites for localised strain hot spots. It is demonstrated that local energy dissipation is governed by the recurring weave pattern and topological order, which can help explain the typical damage state in quasi-static behaviour, establishing a direct link between microstructural features and macrostructural material response.
1. Introduction
Primary aerospace structures are increasingly manufactured with composite materials. The most common manufacturing methodology for such components is based upon unidirectional fibres pre-impregnated with a thermoset resin, which are then laid up as laminates and cured [1]. Significant cost savings can be achieved, however, by employing liquid moulding processes, such as resin transfer moulding (RTM) for such structures [2]. Liquid moulding processes for structural parts typically begin with dry fibrous textile preforms, either woven or stitched, and then use vacuum and/or pressure to wet the fibres and infiltrate the preform with a thermoset matrix [3].
The utility of liquid moulded structures may be lessened by microstructural characteristics inherent to the process [4]. The fibre wet-out phase frequently induces the entrapment of bubbles due to the dual-scale nature of the reinforcement [5]. This dual-scale porosity initiates competing viscous and capillary flow dynamics, leading to the mechanical entrapment of microscopic bubbles that act as precursors to incipient crack formation [6]. The fibres are typically arranged in more than one direction in the dry reinforcements used in liquid moulding, to bind the textile together [7]. The fibres transverse to the flow direction may cause an accumulation of voids in the adjacent resin-rich region [8,9], by impeding the removal of such bubbles by the applied pressure gradient [10]. Initial work has indicated that materials made by liquid moulding may have a greater susceptibility to fatigue degradation due to such voids as well as misaligned fibres and resin-rich regions [11]. Further work is necessary to qualify RTM CFRP components to satisfy the requirements for future fatigue-resistant applications such as aircraft engine parts [12].
For developing advanced aerospace materials, damage resistance and damage tolerance in low-cycle fatigue are critical properties [13]. Aerospace design practice is moving from a conservative safe-life approach to a damage tolerance philosophy, where progressive damage is permitted if it can be predicted reliably [14]. This shift requires models that relate local microstructural variations to the effective properties of the bulk material [15], and these models must be consistent with the behaviour of multi-fibre volumes relevant to industrial applications [16]. A major challenge is to quantify how local phase geometries contribute to the initiation of macroscopic damage [13,17]. In aero-engine development, the standard approach is to (i) develop materials with reduced sensitivity to damage growth, (ii) minimise manufacturing defects through improved processing, and (iii) apply safety margins using modelling and functional testing, such as fan blade-off tests, to ensure that any damage remains non-critical within the specified service period [12,18]. Each strategy requires a quantitative, microstructure-sensitive characterisation methodology capable of linking localised manufacturing defects to macroscopic structural failure models—a capability that does not yet exist through experimental validation.
Textiles or resins can be chosen, or modified, to enhance resistance to damage. Carbon fibre-reinforced polymers (CFRPs) have been shown to have a good resistance to damage propagation when either static or cyclic loads are imposed [19]. Woven fibres frequently impart improved damage tolerance and fracture toughness compared with random mat or unidirectional fibre architectures, particularly regarding their capacity to resist the propagation of Mode I delaminations and transverse cracks [20,21]. While architectural crimp is widely recognised as a network of local stress concentrators [22,23], experimentally verifying how these geometric features interact with processing defects during structural failure remains challenging.
Fatigue-driven delamination in composite materials is predominantly analysed using the Linear Elastic Fracture Mechanics (LEFM) framework. The rate of macroscopic delamination propagation, , is often found to follow a generalised Paris-type law [24]:
where and are fitting parameters, and characterises the macroscopic strain energy release rate (SERR) controlling crack advance. In monolithic metals, the stress intensity factor ) is the standard fracture parameter. For heterogeneous materials such as CFRP laminates, is preferred due to their anisotropic, spatially heterogeneous microstructure, and the difficulty of defining an equivalent to K for biomaterial interfaces. Both energy-based and stress-based fracture parameters are linked through the effective macroscopic modulus (where for plane stress and for plane strain) [25]:
Power law models are commonly used to describe fatigue crack growth in composites but often obscure microscale damage mechanisms due to reliance on macroscopic continuum assumptions [14]. In woven composites, fatigue damage is typically localised, with fibre material constraints and manufacturing-induced defects such as voids. This necessitates a refined approach to understand damage initiation and progression.
In structural components containing access holes, macroscopic stress concentrations dictate damage initiation sites. As microcracks nucleate and coalesce, a macroscopic delamination crack of length may emanate from the open-hole radius under remote tension . The local stress intensity factor is described by Bowie’s analytical solution [26]:
However, the mechanisms governing the interaction between macroscopic driving forces and microscopic defects are not fully understood [27,28]. A key challenge is to determine whether global similitude parameters, such as , provide accurate fatigue predictions in woven composites, where crack propagation is intrinsically influenced by the physical constraints, shielding, and deflection imposed by transverse tows [29].
X-ray computed tomography (CT) scanning of progressive damage, both in situ and ex situ, has provided unparalleled insights into the formation and propagation of cracks under monotonic tension and cyclic loading [30,31]. Digital volume correlation (DVC) can be used on the CT images to perform damage identification, quantification, and displacement/strain analysis [32,33,34]. To advance from phenomenological models to experimentally validated micromechanics, this study looks at a synergistic characterisation methodology combining (i) high-resolution X-ray CT, (ii) digital volume correlation, and (iii) statistical visualisation (SVM) to quantitatively link microstructural attributes to macroscopic damage behaviour in composite materials.
As a proof of concept, this new approach is used to assess tensile incremental and fatigue loading of CFRP RTM laminates. The fibres, pores and specimen open-hole tension (OHT) geometry are considered in terms of their impact on localised strain and crack development. The OHT specimen was chosen as it is representative of a wide range of structures which include in-plane stress gradients. The analysis is performed on a case-by-case basis for strain hotspots and cracks, along with a correlation of the specimen features and damage development using SVM and fracture mechanics.
2. Materials and Methods
2.1. Specimen Design and Fabrication
RTM CFRP laminates of 800 mm × 400 mm × 4 mm were manufactured by GKN Aerospace (Trollhättan, Sweden) using a unidirectional (UD) aerospace-grade non-crimp fabric (NCF) infused with Hexcel (Stamford, CT, USA) HexFlow® RTM 6 oven-cured epoxy resin system. This commercial material system was selected for its multi-scale woven architecture, which is representative of current structural aerospace components [9]. The fabric architecture consists of uncrimped Toho Tenax (Tokyo, Japan) HTS40 12K warp carbon tows, woven together with warp and weft weaves comprising a mix of E-glass and thermoplastic weaves covered with Hexion (Columbus, OH, USA) Epikote™ EPR 05311 powder binder. The bi-axial glass fibre weaves provide support for handling during manufacturing and for load distribution. Carbon fibre and glass fibre areal weight is 242.5 g/m2 and 13.5 g/m2, respectively. The laminates manufactured in this study have a quasi-isotropic layup schedule of [0/+45/90/−45]2s.
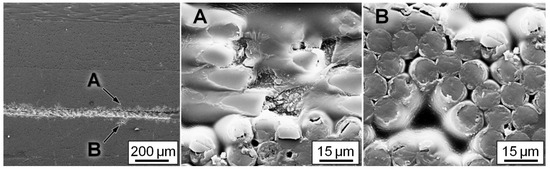
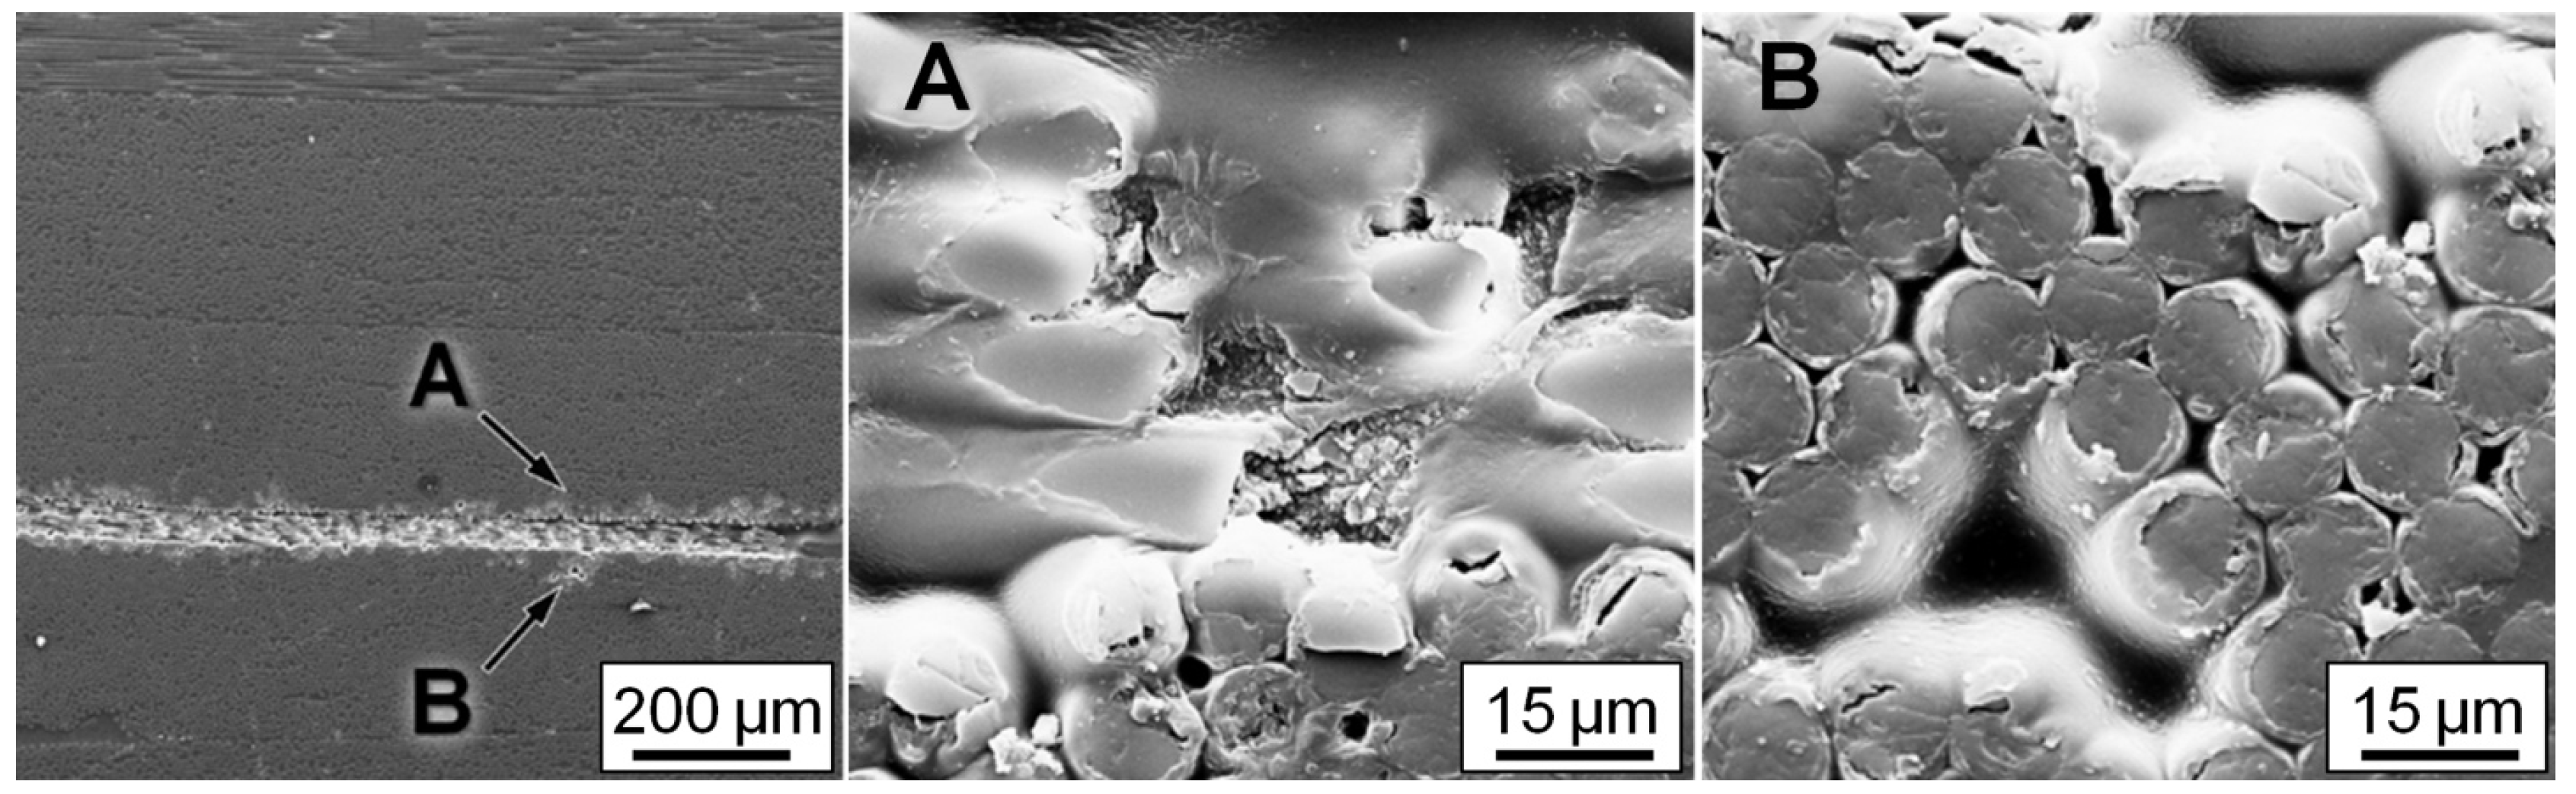
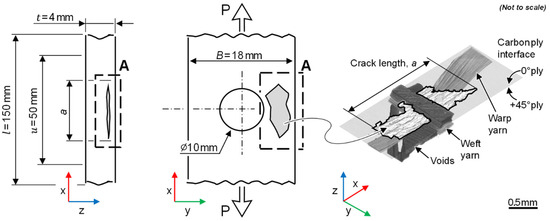
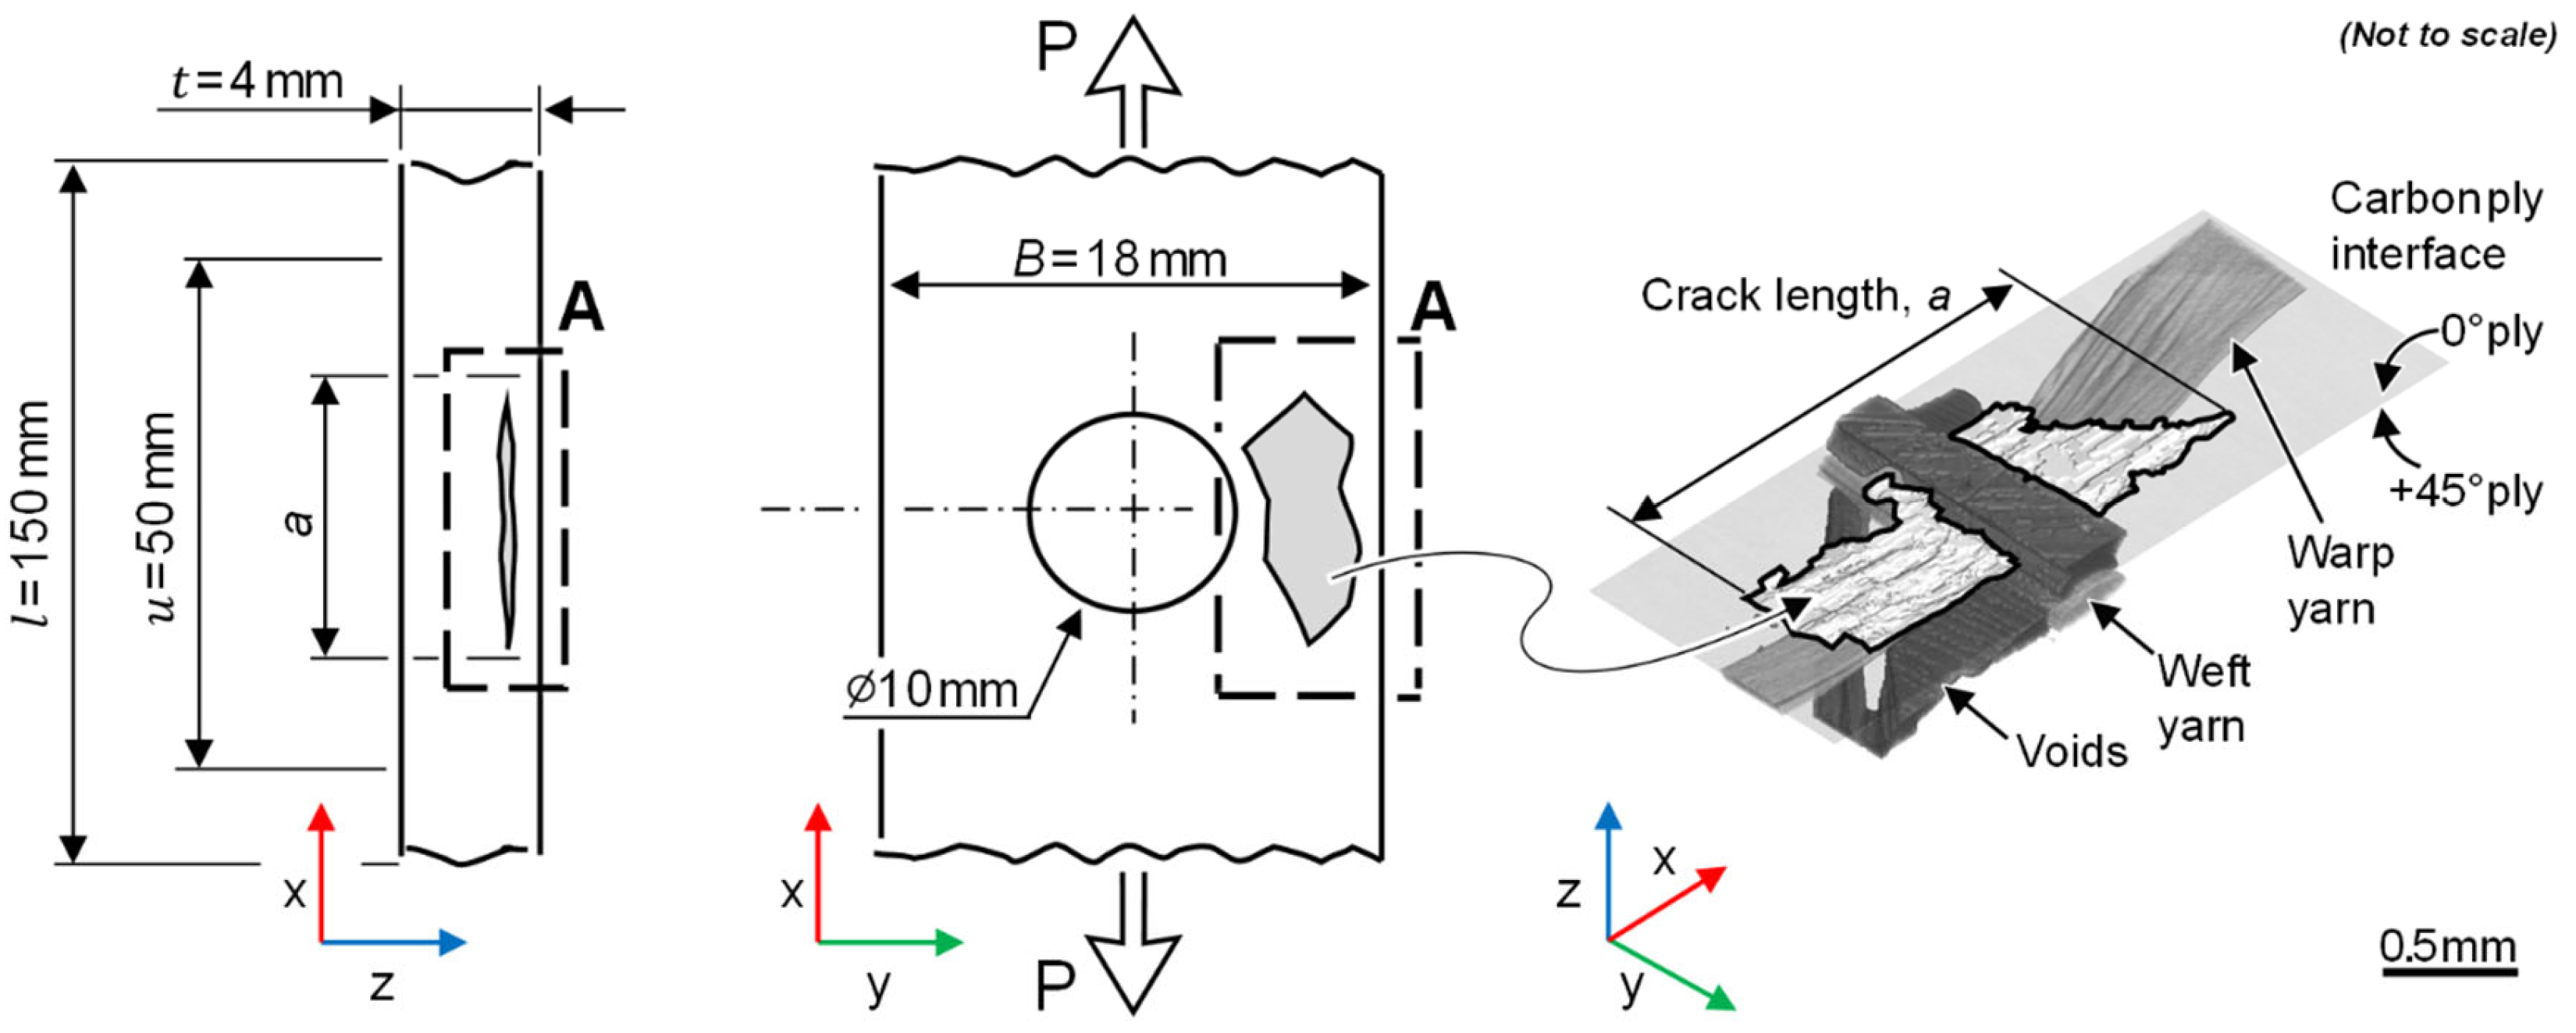
The mould thickness used for the production of the laminates resulted in a fibre volume content of approximately 55%. Porosity was measured by later CT analysis. Any such porosity is assumed to be the result of the entrapment of bubbles during the wet-out of the reinforcement (Figure 1). The local porosity varies widely across liquid moulded parts due to the applied pressure gradient, but the analysed regions of interest typically exhibited porosity volume fractions of ~1%. The post-infusion cure cycle was applied according to the resin manufacturer’s specifications. After curing the laminate, coupons with an open-hole profile for both monotonic and fatigue testing, shown in Figure 2, were cut using a diamond-coated saw and drill bit. The specimen size was chosen to optimise the resolution and FOV for CT imaging.
Figure 1.
SEM images showing bi-material interfaces in thermoset composite with presence of pores around carbon fibre bundles (A) and glass fibre bundles (B).
Figure 2.
Longitudinal crack system. Tensile fatigue load ‘’ applied along x-axis, to cause delamination between ply interfaces with average crack length , within CT gauge section A and extensometer gauge section .
2.2. Testing
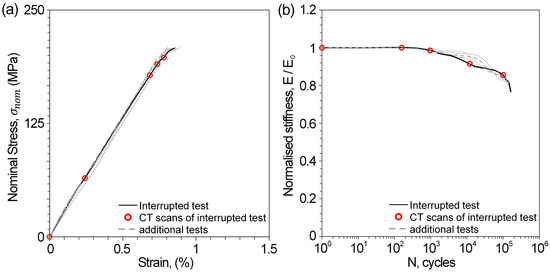
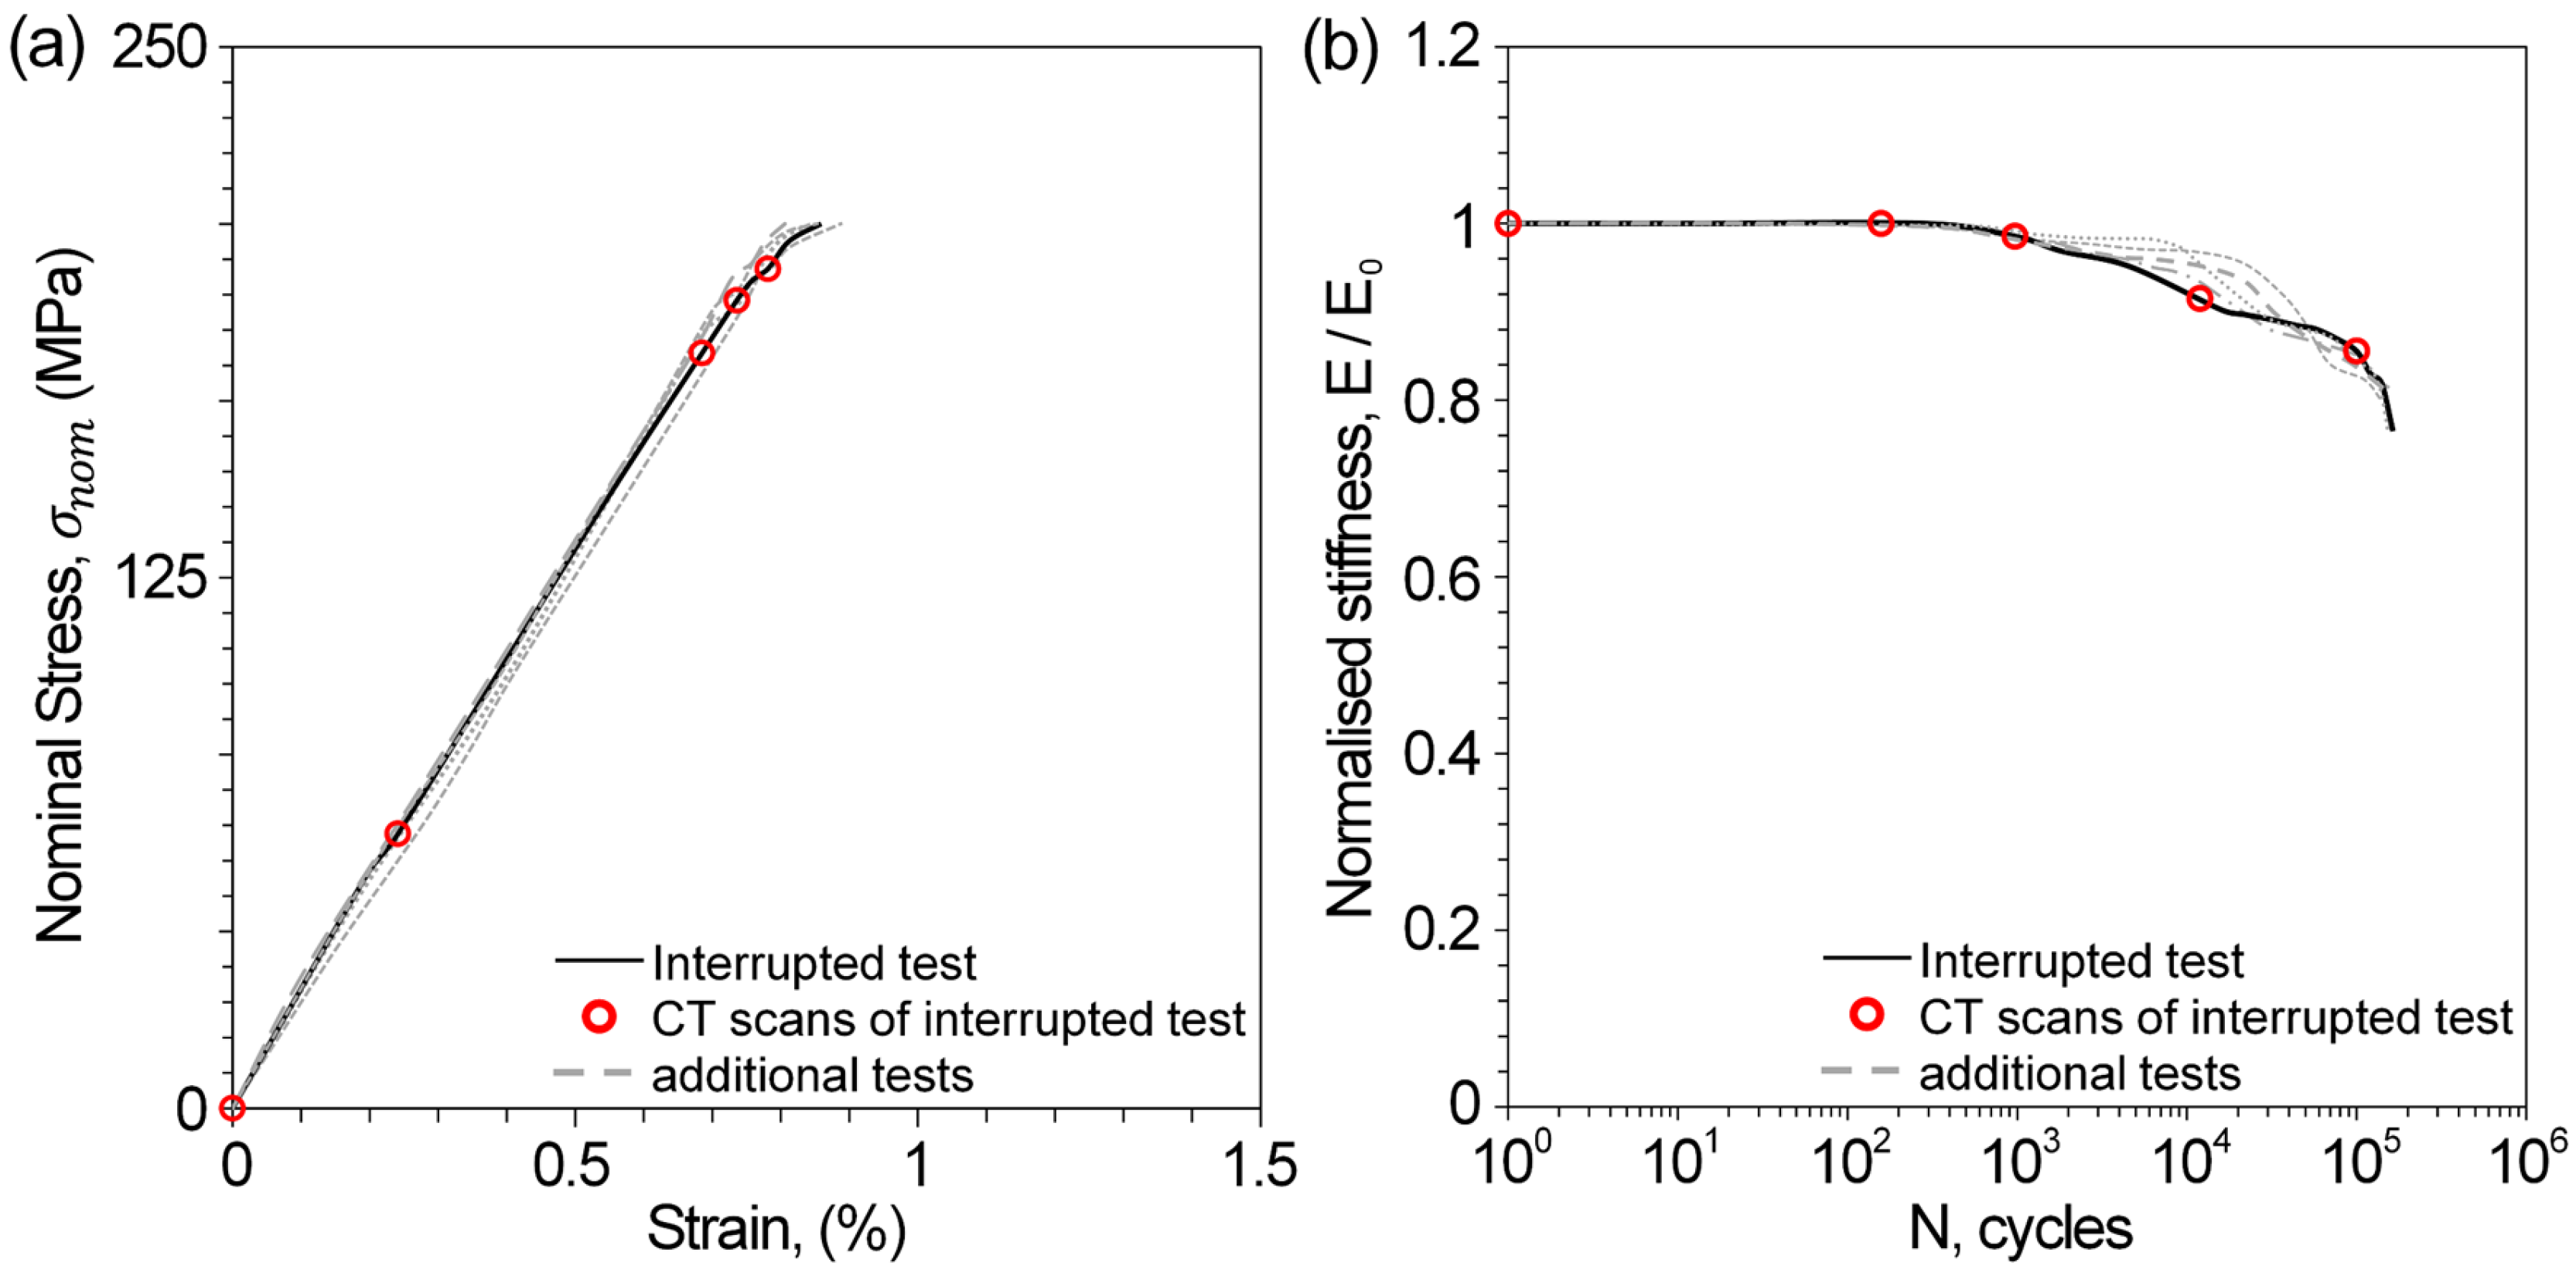
OHT specimens were subjected to both uniaxial tensile displacements at a rate of 1 mm/min and fatigue at a frequency of 5 Hz for a constant load of R = 0.1 and at a maximum stress of Smax= 0.8σult. In both cases, five specimens were loaded in a servo-hydraulic load frame using hydraulic grips; from this cohort, single representative specimens were selected for intensive high-resolution CT imaging and subsequent volumetric mapping at each scan point (Figure 3). The load cell output, the machine stroke and the axial (x-direction) extensometer measurement were recorded. The extensometer had a 50 mm gauge length and was attached using knife edge mounts and elastometer loops to ensure positive engagement with the specimen surface. It was centred at the specimen notch and aligned to measure along the specimen length.
Figure 3.
Example of results and CT scan imaging points for interrupted tests in (a) tension and (b) fatigue (R = 0.1, Smax = 0.8σult).
2.3. Imaging (X-Ray Computed Tomography)
CT imaging was conducted at two different length scales using the following equipment: (i) using synchrotron X-ray computed tomography (SRXCT) at the TOMCAT/X03MA beamline, at the Swiss Light Source of the Paul Scherrer Institute for high-resolution imaging, and (ii) using the Nikon Metrology (Leuven, Belgium) HMX 225™ X-ray micro-computed tomography (µXCT) at the µ-VIS Centre at the University of Southampton for wider fields of view. SRXCT proved effective in capturing local intra-weave defects and damage at a microscale level, whereas wide-field µXCT was better suited for characterising inter-weave and interlaminar damage behaviour in the overall specimen.
The scan settings for the CT imaging are shown in Table 1. The SRXCT specimen was positioned vertically and placed at a distance of 20 mm from the beam in an orthogonal orientation to achieve phase contrast. Projections were collected by rotating the specimen 180 degrees, and a 3D reconstruction was created using a custom code based on the GRIDREC/FFT method. The scans for µXCT and SRXCT were performed non-destructively, with no cutting of the specimens and no penetrative dyes added.
Table 1.
Scan settings for X-ray CT imaging.
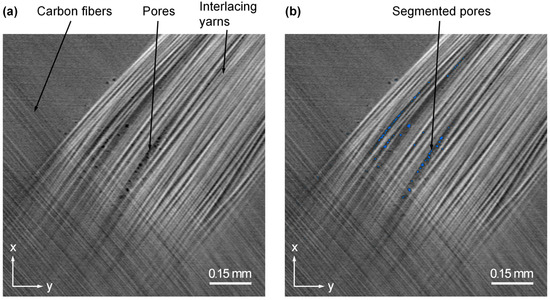
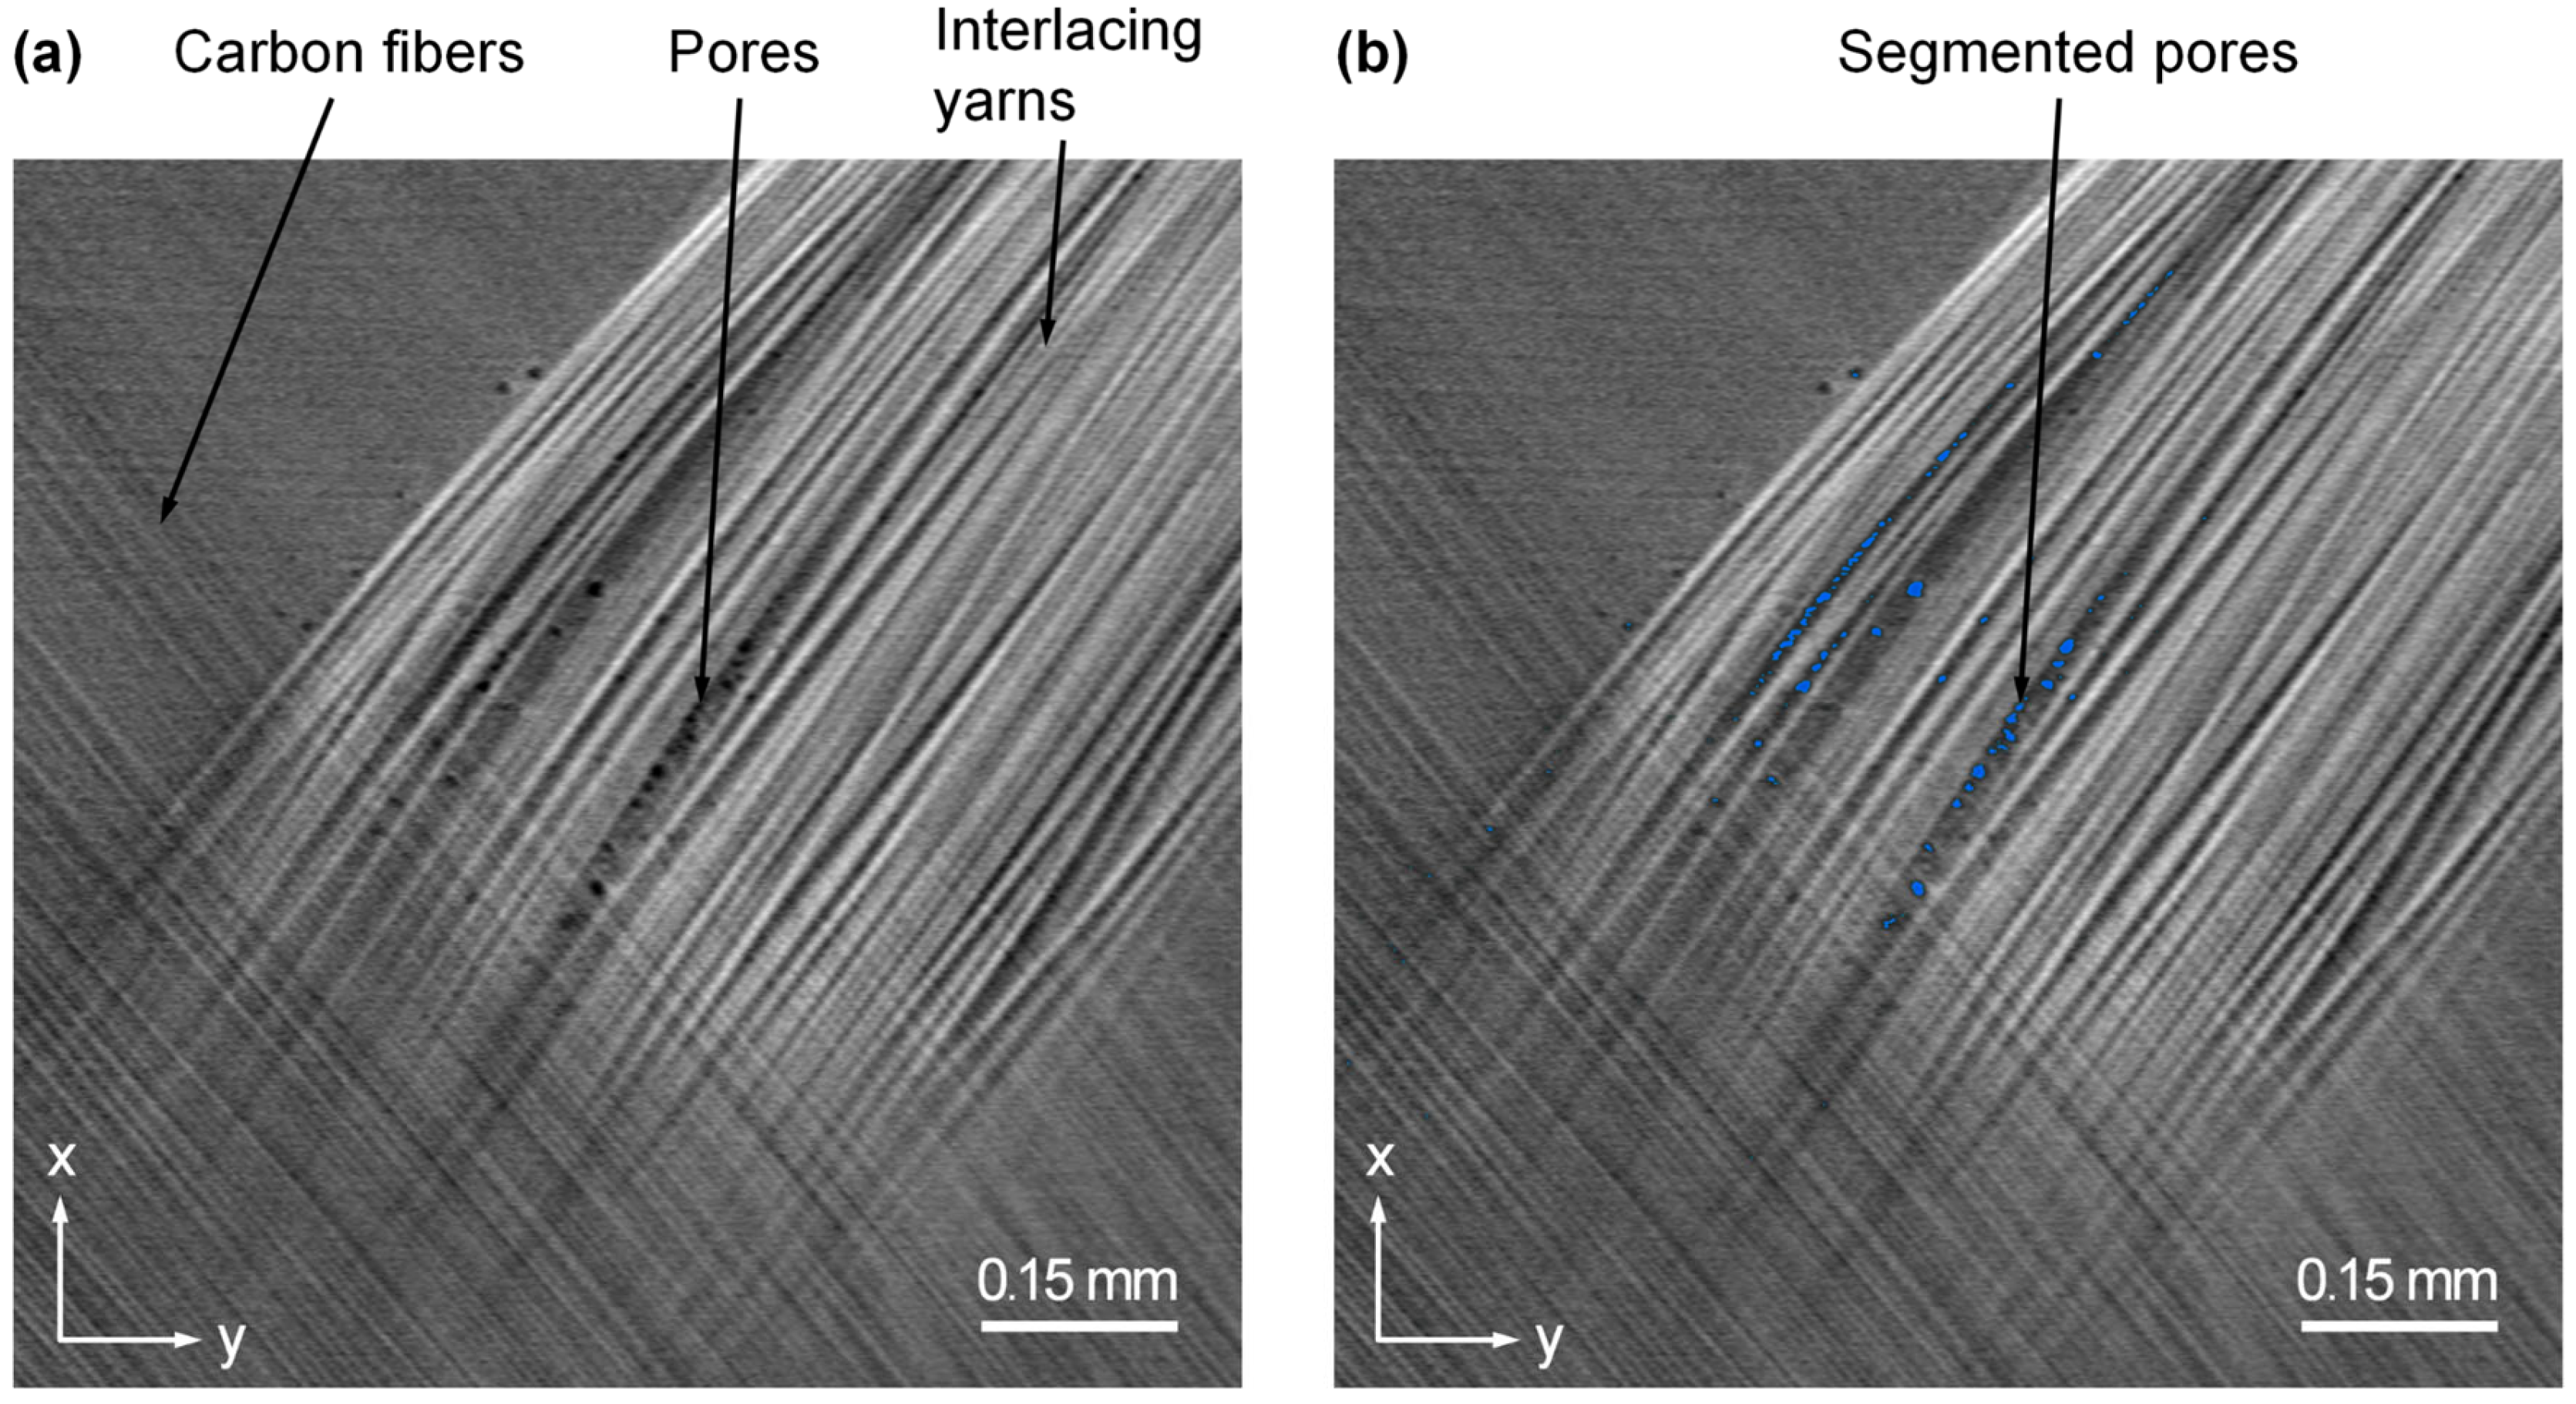
The commercial software VG Studio Max v3.4™ (VGS) was used for the post-analysis of the CT scans. The scans were reconstructed using a filtered back-projection algorithm to form an 8-bit volume with grey scale intensities in the range 0 to 255. Global thresholding and a seed growing algorithm (ISO-50%) were applied to detect carbon fibres, interlacing weaves, pores, and damage such as transverse cracks and delamination. An example of these features, extracted from the tensile case, is shown in Figure 4.
Figure 4.
Example of (a) tomogram from SRXCT specimen and (b) pore segmentation.
2.4. Digital Volume Correlation (DVC)
The Digital Volume Correlation (DVC) module in VGS was used to extract internal deformation fields from the 3D reconstructed CT volumes of the composite specimens. This algorithm measures displacement and strains by relating each discrete coordinate in the initial undeformed volume (Volume A) to a visually corresponding point in the deformed volume (Volume B), establishing the direct transformation function [35,36]:
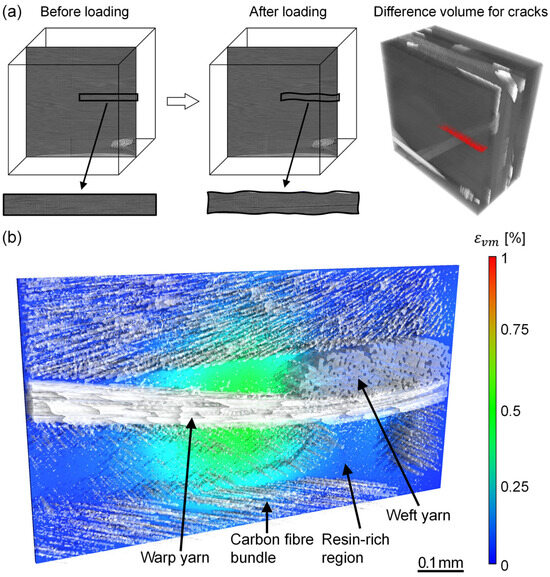
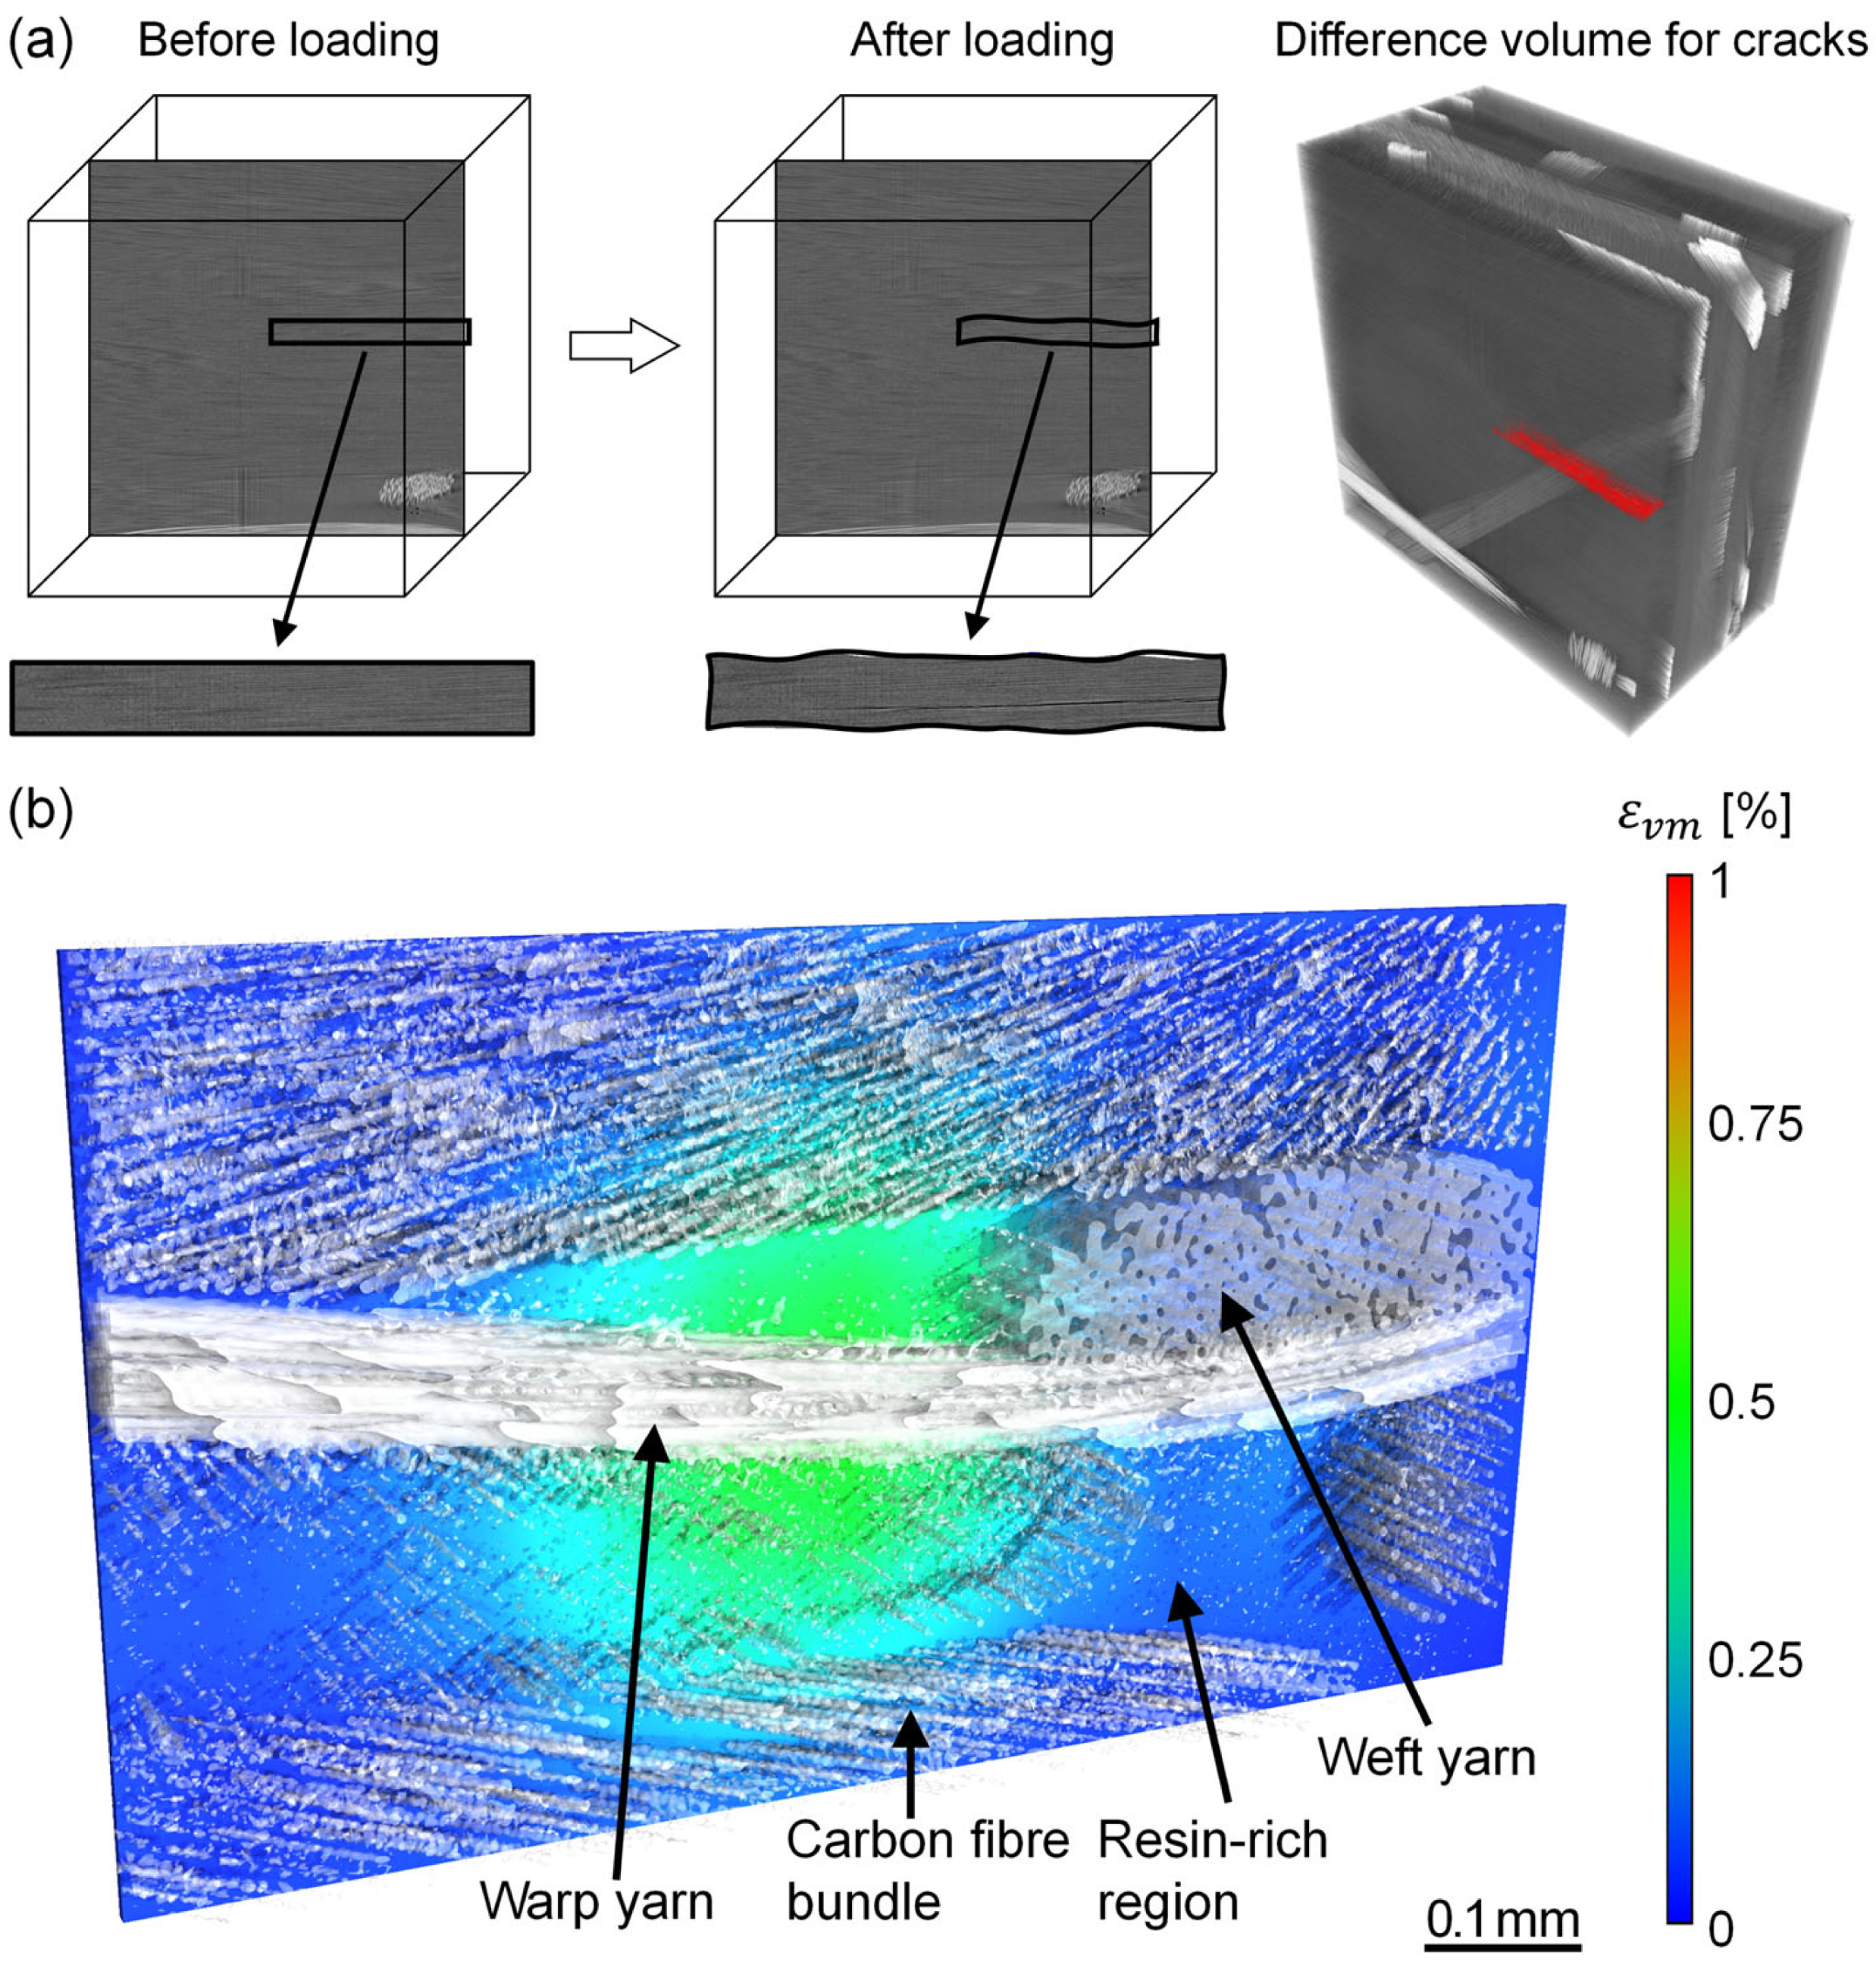
Mapping was carried out using normalised cross-correlation of grey-value patterns in adjacent image regions. Control point spacing was selected to match the characteristic feature size of the material, to ensure accurate representation of microstructural kinematics and to minimise overfitting. Baseline zero-strain reference scans established DVC measurement uncertainty at a subvoxel noise floor—typically less than 10 to 100 orders of magnitude—well beneath the observed load-induced strain fields. Displacement and strain fields between control points were interpolated using cubic B-splines to produce locally resolved deformation maps. These localisations correspond to features in the composite structure. The subset sizes and algorithm parameters used for DVC strain-field calculations were selected in line with industry standards to allow for reproducibility and alignment with established best practices [35,36]. DVC analysis was performed non-destructively to quantify local deformation and crack initiation. An example from a tensile specimen is shown in Figure 5. The von Mises strain colour overlay was used to indicate the combined strain at the element level as a measure of residual crack opening.
Figure 5.
Example of DVC analysis for SRXCT specimen, loaded in tension at 0.8% applied strain, showing (a) schematic approach for DVC and (b) full-field strain distribution around the interlacing weaves.
2.5. Statistical Visualisation Mapping (SVM)
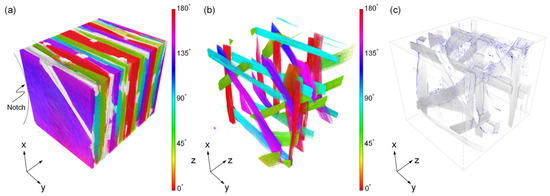
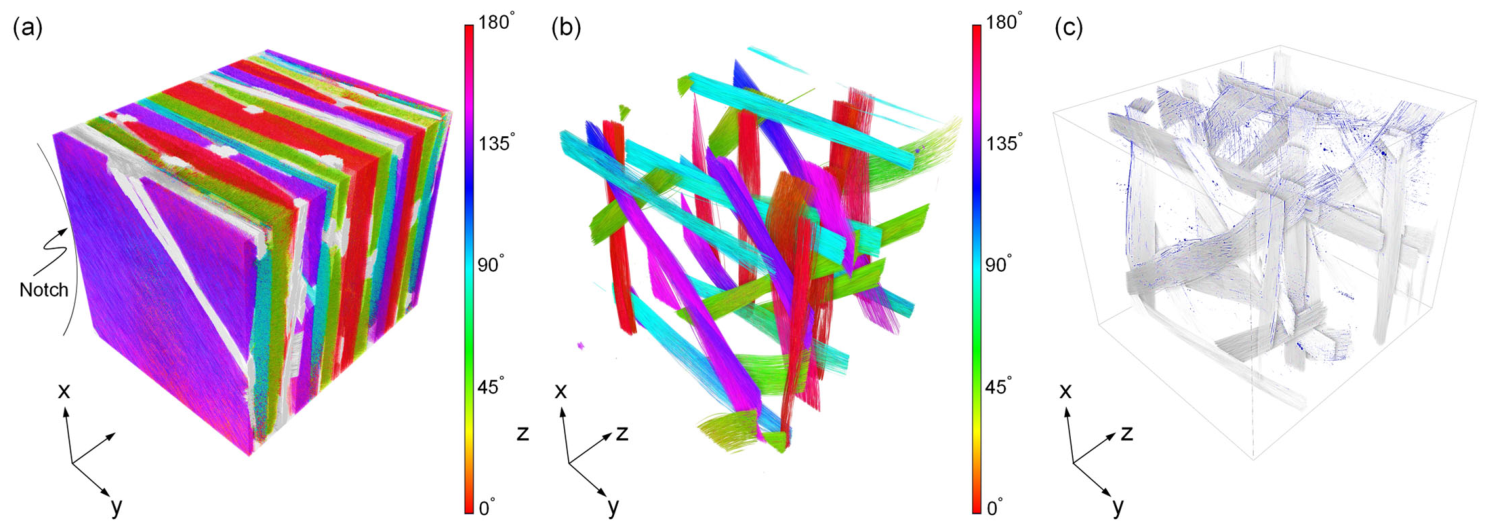
The commercial software MATLAB™ Release 2025b was used to perform a robust statistical visualisation mapping (SVM). SVM, based on two-point correlation, can be used to associate the probability of the location of salient features in the microstructure with strain readings, e.g., from DVC measurements of CT images. This approach captures the geometrical correlations between different material components/phases and/or fields, assessing geometrical correlations between as-manufactured features (such as glass weave position, or voids/pores) and local strain hotspots or crack positions. For example, assume that is a map of the glass fibre distribution (see Figure 6) in the 3D specimen; i.e., gives the percentage of glass found within the voxel at position . Assume that is a map of effective strain. Then for discrete maps, Fourier transforms are used, and the normalised two-point statistics are calculated as:
where indicates the discrete Fourier transform, ‘*’ indicates the complex conjugate, and ‘’ indicates the point-wise product of matrix components. By normalising by the total sum of glass percentages over every voxel, the resultant two-point statistics indicate the average strain at points on the two-point map, where the origin represents a typical position at a glass fibre. In other cases, the normalisation may not have a physical meaning, and the two-point map is presented with arbitrary units (a.u.); in such cases, the relative probabilities of finding a given phase in the vicinity of the phase of interest (e.g., the glass) is indicated by the difference in values or colours. This enables SVM to identify causal microstructural drivers governed by local phase geometry [17], bypassing expensive point-by-point stress modelling [37,38]. To ensure robust spatial statistical analysis, Fourier-based SVM maps are treated as relative probability amplitudes, reducing the effects of imaging uncertainty.
Figure 6.
Ply structure for (a) composite material, (b) only glass weaves where the colour scale represents the in-plane orientation of the fibres, and (c) glass weaves (white) with pores (blue).
This visualisation approach can be combined with Green’s function analysis to calculate an average overall material response. Using perturbation theory, a localisation tensor is defined which is used to determine the effect of neighbourhood morphology on local stress concentrations. This may then be averaged to provide homogenised material properties such as the effective elastic moduli [37]. Furthermore, observed relations between local morphology, as captured in local two-point statistics, and the resultant response can be used to calibrate the material behaviour for rapid analysis and prediction of deformation behaviour in macrostructural models [38]. This localisation tensor approach is grounded in the theory of n-point correlation functions, quantifying how phase geometries govern the bulk mechanical response [17].
3. Fracture Mechanics
Previous studies [27,28] have extensively investigated the damage mechanisms of notched composites through experiments and modelling. The presence of a notch or an open hole causes a strain concentration factor with large strains, driving the macroscopic stress intensity field around the edges (Equation (3)), leading to changes in the effective material properties around the hole and various types of damage mechanisms, e.g., fibre fracture, debonding and pull-out, transverse cracking and delamination. This study looks at delamination as this is readily tracked using CT together with SVM. In quasi-isotropic CFRPs, the presence of an open hole causes damage to occur in four stages during tension, the exact order of which may depend on material layup: (i) isolated delamination zones near the hole edge (inner) and near the specimen edges (outer); (ii) extensive damage formation in the inner delamination regions, (iii) damage growth between the hole edge and the specimen edge through the outer delamination regions, and (iv) matrix cracking and delamination away from the outer delamination regions [39]. The delamination size is determined by the layer thickness. For a large hole (assuming constant ply thickness), these delaminations are small, and the extensive damage growth around the hole is stable and within the gauge section. Figure 2 shows gauge section A for this investigation using CT. This enables the possibility to analyse each damage mechanism separately.
To adapt classical fatigue mechanics to this composite, the Paris law framework was converted into an energy-based format. The Mode I delamination crack growth for an OHT fatigue specimen (Figure 2) has been proposed by Wilkins et al. [40] to be described by:
where is the average crack length, is the number of fatigue cycles, and are the curve fitting parameters, and is the similitude parameter for the strain energy release rate (SERR) range in Mode I [41,42]:
where and are maximum and minimum SERR, respectively, while the Mode I SERR [43]:
where is the applied load, is the specimen width, is the extensometer displacement, and is the compliance.
While compliance does not specifically distinguish delamination from other types of damage, CT fatigue results from this study show that delamination is the primary damage mechanism at this measurement resolution. This approach forms the basis for material characterisation and enables direct comparison with SVM. By averaging the three-dimensional delamination front across the specimen width, the Paris relation (Equation (6)) maintains the energetic similitude that governs the global structural response [29].
4. Results and Discussion
4.1. Segmented Layup and Interlacing Weaves
Figure 6 shows the complete laminate structure from CT analysis and the same volume after segmentation of all but the glass interlacing weaves. The colour scale represents the in-plane orientation of the fibres and allows a visual representation of the fibre waviness, i.e., the deviation of fibres from the nominal ply angle. Figure 6c shows a similar segmentation of the volume but with the addition of the pores detected from CT analysis. These are rendered with white glass weaves against a neutral background to clearly emphasise the blue voids. These pristine pores are found in images obtained prior to loading, i.e., resulting from the manufacturing process, most likely due to the entrapment of bubbles from mechanical obstruction during the liquid moulding process [43,44]. In their pristine state, smaller pores or pores in resin-rich regions tend to have more spherical shapes, but most pores are elongated, indicating constraint due to the fibres [45], as has been documented elsewhere [9].
4.2. Tensile Damage Behaviour
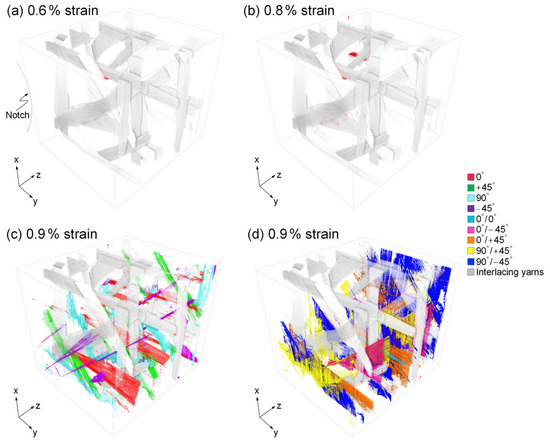
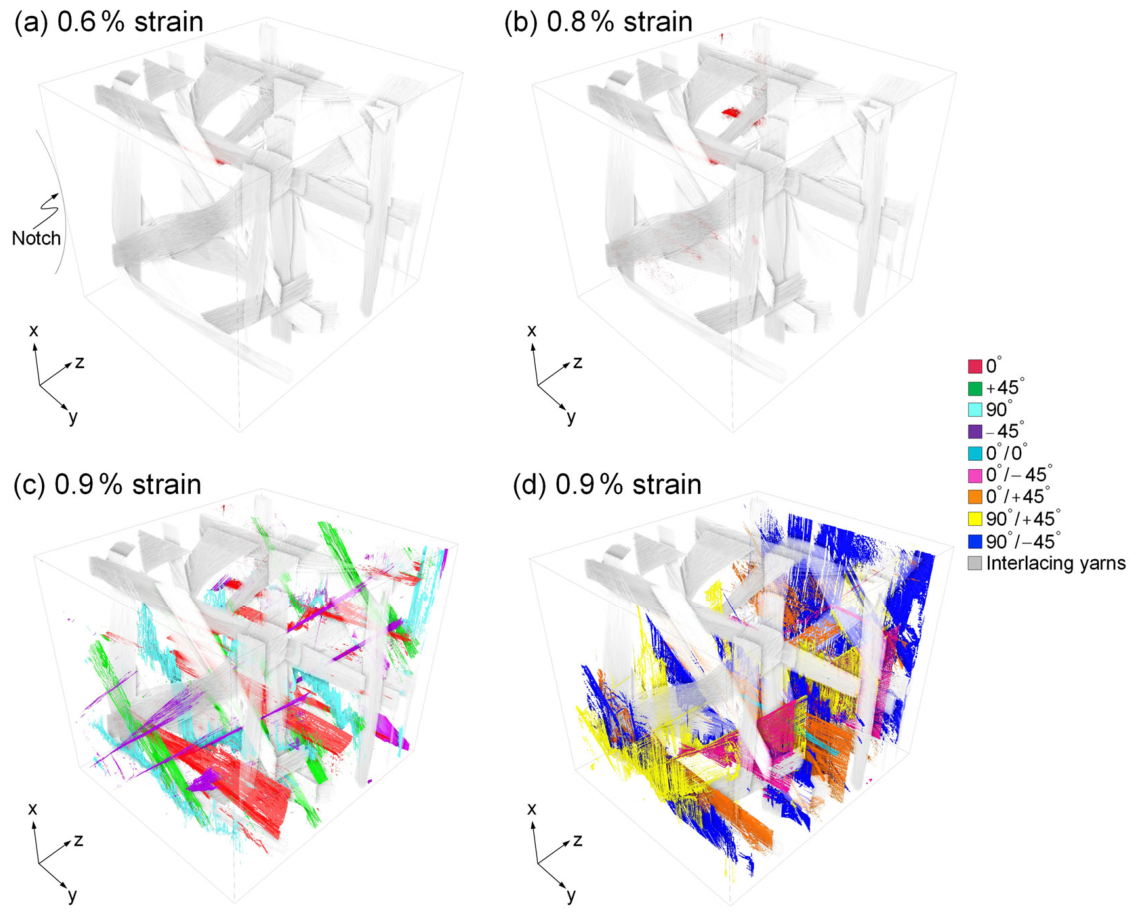
Figure 7 shows the evolution of damage in a specimen after tensile loading, again after segmenting away the carbon fibre and resin. The legend associated with Figure 7 provides a colour code that identifies the damage locations within a ply, between plies, or within interlacing glass weaves. The fracture surfaces depicted here denote the segmented 3D boundaries of the open microcracks. The first three sub-figures (Figure 7a–c) depict intralaminar cracks, and the final sub-figure, Figure 7d, shows interlaminar cracks. As Figure 7a,b illustrate, damage begins with the formation of transverse cracks near the interlacing weaves within the 0° plies. As the tensile displacement increases, Figure 7c shows that cracks are concentrated in the undulating weaves and within the 0° plies.
Figure 7.
Evolution of fracture surfaces after tensile displacements. The colours indicate the fibre orientations of the specific plies and interfaces where the cracks are located.
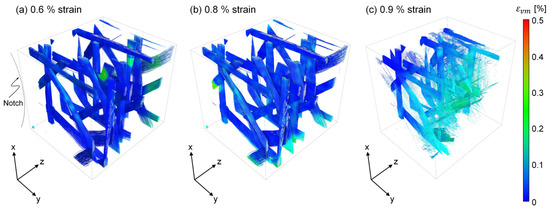
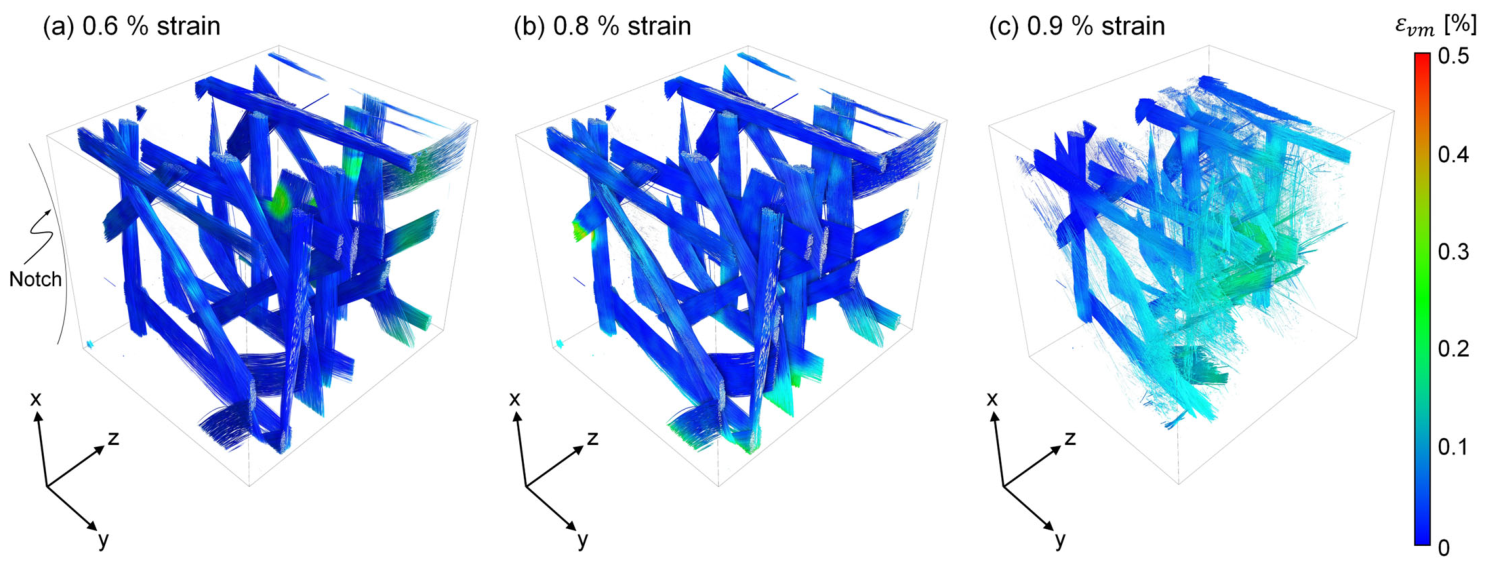
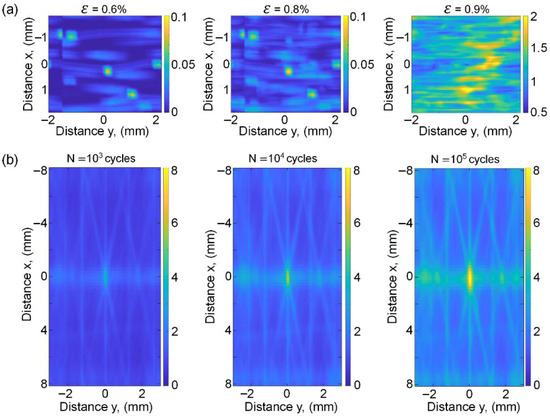
The presence of intralaminar cracks is of significant concern as it can lead to catastrophic failure of the material, particularly if there is subsequent compressive or shear loading. In Figure 7d, all plies are saturated with interlaminar cracks that are relatively linear and aligned with the ply orientations. Tomograms reveal that the cracks, both intralaminar and interlaminar, are bounded by the glass weaves, restricting the extent of crack growth. This observation may provide some insight into the material’s fracture behaviour and stress distribution, as it suggests that the stiff transverse interlacing weaves can restrict further damage to the material. This is further evidenced in the DVC imaging in Figure 8. High-strain regions are observed in all stages including the first at 0.6% strain. This suggests fibre bridging, which is a mechanism that can mitigate the damage around interlacing weaves.
Figure 8.
Residual tensile strain measurements of an unloaded specimen after tensile loading.
4.3. Fatigue Damage Behaviour
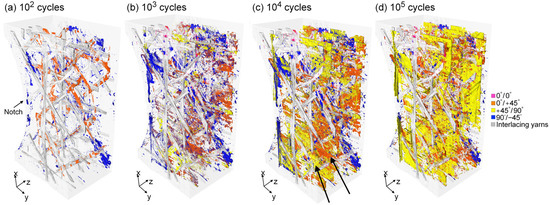
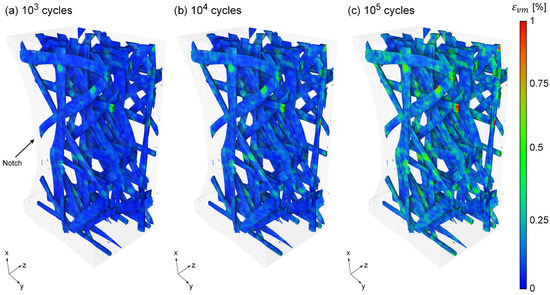
Figure 9 shows the damage development in a tensile fatigue specimen, with increasing number of load cycles, again with colour scale denoting the location of damage. These damage maps were obtained by segmenting the tomograms using grey value thresholding, referenced against the undamaged baseline scans. In Figure 9a, the length of cracks is still small compared to the bond layer thickness. In these cases, the residual strain contributes to the energy released, because the bonded interface, surrounding the warp–weft glass weave overlap, remains intact and thus, retains the residual strain. The gradual increase in residual strain emerges near these overlaps, leading to the high-strain regions shown in Figure 10. The extent of fatigue damage is significantly greater than observed in the tensile case (Figure 7 and Figure 8).
Figure 9.
Evolution of fracture surfaces in the specimen wedge after cyclic loading (R = 0.1; Smax = 0.8σult). The colours indicate the fibre orientations of the specific plies and interfaces where the cracks are located. Arrows in (c) indicate serrated “chips” of brittle material within the weft–warp quadrant.
Figure 10.
Residual strain measurements of interlacing weaves in an unloaded specimen after fatigue loading.
Figure 9a shows that damage initiation in the fatigue specimens begins with a width-wise transverse fracture aligned with the glass weaves. This is followed by a simultaneous formation of short, densely spaced, longitudinal cracks in the off-axis layers shown in Figure 9b. The inward growth of these initial crack paths, from one ply to the next, always occurs with delamination growth at a given glass weave interface.
Additional cycling of the specimen results in the extension of existing cracks and the formation of new cracks in the plies on both sides of the midplane with serrated “chips” of brittle material aligned near the warp weaves shown in Figure 9c. Consequently, this results in large delamination zones, and the crack trajectory follows the warp glass weaves, giving the appearance of arrested crack fronts on either side of the weft glass weaves in each ply shown in Figure 9d.
4.4. Micromechanisms
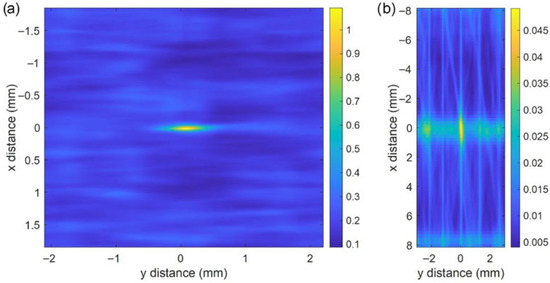
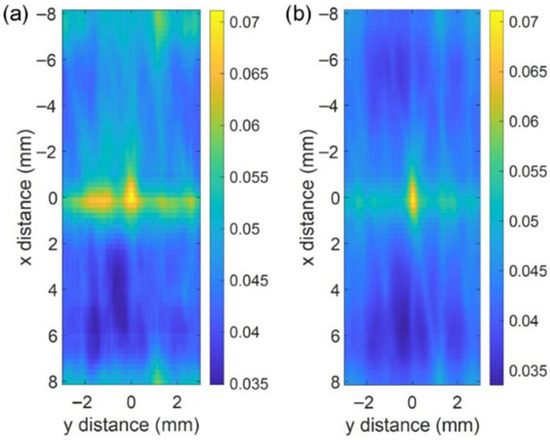
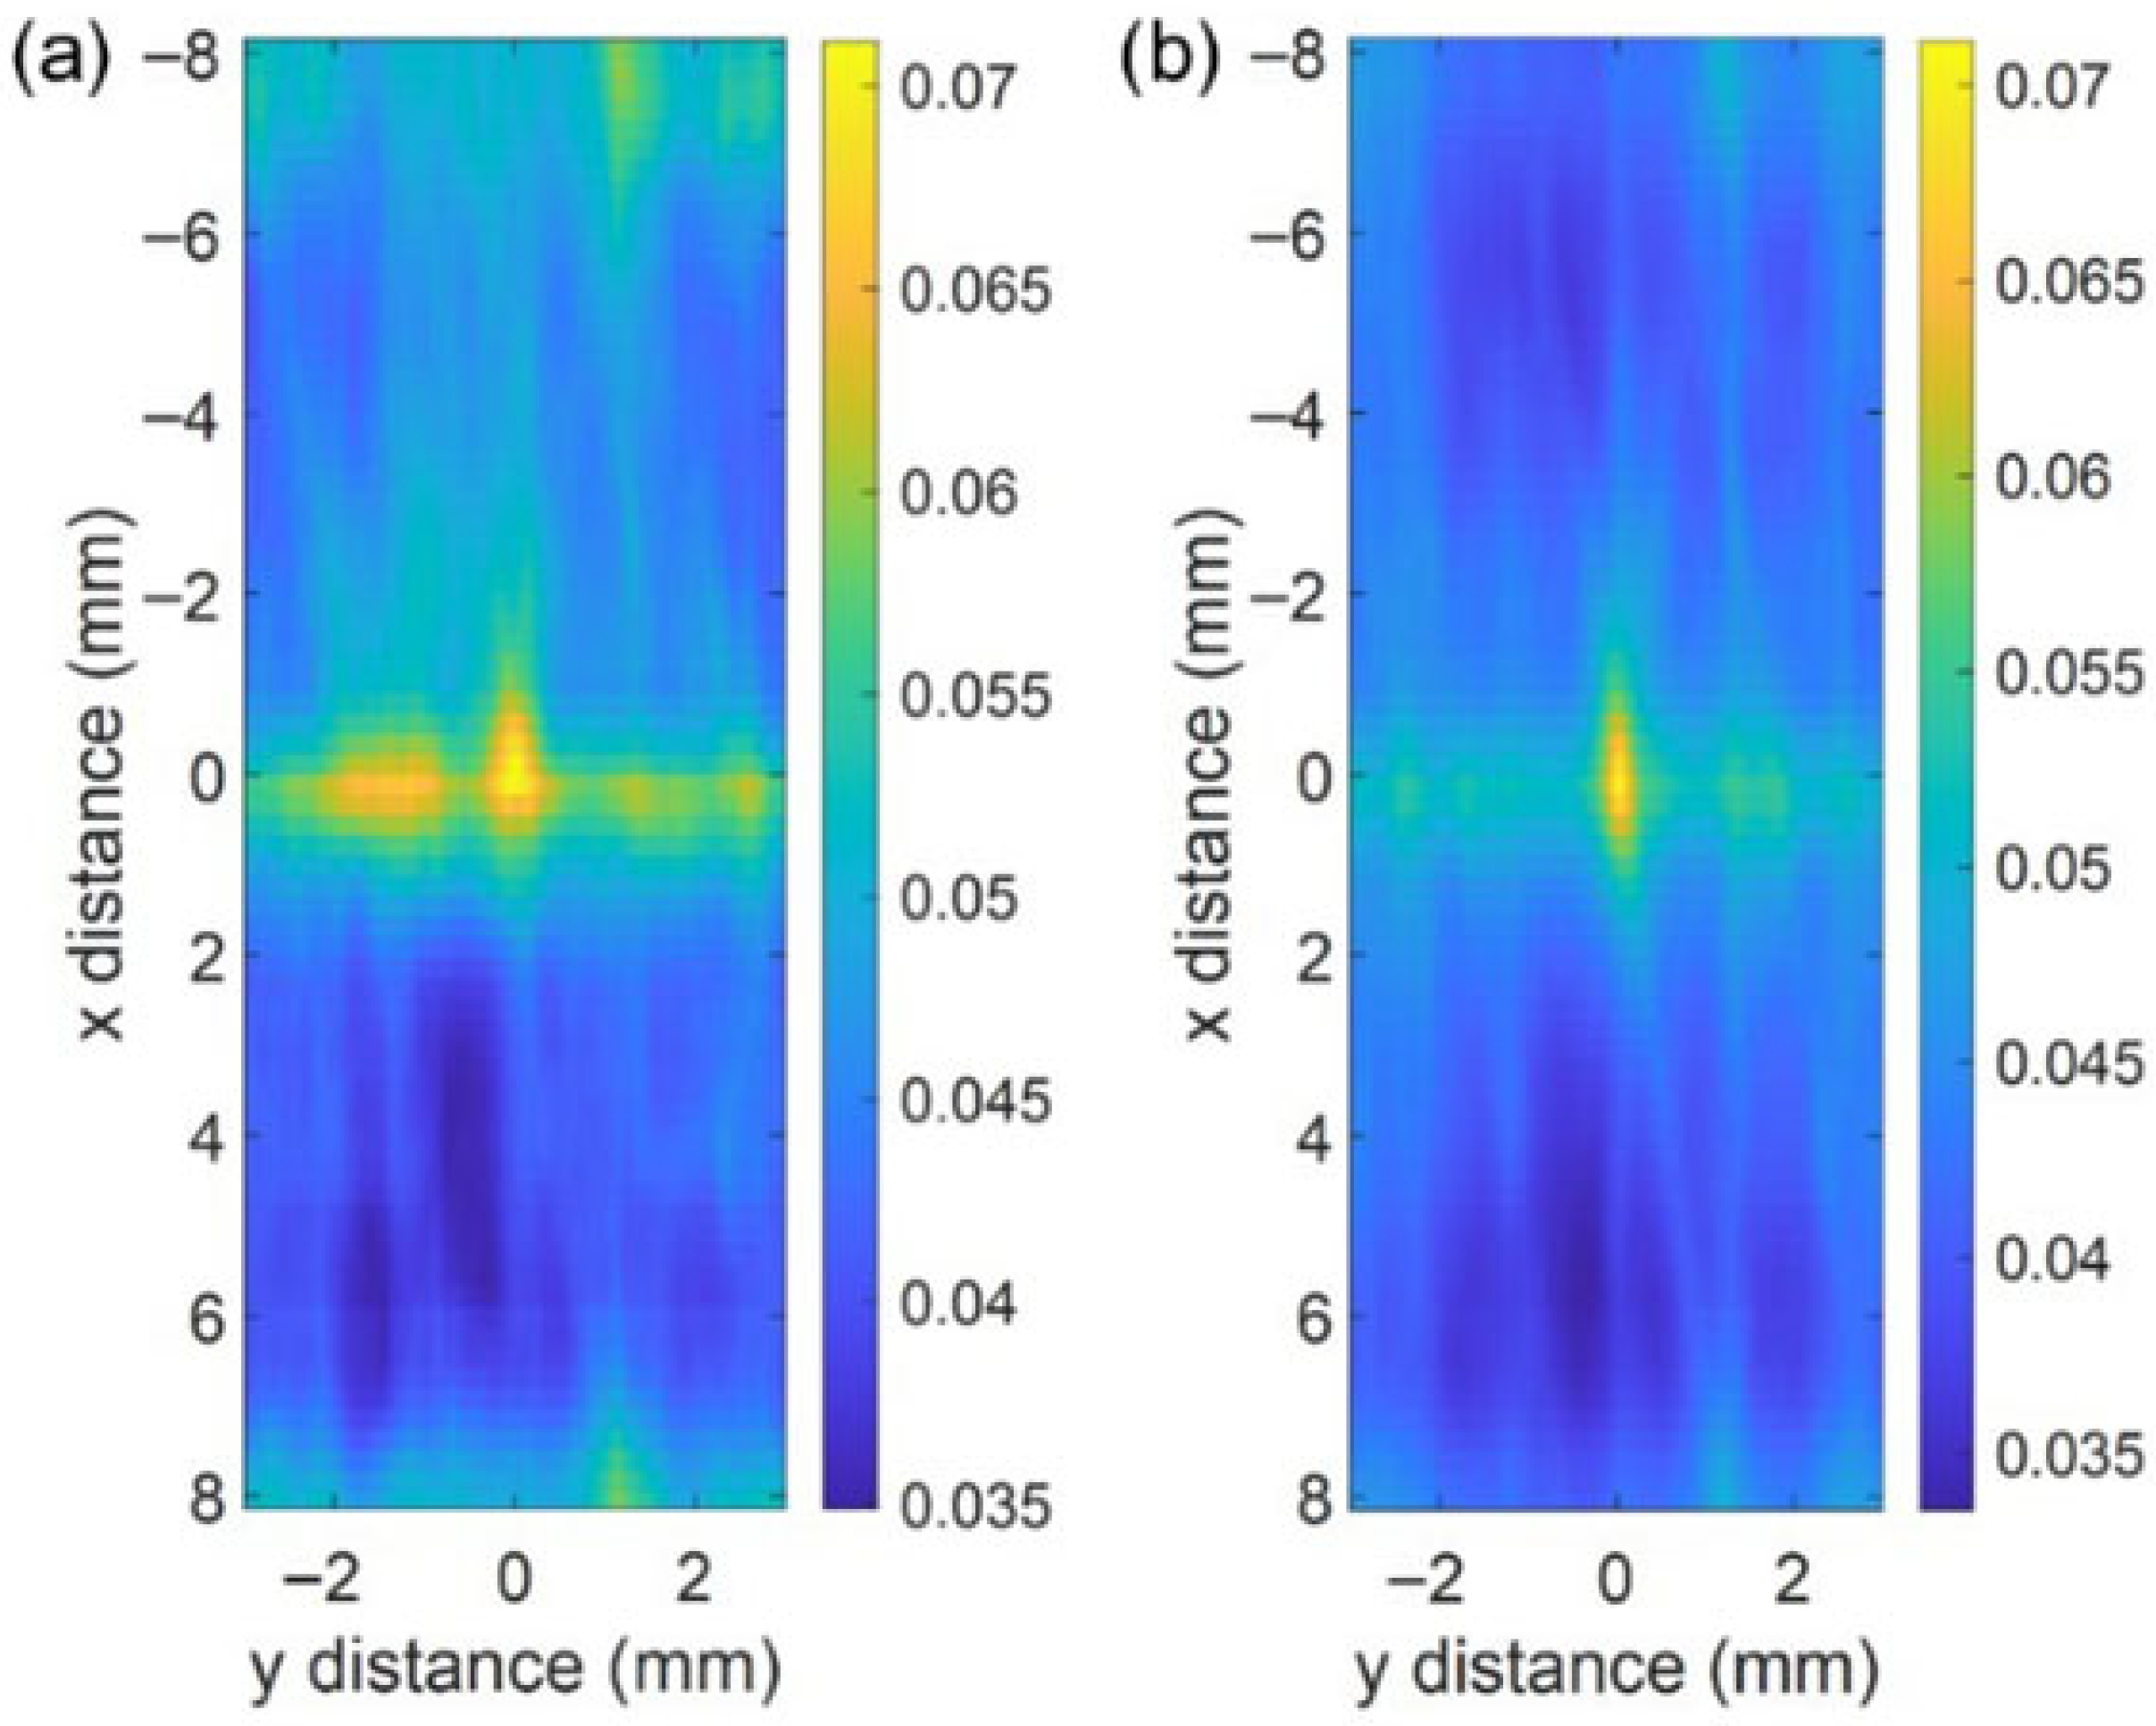
SVM of the positional correlation between pristine pores and glass fibres in the original undamaged specimens for the monotonic and fatigue loading tests are shown in Figure 11. It is worth noting that while both specimens were taken from the same pristine material batch, the resulting maps differ visually. This reflects the different fields of view (FOV) and spatial resolutions employed in the respective baseline scans (Table 1). Each map offers valuable, modality-specific insights. These maps are based on the x-y axis plane cross-sections in both cases. In both specimens, pristine pores show strong positional correlation near glass weaves. In the fatigue case, the probability of finding a pristine pore next to a glass weave is about 0.05 a.u. against a background of approximately 0.005 a.u. in the surrounding carbon–epoxy matrix—a tenfold peak-to-background ratio. This confirms that the glass weaves act as a mechanical obstruction during liquid moulding processing, trapping bubbles that would otherwise move with the pressure gradient towards the flow front or the mould vent.
Figure 11.
SVM between pristine pores and glass fibre for undeformed monotonic (a) and fatigue (b) specimens. The colour bar refers to the relative probability (in arbitrary units) of finding a pristine pore at a given distance away from an arbitrary point in glass.
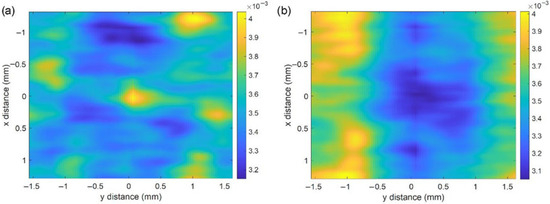
During monotonic loading, the residual strain estimated by DVC does not change dramatically as higher loads are applied. This is likely to be explained by residual strains being primarily due to the residual crack opening displacements of the microcracks created during loading, which are primarily a function of crack geometry, local microstructure and local residual stress states, rather than the applied load level. Hence, correlations between strain and specimen features are shown only for 0.8% strain, which provided the cleanest data. Moreover, as shown in Figure 12, while the strain is quite uniform across the specimen, strain hotspots tend to be close to the glass fibres, as shown by the higher strain in the middle of Figure 12a.
Figure 12.
SVM after 0.8% applied strain, between (a) full-field strain and glass fibres and (b) strain and pristine pores.
Notably, pristine pores were also more likely to occur near glass weaves (Figure 11); however, lower strain correlates with pore location (Figure 12b). No significant correlation was observed between residual strain and pore locations, indicating that pores do not play a significant role in initiating microcracks in monotonic loading. This suggests that the residual strain is due to crack opening rather than plasticity. Consequently, remote micro-voids have negligible contribution to primary damage initiation. SVM analysis showed no correlation between cracks and pristine pore locations, in contrast to previous findings [5]. This difference is attributed to the relatively low overall porosity (~1%) and small pristine pore sizes in the present NCF architecture, where the macroscopic notch-stress intensity field dominates crack path selection. Under these conditions, the global stress field determines the crack path irrespective of local void topology. SVM analysis also showed no correlation between cracks and glass fibres, or between strain levels and cracks.
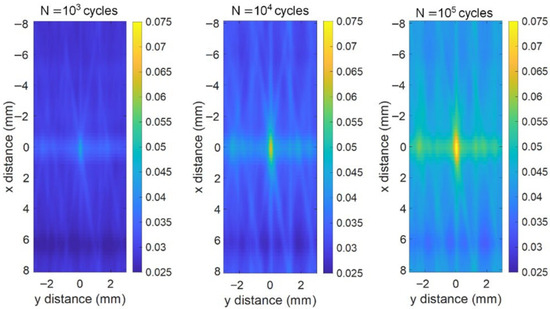
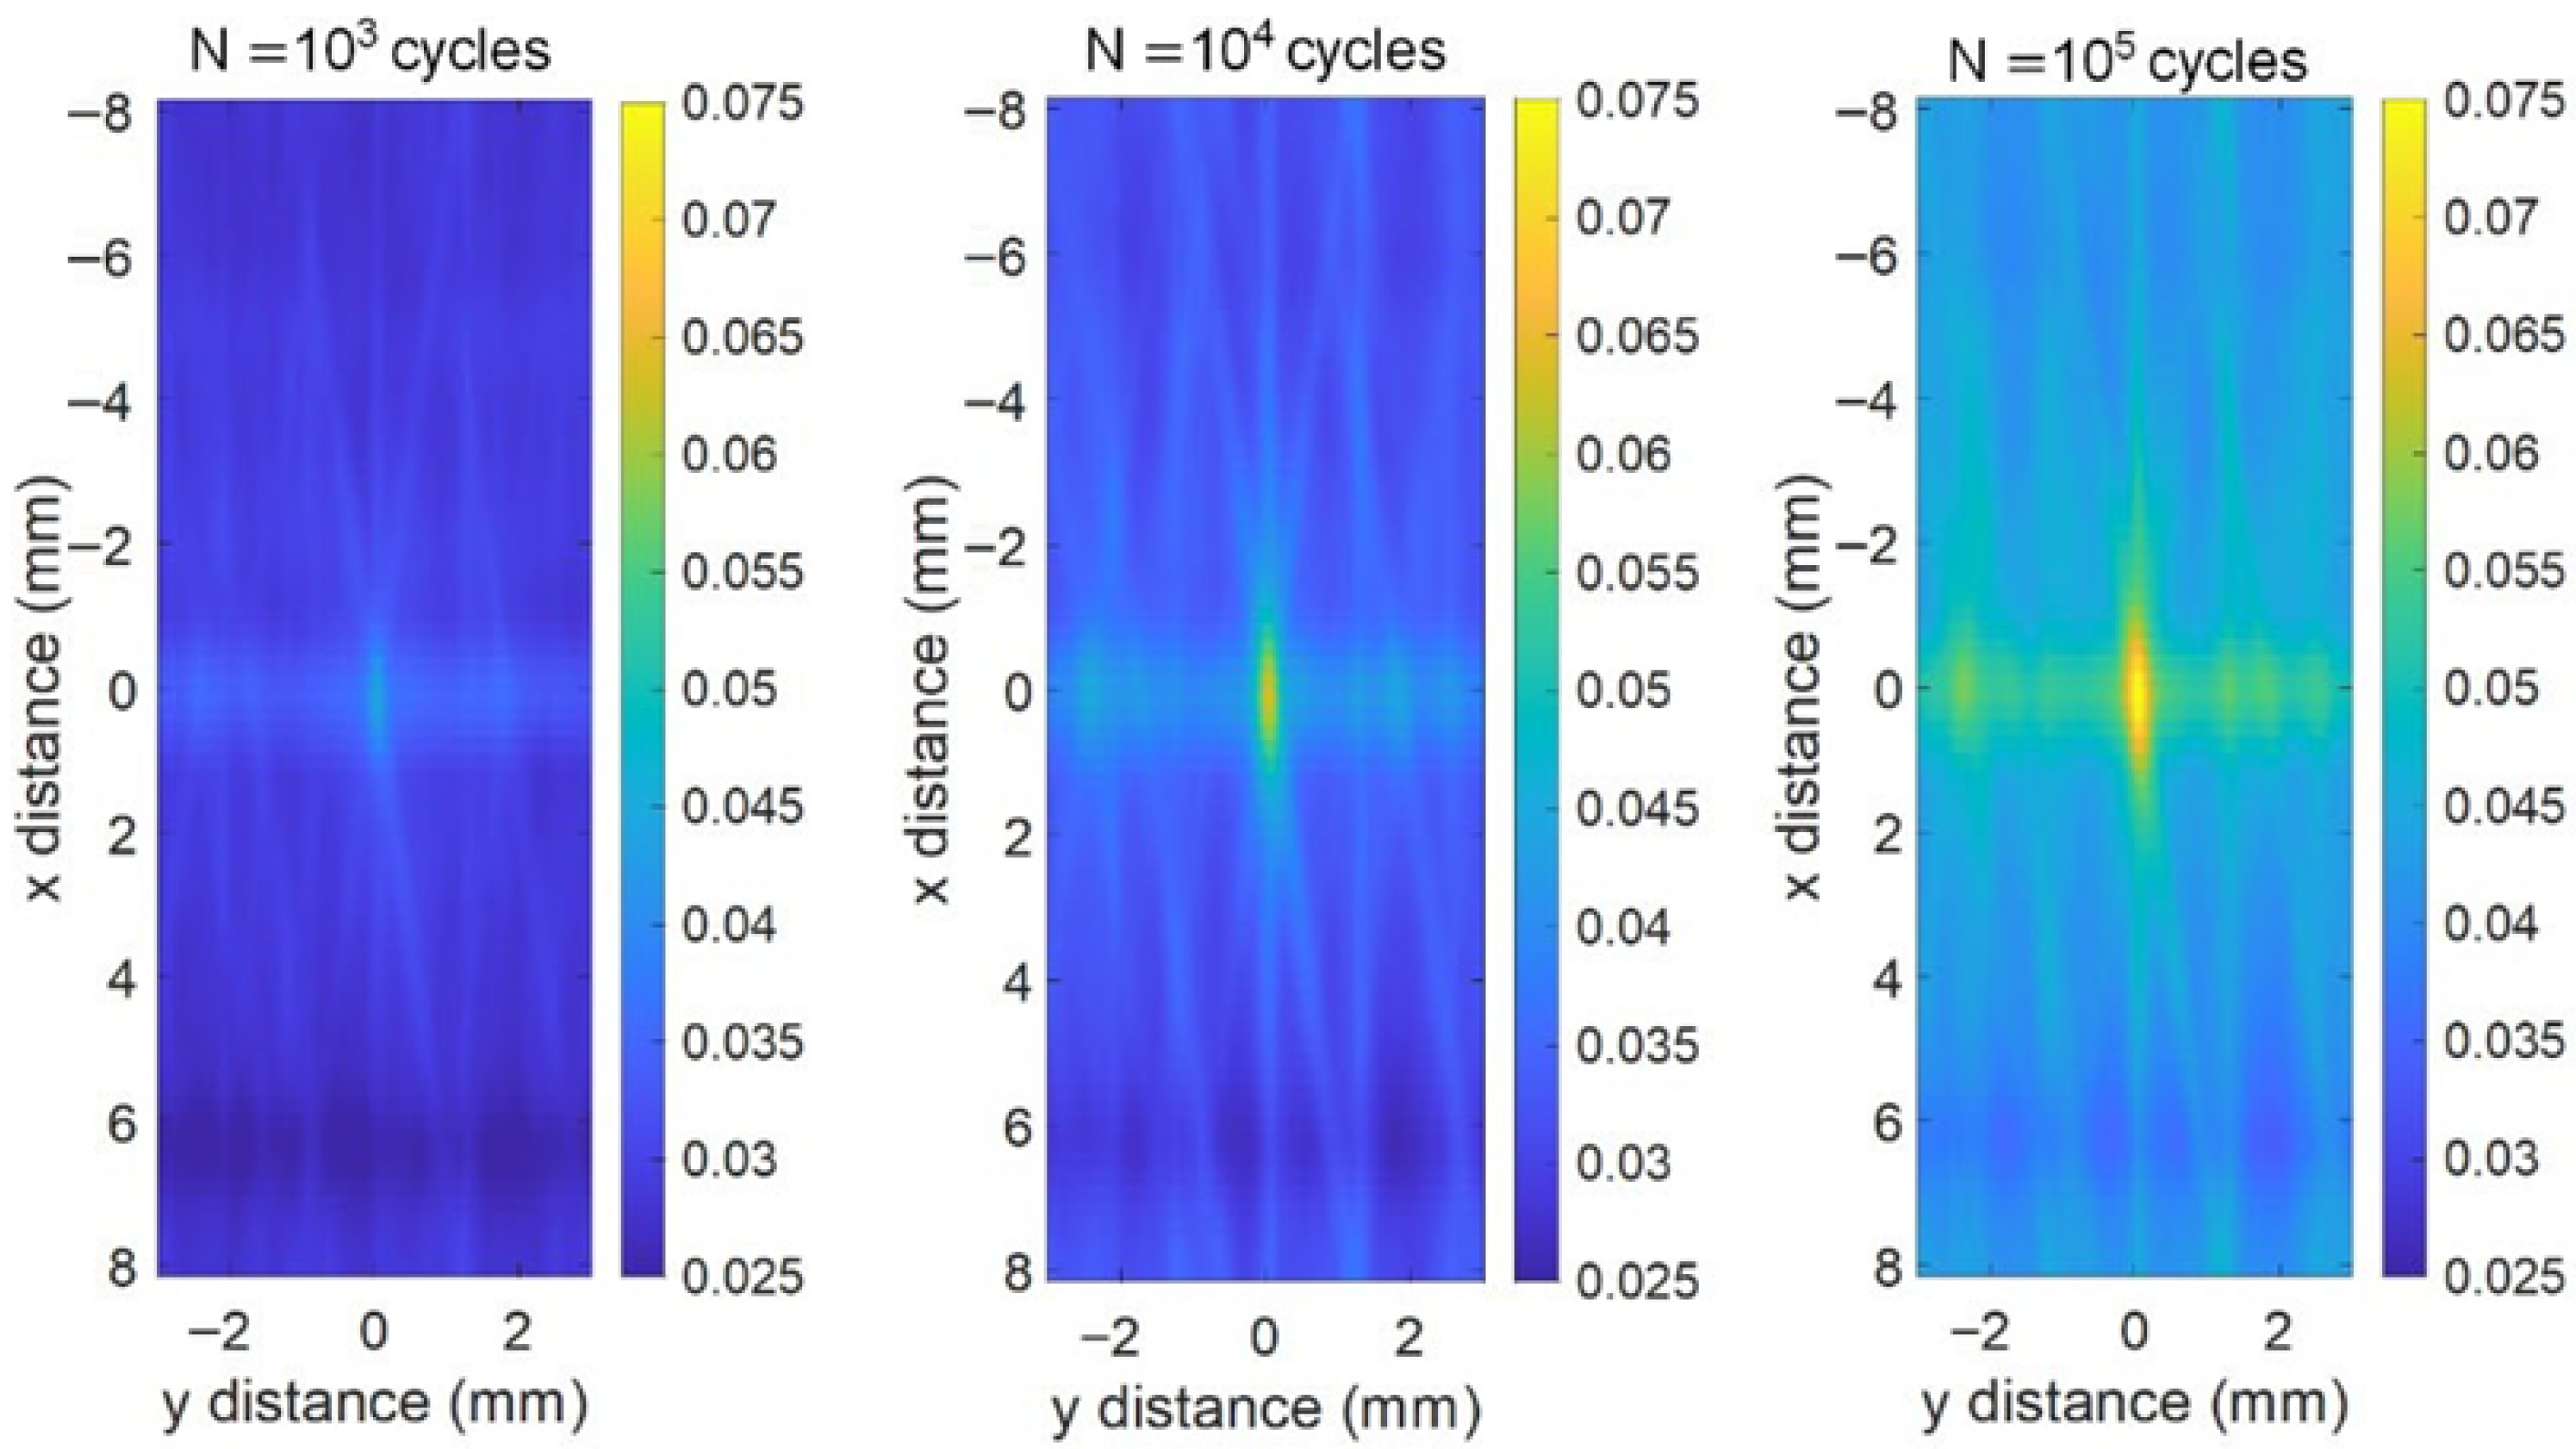
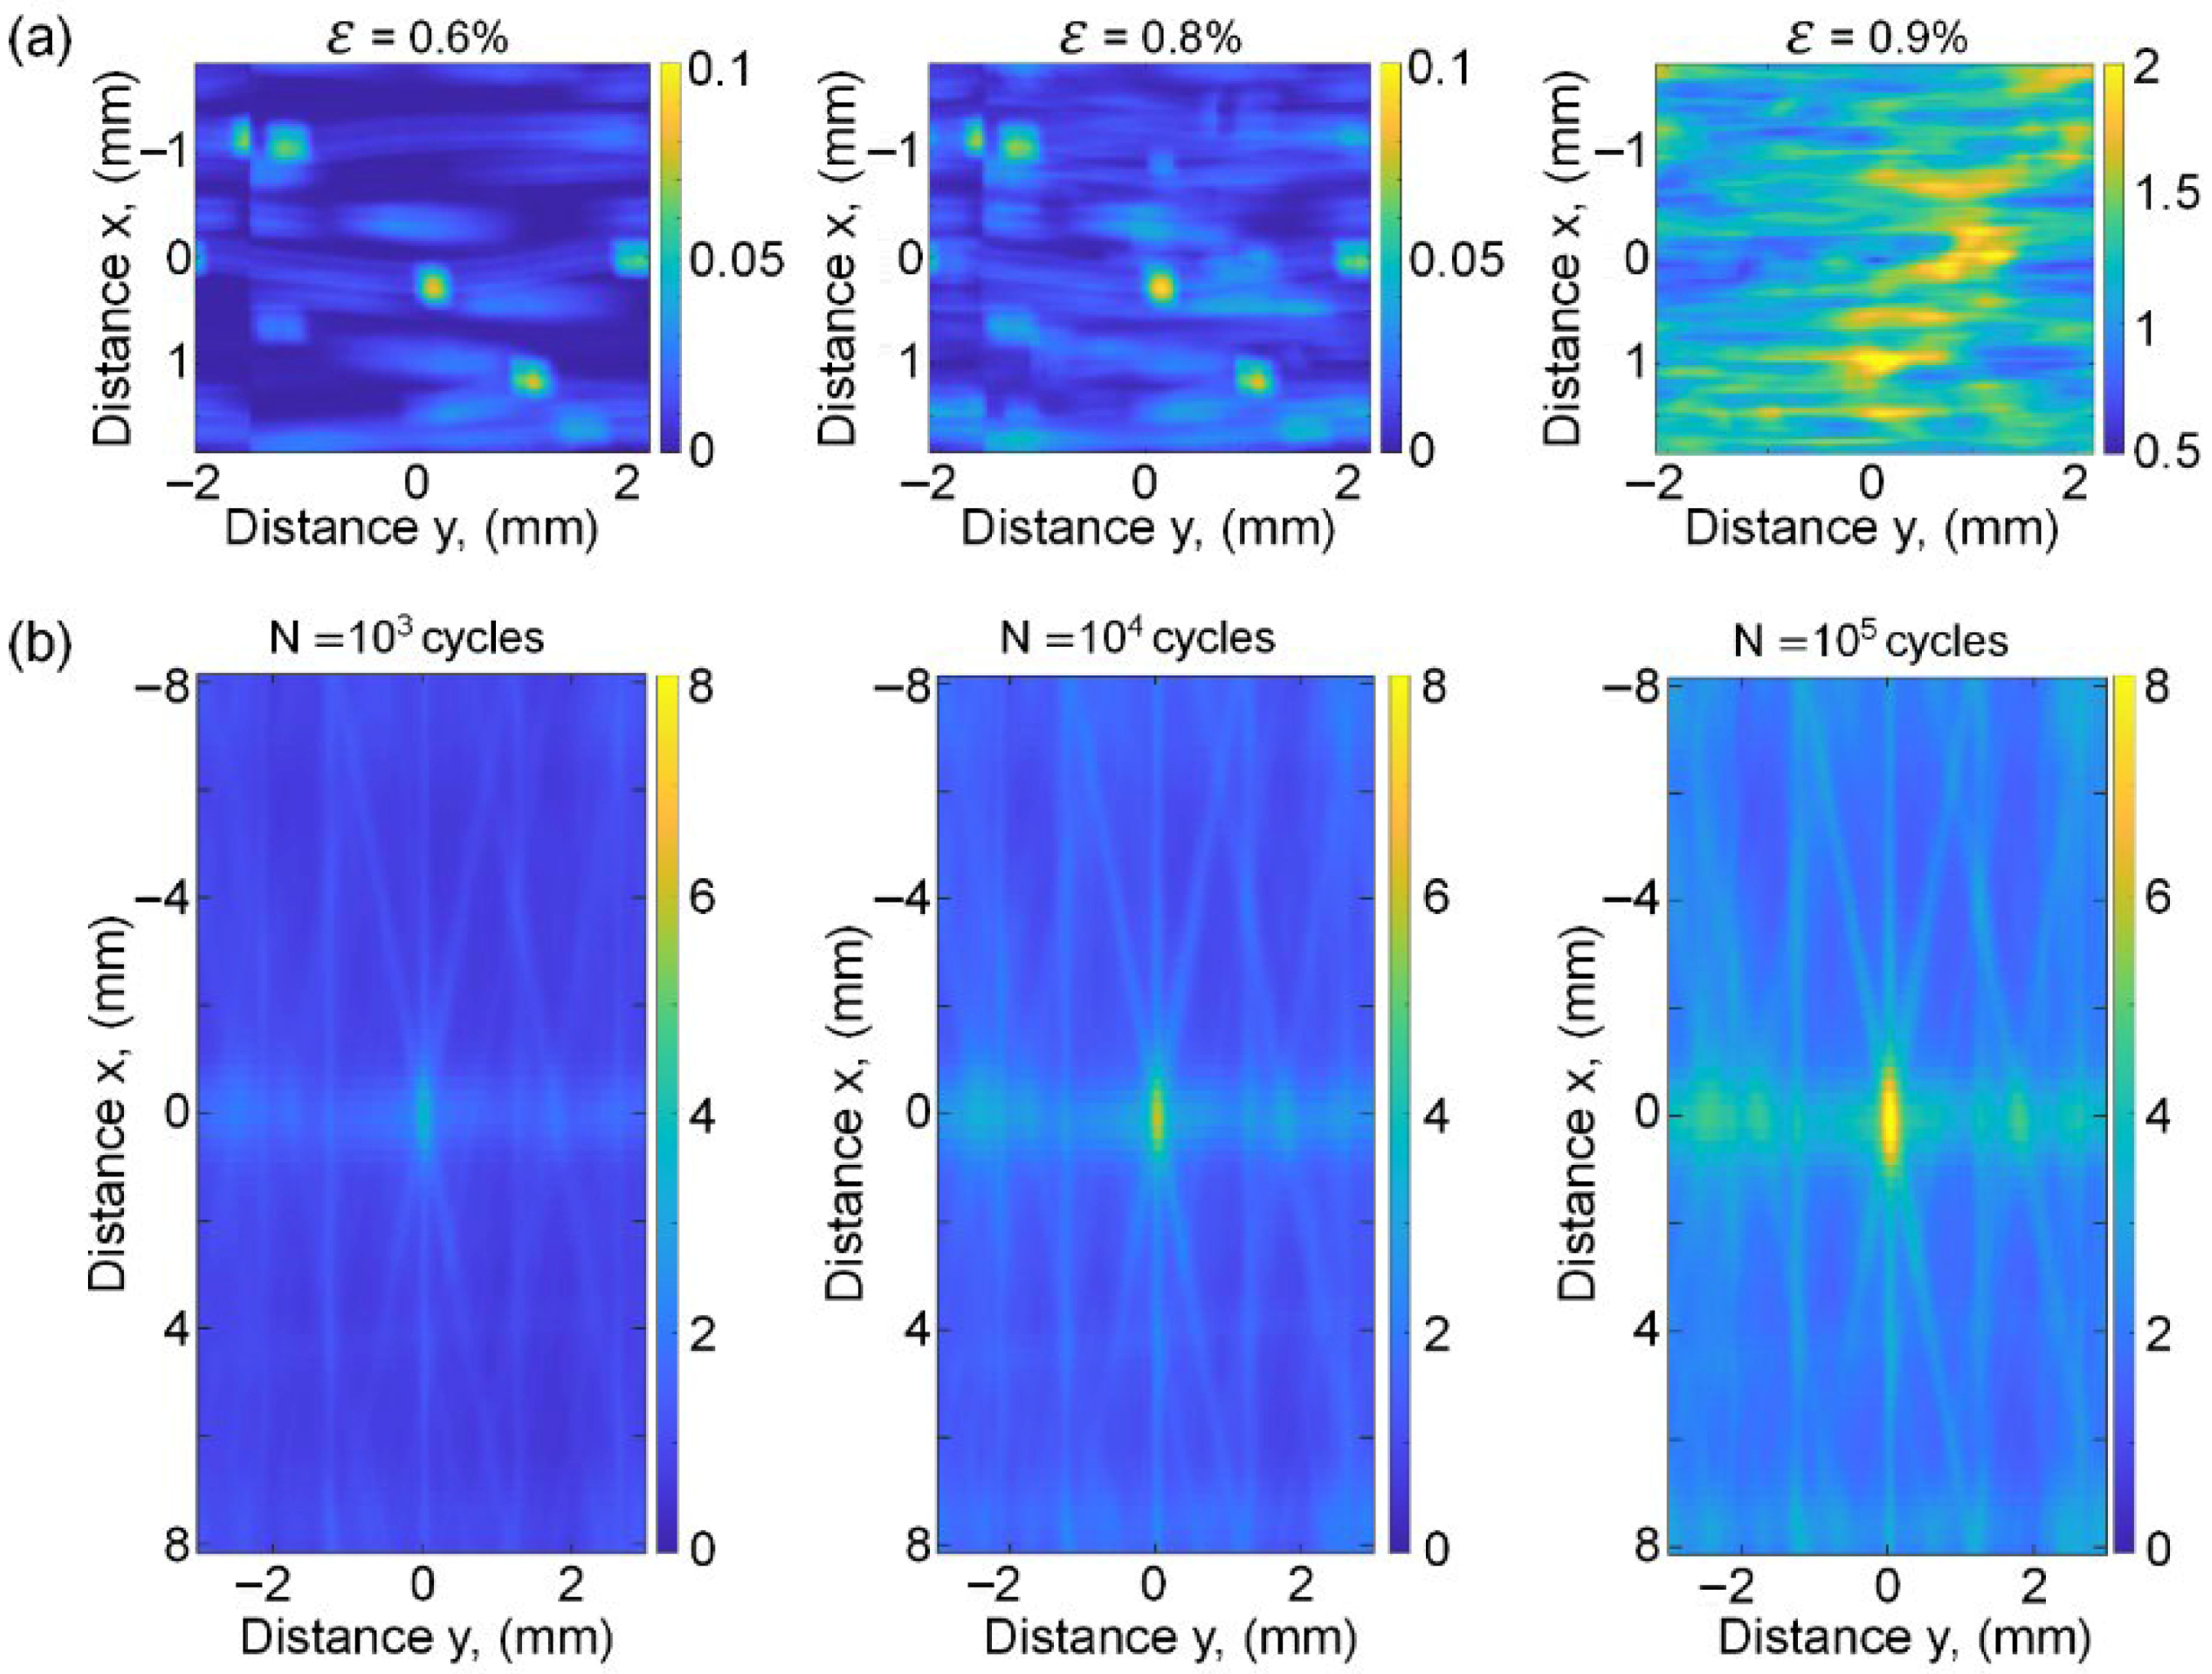
Figure 13 illustrates similar cross-correlations between effective strain and glass fibre locations for the fatigue tests, for progressive levels of cyclical fatigue. As with the static tension results (Figure 12a), higher strain levels develop close to the glass fibres, with strains reaching up to three times higher than in the surrounding regions. SVM metrics from Figure 13 show that strains near glass fibres peak at ~0.075 a.u., versus ~0.025 a.u. in the matrix—a three-fold amplification. This data confirms that the spatial periodicity of strain energy dissipation in fatigue provides a hierarchical mechanical basis to explain the typical damage state, with higher strain levels developing close to the glass fibres. Unlike the monotonic loading case (Figure 12b), the strain is also higher at pore locations, and strain also correlates with crack positions (Figure 14). Under cyclic loading, however, localised energy dissipation manifests at lower bulk stress levels, altering the damage behaviour and allowing voids to serve as nucleation points for cracks. The SVM maps are similar to those observed for the strain–glass correlations in Figure 13.
Figure 13.
SVM between strain and glass fibres for cyclic fractions. The colour bar refers to the average strain at a given distance away from an arbitrary point within glass fibres.
Figure 14.
SVM at 105 cycles between (a) strain and pristine pores and (b) strain and cracks.
Figure 15 shows the SVM of correlations between crack and glass fibre locations for both monotonic and fatigue testing. A strong correlation between these two is seen in fatigue. This contrasts with the tensile case in which the cracks initiated near the glass, but then propagated away from the glass tows, as evident from the progression of the central hotspot, away from the origin (Figure 15a).
Figure 15.
SVM of cracks and glass fibres for (a) applied strain and (b) cyclic fractions.
4.5. Damage Evolution
The SVM of the CT images provides an understanding of general geometrical relationships between different components of the composite specimens but does not shed light on the influence of specimen geometry on damage formation. Hence, both statistical and visual observations of damage are required [38]. Because these observations are conducted in close proximity to the open hole, the local damage mechanisms are profoundly influenced by the global stress intensity field (Equation (3)). The residual strains seen in the unloaded state are likely to be due to the residual crack opening displacements of the damage components caused by loading.
In monotonic loading, residual strains were visible close to glass weaves (Figure 15a) as seen earlier [9]. But few cracks nucleated at the lower strains, and they did not increase in magnitude appreciably between 0.6% and 0.9% applied strain. These cracks subsequently propagate away from the weaves in the form of delamination between carbon layers. As the applied strain approaches 0.9%, these initially isolated microcracks begin coalescing into a contiguous damage network. This coalescence is strongly influenced by the open-hole stress intensity field.
In cyclic loading, a steady increase in residual strain correlated with glass fibre location (Figure 13). The strain also correlated with pore location and crack positions (Figure 14). The SVM maps quantify the spatial topology of damage with respect to the material microstructure; as ex situ characterisations, they capture the geometry of the damage state at each interruption scan point. The strong spatial co-location of voids and cracks is consistent with two mechanistically distinct interpretations: propagating fatigue cracks may be preferentially deflected toward resin-rich regions adjacent to the glass fibres—where void density is inherently elevated as a consequence of the weave-obstruction mechanism during liquid moulding—or the voids may act as topological features that lower the local energy barrier for crack advance. In either case, SVM rigorously maps the spatial affinity between these microstructural features and the evolving damage network, identifying them as architecturally prescribed preferential pathways for damage accumulation under sub-critical cyclic loading [17].
4.6. Interlacing Weave Sensitivity
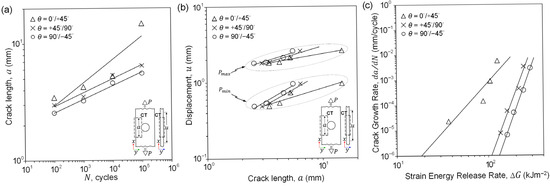
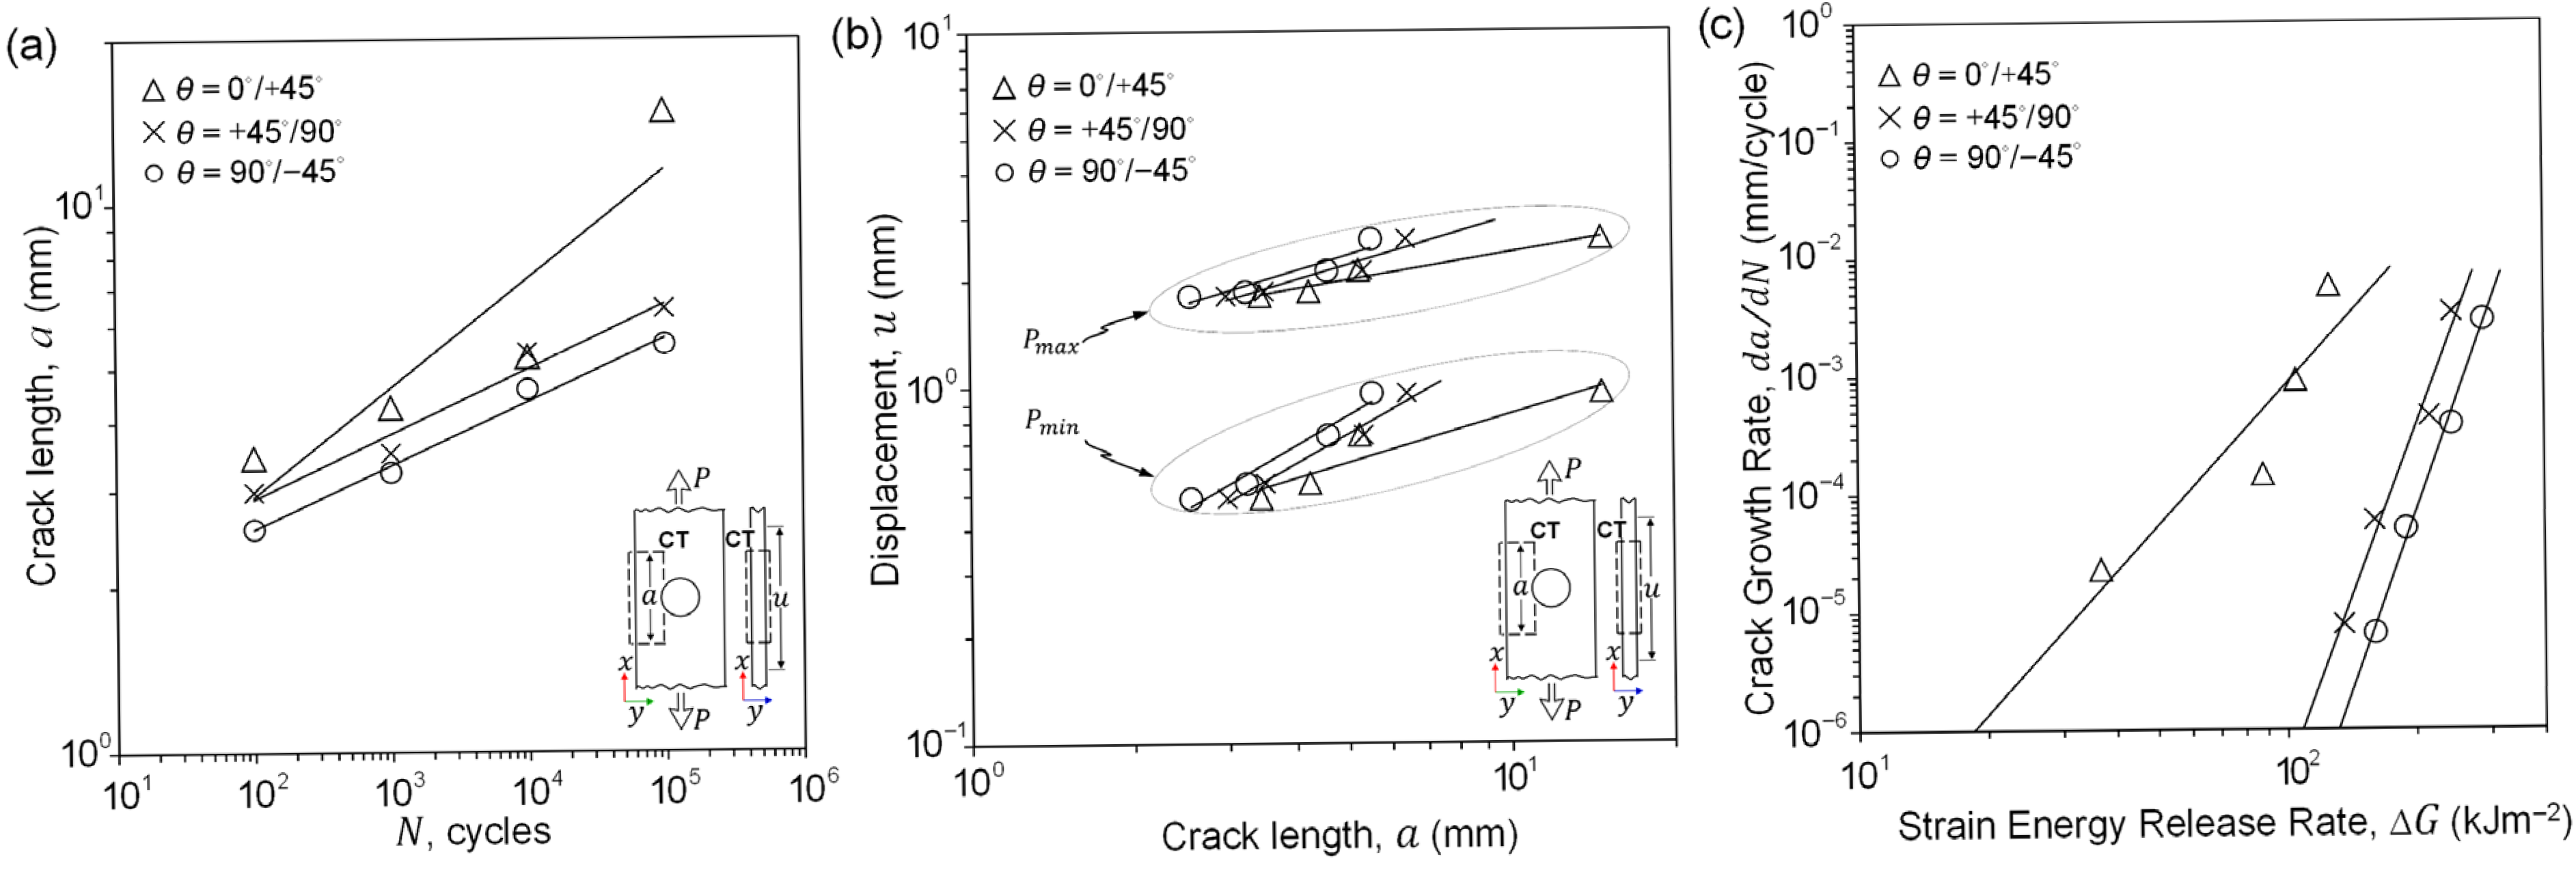
The results shown in the preceding sections can be used to provide a preliminary assessment of the fatigue micromechanisms of strain redistribution around interlacing weaves, flaws, and load-induced cracks. The results obtained for this material (Figure 9, Figure 10, Figure 14 and Figure 15) verify that delamination is the dominant damage mode in fatigue. In the longitudinal orientation, along the direction of the applied load, the onset of cracking occurs within the first ten cycles; the crack length is similar to the spacing between two weft-angle interlocks. At higher numbers of cycles, damage growth follows a power law relationship resulting in a linear trend for all fibre orientations when plotted on logarithmic axes (Figure 16a).
Figure 16.
Comparison of ply interfaces in delamination growth, in terms of (a) cyclic life, (b) displacement, and (c) ∆G, with (–) power law curve fit. Data obtained from test bench (load P and cycle count N), extensometer (displacement u) and CT (crack length a).
Figure 16 shows that the simple power law relationship between fatigue delamination growth rate da/dN and SERR range ∆G, suggested in Section 3 (Equation (6)), fits the data. Delamination crack length as a function of applied load cycles is shown in Figure 16a, where the terminal crack length is typically between one half and two times the hole diameter. Figure 16b shows that the displacement readings from the extensometer, which measures the axial displacement, range from about one-tenth to one-third of the total crack length measured for each load-bearing ply. CT analysis indicates that delaminations propagate as discrete, planar cracks confined to specific ply interfaces, rather than as irregular three-dimensional fronts. This observation supports the use of orientation-specific planar crack lengths for analysis. The consistently low values of u relative to a indicate the laminate’s high axial stiffness in OHT. Unlike DCB specimens, the OHT configuration limits global elastic extension (u) to sub-millimetre levels, while interlaminar cracks (a) extend over several millimetres. As these cracks remain strictly planar, empirical compliance measurements capture orientation-specific stiffness degradation, validating the SERR calculation based on Griffith’s energy balance [46]. Each ply orientation demonstrates a distinct power law fit of crack growth rate with strain energy release rate (Figure 16c). Variations in weave density and ply alignment result in local crack deflections, which influence the rate of delamination growth through the material [47].
The damage continues to grow until final catastrophic failure at approximately 105 cycles (Figure 3b). Despite local crack deflections, the overall delamination grows steadily, supporting the use of an energy-based Paris relationship to predict delamination in woven composites (Equation (6)). This relationship highlights the association between crack formation and the position of interlacing weaves (Figure 15b), further demonstrating their significant contribution to delamination resistance.
Cyclic loading can cause a build-up of strain around the woven interlock prior to final failure, as shown in Figure 10 and Figure 13. In contrast to monotonic static loading, fatigue cycling results in progressive degradation at the interlacing boundaries [48]. This leads to localised rupture of warp glass weaves in the load-bearing plies and interface cracking around the interlocks. Once the interlocks rupture, their toughening effect is lost, resulting in a rapid increase in the available strain energy release rate. These mechanisms reduce the material’s delamination resistance, allowing fractured warp and weft glass weaves to move past each other, which decreases overall stiffness and accelerates failure progression. This emphasises the correlation between localised strain and cracking in composites (Equation (5)). Studies of glass interlacing weaves [17,49] indicate that geometric irregularities increase strain during quasi-static loading, particularly in regions with zig-zag waviness and voids (Figure 6c and Figure 11). This can delocalise failure and affect load transfer around tow failures (Figure 16). SVM method data indicate that average strains prior to fatigue failure are approximately one-third of those observed in quasi-static fracture. This observation supports the conclusion that fatigue failure is mainly driven by cumulative, localised degradation at the structural interfaces.
4.7. Scaling the Synergistic Microstructure-Sensitive Methodology
The synergistic characterisation methodology combining CT, DVC, and SVM provides a robust, quantitative approach for microstructure-sensitive assessment of fatigue damage in woven composites. Several extensions are identified to further consolidate and broaden its applicability. (i) SVM was restricted to single representative specimens at each scan interruption point due to the challenges associated with beamtime and the computational requirements of high-resolution CT imaging. Bulk mechanical response was characterised using five replicate specimens per loading condition, providing statistical confidence at the macro-scale resolution. Extending the SVM workflow to replicate specimens would enable the transition from methodological proof-of-concept to batch-level statistical material descriptors suitable for qualification. (ii) The CT scans for monotonic and cyclic load cases were acquired using different imaging modalities that exhibit distinct spatial resolution (Table 1); consequently, SVM outputs represent modality-specific relative probabilities. Direct amplitude comparison across regimes would require unified-resolution control datasets in future work. (iii) The normalised probability values are sensitive to voxel size, field of view, and segmentation threshold, and are therefore specific to the woven, NCF architecture investigated. SVM is, in principle, independent of material architecture; systematic evaluation of its sensitivity and transferability to alternative textile systems, including homogeneous architectures, is a promising direction. (iv) CT characterisation was performed ex situ on unloaded specimens to capture the geometry of the damage network at each interruption point. The DVC strain fields correspond to the residual crack opening displacements retained after unloading. Implementation of in situ loading with controlled static dwell times would decouple viscoelastic strain recovery from permanent residual strains and provide temporal resolution of crack initiation, overcoming the limitations of the current ex situ method.
5. Conclusions
An integrated characterisation approach combining high-resolution X-ray CT (XCT), digital volume correlation (DVC), robust quantitative statistical visualisation mapping (SVM), and Paris Law fracture modelling was applied to investigate damage initiation and subsequent progression at the microscale in a commercial aerospace-grade woven composite. The principal relationship between microstructural features (e.g., pores or glass fibres) and mechanical behaviour (e.g., localised residual strain or crack development) was quantified and visualised. The analysis revealed several key insights:
- (i)
- The accumulation of damage is dependent on the loading regime. Quantitative statistical visualisation mapping (SVM) indicates that quasi-static failure is predominantly notch-dominated, while cyclic fatigue damage accumulates preferentially near architectural crimps. These regions act as imperfections, generating local stress concentrations that interact with the open-hole stress field.
- (ii)
- Spatial correlations indicate that orthogonal weft glass weaves promote early crack nucleation at interlacing boundaries during cyclic loading.
- (iii)
- The influence of micro-voids is dependent on the loading regime. During monotonic tension, open-hole stress intensity governs the failure path and diminishes the effect of entrained micro-voids. In sub-critical cyclic loading, micro-voids act as preferential pathways for damage accumulation, with strong spatial co-location of void and crack distributions in SVM.
- (iv)
- Local energy dissipation is strictly governed by the recurring weave pattern and topological order. This was confirmed by probabilistic correlations mapping residual strain against weaves and voids, which identified measurable strain hotspots.
- (v)
- The crack path exhibits severe local deflections and microscale tortuosity. The macroscopic damage zone expands in a stable manner, indicating that an energy-based Paris relationship is suitable for predicting bulk delamination kinetics in these structures.
- (vi)
- Interface cracks running parallel to the ply interface showed local variations in both size and location. This scatter is a direct result of stochastic changes in the meso-scale density of the orthogonal weave.
By examining the mechanisms behind quasi-static and fatigue damage, this quantitative approach offers a practical solution that can be applied to other material systems. These methods are useful for building high-fidelity material models using limited microscale test data. Linking microscale observations with macrostructural models will improve the fundamental understanding of slow damage growth and crack arrest, which can support design of damage-tolerant composite structures containing manufacturing defects.
Author Contributions
Conceptualization, S.M.S. (Sanjay M. Sisodia), S.M.S. (S. Mark Spearing) and D.T.F., methodology, S.M.S. (Sanjay M. Sisodia), D.J.B., A.R.G., M.N.M. and D.T.F.; data acquisition, S.M.S. (Sanjay M. Sisodia), D.J.B. and M.N.M.; analysis, S.M.S. (Sanjay M. Sisodia) and D.T.F.; investigation, S.M.S. (Sanjay M. Sisodia) and D.T.F.; data curation, S.M.S. (Sanjay M. Sisodia) and D.T.F.; writing—original draft preparation, S.M.S. (Sanjay M. Sisodia); writing—review and editing, S.M.S. (Sanjay M. Sisodia), A.R.G., S.M.S. (S. Mark Spearing) and D.T.F.; project administration, S.M.S. (Sanjay M. Sisodia), S.M.S. (S. Mark Spearing) and D.T.F.; funding acquisition, S.M.S. (Sanjay M. Sisodia), S.M.S. (S. Mark Spearing) and D.T.F. All authors have read and agreed to the published version of the manuscript.
Funding
This work was supported by the U.S. National Science Foundation (Grant No. CMMI 1538447), by the U.K. Engineering and Physical Sciences Research Council (Grant No. EP/H01506X), by the Swiss Light Source (Grant No. FP7/312284), by the Swedish Aerospace Research Foundation NFFP and GKN Aerospace.
Data Availability Statement
Data available upon request.
Acknowledgments
The authors are grateful for access to facilities TOMCAT-X02DA beamline at the Swiss Light Source, MFGEN at Brigham Young University and µ-VIS X-ray Imaging Centre at the University of Southampton. Materials were supplied by GKN Aerospace—Aircraft Engines.
Conflicts of Interest
Author Sanjay M. Sisodia was employed by GKN Aerospace. The remaining authors declare that the research was conducted in the absence of any commercial or financial relationships that could be construed as a potential conflict of interest.
References
- Ratna, D. Handbook of Thermoset Resins; iSmithers Rapra Publishing: Shawbury, UK, 2009. [Google Scholar]
- Barcenas, L.; Narayana, S.S.; Khoun, L.; Trudeau, P.; Hubert, P. Thermochemical and rheological characterization of highly reactive thermoset resins for liquid moulding. J. Compos. Mater. 2023, 57, 3013–3024. [Google Scholar] [CrossRef] [Scilit]
- Yalcinkaya, M.A.; Guloglu, G.E.; Pishvar, M.; Amirkhosravi, M.; Sozer, E.M.; Altan, M.C. Pressurized infusion: A new and improved liquid composite molding process. J. Manuf. Sci. Eng. 2019, 141, 011007. [Google Scholar] [CrossRef] [Scilit]
- Vilà, J.; Sket, F.; Wilde, F.; Requena, G.; González, C.; LLorca, J. An in situ investigation of microscopic infusion and void transport during vacuum-assisted infiltration by means of X-ray computed tomography. Compos. Sci. Technol. 2015, 119, 12–19. [Google Scholar] [CrossRef] [Scilit]
- Mehdikhani, M.; Gorbatikh, L.; Verpoest, I.; Lomov, S.V. Voids in fiber-reinforced polymer composites: A review on their formation, characteristics, and effects on mechanical performance. J. Compos. Mater. 2019, 53, 1579–1669. [Google Scholar] [CrossRef] [Scilit]
- Lee, Y.; Chatziathanasiou, T.; Breite, C.; Mehdikhani, M.; Swolfs, Y.; Mavrogordato, M.N.; Spearing, S.M.; Sinclair, I. Correlating fibre break development with fibre misalignment and resin-rich pockets using in situ holotomography. Compos. Part A Appl. Sci. Manuf. 2026, 200, 109361. [Google Scholar] [CrossRef] [Scilit]
- Rohatgi, V.; Lee, L.J. Moldability of tackified fiber preforms in liquid composite molding. J. Compos. Mater. 1997, 31, 720–744. [Google Scholar] [CrossRef] [Scilit]
- Lystrup, C.; George, A.; Zobell, B.; Boster, K.; Childs, C.; Girod, H.; Fullwood, D. Optical measurement of voids in situ during infusion of carbon reinforcements. J. Compos. Mater. 2021, 55, 775–786. [Google Scholar] [CrossRef] [Scilit]
- Sisodia, S.M.; Garcea, S.C.; George, A.R.; Fullwood, D.T.; Spearing, S.M.; Gamstedt, E.K. High-resolution computed tomography in resin infused woven carbon fibre composites with voids. Compos. Sci. Technol. 2016, 131, 12–21. [Google Scholar] [CrossRef] [Scilit]
- Frishfelds, V.; Lundström, T.S.; Jakovics, A. Bubble motion through non-crimp fabrics during composites manufacturing. Compos. Part A Appl. Sci. Manuf. 2008, 39, 243–251. [Google Scholar] [CrossRef] [Scilit]
- Sisodia, S.M.; Gamstedt, E.K.; Edgren, F.; Varna, J. Effects of voids on quasi-static and tension fatigue behaviour of carbon-fibre composite laminates. J. Compos. Mater. 2015, 49, 2137–2148. [Google Scholar] [CrossRef] [Scilit]
- Abumeri, G.H.; Kuguoglu, L.H.; Chamis, C.C. Composite Fan Blade Design for Advanced Engine Concepts; NASA/CR-2004-213075; NASA Technical Reports Server; NASA: Washington, DC, USA, 2004.
- Greenhalgh, E.S. Failure Analysis and Fractography of Polymer Composites; Woodhead Publishing: Cambridge, UK, 2009. [Google Scholar] [CrossRef] [Scilit]
- Pascoe, J.A.; Alderliesten, R.C.; Benedictus, R. Methods for the prediction of fatigue delamination growth in composites and adhesive bonds—A critical review. Eng. Fract. Mech. 2013, 112–113, 72–96. [Google Scholar] [CrossRef] [Scilit]
- Danesh, H.; Di Lorenzo, D.; Chinesta, F.; Reese, S.; Brepols, T. FFT-based surrogate modeling of auxetic metamaterials with real-time prediction of effective elastic properties and swift inverse design. Mater. Des. 2024, 248, 113491. [Google Scholar] [CrossRef] [Scilit]
- Chatziathanasiou, T.; Lee, Y.; Villanova, J.; Stamati, O.; AhmadvashAghbash, S.; Fazlali, B.; Breite, C.; Sinclair, I.; Mavrogordato, M.N.; Spearing, S.M.; et al. Questioning the representativeness of damage mechanisms in single-fiber composites via in situ synchrotron x-ray holo-tomography. Small 2024, 20, 2406168. [Google Scholar] [CrossRef] [Scilit]
- Skolnick, M.; Torquato, S. Effective transport and mechanical properties of two-phase materials across the order-disorder spectrum. Acta Mater. 2025, 290, 120921. [Google Scholar] [CrossRef] [Scilit]
- US Department of Defense. MIL-HDBK-17: Composite Materials Handbook: Polymer Matrix Composites; Department of Defense: Washington, DC, USA, 2002.
- Alam, P.; Mamalis, D.; Robert, C.; Floreani, C.; Ó Brádaigh, C.M. The fatigue of carbon fibre reinforced plastics—A review. Compos. Part B Eng. 2019, 166, 555–579. [Google Scholar] [CrossRef] [Scilit]
- Xu, Z.; Yokoyama, A. Influence of the woven structure on the initial fracture behavior of roving glass fabric reinforced composites. Open J. Compos. Mater. 2018, 8, 54–67. [Google Scholar] [CrossRef]
- Zhou, Y.; Cao, Y.; Cao, J.; Zhang, C.; Li, J.; Wang, Z. Fracture toughness and fiber bridging mechanism for mode-I interlaminar failure of spread-tow woven composites. Eng. Fract. Mech. 2024, 298, 109957. [Google Scholar] [CrossRef] [Scilit]
- Lomov, S.V.; Ivanov, D.S.; Verpoest, I.; Zako, M.; Kurashiki, T.; Nakai, H.; Hirosawa, S. Meso-FE modelling of textile composites: Road map, data flow and algorithms. Compos. Sci. Technol. 2007, 67, 1870–1891. [Google Scholar] [CrossRef] [Scilit]
- Gao, F.; Boniface, L.; Ogin, S.L.; Smith, P.A.; Greaves, R.P. Damage accumulation in woven-fabric CFRP laminates under tensile loading: Part 1. Observations of damage accumulation. Compos. Sci. Technol. 1999, 59, 123–136. [Google Scholar] [CrossRef] [Scilit]
- Paris, P.C.; Erdogan, F. A critical analysis of crack propagation laws. J. Basic Eng. 1963, 85, 528–533. [Google Scholar] [CrossRef] [Scilit]
- Sih, G.C.; Paris, P.C.; Irwin, G.R. On cracks in rectilinearly anisotropic bodies. Int. J. Fract. Mech. 1965, 1, 189–203. [Google Scholar] [CrossRef] [Scilit]
- Bowie, O.L. Analysis of an infinite plate containing radial cracks originating at the boundary of an internal circular hole. J. Math. Phys. 1956, 35, 60–71. [Google Scholar] [CrossRef] [Scilit]
- Hallett, S.R.; Green, B.G.; Jiang, W.G.; Wisnom, M.R. An experimental and numerical investigation into the damage mechanisms in notched composites. Compos. Part A Appl. Sci. Manuf. 2009, 40, 613–624. [Google Scholar] [CrossRef] [Scilit]
- Nixon-Pearson, O.J.; Hallett, S.R.; Withers, P.J.; Rouse, J. Damage development in open hole composite specimens in fatigue. Part 1: Experimental investigation. Compos. Part A Appl. Sci. Manuf. 2013, 44, 106–118. [Google Scholar] [CrossRef] [Scilit]
- Rans, C.; Alderliesten, R.C.; Benedictus, R. Misinterpreting the results: How similitude can improve our understanding of fatigue delamination growth. Compos. Sci. Technol. 2011, 71, 230–238. [Google Scholar] [CrossRef] [Scilit]
- Helwing, R.; Hülsbusch, D.; Walther, F. Deep learning method for analysis and segmentation of fatigue damage in X-ray computed tomography data for fiber-reinforced polymers. Compos. Sci. Technol. 2022, 230, 109781. [Google Scholar] [CrossRef] [Scilit]
- Fritz, N.K.; Kopp, R.; Nason, A.K.; Ni, X.; Lee, J.; Stein, I.Y.; Kalfon-Cohen, E.; Sinclair, I.; Spearing, S.M.; Camanho, P.P.; et al. New interlaminar features and void distributions in advanced aerospace-grade composites revealed via automated algorithms using micro-computed tomography. Compos. Sci. Technol. 2020, 193, 108132. [Google Scholar] [CrossRef] [Scilit]
- Garcea, S.C.; Wang, Y.; Withers, P.J. X-ray computed tomography of polymer composites. Compos. Sci. Technol. 2018, 156, 305–319. [Google Scholar] [CrossRef] [Scilit]
- Holmes, J.; Sommacal, S.; Das, R.; Stachurski, Z.; Compston, P. Digital image and volume correlation for deformation and damage characterisation of fibre-reinforced composites: A review. Compos. Struct. 2023, 315, 116994. [Google Scholar] [CrossRef] [Scilit]
- Buljac, A.; Jailin, C.; Mendoza, A.; Neggers, J.; Taillandier-Thomas, T.; Bouterf, A.; Smaniotto, B.; Hild, F.; Roux, S. Digital Volume Correlation: Review of Progress and Challenges. Exp. Mech. 2018, 58, 661–708. [Google Scholar] [CrossRef] [Scilit]
- Bay, B.K.; Smith, T.S.; Fyhrie, D.P.; Saad, M. Digital volume correlation: Three-dimensional strain mapping using X-ray tomography. Exp. Mech. 1999, 39, 217–226. [Google Scholar] [CrossRef] [Scilit]
- Pan, B.; Qian, K.; Xie, H.; Asundi, A. Two-dimensional digital image correlation for in-plane displacement and strain measurement: A review. Meas. Sci. Technol. 2009, 20, 062001. [Google Scholar] [CrossRef] [Scilit]
- Fullwood, D.T.; Niezgoda, S.R.; Adams, B.L.; Kalidindi, S.R. Microstructure sensitive design for performance optimization. Prog. Mater. Sci. 2010, 55, 477–562. [Google Scholar] [CrossRef] [Scilit]
- Gupta, A.; Cecen, A.; Goyal, S.; Singh, A.K.; Kalidindi, S.R. Structure-property linkages using a data science approach: Application to a non-metallic inclusion/steel composite system. Acta Mater. 2015, 91, 239–254. [Google Scholar] [CrossRef] [Scilit]
- Broughton, W.R.; Gower, M.R.L.; Lodeiro, M.J.; Pilkington, G.D.; Shaw, R.M. An experimental assessment of open-hole tension-tension fatigue behaviour of a GFRP laminate. Compos. Part A Appl. Sci. Manuf. 2011, 42, 1310–1320. [Google Scholar] [CrossRef] [Scilit]
- Wilkins, D.J.; Eisenmann, J.R.; Camin, R.A.; Margolis, W.S.; Benson, R.A. Characterizing delamination growth in graphite-epoxy. In Damage in Composite Materials: Basic Mechanisms, Accumulation, Tolerance, and Characterization; ASTM STP 775-EB; Reifsnider, K.L., Ed.; ASTM International: Philadelphia, PA, USA, 1982; pp. 168–183. [Google Scholar] [CrossRef] [Scilit]
- Asp, L.E.; Sjögren, A.; Greenhalgh, E.S. Delamination growth and thresholds in a carbon/epoxy composite under fatigue loading. J. Compos. Technol. Res. 2001, 23, 55–68. [Google Scholar] [CrossRef] [Scilit]
- Gustafson, C.G.; Hojo, M. Delamination fatigue crack growth in unidirectional graphite/epoxy laminates. J. Reinf. Plast. Compos. 1987, 6, 36–52. [Google Scholar] [CrossRef] [Scilit]
- Plank, B.; Helmus, R.; Gschwandtner, M.; Hinterhölzl, R.M.; Kastner, J. In-situ observation of bubble formation in neat resin during the curing process by means of X-ray computed tomography. In Proceedings of the 7th Conference on Industrial Computed Tomography, Wels, Austria, 9–12 February 2016. [Google Scholar]
- Castro, J.; Sket, F.; Helfen, L.; González, C. In situ local imaging and analysis of impregnation during liquid moulding of composite materials using synchrotron radiation computed laminography. Compos. Sci. Technol. 2021, 215, 108999. [Google Scholar] [CrossRef] [Scilit]
- Elnekhaily, S.A.; Talreja, R. Effects of micro voids on the early stage of transverse crack formation in unidirectional composites. Compos. Part A Appl. Sci. Manuf. 2023, 167, 107457. [Google Scholar] [CrossRef] [Scilit]
- Amaral, L.; Yao, L.; Alderliesten, R.; Benedictus, R. The relation between the strain energy release in fatigue and quasi-static crack growth. Eng. Fract. Mech. 2015, 145, 86–97. [Google Scholar] [CrossRef] [Scilit]
- Yao, L.; Cui, H.; Sun, Y.; Guo, L.; Chen, X.; Zhao, M.; Alderliesten, R.C. Fibre-bridged fatigue delamination in multidirectional composite laminates. Compos. Part A Appl. Sci. Manuf. 2018, 115, 175–186. [Google Scholar] [CrossRef] [Scilit]
- Yang, Q.D.; Schesser, D.; Niess, M.; Wright, P.; Mavrogordato, M.N.; Sinclair, I.; Spearing, S.M.; Cox, B.N. On crack initiation in notched, cross-plied polymer matrix composites. J. Mech. Phys. Solids 2015, 78, 314–332. [Google Scholar] [CrossRef] [Scilit]
- Ivanov, D.S.; Lomov, S.V.; Bogdanovich, S.G.; Karahan, M.; Verpoest, I. A comparative study of tensile properties of non-crimp 3D orthogonal weave and multi-layer plain weave E-glass composites. Compos. Part A Appl. Sci. Manuf. 2009, 40, 1134–1143. [Google Scholar] [CrossRef] [Scilit]

Disclaimer/Publisher’s Note: The statements, opinions and data contained in all publications are solely those of the individual author(s) and contributor(s) and not of MDPI and/or the editor(s). MDPI and/or the editor(s) disclaim responsibility for any injury to people or property resulting from any ideas, methods, instructions or products referred to in the content. |
© 2026 by the authors. Licensee MDPI, Basel, Switzerland. This article is an open access article distributed under the terms and conditions of the Creative Commons Attribution (CC BY) license.