


Abstract
Carbon fiber-reinforced polymer (CFRP) composites are increasingly used in lightweight structures; however, their poor thermal conductivity poses challenges during drilling, where excessive heat degrades the epoxy matrix. This study investigates the individual and combined effects of wax (0–2%) as a solid lubricant and graphene nanoplatelets (0–2%) as a heat dissipation enhancer on cutting temperature during CFRP drilling. A data-driven modeling approach based on response surface methodology (RSM) with dummy variables was developed using a full factorial design comprising 225 unique experimental conditions (9 formulations × 5 cutting speeds × 5 feed rates) with three replicates per condition, resulting in 675 individual drilling tests. The RSM model was fitted to the 225 condition means. The global RSM model achieved high predictive accuracy (R2 = 0.9250, RMSE = 2.83 °C). Results show that increasing the feed rate reduces temperature by up to 29% and improves process stability, contrary to conventional metal cutting behavior. The addition of 2% wax reduced mean temperature by 11.3% and decreased thermal variability by 26%. Graphene exhibited an optimal concentration at 0.25%, yielding a 4.3% reduction in cutting temperature, with higher concentrations providing no additional benefit due to agglomeration. The combined effects of wax and graphene resulted in an optimal formulation containing 2% wax and 0.25% graphene, which provided the most favorable balance between low cutting temperature (46.1 °C) and enhanced thermal consistency (standard deviation = 3.53 °C). These findings provide practical guidelines for designing thermally regulated CFRP composites for high-performance drilling operations.
1. Introduction
The increasing demand for lightweight structures in aerospace and automotive industries has propelled the widespread adoption of carbon fiber-reinforced polymer (CFRP) composites [1,2]. These materials offer exceptional specific strength, stiffness, and corrosion resistance. However, the very properties that make CFRP attractive also create significant challenges during machining operations, particularly drilling [3,4].
Drilling of CFRP is complicated by the material’s heterogeneous and anisotropic nature. The combination of hard, abrasive carbon fibers embedded in a relatively soft polymer matrix leads to complex cutting mechanisms that differ fundamentally from those observed in metallic materials [5,6,7]. Among the various issues encountered, thermal management represents a critical concern because the epoxy matrix exhibits inherently low thermal conductivity, typically ranging from 0.2 to 0.3 W/m·K [8,9].
During drilling, frictional interactions between the tool and the workpiece generate substantial heat [10]. This thermal energy accumulates in the cutting zone due to poor heat dissipation through the composite, leading to elevated temperatures that can exceed the glass transition temperature of the epoxy matrix [11,12]. Such thermal conditions induce matrix softening, degradation, and even pyrolysis, which severely compromise the structural integrity of the drilled component [13,14].
Traditional strategies for managing thermal issues in CFRP drilling have focused primarily on optimizing cutting parameters [15,16,17]. Reducing cutting speed and feed rate can lower heat generation, but this approach sacrifices productivity. The application of external coolants is often ineffective because the low thermal conductivity of CFRP prevents heat from migrating away from the cutting zone [18,19]. Furthermore, conventional cooling methods can introduce contaminants that affect subsequent bonding operations [20,21].
Tool geometry modifications and advanced coatings, such as polycrystalline diamond (PCD) or chemical vapor deposition (CVD) diamond, address wear resistance but do not directly mitigate the thermal load imposed on the workpiece [22,23,24,25]. Thus, a more fundamental solution targeting the thermal properties of the composite itself is required.
Recent advances in composite materials have demonstrated that the incorporation of functional additives can significantly alter the thermal behavior of polymer matrices [26,27,28,29]. Among various nanofillers, graphene has attracted considerable attention due to its high thermal conductivity, which can exceed 5000 W/m·K [30,31]. When dispersed in an epoxy matrix, graphene nanoplatelets create conductive pathways that facilitate heat transfer away from the cutting zone, thereby reducing localized temperature spikes [32].
Parallel to this approach, solid lubricants such as wax have been shown to reduce frictional heating at the tool–workpiece interface [33,34]. Unlike liquid lubricants, which may not penetrate the cutting zone effectively during CFRP drilling, wax additives are incorporated directly into the composite matrix [35,36]. During machining, the wax melts locally and forms a lubricating film that reduces the coefficient of friction [37,38]. This mechanism directly addresses the source of heat generation rather than merely attempting to dissipate heat after it is generated.
Although the individual effects of graphene and wax have been studied independently in various composite systems, their combined impact on thermal regulation during CFRP drilling has not been systematically examined. Furthermore, the thermal regulation mechanisms arising from the simultaneous presence of graphene and wax remain largely unexplored.
Furthermore, the combined influence of wax and graphene under varying drilling conditions remains largely uncharacterized. This knowledge gap hinders the rational design of composite formulations optimized for thermal management during machining.
While our previous work [10] focused on the coupled analysis of both cutting force and temperature during CFRP drilling, with particular emphasis on the dominant effect of feed rate on force generation and the reversal of graphene’s lubricating effect in the presence of wax, the present study is exclusively dedicated to thermal regulation mechanisms. It introduces a novel data-driven modeling approach based on response surface methodology (RSM) with dummy variables, which provides a unified framework for quantifying the thermal contribution of each additive formulation relative to the unmodified reference. This modeling approach, combined with the systematic quantification of thermal stability through quartile and standard deviation analysis and the identification of optimal additive formulations for thermal management, constitutes the distinct novelty of the present contribution.
The specific objectives of this study are:
- To quantify the individual and combined effects of wax and graphene on cutting temperature during CFRP drilling using a global RSM model with dummy variables;
- To identify optimal additive concentrations for minimizing thermal load;
- To characterize the thermal stability and parameter-response consistency of different formulations across varying cutting parameters;
- To provide physically interpretable insights into thermal regulation mechanisms through statistical analysis and model diagnostics.
2. Materials and Methods
2.1. Composite Fabrication
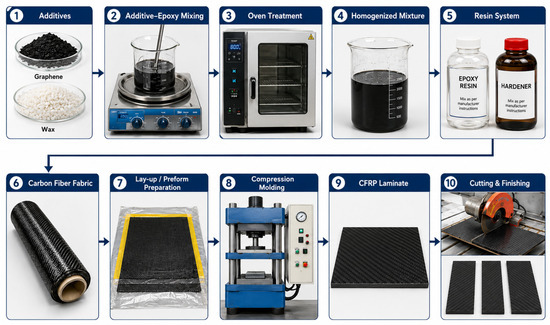
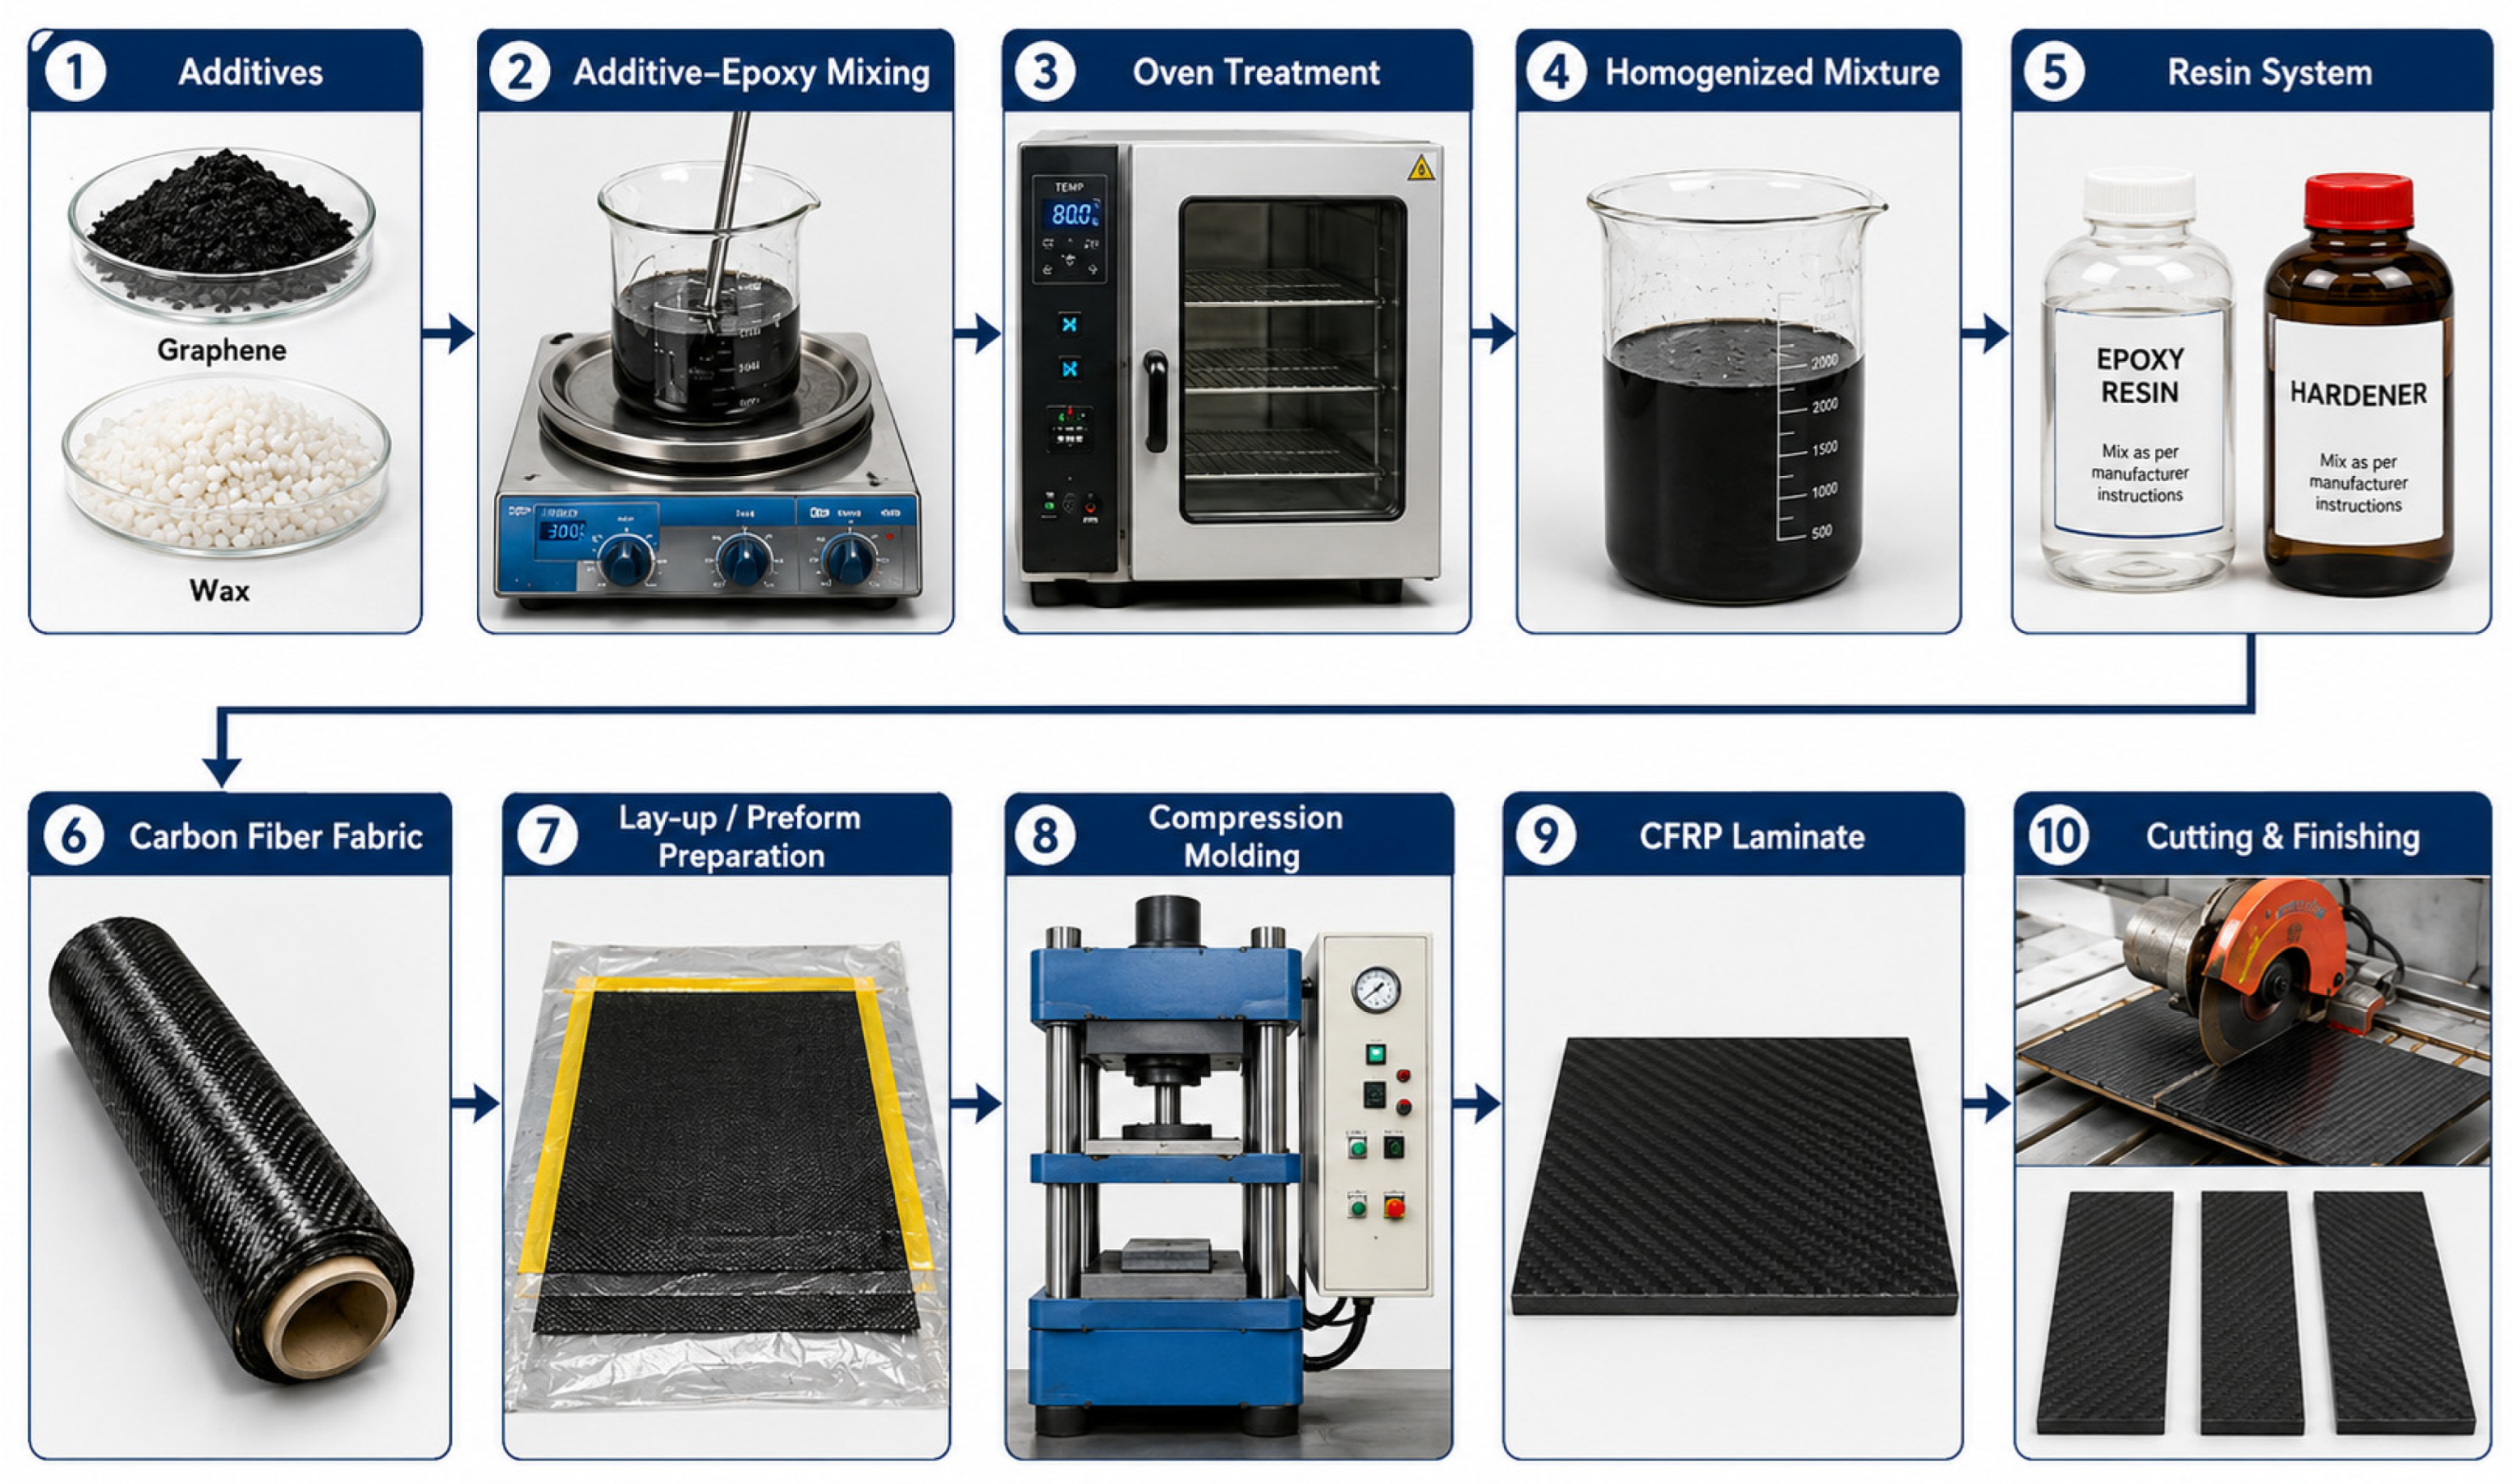
A total of nine CFRP laminate compositions were produced using a manual lay-up technique. The polymer matrix employed was SikaBiresin® CR72 (Sika, Madison Heights, MI, USA) combined with CH72-2 medium hardener in a 100:18 weight ratio. Unidirectional carbon fiber fabric TC-09-U (TEXONIC, St-Jean sur Richelieu, QC, Canada) served as the reinforcing phase. The stacking sequence comprised 16 layers, giving a finished plate thickness of 5 mm. Hardening took place at ambient temperature over a 24 h period (Figure 1).
Figure 1.
Schematic representation of the manufacturing workflow for graphene/wax-enhanced CFRP laminates, including additive preparation, resin modification, thermal homogenization, composite lay-up, compression molding, laminate fabrication, and final cutting/finishing operations.
Graphene nanoplatelets (Nano-Xplore Inc., Montréal, QC, Canada), were added at 0%, 0.25%, and 2% by weight. Manufacturer specifications indicate a primary particle size between 0.5 and 1 µm, an agglomerate size distribution with D10 = 4 µm, D50 = 12 µm, and D90 = 27 µm, a thickness of 6–10 layers, and a bulk density ranging from 0.2 to 0.3 g/cm3.
Wax additive, Ceraflour 996 (BYK USA Inc., Wallingford, CT, USA), was introduced at 0%, 1%, and 2% by weight to function as a solid lubricant. Literature suggests that wax concentrations exceeding 2% result in excessive softening of the composite [39]. The chosen graphene weight fractions (0%, 0.25%, and 2%) were selected based on literature recommendations for balancing performance enhancement and processability [40]. The 0.25% level corresponds to a low concentration that provides measurable improvements in thermal and mechanical behavior without compromising the composite’s processability. The 2% level represents a higher concentration approaching the upper limit beyond which graphene tends to agglomerate, leading to degraded mechanical properties and increased resin viscosity [41,42]. This upper limit was selected to capture the full range of graphene’s influence, from minimal effective dosage to the threshold where negative effects begin to appear. Intermediate concentrations were not included to keep the experimental design practical while still capturing the essential data trends across the concentration range.
2.2. Experimental Design
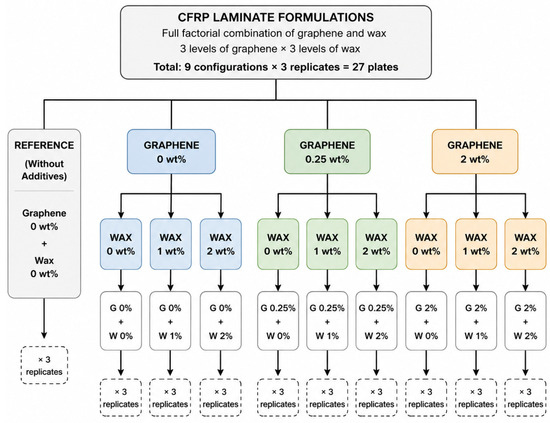
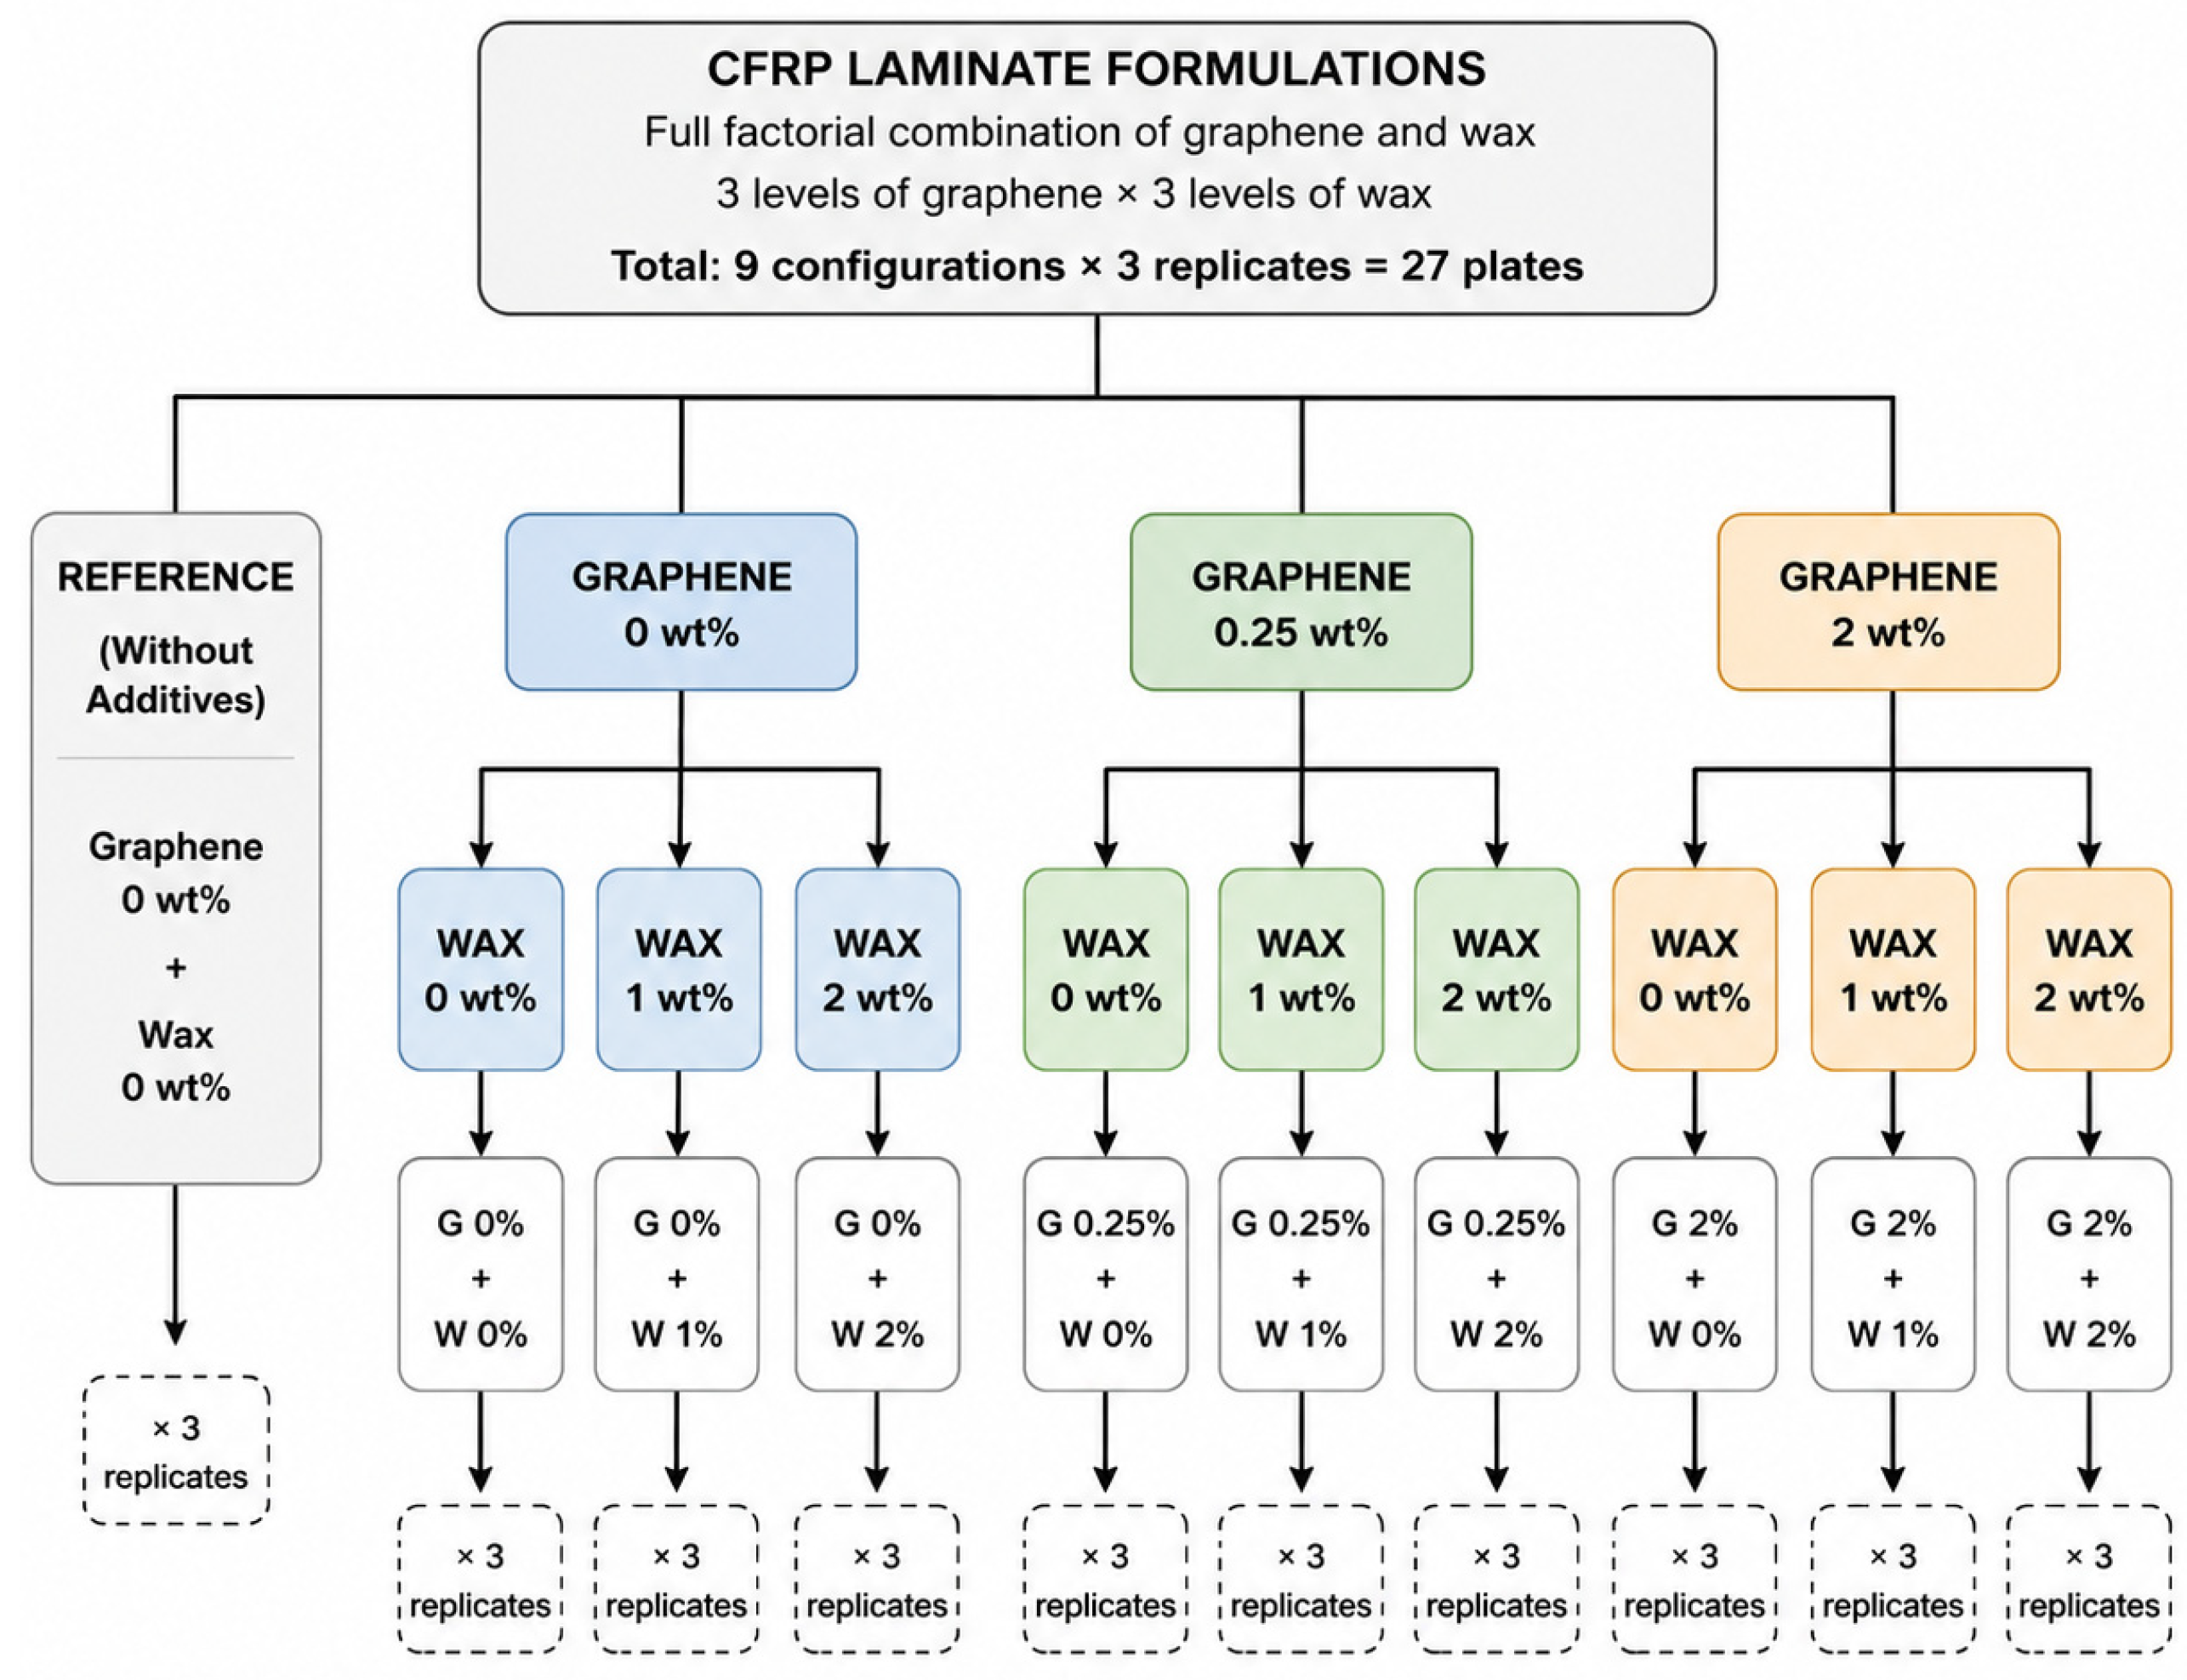
The experimental plan was structured around a full factorial design incorporating three independent factors. Cutting speed was tested at five levels (50, 100, 150, 200, and 250 m/min), while feed rate was also examined at five levels (0.005, 0.02, 0.05, 0.08, and 0.11 mm/rev). The material factor consisted of nine distinct CFRP laminate configurations, resulting from the full factorial combination of three graphene levels (0 wt%, 0.25 wt%, and 2 wt%) and three wax levels (0 wt%, 1 wt%, and 2 wt%). These nine formulations included a reference without additives, three formulations with varying wax at fixed 0% graphene, three formulations with varying wax at fixed 0.25% graphene, and three formulations with varying wax at fixed 2% graphene. Each formulation was produced in three replicate plates, yielding a total of 27 fabricated plates (Figure 2).
Figure 2.
Overview of the nine experimental formulations defined by different weight percentage combinations of graphene and wax.
All 25 machining conditions (5 cutting speeds × 5 feed rates) were applied to each of the nine material formulations. Every combination was repeated three times, leading to a total of 675 drilling experiments (9 formulations × 25 machining conditions × 3 repetitions). This full factorial approach enabled systematic evaluation of both the main effects of each factor and their potential interactions.
2.3. Drilling Procedure and Temperature Measurement
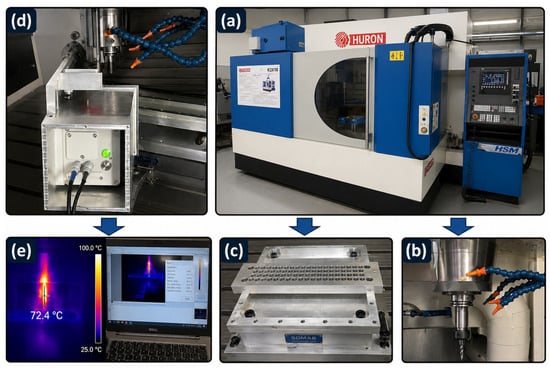
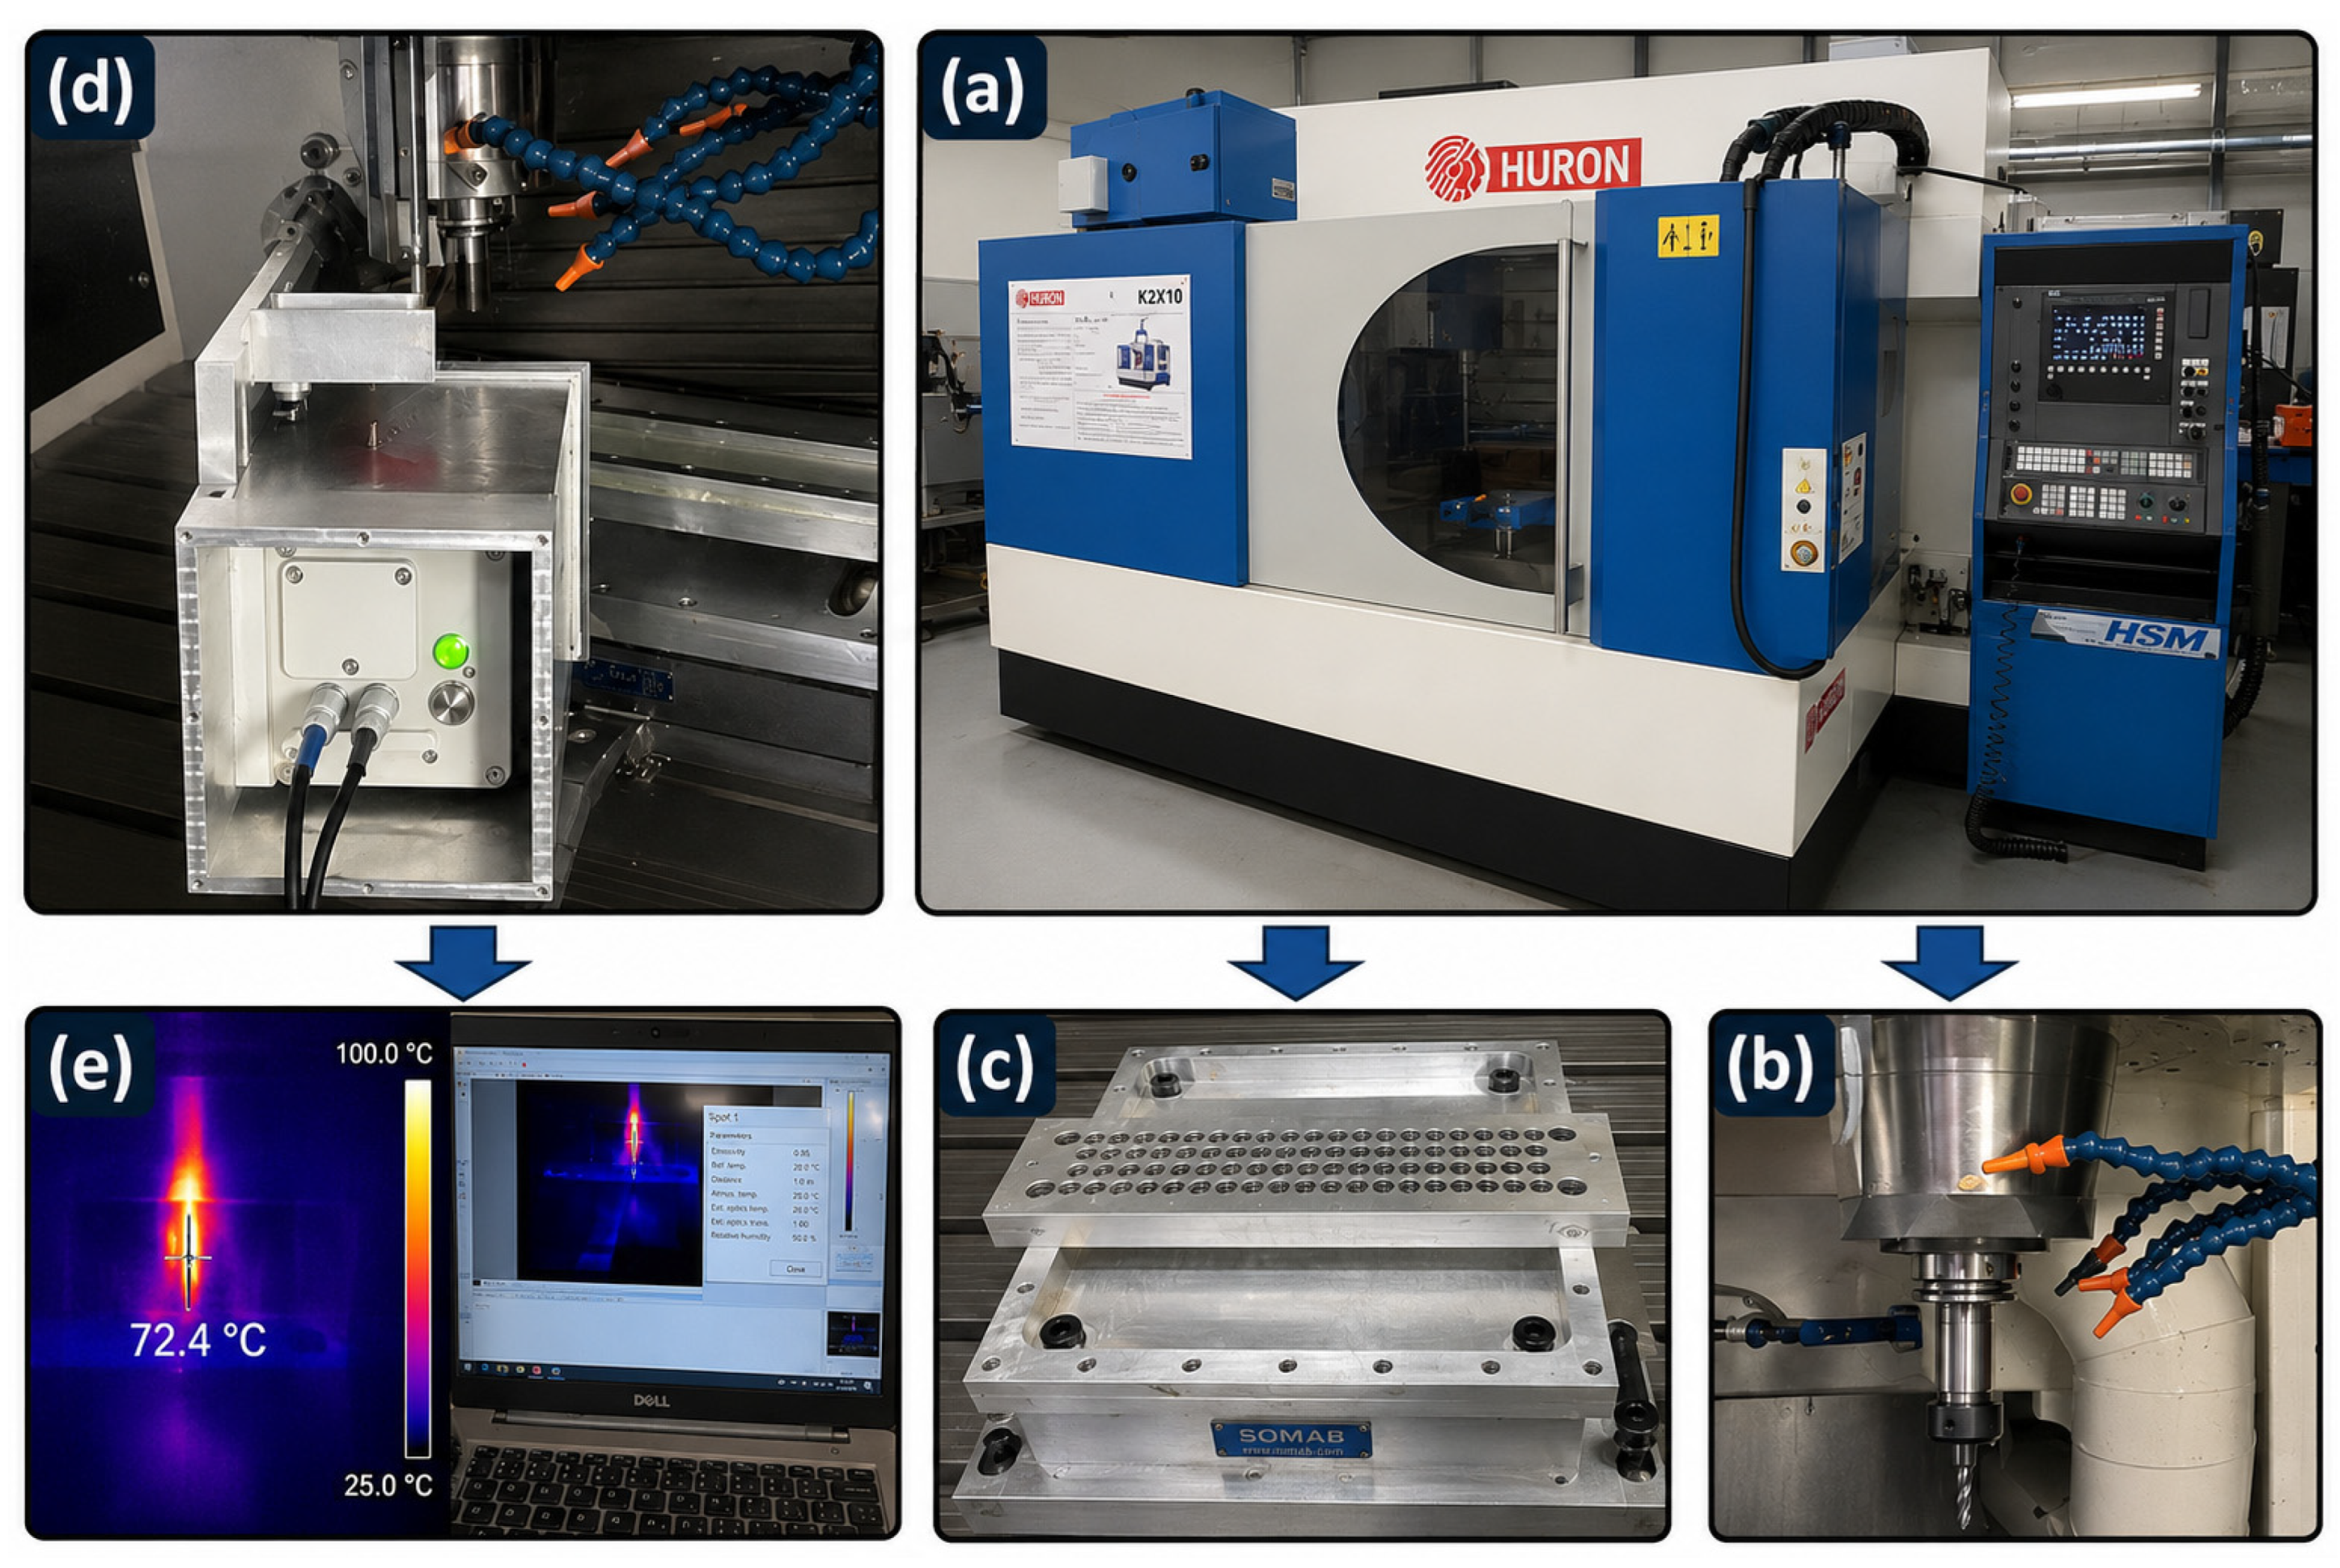
Drilling experiments were carried out on a Huron K2x10 three-axis CNC milling center (Huron, Eschau, France), as illustrated in Figure 3a. A CoreHog CVD diamond-coated drill bit (USA-made) was employed. The tool characteristics included a solid carbide substrate, a true crystalline CVD diamond coating, a diameter of 7/32 inch (5.56 mm), a 118° point angle, an 80° secondary point angle, two flutes, a flute length of 1.5 inches (38.1 mm), and an overall length of 4 inches (101.6 mm), as shown in Figure 3b. To ensure consistency and minimize the influence of tool wear, a new drill bit was used for each material formulation (i.e., for each of the nine composite plates), resulting in a total of nine drill bits used throughout the experimental campaign. Each drill bit was therefore used to produce 75 holes (5 cutting speeds × 5 feed rates × 3 replicates) in a single CFRP plate. The experimental sequence was randomized for each formulation to minimize the influence of progressive tool wear on the measured temperatures. Tool wear was not systematically quantified, as it was not the primary focus of this study; however, given the use of a new drill bit per plate and the randomization of the experimental sequence, the influence of tool wear on the observed thermal trends is expected to be negligible.
Figure 3.
Experimental setup for CFRP drilling and temperature measurement: (a) Huron K2x10 CNC milling machine, (b) CVD diamond-coated drill bit, (c) pre-drilled machining fixture, (d) VarioCAM® HD head 900 infrared thermal camera, (e) thermal image analysis using GRAYESS IRT Analyzer software.
A specially designed pre-drilled machining fixture was manufactured to secure and support the CFRP plates during drilling (Figure 3c). The pre-existing holes in the fixture allowed for proper drill evacuation. All drilling was performed under dry conditions, without any external coolant, to evaluate the inherent thermal response of the composites.
Cutting temperatures were recorded using a VarioCAM® HD head 900 infrared thermal camera positioned to observe the cutting zone (Figure 3d). According to the manufacturer, the camera incorporates proprietary calibration algorithms with multiple compensation curves to account for temperature variations, delivering high accuracy and repeatability across a broad temperature range, with a thermal resolution of 0.02 K. The captured thermal videos were processed using GRAYESS IRT Analyzer 7 software to extract the maximum temperature and compute average temperatures during each drilling event (Figure 3e). This information was subsequently utilized for thermal analysis. The peak temperature recorded for each drilling operation served as the representative thermal load. Camera placement and emissivity parameters were kept constant throughout all tests to ensure measurement consistency.
2.4. Response Surface Methodology with Dummy Variables
2.4.1. Global Modeling Strategy
Response surface methodology (RSM) is a collection of statistical and mathematical techniques useful for developing, improving, and optimizing processes [43,44]. In this study, a single global response surface model was developed to predict cutting temperature as a function of machining parameters (cutting speed and feed rate) and additive composition (wax and graphene concentrations). Rather than developing nine separate models for each formulation, a unified approach was adopted using dummy variables to encode the additive composition [45,46,47]. This strategy offers several advantages: (i) a single predictive equation covering all formulations, (ii) direct statistical comparison between formulations, and (iii) increased degrees of freedom for parameter estimation [45,48].
The reference formulation was defined as the baseline composite without additives (0% wax, 0% graphene). For the remaining eight formulations, binary dummy variables were introduced to capture their deviation from the reference [49,50].
2.4.2. Model Structure
The input variables were normalized to coded values within the interval [−1, 1] using the following transformation [43]:
where Xi represents the actual value of the input variable (cutting speed or feed rate), while Xi,min and Xi,max denote its minimum and maximum values, respectively.
A full third-order polynomial model, including all interaction terms, was initially formulated to capture potential nonlinearities in the relationship between machining parameters and cutting temperature [43,51]. Stepwise and backward elimination were then applied to reduce the model, retaining only statistically significant parameters. Through this process, the third-order interaction terms (s2f and sf2) were found to be not statistically significant (p > 0.05) and were therefore omitted. Furthermore, the Wax × Graphene interaction was also found to be not statistically significant (p > 0.05) and was excluded from the final model. This indicates that the effects of wax and graphene are additive in our system. The final model, presented in Equation (2), includes only the significant terms: main effects, quadratic terms, cubic terms, speed × feed interaction, and dummy variables representing each formulation. The model structure is expressed as follows:
where
- T is the predicted cutting temperature (°C);
- s and f are the normalized cutting speed and feed rate, respectively;
- β0 is the intercept term for the reference formulation;
- β1, β2 are linear coefficients;
- β3, β4 are quadratic coefficients;
- β5 is the interaction coefficient between speed and feed;
- β6, β7 are cubic coefficients;
- Dk are binary dummy variables (k = 1,…,8), each equal to 1 when the corresponding additive formulation is present and 0 otherwise;
- αk represents the main effect of the k-th formulation relative to the reference;
- γk and δk represent the interaction effects between the k-th formulation and cutting speed or feed rate, respectively.
The polynomial structure in Equation (2) was chosen to reflect the nonlinear temperature responses observed in the experimental data for both cutting speed and feed rate. The cubic terms (β6s3 + β7f3) were retained through the stepwise and backward elimination process, allowing for curvature beyond quadratic behavior, which was evident for several formulations. This structure provides sufficient flexibility to capture the underlying physical phenomena—such as thermal softening and nonlinear friction behavior—while remaining parsimonious to avoid overfitting [46,51].
This formulation allows the reference formulation to serve as the baseline model, while each dummy variable and its associated interaction terms quantify how a given additive formulation deviates from this baseline in terms of intercept, speed sensitivity, and feed sensitivity [49].
2.4.3. Parameter Estimation
The model coefficients were estimated using ordinary least squares regression [52]. The RSM model was fitted to the 225 condition means (averages of the three replicates). This approach is standard in response surface methodology, where the goal is to model the expected response at each design point rather than individual replicate variability.
Ridge regularization (λ = 0.001) was applied to ensure numerical stability and mitigate potential multicollinearity among the dummy variables and their interactions [53,54]. The value λ = 0.001 was selected through a systematic grid search to minimize the cross-validated prediction error while maintaining the numerical stability of the matrix inversion. This small regularization penalty does not substantially bias the coefficient estimates but effectively stabilizes the solution when near-multicollinearity is present.
The quality of the fitted model was evaluated using the coefficient of determination (R2), the adjusted coefficient of determination (R2adj), and the root mean square error (RMSE) [46,49].
3. Results
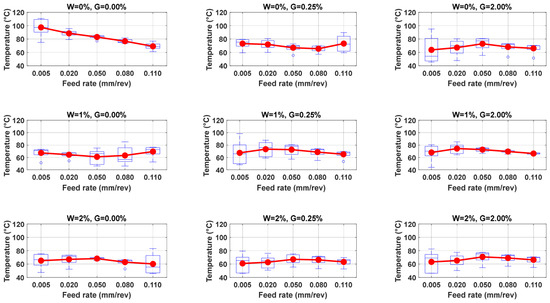
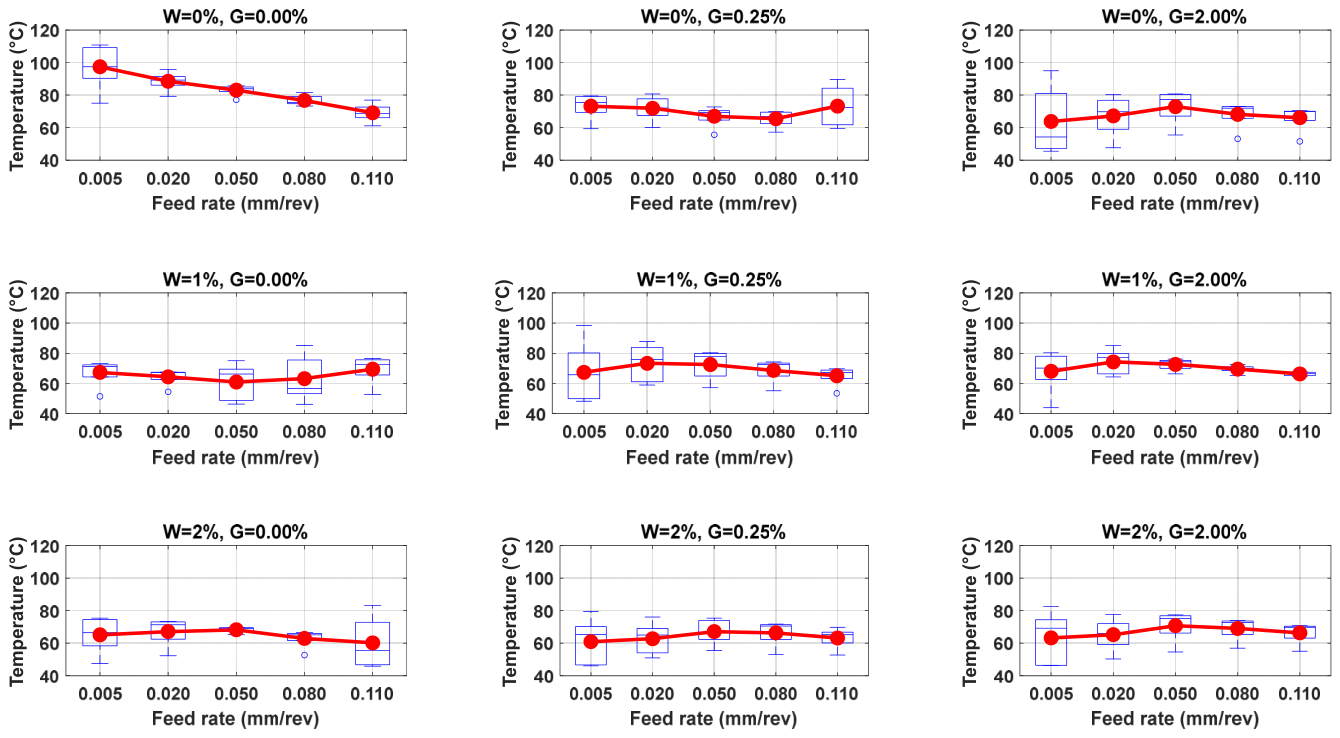
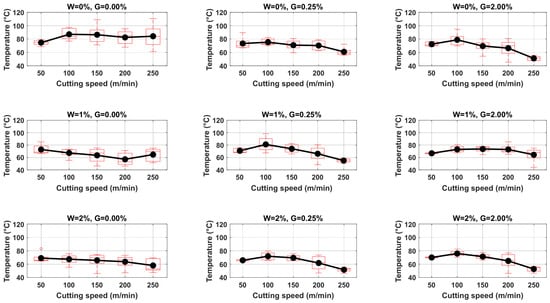
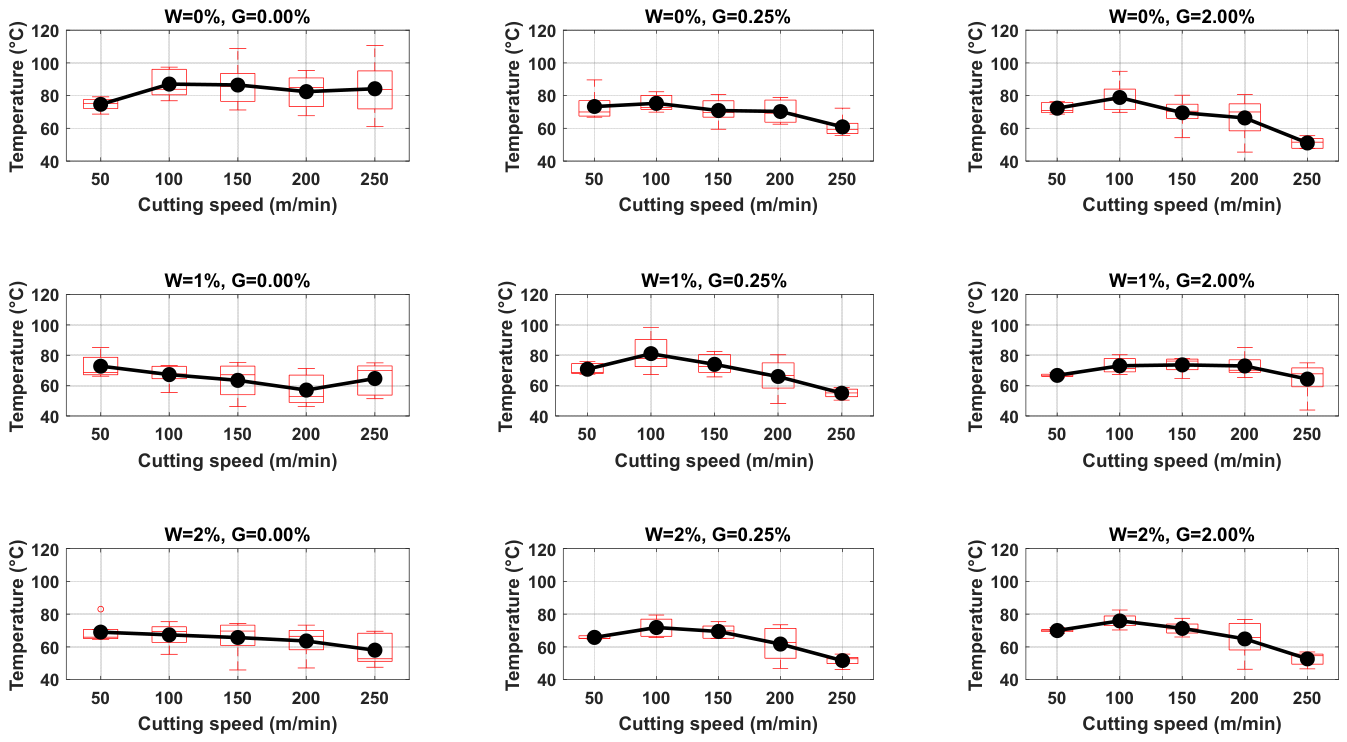
A total of 675 drilling experiments were conducted, corresponding to nine distinct material formulations combining three wax levels (0%, 1%, 2%) and three graphene levels (0%, 0.25%, 2.00%), each tested at five feed rates (0.005 to 0.110 mm/rev) and five cutting speeds (50 to 250 m/min) with three replicates per condition. For each of the 225 unique experimental conditions, the mean temperature, median, first quartile (Q1), third quartile (Q3), and standard deviation (std) were calculated and are presented in Figure 4, Figure 5 and Figure 6.
Figure 4.
Effect of feed rate on cutting temperature. Data shown are averaged over all five cutting speeds (50, 100, 150, 200, and 250 m/min). The boxplots show the distribution of temperature across formulations and the error bars represent the standard deviation across cutting speeds and replicates.
Figure 5.
Effect of cutting speed on cutting temperature. Data shown are averaged over all five feed rates (0.005, 0.02, 0.05, 0.08, and 0.11 mm/rev). The boxplots show the distribution of temperature across formulations, and the error bars represent the standard deviation across cutting speeds and replicates.
Figure 6.
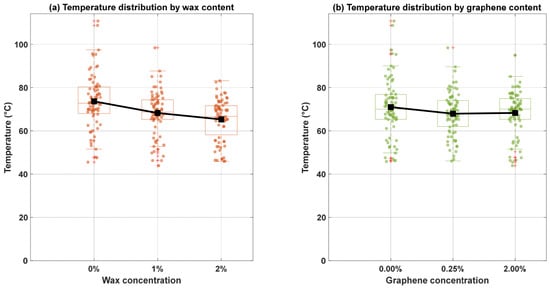
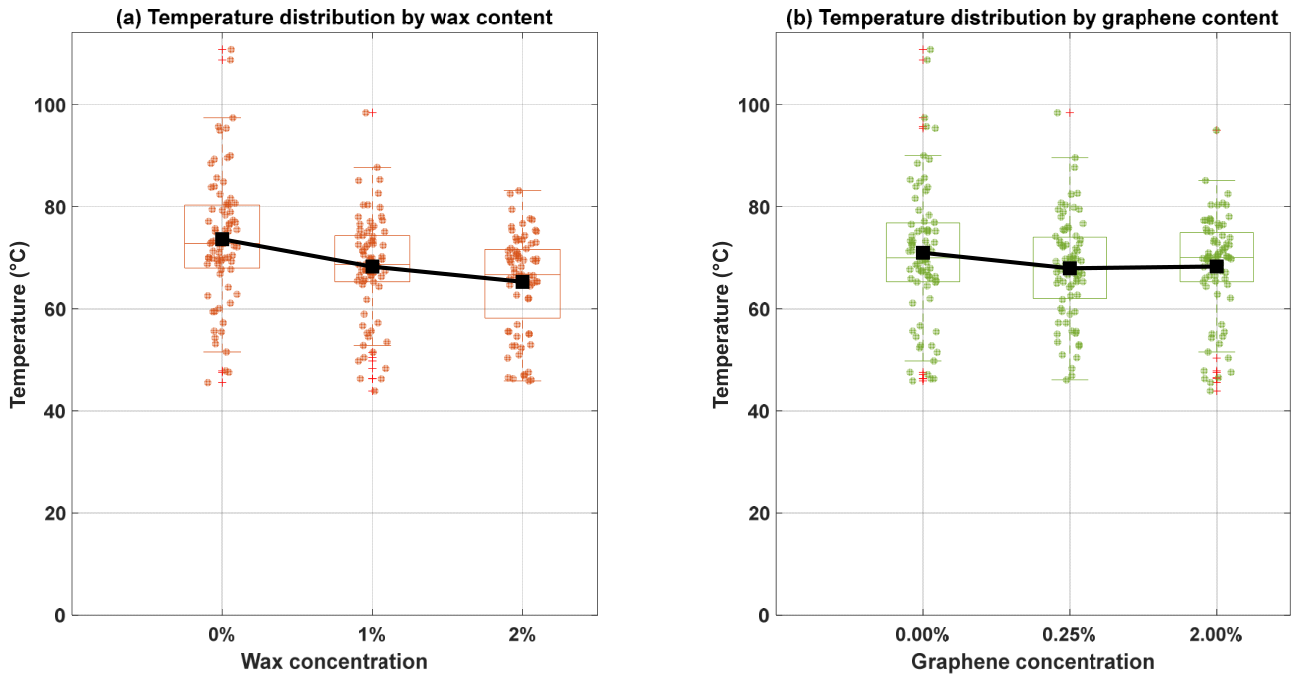
Effect of additive concentrations on cutting temperature: (a) wax content; (b) graphene content.
3.1. Effect of Feed Rate on Drilling Temperature
Figure 4 shows that for the baseline formulation (0% wax, 0% graphene), increasing the feed rate from 0.005 to 0.11 mm/rev reduced the mean temperature from 97.45 °C to 69.14 °C, a decrease of approximately 29%. This inverse relationship was consistently observed across all nine formulations. More importantly, the standard deviation decreased dramatically from 14.20 °C at the lowest feed rate to 3.41 °C at 0.050 mm/rev, and further to 3.26 °C and 5.74 °C at higher feed rates. This indicates that higher feed rates not only reduce temperature but also stabilize the drilling process, producing more consistent and repeatable thermal results. The quartile ranges support this observation: at 0.005 mm/rev, the interquartile range (Q3–Q1) was approximately 19 °C (from 90.28 °C to 109.21 °C), while at 0.050 mm/rev, the interquartile range narrowed to only 3 °C (from 82.12 °C to 85.03 °C).
The most stable thermal response across feed rates was observed for the 1% wax, 2% graphene formulation, where the standard deviation at 0.110 mm/rev was only 1.28 °C, with a very narrow interquartile range of approximately 2 °C (from 65.23 °C to 67.48 °C). This formulation exhibited high thermal consistency regardless of feed rate variations. In contrast, the 0% wax, 0.25% graphene formulation showed high thermal instability at the highest feed rate, with a standard deviation of 12.80 °C and an interquartile range spanning from 61.77 °C to 84.19 °C, indicating that the addition of 0.25% graphene without wax actually increased process variability at high feed rates.
The lowest mean temperature recorded at the highest feed rate was 60.21 °C for the 2% wax, 0% graphene formulation, with a standard deviation of 15.89 °C and an interquartile range from 46.79 °C to 72.90 °C, revealing that while this formulation achieved low temperatures, it suffered from considerable instability.
3.2. Effect of Cutting Speed on Drilling Temperature
Figure 5 summarizes the temperature response across five cutting speeds. For the baseline formulation (0% wax, 0% graphene), the minimum mean temperature of 74.69 °C occurred at 50 m/min with a relatively low standard deviation of 4.02 °C and a narrow interquartile range from 72.11 °C to 77.64 °C, indicating stable drilling at low speeds. However, at 250 m/min, while the mean temperature was 84.21 °C, the standard deviation increased dramatically to 18.35 °C with an interquartile range from 71.88 °C to 95.16 °C, revealing that high cutting speeds without additives produce highly erratic thermal behavior.
For formulations containing both wax and graphene, a clear decreasing trend in temperature emerged at higher speeds, accompanied by improved stability. The 0% wax, 2% graphene formulation showed a dramatic decrease from 72.35 °C at 50 m/min to 51.11 °C at 250 m/min, representing a 29.4% reduction. Importantly, the standard deviation at 250 m/min was only 3.41 °C with an interquartile range from 47.77 °C to 53.72 °C, demonstrating that the combination of high speed and 2% graphene produced both low temperatures and high stability. Similarly, the 2% wax, 2% graphene formulation decreased from 70.00 °C to 52.67 °C with a standard deviation of 4.21 °C at 250 m/min and an interquartile range from 49.38 °C to 55.52 °C.
The 2% wax, 0.25% graphene formulation achieved the second lowest temperature at 250 m/min (51.65 °C) with a low standard deviation of only 3.53 °C and a very tight interquartile range from 49.74 °C to 53.59 °C, indicating that the combination of 2% wax and 0.25% graphene provides the best balance of low temperature and high stability at maximum cutting speed.
3.3. Effect of Additive Concentrations
Figure 6 demonstrates that increasing wax concentration from 0% to 2% reduced the overall mean temperature from 73.61 °C to 65.26 °C, a decrease of 11.3%. More significantly, the standard deviation decreased substantially from 12.90 °C to 9.51 °C, indicating that higher wax content produces more consistent drilling conditions across all experiments. The interquartile range also narrowed considerably: at 0% wax, Q1 was 67.96 °C and Q3 was 80.30 °C (range of 12.34 °C), while at 2% wax, Q1 was 58.17 °C and Q3 was 71.63 °C (range of 13.46 °C), showing a slight widening of the middle 50% of data despite the reduced overall standard deviation.
Figure 6 reveals that the addition of 0.25% graphene reduced the mean temperature from 70.94 °C (0% graphene) to 67.90 °C (4.3% reduction), with the standard deviation improving from 13.64 °C to 10.17 °C. The interquartile range also narrowed from 76.81 − 65.29 °C = 11.52 °C at 0% graphene to 74.01 − 61.98 °C = 12.03 °C at 0.25% graphene, indicating slightly improved consistency. However, further increasing graphene to 2.00% resulted in a slight mean temperature increase to 68.27 °C, while the standard deviation remained nearly identical at 10.16 °C, suggesting that beyond the optimal concentration of 0.25%, additional graphene provides no further benefit in either temperature reduction or process stability.
3.4. Global Model Performance
A global RSM model with dummy variables was developed to predict cutting temperature as a function of cutting parameters (speed and feed) and additive concentrations (wax and graphene).
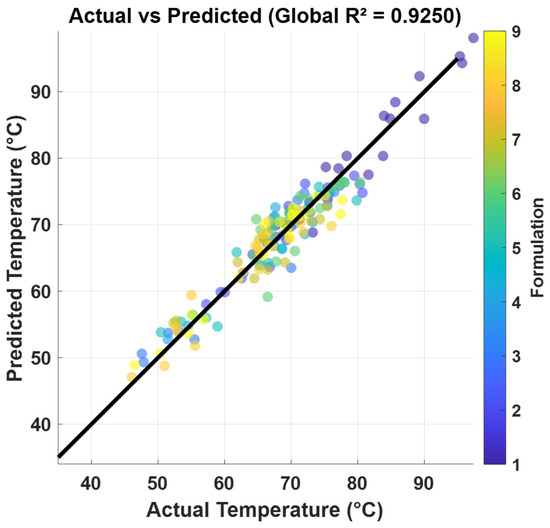
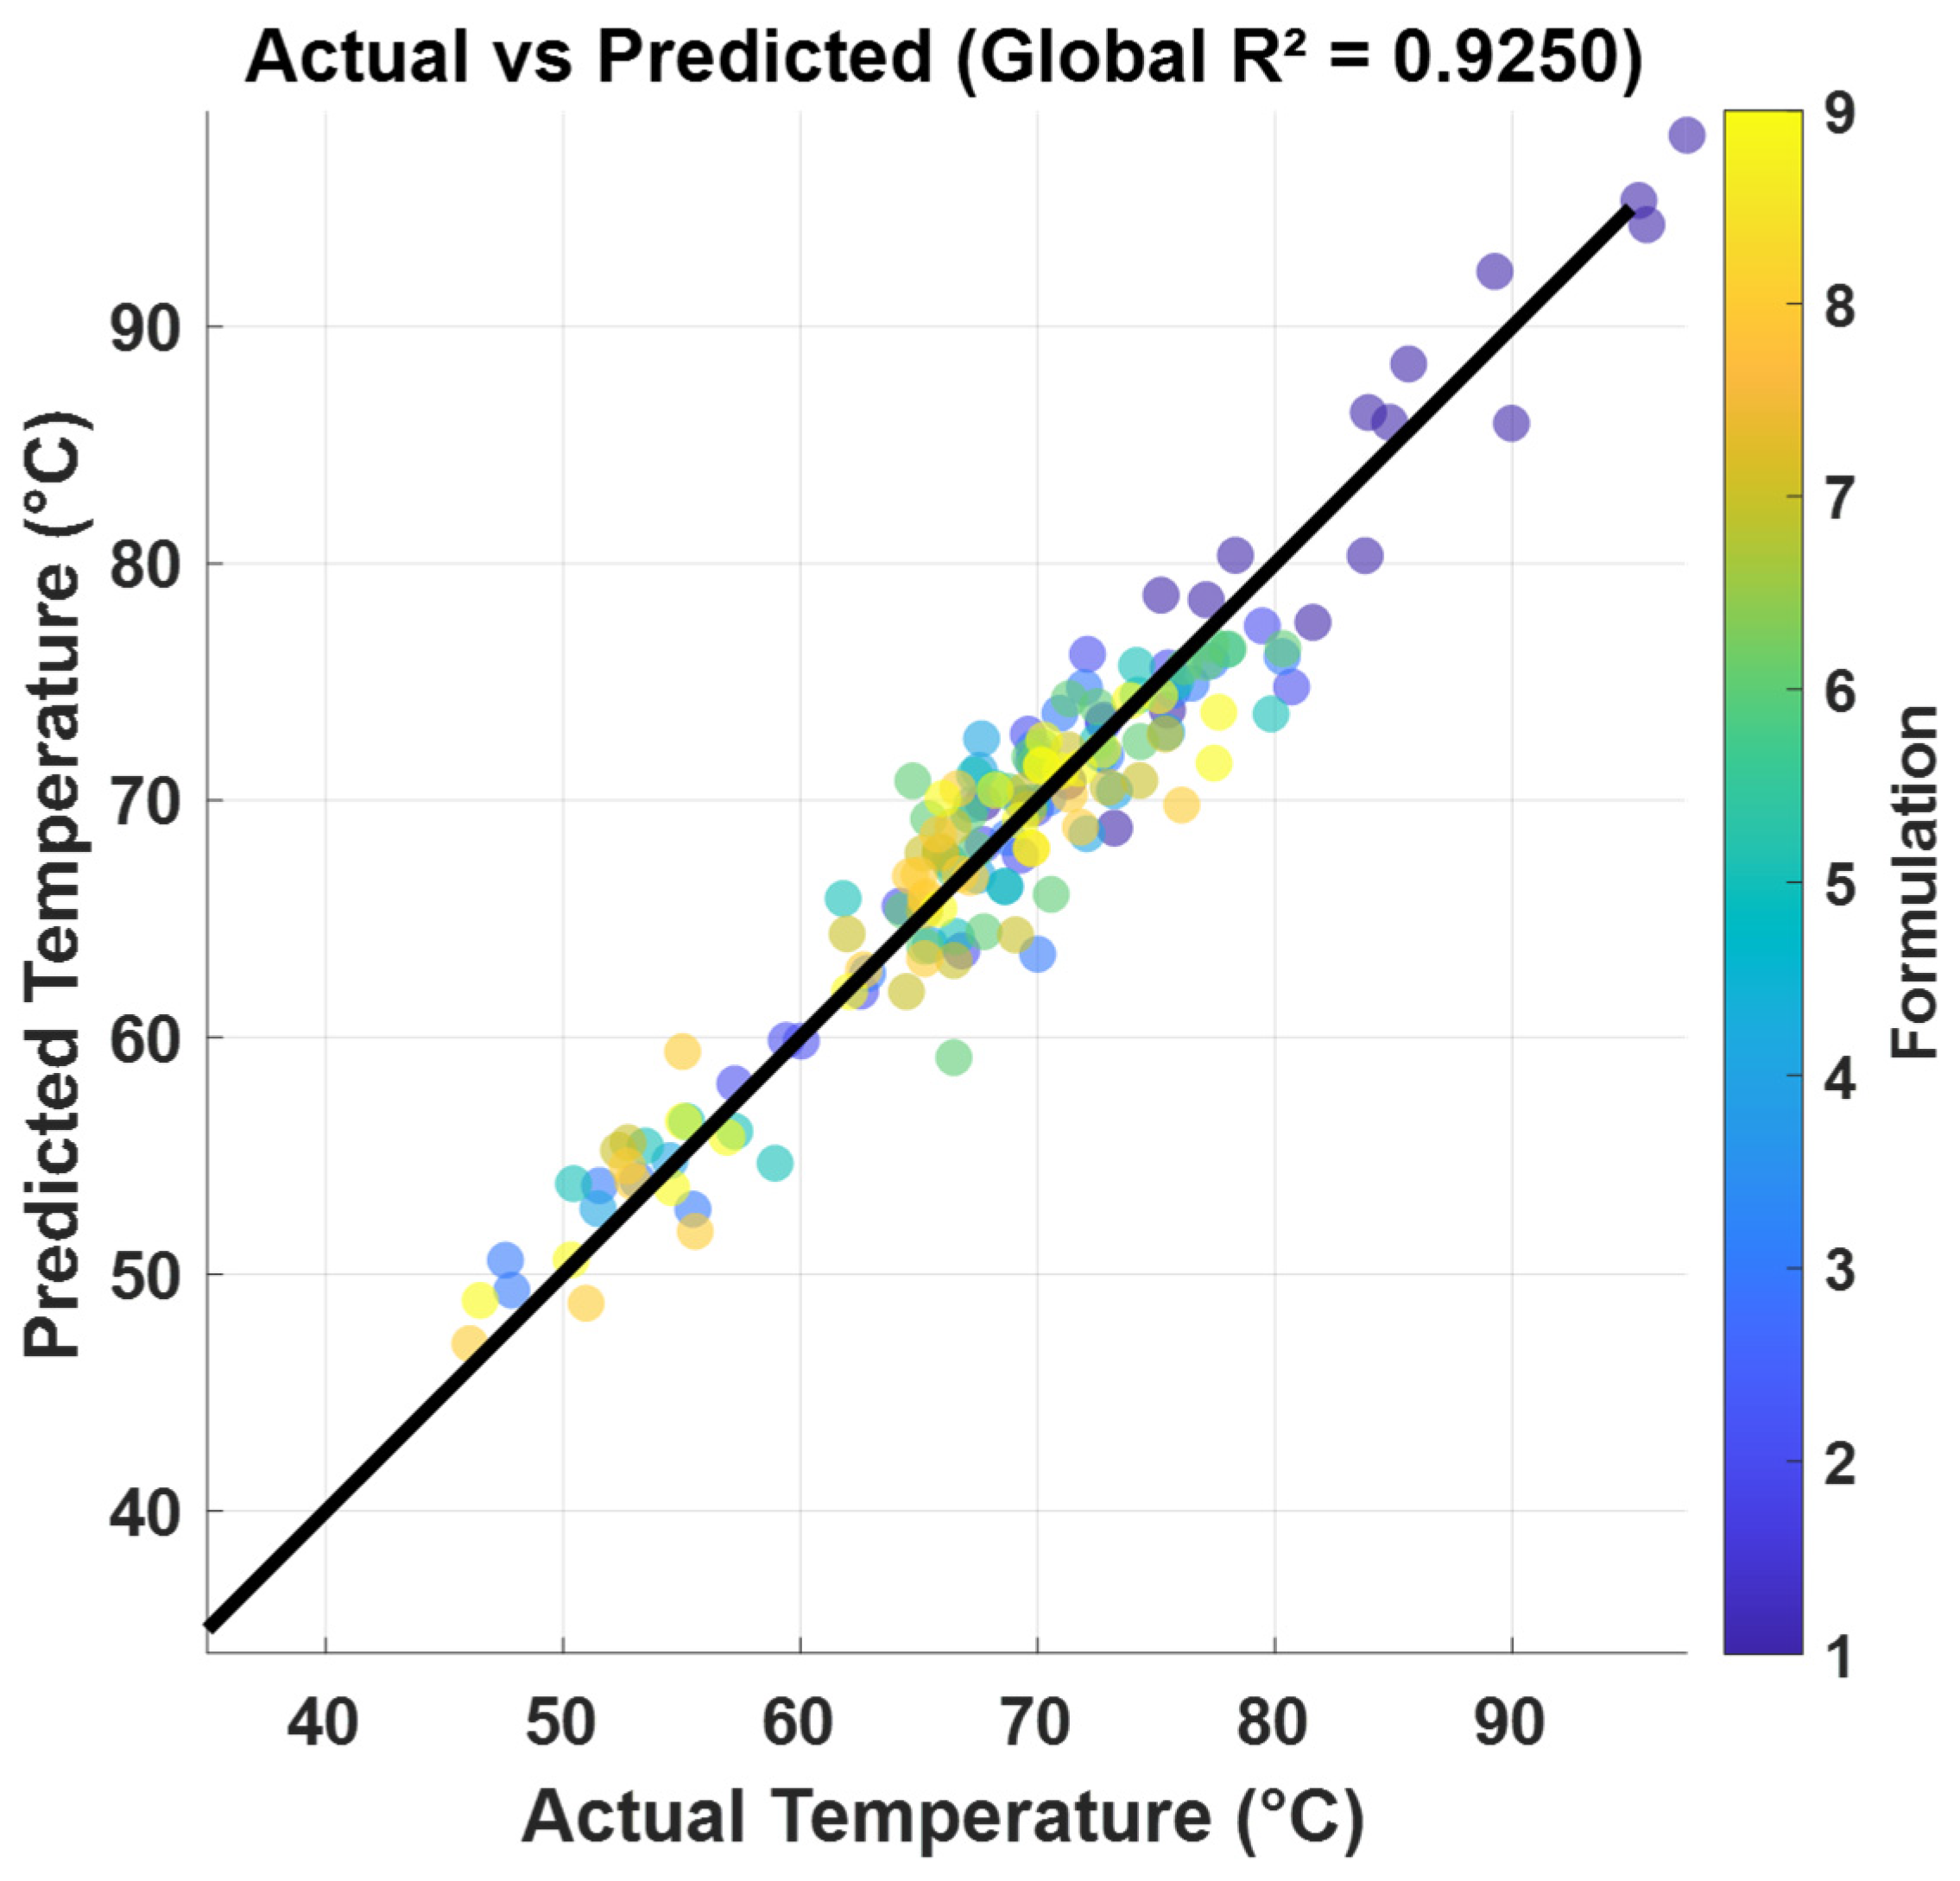
Figure 7 illustrates the correlation between experimentally measured and model-predicted cutting temperatures. The model demonstrated high goodness of fit with a coefficient of determination R2 = 0.9250 and an adjusted R2 = 0.9067, indicating that 92.5% of the temperature variance is explained by the model while accounting for its complexity with 32 parameters. The root mean square error (RMSE) was 2.83 °C and the correlation between predicted and measured temperatures reached 0.9618.
Figure 7.
Actual vs. predicted cutting temperatures with diagonal line representing perfect prediction.
The global model coefficients are presented in Table 1 with respect to the reference formulation (0% wax, 0% graphene). The negative coefficients for speed (−0.4721) and feed (−13.6098), in combination with the quadratic and cubic terms, indicate that increasing both parameters generally reduces temperature across the tested range. However, these linear coefficients should not be interpreted independently of the higher-order terms included in the model. All dummy variables for non-reference formulations showed large negative main effects ranging from −11.18 to −17.94, confirming that any addition of wax or graphene significantly reduces cutting temperature compared to the reference. The largest formulation effects were observed for W = 2%, G = 0.25% (−17.94) and W = 2%, G = 0.00% (−17.25).
Table 1.
Estimated model coefficients for temperature prediction. Reference formulation: Wax = 0%, Graphene = 0%.
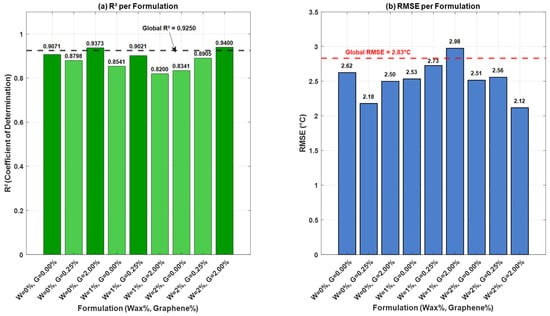
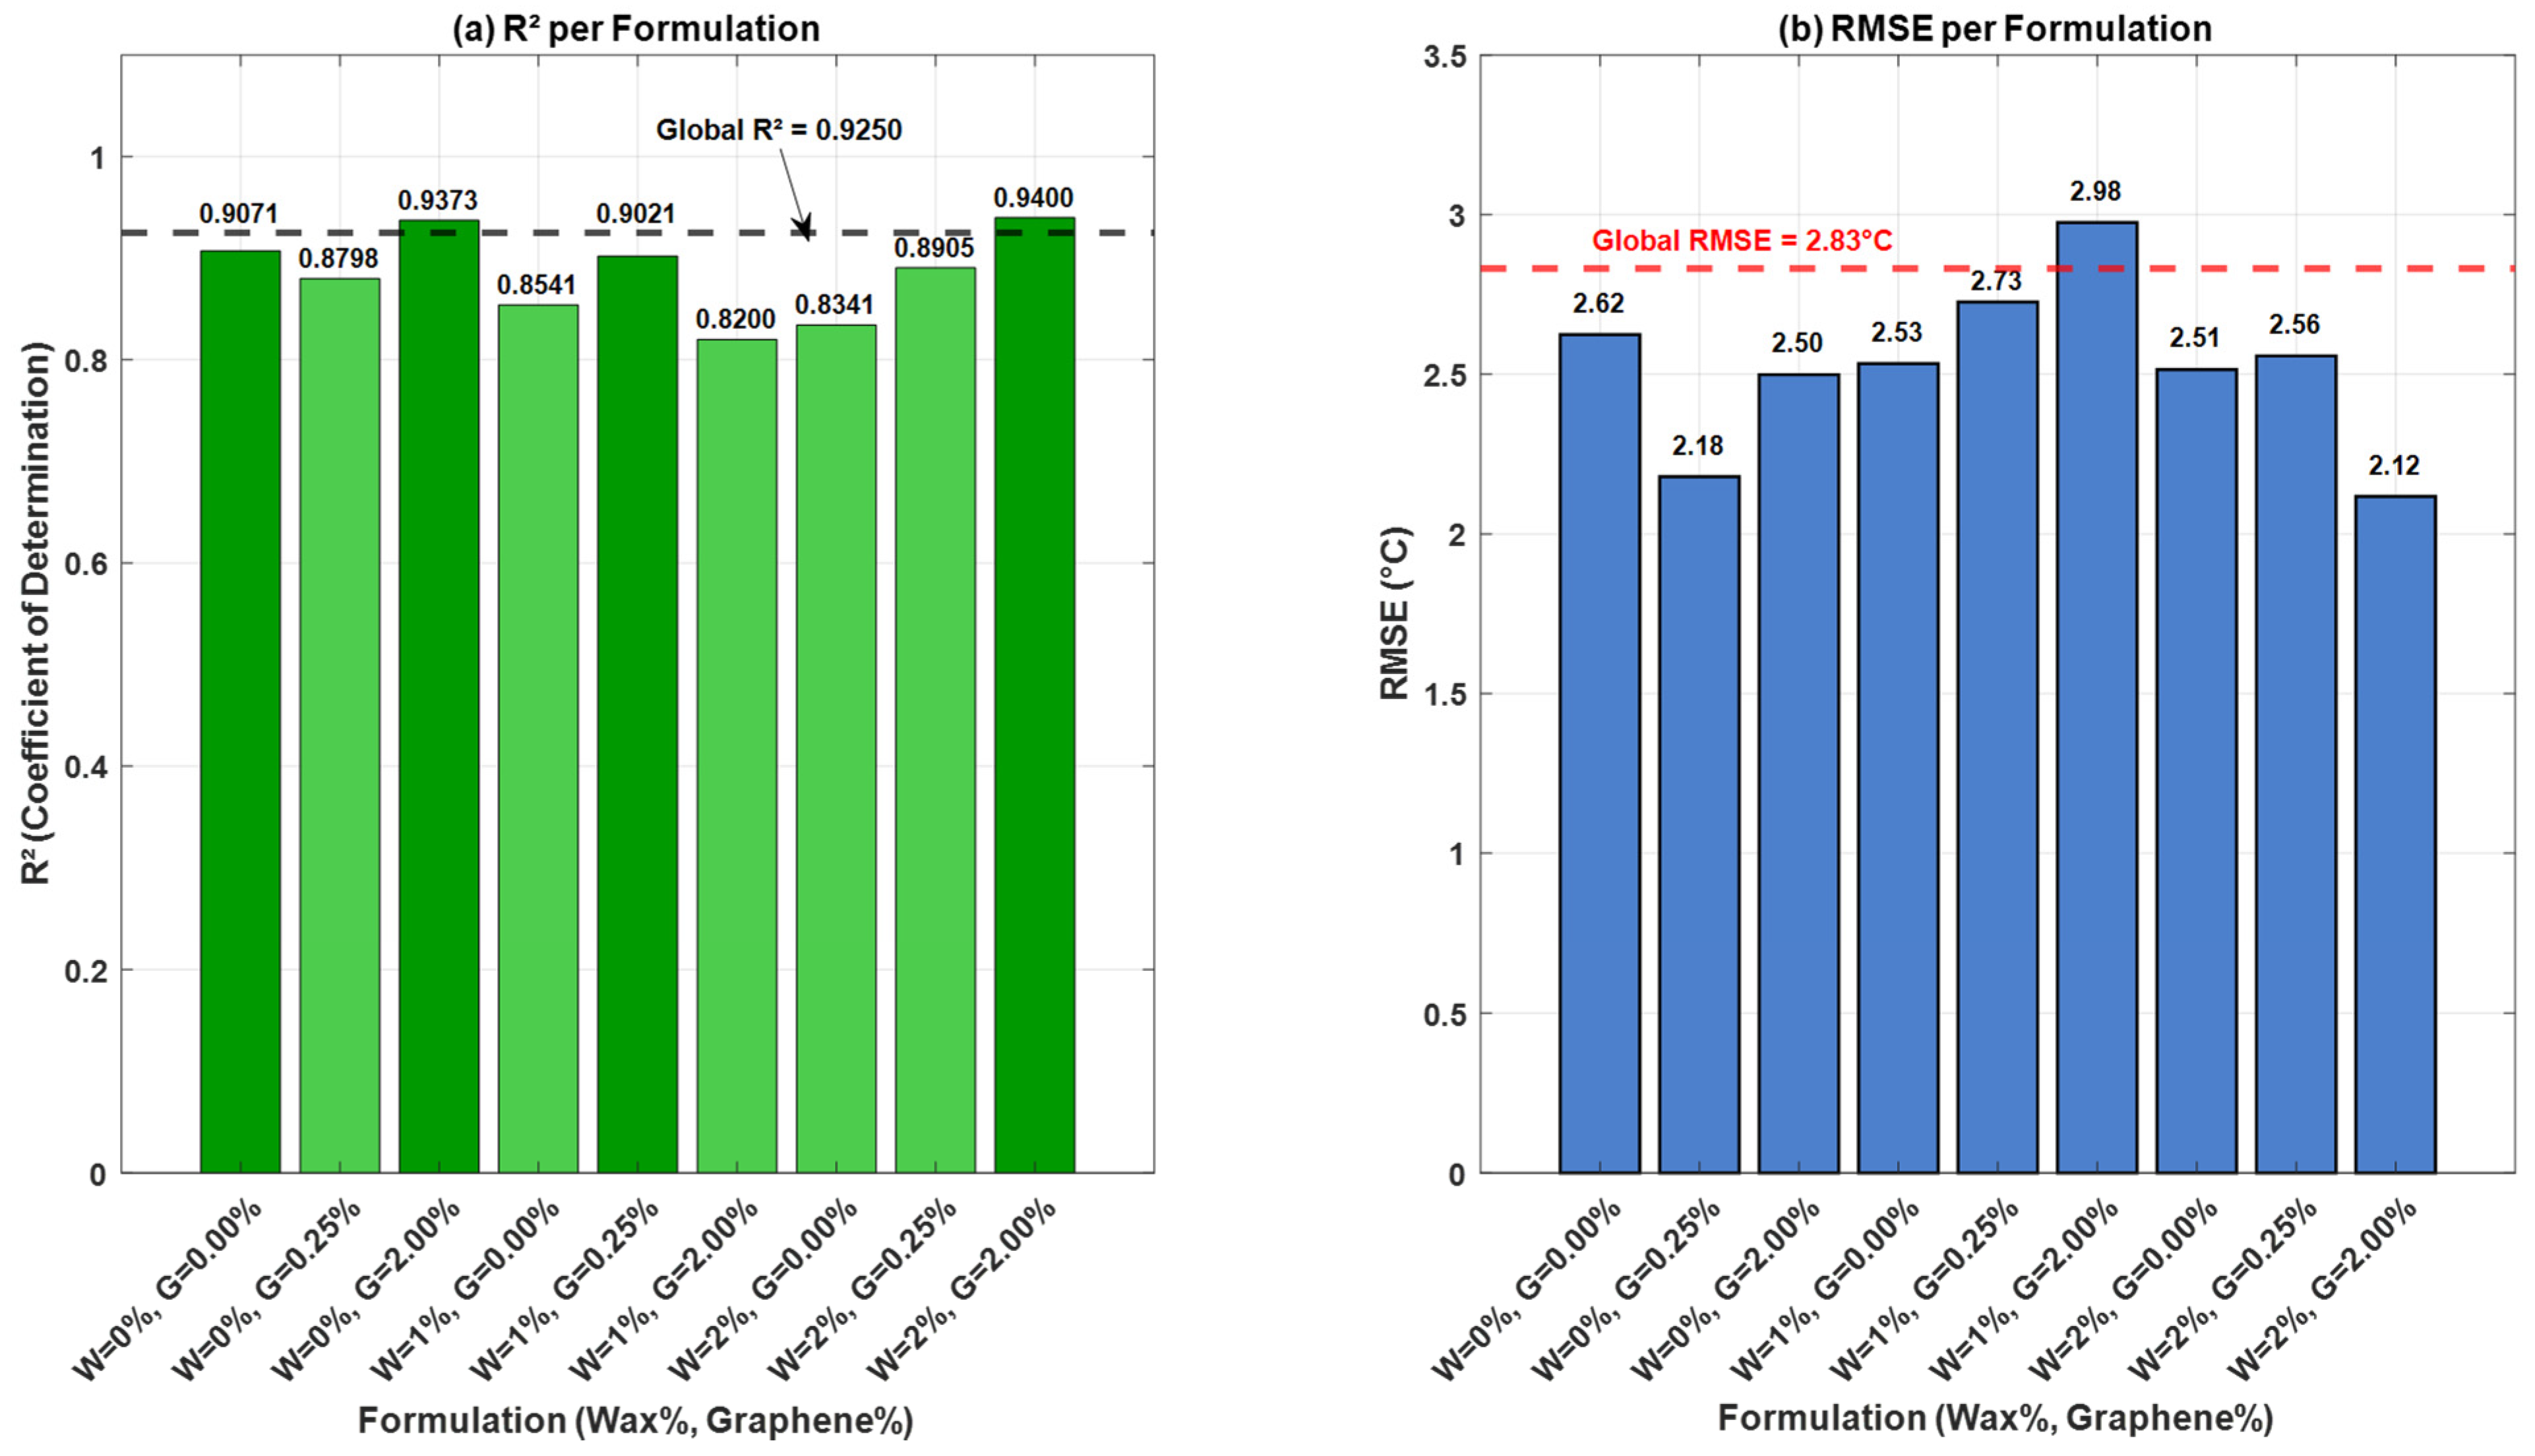
The predictive accuracy varied considerably across formulations, as illustrated in Figure 8a,b. The highest R2 values were achieved for W = 2%, G = 2.00% (R2 = 0.9400, RMSE = 2.12 °C) and W = 0%, G = 2.00% (R2 = 0.9373, RMSE = 2.50 °C). The reference formulation W = 0%, G = 0.00% showed good accuracy (R2 = 0.9071, RMSE = 2.62 °C). The poorest performance was observed for W = 1%, G = 2.00% (R2 = 0.82, RMSE = 2.98 °C), suggesting that this specific combination exhibits more complex thermal behavior that is less adequately captured by the global model.
Figure 8.
Model accuracy per formulation: (a) R2 values with color-coded bars; (b) RMSE values. The horizontal dashed lines in (a,b) represent the global model performance (R2 = 0.9250, RMSE = 2.83 °C).
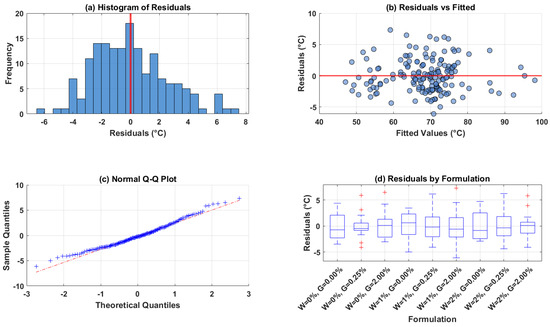
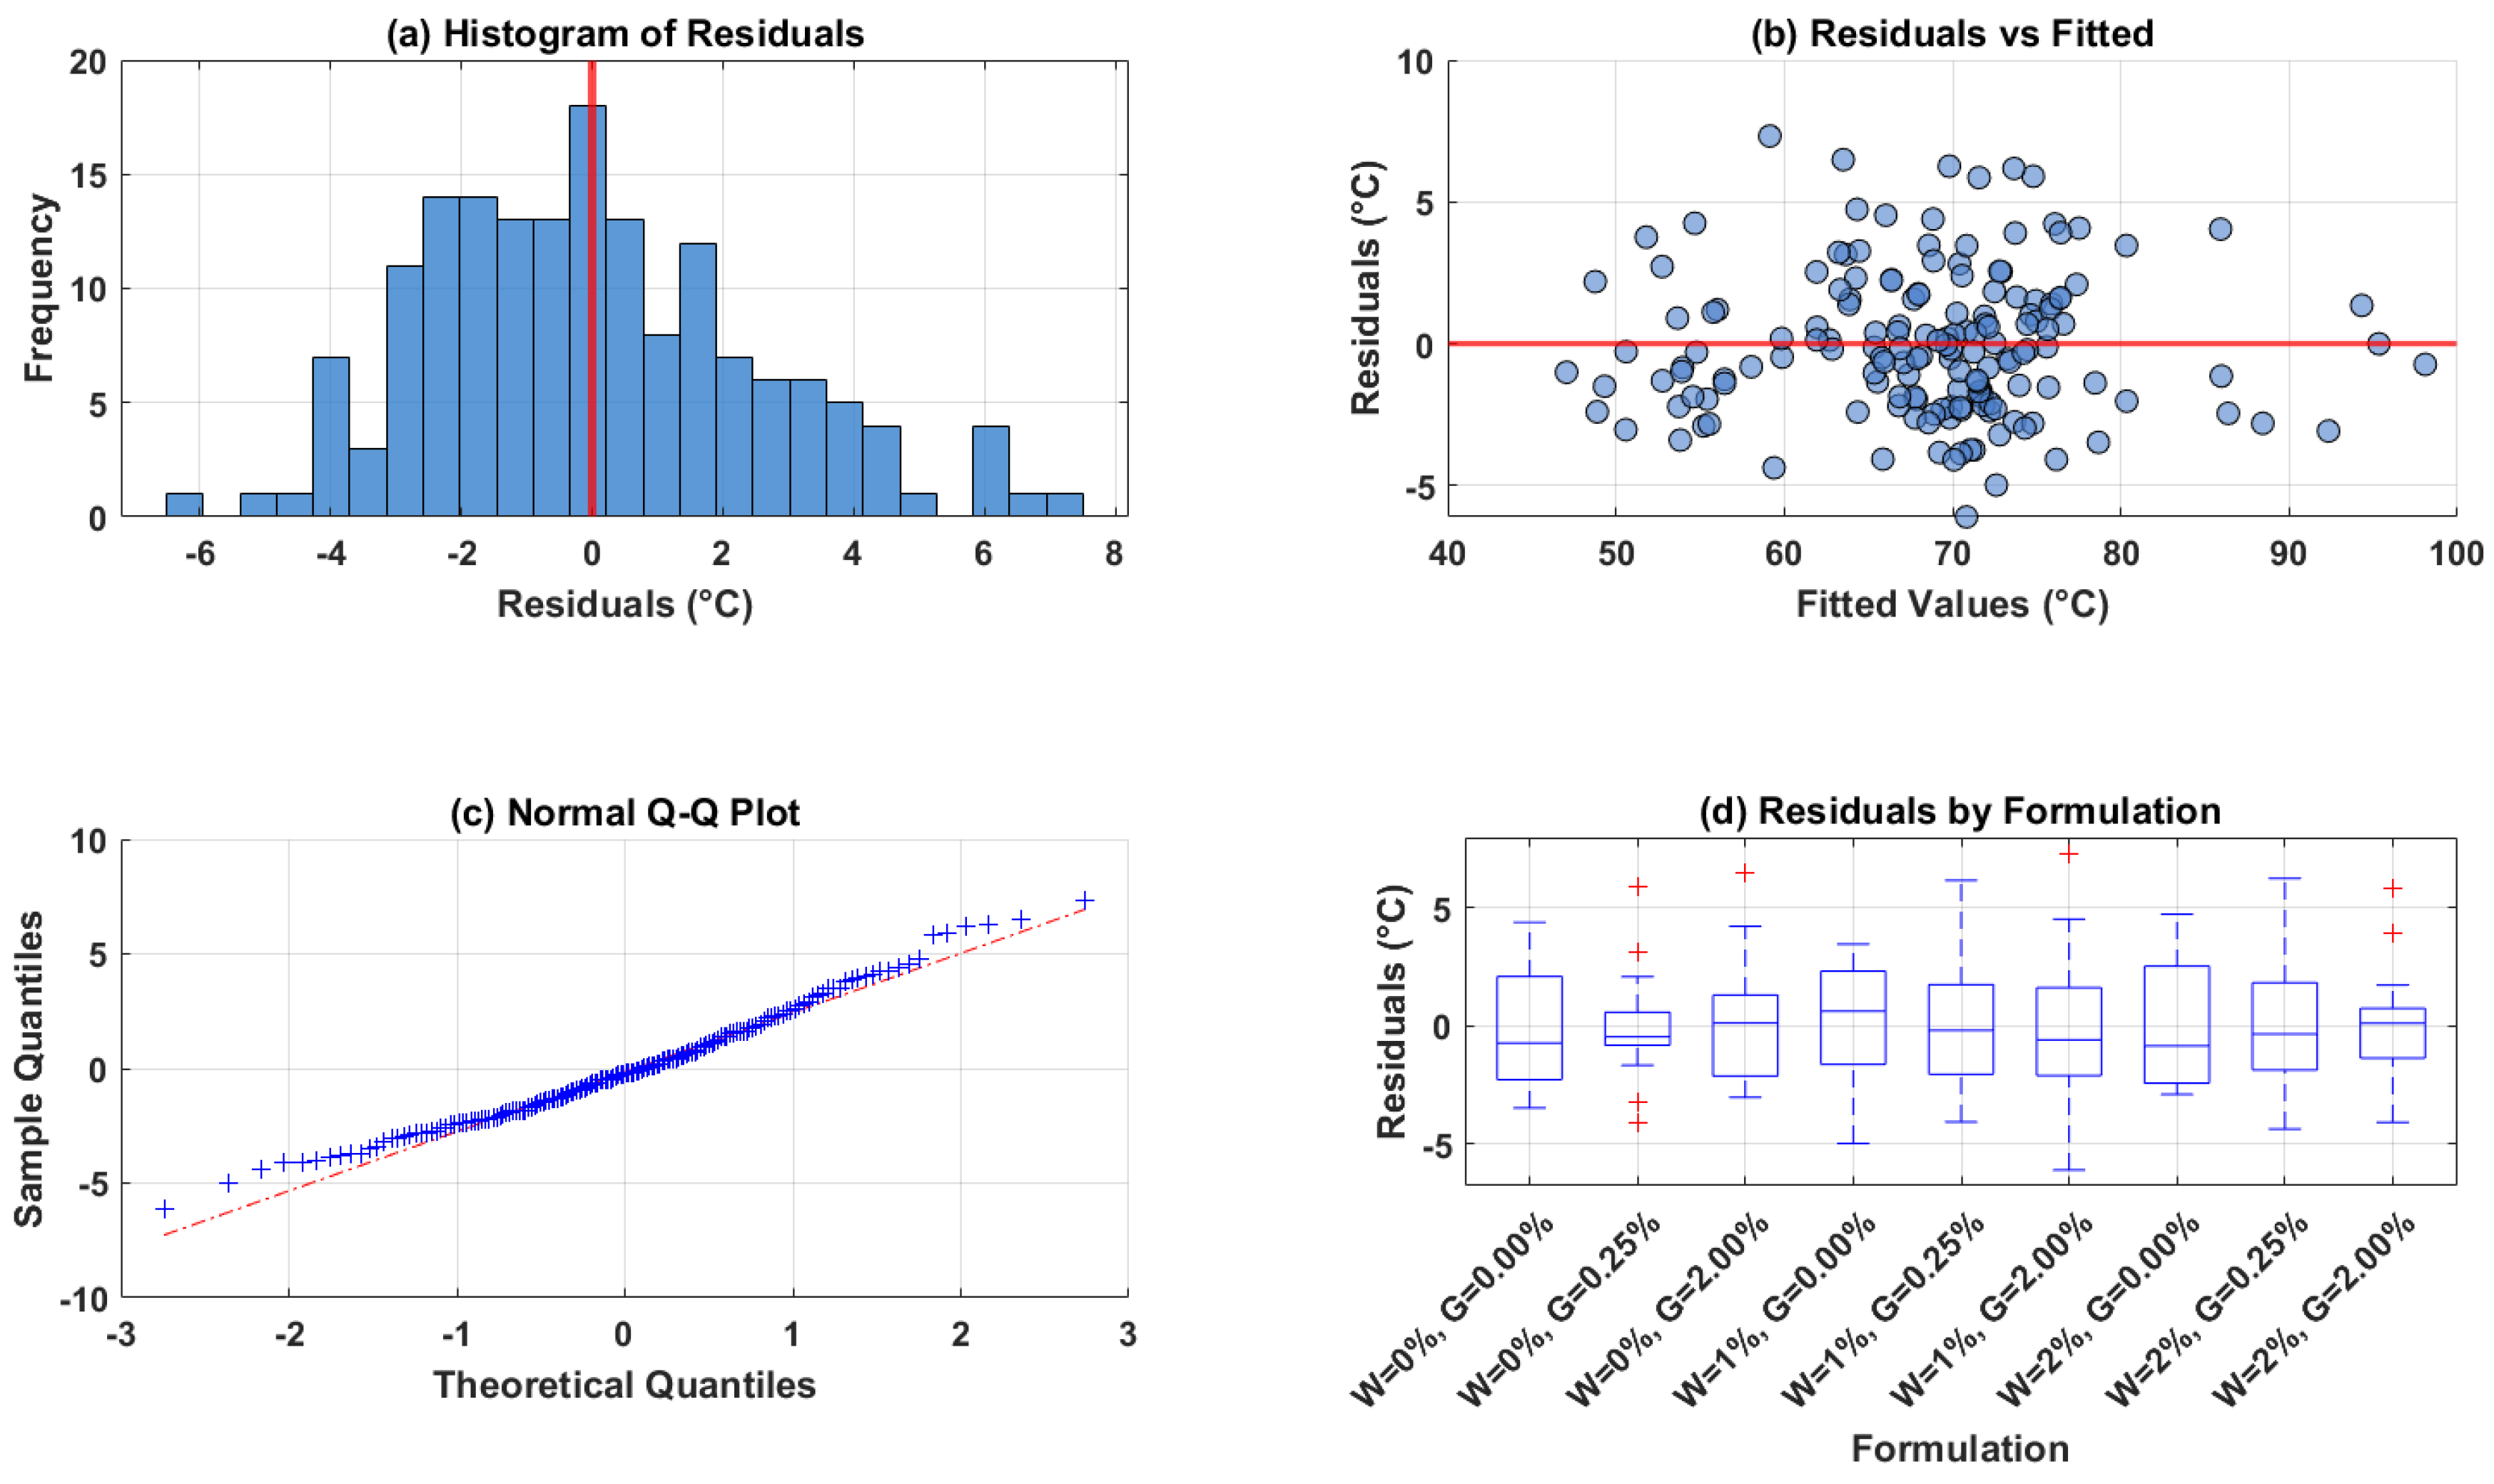
Residual analysis, presented in Figure 9a–d, confirmed the model’s adequacy. The histogram of residuals (Figure 9a) shows a distribution centered near zero, with a mean residual of approximately 0.0005 °C, indicating no systematic bias. The residuals vs. fitted plot (Figure 9b) reveals no apparent patterns or trends, suggesting that the model captures the underlying relationships appropriately and that the error variance is approximately constant across the range of predicted temperatures. The normal Q-Q plot (Figure 9c) shows residuals closely following the diagonal line, with a skewness of 0.4784 and kurtosis of 2.9588, approaching normality. The residuals by formulation (Figure 9d) show no systematic bias for any specific formulation, indicating that the model performs consistently across all nine material formulations. The residual range was [−6.09 °C, 7.32 °C], demonstrating that prediction errors remained within acceptable bounds for engineering applications.
Figure 9.
Residual diagnostics for the global RSM model.
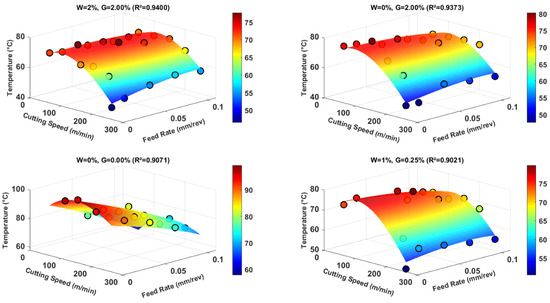
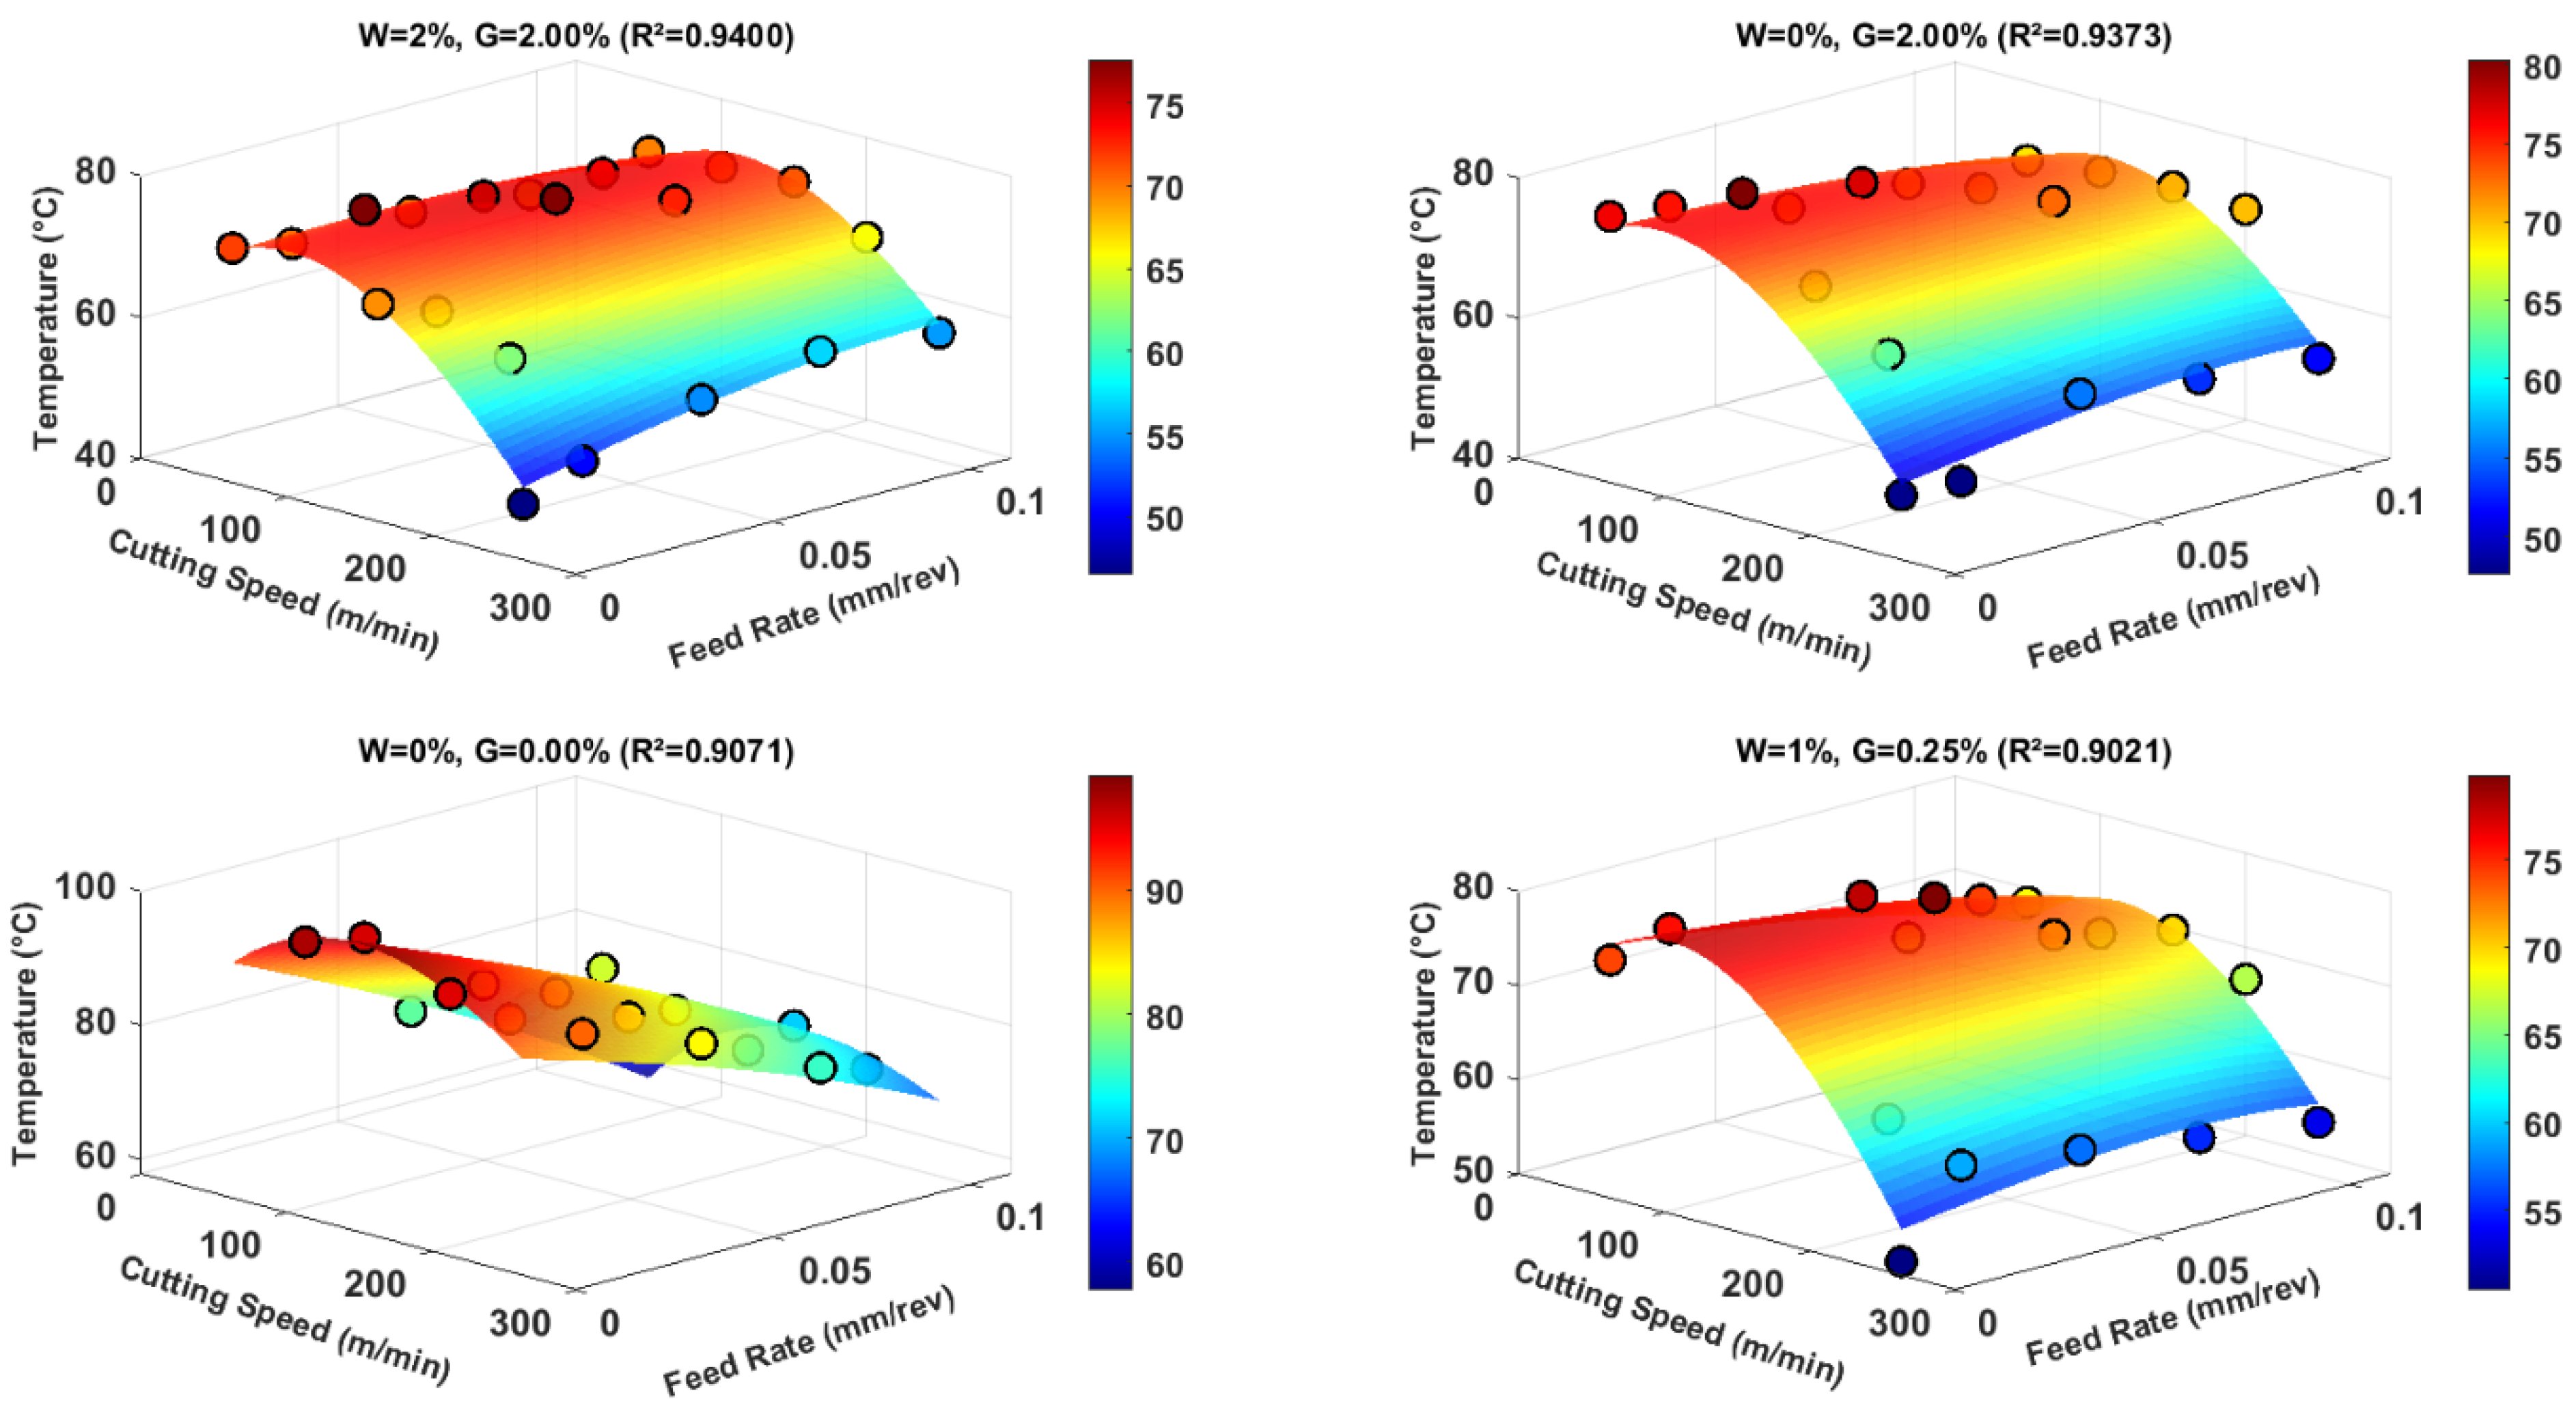
Figure 10 presents the 3D response surface plots for the four best-performing formulations based on R2 values (W = 2%, G = 2.00%; W = 0%, G = 2.00%; W = 0%, G = 0.00%; W = 1%, G = 0.25%). The surfaces illustrate the combined effect of cutting speed and feed rate on temperature. The W = 2%, G = 2.00% formulation exhibits the flattest surface, indicating minimal temperature variation across the range of cutting parameters, which is consistent with its highest R2 value (0.9400). The reference formulation (W = 0%, G = 0.00%) shows the steepest surface gradient, reflecting greater temperature sensitivity to parameter changes.
Figure 10.
RSM surface plots for the top four formulations.
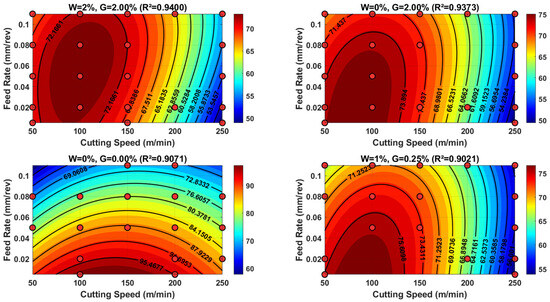
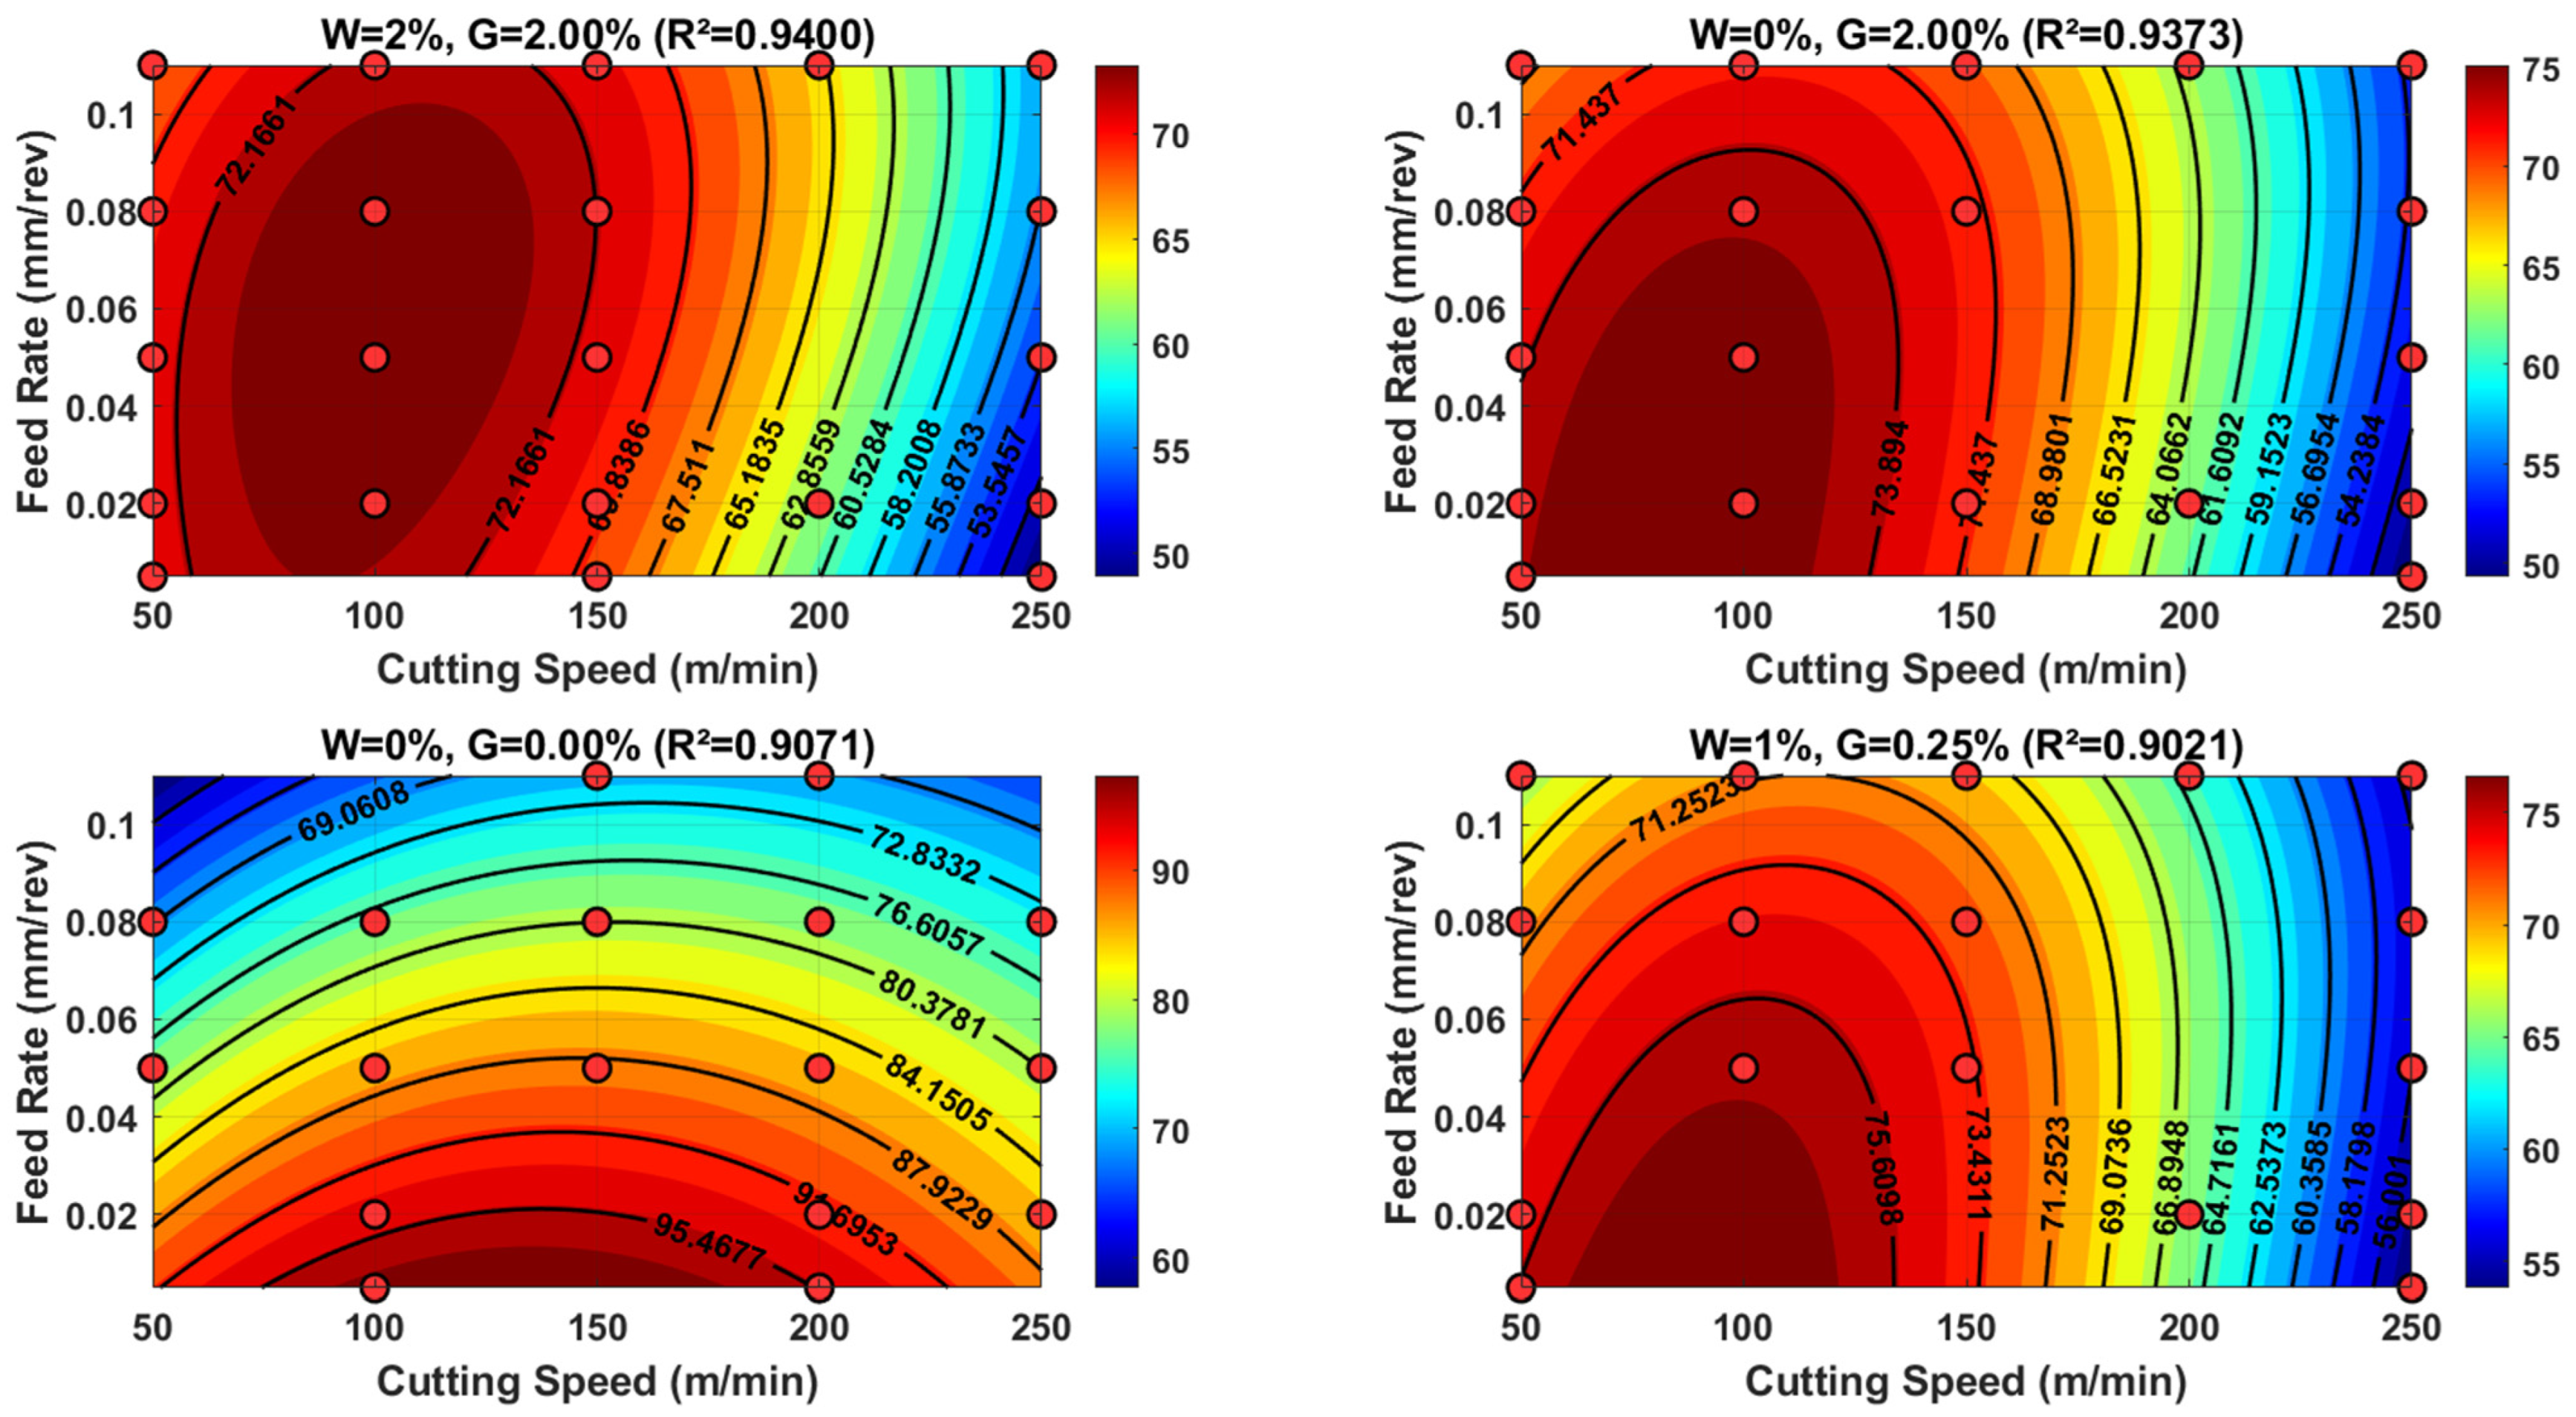
Figure 11 shows the corresponding contour plots with experimental data points overlaid. Numerical analysis of the contour plots revealed distinct thermal operating ranges. The W = 2%, G = 2.00% formulation exhibited the lowest predicted temperature range [48.9 °C, 74.5 °C], followed closely by W = 0%, G = 2.00% with [49.3 °C, 76.4 °C]. The reference formulation showed substantially higher temperatures [57.7 °C, 99.2 °C], confirming the thermal benefit of additive incorporation. The W = 1%, G = 0.25% formulation displayed an intermediate range [53.8 °C, 77.8 °C].
Figure 11.
RSM contour plots for the top four formulations with experimental data points.
The optimal conditions for minimum cutting temperature were identified at W = 2%, G = 0.25%, with a cutting speed of 250 m/min and a feed rate of 0.005 mm/rev, yielding a predicted minimum temperature of 46.1 °C. This represents a temperature reduction of approximately 53% compared to the reference formulation under similar cutting conditions.
4. Discussion
4.1. Inverse Relationship Between Feed Rate and Temperature
The observed decrease in drilling temperature with increasing feed rate contradicts conventional metal cutting theory, where increased feed typically elevates temperature due to higher material removal rates [55,56]. As shown in Figure 4, for the baseline formulation, increasing the feed rate from 0.005 to 0.110 mm/rev reduced the mean temperature from 97.45 °C to 69.14 °C. This inverse relationship has been documented in natural fiber-reinforced polymer composites. Davim et al. [57] reported that increasing the feed rate reduces specific cutting energy in CFRP machining because the tool spends less time in contact with the workpiece per unit volume of material removed. Similarly, Karpat et al. [58] observed that higher feed rates in drilling flax fiber composites lead to shorter tool–workpiece interaction time, reducing frictional heat generation. The present results extend these findings by demonstrating that this inverse relationship persists across all nine formulations, indicating a fundamental characteristic of flax fiber-reinforced composites.
The novel contribution of this study is the quantification of process stability through standard deviation and quartile analysis (Figure 4). The dramatic reduction in standard deviation from 14.20 °C at the lowest feed rate to 3.41 °C at 0.050 mm/rev for the baseline formulation indicates that higher feed rates not only reduce temperature but also stabilize the drilling process. This finding aligns with Bhatnagar et al. [59], who demonstrated that low feed rates promote erratic chip formation and intermittent cutting, leading to temperature fluctuations. The wide interquartile range of approximately 19 °C at 0.005 mm/rev compared to only 3 °C at 0.050 mm/rev quantitatively confirms that low feed rates produce highly unpredictable thermal behavior, which is detrimental for industrial applications requiring consistent part quality.
4.2. Dominant Role of Cutting Speed and Speed-Dependent Stability
The identification of cutting speed as a dominant factor is consistent with Sheikh-Ahmad [60] and Poulachon et al. [61]. However, as illustrated in Figure 5, the standard deviation analysis reveals a critical new finding: the stability of the drilling process is highly speed-dependent and formulation-dependent. For the baseline formulation without additives, increasing speed from 50 m/min to 250 m/min increased the standard deviation from 4.02 °C to 18.35 °C, indicating that high speeds without additives produce highly erratic thermal behavior. In contrast, for the 0% wax, 2% graphene formulation, increasing speed to 250 m/min reduced the standard deviation to 3.41 °C with a very tight interquartile range. This suggests that graphene is particularly effective at high cutting speeds, where its high thermal conductivity can rapidly dissipate intense frictional heat. As shown in Figure 5, the 2% wax, 0.25% graphene formulation achieved the best combination of low temperature (51.65 °C) and high stability (σ = 3.53 °C) at 250 m/min, demonstrating that the optimal formulation for high-speed drilling is 2% wax with 0.25% graphene.
4.3. Effects of Wax and Graphene on Thermal Stability
The progressive temperature reduction of 11.3% when increasing wax from 0% to 2% (Figure 6a) confirms the lubricating and phase-change cooling mechanisms proposed by Sharma et al. [62]. Wax acts as a solid lubricant, reducing the coefficient of friction at the tool–workpiece interface [39], while also undergoing phase change during drilling to absorb latent heat [62]. The reduction in standard deviation from 12.90 °C to 9.51 °C (Figure 6a) provides new evidence that wax also acts as a thermal stabilizer, reducing the scatter of temperature measurements. This improved consistency, observed across the range of cutting parameters (Figure 6a), indicates that wax addition enhances the overall robustness of the drilling process to variations in cutting conditions, which is critical for industrial applications requiring predictable and repeatable drilling conditions.
Regarding graphene, the non-monotonic temperature response with an optimal concentration at 0.25% (Figure 6b) confirms the biphasic behavior reported by Shahil and Balandin [63] and Kim et al. [64]. At low concentrations, graphene’s exceptional in-plane thermal conductivity (≈5000 W/m·K) facilitates rapid heat dissipation from the drilling zone [42,65]. However, at higher concentrations, graphene agglomeration occurs, creating thermal barriers rather than conductive pathways [66]. The stability analysis provides additional insights: as shown in Figure 6b, the standard deviation improved from 13.64 °C at 0% graphene to 10.17 °C at 0.25% graphene but remained essentially unchanged at 10.16 °C for 2.00% graphene. This indicates that while low graphene concentrations improve both mean temperature and consistency, higher concentrations provide no additional stability benefit. The practical implication is that adding more than 0.25% graphene is inefficient from both cost and performance perspectives.
4.4. Combined Effects of Wax and Graphene Additives
The best thermal performance at high cutting speeds was achieved with formulations containing both wax and graphene. As shown in Figure 5, the 2% wax, 2% graphene formulation maintained 52.67 °C at 250 m/min with a standard deviation of 4.21 °C, while the baseline formulation reached 84.21 °C with a standard deviation of 18.35 °C. This represents a 37.4% reduction in mean temperature and a 77% reduction in variability. This improvement indicates that wax and graphene work through complementary mechanisms [67]. Wax provides consistent lubrication through transfer film formation [68], while graphene provides rapid heat dissipation [65], together eliminating the intermittent cutting and localized hot spots that cause thermal variability.
The high stability observed for the 1% wax, 2% graphene formulation (σ = 1.28 °C at 0.110 mm/rev in Figure 4) further suggests that the combination of wax and graphene creates a self-stabilizing thermal management system. The poor stability of the 0% wax, 0.25% graphene formulation (σ = 12.80 °C at 0.110 mm/rev in Figure 4) reveals that graphene alone, without wax, cannot provide consistent thermal performance, likely due to uneven distribution of graphene agglomerates that create localized hot spots [66]. The surface and contour plots in Figure 10 and Figure 11 further illustrate these effects: the W = 2%, G = 2.00% formulation exhibits the flattest surface and tightest contour spacing, consistent with its highest R2 value (0.9400).
4.5. Model Performance and Formulation-Specific Behavior
The global RSM model demonstrated high goodness of fit, as illustrated in Figure 7, with R2 = 0.9250 and a correlation of 0.9618 between predicted and measured temperatures. Residual analysis (Figure 9) confirmed model adequacy, with a mean residual of approximately zero (0.0005 °C) and approximately symmetric residuals (skewness = 0.4784, kurtosis = 2.9588).
As shown in Figure 8a, the W = 2%, G = 2.00% formulation achieved the highest predictive accuracy (R2 = 0.9400) and lowest RMSE (2.12 °C, Figure 8b) among all formulations. This high model fit suggests that the thermal behavior of this formulation is more linear and predictable than others. The tight contour spacing (range 48.9–74.5 °C in Figure 11) indicates that this formulation maintains relatively stable temperatures across a wide range of cutting parameters.
In contrast, the markedly lower R2 for W = 1%, G = 2.00% (0.82 in Figure 8a) warrants explanation. This intermediate wax concentration with high graphene loading appears to produce the most complex thermal behavior, characterized by non-linear interactions that the global model captures less effectively. This may be attributed to partial graphene agglomeration at 2% concentration combined with insufficient wax (1%) to maintain uniform dispersion or provide adequate lubrication. Similar non-linear responses have been reported by Khan et al. [67] for intermediate filler concentrations in polymer composites.
Beyond statistical accuracy, the model coefficients are consistent with independently understood thermal and tribological mechanisms. The negative feed coefficient aligns with the well-established inverse relationship between feed rate and specific cutting energy in polymer composites, where higher feed rates reduce tool–workpiece contact time [58,69]. The negative wax coefficients reflect the documented lubricating and phase-change behavior of solid lubricants, where wax melts locally and forms a transfer film that reduces friction at the tool–workpiece interface [39,70]. The non-monotonic graphene response, with optimal performance at 0.25%, is consistent with the known thermal conductivity behavior of graphene at different concentrations: low concentrations provide effective heat dissipation pathways, while higher concentrations lead to agglomeration and reduced thermal conductivity [65,71,72]. This physical consistency supports the credibility of the statistical associations and distinguishes them from purely data-driven correlations.
4.6. Optimal Operating Conditions and Practical Implications
The optimization identified W = 2%, G = 0.25% as the formulation yielding minimum temperature (46.1 °C) at maximum speed (250 m/min) and minimum feed (0.005 mm/rev). This result combines high speed (which typically increases temperature in conventional materials) with minimum feed (which typically increases temperature in composites due to longer contact time). As shown in Figure 5, this formulation achieved the second lowest temperature at 250 m/min (51.65 °C) with a low standard deviation of 3.53 °C. This finding suggests that the combined effects of wax lubrication and graphene-enhanced heat dissipation are most effective at high speeds where frictional heating is most intense. The effectiveness of lubrication and tribological conditioning in fiber-reinforced composites is strongly dependent on cutting speed, with improved frictional stability and thermal management typically observed at higher cutting speeds due to enhanced heat dissipation and stabilized interfacial interactions [73,74].
The R2 values by formulation (Figure 8a) demonstrate that the global dummy model is most reliable for formulations containing both additives (W = 2%, G = 2.00%: R2 = 0.940; W = 0%, G = 2.00%: R2 = 0.937) or the reference (R2 = 0.907). Practitioners should exercise caution when using the model for W = 1%, G = 2.00% (R2 = 0.82), where prediction uncertainty is substantially higher. The optimized conditions (W = 2%, G = 0.25%, 250 m/min, 0.005 mm/rev) provide a concrete recommendation for industrial drilling operations seeking to minimize thermal damage during machining of flax fiber-reinforced composites.
5. Conclusions
This study systematically investigated the individual and combined effects of wax as a solid lubricant and graphene nanoplatelets as a heat dissipation enhancer on cutting temperature during CFRP drilling. Based on 225 unique experimental conditions (9 formulations × 5 cutting speeds × 5 feed rates) with three replicates per condition, totaling 675 individual drilling tests, the following conclusions are drawn:
- Increasing feed rate from 0.005 to 0.110 mm/rev reduced the mean cutting temperature by up to 29% for the baseline formulation. More importantly, higher feed rates dramatically improved process stability, reducing the standard deviation from 14.20 °C to 3.41 °C and narrowing the interquartile range from 19 °C to 3 °C.
- High cutting speeds (250 m/min) without additives produced highly erratic thermal behavior (σ = 18.35 °C). However, the addition of 2% graphene enabled stable drilling at high speeds (σ = 3.41 °C), demonstrating graphene’s effectiveness in dissipating intense frictional heat.
- Increasing wax concentration from 0% to 2% reduced mean temperature by 11.3% (from 73.61 °C to 65.26 °C) and decreased standard deviation by 26% (from 12.90 °C to 9.51 °C), confirming wax’s dual role as a lubricant and thermal stabilizer.
- Graphene exhibited a non-monotonic response with an optimal concentration at 0.25%, achieving a 4.3% temperature reduction and improving standard deviation from 13.64 °C to 10.17 °C. Higher concentrations (2%) provided no additional thermal or stability benefits due to nanoparticle agglomeration.
- The combination of 2% wax and 2% graphene achieved a 37.4% temperature reduction and a 77% reduction in variability compared to the reference formulation. The optimal formulation for industrial application was identified as 2% wax with 0.25% graphene, yielding a minimum temperature of 46.1 °C at 250 m/min and 0.005 mm/rev.
- The developed RSM model with dummy variables demonstrated high goodness of fit (R2 = 0.9250, RMSE = 2.83 °C), providing a reliable tool for estimating cutting temperature across different additive formulations and machining conditions.
6. Future Works
While this study provides comprehensive insights into thermal regulation during CFRP drilling, several avenues remain for future investigation:
- Mechanical property characterization: Future work should systematically evaluate the effect of wax and graphene additions on the mechanical properties of CFRP composites, including flexural strength, interlaminar shear strength, and impact resistance, to ensure that thermal benefits are not achieved at the expense of structural integrity.
- Tool wear analysis: Extended drilling tests with tool wear monitoring are needed to assess how the reduced cutting temperatures and improved lubrication translate into prolonged tool life, particularly for industrial high-volume production scenarios.
- Microstructural investigation: Advanced microscopic characterization (SEM, TEM, Raman spectroscopy) should be performed to understand the dispersion quality of graphene nanoplatelets, the formation of wax transfer films, and their evolution during repeated drilling cycles.
- Alternative additive combinations: The mechanisms identified in this study warrant exploration of other hybrid additive systems, such as graphene combined with other solid lubricants (e.g., MoS2, graphite, PTFE), to further enhance thermal regulation.
- Scale-up and industrial validation: Validation studies under industrial production conditions, including varying workpiece geometries, multiple tool diameters, and automated drilling cells, are necessary to confirm the scalability of the optimized formulation.
- Spatiotemporal thermal monitoring: Future work should extend the present analysis from scalar peak temperature to spatiotemporal thermal evolution using full infrared sequence analysis. This would provide a more defensible basis for evaluating process stability, heating rates, breakthrough-related fluctuations, localized hot-spot persistence, and cooling behavior. Deep learning-based analysis of temporal thermal data could enable real-time monitoring and classification of drilling states, similar to recent approaches demonstrated for additive manufacturing processes. Such sequence-based analysis would provide a stronger definition of thermal process stability and support real-time quality control in industrial drilling operations.
Author Contributions
Conceptualization, M.S. and J.-F.C.; methodology, M.S. and C.K.; software, M.S.; validation, M.S. and J.-F.C.; formal analysis, M.S.; investigation, M.S.; resources, J.-F.C.; data curation, C.K.; writing—original draft preparation, M.S.; writing—review and editing, M.S. and J.-F.C.; visualization, M.S.; supervision, J.-F.C.; project administration, J.-F.C.; funding acquisition, J.-F.C. All authors have read and agreed to the published version of the manuscript.
Funding
This research was funded by the Natural Sciences and Engineering Research Council of Canada (NSERC) grant number #RGPIN-2017-04305.
Data Availability Statement
Data available upon request.
Conflicts of Interest
The authors declare no conflicts of interest. The funders had no role in the design of the study; in the collection, analyses, or interpretation of data; in the writing of the manuscript; or in the decision to publish the results.
Abbreviations
The following abbreviations are used in this manuscript:
| CFRP | Carbon fiber-reinforced polymer |
| DOE | Design of experiments |
| PCD | Polycrystalline diamond |
| CVD | Chemical vapor deposition |
| RSM | Response surface methodology |
| RMSE | Root mean square error |
| R2 | Coefficient of determination |
| R2adj | Adjusted coefficient of determination |
| Q1 | First quartile |
| Q3 | Third quartile |
| STD | Standard deviation |
References
- Ahmad, H.; A Markina, A.; Porotnikov, M.V.; Ahmad, F. A review of carbon fiber materials in automotive industry. IOP Conf. Ser. Mater. Sci. Eng. 2020, 971, 032011. [Google Scholar] [CrossRef] [Scilit]
- Othman, R.; Ismail, N.I.; Pahmi, M.A.A.H.; Basri, M.H.M.; Sharudin, H.; Hemdi, A.R. Application of carbon fiber reinforced plastics in automotive industry: A review. J. Mech. Manuf. 2018, 1, 144–154. [Google Scholar]
- Slamani, M.; Chatelain, J.-F. Issues and challenges in robotic trimming of CFRP. In 2015 12th International Conference on Informatics in Control, Automation and Robotics (ICINCO); IEEE: Piscataway, NJ, USA, 2015. [Google Scholar]
- Aamir, M.; Tolouei-Rad, M.; Giasin, K.; Nosrati, A. Recent advances in drilling of carbon fiber–reinforced polymers for aerospace applications: A review. Int. J. Adv. Manuf. Technol. 2019, 105, 2289–2308. [Google Scholar] [CrossRef] [Scilit]
- Xu, J.; Geier, N.; Shen, J.; Krishnaraj, V.; Samsudeensadham, S. A review on CFRP drilling: Fundamental mechanisms, damage issues, and approaches toward high-quality drilling. J. Mater. Res. Technol. 2023, 24, 9677–9707. [Google Scholar] [CrossRef] [Scilit]
- Zhu, W.; Fu, H.; Li, F.; Ji, X.; Li, Y.; Bai, F. Optimization of CFRP drilling process: A review. Int. J. Adv. Manuf. Technol. 2022, 123, 1403–1432. [Google Scholar] [CrossRef] [Scilit]
- Álvarez-Alcón, M.; Lopez de Lacalle, L.N.; Fernández-Zacarías, F. Multiple sensor monitoring of CFRP drilling to define cutting parameters sensitivity on surface roughness, cylindricity and diameter. Materials 2020, 13, 2796. [Google Scholar] [CrossRef] [Scilit] [PubMed]
- Luo, B.; Hou, G.; Zhang, K.; Cheng, H. Hole-wall temperature characteristics in thick UD-CFRP drilling by different condition. Mater. Manuf. Process. 2024, 39, 563–576. [Google Scholar]
- Chen, R.; Li, S.; Li, C.; Li, P.; Jiang, Y.; Ko, T.J. Influence of fiber direction and processing parameters on drilling temperature of CFRP. J. Mech. Sci. Technol. 2021, 35, 1663–1669. [Google Scholar] [CrossRef] [Scilit]
- Slamani, M.; Kebaili, C.; Chatelain, J.-F. Drilling Temperature and Cutting Force Analysis in Additive-Modified CFRP Composites. J. Manuf. Mater. Process. 2026, 10, 184. [Google Scholar] [CrossRef] [Scilit]
- Zhang, C.; Zhang, X.; Duan, Y.; Xia, Y.; Ming, Y.; Zhu, Y. Deformation resistance performance of carbon fiber-reinforced plastic machined by controlling drilling area temperature below the glass transition temperature. Materials 2021, 14, 1394. [Google Scholar] [CrossRef] [Scilit] [PubMed]
- Wang, H.; Zhang, X.; Duan, Y. Effects of drilling area temperature on drilling of carbon fiber reinforced polymer composites due to temperature-dependent properties. Int. J. Adv. Manuf. Technol. 2018, 96, 2943–2951. [Google Scholar] [CrossRef] [Scilit]
- Wang, K.; Wu, S.; Wang, J.; Huo, L. Drilling Defects and Process Optimization in Carbon Fiber-Reinforced Polymer Composites: A Review. Coatings 2026, 16, 204. [Google Scholar] [CrossRef] [Scilit]
- Jagadeesh, P.; Rangappa, S.M.; Suyambulingam, I.; Siengchin, S.; Puttegowda, M.; Binoj, J.S.; Gorbatyuk, S.; Khan, A.; Doddamani, M.; Fiore, V.; et al. Drilling characteristics and properties analysis of fiber reinforced polymer composites: A comprehensive review. Heliyon 2023, 9, e14428. [Google Scholar] [CrossRef] [Scilit] [PubMed]
- Krishnaraj, V.; Prabukarthi, A.; Ramanathan, A.; Elanghovan, N.; Senthil Kumar, M.; Zitoune, R.; Davim, J.P. Optimization of machining parameters at high speed drilling of carbon fiber reinforced plastic (CFRP) laminates. Compos. Part B Eng. 2012, 43, 1791–1799. [Google Scholar] [CrossRef] [Scilit]
- Wang, Q.; Jia, X. Optimization of cutting parameters for improving exit delamination, surface roughness, and production rate in drilling of CFRP composites. Int. J. Adv. Manuf. Technol. 2021, 117, 3487–3502. [Google Scholar] [CrossRef] [Scilit]
- Angelone, R.; Caggiano, A.; Nele, L.; Teti, R. Optimal cutting parameters and tool geometry in drilling of CFRP/CFRP stack laminates for aeronautical applications. Procedia CIRP 2021, 99, 398–403. [Google Scholar] [CrossRef] [Scilit]
- Ge, J.; Fu, G.; Almeida, J.H.S., Jr.; Jin, Y.; Sun, D. Thermal effect in CFRP machining: Temperature field characteristics, heat generation mechanism and thermal damage management. Compos. Struct. 2025, 356, 118845. [Google Scholar] [CrossRef] [Scilit]
- Danish, M.; Gupta, M.K.; Rubaiee, S.; Ahmed, A.; Mahfouz, A.; Jamil, M. Machinability investigations on CFRP composites: A comparison between sustainable cooling conditions. Int. J. Adv. Manuf. Technol. 2021, 114, 3201–3216. [Google Scholar] [CrossRef] [Scilit]
- Slamani, M.; Karabibene, N.; Chatelain, J.-F.; Beauchamp, Y. Edge trimming of flax fibers and glass fibers reinforced polymers composite–An experimental comparative evaluation. Int. J. Mater. Form. 2021, 14, 1497–1510. [Google Scholar] [CrossRef] [Scilit]
- Wang, B.; Al-Barawi, A.; Dai, Z.; Liu, K.; Mostafa, M.M.A.; Ma, M. Effect of Cooling Methods on CFRP–Concrete Bond Behavior After High-Temperature Exposure: An Experimental Study. Polymers 2026, 18, 939. [Google Scholar] [CrossRef] [Scilit] [PubMed]
- Hrechuk, A.; M’SAoubi, R.; Melin, T.; Frejd, S.; Nordberg, P.; Karlsson, L.; Alm, P.; Kryzhanivskyy, V.; Bushlya, V. Effect of tool geometry and flank wear on drill temperature during CFRP machining. Compos. Part C Open Access 2026, 19, 100695. [Google Scholar] [CrossRef] [Scilit]
- Yuan, W.; Liu, C.; Yang, T.; Du, Y.; Liu, S. Experimental investigation on effect of tool geometry on thermal and crystallization characteristics in drilling of carbon fiber reinforced PEEK composite. Polym. Compos. 2024, 45, 9376–9388. [Google Scholar] [CrossRef] [Scilit]
- de Lacalle, N.L.; Lamikiz, A.; Campa, F.; Valdivielso, A.F.; Etxeberria, I. Design and test of a multitooth tool for CFRP milling. J. Compos. Mater. 2009, 43, 3275–3290. [Google Scholar] [CrossRef] [Scilit]
- de Lacalle, L.N.L.; Lamikiz, A.; Sanchez, J.A.; de Bustos, I.F. Simultaneous measurement of forces and machine tool position for diagnostic of machining tests. IEEE Trans. Instrum. Meas. 2005, 54, 2329–2335. [Google Scholar]
- Lee, S.H.; Luvnish, A.; Su, X.; Meng, Q.; Liu, M.; Kuan, H.-C.; Saman, W.; Bostrom, M.; Ma, J. Advancements in polymer (Nano) composites for phase change material-based thermal storage: A focus on thermoplastic matrices and ceramic/carbon fillers. Smart Mater. Manuf. 2024, 2, 100044. [Google Scholar] [CrossRef] [Scilit]
- Dobrotă, D.; Bărbușiu, A.-M.; Sava, G.-A.; Oleksik, V.Ș. Functional Additives in Automotive Polymer Matrices: Compatibility, Mechanisms, and Industry Challenges. Polymers 2025, 17, 2328. [Google Scholar] [CrossRef] [Scilit] [PubMed]
- Slamani, M.; Louhichi, B.; Amroune, S.; Jawaid, M. Next-Generation Composite Materials and Manufacturing: A Review of Smart, Sustainable, and Digital Advancements. Adv. Mater. Technol. 2026, 11, e01409. [Google Scholar] [CrossRef] [Scilit]
- Elhadi, A.; Slamani, M.; Arslane, M.; Amroune, S.; Köklü, U.; Alrasheedi, N.; Louhichi, B. Machine learning-based predictive modeling of machining forces and temperatures in alumina-reinforced jute/epoxy functional composites. Int. J. Adv. Manuf. Technol. 2026, 144, 5217–5237. [Google Scholar] [CrossRef] [Scilit]
- Thakur, R.K.; Singh, K.K.; Rawat, P. Evaluation of graphene nanoplatelets addition and machining methods on the hole quality and bearing strength of glass and carbon fibre reinforced epoxy laminates. J. Manuf. Process. 2024, 115, 137–155. [Google Scholar] [CrossRef] [Scilit]
- Bighash, M.T.; Baraheni, M.; Tahmasbi, V. Drilling-induced damage and thermal–mechanical response of graphene nanoplatelet–modified CFRP composites under high-speed conditions. J. Compos. Mater. 2026, 00219983261442038. [Google Scholar] [CrossRef] [Scilit]
- Ma, T.; Yang, J.; Chen, J.; Dang, J.; An, Q.; Chen, M. A review of nanofluid minimum quantity lubrication technology applications in various machining processes. Lubricants 2026, 14, 103. [Google Scholar] [CrossRef] [Scilit]
- Hedayati, H.; Mofidi, A.; Al-Fadhli, A.; Aramesh, M. Solid lubricants used in extreme conditions experienced in machining: A comprehensive review of recent developments and applications. Lubricants 2024, 12, 69. [Google Scholar] [CrossRef] [Scilit]
- Vamsi Krishna, P.; Srikant, R.; Rao, D.N. Solid lubricants in machining. Proc. Inst. Mech. Eng. Part J J. Eng. Tribol. 2011, 225, 213–227. [Google Scholar] [CrossRef] [Scilit]
- Slamani, M.; Jammel, S.; Chatelain, J.-F. Effects of wax and graphene concentrations on cutting force in drilling GFRP composites: A comprehensive study using a full factorial design of experiments. J. Compos. Mater. 2025, 59, 2779–2797. [Google Scholar] [CrossRef] [Scilit]
- Slamani, M.; Chatelain, J.-F.; Jammel, S. Comprehensive Analysis of Lubricant and Nanofiller Contributions to Surface Roughness Control in Drilling of GFRP Composites. J. Compos. Sci. 2026, 10, 81. [Google Scholar] [CrossRef] [Scilit]
- Sunil, T.; Sandeep, M.; Kumaraswami, R.; Shravan, A. A critical review on solid lubricants. Int. J. Mech. Eng. Technol. 2016, 7, 193–199. [Google Scholar] [CrossRef] [Scilit]
- Krishna, P.V.; Rao, D.N. Performance evaluation of solid lubricants in terms of machining parameters in turning. Int. J. Mach. Tools Manuf. 2008, 48, 1131–1137. [Google Scholar] [CrossRef] [Scilit]
- Khun, N.W.; Zhang, H.; Yang, J.; Liu, E. Mechanical and tribological properties of epoxy matrix composites modified with microencapsulated mixture of wax lubricant and multi-walled carbon nanotubes. Friction 2013, 1, 341–349. [Google Scholar] [CrossRef] [Scilit]
- Levy, I.; Wormser, E.M.; Varenik, M.; Buzaglo, M.; Nadiv, R.; Regev, O. Graphene–graphite hybrid epoxy composites with controllable workability for thermal management. Beilstein J. Nanotechnol. 2019, 10, 95–104. [Google Scholar] [CrossRef] [Scilit] [PubMed]
- Upadhyay, R.K.; Kumar, A. Effect of particle weight concentration on the lubrication properties of graphene based epoxy composites. Colloid Interface Sci. Commun. 2019, 33, 100206. [Google Scholar] [CrossRef] [Scilit]
- Slamani, M.; Chatelain, J.-F.; Jammel, S. The effect of lubricant and nanofiller additives on drilling temperature in GFRP composites. J. Compos. Sci. 2025, 9, 558. [Google Scholar] [CrossRef] [Scilit]
- Jensen, W.A. Response Surface Methodology: Process and Product Optimization Using Designed Experiments, 4th ed.; Taylor & Francis: Abingdon, UK, 2017. [Google Scholar]
- Montgomery, D.C. Design and Analysis of Experiments; John Wiley & Sons: Hoboken, NJ, USA, 2017. [Google Scholar]
- Kutner, M.H. Applied linear statistical models. J. Am. Stat. Assoc. 1984, 103, 880. [Google Scholar]
- Montgomery, D.C.; Peck, E.A.; Vining, G.G. Introduction to Linear Regression Analysis; John Wiley & Sons: Hoboken, NJ, USA, 2021. [Google Scholar]
- Slamani, M.; Chatelain, J.-F.; Il, A.; Balazinski, M. Statistical analysis and modeling of temperature distribution during various milling operations of thin walled aircraft parts. Phys. A Stat. Mech. Its Appl. 2021, 570, 125842. [Google Scholar] [CrossRef] [Scilit]
- Slamani, M.; Amroune, S.; Benyettou, R.; Fouad, H.; Jawaid, M.; Khiari, R. Water absorption behavior of date palm fruit branches fiber (DPF) composites: Experimental and statistical analyses. J. Nat. Fibers 2024, 21, 2375530. [Google Scholar] [CrossRef] [Scilit]
- Fox, J. Applied Regression Analysis and Generalized Linear Models; Sage Publications: Thousand Oaks, CA, USA, 2015. [Google Scholar]
- Slamani, M.; Elhadi, A.; Amroune, S.; Arslane, M.; Jomaa, W.; Fouad, H.; Chatelain, J.-F.; Jawaid, M. Investigating the impact of drill material on hole quality in jute/palm fiber reinforced hybrid composite drilling with uncertainty analysis. Heliyon 2024, 10, e36925. [Google Scholar] [CrossRef] [Scilit] [PubMed]
- Khuri, A.I.; Mukhopadhyay, S. Response Surface Methodology. Wiley Interdiscip. Rev. Comput. Stat. 2010, 2, 128–149. [Google Scholar] [CrossRef] [Scilit]
- Seber, G.A.; Lee, A.J. Linear Regression Analysis; John Wiley & Sons: Hoboken, NJ, USA, 2003. [Google Scholar]
- Hoerl, A.E.; Kennard, R.W. Ridge regression: Biased estimation for nonorthogonal problems. Technometrics 1970, 12, 55–67. [Google Scholar] [CrossRef]
- Hoerl, A.E.; Kannard, R.W.; Baldwin, K.F. Ridge regression: Some simulations. Commun. Stat.-Theory Methods 1975, 4, 105–123. [Google Scholar] [CrossRef] [Scilit]
- Astakhov, V.P. Tribology of Metal Cutting, in Mechanical Tribology; CRC Press: Boca Raton, FL, USA, 2004; pp. 319–358. [Google Scholar]
- Shaw, M.C. Metal Cutting Principles; Oxford University Press: Oxford, UK, 2005. [Google Scholar]
- Davim, J.P.; Reis, P. Drilling carbon fiber reinforced plastics manufactured by autoclave—Experimental and statistical study. Mater. Des. 2003, 24, 315–324. [Google Scholar] [CrossRef] [Scilit]
- Karpat, Y.; Bahtiyar, O.; Değer, B. Mechanistic force modeling for milling of unidirectional carbon fiber reinforced polymer laminates. Int. J. Mach. Tools Manuf. 2012, 56, 79–93. [Google Scholar] [CrossRef] [Scilit]
- Bhatnagar, N.; Ramakrishnan, N.; Naik, N.; Komanduri, R. On the machining of fiber reinforced plastic (FRP) composite laminates. Int. J. Mach. Tools Manuf. 1995, 35, 701–716. [Google Scholar] [CrossRef] [Scilit]
- Sheikh-Ahmad, J.Y. Machining of Polymer Composites; Springer: Berlin/Heidelberg, Germany, 2009. [Google Scholar]
- Poulachon, G.; Outeiro, J.; Ramirez, C.; André, V.; Abrivard, G. Hole surface topography and tool wear in CFRP drilling. Procedia CIRP 2016, 45, 35–38. [Google Scholar] [CrossRef] [Scilit]
- Sharma, A.; Tyagi, V.V.; Chen, C.R.; Buddhi, D. Review on thermal energy storage with phase change materials and applications. Renew. Sustain. Energy Rev. 2009, 13, 318–345. [Google Scholar] [CrossRef] [Scilit]
- Shahil, K.M.; Balandin, A.A. Thermal properties of graphene and multilayer graphene: Applications in thermal interface materials. Solid State Commun. 2012, 152, 1331–1340. [Google Scholar] [CrossRef] [Scilit]
- Kim, H.; Abdala, A.A.; Macosko, C.W. Graphene/polymer nanocomposites. Macromolecules 2010, 43, 6515–6530. [Google Scholar] [CrossRef] [Scilit]
- Balandin, A.A.; Ghosh, S.; Bao, W.; Calizo, I.; Teweldebrhan, D.; Miao, F.; Lau, C.N. Superior thermal conductivity of single-layer graphene. Nano Lett. 2008, 8, 902–907. [Google Scholar] [CrossRef] [Scilit] [PubMed]
- Papageorgiou, D.G.; Kinloch, I.A.; Young, R.J. Mechanical properties of graphene and graphene-based nanocomposites. Prog. Mater. Sci. 2017, 90, 75–127. [Google Scholar] [CrossRef] [Scilit]
- Khan, U.; May, P.; O’neill, A.; Coleman, J.N. Development of stiff, strong, yet tough composites by the addition of solvent exfoliated graphene to polyurethane. Carbon 2010, 48, 4035–4041. [Google Scholar] [CrossRef] [Scilit]
- Bahadur, S. The development of transfer layers and their role in polymer tribology. Wear 2000, 245, 92–99. [Google Scholar] [CrossRef] [Scilit]
- Davim, J.P.; Reis, P. Study of delamination in drilling carbon fiber reinforced plastics (CFRP) using design experiments. Compos. Struct. 2003, 59, 481–487. [Google Scholar] [CrossRef] [Scilit]
- Ali, S.H.; Yao, Y.; Wu, B.; Zhao, B.; Ding, W.; Jamil, M.; Khan, A.; Baig, A.; Liu, Q.; Xu, D. Recent developments in MQL machining of aeronautical materials: A comparative review. Chin. J. Aeronaut. 2025, 38, 102918. [Google Scholar] [CrossRef] [Scilit]
- Huang, J.-N.; Yang, L.; Xie, Y. Why the thermal conductivity of graphene nanofluids is extremely high? A new model based on anisotropy and particle-free renovation. J. Mol. Liq. 2021, 341, 117326. [Google Scholar] [CrossRef] [Scilit]
- D’Oliveira, E.J.; Sanchez-Vicente, Y.; Mehvari, S.; Pereira, S.C.C. Effect of Graphene Nanoplatelet Size on the Thermal Properties of Bio-Based Phase-Change Materials for Thermal Energy Storage. Energies 2026, 19, 1504. [Google Scholar] [CrossRef] [Scilit]
- Chegdani, F.; Mezghani, S.; El Mansori, M. On the multiscale tribological signatures of the tool helix angle in profile milling of woven flax fiber composites. Tribol. Int. 2016, 100, 132–140. [Google Scholar] [CrossRef] [Scilit]
- Rodríguez, A.; Calleja, A.; de Lacalle, L.N.L.; Pereira, O.; Rubio-Mateos, A.; Rodríguez, G. Drilling of CFRP-Ti6Al4V stacks using CO2-cryogenic cooling. J. Manuf. Process 2021, 64, 58–66. [Google Scholar] [CrossRef] [Scilit]

Disclaimer/Publisher’s Note: The statements, opinions and data contained in all publications are solely those of the individual author(s) and contributor(s) and not of MDPI and/or the editor(s). MDPI and/or the editor(s) disclaim responsibility for any injury to people or property resulting from any ideas, methods, instructions or products referred to in the content. |
© 2026 by the authors. Licensee MDPI, Basel, Switzerland. This article is an open access article distributed under the terms and conditions of the Creative Commons Attribution (CC BY) license.