


Abstract
This study investigates the influence of process parameters on dimensional accuracy and microhardness in fiber laser cutting of low-carbon steel. A full factorial design of experiments (DOE) with three factors—cutting speed, focal position, and assist gas pressure—was applied to evaluate their effects on dimensional deviations and microhardness in the heat-affected zone (HAZ). The results showed that focal position is the most significant factor affecting all evaluated dimensional responses, while cutting speed has a strong influence on circular and linear dimensions. The effect of assist gas pressure was found to be response-dependent, being insignificant for inner diameter deviation but significant for selected linear features and through interaction effects with focal position. Statistical analysis confirmed the presence of significant interaction effects between process parameters. Microhardness measurements revealed a substantial increase in hardness from the base material toward the cut edge, indicating microstructural transformations caused by rapid thermal cycles during laser cutting. While this increase in hardness may enhance wear resistance, it may also lead to increased brittleness and reduced toughness. The findings provide a detailed insight into the relationship between process parameters and dimensional accuracy, highlighting the importance of parameter optimization and interaction effects in contributing to improved quality of laser-cut components.
1. Introduction
Laser beam machining (LBM) represents one of the most advanced non-conventional manufacturing technologies widely applied in modern industrial production due to its high precision, flexibility, and ability to process a wide range of materials [1,2,3]. Compared with conventional machining processes, laser cutting enables contactless material removal, reduced mechanical stresses, and improved capability for processing complex geometries and thin-walled structures [4,5]. These advantages have led to its extensive utilization in automotive, aerospace, and general engineering industries, where high productivity and precision are required [6].
Among various laser technologies, fiber lasers have gained significant attention in recent years due to their high energy efficiency, excellent beam quality, and operational stability [7,8,9]. Their ability to achieve high cutting speeds while maintaining high process efficiency has made them a dominant solution in sheet metal processing [10]. Compared to conventional CO2 lasers, fiber lasers exhibit higher electrical efficiency, lower maintenance requirements, and improved absorption characteristics when processing metallic materials, particularly low-carbon steels [11,12].
Despite these advantages, achieving high dimensional and geometrical accuracy remains a critical challenge, particularly when processing structural steels of smaller thicknesses [13]. Dimensional accuracy in laser cutting is strongly influenced by process parameters such as cutting speed, focal position, and assist gas pressure [14,15]. These parameters directly affect energy distribution, melt dynamics, and process stability. Improper parameter selection may result in dimensional deviations, poor edge quality, increased surface roughness, and defects such as dross adhesion or striations [16,17].
A key issue associated with laser cutting is the formation of a heat-affected zone (HAZ), where the material microstructure and mechanical properties are altered due to rapid thermal cycles [3,11]. Changes in microhardness, residual stresses, and microstructural composition within the HAZ can significantly influence the functional performance and durability of components [4]. Recent investigations have reported a substantial increase in hardness near the cut edge, which is attributed to phase transformations induced by rapid heating and cooling [2]. While this phenomenon may improve wear resistance, it may also result in increased brittleness and reduced toughness, which must be considered in engineering applications.
Several recent studies have investigated the influence of laser cutting parameters on surface quality, kerf geometry, and thermal effects. It has been shown that cutting speed plays a dominant role in controlling kerf width and surface roughness, while focal position significantly affects energy distribution within the material and the quality of the cut edge [1,6,14]. Assist gas pressure influences melt ejection efficiency and oxidation processes, often through interaction effects with other parameters [6,15]. However, despite these findings, the interaction effects between process parameters and their combined influence on dimensional accuracy are still not fully understood, particularly for low-carbon structural steels of small thickness [7,13].
To systematically analyze these effects, statistical methods such as design of experiments (DOE) and response surface methodology (RSM) are widely used [18,19,20]. These approaches allow the identification of significant process parameters, evaluation of their interactions, and development of predictive models for process optimization [21,22]. Their application is particularly beneficial in laser cutting processes, where multiple variables simultaneously influence the final quality of the product.
In addition to process optimization, quality evaluation standards such as EN ISO 9013 define requirements for dimensional tolerances, edge quality, and deviation characteristics of thermally cut parts [12]. However, achieving the required tolerance class under real industrial conditions often requires experimental validation and parameter tuning based on specific material properties and thickness conditions.
In contrast to previous studies, this work provides a detailed analysis combining dimensional accuracy evaluation with thermal effects assessment through microhardness measurements. The integration of design of experiments (DOE), statistical modeling, and physical interpretation of interaction effects enables a more detailed understanding of the coupled influence of process parameters.
Furthermore, the study identifies specific parameter combinations leading to near-zero-dimensional deviations and provides experimentally validated regression models suitable for practical process optimization in industrial conditions.
Therefore, the main objective of this study is to experimentally investigate the influence of selected process parameters on the dimensional accuracy of parts produced by fiber laser cutting of low-carbon structural steel with a thickness of 3 mm. A full factorial design of experiments (DOE) is applied to systematically evaluate the effects of cutting speed, focal position, and assist gas pressure on selected dimensional responses. Furthermore, statistical analysis is used to identify significant factors and develop predictive models for process optimization. In addition, microhardness measurements are performed to assess changes in the heat-affected zone and their relationship to process conditions.
Based on the current state of knowledge and previous studies, it is hypothesized that the focal position of the laser beam has a significant influence on the dimensional and geometric accuracy of parts produced by fiber laser cutting. It is further assumed that the hardness of the material in the vicinity of the cut edge will be significantly higher than that of the base material due to rapid thermal cycles occurring during the cutting process. Therefore, the aim of this study is to experimentally investigate the influence of selected process parameters on dimensional accuracy and to analyze the corresponding changes in material properties in the heat-affected zone.
2. Materials and Methods
2.1. Material
The experimental investigations were carried out on low-carbon structural steel sheets with a thickness of 3 mm. This material represents a typical engineering steel widely used in industrial applications due to its good weldability, machinability, and balanced mechanical properties.
The investigated material corresponds to low-carbon structural steel S235JR according to EN 10025-2 [23]. The typical chemical composition of the material is summarized in Table 1.
Table 1.
Typical chemical composition of S235JR steel according to EN 10025-2.
The initial microstructure consists predominantly of ferrite and pearlite, which is characteristic of low-carbon structural steels and provides a balanced combination of strength and ductility [24].
The selected thickness of 3 mm is commonly applied in automotive and general engineering production and provides stable laser cutting conditions while still exhibiting measurable thermal and geometrical effects. This makes it suitable for systematic investigation of process parameter influence.
The study is intentionally focused on a single material thickness in order to eliminate additional variability and ensure a clear interpretation of the results. The investigation of other material thicknesses is considered as part of future work.
2.2. Laser Cutting Equipment
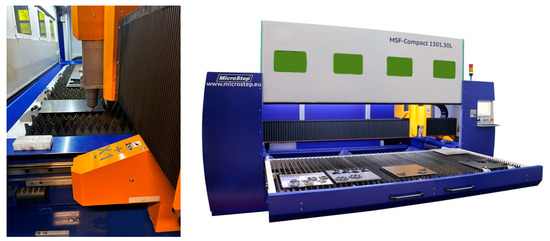
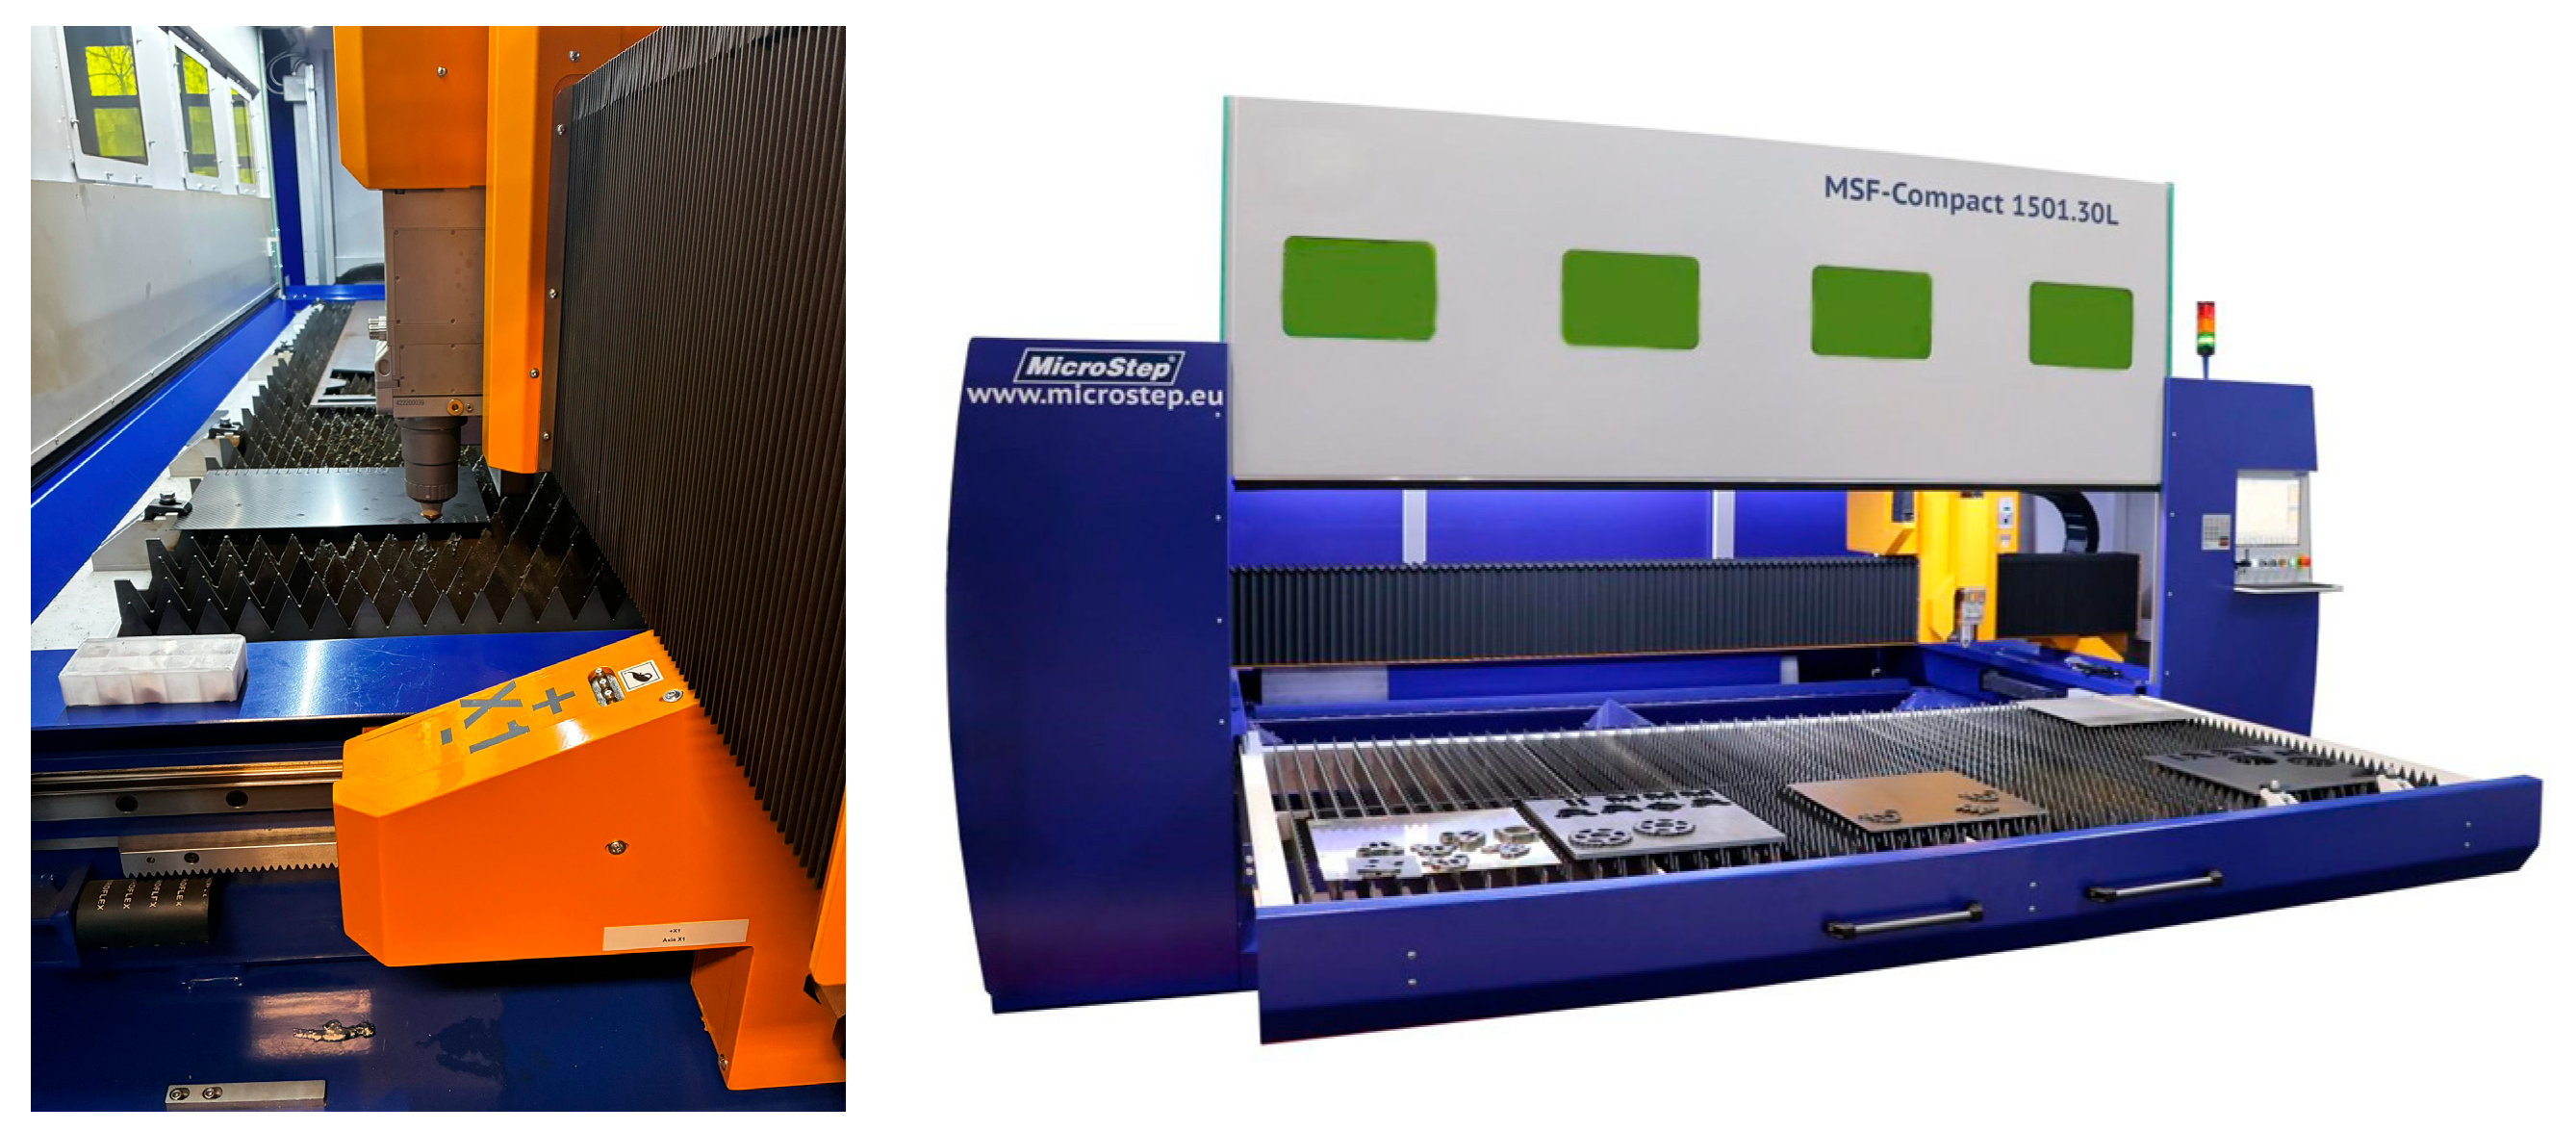
The experiments were performed using a CNC laser cutting system (MicroStep, Bratislava, Slovakia, MSF series) equipped with a fiber laser source IPG YLS-6000-CUT (IPG Photonics, Oxford, MA, USA). The experimental setup is shown in Figure 1. The system enables high-precision cutting through a focused laser beam with stable beam quality and repeatable process conditions.
Figure 1.
Experimental setup of the fiber laser cutting system (MicroStep MSF series) used for sample preparation.
The machine is characterized by high dynamic performance, with a maximum axis speed of 130 m/min for individual X and Y axes and a maximum synchronized speed of 183 m/min. The maximum acceleration of the axes reaches 10 m/s2, while the acceleration typically used during the cutting process is limited to 2 m/s2 to ensure process stability and cutting quality. The positioning repeatability of the system is ±0.03 mm, ensuring high precision and reproducibility of the experiments. The effective cutting area of the machine is 1.5 m × 3 m (X × Y working dimensions), and the weight of the carriage with the cutting head is approximately 80 kg. Oxygen with a purity of 99.95% was used as an assist gas during the cutting process. The use of oxygen supports exothermic reactions, enhances cutting efficiency, and improves melt ejection from the kerf. At the same time, it influences the thermal characteristics of the process and contributes to achieving stable cutting conditions.
2.3. Experimental Design
A full factorial design of experiments (DOE) was applied to evaluate the influence of selected process parameters on dimensional accuracy. Three input factors were considered: cutting speed (v), focal position (F), and assist gas pressure (p). The laser power was kept constant at 3000 W for all experimental runs and was not included as a variable parameter in the design of experiments. The levels of process parameters were selected based on recommended cutting conditions provided by the machine manufacturer (MicroStep) for the investigated material and thickness. The central level (coded as 0) corresponds to standard industrial cutting conditions, while the lower and higher levels were defined to represent controlled deviations around this reference point.
The non-uniform spacing of parameter levels reflects the technological sensitivity of the laser cutting process, where certain parameters exhibit nonlinear influence on the output responses. Therefore, the selected parameter ranges were chosen based on recommended cutting conditions provided by the machine manufacturer (MicroStep) and to capture both stable cutting conditions and boundary regions where process instability or quality degradation may occur.
Each factor was investigated at three levels (−1, 0, +1), corresponding to low, medium, and high settings. The real values of the process parameters were as follows: cutting speed (2000, 3200, and 4000 mm/min), assist gas pressure (0.3, 0.5, and 0.6 bar), and focal position (3, 3.5, and 4 mm).
The experimental design was based on a full factorial scheme (33), resulting in 27 base experimental runs. To increase the reliability of the results and enable statistical evaluation of experimental error, each run was repeated six times, leading to a total of 162 experimental observations.
This experimental setup allows for the evaluation of both main effects of individual factors and their interaction effects, providing a comprehensive understanding of the process behavior.
The experimental plan and factor levels are summarized in Table 2.
Table 2.
Process parameters and their levels used in the DOE.
2.4. Measured Responses
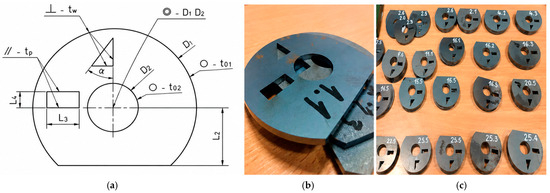
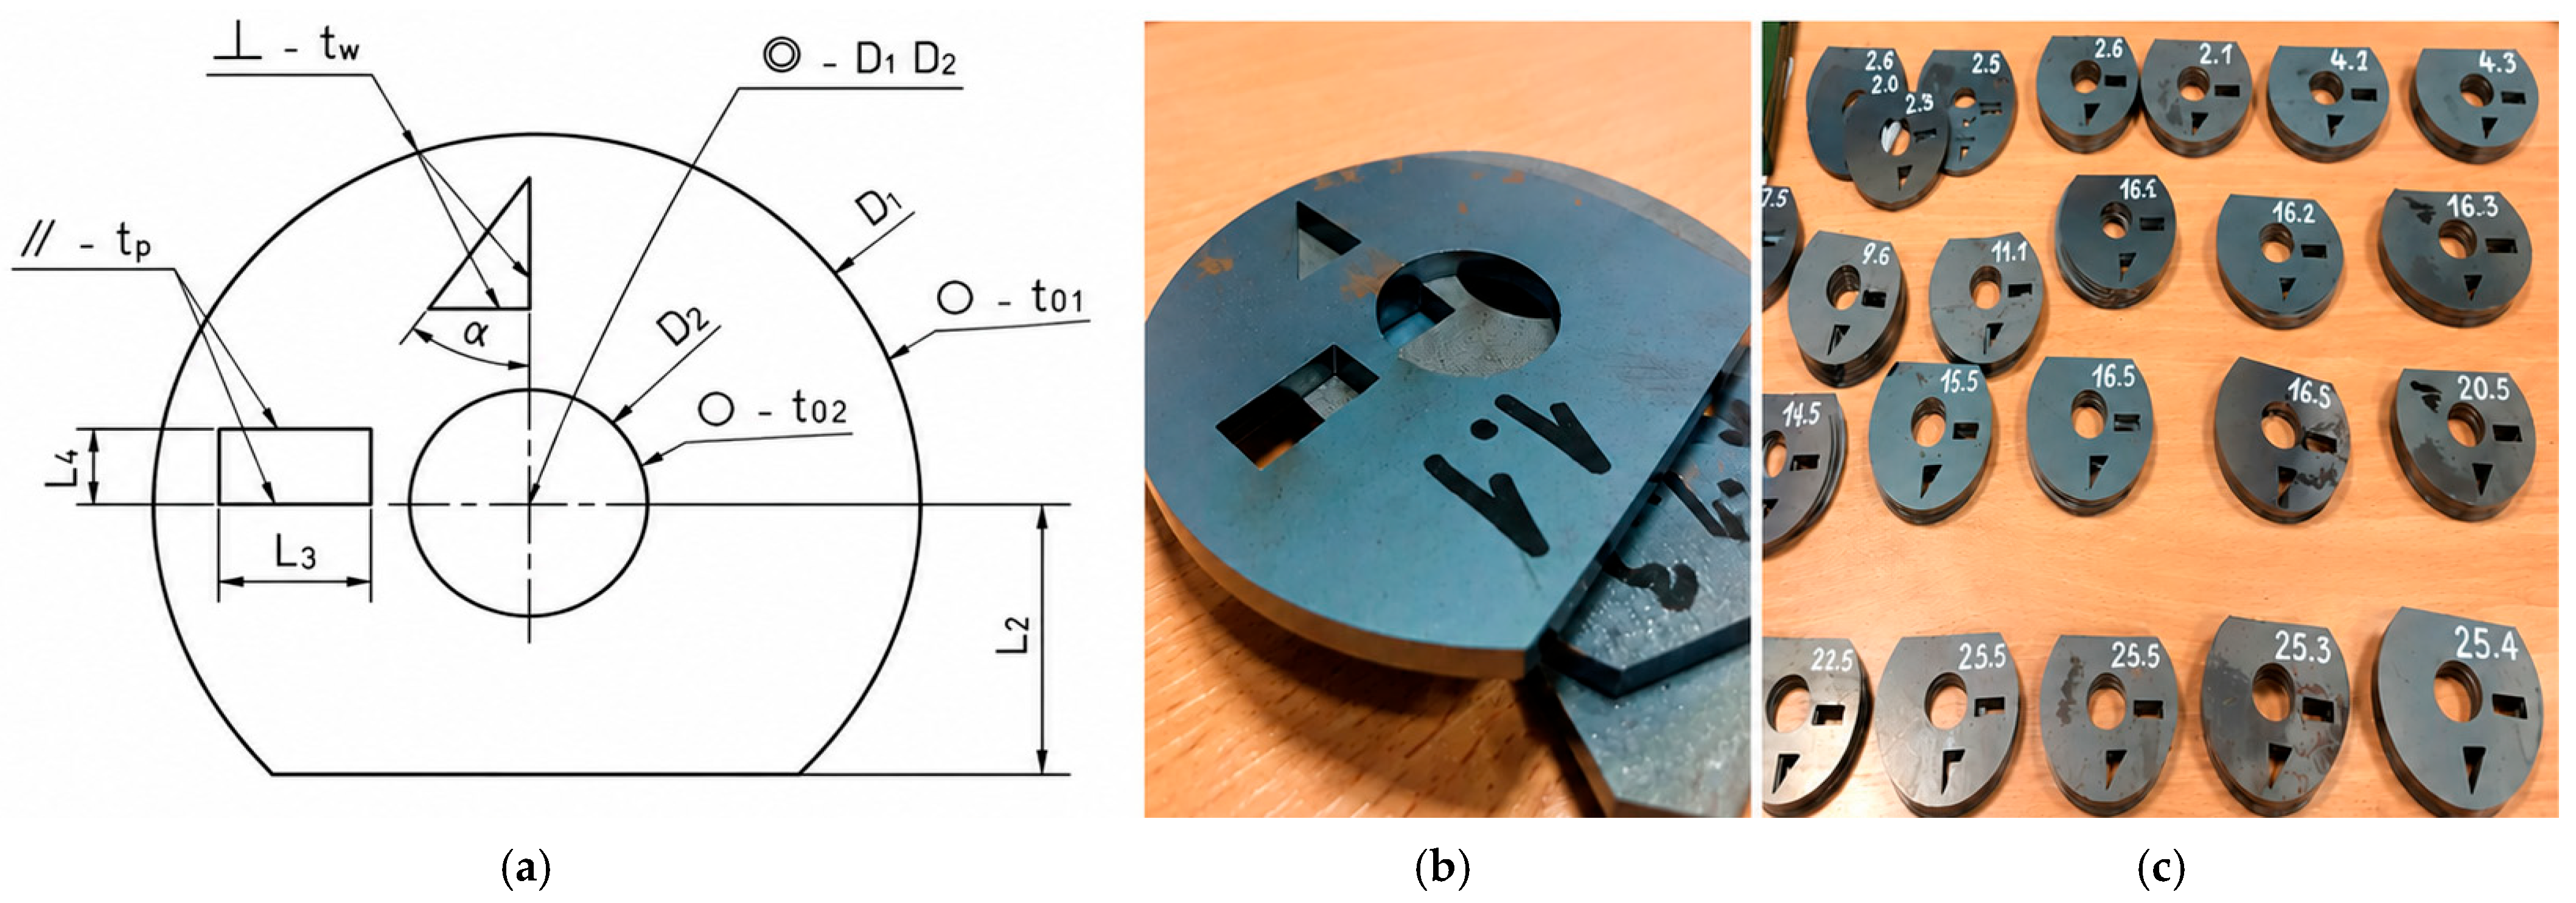
The dimensional accuracy of the cut parts was evaluated using four response variables, namely the deviation of the outer diameter (D1), the deviation of the inner diameter (D2), the linear deviation defined as the distance from the center to the cut edge (L2), and the length deviation of the rectangular feature (L3).
Each response represents a critical dimensional characteristic of the produced parts and enables a comprehensive evaluation of geometric accuracy. The evaluated dimensional characteristics are illustrated in Figure 2. The figure also includes representative laser-cut samples and a set of fabricated specimens, demonstrating the variability of geometrical features under different process conditions.
Figure 2.
Geometry of the tested sample and evaluated dimensional characteristics: (a) schematic representation of measured parameters (D1, D2, L2, L3); (b) representative laser-cut sample; (c) set of samples manufactured under different process parameter combinations.
2.5. Measurement Methodology
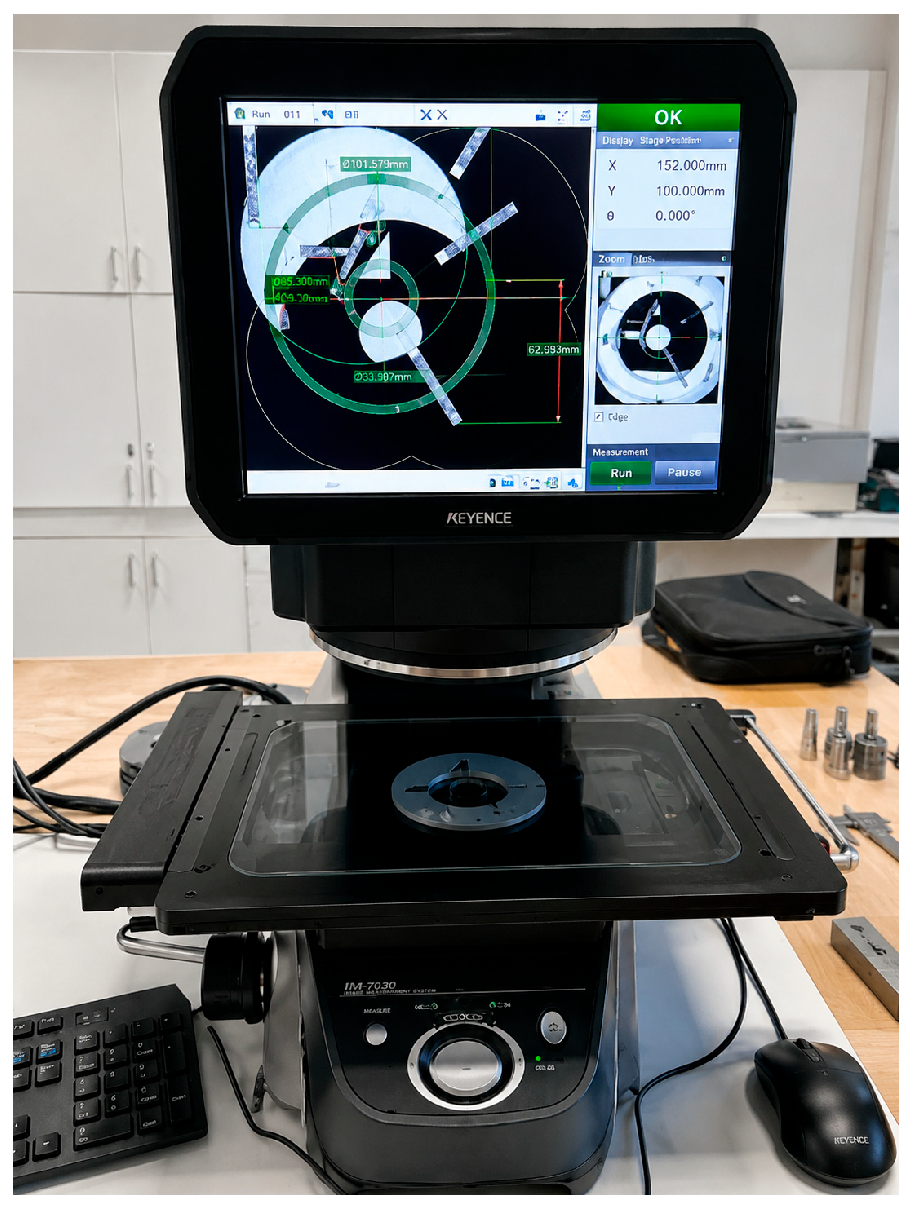
Dimensional measurements were performed using a high-precision optical measurement system Keyence IM-7030 (Keyence, Osaka, Japan). The measurement system used in this study is shown in Figure 3. This device enables fast, non-contact measurement of geometrical features with high accuracy and repeatability.
Figure 3.
Optical measurement system (Keyence IM-7030) used for high-precision, non-contact dimensional evaluation of laser-cut samples.
For each experimental condition, six independent samples were produced as repetitions of the same parameter combination. All samples were measured using the optical measurement system, and the reported values represent the average of all measurements. This approach ensures statistical reliability and minimizes measurement uncertainty. The individual dimensional deviations evaluated in this study (D1, D2, L2, and L3) were defined based on the geometry shown in Figure 2. The deviations were determined as the differences between the nominal CAD dimensions and the measured values obtained from the optical system.
Specifically, D1 represents the deviation of the outer circular contour, while D2 corresponds to the deviation of the inner circular feature. The linear deviations L2 and L3 were evaluated as distances between defined reference edges and geometric features of the cut specimen. This approach ensures a consistent and repeatable evaluation of dimensional accuracy across all experimental conditions.
2.6. Statistical Analysis
The measured data were processed using statistical methods to evaluate the significance of individual process parameters and their interaction effects on the selected responses. The analysis included the evaluation of main effects and interaction effects, supported by analysis of variance (ANOVA) to identify statistically significant factors.
The statistical evaluation was performed using Minitab software Version 22 (Minitab, State College, PA, USA). The significance of the investigated parameters was assessed based on p-values and standardized effects, allowing the identification of dominant factors influencing dimensional accuracy. In addition, regression models were developed to describe the relationship between process parameters and dimensional deviations, providing a basis for prediction and optimization of cutting conditions.
2.7. Microhardness Measurement
The influence of laser cutting on material properties was evaluated by microhardness measurements in the heat-affected zone (HAZ). Samples were prepared from selected cut edges to enable analysis of material changes induced by thermal loading during the cutting process.
Microhardness measurements were carried out using a microhardness tester Buehler system (Buehler, Lake Bluff, IL, USA) under controlled conditions. The measurements were performed across three characteristic regions of the material: the base material, the heat-affected zone (HAZ), and the region near the cut edge.
The measurements were conducted along a line perpendicular to the cut edge in order to capture the variation in hardness across the affected zone. This approach enabled the identification of changes in material properties caused by the laser cutting process.
These results confirm the presence of thermal effects during laser cutting and their influence on material properties.
3. Results
3.1. Evaluation of Dimensional Deviations
The dimensional accuracy of laser-cut parts was evaluated using four response variables (D1, D2, L2, and L3), representing key geometric deviations. The standard deviation of the measured values was typically below 0.02 mm for dimensional responses, indicating high measurement precision. The measured results indicate that all investigated process parameters significantly influence the dimensional accuracy of the produced parts.
Among the evaluated responses, the largest variability was observed for the outer diameter deviation (D1), while the inner diameter (D2) and linear dimensions (L2, L3) exhibited comparatively lower deviations. This suggests that external contours are more sensitive to process conditions than internal geometries.
3.2. Main Effects of Process Parameters
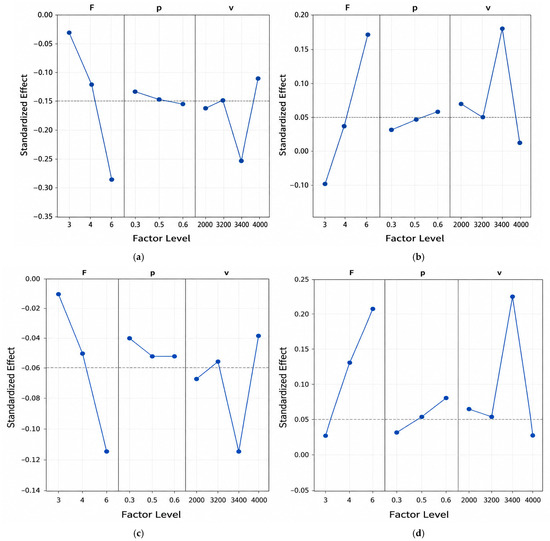
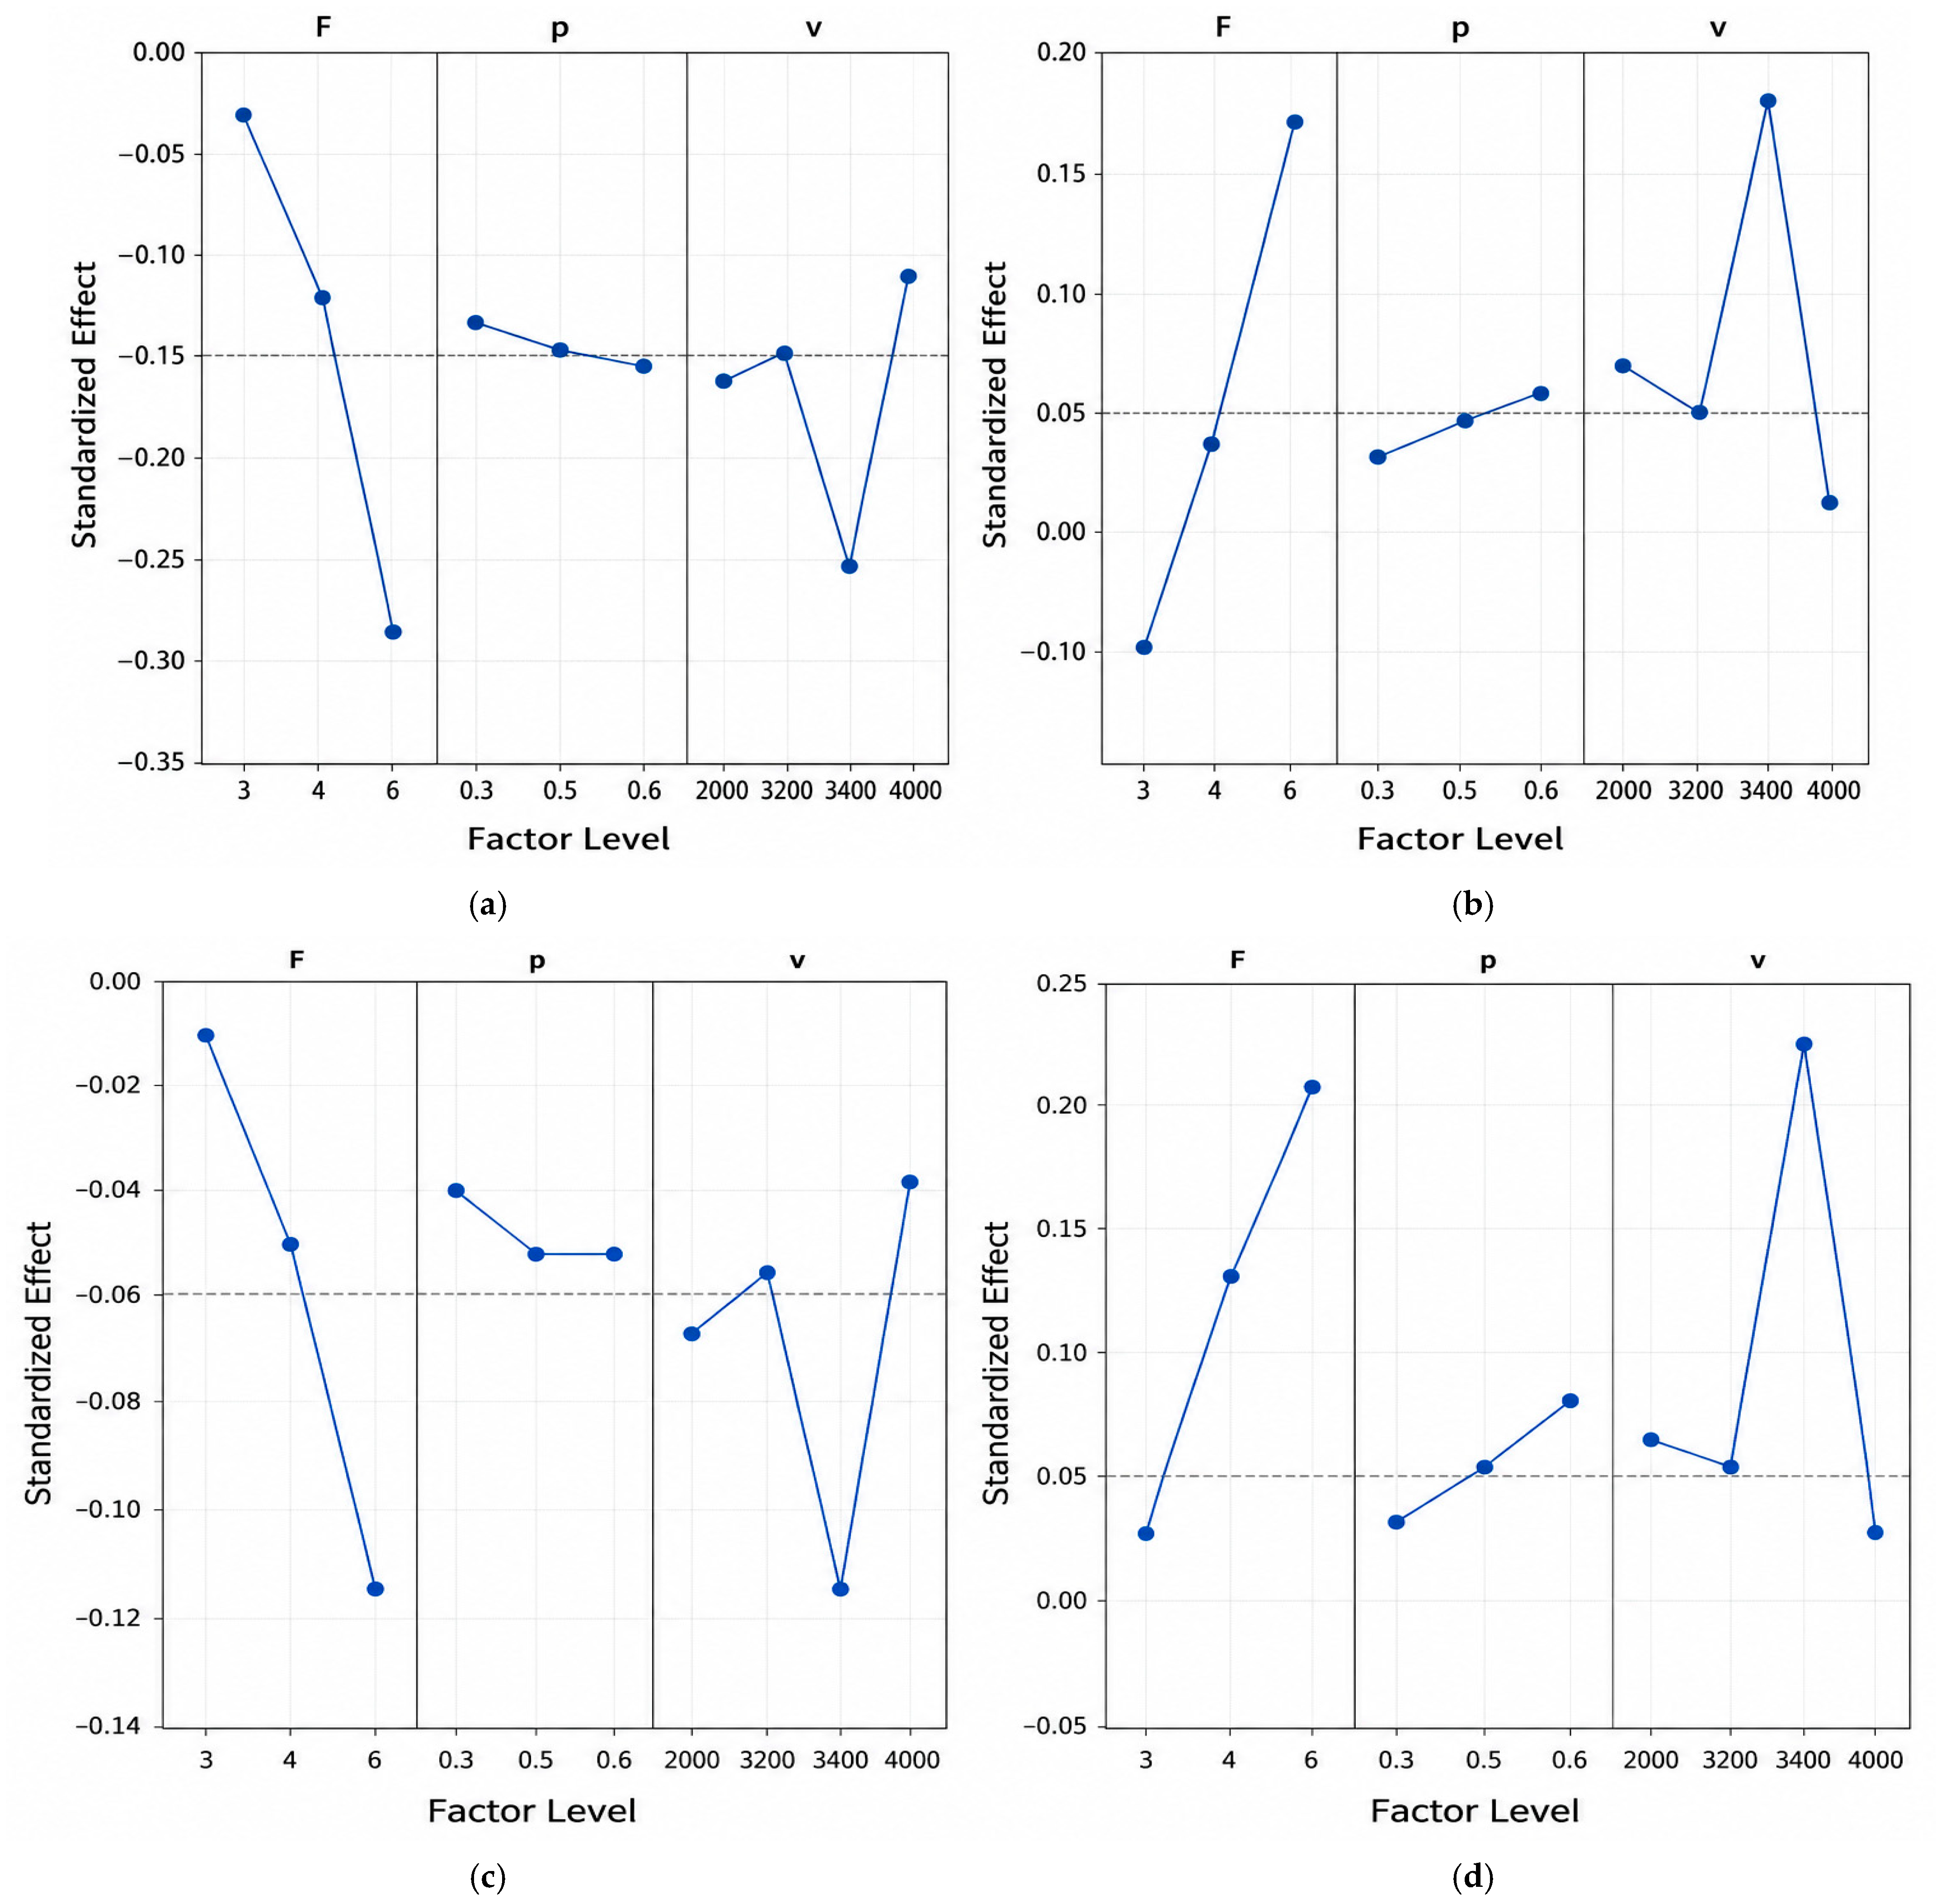
The analysis of main effects revealed that cutting speed and focal position have the most significant influence on dimensional accuracy. The main effects of process parameters on individual responses are shown in Figure 4. To quantify the influence of individual process parameters, a range analysis was performed based on the difference between the maximum and minimum values of each response within the investigated parameter levels. The horizontal axis in Figure 4 represents the investigated levels of process parameters, while the vertical axis shows the corresponding dimensional deviations.
Figure 4.
Main effects plots illustrating the influence of process parameters on dimensional deviations: (a) D1—outer diameter deviation; (b) D2—inner diameter deviation; (c) L2—linear deviation; (d) L3—length deviation of the rectangular feature. The horizontal axis represents the levels of process parameters (cutting speed v in mm/min, focal position F in mm, and assist gas pressure p in bar), while the vertical axis shows the corresponding dimensional deviations (mm).
The results indicate that cutting speed exhibits the largest variation range for most responses, confirming its dominant influence on dimensional accuracy. Focal position also shows a significant variation range, particularly for circular geometries, while assist gas pressure demonstrates a comparatively smaller effect.
These findings are consistent with the trends observed in the main effects plots (Figure 4) and indicate the relative importance of individual parameters.
An increase in cutting speed generally led to an increase in dimensional deviations. This effect can be attributed to insufficient energy input at higher speeds, resulting in incomplete material removal and instability of the cutting process.
Focal position was identified as a critical parameter affecting accuracy. Improper positioning of the focal point resulted in uneven energy distribution within the material thickness, leading to increased deviations and reduced cut quality.
Assist gas pressure showed a less pronounced but still noticeable effect. Higher gas pressure improved melt ejection and reduced dross formation, which contributed to improved dimensional stability.
3.3. Interaction Effects
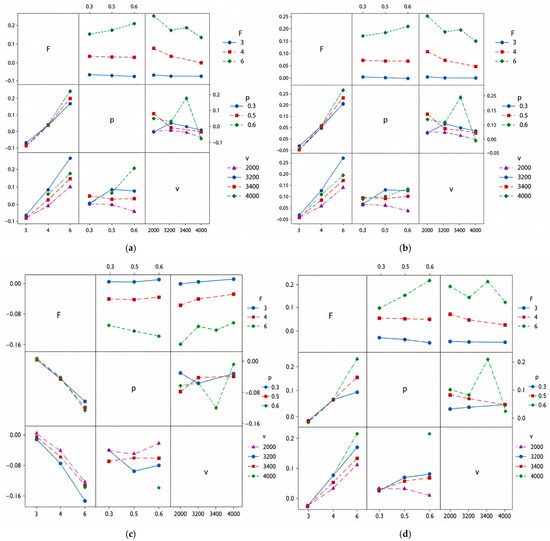
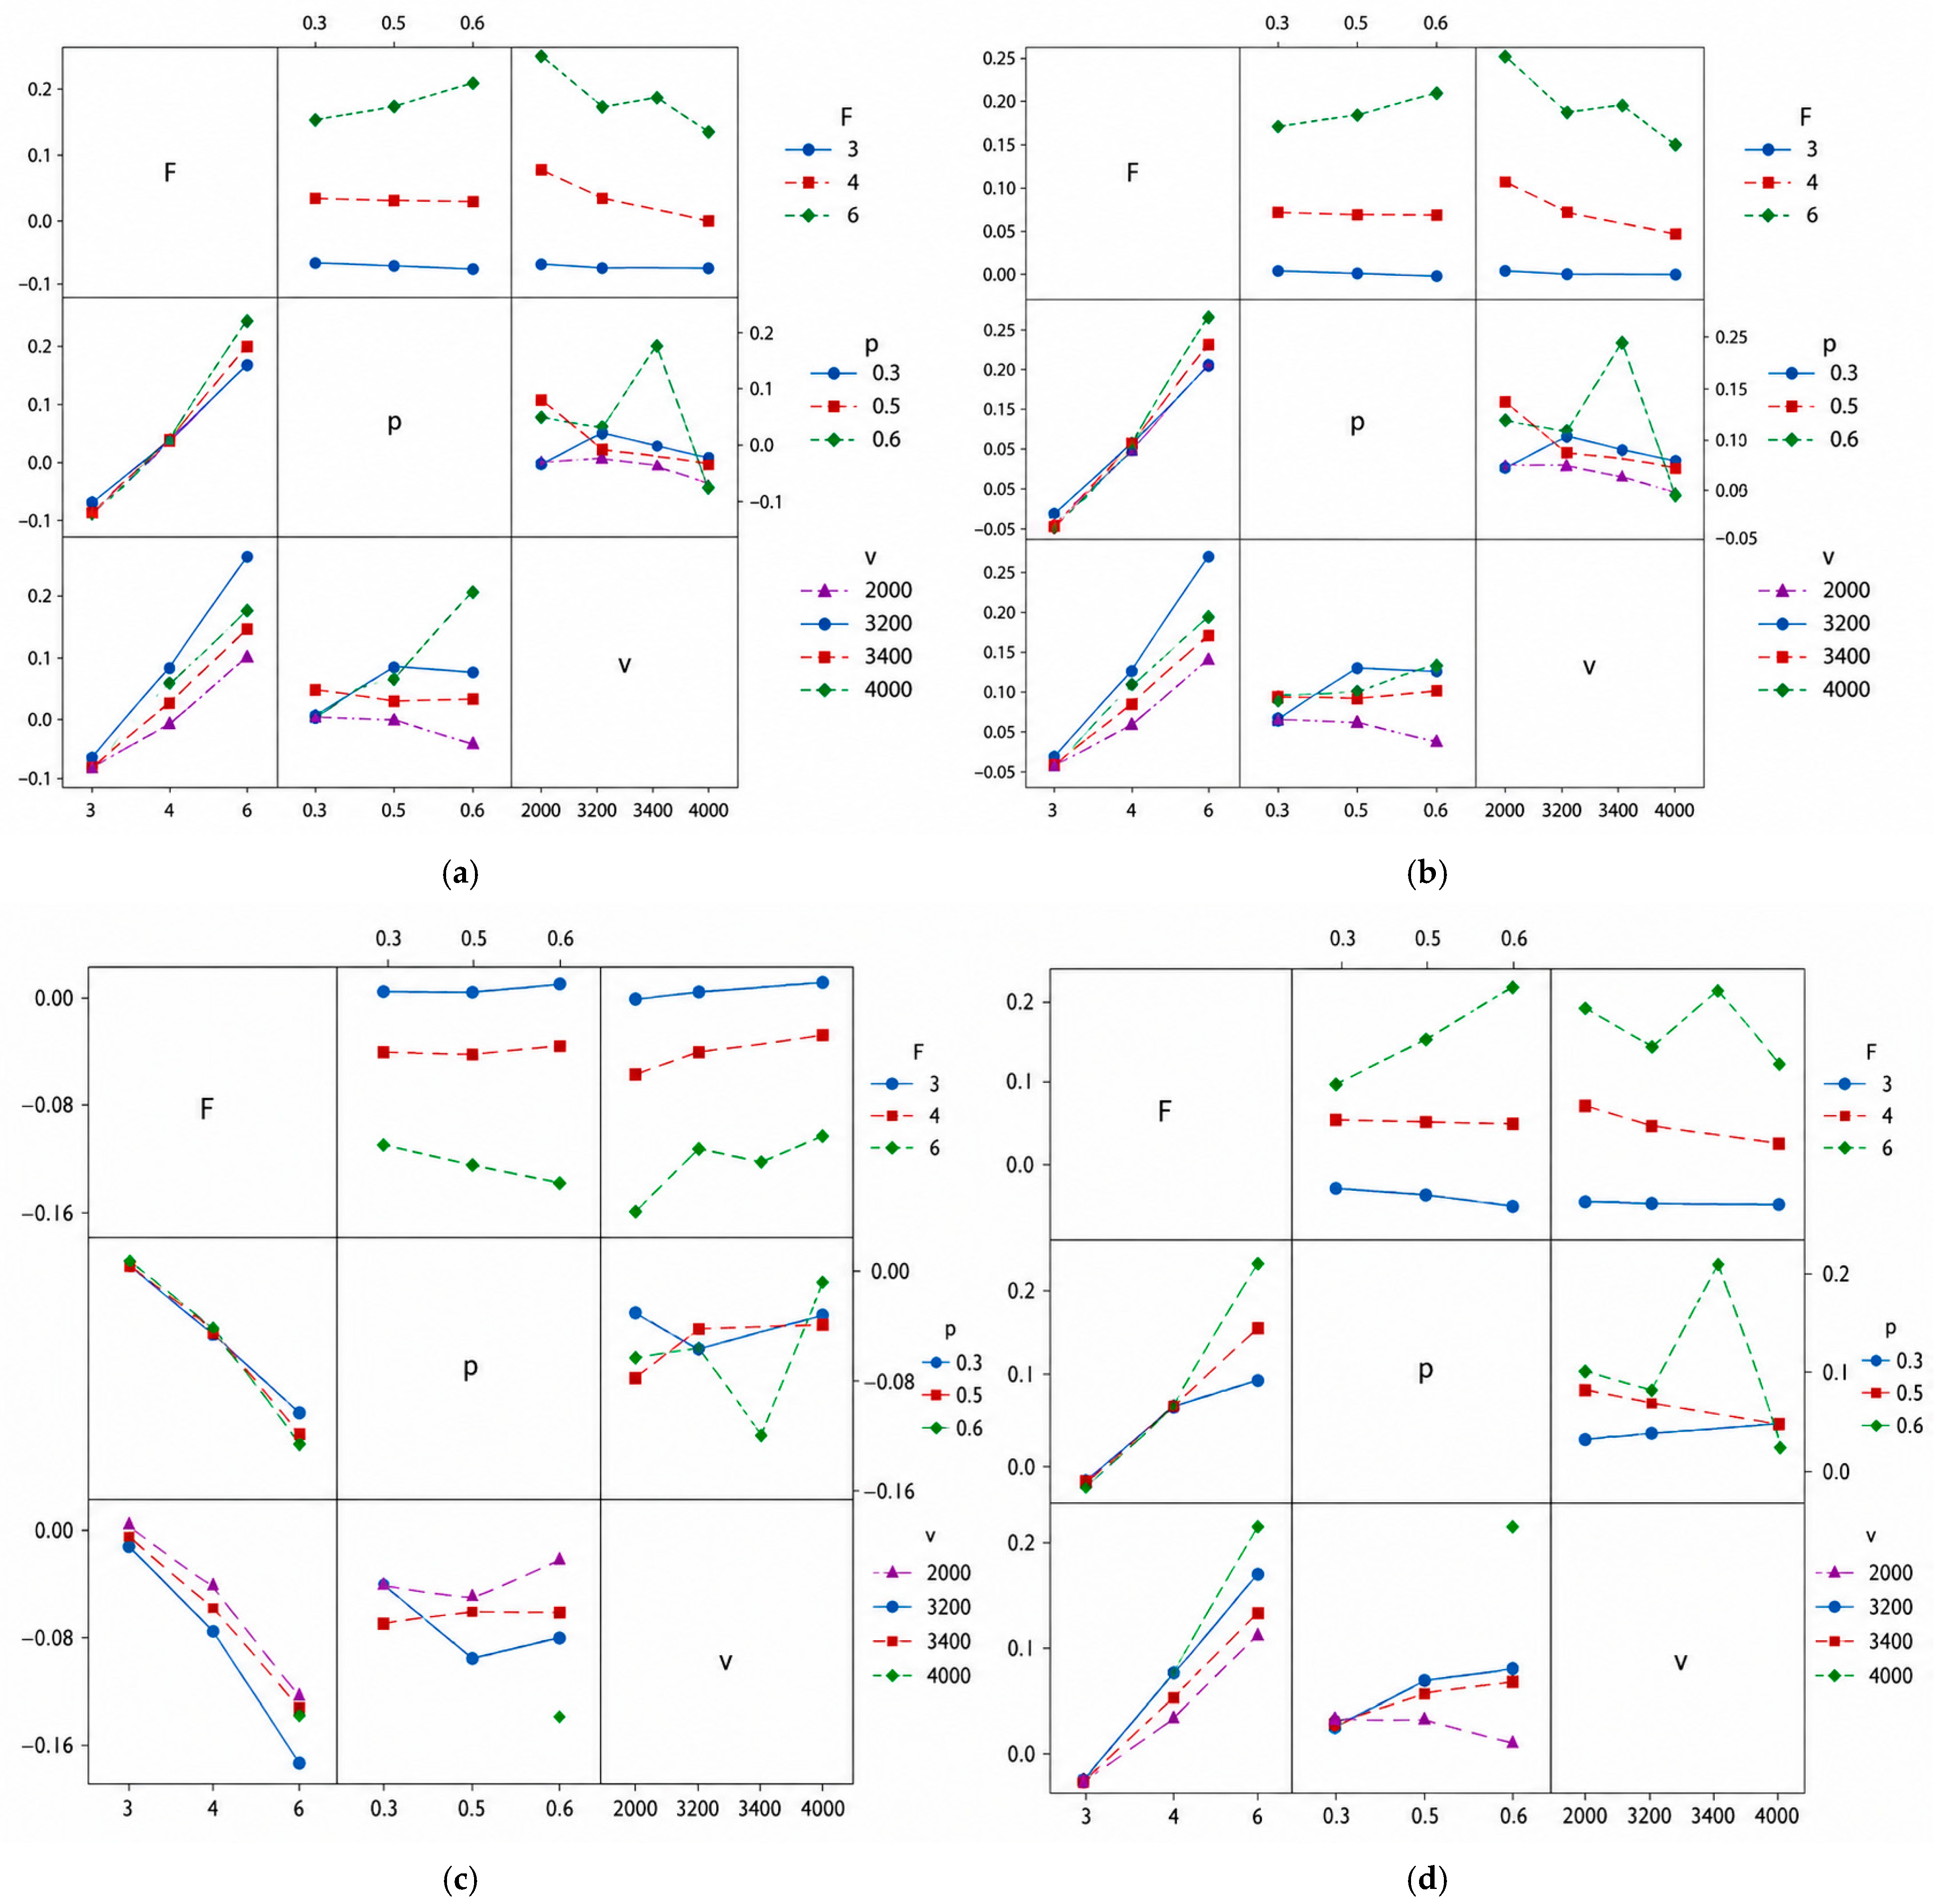
Interaction plots indicated that the combined effect of process parameters plays a significant role in determining the final dimensional accuracy. The interaction effects between process parameters on the evaluated dimensional responses are shown in Figure 5. Significant interaction effects were observed, particularly between cutting speed and focal position.
Figure 5.
Interaction plots illustrating the combined influence of process parameters on dimensional deviations: (a) D1—outer diameter deviation; (b) D2—inner diameter deviation; (c) L2—linear deviation; (d) L3—length deviation of the rectangular feature.
The interaction between cutting speed and focal position was found to be particularly significant. At higher cutting speeds, the influence of focal position became more pronounced, indicating that optimal focusing conditions are essential for maintaining accuracy under dynamic cutting conditions.
Similarly, the interaction between assist gas pressure and cutting speed can be explained by the coupled influence of process parameters on melt formation and ejection dynamics. Cutting speed directly controls the energy input per unit length, which determines the amount of material melted during the cutting process. At lower cutting speeds, higher energy input results in a larger volume of molten material and a more stable cutting front, allowing efficient melt removal even at lower gas pressures.
In contrast, at higher cutting speeds, the available energy input is reduced, leading to a smaller melt pool and increased sensitivity to process instabilities. Under these conditions, higher assist gas pressure becomes necessary to ensure sufficient melt ejection from the kerf. The interaction between these parameters therefore reflects the balance between energy input, melt generation, and removal efficiency, which together govern the stability of the cutting process and the resulting dimensional accuracy.
At lower cutting speeds, higher energy input leads to increased melting and a more stable cutting front. Under these conditions, the influence of focal position becomes less critical, as sufficient energy is available throughout the material thickness. However, at higher cutting speeds, the available energy is reduced, and the role of focal position becomes more pronounced. Improper focal positioning in such conditions leads to insufficient energy concentration, resulting in unstable cutting and increased dimensional deviations.
In addition, the interaction between cutting speed and assist gas pressure is closely related to melt ejection efficiency. These findings indicate that parameter optimization cannot be performed independently, and interactions must be considered to achieve optimal results.
3.4. Statistical Significance (ANOVA and Pareto Analysis)
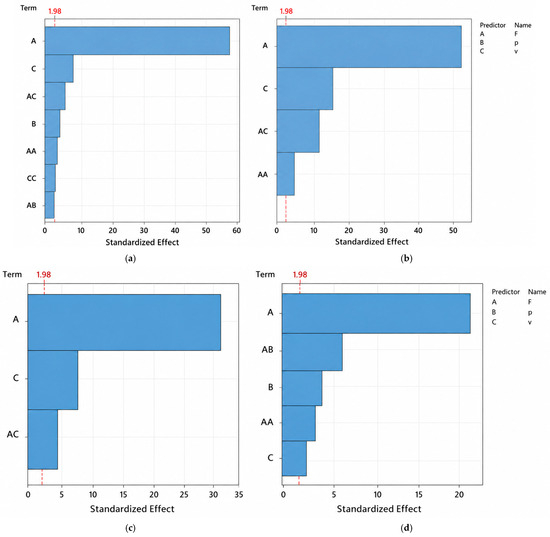
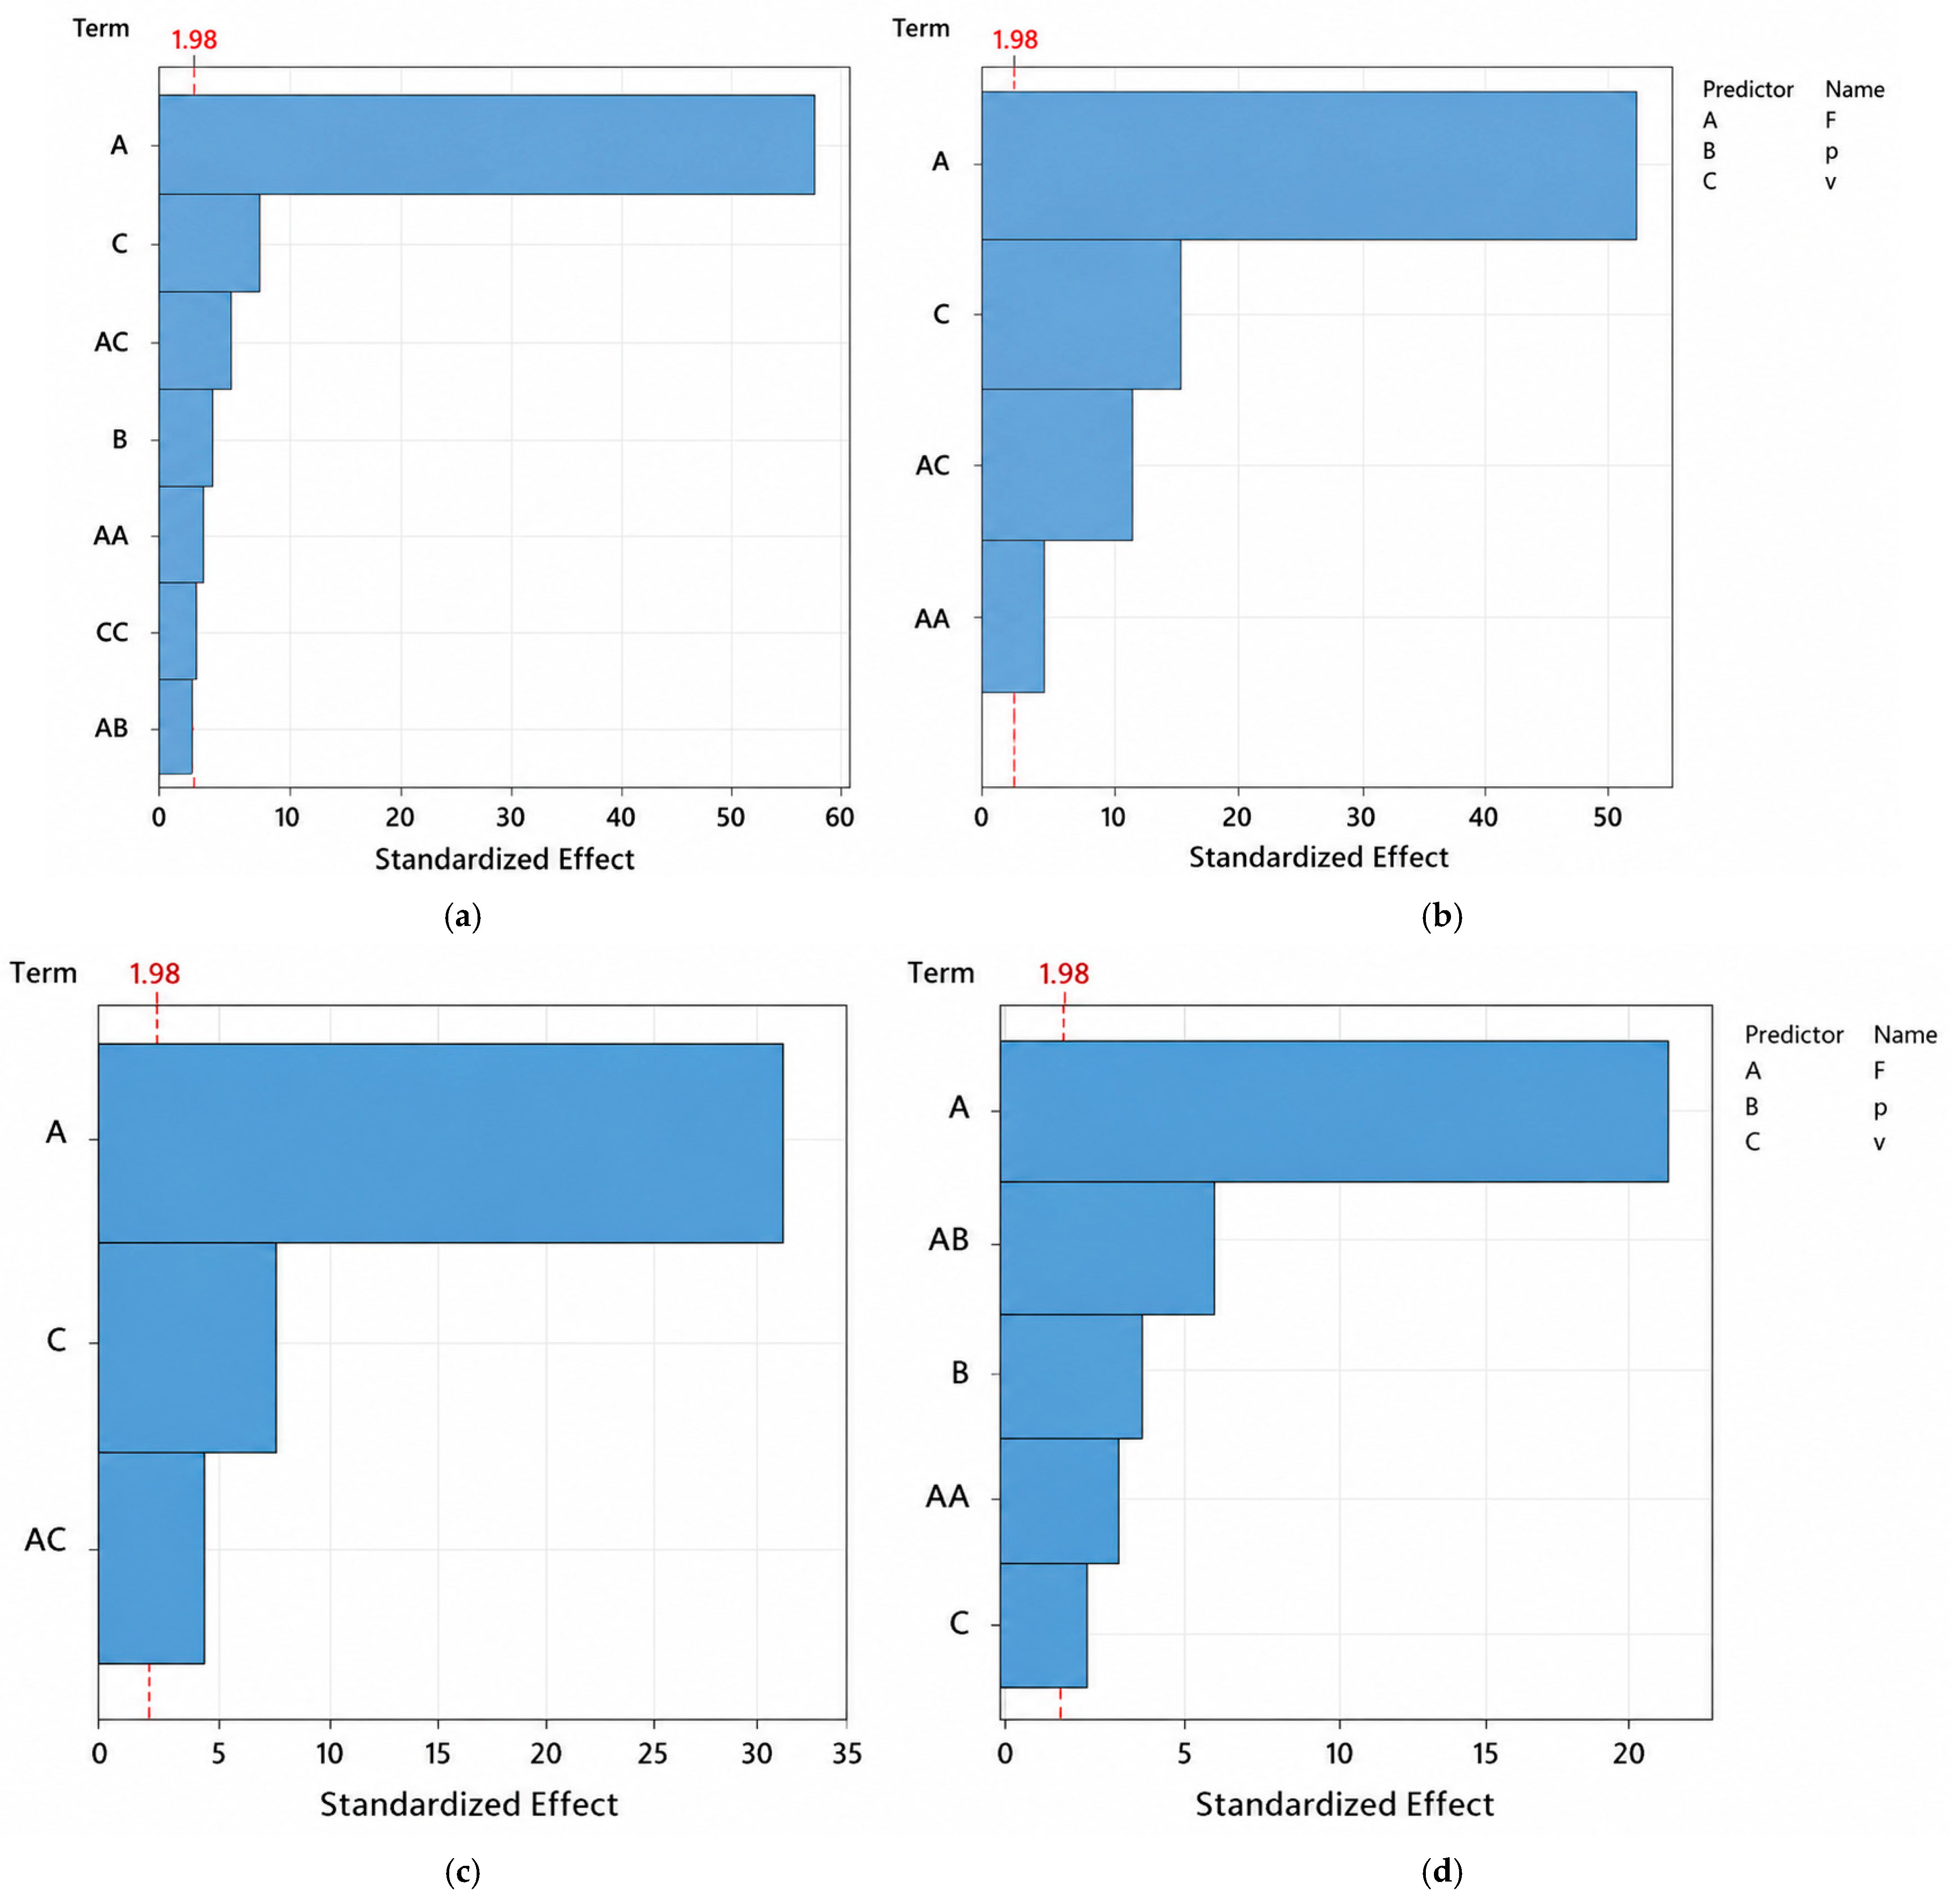
The statistical analysis confirmed the significance of the investigated parameters. The significance of process parameters is illustrated by Pareto charts (Figure 6).
Figure 6.
Pareto charts of standardized effects illustrating the significance of process parameters and their interactions on dimensional deviations: (a) D1—outer diameter deviation; (b) D2—inner diameter deviation; (c) L2—linear deviation; (d) L3—length deviation of the rectangular feature.
Pareto charts of standardized effects indicated that cutting speed is the dominant factor affecting dimensional deviations, followed by focal position as the second most significant parameter, while assist gas pressure exhibits a secondary influence.
Analysis of variance (ANOVA) demonstrated that the main effects of cutting speed and focal position are statistically significant (p < 0.05), while selected interaction terms also contribute significantly to the model.
The developed regression models showed good agreement with the experimental data, indicating that the selected factors capture the dominant trends of the process within the investigated conditions.
The statistical significance of the investigated parameters was further evaluated using analysis of variance (ANOVA), as summarized in Table 3.
Table 3.
Analysis of variance (ANOVA) for response D1 (outer diameter deviation).
The ANOVA results indicate that focal position is the most significant factor affecting the outer diameter deviation (D1), followed by cutting speed. Both factors exhibit highly significant effects (p < 0.05). Additionally, interaction effects between parameters are statistically significant, confirming the importance of considering parameter combinations in process optimization. Although the regression term is highly significant and the identified factors explain a substantial portion of the observed variability, the lack-of-fit test for response D1 was also statistically significant (p < 0.05). This indicates that the developed model captures the main trends of the process but does not fully capture all sources of variability within the investigated experimental domain. Such behavior may be related to additional nonlinear effects or secondary process influences that were not explicitly included in the model. Nevertheless, considering the high F-values of the main factors and the strong predictive performance of the regression model, the model remains suitable for identifying dominant relationships and for practical process optimization. The presence of lack-of-fit suggests that additional factors or higher-order effects may influence the process and were not captured within the current model formulation.
Similar trends were observed for the remaining responses (D2, L2, and L3), as summarized in Table 4. The focal position was identified as the most significant factor for all evaluated responses. Cutting speed showed a strong influence on D1, D2, and L2, while gas pressure had a significant effect particularly on response L3. For response D2, gas pressure alone was found to be statistically insignificant; however, its interaction with focal position was significant. These findings highlight the importance of considering both individual effects and parameter interactions when optimizing the laser cutting process.
Table 4.
Summary of ANOVA results for all evaluated responses.
3.5. Regression Modeling and Process Optimization
A regression analysis was performed to describe the relationship between process parameters and dimensional deviations. The developed models enable prediction of process behavior and provide a basis for optimization of cutting conditions. The predictive accuracy of the developed regression models was evaluated using the mean absolute error (MAE). The MAE value for response D1 was 0.258 mm, while for response D2 it reached 0.106 mm, indicating good agreement between predicted and experimental values.
The Mean Absolute Percentage Error (MAPE) was also considered as an additional performance indicator; however, due to the presence of very small response values close to zero, it resulted in unrealistically high values and was therefore not suitable for this dataset. For this reason, MAE was used as a more appropriate metric for evaluating model accuracy.
The lower MAE value for D2 indicates higher prediction accuracy for internal geometries compared to external features, which is consistent with the observed sensitivity of outer contours to process parameters.
Considering the dimensional scale of the investigated features and the inherent variability of the laser cutting process, the obtained MAE values can be considered acceptable and suitable for practical applications.
The goodness of fit of the developed regression models was further evaluated using the coefficient of determination (R2). For response D1, the model achieved an R2 value of 97.26%, with an adjusted R2 of 97.13% and a predicted R2 of 96.92%. Similarly, for response D2, the R2 value reached 96.61%, with an adjusted R2 of 96.48% and a predicted R2 of 96.28%.
These high R2 values indicate a strong correlation between the predicted and experimental data and suggest that the developed models adequately capture the dominant trends of the process. The close agreement between R2, adjusted R2, and predicted R2 further suggests that the models are robust and not affected by overfitting. The combination of low MAE values and high R2 indicators suggests that the developed regression models provide a useful approximation of the process behavior within the investigated experimental domain. The evaluation was focused on the most critical dimensional responses (D1 and D2), which are representative for assessing the overall model performance.
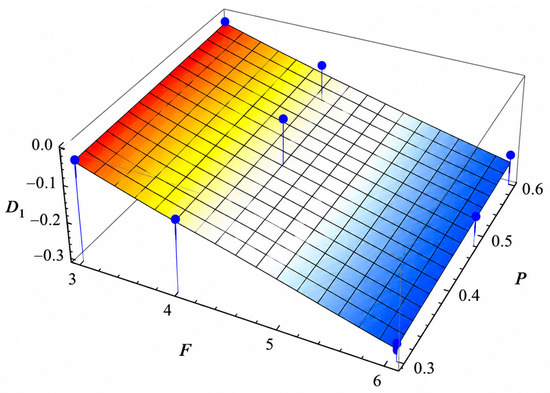
As a representative example, the regression model for the outer diameter deviation (D1) is given by Equation (1):
D1 = 0.23170 − 0.15556 F + 0.18624 p + 3.82573 × 10 − 5 v + 0.005734 F2 − 1.02654 × 10 − 8 v2 − 0.03084 Fp + 9.77515 × 10 − 6 Fv
The model indicates that focal position (F) and cutting speed (v) have a dominant influence on the outer diameter deviation. The presence of quadratic terms confirms nonlinear behavior of the process, while interaction terms (Fp, Fv) highlight the combined influence of parameters.
The corresponding response surface plot is shown in Figure 7.
Figure 7.
Response surface plot illustrating the combined effect of focal position (F) and gas pressure (p) on the outer diameter deviation (D1), based on the developed regression model. The color gradient represents the predicted response magnitude, where warmer colors indicate higher values and cooler colors indicate lower values.
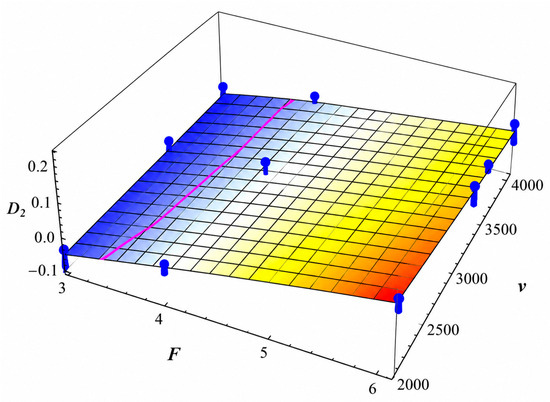
To further demonstrate the response-dependent behavior of the process, the regression model for the inner diameter deviation (D2) is presented in Equation (2):
D2 = −0.5728 + 0.1989 F + 0.000055 v − 0.00663 F2 − 0.000020 Fv
In this case, gas pressure does not appear as an independent significant factor, which is consistent with the ANOVA results. However, the interaction between focal position and cutting speed remains significant, indicating that the influence of cutting speed depends on the selected focal position.
The corresponding response surface plot is shown in Figure 8.
Figure 8.
Response surface plot illustrating the combined effect of focal position (F) and cutting speed (v) on the inner diameter deviation (D2), based on the developed regression model. The color gradient represents the predicted response magnitude, where warmer colors indicate higher values and cooler colors indicate lower values.
For completeness, the regression models developed for the remaining responses (L2 and L3) also demonstrated satisfactory predictive capability. The coefficient of determination reached R2 = 87.32% (R2_pred = 86.57%) for L2 and R2 = 80.98% (R2_pred = 78.70%) for L3.
In terms of prediction accuracy, the mean absolute error (MAE) was 0.094 mm for L2 and 0.213 mm for L3. The lower MAE value for L2 indicates a higher prediction accuracy for linear deviations, while the higher error observed for L3 reflects increased sensitivity of this response to process variability.
Despite this difference, the obtained results indicate that the developed models adequately capture the dominant behavior of the process for all evaluated responses within the investigated experimental domain.
The optimization of process parameters was performed based on the developed regression models using response surface methodology (RSM). The objective of the optimization was to minimize dimensional deviations (D1, D2, L2, and L3) within the investigated parameter range.
Optimal parameter combinations were identified by analyzing the response surfaces and locating regions corresponding to minimal or near-zero deviations. The reported optimal values therefore represent model-based predictions within the defined experimental domain, rather than independent experimental validation points.
This approach enables the identification of parameter settings that may provide improved dimensional accuracy under the given conditions.
3.6. Microhardness Evaluation
Microhardness measurements confirmed the presence of thermal effects in the heat-affected zone (HAZ), resulting in significant changes in material properties. Although the primary focus of this study is on dimensional accuracy, the evaluation of microhardness provides important insight into the thermal effects occurring during the laser cutting process. These thermal effects are directly related to energy input and heat transfer, which also influence melt formation, material removal, and consequently the dimensional accuracy of the cut parts.
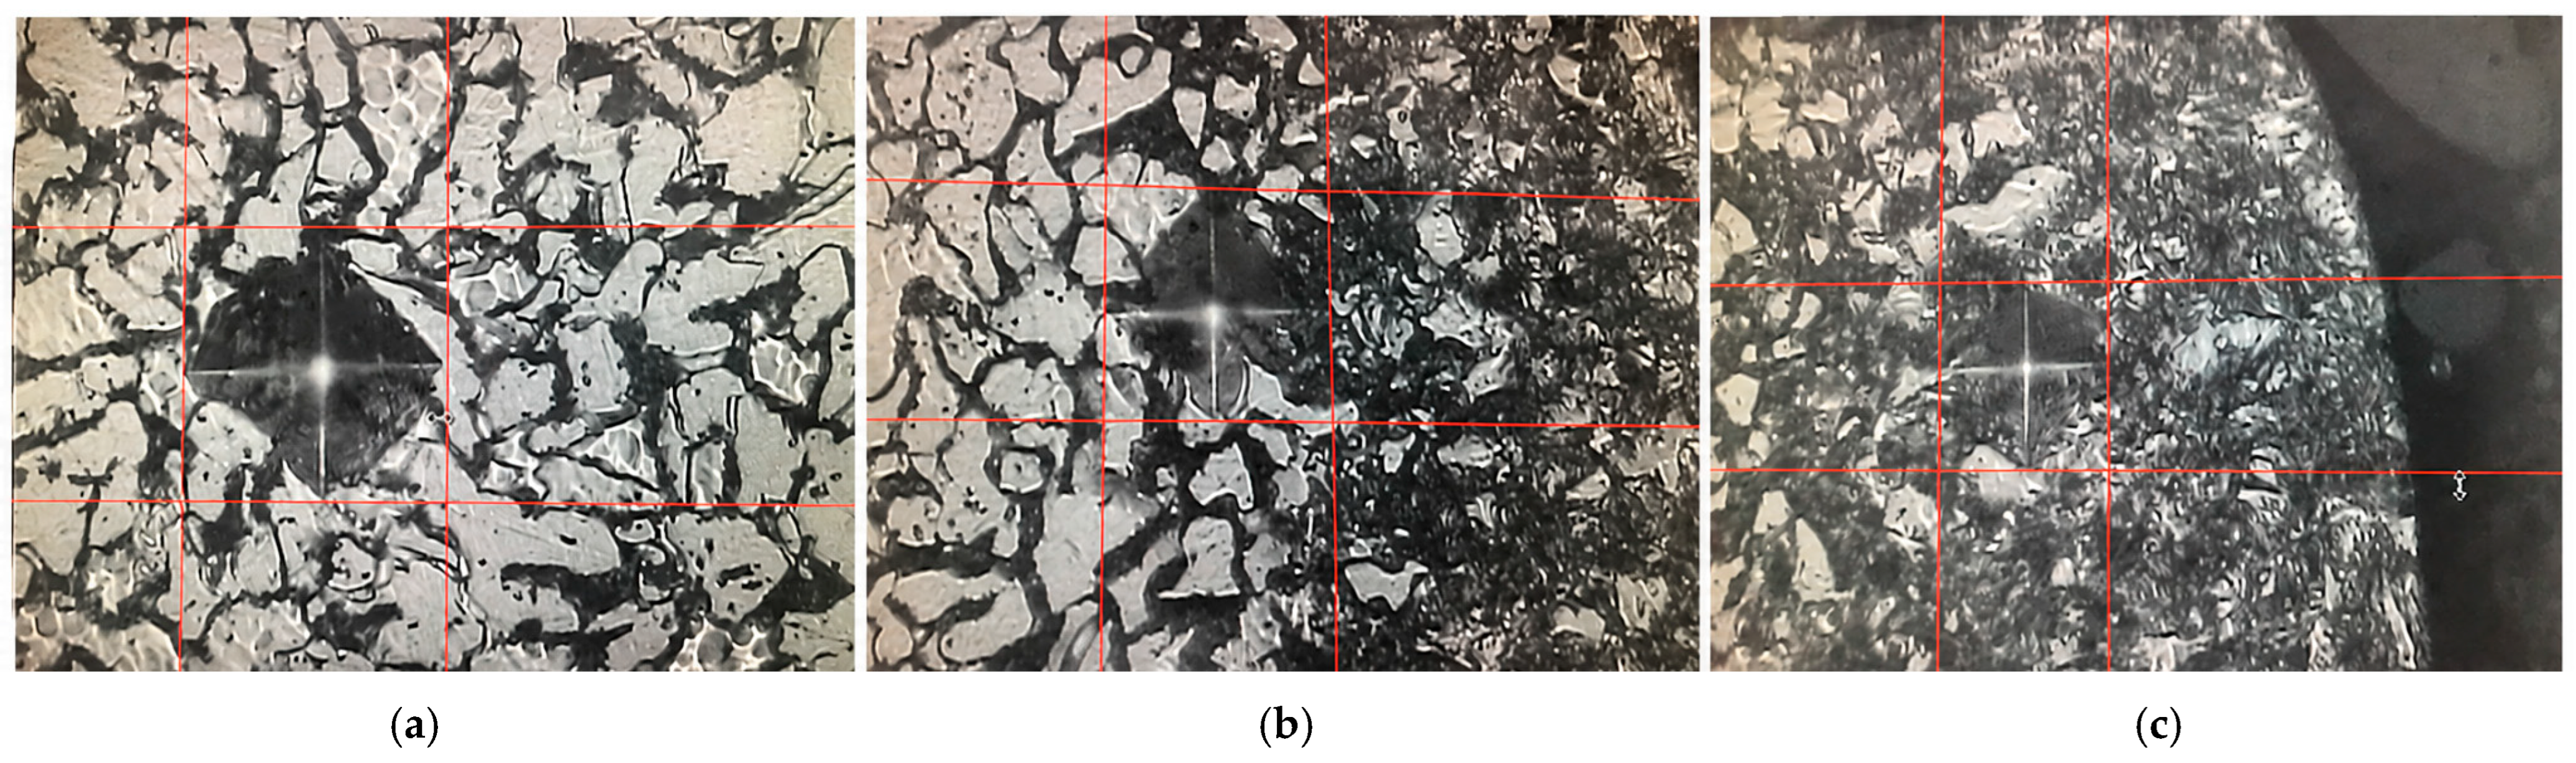
Therefore, the analysis of microhardness serves as a complementary indicator of process stability and thermal loading, enabling a deeper understanding of the mechanisms affecting dimensional deviations. The variation in hardness across different regions is illustrated in Figure 9.
Figure 9.
Microstructural evolution across the heat-affected zone (HAZ) after laser cutting: (a) base material (HV ≈ 153); (b) heat-affected zone (HV ≈ 310); (c) region near the cut edge (HV ≈ 428). The red lines indicate the optical measurement grid used during microhardness testing.
A significant increase in hardness was observed from the base material toward the cut edge. The base material exhibited a hardness of approximately 153 HV, while the heat-affected zone reached approximately 310 HV. The highest hardness values, approximately 428 HV, were measured in the region near the cut edge.
The observed increase in hardness is likely associated with rapid thermal cycles occurring during laser cutting. These thermal effects may lead to changes in the microstructural state of the material, which can influence hardness values.
In the base material, the microstructure is predominantly composed of ferrite and pearlite, which corresponds to lower hardness values. In the heat-affected zone, thermal exposure may result in microstructural modifications and local refinement, contributing to increased hardness.
In the region near the cut edge, the material is subjected to the highest thermal gradients and cooling rates, which may promote further microstructural changes and localized hardening.
Therefore, the increase in hardness can be interpreted as a consequence of thermally induced microstructural evolution, although detailed characterization of these changes would require dedicated metallographic analysis.
These results confirm that the variation in microhardness is directly linked to the microstructural evolution across the heat-affected zone, as illustrated in Figure 9. The microstructural analysis (Figure 9) confirms the transition from the original ferrite–pearlite structure of the base material to a refined and hardened structure in the heat-affected zone and near the cut edge.
Although representative values are reported for each region, the measurements were performed along a continuous line across the material, revealing a gradual increase in hardness from the base material toward the cut edge.
The results indicate that while laser cutting provides high geometric precision, the associated thermal effects, reflected in microhardness changes, are closely linked to process conditions that also govern dimensional accuracy. The increased hardness may improve wear resistance; however, it can also lead to increased brittleness and reduced toughness. Therefore, these effects must be considered in applications where mechanical performance and structural integrity are critical. However, a detailed analysis of phase composition and microstructural transformations was not performed in this study and is beyond its scope.
4. Discussion
The results of this study confirm that dimensional accuracy in fiber laser cutting is strongly influenced by process parameter selection; however, the effect of individual parameters varies depending on the evaluated response. This response-dependent behavior highlights the complexity of the cutting process and the necessity of multi-parameter optimization.
The analysis of variance demonstrated that focal position is the most significant factor affecting all investigated dimensional deviations. This dominant influence can be attributed to its direct effect on laser energy distribution within the material thickness. Proper focal positioning ensures stable cutting conditions and uniform kerf formation, whereas deviations lead to irregular energy density and increased dimensional inaccuracies. Similar observations have been reported in recent studies, which emphasize the critical role of focal position in determining cut quality and dimensional precision [1,2].
Cutting speed was identified as the second most influential parameter, particularly for circular geometries. Its influence is associated with the energy input per unit length and the interaction time between the laser beam and the material. Higher cutting speeds reduce the available energy for complete material melting and removal, resulting in increased dimensional deviations and instability of the cutting front. These findings are consistent with previous studies reporting a strong relationship between cutting speed, kerf geometry, and surface quality [2,14].
The influence of assist gas pressure was found to be response-dependent. While its direct effect on certain responses was limited, its interaction with focal position and cutting speed was significant. This indicates that gas pressure primarily contributes to melt ejection efficiency and process stability rather than directly affecting dimensional accuracy. Similar conclusions have been reported in the literature, where assist gas parameters are identified as secondary but essential factors influencing cut edge quality and process consistency [6,14].
The presence of statistically significant interaction effects further confirms that fiber laser cutting is a multivariable process in which the combined influence of parameters must be considered. In particular, interactions between focal position and cutting speed, as well as focal position and gas pressure, were found to significantly affect selected responses. This behavior is in agreement with studies employing design of experiments (DOE), which highlight the importance of interaction terms for accurate modeling and process optimization [13,15]. Although the input parameters were defined independently within the experimental design, their physical influence on the cutting process is inherently interconnected. In particular, cutting speed, focal position, and assist gas pressure jointly determine the effective energy distribution, melt dynamics, and material removal mechanisms.
For example, cutting speed directly affects the energy input per unit length, while focal position controls the spatial distribution of this energy within the material thickness. At the same time, assist gas pressure influences melt ejection efficiency, which is strongly dependent on both the amount of generated melt (related to energy input) and its viscosity (affected by temperature gradients).
Therefore, the effect of each parameter cannot be considered in isolation, as changes in one parameter may alter the influence of others. This behavior is reflected in the statistically significant interaction terms identified in the ANOVA analysis, particularly for combinations of focal position with cutting speed and gas pressure.
These findings confirm that the dimensional accuracy of laser cutting is governed by a coupled multi-parameter system, where both direct and indirect effects of input parameters must be considered.
Microhardness measurements confirmed the presence of thermal effects in the heat-affected zone, with a significant increase in hardness observed from the base material toward the cut edge. This increase is associated with rapid thermal cycles during laser cutting, leading to microstructural transformations such as phase changes and localized hardening. Similar findings have been reported in studies focused on laser-induced thermal effects in metallic materials [3,11].
The observed increase in microhardness is consistent with variations in thermal input associated with different cutting conditions. Lower cutting speeds correspond to higher energy input per unit length, leading to more pronounced thermal effects and higher cooling rates near the cut edge. These conditions promote localized hardening, which is reflected in the increased hardness values measured in the heat-affected zone and near the cut edge.
To better understand the thermal effects observed in the heat-affected zone (HAZ), the effective energy input during the cutting process was further evaluated.
Since the laser power was kept constant at 3000 W and the beam diameter was 0.15 mm, the energy input was expressed in terms of line energy and theoretical energy density. The calculated values are summarized in Table 5.
Table 5.
Calculated energy input parameters for the applied cutting speeds.
These results confirm that lower cutting speeds correspond to higher energy input into the material, which contributes to more pronounced thermal effects and explains the increase in hardness observed in the HAZ.
From a practical perspective, the results indicate that achieving high dimensional accuracy requires careful control of focal position, supported by appropriate selection of cutting speed and assist gas pressure depending on the specific geometry. Circular features are more sensitive to cutting speed and focusing conditions, while linear features are additionally influenced by gas pressure. This highlights the need for geometry-specific parameter optimization in industrial applications.
It is important to distinguish between statistical significance and engineering significance when interpreting the obtained results. While several factors and interactions were found to be statistically significant based on ANOVA analysis, their practical impact on dimensional accuracy depends on the magnitude of the observed deviations.
From an engineering perspective, only those parameter effects that lead to meaningful changes in dimensional accuracy are relevant for process optimization. In this study, the most influential parameters, particularly focal position and cutting speed, showed both statistical significance and practical impact, as they resulted in measurable changes in dimensional deviations.
The obtained dimensional deviations were further evaluated with respect to industrial quality criteria defined in EN ISO 9013. According to this standard, dimensional tolerances for thermally cut parts with a thickness of 3 mm typically fall within ±0.1–0.3 mm for tolerance class 1 and ±0.3–0.7 mm for tolerance class 2.
The results of the present study show that the deviation of the inner diameter (D2) corresponds predominantly to tolerance class 1, indicating high cutting precision. In contrast, the outer diameter deviation (D1) approaches the upper limit of tolerance class 1 and partially extends toward class 2, reflecting higher sensitivity of external geometries to process conditions.
These findings confirm that the achieved dimensional accuracy is consistent with industrial standards and indicates that the applied fiber laser cutting process is capable of meeting the requirements defined by EN ISO 9013.
It should be noted that although the developed models show good agreement with experimental data and adequate predictive capability, the significant lack-of-fit observed for selected responses indicates that additional factors or nonlinear effects may still influence the process behavior.
Overall, the findings of this study provide a detailed understanding of the relationship between process parameters and dimensional accuracy in fiber laser cutting. The integration of experimental design and statistical analysis proved to be an effective approach for process optimization and offers practical guidance for improving cutting precision and process efficiency in industrial practice.
The contribution of this study lies not only in the identification of significant process parameters but also in the development of regression equations and mathematical models describing the behavior of individual responses. These models enable the prediction and optimization of process parameters for the investigated material, allowing the minimization of dimensional deviations.
For selected responses, the developed models predicted the possibility of approaching near-zero deviation under specific parameter combinations, represented by optimization curves. In particular, for response D2, near-zero deviation was predicted at a focal position of F = 3 mm and a cutting speed of v = 654.40 mm·min−1. Similarly, for response L3, the optimal condition corresponding to near-zero deviation was predicted at a focal position of F = 3 mm and an assist gas pressure of p = 0.11 bar.
These results highlight the practical applicability of the developed models, as they may provide guidance for parameter selection in industrial practice to achieve near-zero-dimensional deviations during laser cutting of the investigated material.
It should be noted that some of the predicted optimal parameter values fall outside the experimentally investigated range. These results represent model-based extrapolations and should therefore be interpreted with caution. Experimental validation of such conditions is required before their practical application.
A limitation of this study is that only a limited range of process parameters and material thickness was considered. Additional factors such as laser power, nozzle diameter, and material variability may also influence the cutting process and should be investigated in future research.
5. Conclusions
This study investigated the influence of cutting speed, focal position, and assist gas pressure on the dimensional accuracy of parts produced by fiber laser cutting of low-carbon structural steel with a thickness of 3 mm.
The results confirmed that dimensional accuracy is strongly dependent on process parameter selection and that the effect of individual parameters varies depending on the evaluated response. Focal position was identified as the most significant factor affecting all investigated dimensional deviations, highlighting its dominant role in controlling energy distribution and cutting stability. Cutting speed was found to be the second most influential parameter, particularly for circular geometries, where insufficient energy input at higher speeds led to increased dimensional inaccuracies. The effect of assist gas pressure was shown to be response-dependent, with a limited direct influence but a significant role through interaction effects, especially in combination with focal position.
The importance of interaction effects was confirmed, indicating that parameter optimization cannot be performed independently. This highlights the necessity of applying statistical approaches, such as design of experiments, for accurate process modeling and optimization.
The developed regression models demonstrated good predictive accuracy, with R2 values exceeding 96% and low MAE values (0.258 mm for D1 and 0.106 mm for D2), confirming good agreement between predicted and experimental data.
Microhardness analysis revealed a substantial increase in hardness in the heat-affected zone, from approximately 153 HV in the base material to 428 HV near the cut edge. These results confirm the presence of thermal effects and microstructural transformations caused by rapid heating and cooling, which are closely related to process conditions affecting dimensional accuracy.
From an industrial perspective, the findings indicate that achieving high dimensional accuracy requires precise control of focal position, supported by appropriate selection of cutting speed and assist gas pressure depending on the specific geometry of the part. Circular features are more sensitive to cutting speed and focusing conditions, whereas linear features are additionally influenced by gas pressure, highlighting the need for geometry-specific parameter optimization.
The developed models enable the identification of optimal process conditions, with selected parameter combinations allowing near-zero-dimensional deviations. This suggests the practical applicability of the proposed approach for process optimization.
Although the models showed high accuracy, further research should focus on extending the parameter space and incorporating additional variables to further improve prediction capability.
Overall, the results provide a detailed insight into the relationship between process parameters, thermal effects, and dimensional accuracy in fiber laser cutting within the investigated conditions and may provide guidance for improving process performance in industrial applications.
The findings of this study are limited to the investigated material, thickness, and process conditions, and should not be generalized without further experimental validation.
Author Contributions
Conceptualization, I.Č. and V.Č.; methodology, B.F. and I.Č.; validation, B.F., I.Č. and V.Č.; formal analysis, B.F.; investigation, B.F. and S.S.; resources, A.B. and Ľ.Š.; data curation, B.F. and S.S.; writing—original draft preparation, B.F.; writing—review and editing, I.Č. and V.Č.; visualization, B.F.; supervision, I.Č. and V.Č.; project administration, I.Č.; funding acquisition, I.Č. and Ľ.Š. All authors have read and agreed to the published version of the manuscript.
Funding
This research was funded by the Scientific Grant Agency of the Ministry of Education, Research, Development and Youth of the Slovak Republic and the Slovak Academy of Sciences (VEGA), grant number 1/0387/24, titled “HAZ index analysis of carbon fibre reinforced plastic (CFRP) composites using quasi-continuous wave (QCW) fibre laser”. The APC was funded by the VEGA project 1/0387/24.
Data Availability Statement
The data supporting the findings of this study are available from the corresponding author upon reasonable request.
Acknowledgments
The authors would like to thank MicroStep, spol. s r.o., for their long-term cooperation and for providing access to the laser cutting system and experimental facilities without financial requirements. The support of MicroStep significantly contributed to the realization of the experimental work presented in this study. The results of this research also contribute to the further development and optimization of machine control and software solutions aimed at improving cutting performance and process quality for industrial applications.
Conflicts of Interest
The authors declare no conflicts of interest.
References
- Cepauskaite, L.; Bendikiene, R.; Baskutis, S.; Baskys, A. Effect of Fiber-Laser Parameters on Cutting Accuracy of Thin and Thick S355JR Structural Steel Plates. Metals 2024, 14, 723. [Google Scholar] [CrossRef] [Scilit]
- Ali, A.S.; Abdelmonem, T.; Elsoeudy, R.; Mohsen, M.A.; Elzayady, N. Characterization of AISI 304 Stainless Steel Based on Laser Cutting Process Optimization. Sci. Rep. 2025, 15, 24932. [Google Scholar] [CrossRef] [Scilit] [PubMed]
- Xu, L.; Wang, C.; Yan, F.; Hu, Z.; Zhang, W. Improved Surface Quality and Microstructure Regulation in High Power Fiber Laser Cutting of Stainless Steel Grid Plates. Materials 2024, 17, 5959. [Google Scholar] [CrossRef] [Scilit] [PubMed]
- Chen, J.; Tu, F.; Wang, P.; Cao, Y. Revealing the Enhancement Mechanism of Laser Cutting on the Strength–Ductility Combination in Low Carbon Steel. Metals 2024, 14, 541. [Google Scholar] [CrossRef] [Scilit]
- Dubey, A.K.; Yadava, V. Laser Beam Machining—A Review. Int. J. Mach. Tools Manuf. 2008, 48, 609–628. [Google Scholar] [CrossRef] [Scilit]
- Riveiro, A.; Quintero, F.; Lusquiños, F.; Comesaña, R.; Pou, J. Laser Cutting: A Review on the Influence of Assist Gas. Materials 2019, 12, 157. [Google Scholar] [CrossRef] [Scilit] [PubMed]
- Pandey, A.K.; Dubey, A.K. Multiple Quality Optimization in Laser Cutting Using Grey–Fuzzy Methodology. Int. J. Adv. Manuf. Technol. 2013, 65, 421–431. [Google Scholar] [CrossRef] [Scilit]
- Pramanik, A.; Basak, A.K. Laser Beam Machining of Titanium Alloy—A Review. Metals 2023, 13, 1536. [Google Scholar] [CrossRef] [Scilit]
- Salah, E.S.; Mostafa, R.; Tawfik, M.M.; Dewidar, M. Laser Forming Technology: A Comprehensive Review. Int. J. Mater. Form. 2025, 18, 82. [Google Scholar] [CrossRef] [Scilit]
- Steen, W.M.; Mazumder, J. Laser Material Processing, 4th ed.; Springer: London, UK, 2010. [Google Scholar]
- Shi, J.; Yang, L.; Zhou, H.; Fu, P.; Tao, P.; Yang, Y. Effects of Laser Cutting on Microstructure, Hardness and Magnetic Properties of Fe-Based Amorphous Ribbons. Opt. Laser Technol. 2025, 192, 113479. [Google Scholar] [CrossRef] [Scilit]
- EN ISO 9013:2017; Thermal Cutting—Classification of Thermal Cuts—Geometrical Product Specification and Quality Tolerances. Polish Committee for Standardization: Warsaw, Poland, 2017.
- Alsaadawy, M.; Dewidar, M.; Said, A.; Maher, I.; Shehabeldeen, T.A. A comprehensive review of studying the influence of laser cutting parameters on surface and kerf quality of metals. Int. J. Adv. Manuf. Technol. 2024, 130, 1039–1074. [Google Scholar] [CrossRef] [Scilit]
- Huang, S.; Fu, Z.; Liu, C.; Li, J. Multi-objective optimization of fiber laser cutting quality characteristics of glass fiber reinforced plastic (GFRP) materials. Opt. Laser Technol. 2023, 163, 109020. [Google Scholar] [CrossRef] [Scilit]
- Turkkan, Y.A.; Aslan, M.; Tarkan, A.; Aslan, Ö.; Yuce, C.; Yavuz, N. Multi-objective optimization of fiber laser cutting of stainless-steel plates using Taguchi-based grey relational analysis. Metals 2023, 13, 132. [Google Scholar] [CrossRef] [Scilit]
- Ullah, S.; Li, X.; Guo, G.; Rodríguez, A.R.; Li, D.; Du, J.; Cui, L.; Wei, L.; Liu, X. Influence of the fiber laser cutting parameters on the mechanical properties and cut− edge microfeatures of a AA2B06− T4 aluminum alloy. Opt. Laser Technol. 2022, 156, 108395. [Google Scholar] [CrossRef] [Scilit]
- Samura, L.; Danil Pratama, M.; Galih Vidia Putra, V.; Achmad, F.; Yusuf, Y.; Abdullah, F. A new mathematical model for optimizing laser cutting parameters to improve fabric quality. J. Vibroeng. 2024, 10, 202–216. [Google Scholar] [CrossRef] [Scilit]
- Montgomery, D.C. Design and Analysis of Experiments; Wiley: New York, NY, USA, 2017. [Google Scholar]
- Myers, R.H.; Montgomery, D.C.; Anderson-Cook, C.M. Response Surface Methodology; Wiley: New York, NY, USA, 2016. [Google Scholar]
- Box, G.E.P.; Hunter, J.S.; Hunter, W.G. Statistics for Experimenters; Wiley: New York, NY, USA, 2005. [Google Scholar]
- Draper, N.R.; Smith, H. Applied Regression Analysis; Wiley: New York, NY, USA, 1998. [Google Scholar]
- Kutner, M.H.; Nachtsheim, C.J.; Neter, J. Applied Linear Statistical Models; McGraw-Hill: New York, NY, USA, 2005. [Google Scholar]
- EN 10025-2:2019; Hot Rolled Products of Structural Steels—Part 2: Technical Delivery Conditions for Non-Alloy Structural Steels. European Committee for Standardization (CEN): Brussels, Belgium, 2019.
- Callister, W.D.; Rethwisch, D.G. Materials Science and Engineering: An Introduction; Wiley: New York, NY, USA, 2018. [Google Scholar]

Disclaimer/Publisher’s Note: The statements, opinions and data contained in all publications are solely those of the individual author(s) and contributor(s) and not of MDPI and/or the editor(s). MDPI and/or the editor(s) disclaim responsibility for any injury to people or property resulting from any ideas, methods, instructions or products referred to in the content. |
© 2026 by the authors. Licensee MDPI, Basel, Switzerland. This article is an open access article distributed under the terms and conditions of the Creative Commons Attribution (CC BY) license.