
Article

Influence of Vibration-Assisted MIG Weld Cladding on the Reconditioning of Hot Extrusion Punches

by
Mihai Alexandru Luca
1,*,
Dorin-Ioan Catana
1,
Dana Luca Motoc
2 and
Mircea Horia Tierean
1,3
1
Department of Materials Engineering and Welding, Faculty of Materials Science and Engineering, Transilvania University of Brasov, B-dul Eroilor 29, 500036 Brasov, Romania
2
Department of Automotive and Transport Engineering, Faculty of Mechanical Engineering, Transilvania University of Brasov, B-dul Eroilor 29, 500036 Brasov, Romania
3
Technical Sciences Academy of Romania, B-dul Dacia 26, 010414 Bucharest, Romania
*
Author to whom correspondence should be addressed.
J. Manuf. Mater. Process. 2026, 10(5), 173; https://doi.org/10.3390/jmmp10050173
Submission received: 8 April 2026 / Revised: 5 May 2026 / Accepted: 6 May 2026 / Published: 14 May 2026

Abstract

Hot extrusion tools operate under severe thermal and mechanical conditions, which significantly limit their service life. During operation, the punch and die absorb large amounts of heat from the hot billet while being subjected to high pressures and intense friction, leading to severe abrasive wear and progressive hardness reduction. In practice, the punch generally exhibits a shorter service life than the die. The present study proposes a technological solution for reconditioning worn extrusion punches using vibration-assisted welding (VAW). A wear-resistant layer was deposited by MIG welding using DUR 600 filler material, while mechanical vibrations were introduced through a vibrating welding table. The applied vibration regime consisted of a frequency of 50 Hz–108 Hz and acceleration components of ax = 30–60 m/s2 and az = 35–70 m/s2. The experimental investigations included macroscopic analysis, hardness and microhardness measurements, microstructural observations, and SEM-EDS line scanning analysis of the dilution zone between the cladding material and the base metal. The results suggest that vibration-assisted welding may influence the microstructural characteristics, hardness distribution, and dilution behavior of the cladded layer. The vibrated specimens exhibited higher hardness values in the range of 702 to 908 HV5–10. Under the investigated conditions, the process did not require additional hardening treatment, and only a stress-relief annealing stage was applied. The proposed VAW approach appears to be a promising option for the reconditioning of hot extrusion tools; however, further investigations are required to validate its performance under industrial conditions.

1. Introduction

Extrusion is a forming process by pressing material in which the billet or workpiece is forced to flow through a die that has a shaped orifice. Extrusion is applied with the purpose of reducing the cross-sectional area of the billet and potentially generating a new cross-sectional shape. Essentially, pressing reduces the billet’s cross-section and increases its length. The resulting product has a cross-section determined by the shape of the die’s orifice, through which the material is expelled by pressing with a punch. Steel extrusion normally involves very large forces acting on both the processed material and the tools used. To reduce extrusion force, the material’s plasticity is increased, which is achieved by heating the steel into the austenite range. However, under these conditions, the die and punch in contact with the processed material heat up to high temperatures [1].
In hot extrusion of steels, the contact time between the die and the workpiece is generally longer than in die forging. Extrusion tools absorb heat from the incandescent billet but also heat up due to the violent flow of material under high pressure, as well as friction on the contact surfaces. Thus, the die’s temperature, especially the punch, rises significantly. To increase production rates and extend the service life of extrusion tools, cooling them is necessary, as is reducing friction by lubricating the contact surface with the incandescent billet. Frequently, with good results, lubrication is provided with glass powders that melt upon contact with the hot billet. Additionally, the billet may be prepared before heating by coating it with a mixture of glass powder and sodium silicate. Molten glass lubrication offers numerous advantages: it reduces extrusion force, has low thermal conductivity, provides thermal protection for the tools, and adheres at high temperature, as well as exhibiting pressure resistance, chemical stability, and no reaction with the extruded part [2,3].
To extend the service life of extrusion tools and improve lubrication conditions, at the start of the manufacturing process, they are preheated to 300–400 °C. During production, tool temperature rises, but exceeding a maximum temperature where physical and mechanical strength are compromised must be avoided. Generally, steels used for hot-working tools tolerate heating up to 550–600 °C. To maintain temperatures within set limits, thermocouples can be implanted in the punch and die to monitor the production process. Cooling of extrusion tools can be done internally via cooling channels [4] or externally with a jet spray of compressed air and fine water particles [5]. This cooling method is effective and additionally has the advantage of carrying fine graphite particles in the jet, providing lubrication as well, thus reducing friction and wear. Another advantage of this cooling and lubrication method is the removal of the scale crust that may form on the billet surface during heating. The presence of oxide crust affects the surface quality of the extruded piece, causing scratching and premature tool wear. Under the cooling jet’s pressure, the oxide crust is removed, thus increasing tool durability.
The main reason for taking hot extrusion tools out of service is their plastic deformation due to material softening, but other causes can occur, such as abrasive wear, thermal fatigue, and brittle fracture. It should be noted that the punch’s lifespan is shorter than that of the die. The most affected part is the edge of the punch’s front surface. This area heats up the most, thus its hardness decreases and its deformation increases, resulting in maximum abrasive wear [6,7].

Research Aims and Objectives

The present work aimed to increase the service life of extrusion punches. In the first stage, a punch that exhibited pronounced wear on the edges of the active surface was subjected to a reconditioning operation by welding a wear-resistant layer in the most affected area. Promising results were obtained, and the decision was made to develop a reliable reconditioning technology for worn punches. Thus, a research program was initiated to determine the optimal parameters for weld-cladding the worn tool. Internal stresses generated during welding and cooling can exceed the mechanical strength of the material at its heated temperature, and in such cases, cracks occur in the deposited metal or in the heat-affected zone (HAZ). Cracking in the HAZ is most often due to the chemical composition of the base material. As carbon content and alloying elements increase, ductility decreases, and the risk of cracking rises.
Over time, various vibration-assisted welding (VAW) methods have been developed and studied, which can reduce production costs by eliminating pre- and post-heating operations [8].
In addition to the reduction in residual stresses in the heat-affected zone (HAZ), the application of the VAW process influences a solidification process in the deposited metal, which may lead to grain refinement in the weld bead, prevent the formation of Widmanstätten structures, contribute to improved mechanical properties, and result in a better weld bead appearance.
Research on vibration-assisted welding (VAW) has been reported in several studies [9,10]. The main methods by which mechanical oscillations are introduced into the welding process involve vibrating the workpiece using an exciter, which is applied in vibratory stress relief (VSR) processes, operating at frequencies below 150 Hz [10,11]. The vibration of the workpiece at higher frequencies is achieved using electromagnetic or electrodynamic vibrators.
Vibration-assisted welding applied to medium-carbon steels appears to be a feasible alternative to pre- and post-weld heat treatments. By applying vibrations during arc welding, stress concentrations and distortions are minimized, thereby improving the mechanical properties [12,13,14]. The advantages of this process can also be extended and tested for other steels, as in the present case of hot-work tool steels, which, when coated with a hard layer, can withstand both impact loading and wear.
The new weld-cladding method applied to the punch head was based on previous experience gained during the development of the VAW (Vibratory-Assisted Welding) process, applied to the welding of steels intended for quenching and tempering (Q&T) without pre- or post-heating [8]. The main objective of the research and experimental investigations was to obtain a VAW deposition regime without preheating of the base material, without the risk of cracking during service, and with high hardness in the deposited layer [15]. In the final stage, it was concluded that the applied technology did not require a final heat treatment, as appropriate mechanical properties were obtained directly from the weld-cladding process.
Recent studies on vibration-assisted welding (VAW) have primarily focused on the influence of vibration frequency on material properties, often within high-frequency ranges (1000–10,000 Hz). Under these conditions, the resulting effects on microstructure and mechanical performance have been relatively limited, which has contributed to a reduced level of industrial adoption.
In the last decade, research interest has shifted toward low-frequency vibration regimes (20–200 Hz), where higher vibration amplitudes can be achieved. This leads to increased acceleration levels and enhanced inertial effects within the molten pool during solidification and phase transformations. As a result, the potential influence of VAW on weld pool dynamics and microstructural evolution has become more significant.
However, the available literature remains difficult to compare due to the large number of interacting parameters involved, including welding conditions, vibration frequency, acceleration, excitation modes, and material characteristics. Furthermore, most studies have been conducted on different materials and under non-standardized conditions, which limits the development of generalized conclusions or industrial implementation strategies.
In this context, the present study adopts a controlled experimental approach, using a limited but carefully designed set of specimens, in order to isolate the influence of key parameters such as vibration frequency, acceleration, and linear heat input on the thermo-mechanically affected zone.
The novelty of the present study lies in the application of vibration-assisted welding (VAW) to the reconditioning of hot extrusion punches, a topic that has not been systematically addressed in the existing literature. In addition, the study provides a comparative analysis of the influence of vibration parameters, particularly frequency and acceleration, on weld pool behavior, dilution characteristics, and hardness distribution. Furthermore, the results indicate the possibility of eliminating post-weld hardening treatments by achieving high hardness directly through the weld-cladding process.

2. Materials and Methods

2.1. Materials for the Die and Punch

The steels used for hot extrusion tools must satisfy the following requirements:
  • Mechanical strength at the maximum extrusion temperature (600 °C);
  • Minimal deformation at the operating temperature;
  • Resistance to mechanical shock and adequate toughness;
  • Resistance to thermal shock under compressed air and water spray cooling;
  • Resistance to abrasive wear;
  • Corrosion resistance.
The extrusion tools, namely the die and the punch, were manufactured from EN 32CrMoV12-28 (1.2365) steel (equivalent to DIN X32CrMoV3-3, AISI H10, EN ISO 4957: 2000) [16] purchased from SIJ Group (SHITERM, Ravne na Koroškem, Slovenia) in the form of a forged bar with a diameter of 210 mm.
According to the relevant standard, the alloying elements of this steel are allowed within specific limits (Table 1).
The EN 32CrMoV12-28 hot-work tool steel is characterized by high resistance to softening at elevated temperatures and good thermal fatigue resistance, which makes it suitable for applications involving cyclic thermal loading and high mechanical stresses [17].
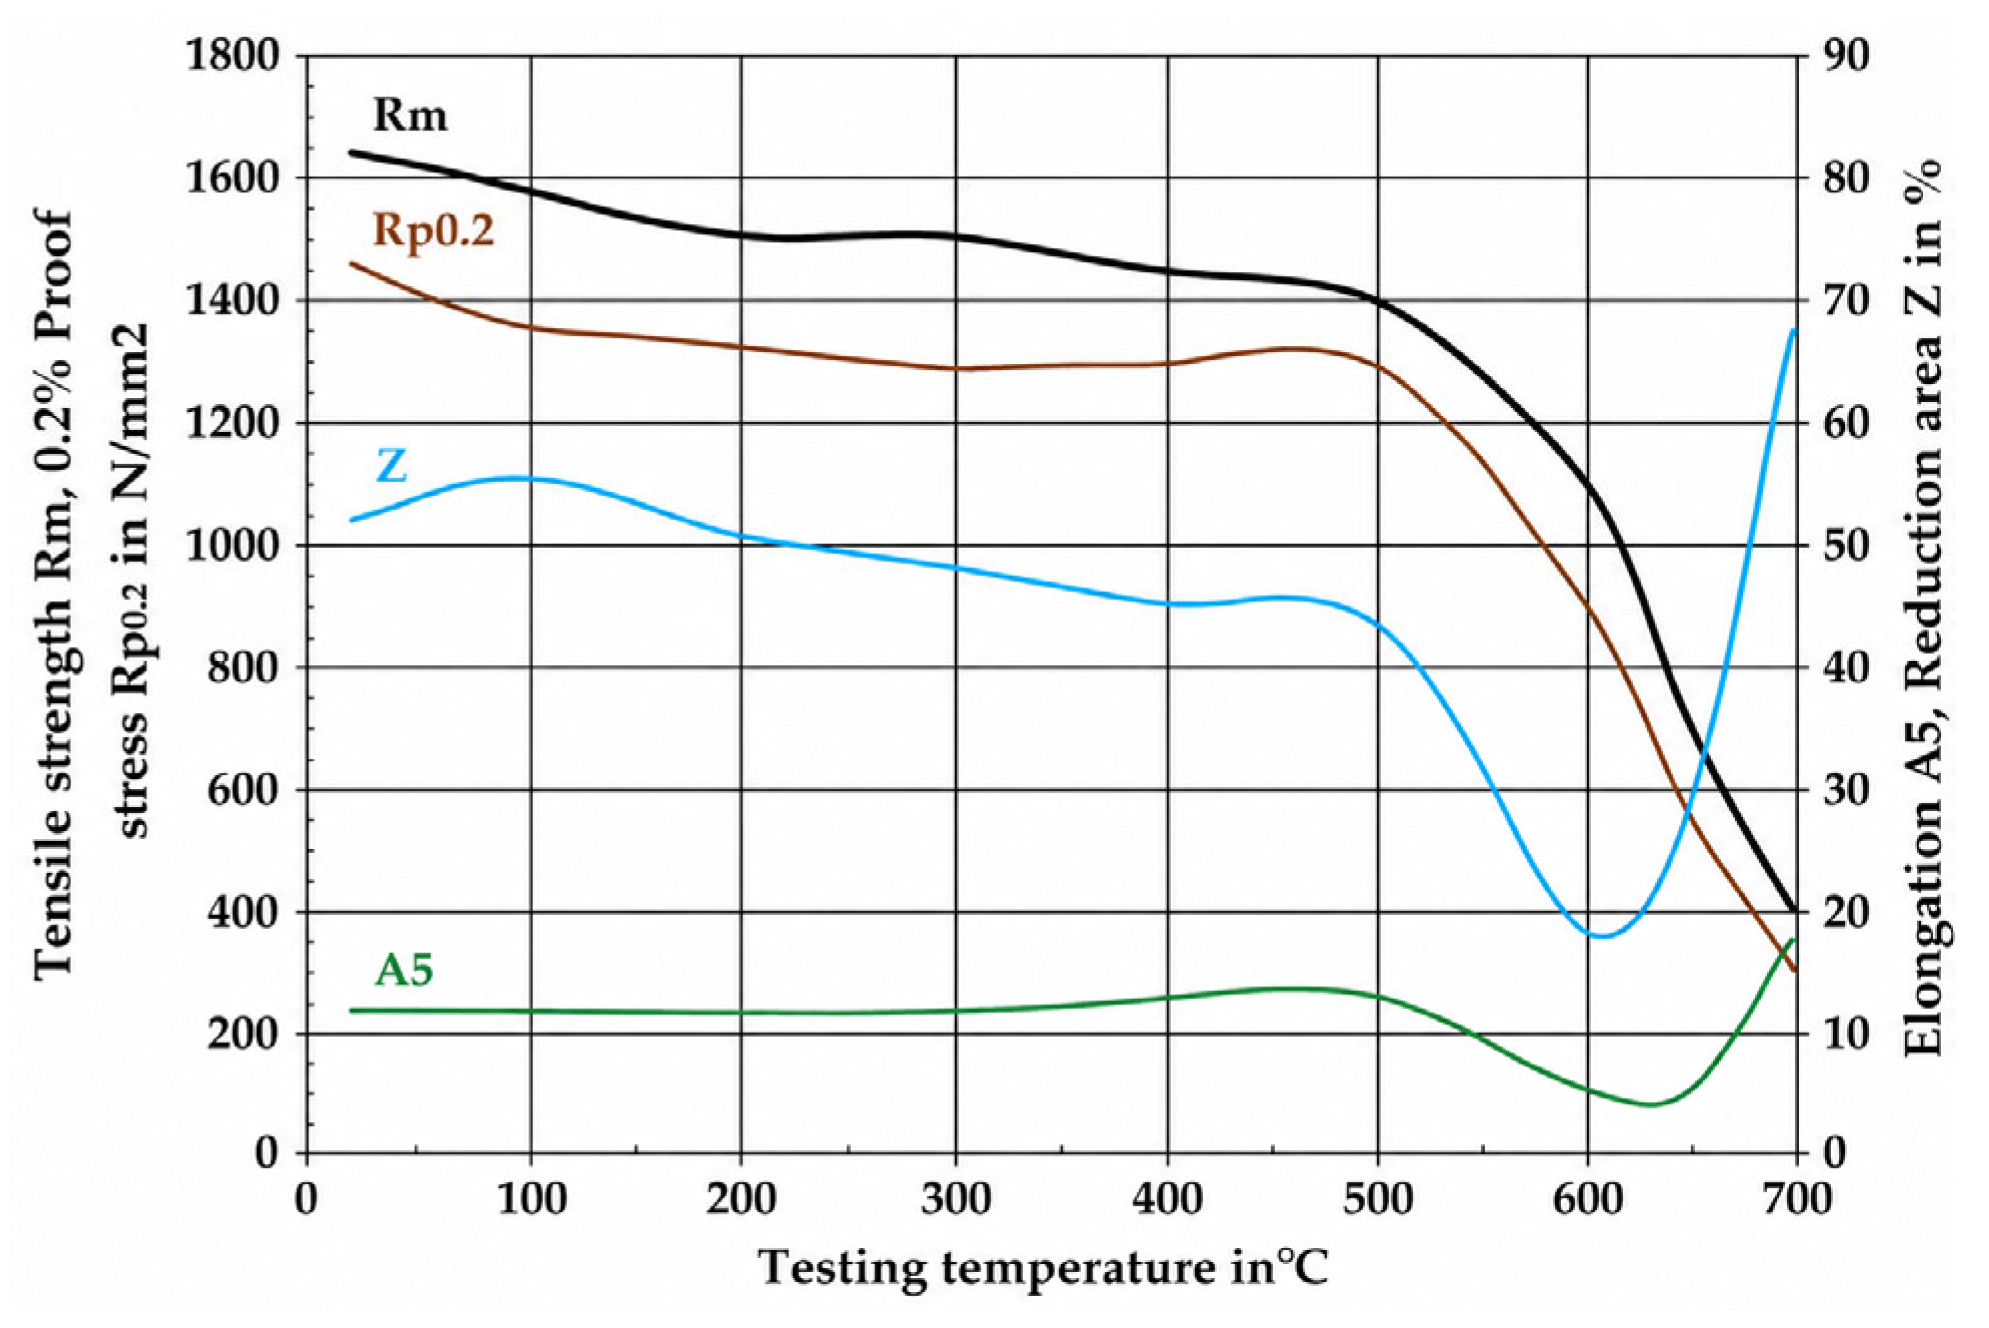
The influence of temperature on the mechanical behavior of hot-work tool steels is illustrated in Figure 1 and Figure 2. Figure 1 shows the variation in hardness as a function of tempering temperature, indicating the progressive softening of the material upon reheating after quenching. This behavior is particularly relevant under service conditions, where the punch is subjected to repeated thermal cycles.
Figure 2 presents the variation in yield strength with temperature, highlighting the reduction in mechanical resistance at elevated temperatures.
These characteristics explain the degradation mechanisms affecting the extrusion punch during operation and justify the need for reconditioning solutions capable of maintaining hardness and mechanical strength under thermal loading conditions.
Both figures are adapted from [17] and are included to provide a reference framework for understanding the material behavior under working conditions.
The heat treatment conditions associated with EN 32CrMoV12-28 tool steel include the following stages: soft annealing at 780–810 °C, resulting in a maximum hardness of approximately 229 HB; hardening at 1000–1150 °C followed by cooling; stress-relief annealing at 600–650 °C after quenching, yielding a hardness of 44–54 HRC; and tempering at 538–621 °C, where double tempering is required.
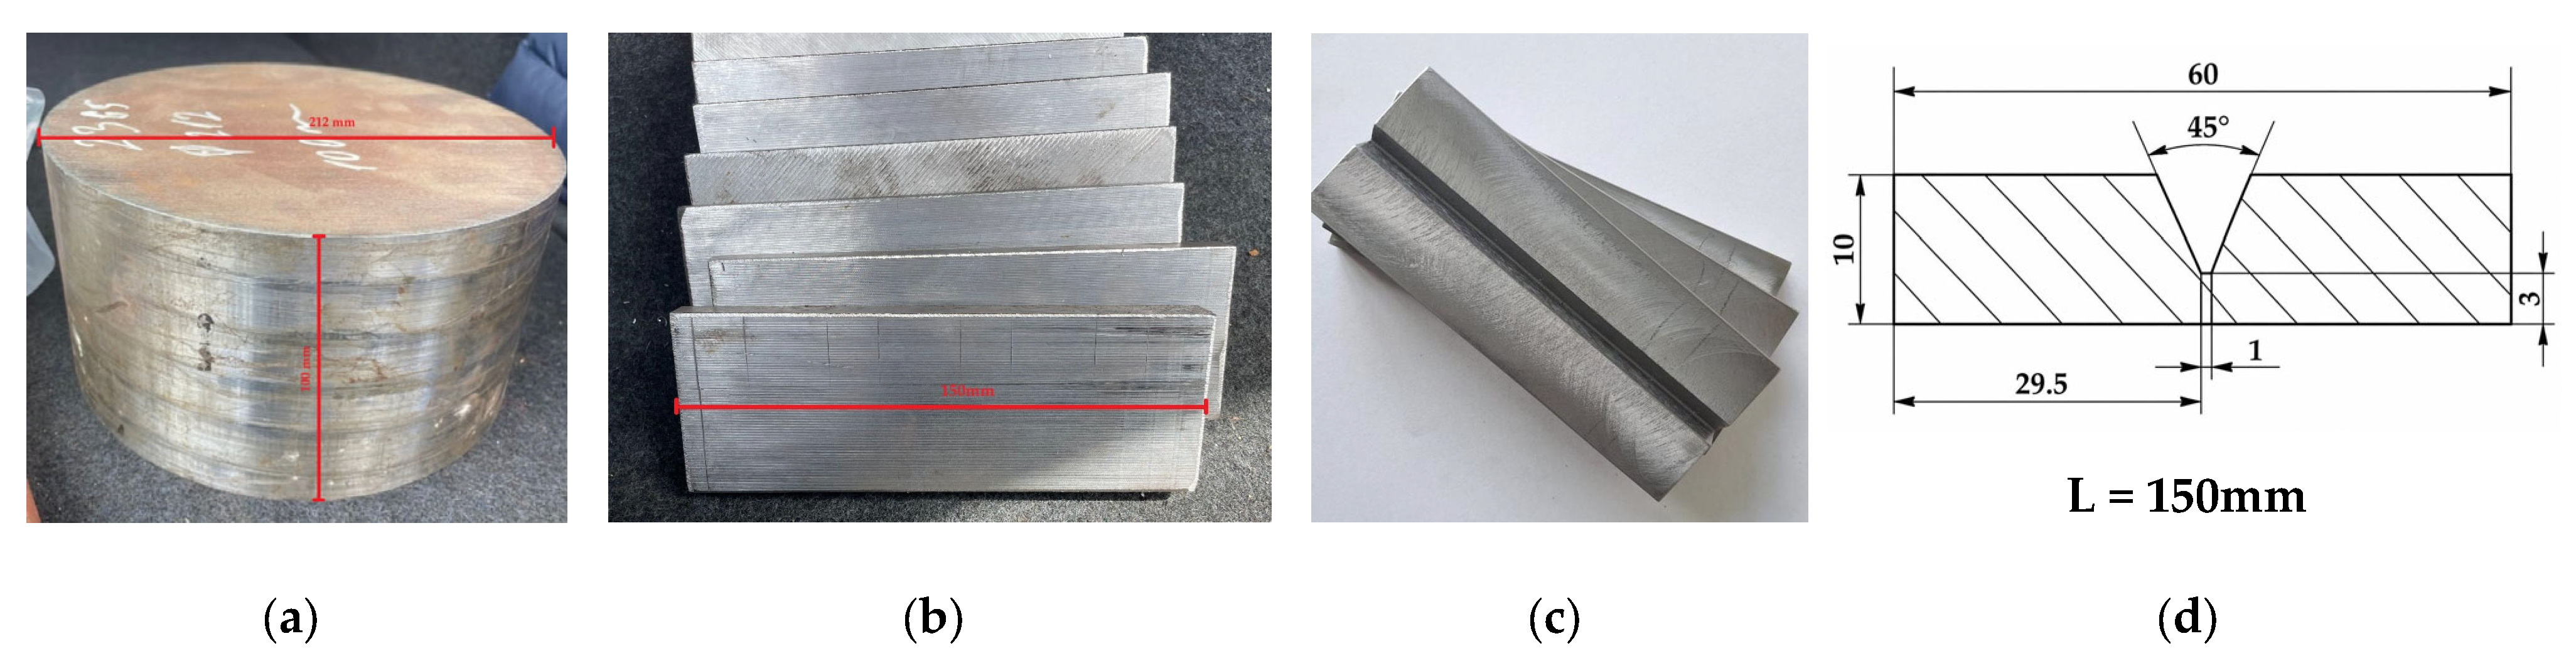
From the EN 32CrMoV12-28 steel (in the as-delivered condition of 160–180 HV), specimens with the shape and dimensions shown in Figure 3 were manufactured.

2.2. Material for the Punch Cladding

The cladding material (with chemical composition from Table 2) was deposited in the weld joint using the MIG process. A UTP A DUR 600 [18]-1.2 mm hardfacing wire (purchased from the Voestalpine Group, Linz, Austria) was employed, which is widely used for weld cladding of structural components subjected to high impact loads and moderate abrasive wear.
Typical applications include quarries, crushing plants, mining equipment, steel and cement industries, as well as cutting tools and dies used in the automotive industry. Despite its high hardness, the deposited layer exhibits good toughness, high crack resistance, and excellent machinability.
In general, tool steels require preheating to approximately 450 °C prior to welding.
The hardness of the pure weld deposit is in the range of 54–60 HRC. After soft annealing at 780–820 °C in a furnace, the hardness decreases to approximately 25 HRC. Following hardening at 1000–1050 °C, with cooling in oil, the hardness increases again to approximately 60 HRC.

2.3. Samples

Using a band saw, slices were cut, and by milling, a V-shaped relief with a 45° angle was applied, as shown in Figure 3. Figure 3a presents the initial cylindrical bar from which the samples were extracted, while Figure 3b shows the rectangular plate-type specimens obtained after cutting and machining. The V-shaped groove prepared for weld cladding is shown in Figure 3c. The complete specimen geometry, including the length of 150 mm, width of 60 mm, groove angle of 45°, and the main dimensional details, is presented in Figure 3d.

2.4. The Equipment Used to Apply the VAW Process

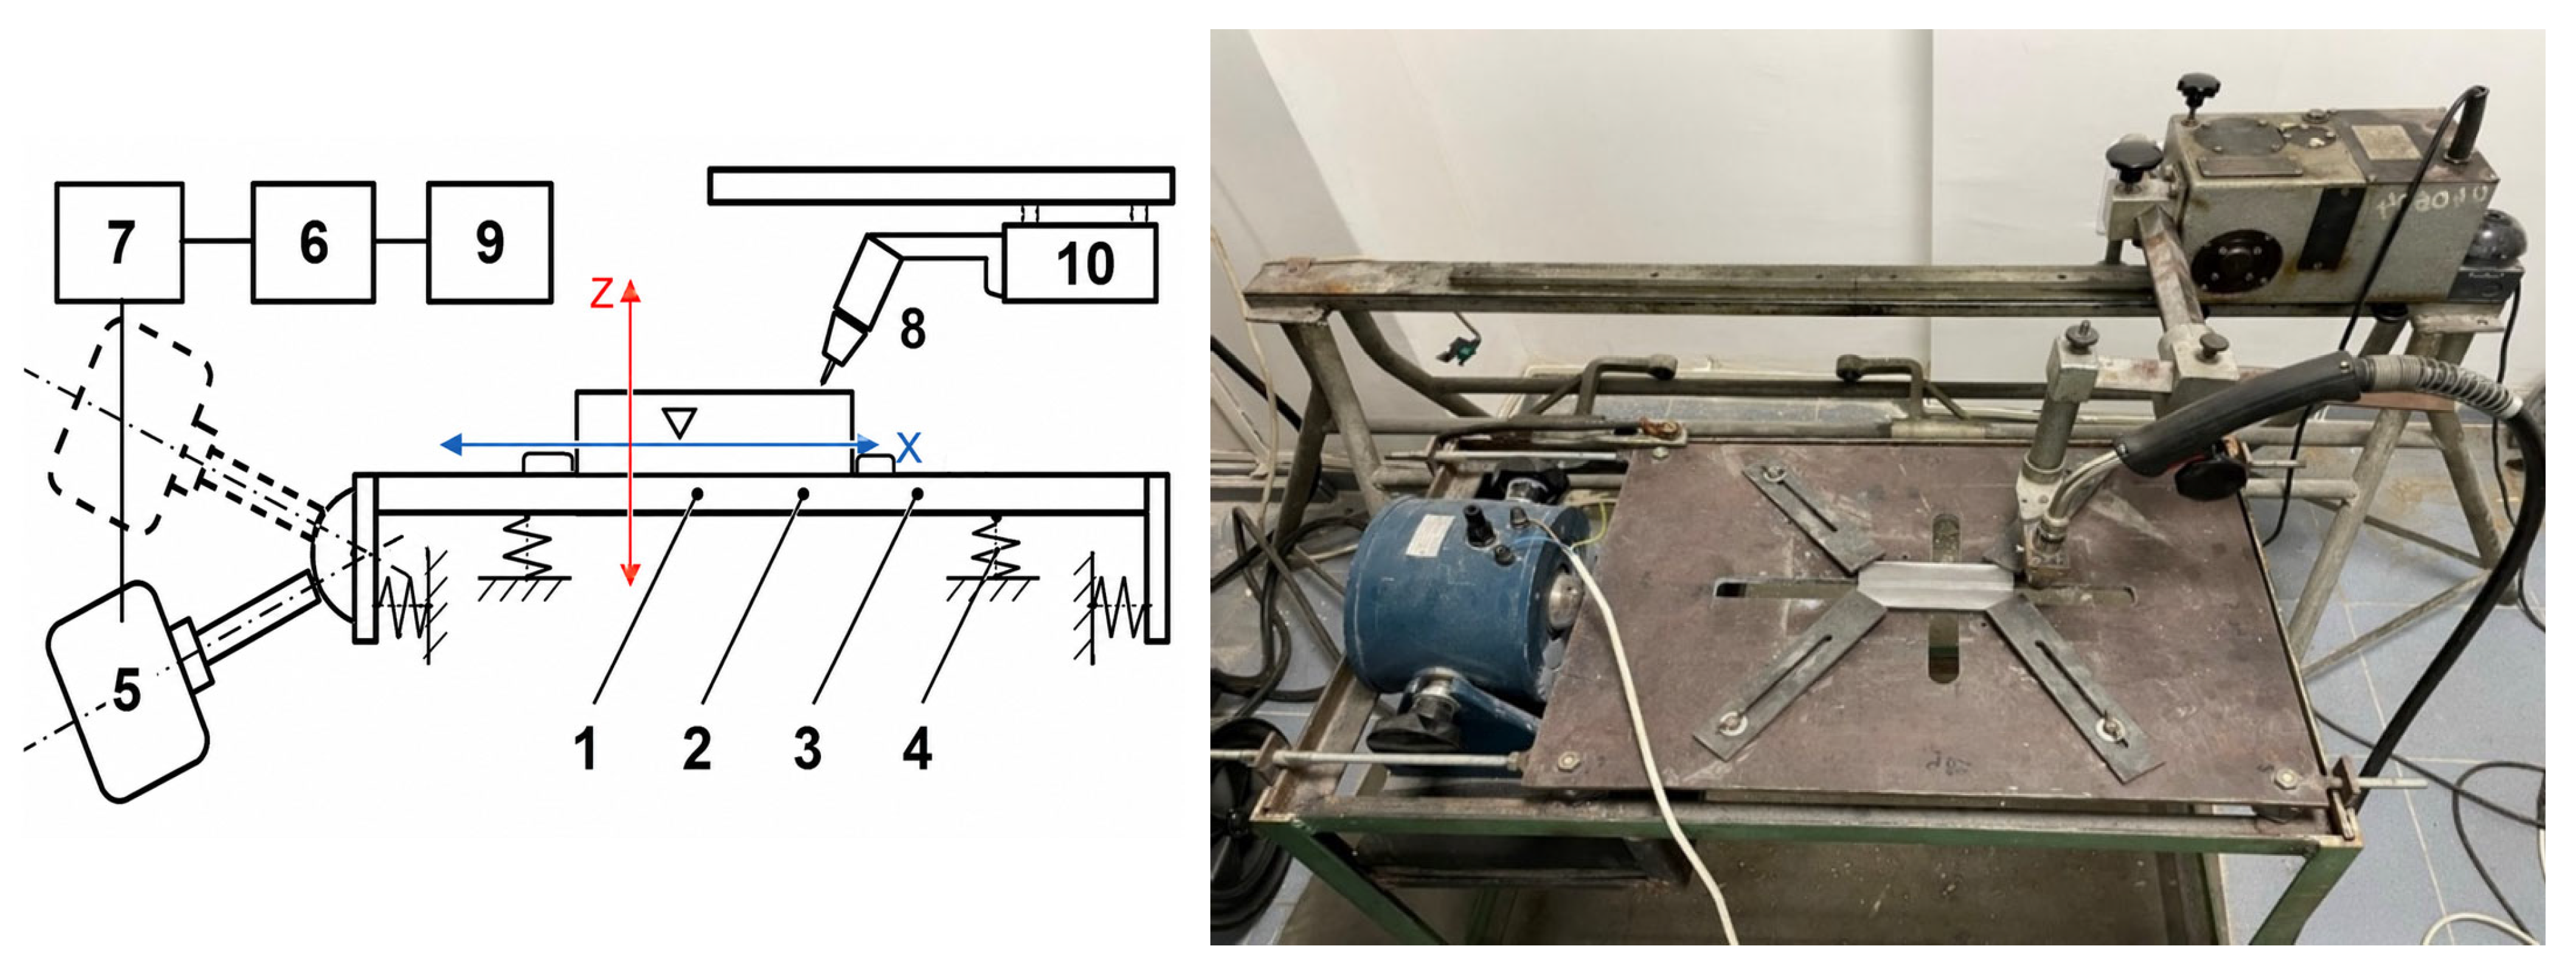
Figure 4 shows the equipment scheme used to apply the VAW process. A patent was obtained for this equipment: vibrating table for welding, RO127504B1 [19].
The workpiece 1 (sample) (in Figure 4), processed by welding using the VAW method, is positioned on the vibrating platform 2. Any displacement of the part caused by vibrations is restricted by the stoppers 3. Platform motion is enabled by the elastic support system 4, which permits oscillations along the x, y, and z axes, with acceleration values that vary according to the placement of the electrodynamic exciter 5.
The low-frequency generator 6 produces either sinusoidal or stepped electrical signals, which are amplified by the power amplifier 7 and transmitted to the electrodynamic exciter. This exciter generates mechanical oscillations with adjustable amplitude and a maximum frequency of 18 kHz. Welding is performed using the welding torch 8, supplied by the MIG/MAG power source 9, while the constant-speed linear movement of the torch is ensured by the welding tractor 10.
Oscillations generated unidirectionally at various frequencies by the electrodynamic exciter propagate through the vibrating table as longitudinal, transverse, or plate waves. As a consequence, acceleration values measured on the platform surface differ depending on the measurement location—center, edges, or corners. The vibration behavior of the platform without load differs from that observed when a part is mounted. The overall vibration mode of the assembly is influenced both by the mass of the mounted part and by its position on the vibrating table.
By modifying the mounted component or the exciter location, as well as by adjusting the spring compression within the elastic support system, it is possible to obtain the required acceleration components in any region of the platform, namely axayaz. The vibration amplitude of either the platform or the mounted part can be determined at any point using an accelerometer connected to a vibrometer.
An increase in acceleration along the weld axis (ax) promotes the formation of welds with finer ripples, thereby reducing surface unevenness. Higher transverse accelerations (ay) contribute to lowering the weld reinforcement, resulting in bead flattening. The vertical acceleration component (az) must remain below a specific threshold. Experimental investigations showed that when vertical accelerations exceed 40 m/s2, gaseous inclusions tend to form within the weld bead.
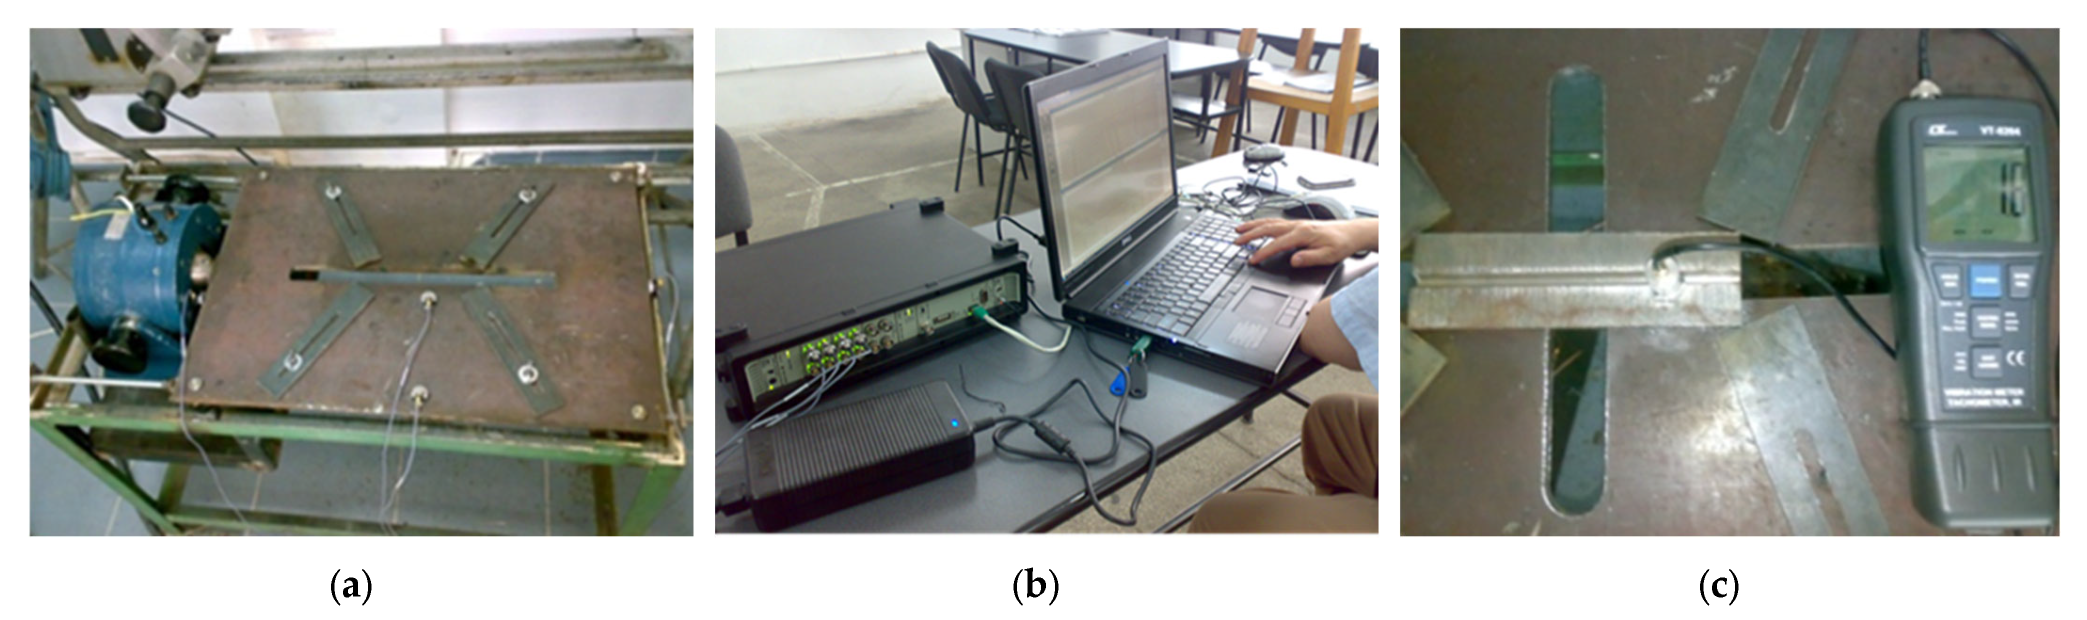
The vibration behavior of the welding table, for various positions of the electrodynamic exciter relative to the vibrating platform, was analyzed using the signal analyzer system Type 3560 C-E01 Brüel & Kjær (Bruel & Kjaer, Nærum, Denmark), shown in Figure 5b.
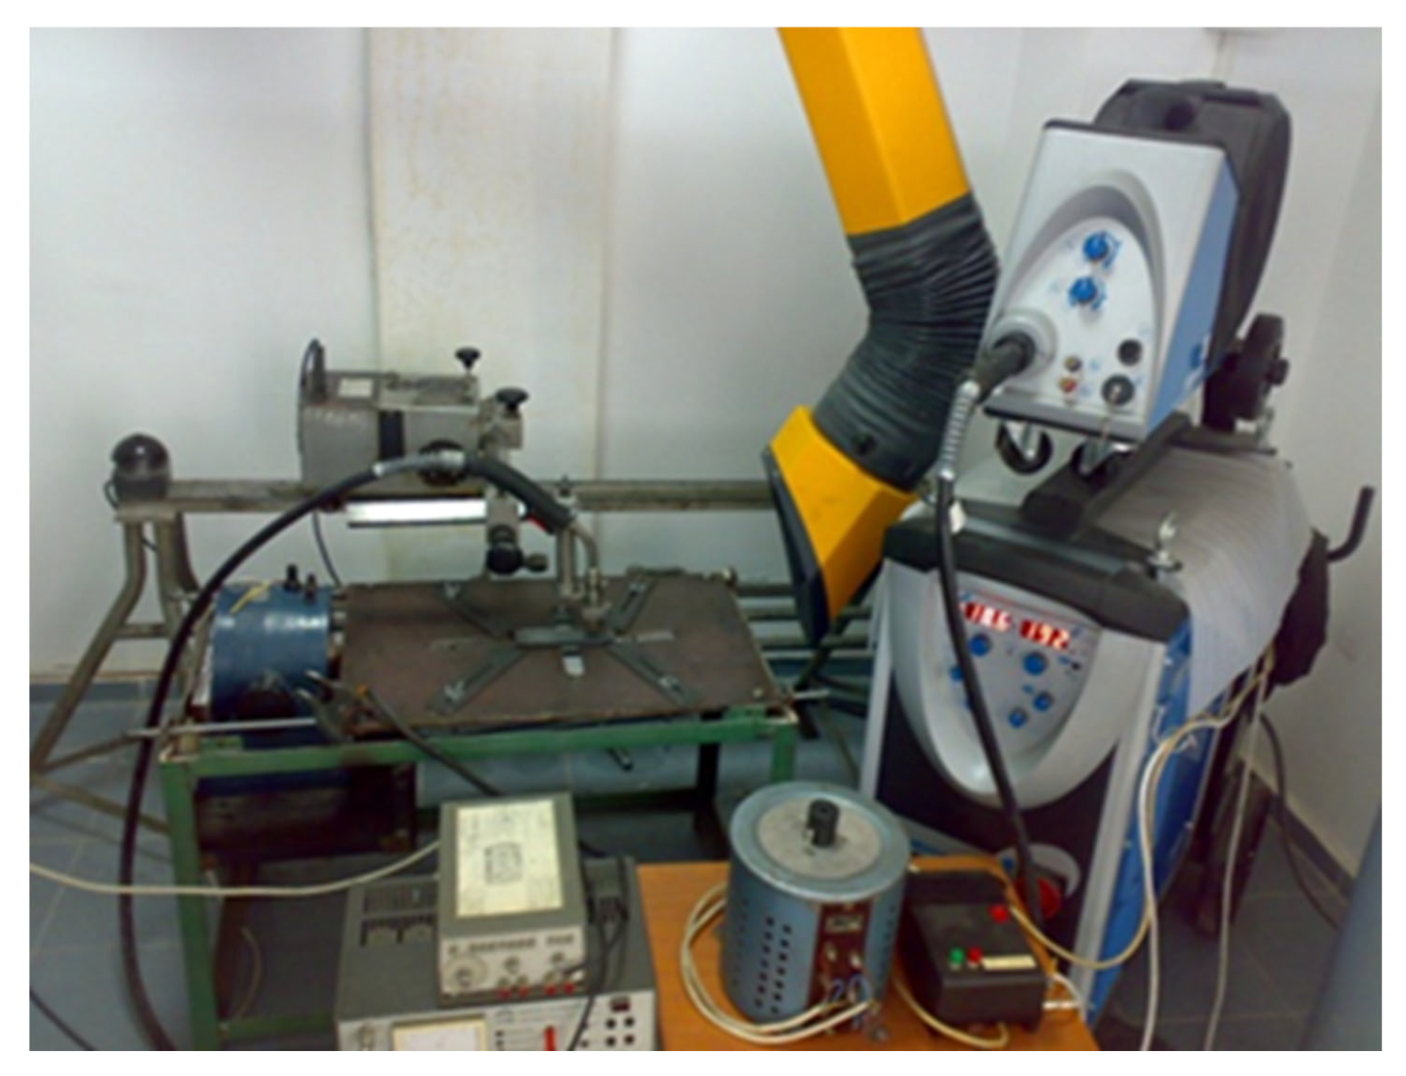
Besides the vibrating table and its associated components (frequency generator and power amplifier), the experimental setup also included the following elements (Figure 6):
  • PCE-VT204 vibrometer (PCE Instruments, Meschede, Germany)(Figure 5c), providing high-accuracy vibration measurements, with resolution values of 0.1 m/s2 for acceleration, 0.1 mm/s for velocity, and 0.001 mm for displacement, employed to evaluate the acceleration components of the specimens along the x and z axes, while the acceleration in the y axis was considered negligible.
  • MIG/MAG power source DIGIPULS 320, SAF-FRO, Air Liquide Welding, Paris, France, Figure 6), designed to operate in synergic welding mode;
  • ETAB welding tractor (ETAB, Montgomery County, MD, USA) (Figure 6), supplied with direct current, ensuring a uniform and adjustable travel speed of the MIG/MAG welding torch.
The description of the working equipment is also provided in [8], Section 2.5, where, additionally, the physical and mechanical phenomenon of wave propagation and the interdependence of its components are disseminated. It was deemed necessary that the reference and presentation of the equipment used to produce the specimens should also be part of this work to ensure a cohesive character.

2.5. Specimens’ Vibration and Welding Regime

Five samples were welded in a synergic mode: two specimens—without vibrations—to assess the conditions for manually performing the weld-cladding operation, and three specimens—vibrated at different frequencies and accelerations. When selecting the vibration regimes, the previously obtained results were considered, when the VAW technology for C45 steel was studied and established without pre- and post-heating [8]. The welding and vibration parameters are presented in Table 3.
The selection of the welding and vibration parameters was based on the authors’ previous experience in this field [8] as well as on the findings reported by other researchers who performed similar experimental studies [20,21].
The vibration acceleration components are denoted throughout the paper as ax (horizontal direction) and az (vertical direction), and this notation is used consistently in all sections.
The vibratory motion can be further characterized by its amplitude, which is related to the measured acceleration and frequency through the well-known relationship:
A = a/(2πf)2
where A represents the vibration amplitude, a is the acceleration, and f is the vibration frequency.
Although the amplitude was not directly measured in the present study, its value can be estimated based on the recorded acceleration levels. For the vibration conditions used, the resulting amplitudes are in the sub-millimeter range, indicating that the variation in the relative distance between the welding torch and the workpiece is minimal. Therefore, the observed effects can be attributed primarily to modifications in the melt pool dynamics rather than to geometric displacement effects. For example, at a vibration frequency of 50 Hz and an acceleration of 60 m/s2, the estimated amplitude is approximately 0.6 mm.

3. Results

In order to identify the most relevant tests for the characterization of the properties obtained after welding, studies reported in the literature were reviewed [22,23,24,25,26,27,28], and the following eight analyses were considered representative for this application.

3.1. Aspect

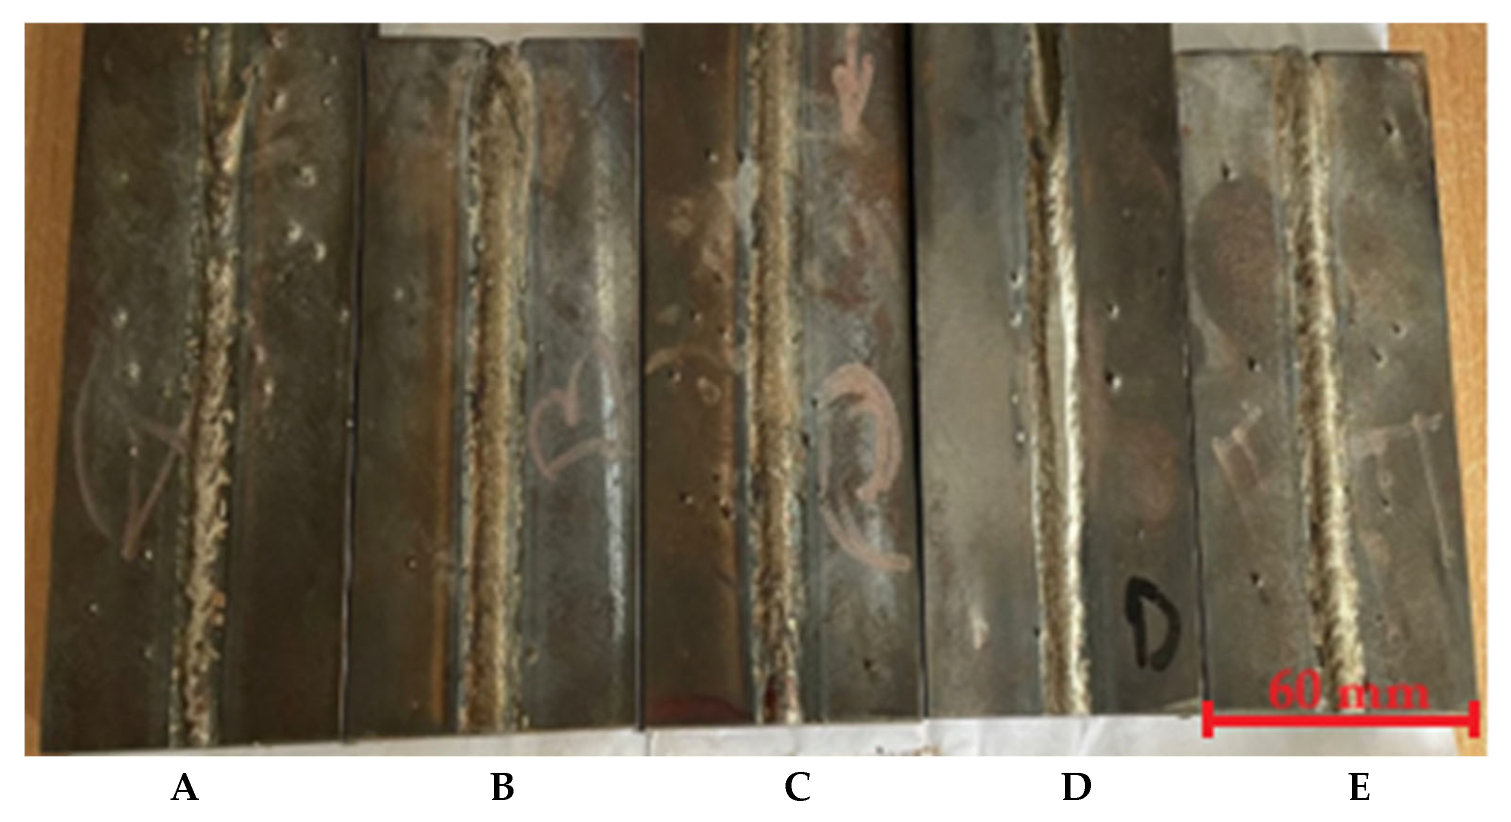
The appearance of the welded samples under different conditions is shown in Figure 7. Sample A was welded with a slightly higher welding speed (vw) and consequently lower linear energy (Q- heat input) than the other samples. Thus, one can compare the influence of Q on the properties of the welded samples against the influence of vibrations. For samples B, C, D, and E, the main welding parameters were kept constant, with only the vibration conditions varied. Sample B was considered the reference sample and was welded conventionally, without mechanical excitation. The excitation regime for samples C, D, and E was chosen so that, by comparing samples C and E, where frequency (f) was kept constant (50 Hz), the influence of acceleration on the resulting properties could be observed. Then, by comparing samples D and E, where the vertical and horizontal accelerations (az and ax) were constant (35 and 30 m/s2, respectively), the influence of frequency f on the resulting changes could be observed. In the end, it was possible to evaluate the relative influence of vibration components, including which of them had the most pronounced effect. Naturally, in the end, the weld with the best properties was compared to the conventionally welded sample B (without mechanical excitation), and the changes obtained through vibration were compared to those obtained by altering the heat input (Q) (sample A).

3.2. Bending Test

In order to simulate the thermal conditions encountered during the service of hot extrusion punches, the specimens were heated together in the furnace up to 550 °C, held for 2 h, and air cooled. Under such conditions, a partial relaxation of residual stresses may occur; however, the primary purpose of this thermal exposure was to reproduce the working temperature regime rather than to perform a dedicated stress-relief heat treatment.
Subsequently, a bending test was performed to evaluate the cracking sensitivity and deformability of the deposited weld metal, with the outer surface of the cladding layer subjected to tensile stresses during loading.
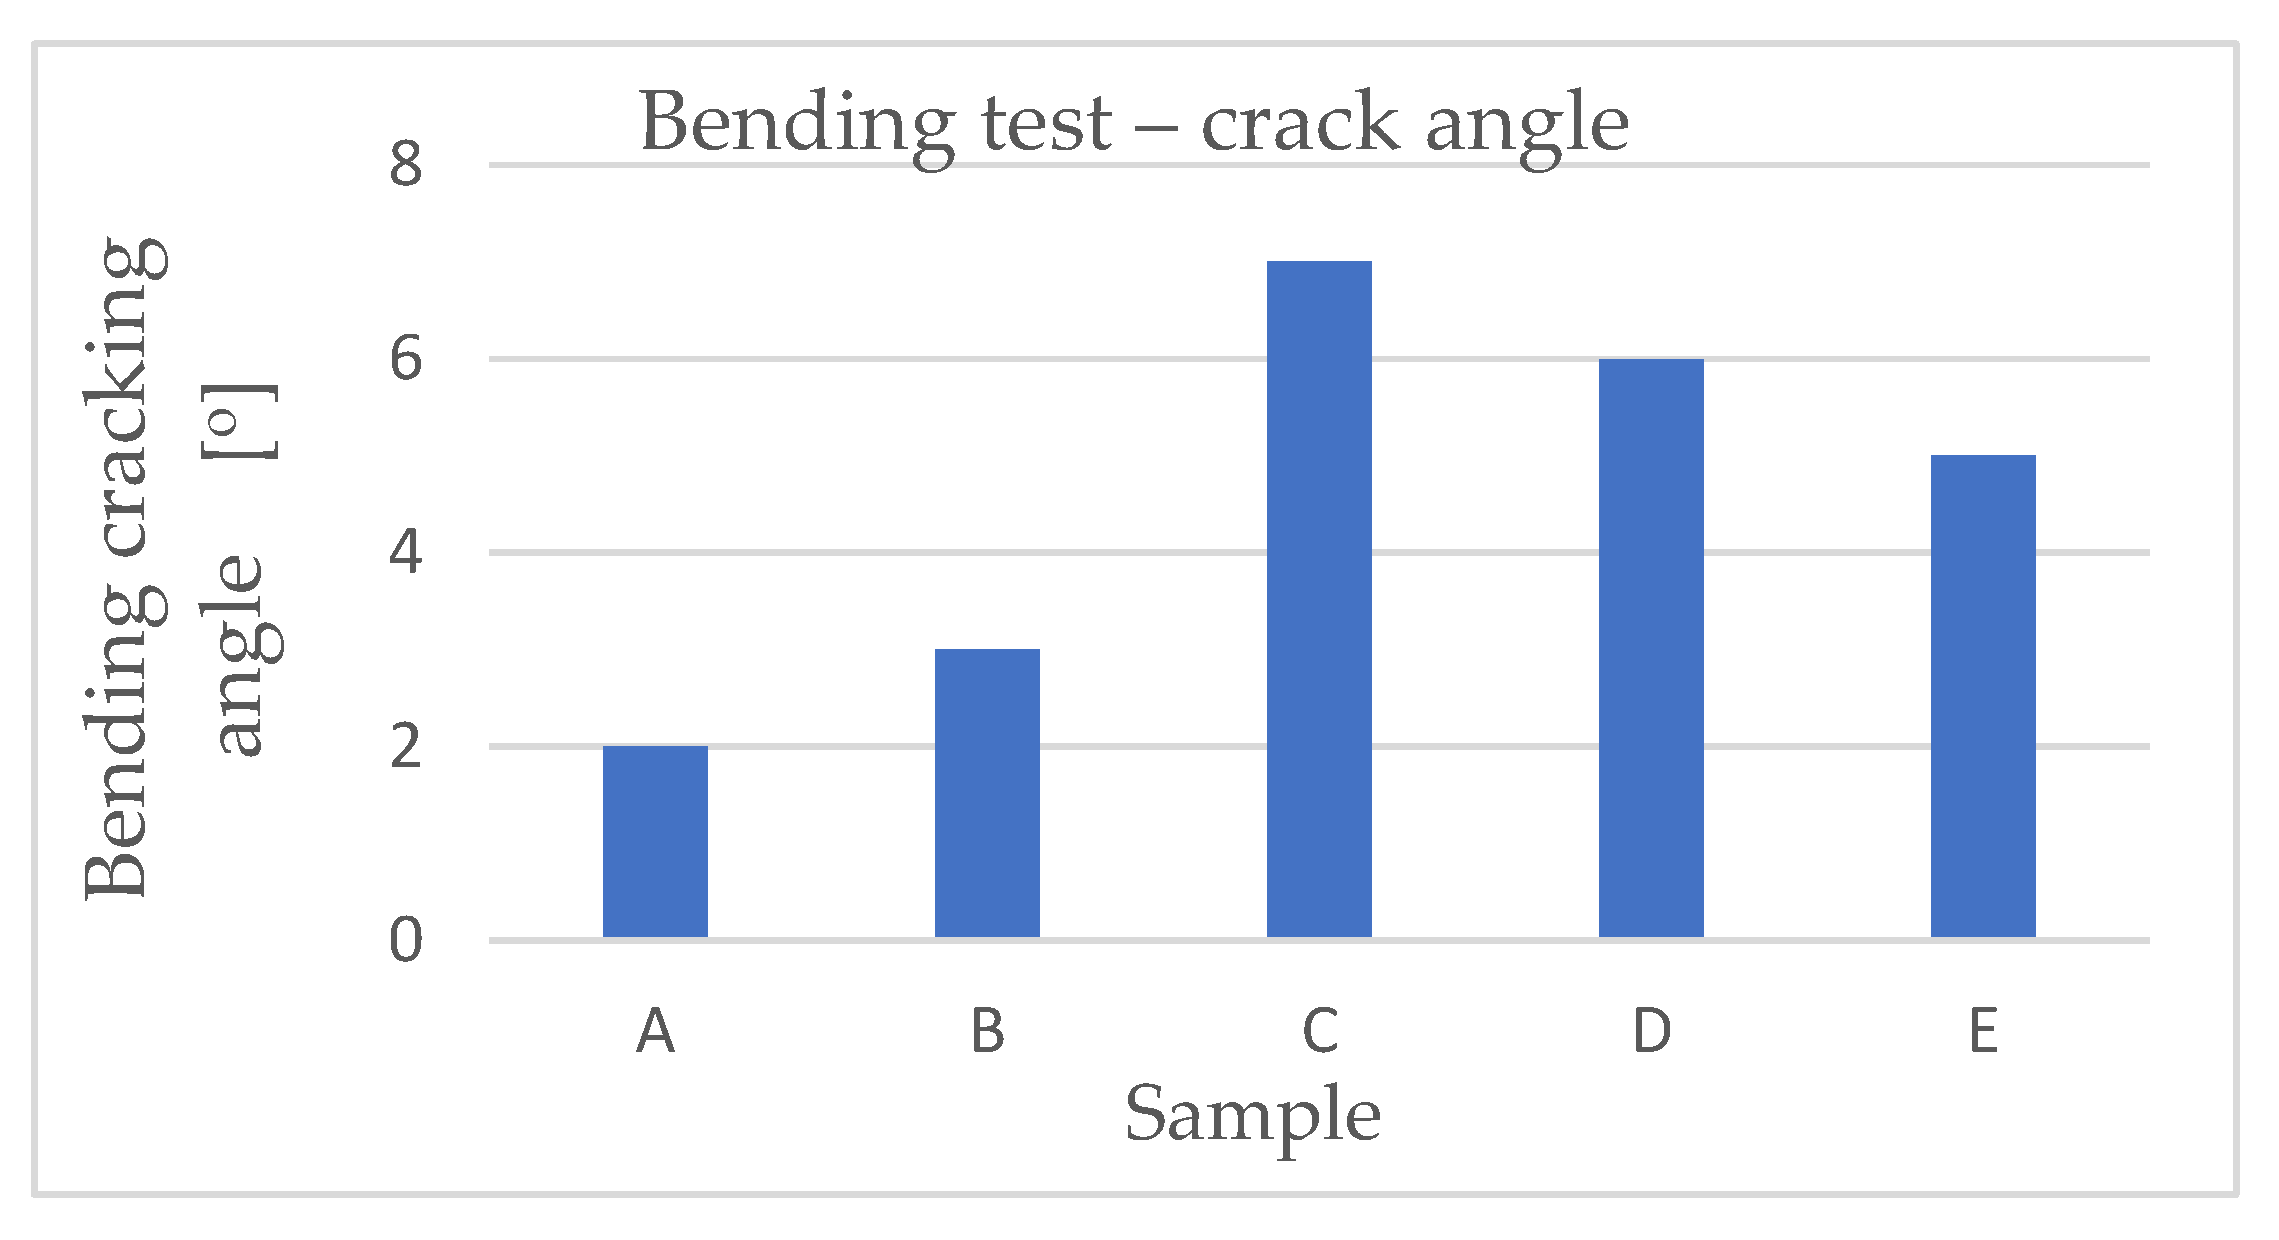
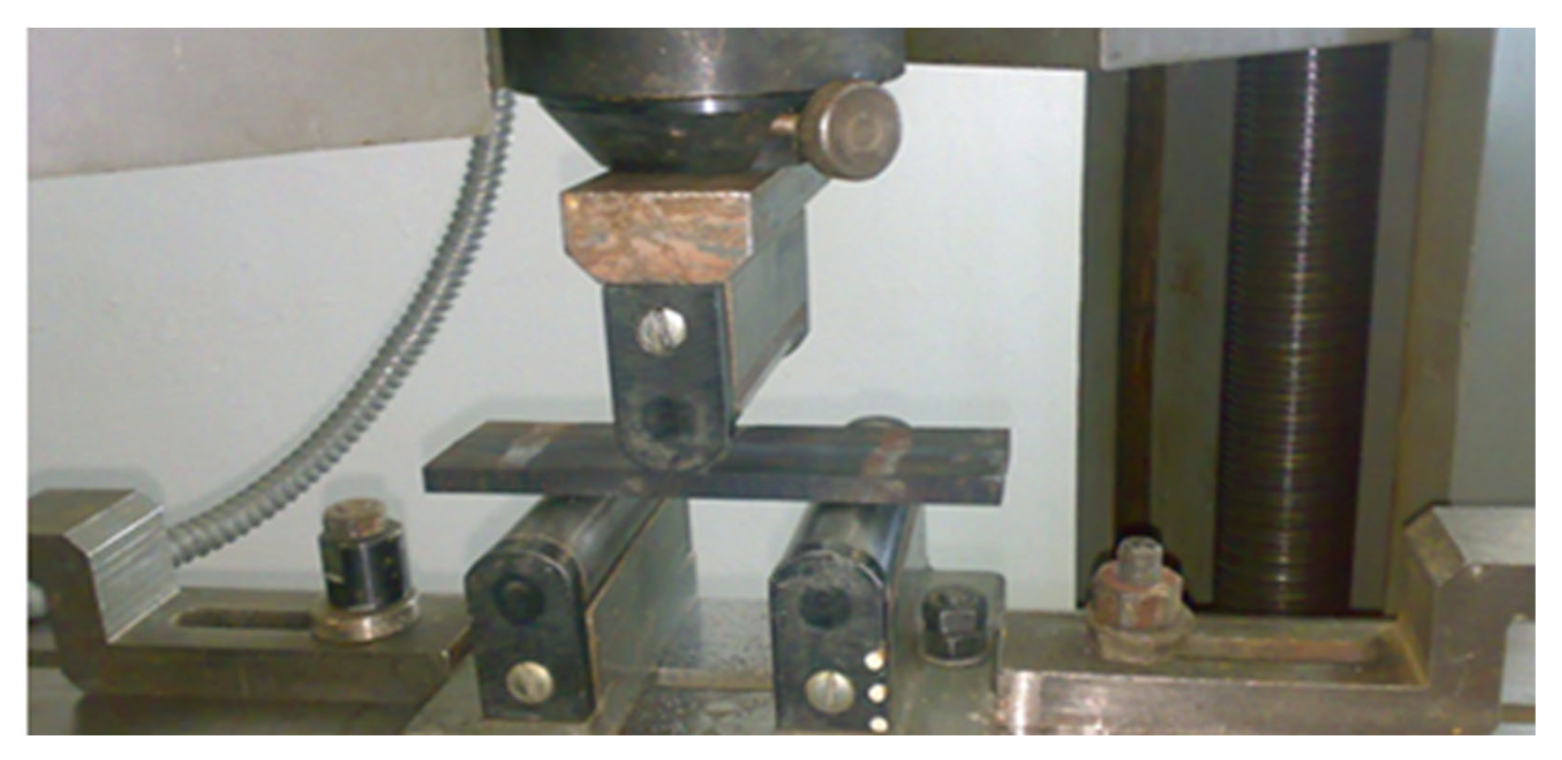
The results are presented in Figure 8 and the crack angle in Table 4. Considering the high hardness of the deposited material, the results suggest a good deformation capacity of the material deposited using the VAW method.
The bending test was performed on a universal testing machine for tension–bending–compression–shear, of the type Traktionsprüfgerät FU 10000e Rauenstein (Traktionsprüfgerät, Berlin, Germany). All three of the working rollers used had a diameter of 25 mm, and the distance between the support rollers was 100 mm. The bending angle was measured using a digital electronic protractor, type HEDU D-104 (HEDÜ, Mönchengladbach, Germany).
It can be observed that both the welding heat input and the vibration regime applied to the specimens during welding influenced the mechanical properties of the samples, as reflected by the bending test results (Table 4).

3.3. Macrostructure

After the bending test, from the end of each specimen corresponding to the welding termination, samples were symmetrically cut at a distance of 50 mm from the termination and prepared for macroscopic and microscopic investigations, as well as for hardness measurements across the cross-section.
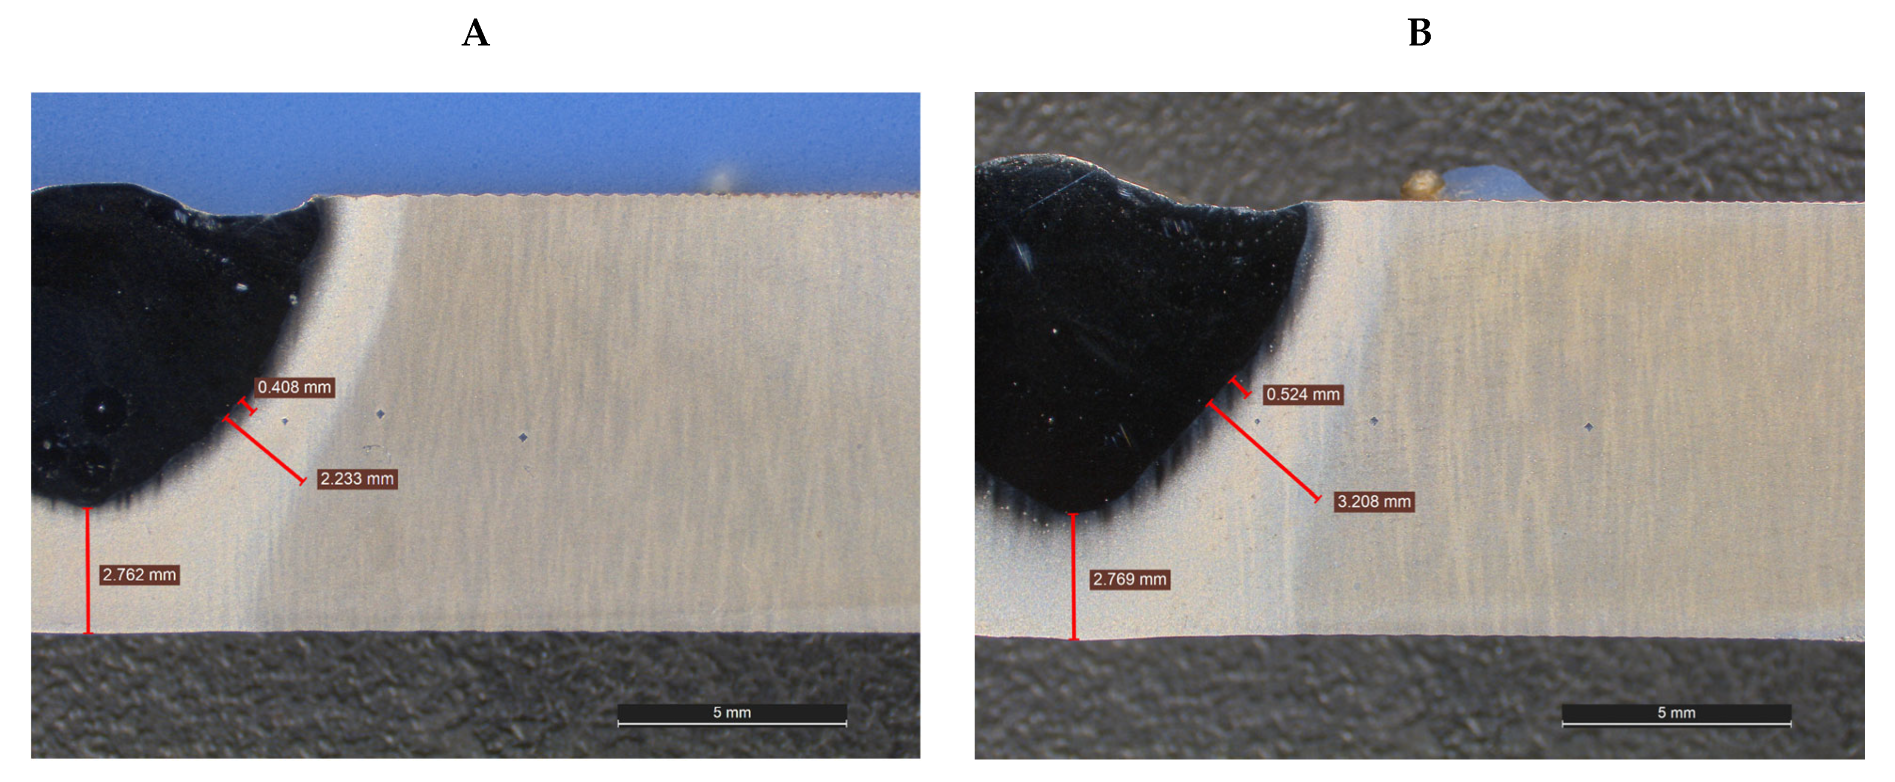
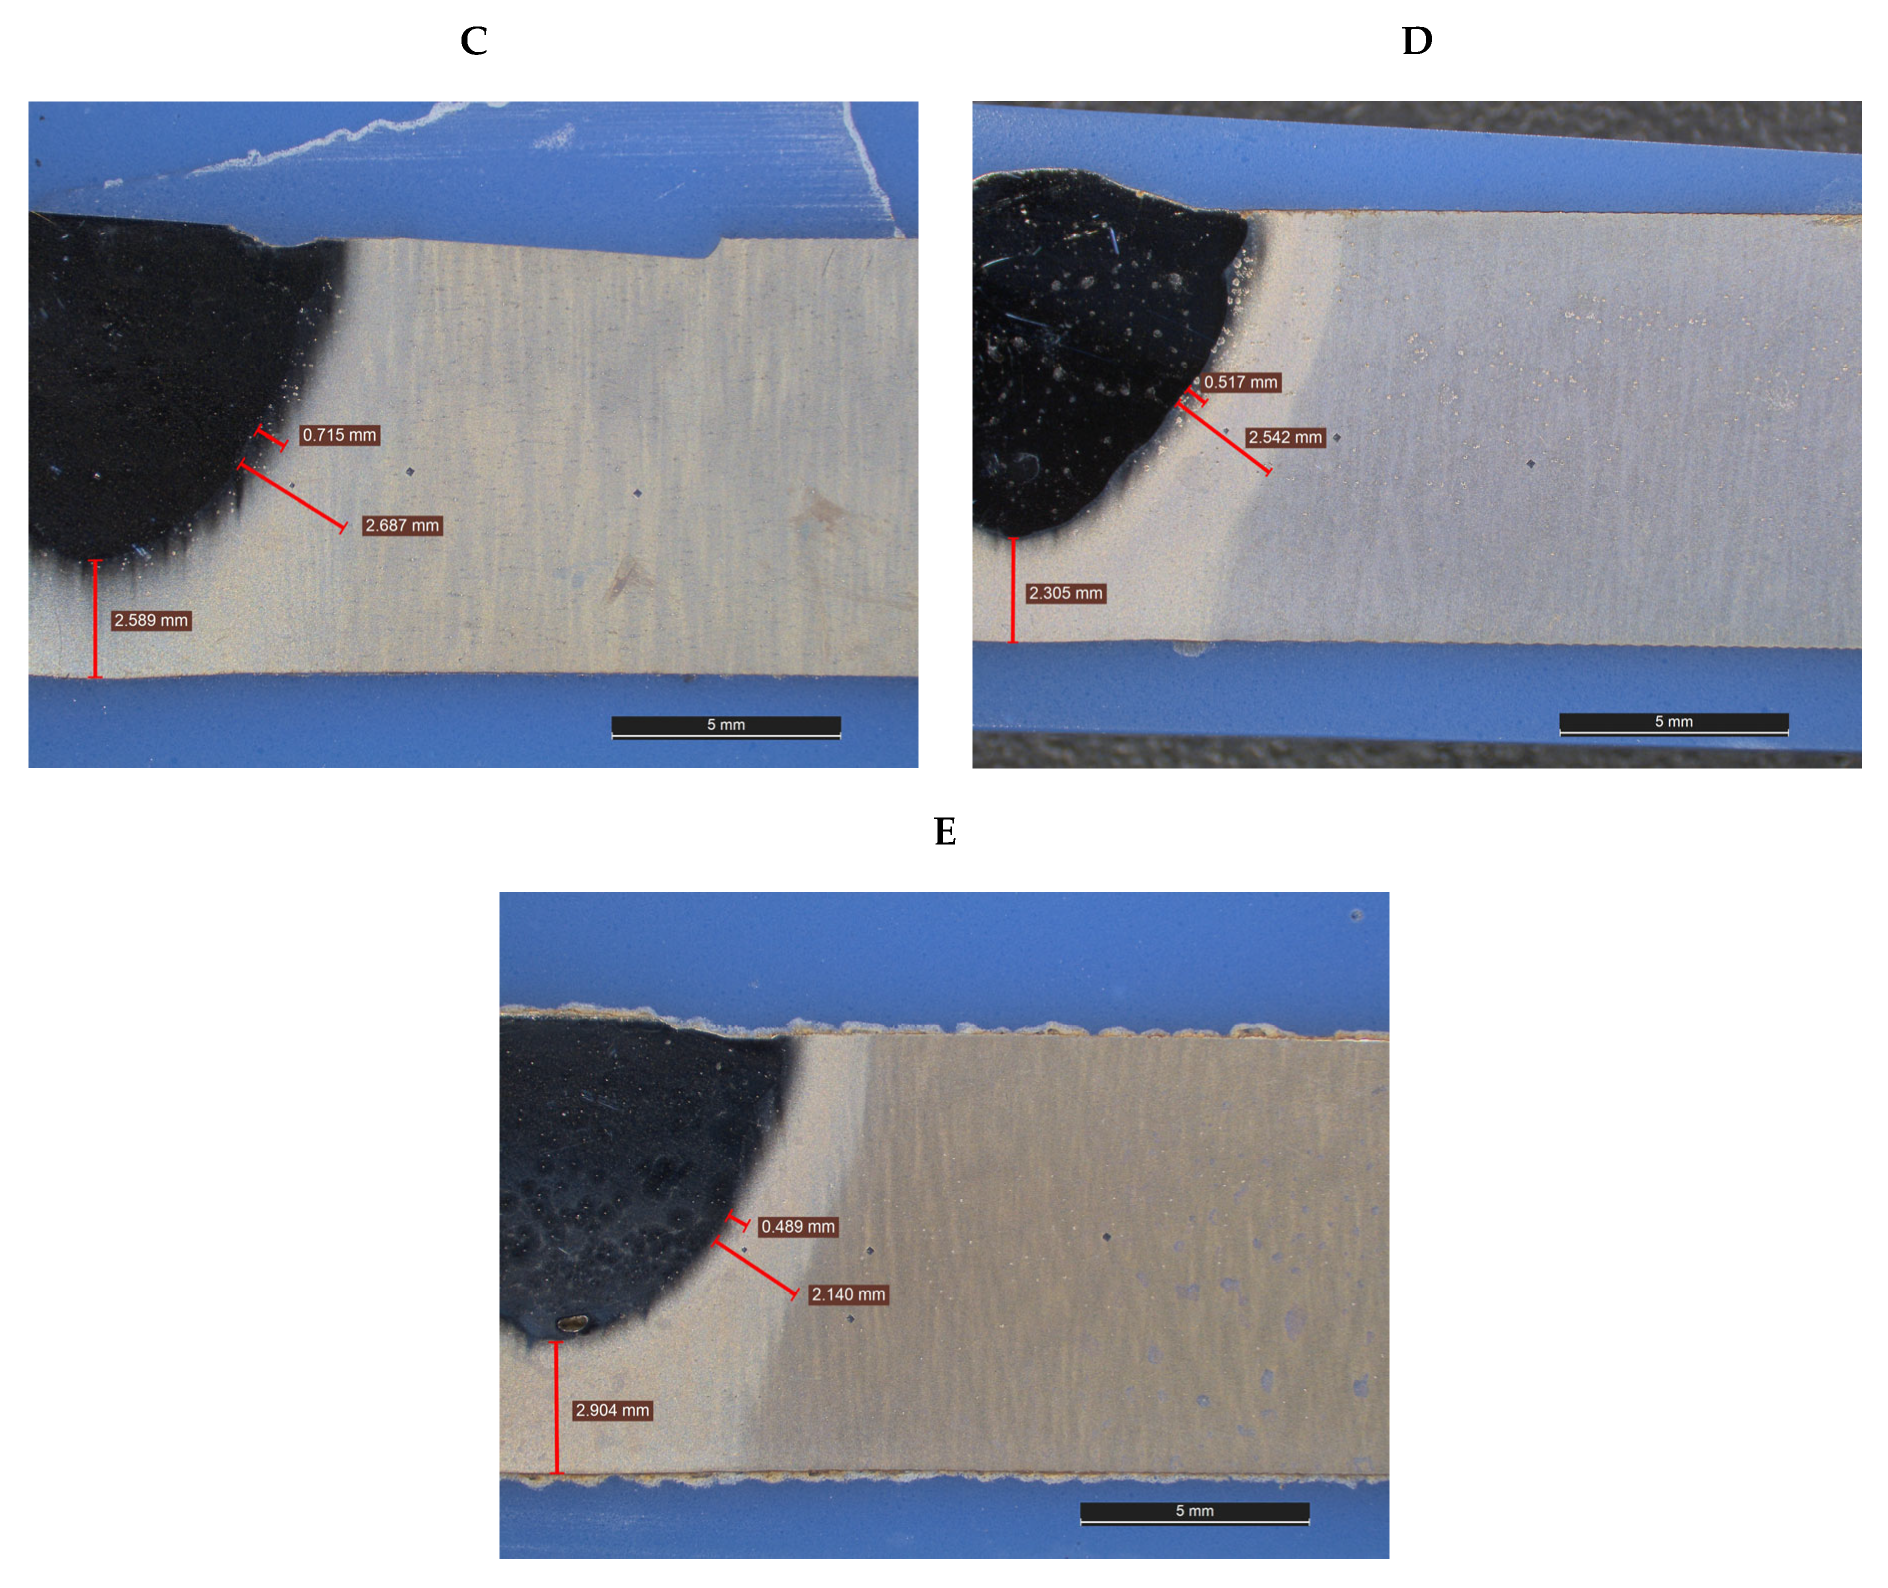
The transverse cutting was performed by water jet cutting using an abrasive jet cutting machine (MAXIEM 1530, OMAX Corporation, Kent, WA, USA). For the macroscopic examination, the samples were ground, polished, and etched with 6% NITAL reagent for 6 s. Subsequently, photographs were taken, and measurements were carried out on areas with different appearances within the heat-affected zone (HAZ). These analyses were performed using an S9D LEICA macroscope from Leica Microsystems, Heerbrugg, Switzerland, equipped with the LAS V4.10 visualization, measurement, and imaging software. The cross-sectional appearance and the corresponding measurement results are presented in Figure 9 and Table 5.
Visually, three distinct zones can be identified: the penetration depth at the root, the dilution zone, and the heat-affected zone (HAZ). The measured dimensions of these zones are listed in Table 5.

3.4. Hardness

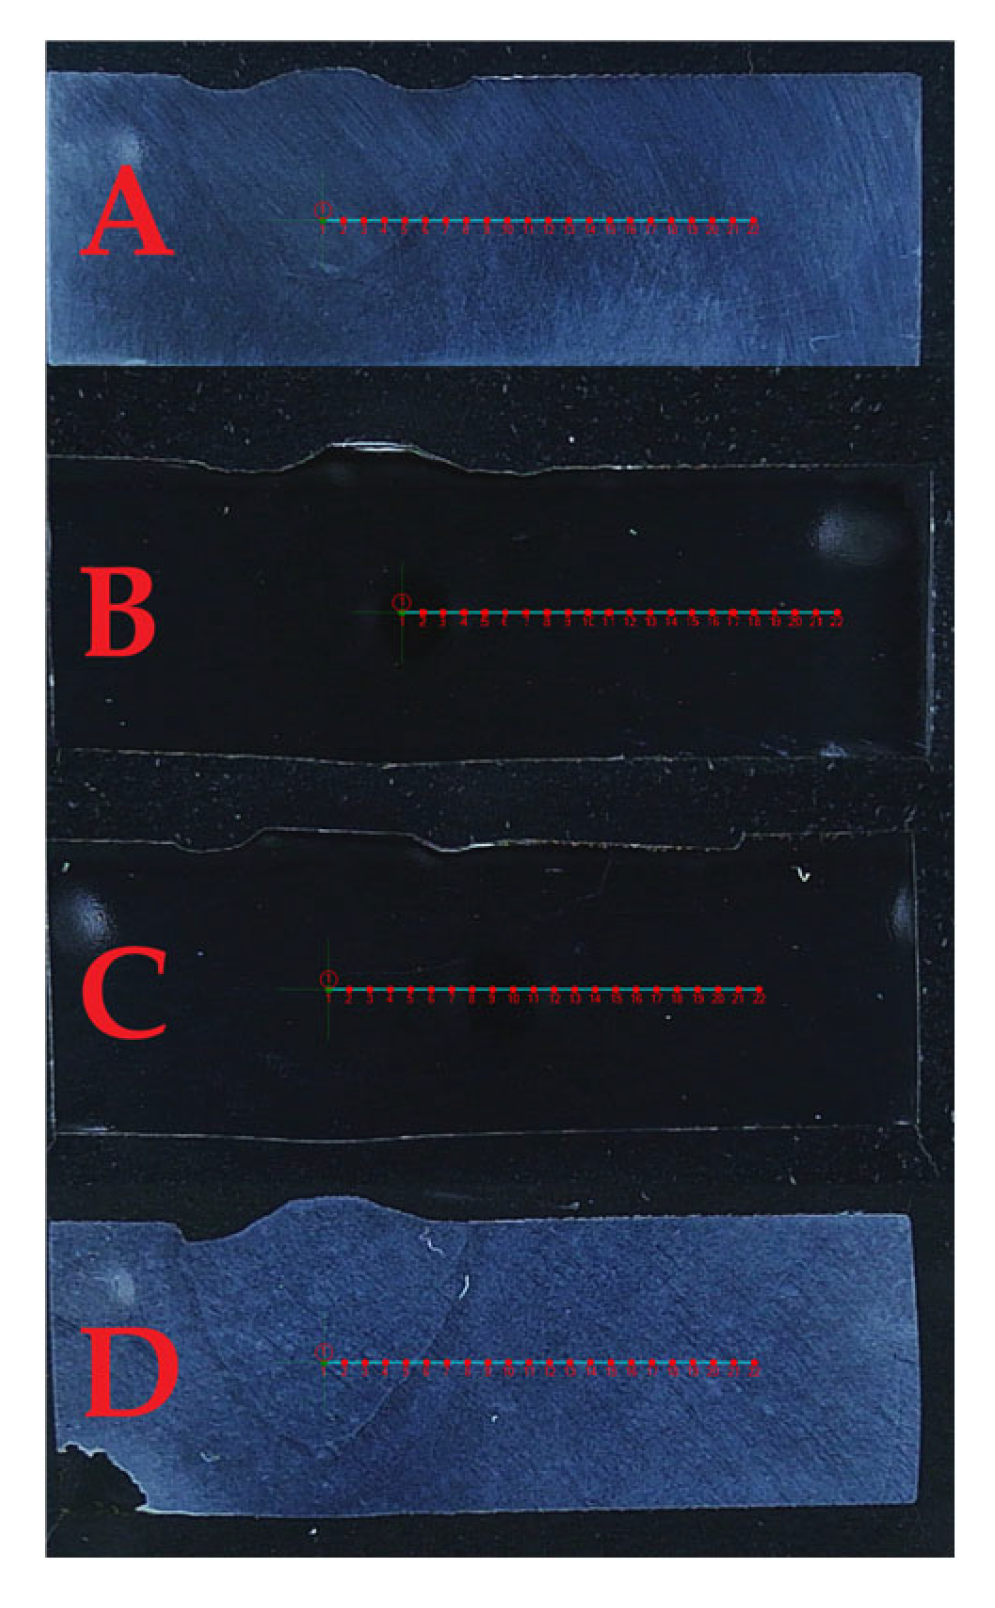
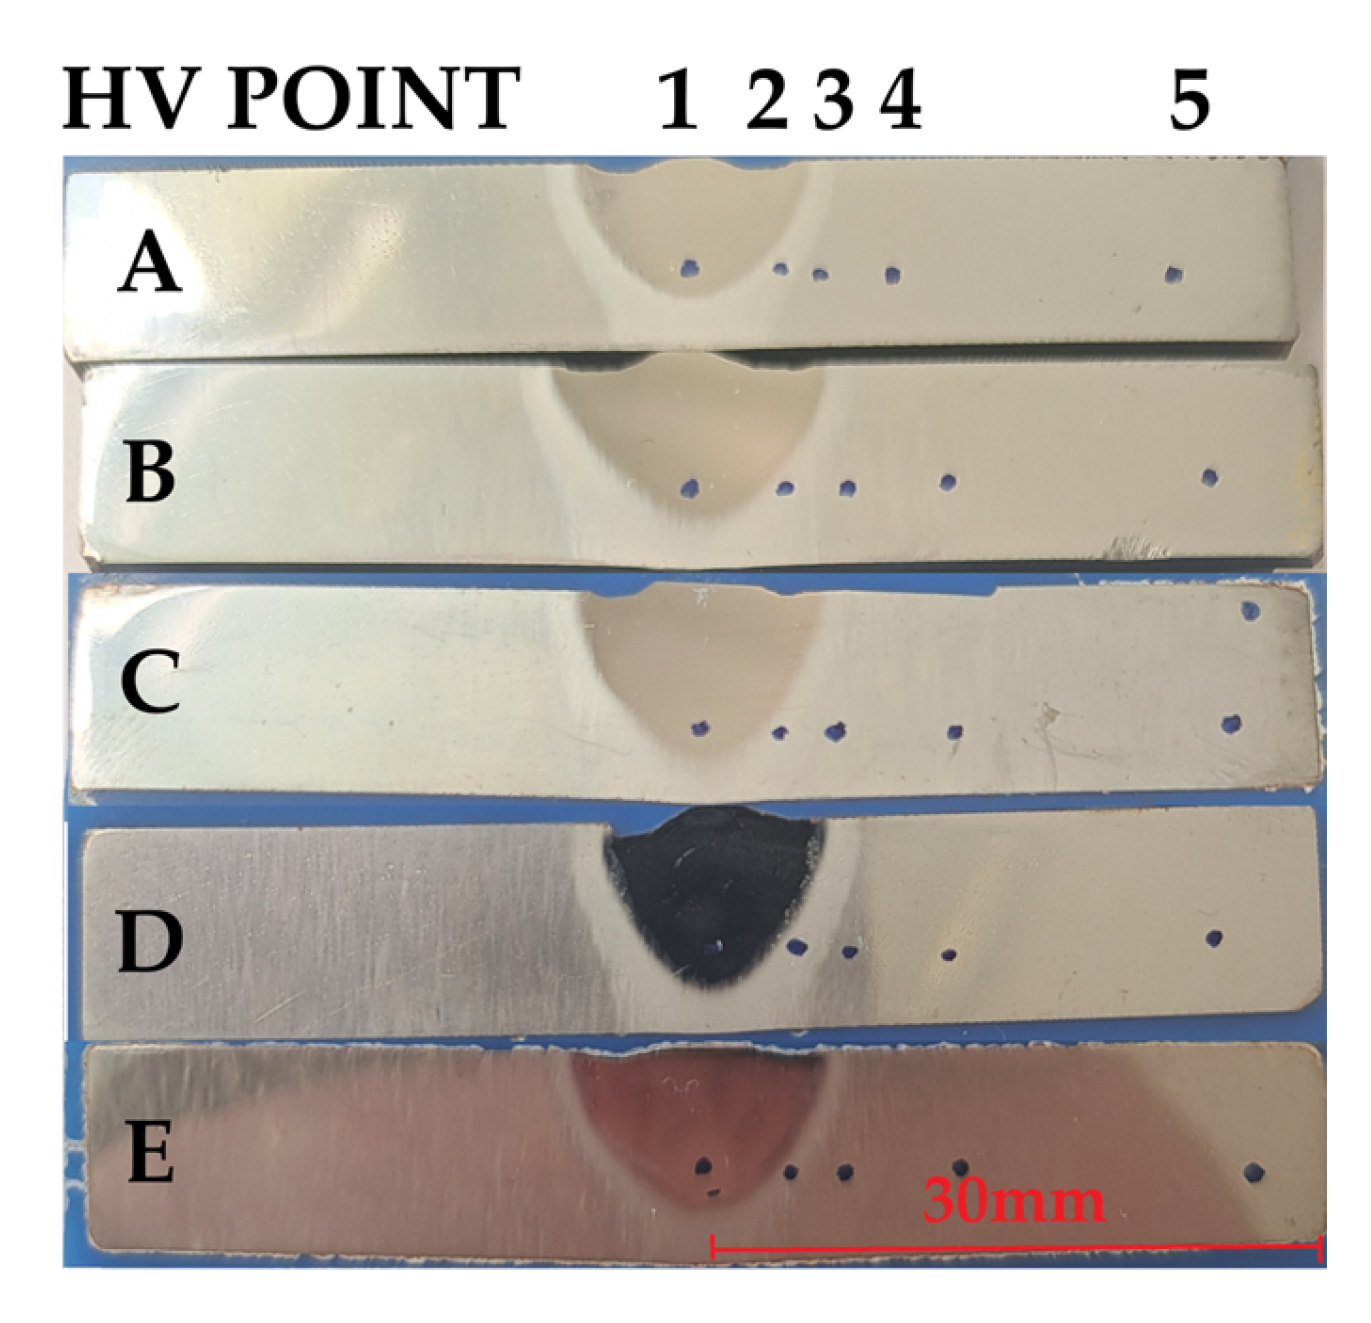
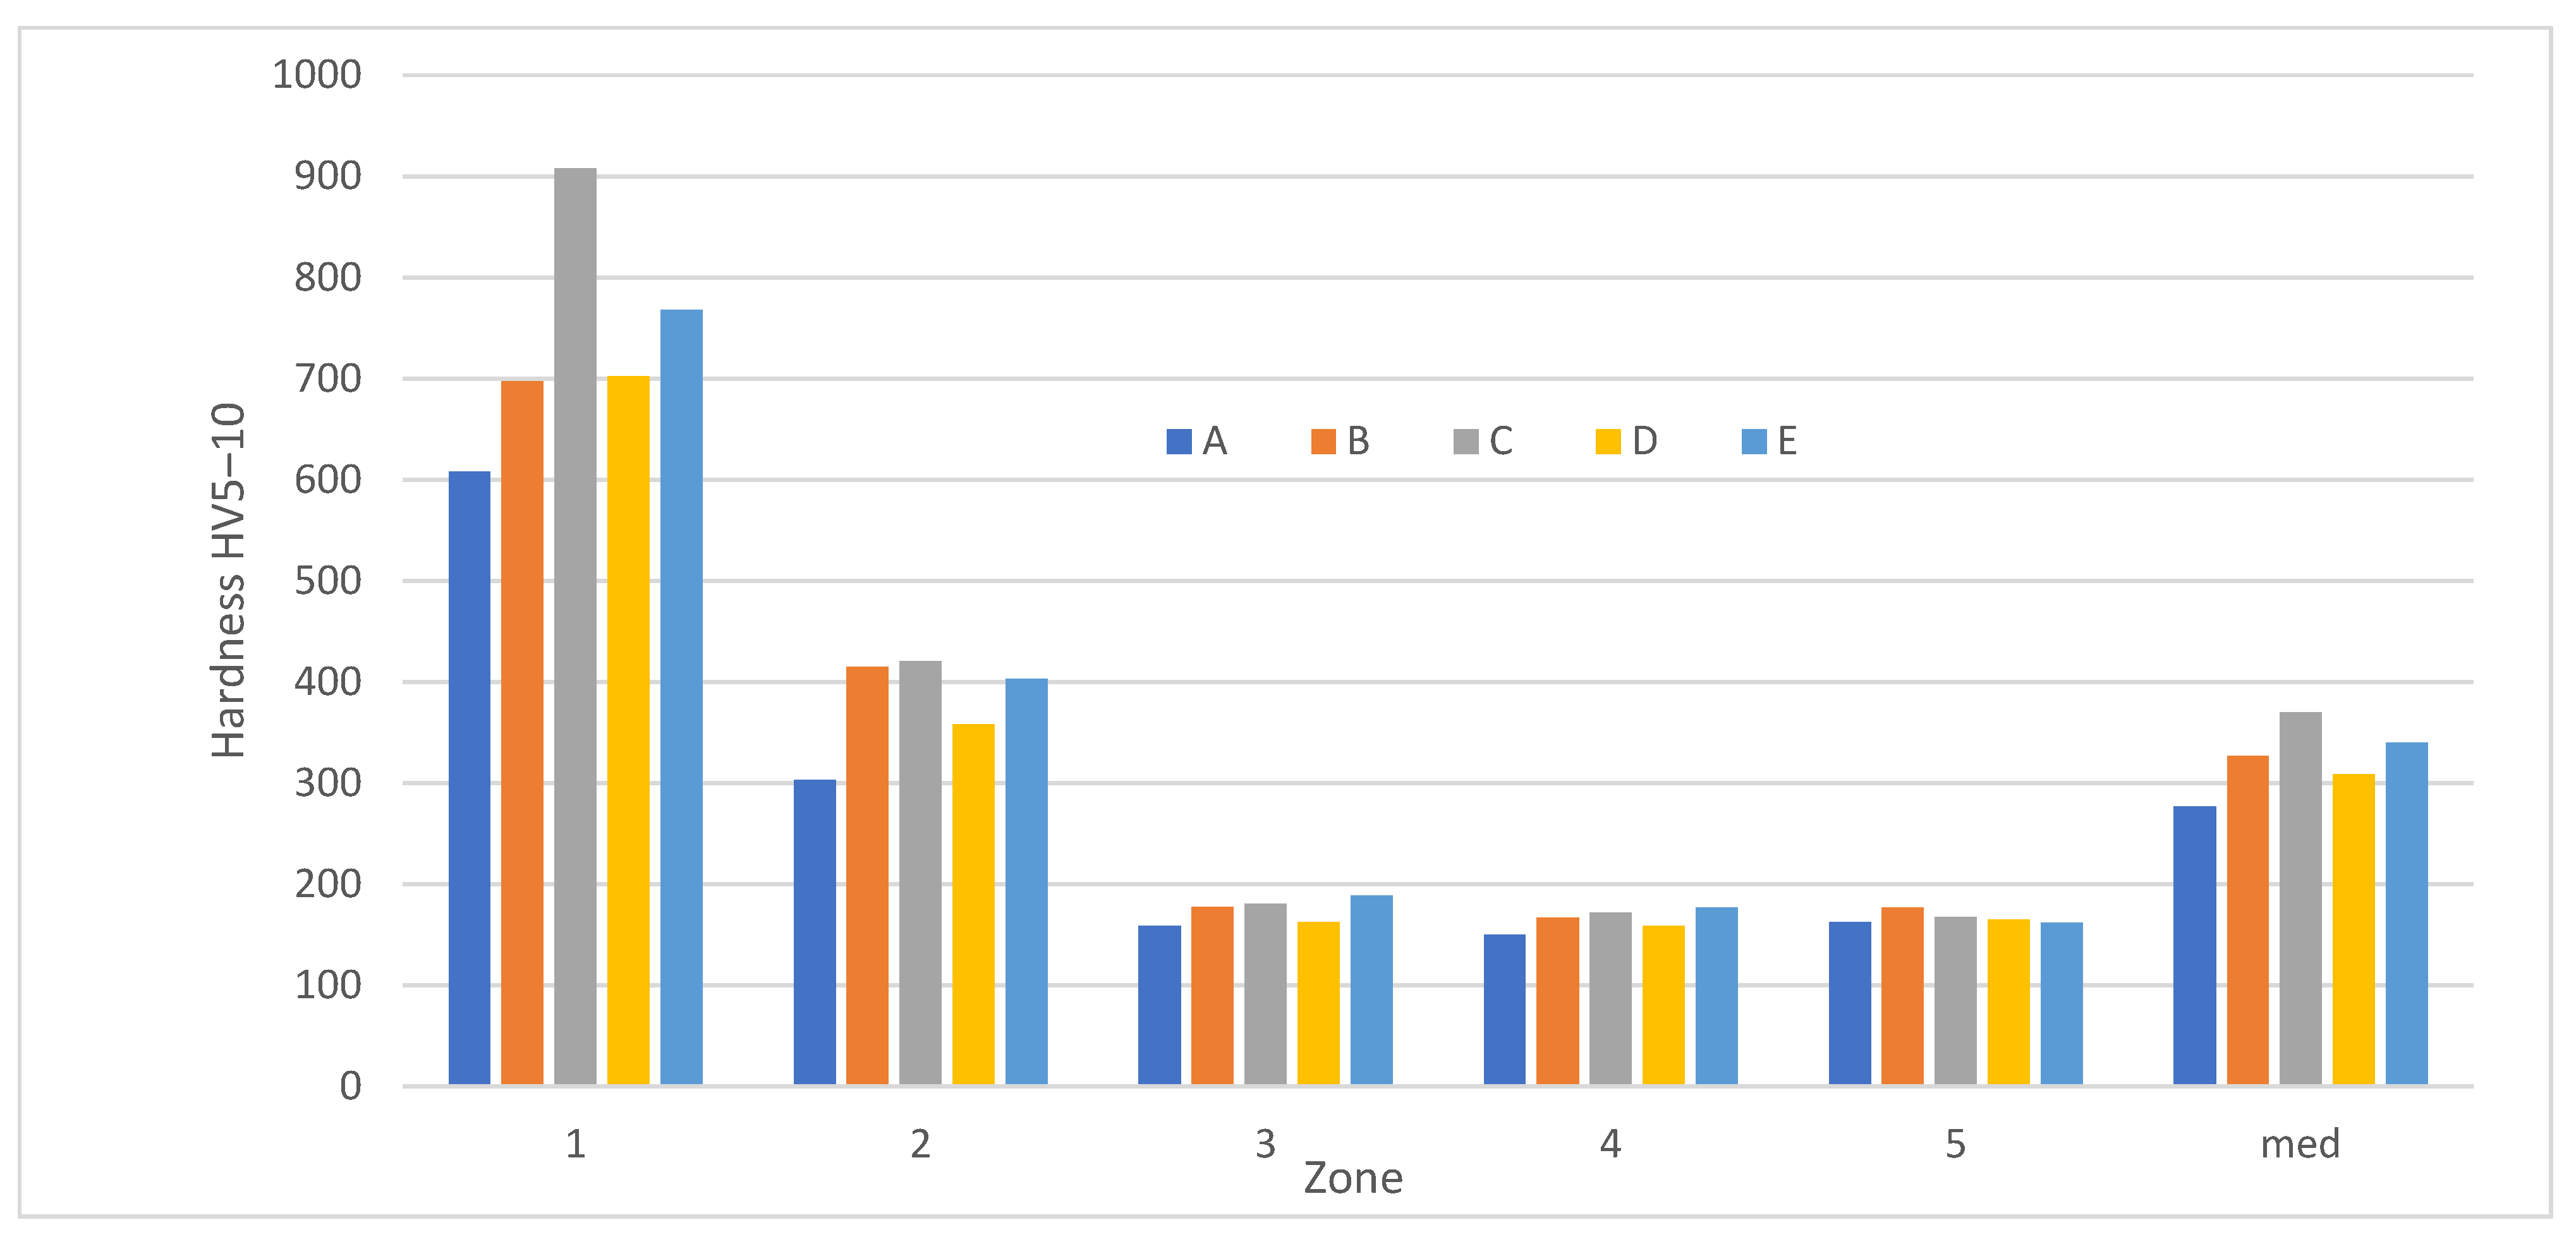
Figure 10 shows the transverse cross-sections taken at a distance of 50 mm from the final end of the weld. The blue points indicate the locations where the Vickers hardness indentations (HV5–10) were performed, and their values are listed in Table 6. These measurements determine, for each specimen, the hardness values corresponding to five specific zones within the heat-affected zone (HAZ). The zones with different appearances are marked in Figure 10 by numbers from 1 to 5. The distance of the hardness indentations from the lower surface of the specimen was maintained at 4 mm. The hardness measurements were carried out using a Vickers hardness tester, type ISH-TDV1000A, INSIZE Co., Ltd., Suzhou, China.

3.5. Vickers Microhardness

Macrohardness measurements use relatively high indentation loads; therefore, the resulting impressions have dimensions that cover the area of several grains. Consequently, in most cases, macrohardness provides a more representative and global characterization, since the indentation produced by the indenter reflects the properties of a larger material volume.
However, when characterizing anisotropic materials, materials with heterogeneous precipitation (segregations), and/or significant variations in chemical composition (such as transition zones between two different materials), and/or different internal stress states (resulting from varying cooling rates), macrohardness measurements may lead to deviations that can be misinterpreted. Thus, especially in transition zones between two materials, where these effects are combined, microhardness measurements allow for a more accurate interpretation.
In the present study, a more precise assessment of the hardness variation within the weld bead and of the hardness trends resulting from the influence of mechanical vibrations can be obtained by calculating the arithmetic mean of the hardness values measured in the deposited material, both in the weld center and progressively toward its edges, where the cooling rate decreases. Under the same conditions, a similar analysis can be performed for the base material (BM), allowing an observation of the global hardness variation trend.
For this purpose, linear hardness analyses (LHA) were carried out using a fully automated hardness tester of the model FALCON 600G2, INNOVATEST Europe BV, Maastricht, The Netherlands. With this equipment, Vickers hardness measurements (HV 0.2, 10 s) were performed on polished specimens with a step of 0.7 mm, starting from the weld centerline, while maintaining a constant distance of 5 mm from the lower surface of the specimen (Figure 11). Unfortunately, the positioning data of the hardness measurements for specimen E were lost, and those corresponding to specimens B and C are of limited quality. The hardness tester operates fully automatically, thus excluding human influence.
Finally, the arithmetic mean values of the hardness measurements were calculated for the deposited material (first five measurements) and for the base material (measurements 6–20), as presented at the end of Table 7.

3.6. Microstructure

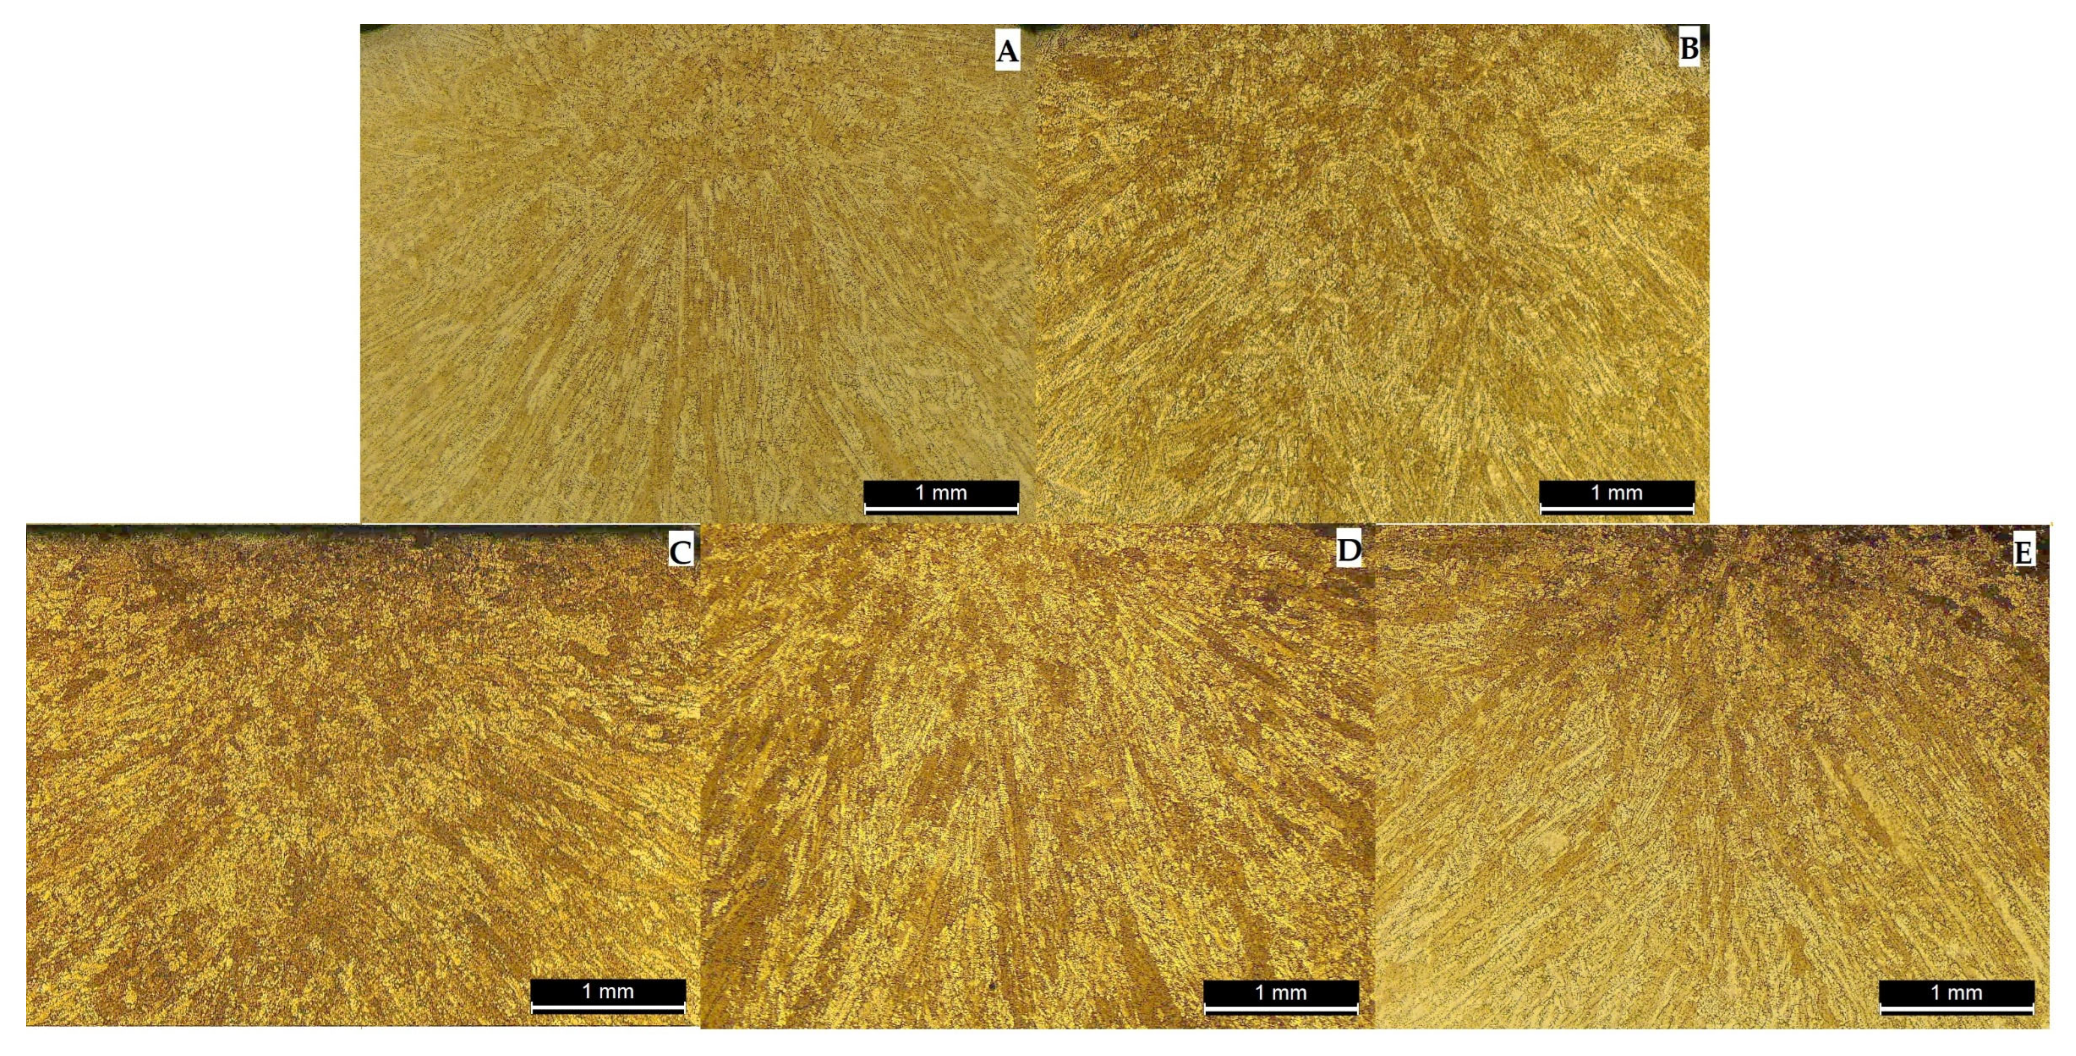
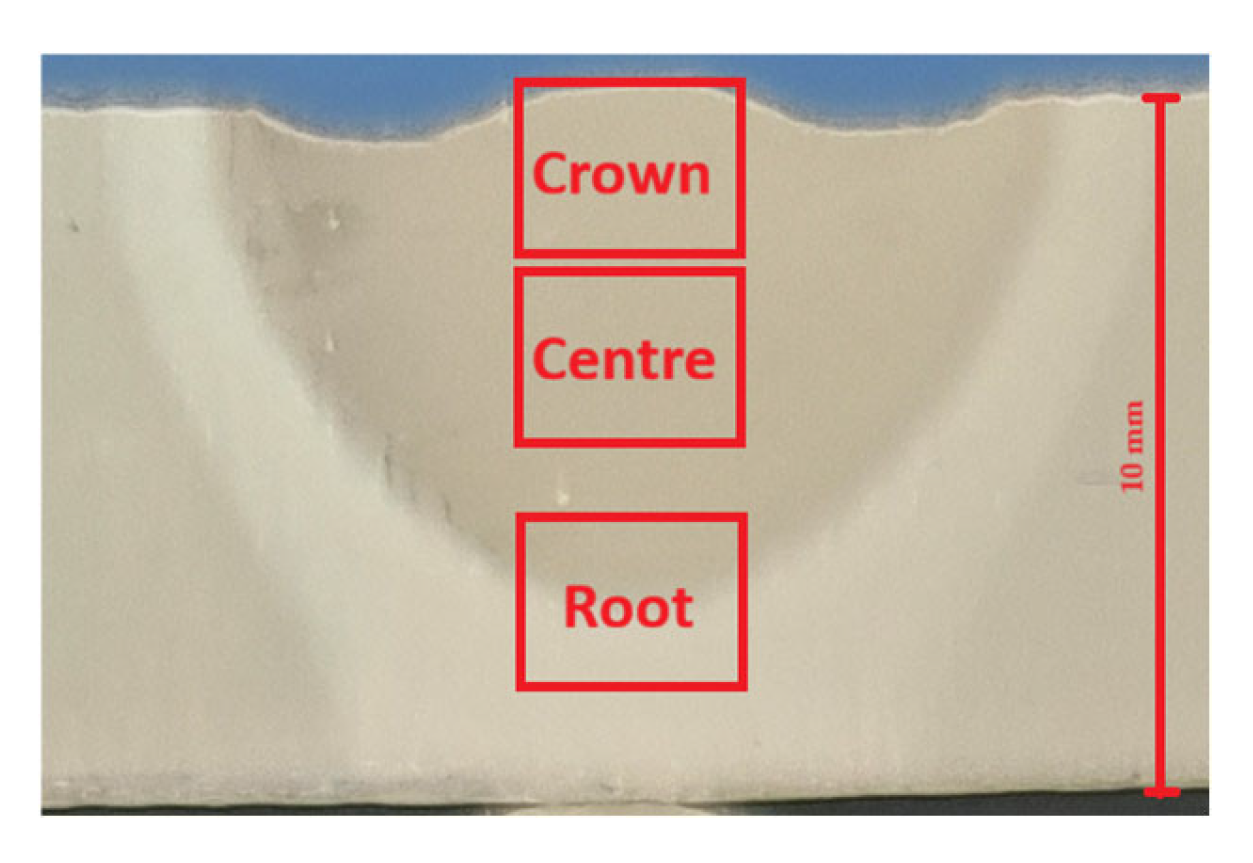
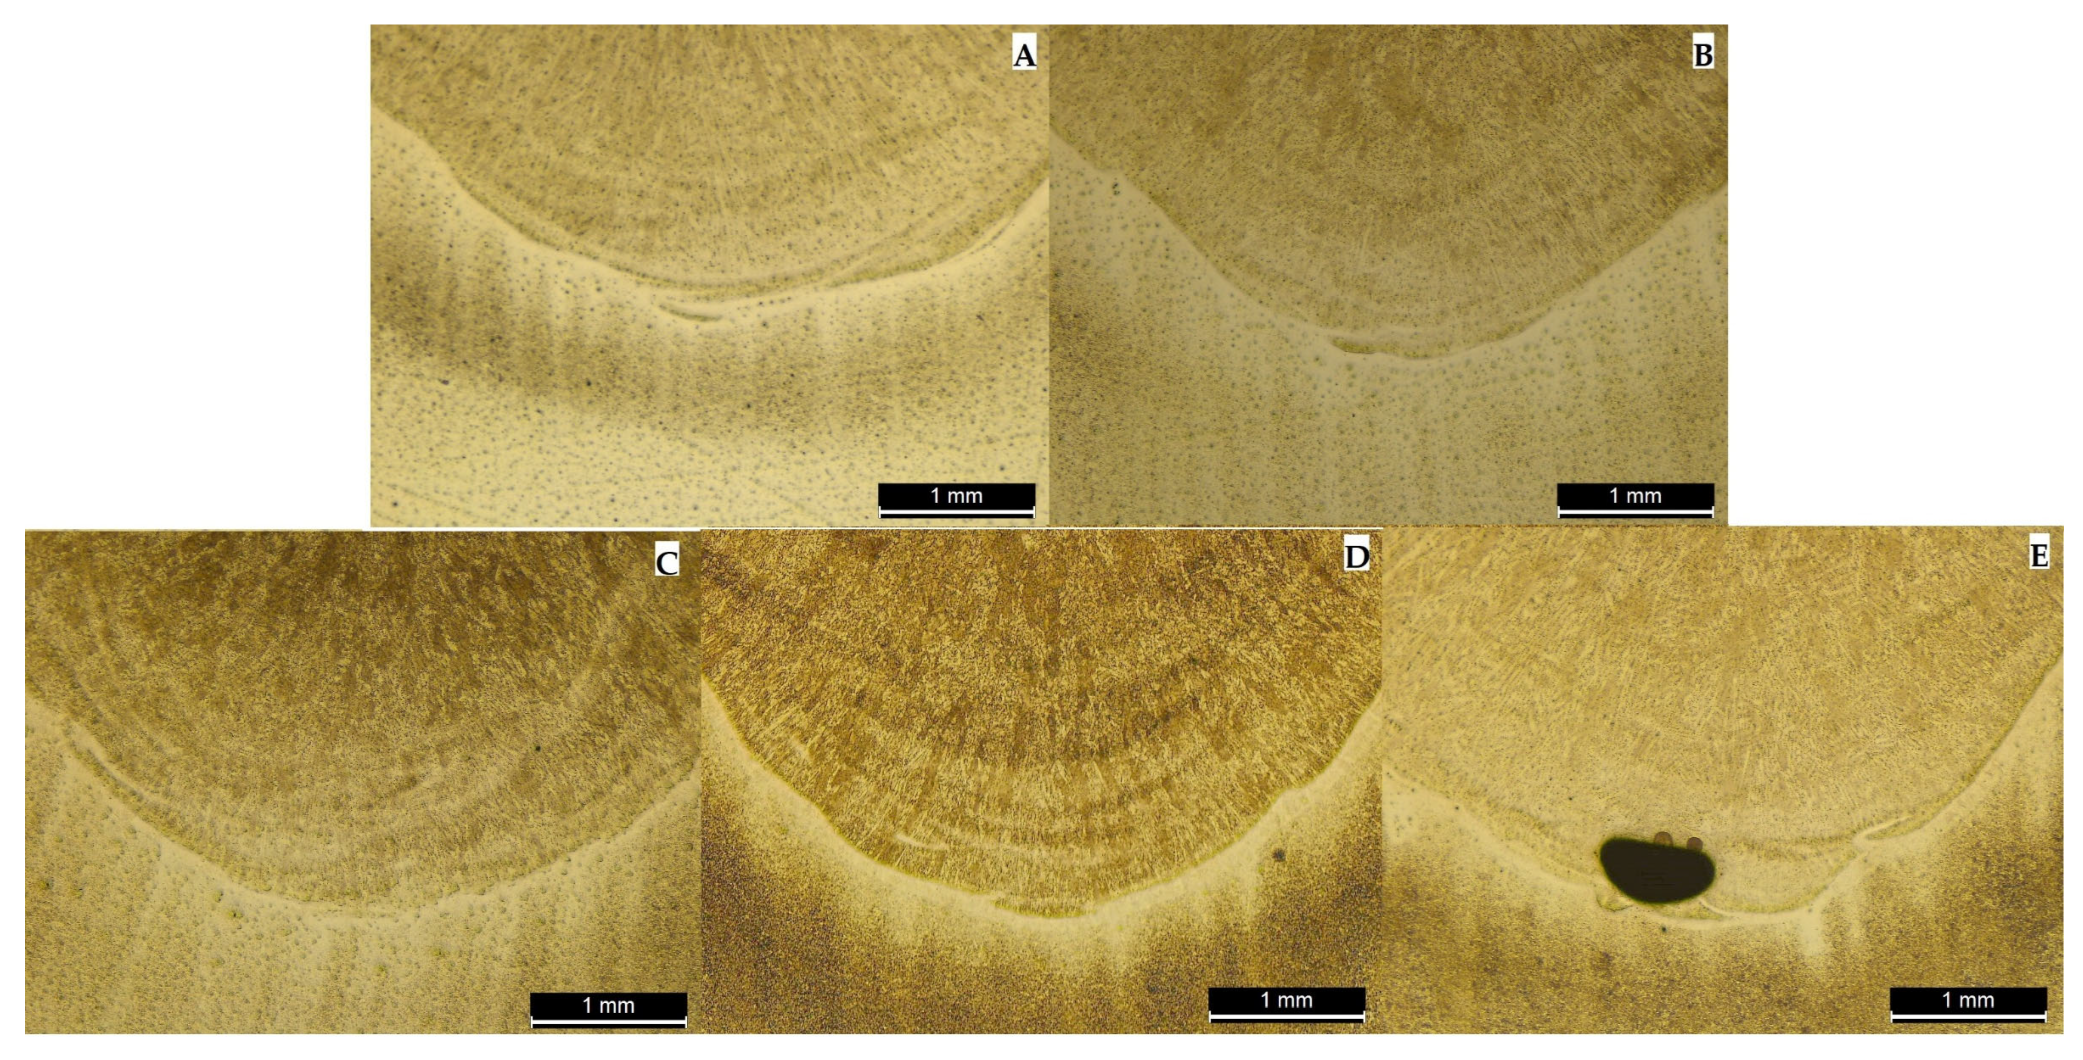
The microstructures were analyzed after etching using Aqua regia (1/4 HCl, 3/4 HNO3) for 8 s for the filler material, and Nital 6 (6% HNO3 + 94% ethyl alcohol) for 6 s for the base material. For the microscopic analysis of the deposited weld material, micrographs were taken in three distinct zones, as shown in Figure 12. The regions of interest were defined based on previous experience in this field and on findings reported in the literature by other researchers [29].
For both etching procedures, the specimens were mounted together in a metallic fixture; therefore, the etching time and reagent concentration were strictly identical for all samples.
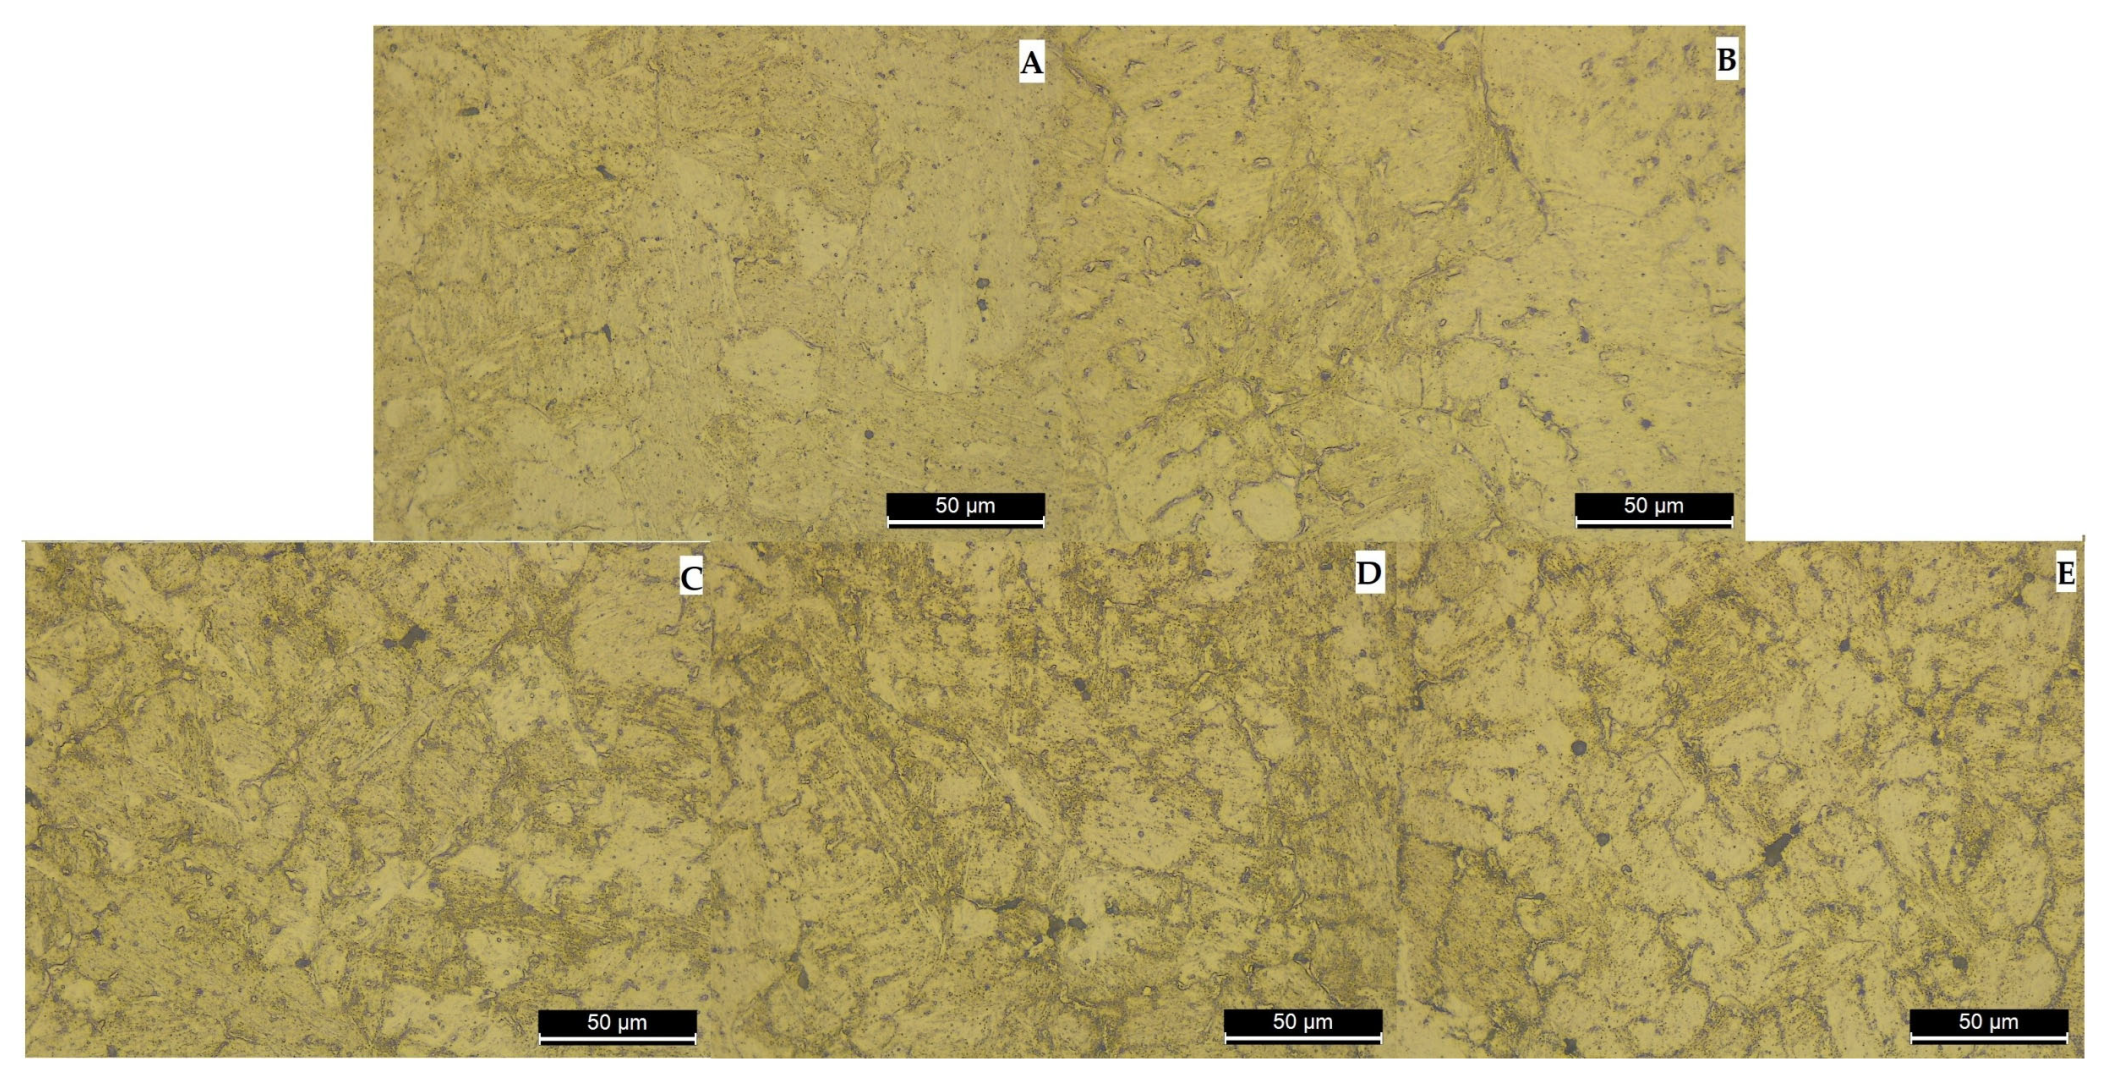
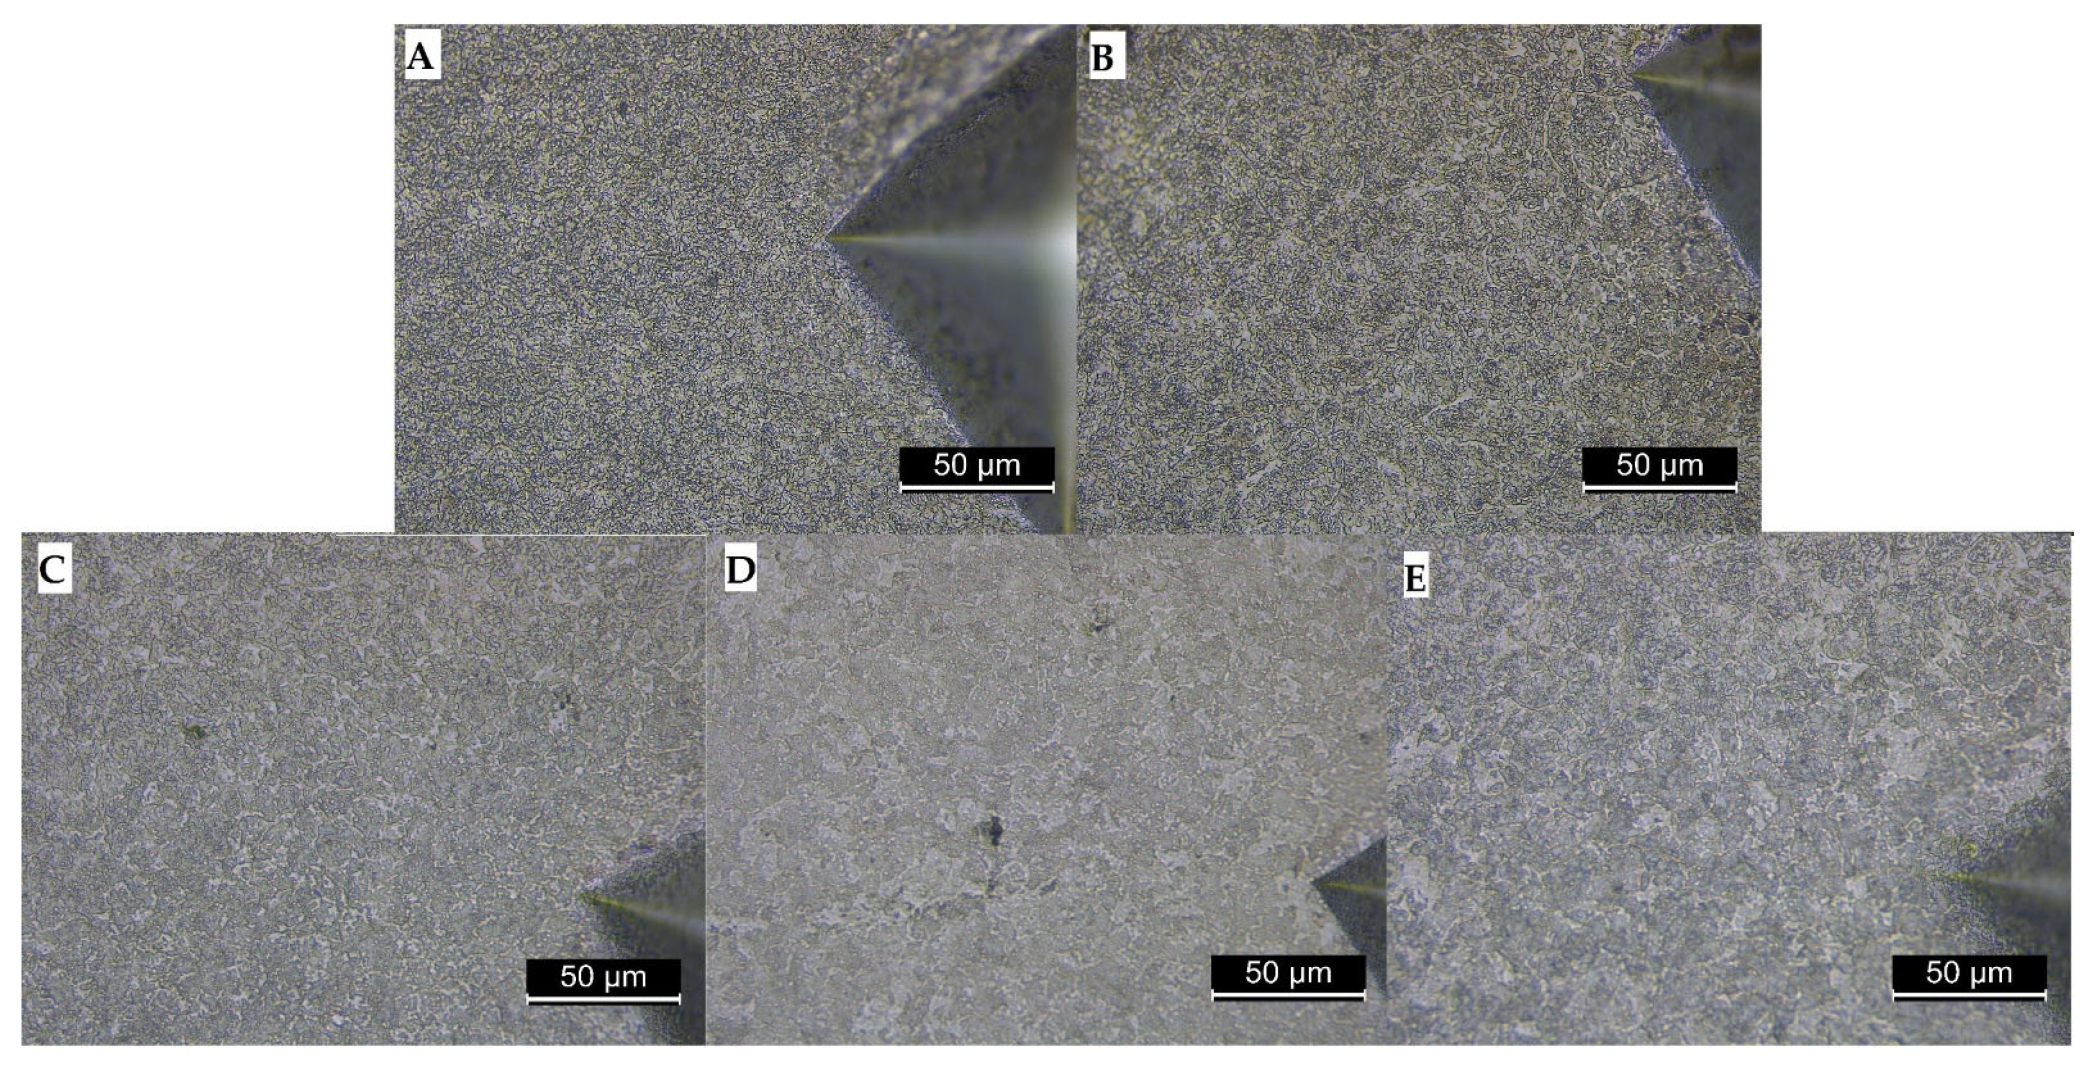
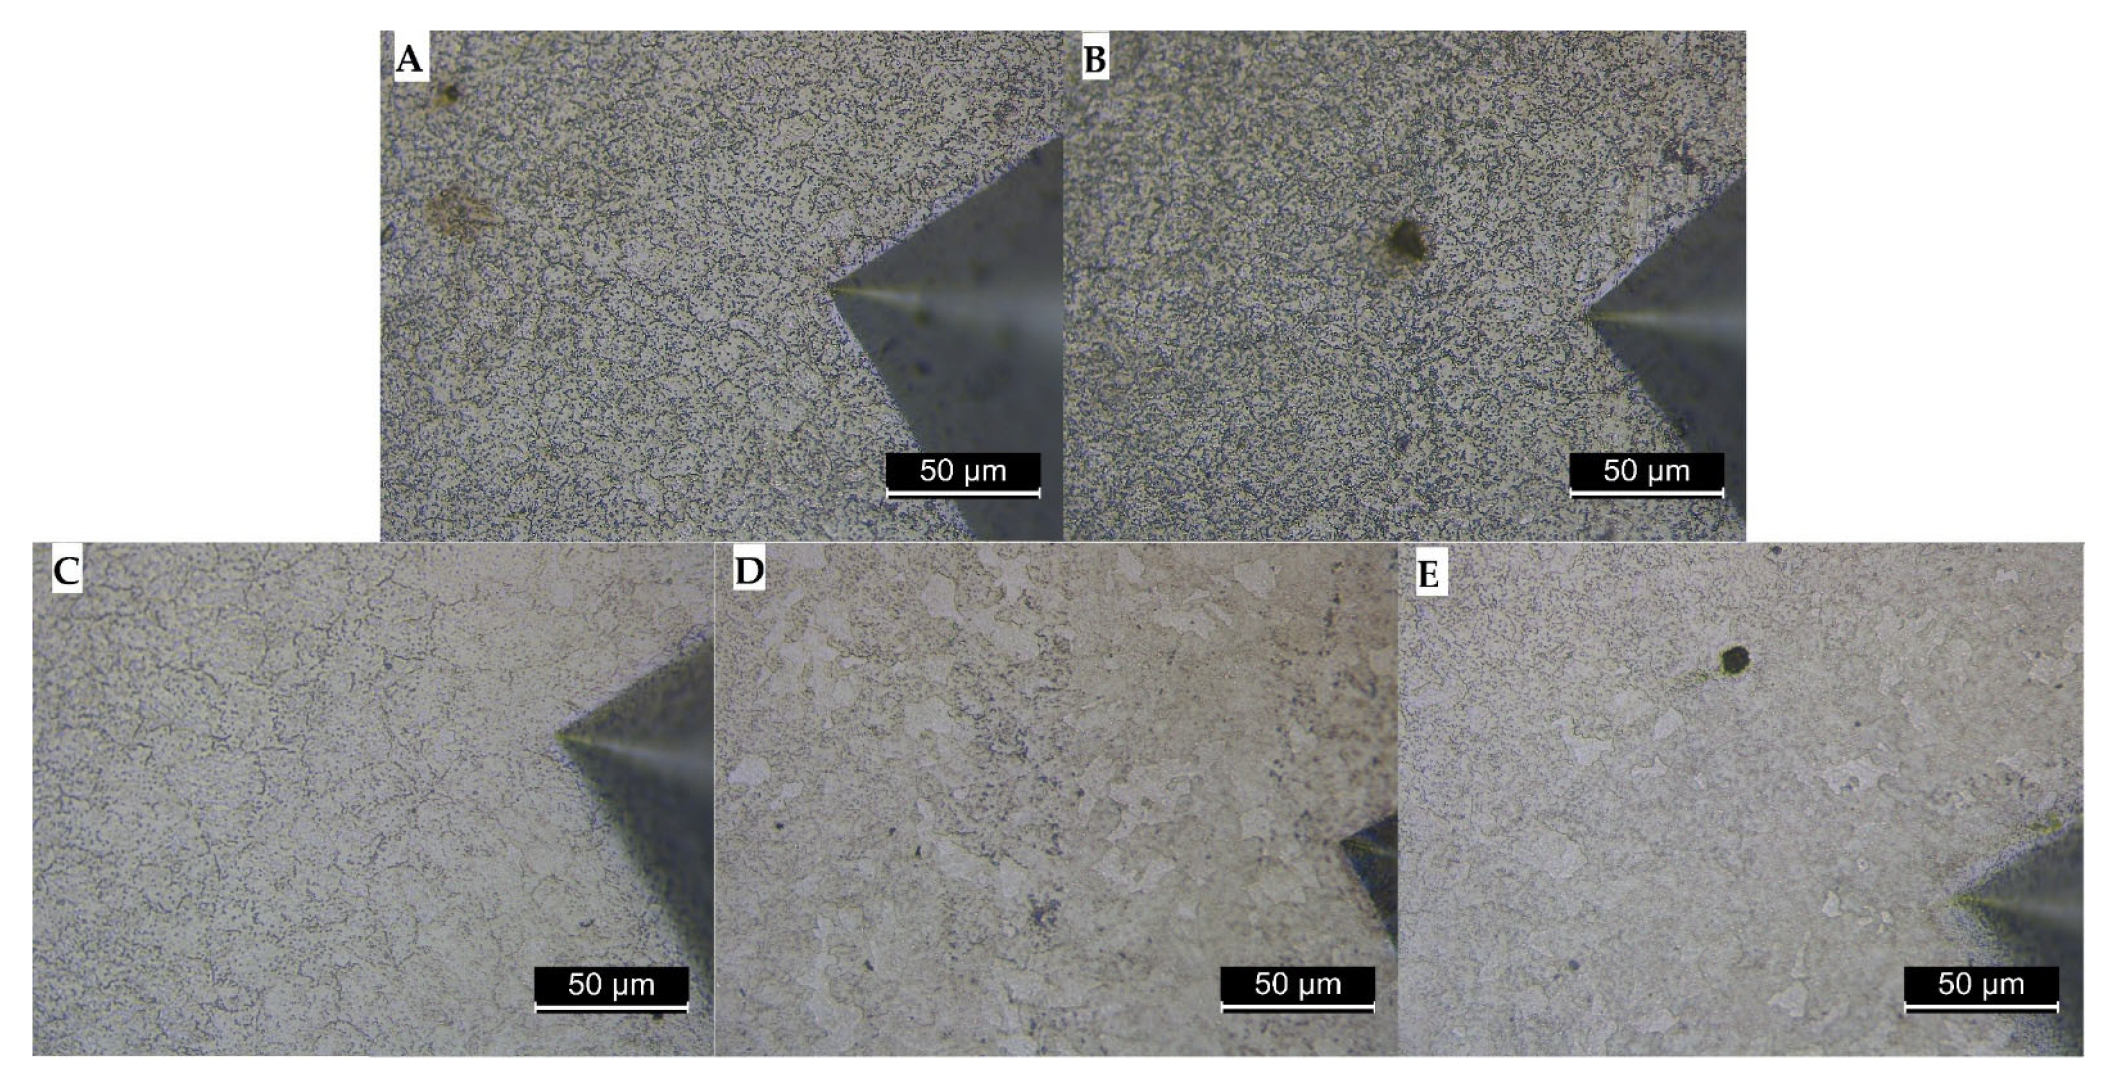
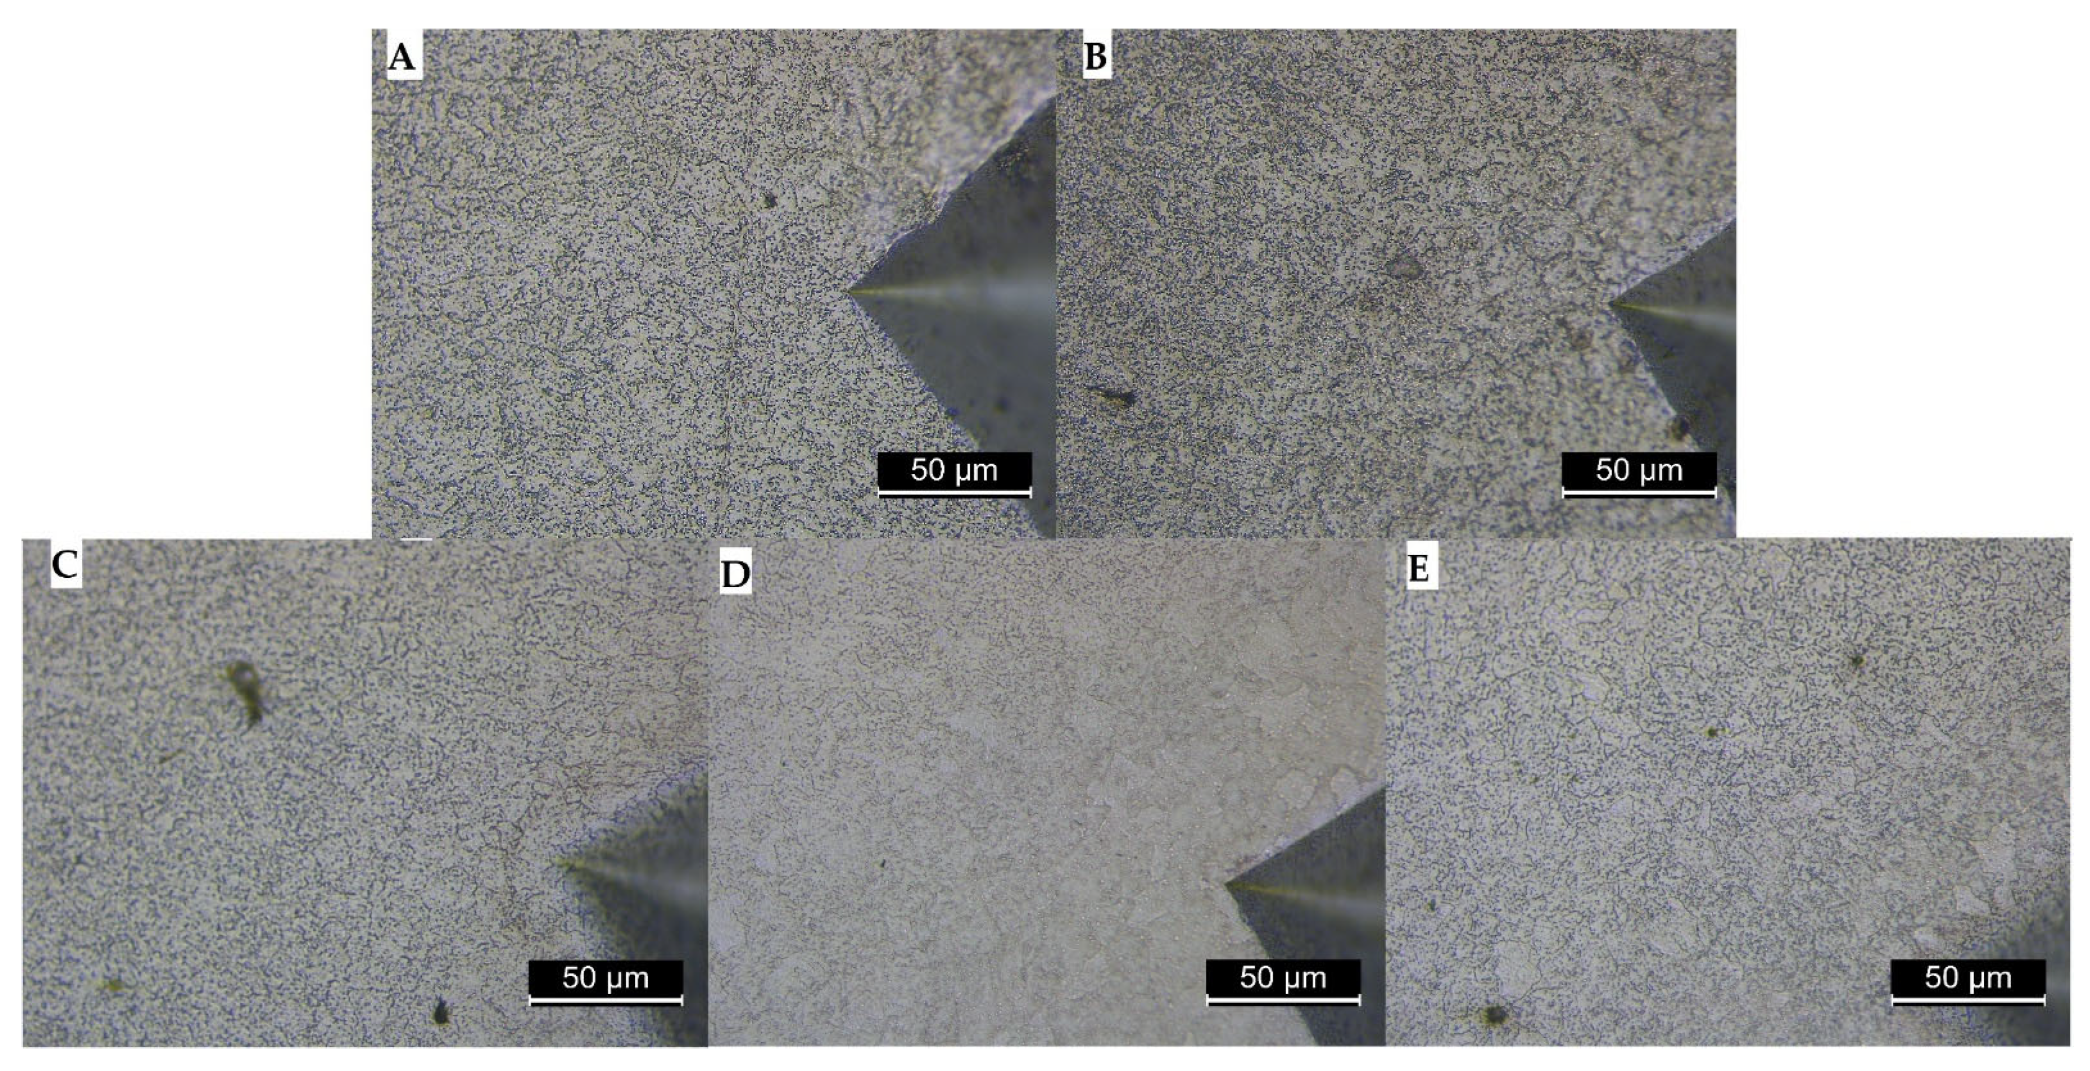
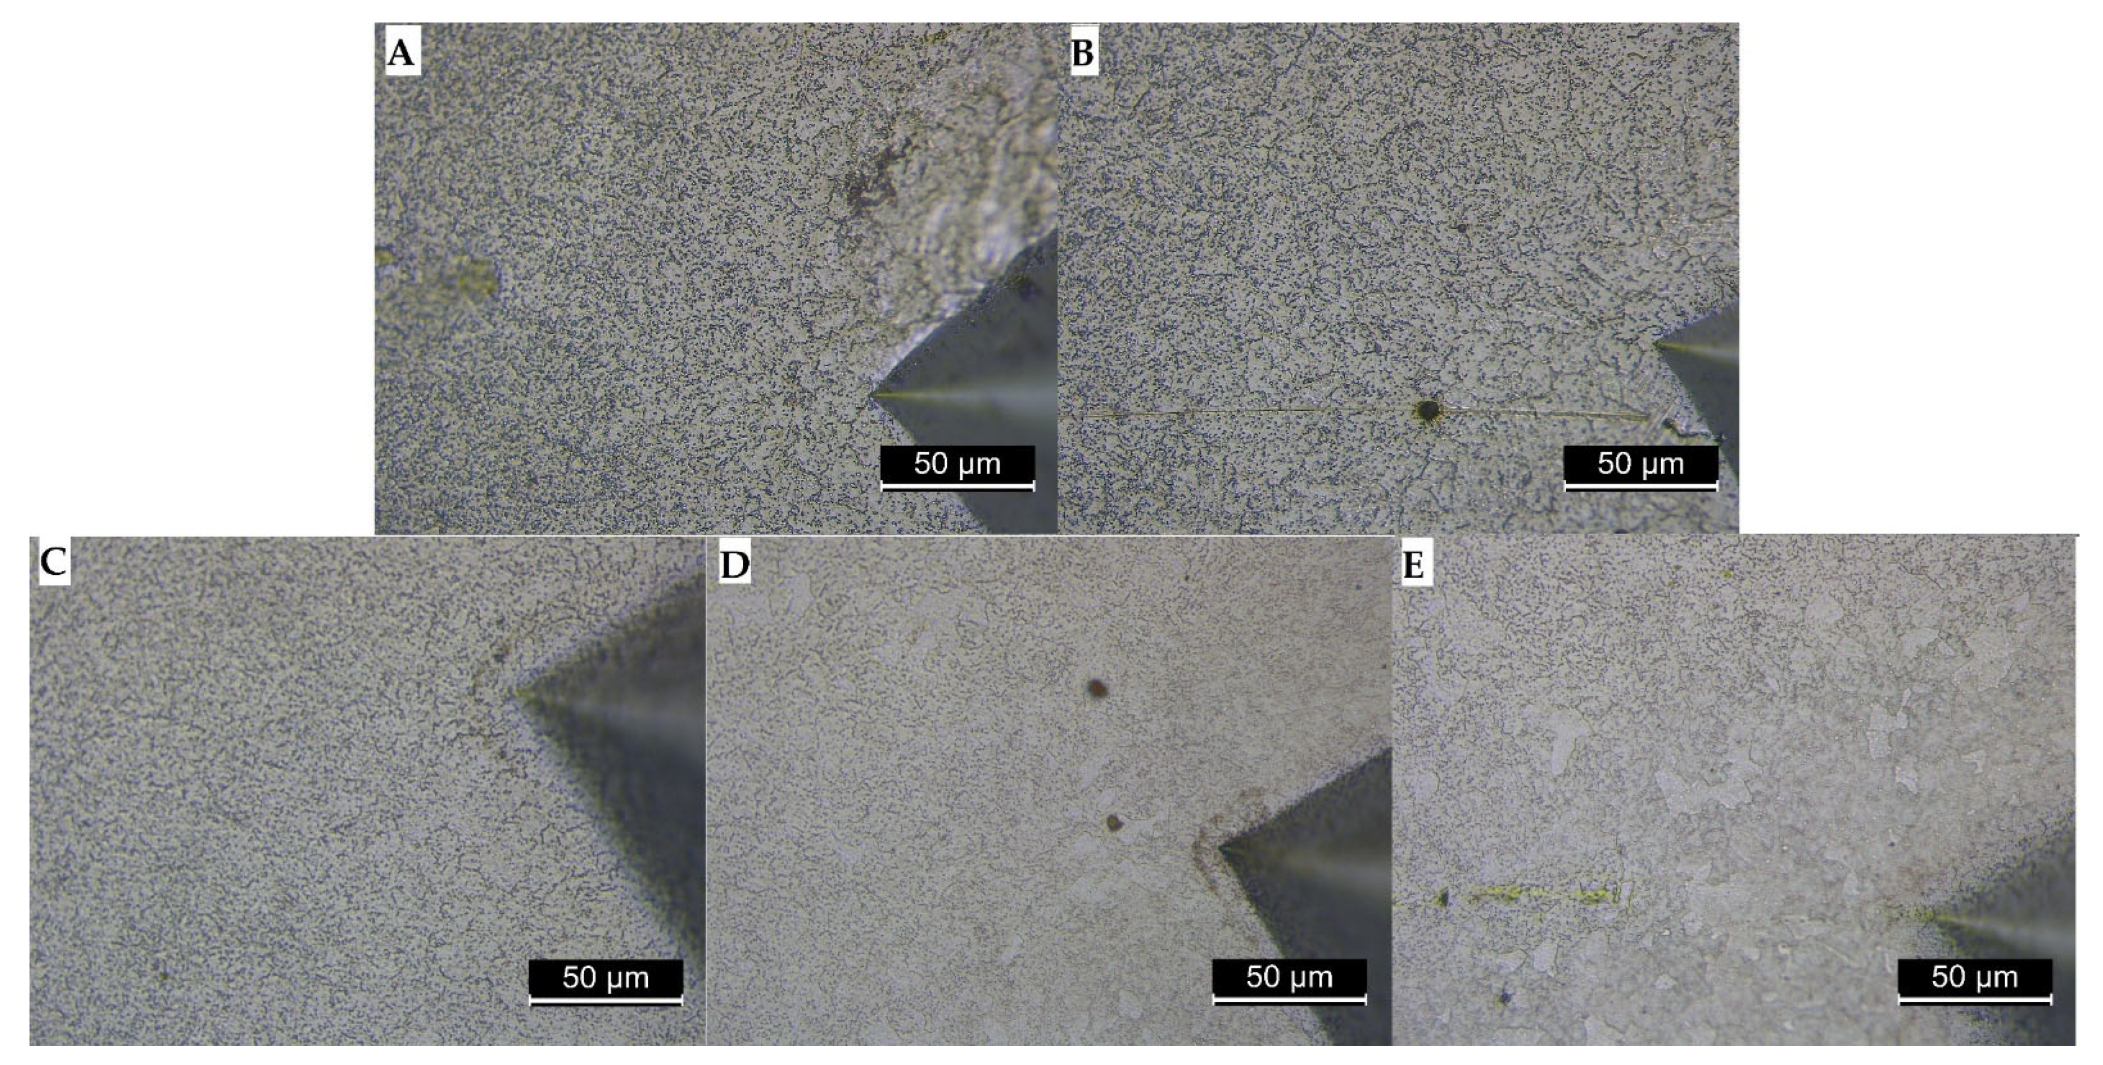
The microscopic images were acquired using a DM ILM LED Inverted Microscope, Leica Microsystems, Wetzlar, Germany, operated with LAS V4.10 software. Figure 13, Figure 14 and Figure 15 present the micrographs obtained from the CM region, while Figure 16, Figure 17, Figure 18 and Figure 19 show the microstructures of the BM in the vicinity of the hardness indentations marked as positions 2, 3, 4 and 5 in Figure 10. The corresponding comments and analysis are provided in Section 4, Results and Discussion, and Section 4.6, Microstructure analysis.

3.7. SEM with 3.8 EDS

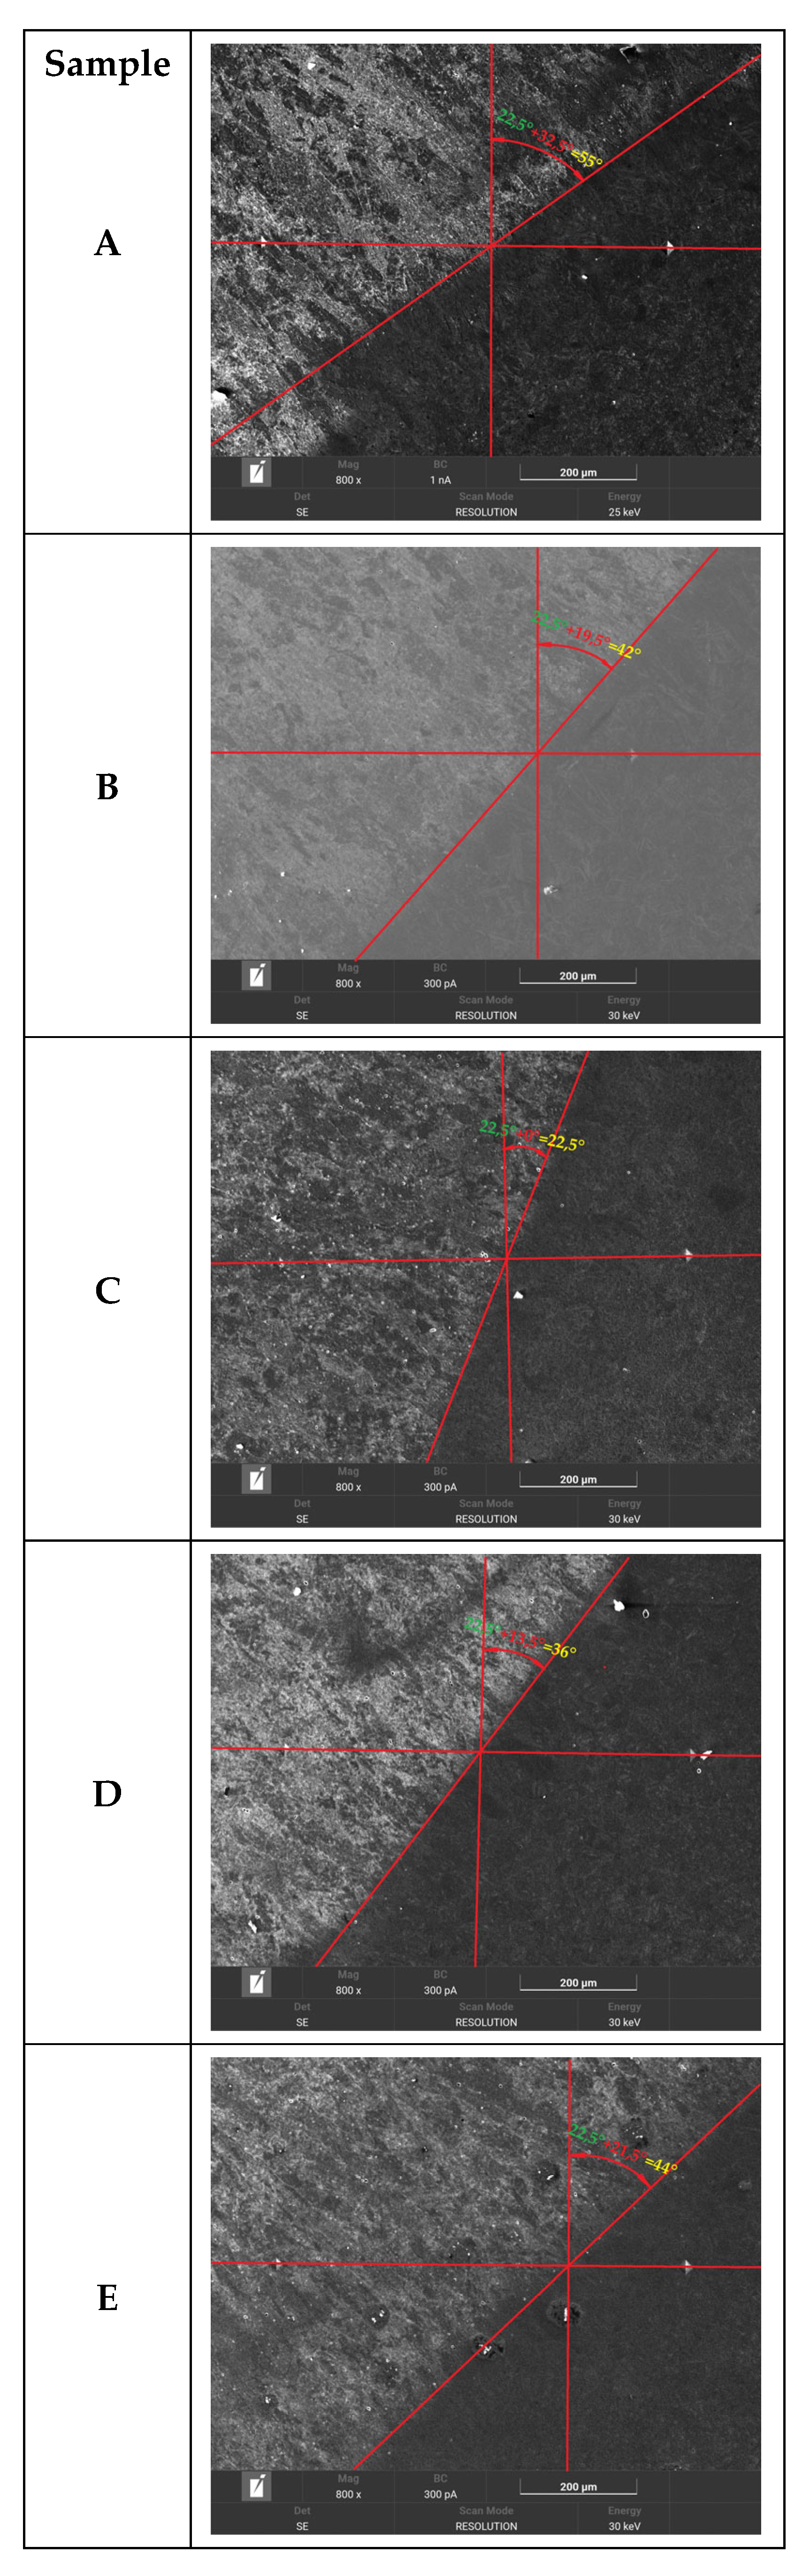
For a detailed investigation of the transition zone between the cladding material and the base material, scanning electron microscopy was performed at a magnification of ×800 (Figure 20). The image acquisition was adjusted to include hardness indentations 5 and 6 from Figure 11 (with corresponding values listed in Table 7) for all specimens. The microstructural analysis was performed using a scanning electron microscope (SEM), model TESCAN VEGA LMU S5124 (Brno, Czech Republic, 2023).
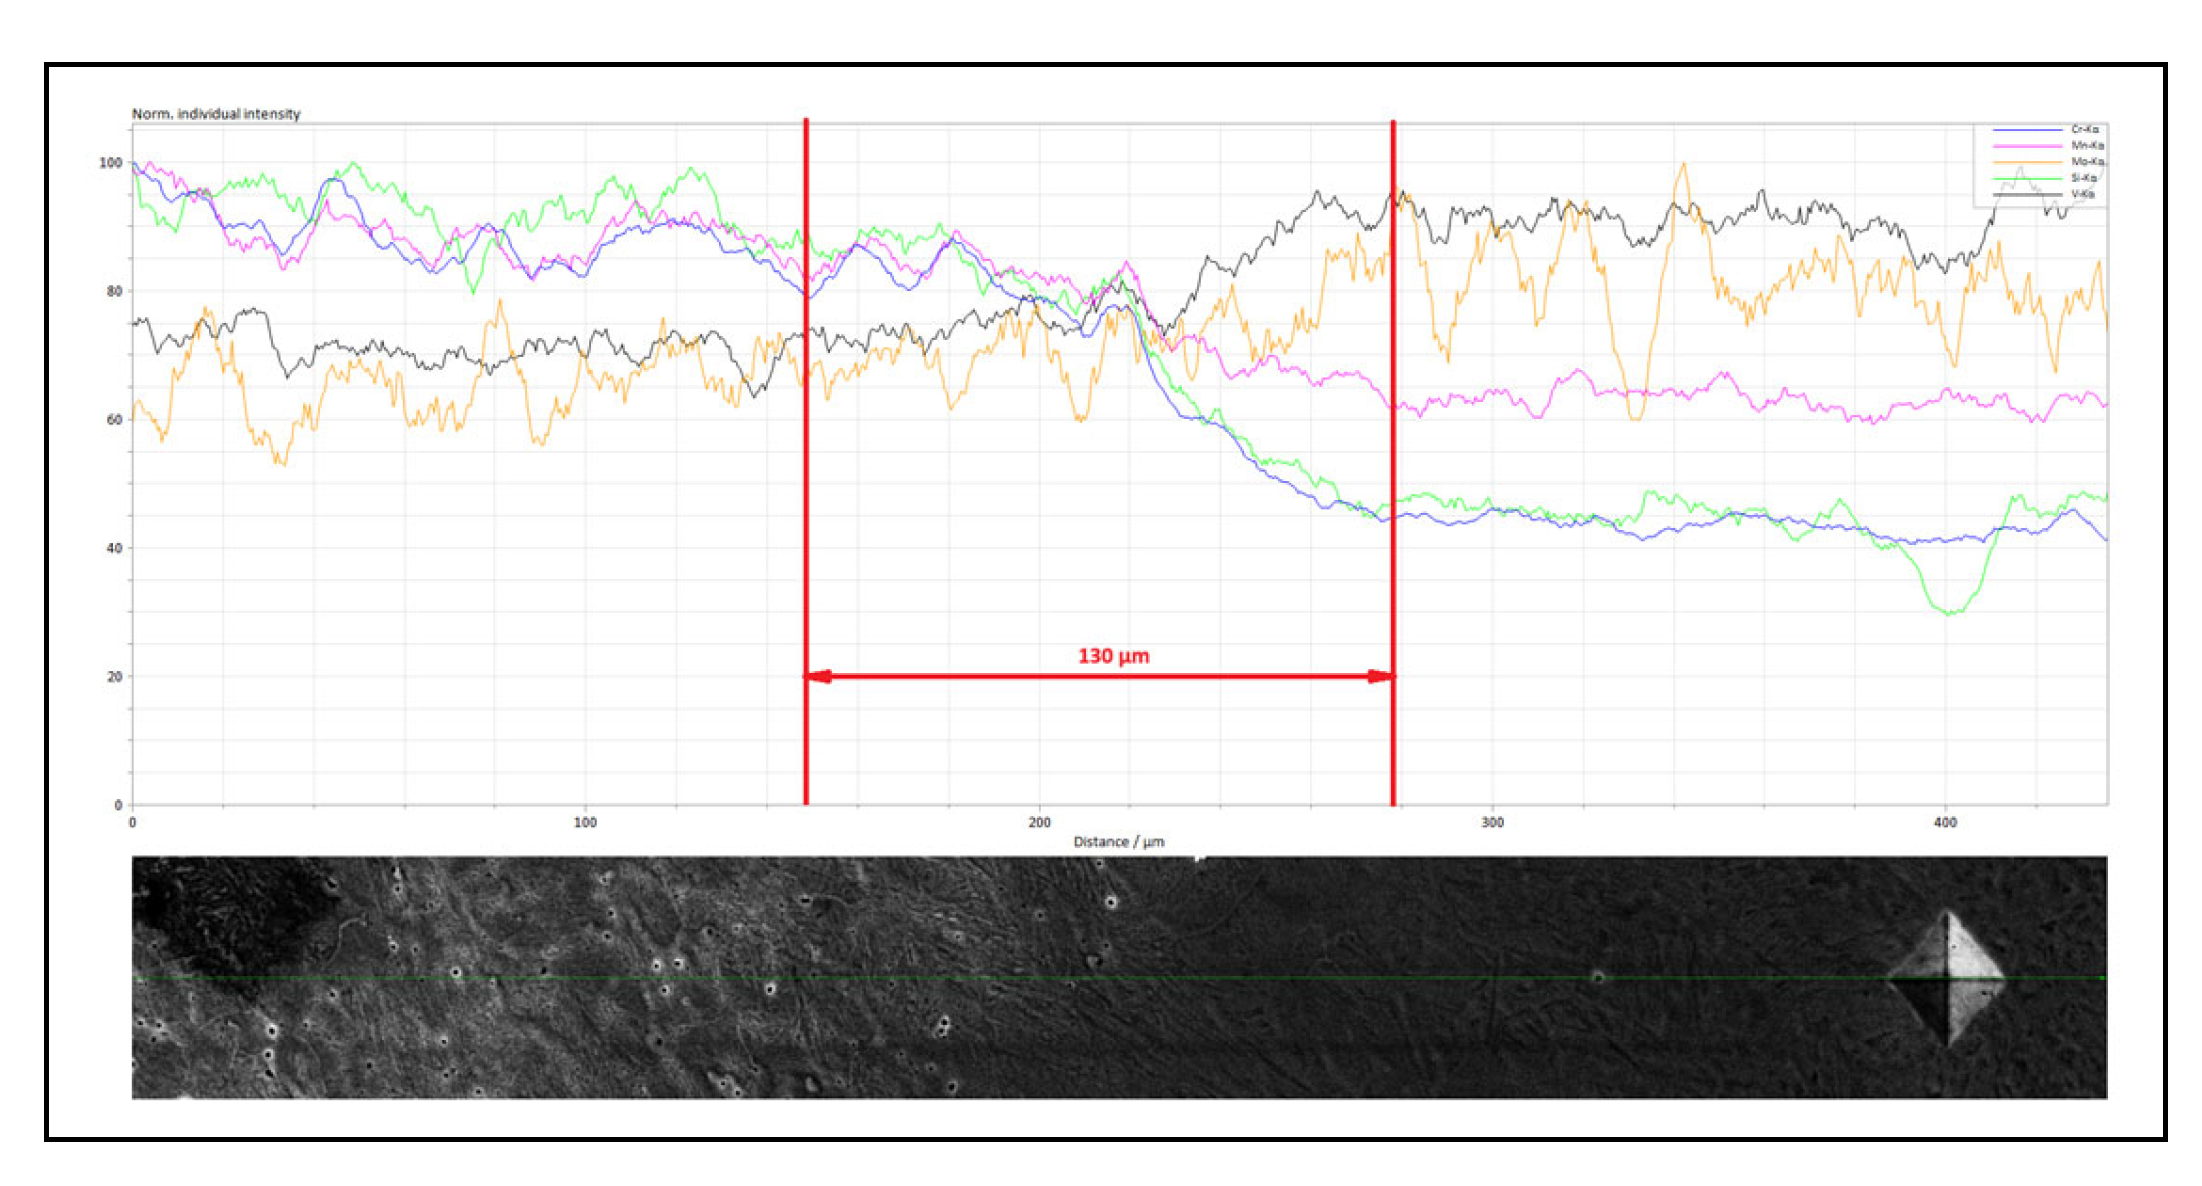
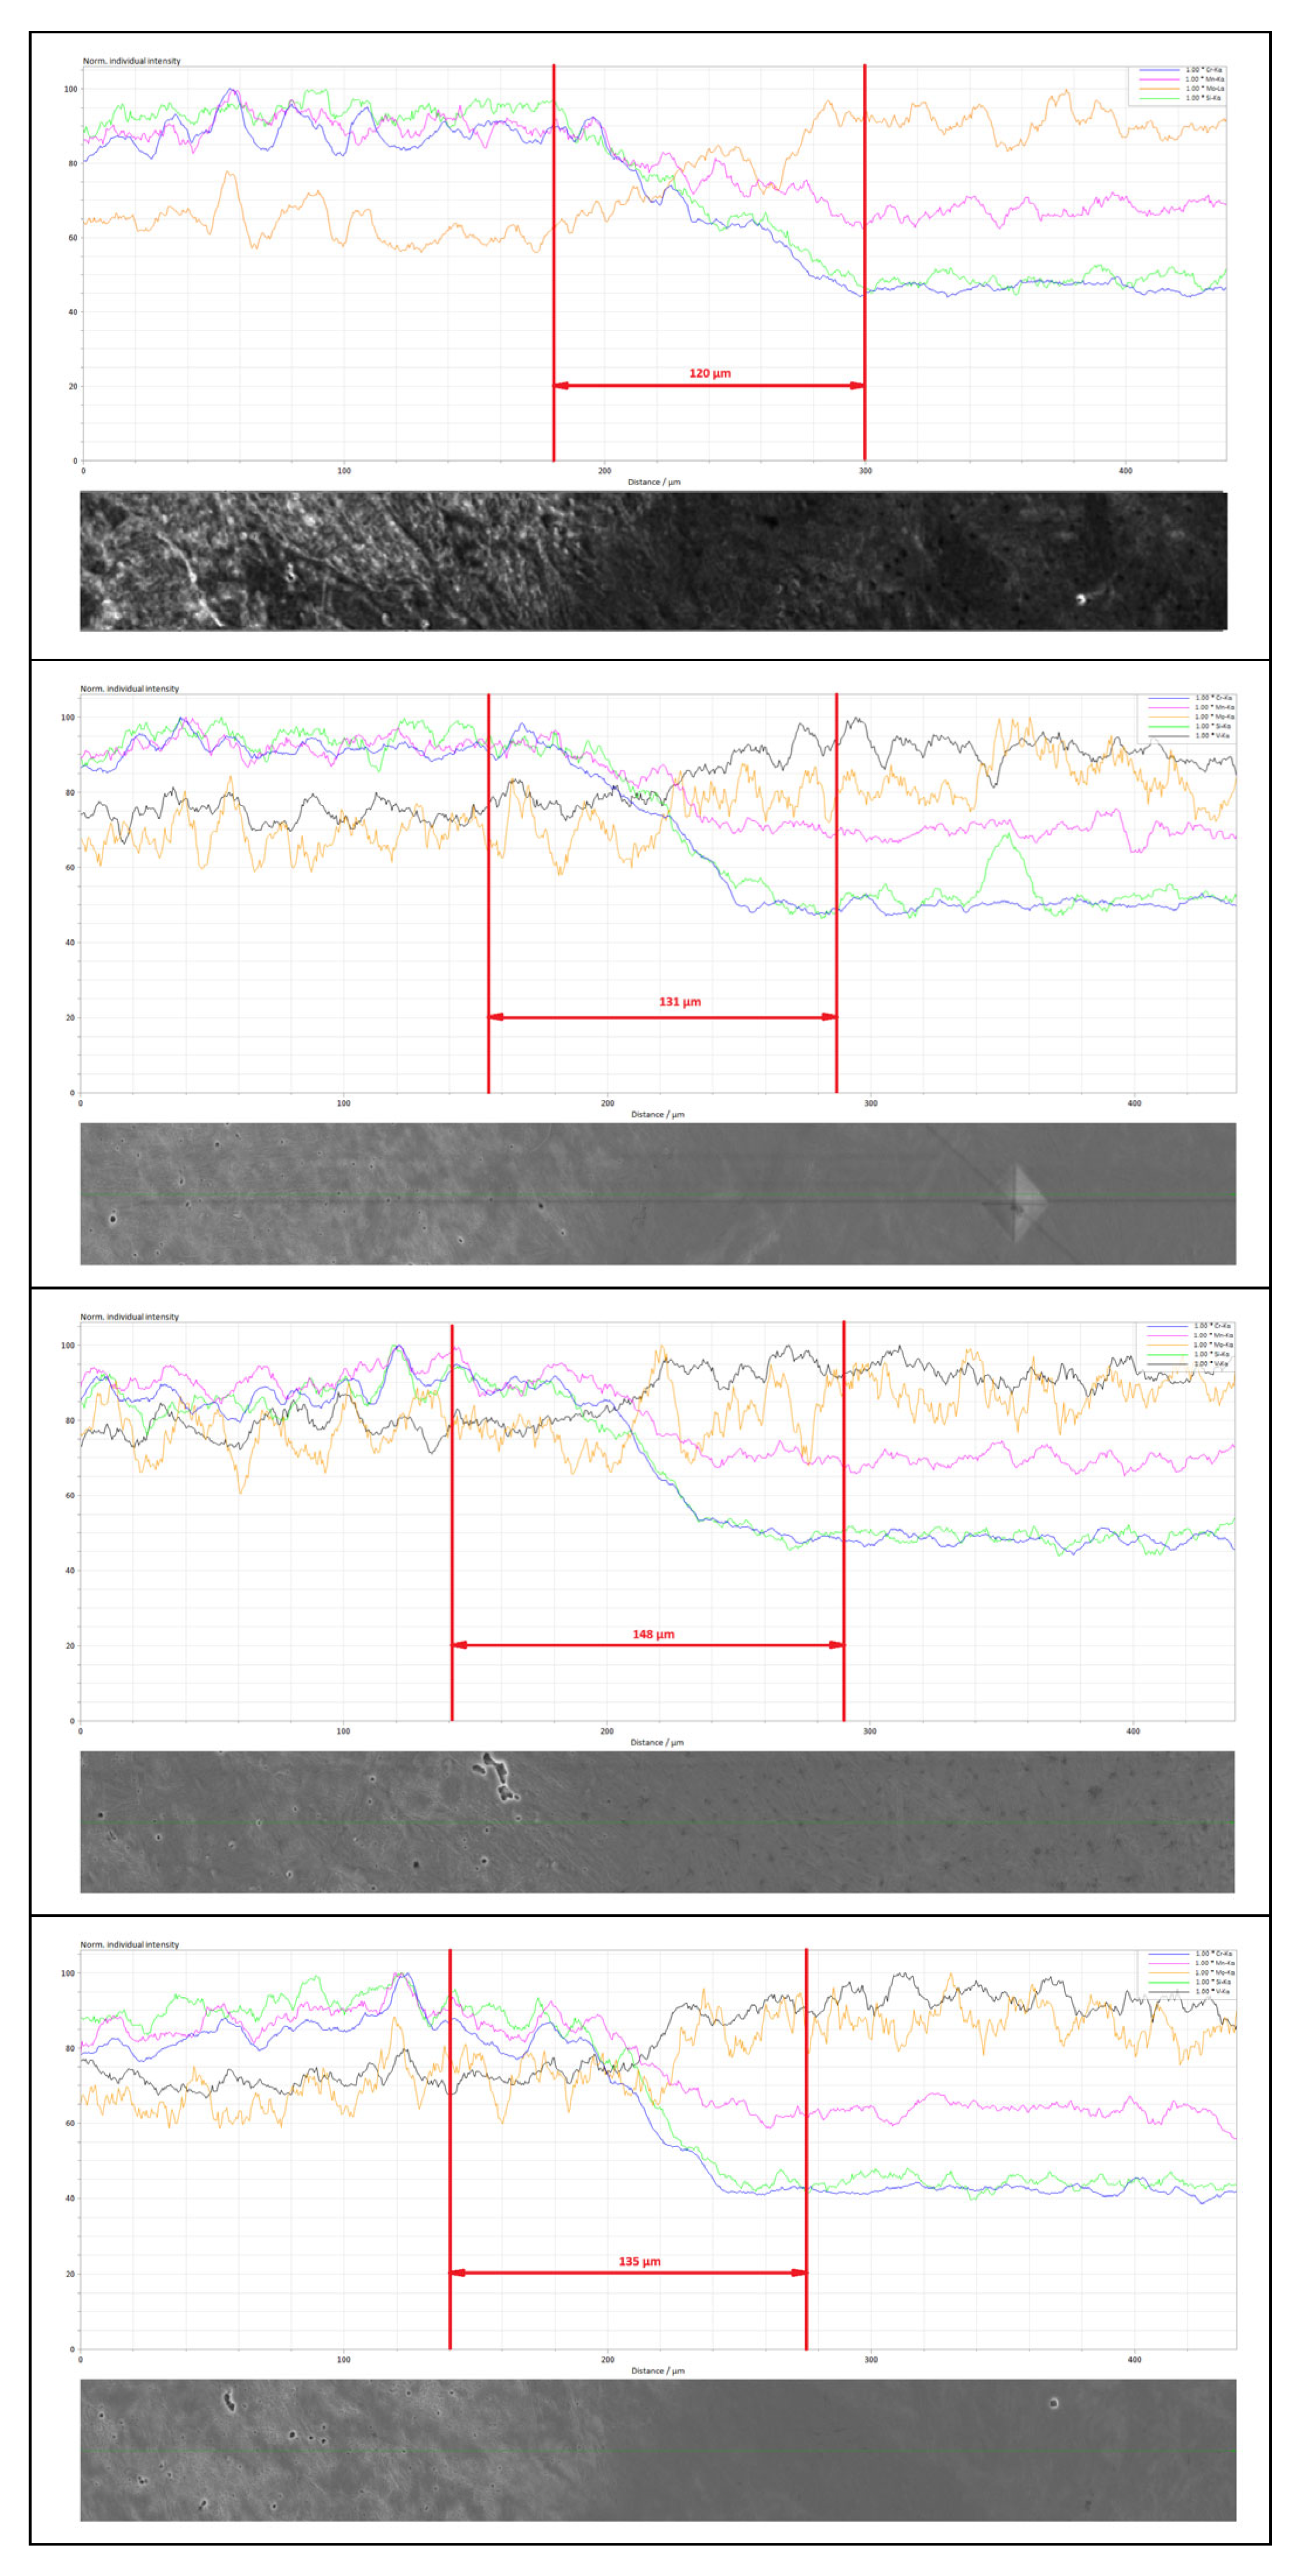
The chemical composition was analyzed using an energy-dispersive X-ray spectroscopy (EDS) system (Bruker XFlash Detector 630M, Berlin, Germany) attached to a scanning electron microscope (SEM), with measurements performed in line scanning analysis (LSA) mode (Figure 21).
For LSA, the scan line was positioned to cross hardness indentations 5 and 6 (Table 7, Figure 11) and to intersect the fusion boundary perpendicularly. This approach was adopted to avoid errors in dilution depth interpretation caused by specimen-to-specimen variations in the angle fusion line.
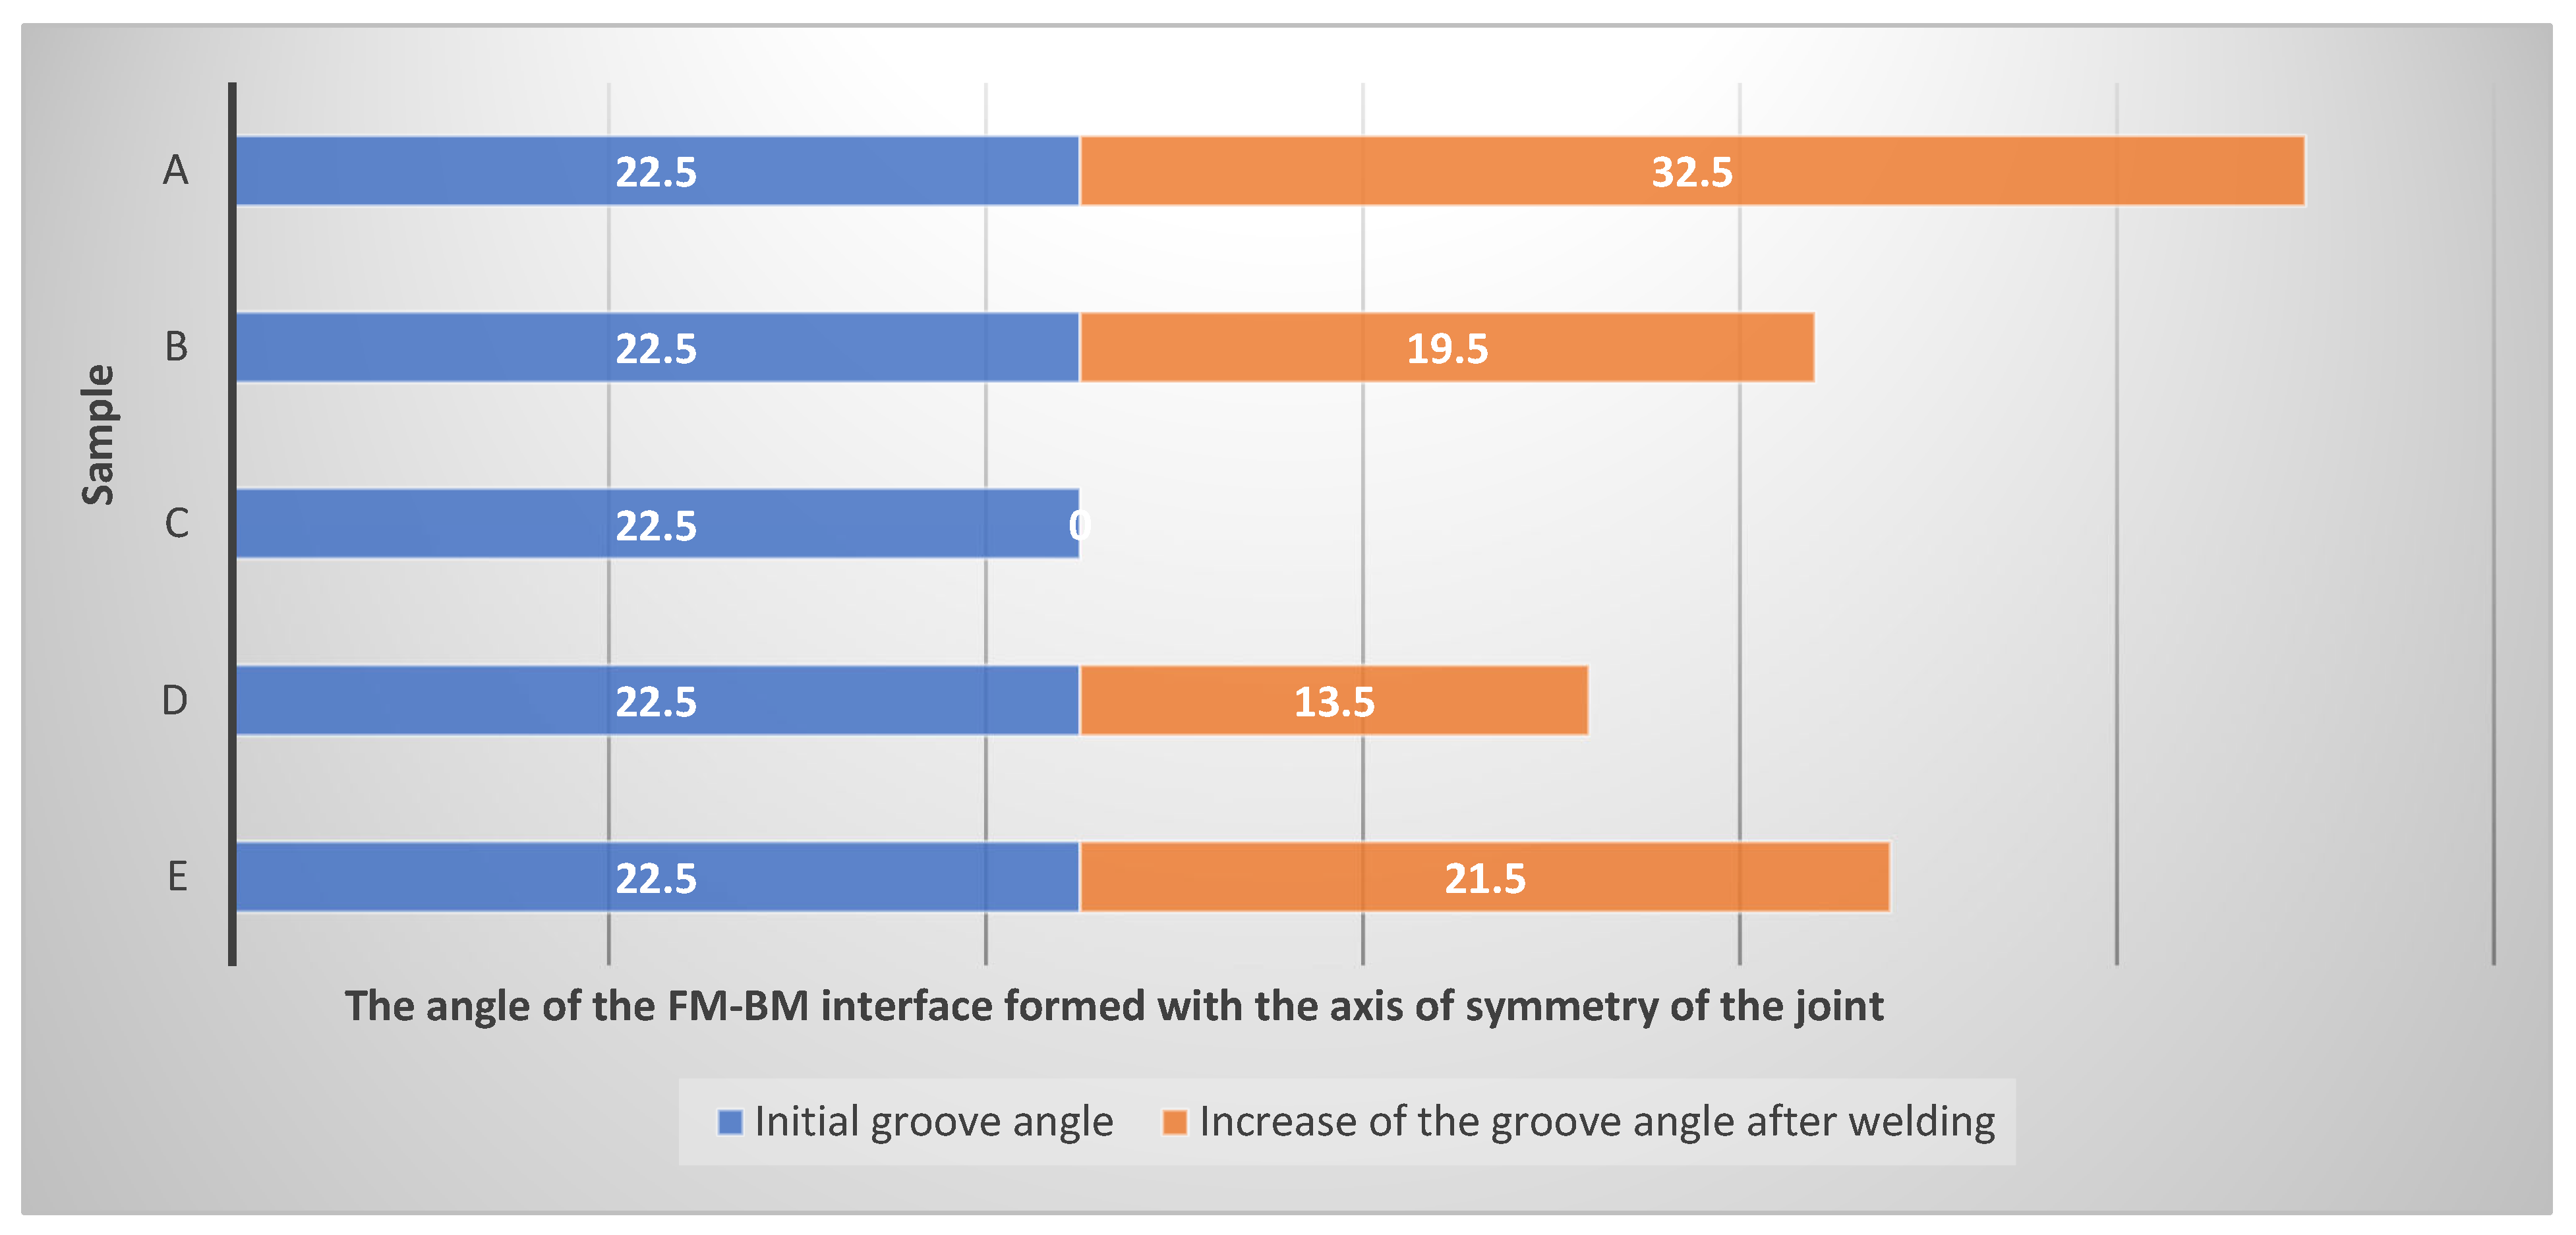
The angle measurements highlighted in Figure 20 are centralized in Table 8, and Table 9 can help compare the dilution areas measured in Figure 21.

4. Discussion

4.1. Macroscopic Observations

Figure 7 presents the appearance of the DUR 600 deposits on the base material. Specimen A was produced using the synergic welding regime imposed by the DIGIPULS 320 welding equipment, SAF-FRO, Air Liquide Welding, France, intended for conventional welds employing low-carbon filler materials. In the case of sample A, complete filling of the joint was not achieved; therefore, a reduction in the welding speed v(w) and a corresponding increase in the welding heat input were required. In addition, spatter formation is evident in specimen A, resulting from inadequate welding parameters.
When the wire feed speed is too high relative to the set voltage, the wire impacts the weld pool before fully melting, leading to spatter formation. Conversely, if the voltage is too low, an excessively short arc is produced, which may cause violent short circuits and expulsion of molten metal in the form of spatter.
By adjusting the welding parameters, specimen B was obtained, characterized by a uniform deposit without spatter. Using the same welding parameters, specimens C, D, and E were also produced, but under different vibration conditions. For all specimens welded under VAW conditions, spatter formation was observed, mainly due to the a(z) vibration component. In order to reduce the adhesion of the spatter, which is unavoidable under these conditions, an anti-spatter spray can be applied to the workpiece prior to welding.

4.2. Bending Test Results and Analysis

As shown in Figure 22, the application of vibrations during welding appears to influence the deformability of the deposited layer. All VAW specimens exhibit increased deformability compared to the non-vibrated condition. These differences may be related to variations in solidification conditions and resulting microstructural characteristics induced by vibration-assisted welding.
The bending tests were performed using a universal testing machine under controlled loading conditions. The specimens were subjected to three-point bending, with the load applied at a constant rate until failure. The span between supports and the loading rate were selected to ensure a consistent comparison between the tested specimens. The purpose of the bending test was to evaluate the deformability of the cladded layer after heating at the work temperature (simulated in the heat treatment).

4.3. Influence on Penetration Depth, BM–CM Interfacial Dilution, and HAZ Extent (Observed in Macrostructures)

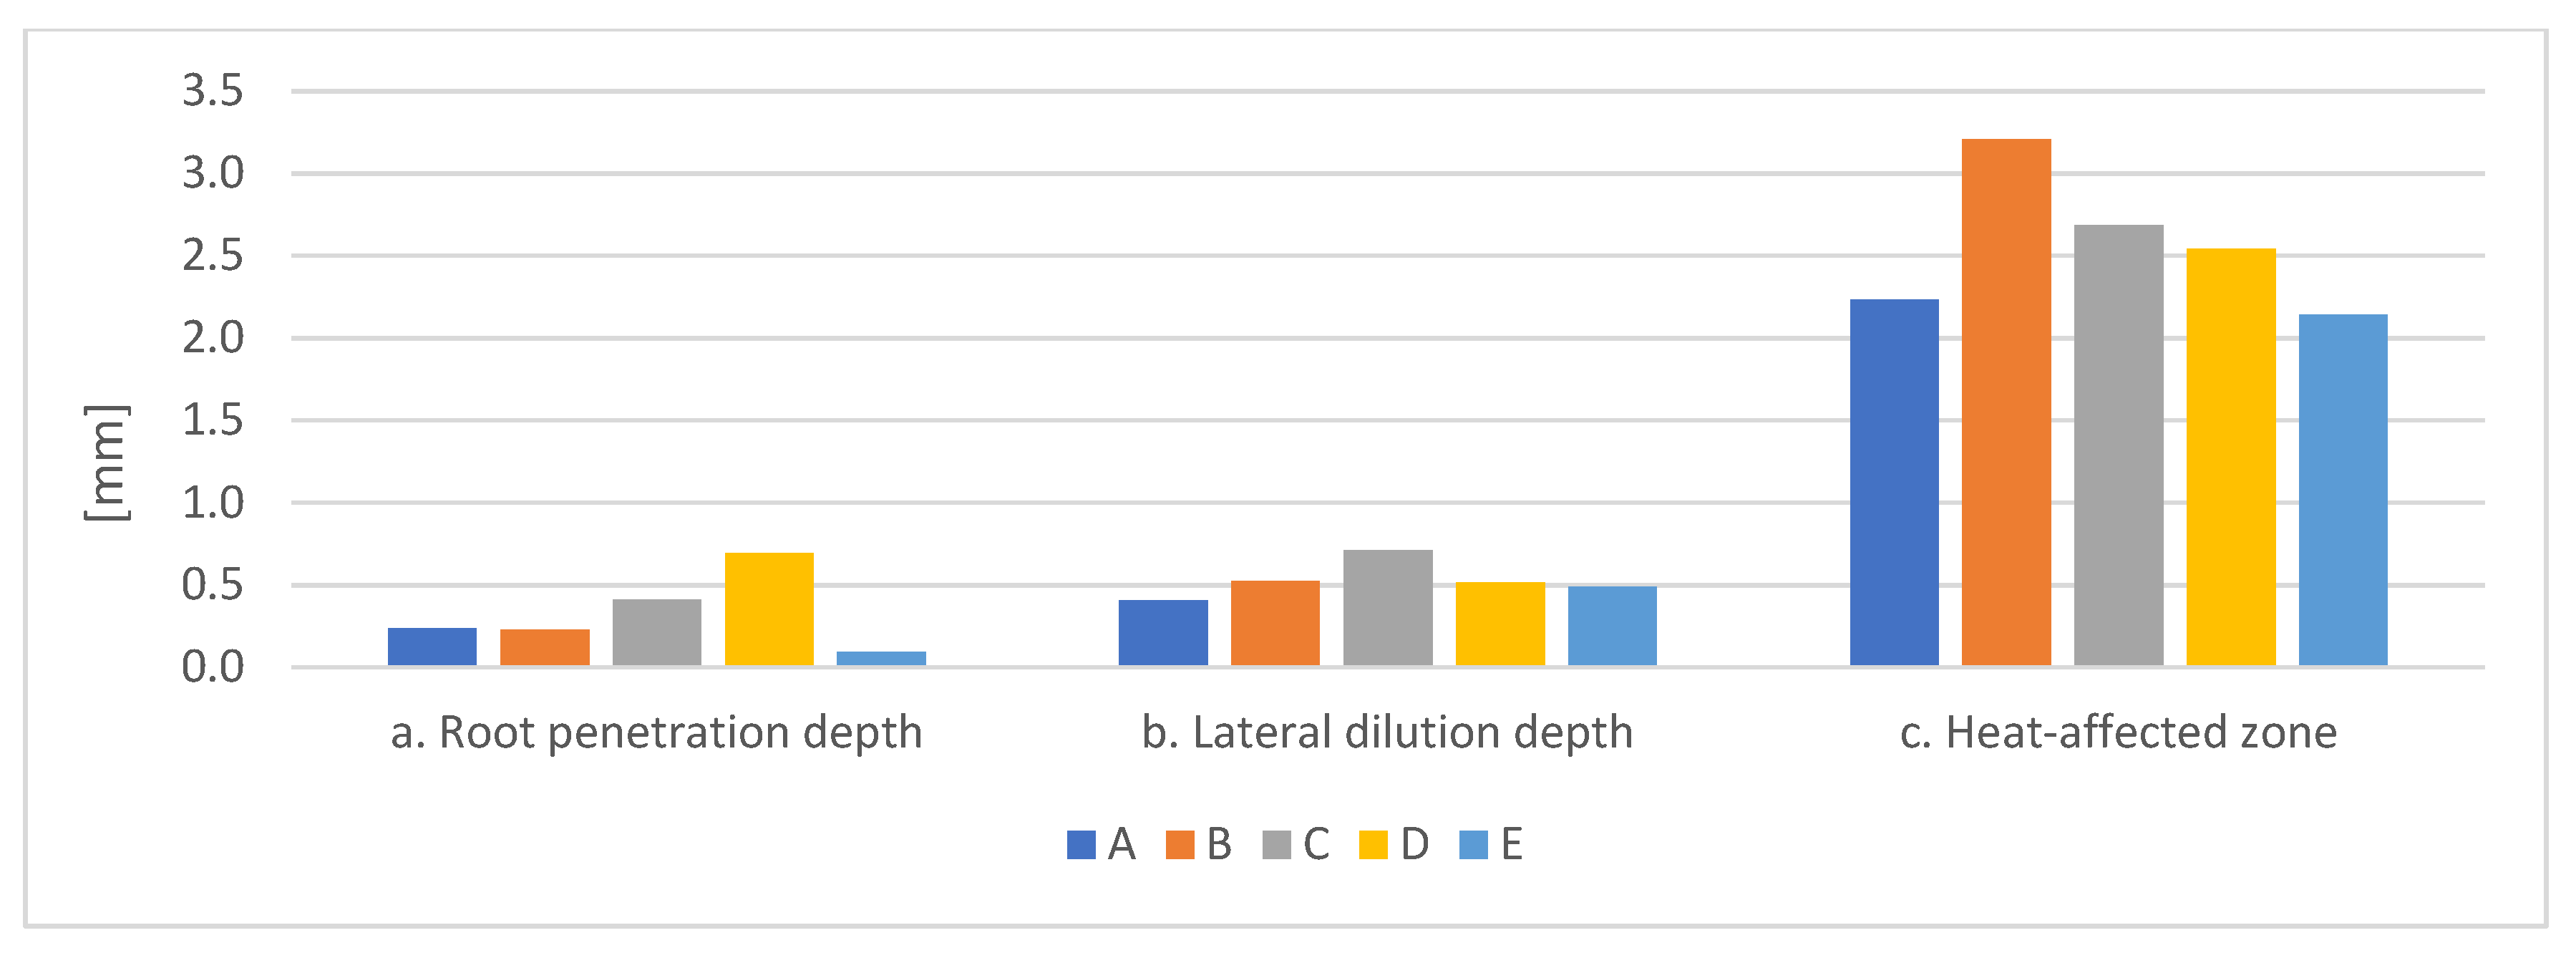
In the three column charts shown in Figure 23, the influence of the different vibration parameters on the main quantities characterizing the deposition of the filler material is analyzed. The following parameters are highlighted:
  • The penetration depth of the cladding material (CM) into the base material (BM);
  • The lateral dilution in the CM–BM contact zone;
  • The extent of the heat-affected zone (HAZ).
For the analysis of the influence of welding heat input, a direct comparison can be made between specimens A and B. The two specimens differ only in the welding speed, which affects the linear heat input, while all other welding parameters were kept constant. This allows the effect of heat input on penetration depth and weld geometry to be evaluated independently of vibration effects.
Subsequently, in order to separate the effects of vibration parameters, specimens B–E were produced under identical welding conditions, while only the vibration regime was varied. This approach allows a direct comparison of the influence of frequency and acceleration on the resulting properties. The results suggest that acceleration may have a more pronounced effect on dilution and hardness than frequency under the present experimental conditions, while heat input primarily influences penetration depth.
The specimen vibrated at the higher oscillation frequency (108 Hz) exhibits the highest root penetration depth (0.695 mm)Figure 23. The lateral dilution is similar for all specimens, both vibrated and non-vibrated. Therefore, it can be concluded that, for this BM–CM combination, it may be observed that vibrations appear to have a limited effect on dilution in the interpenetration zone between the two materials (Figure 23).
However, it can be observed that for specimen C, in which the vibration accelerations were the highest (az = 70 m/s2, ax = 60 m/s2), the dilution is slightly increased (Figure 23). At the same time, this specimen also shows a higher amount of spatter in the vicinity of the CM deposition.
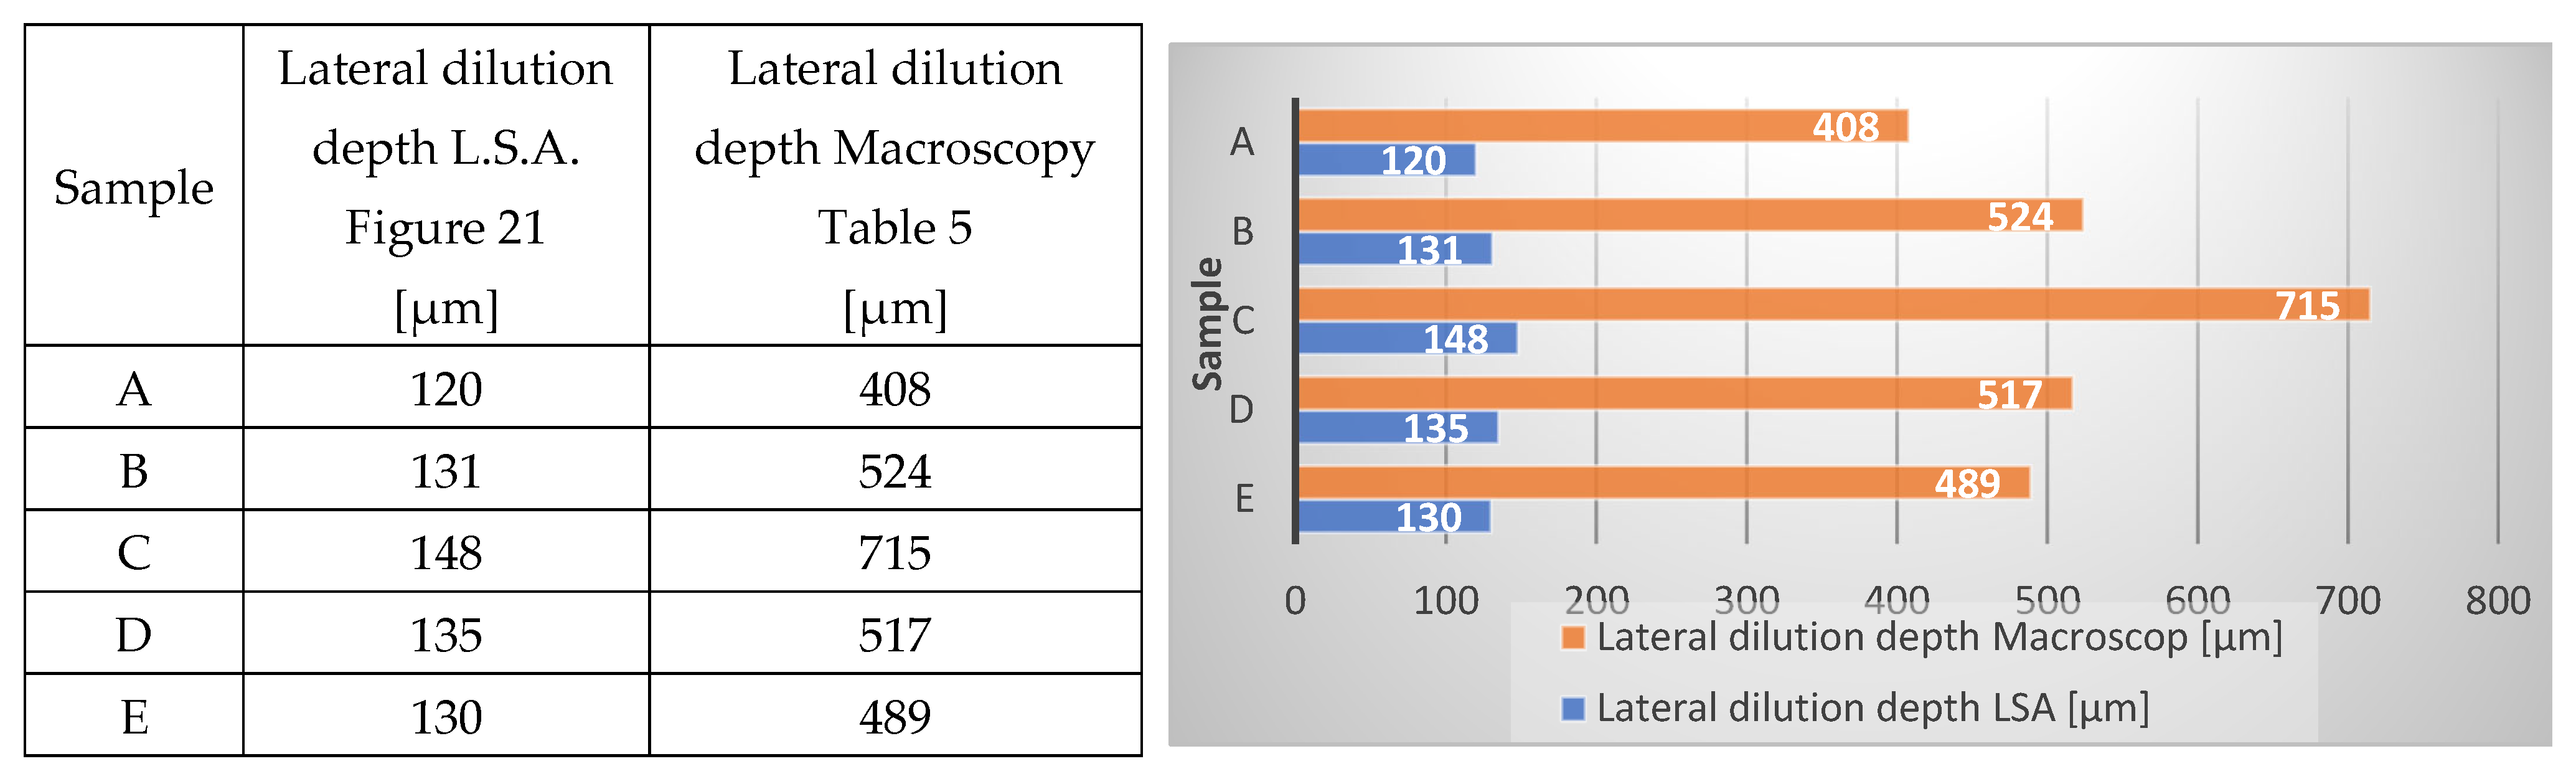
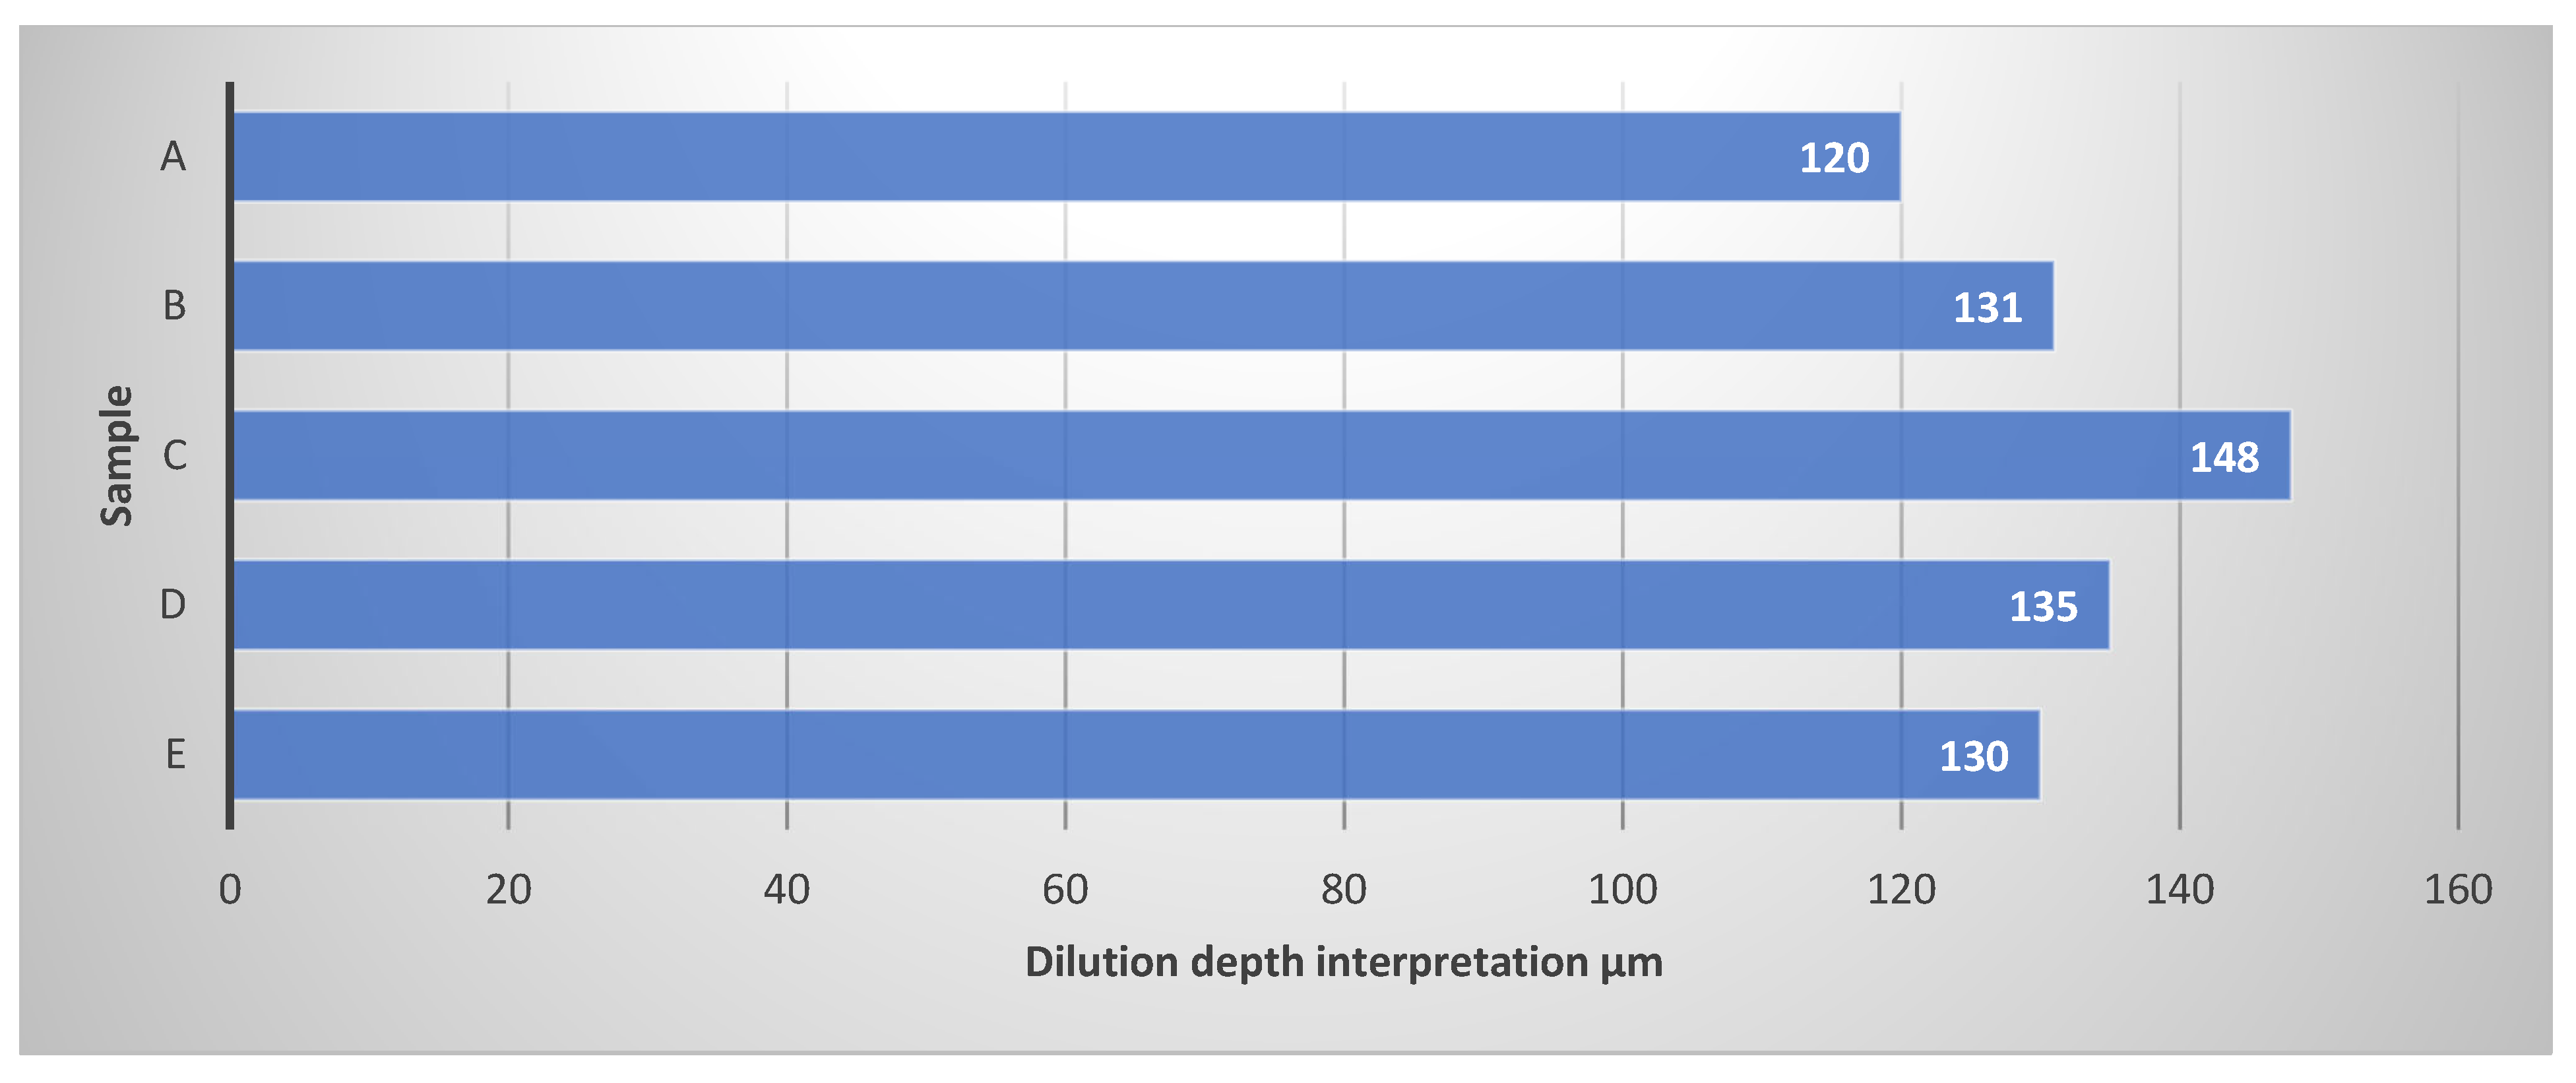
The SEM analysis combined with EDS in LSA mode (Figure 24) confirms the proportionality of the measurements obtained by macroscopic examination; however, it shows that, in reality, the elements from the weld bead diffuse into the base material over much shorter distances than those observable by macroscopic analysis.
For the specimens produced with the same welding heat input, it is observed that specimen E exhibits the smallest heat-affected zone (HAZ). This specimen was vibrated at acceleration levels approximately half of those recorded for specimen C.
The apparent discrepancy between macroscopic dilution measurements and LSA results arises from the different physical meaning of the two approaches. While macroscopic measurements describe the geometrical extent of fusion, LSA provides information on elemental diffusion across the interface. Therefore, the two methods should be interpreted as complementary rather than directly comparable.

4.4. Hardness Analysis

The column charts presented in Figure 25 show the HV hardness values obtained in the different zones of the specimens. The zone of greatest interest is Zone 1, corresponding to the central region of the cladding material. Higher hardness values were observed in specimen C, vibrated at the maximum acceleration levels. However, given the limited dataset, these observations should be interpreted with caution.
This behavior may be associated with microstructural modifications induced by vibration-assisted welding, such as possible refinement of the solidification structure and changes in dendritic morphology.
Although these features were not quantitatively evaluated, they may provide a plausible explanation for the observed increase in resistance to plastic deformation, concomitant with the increase in hardness.
It should be noted that the present study is based on a limited number of experimental samples, and no statistical analysis or repeatability assessment was performed. Therefore, the results should be interpreted as indicative trends rather than definitive conclusions. A more comprehensive statistical evaluation would require a larger dataset and repeated measurements.

4.5. Microhardness Evaluation

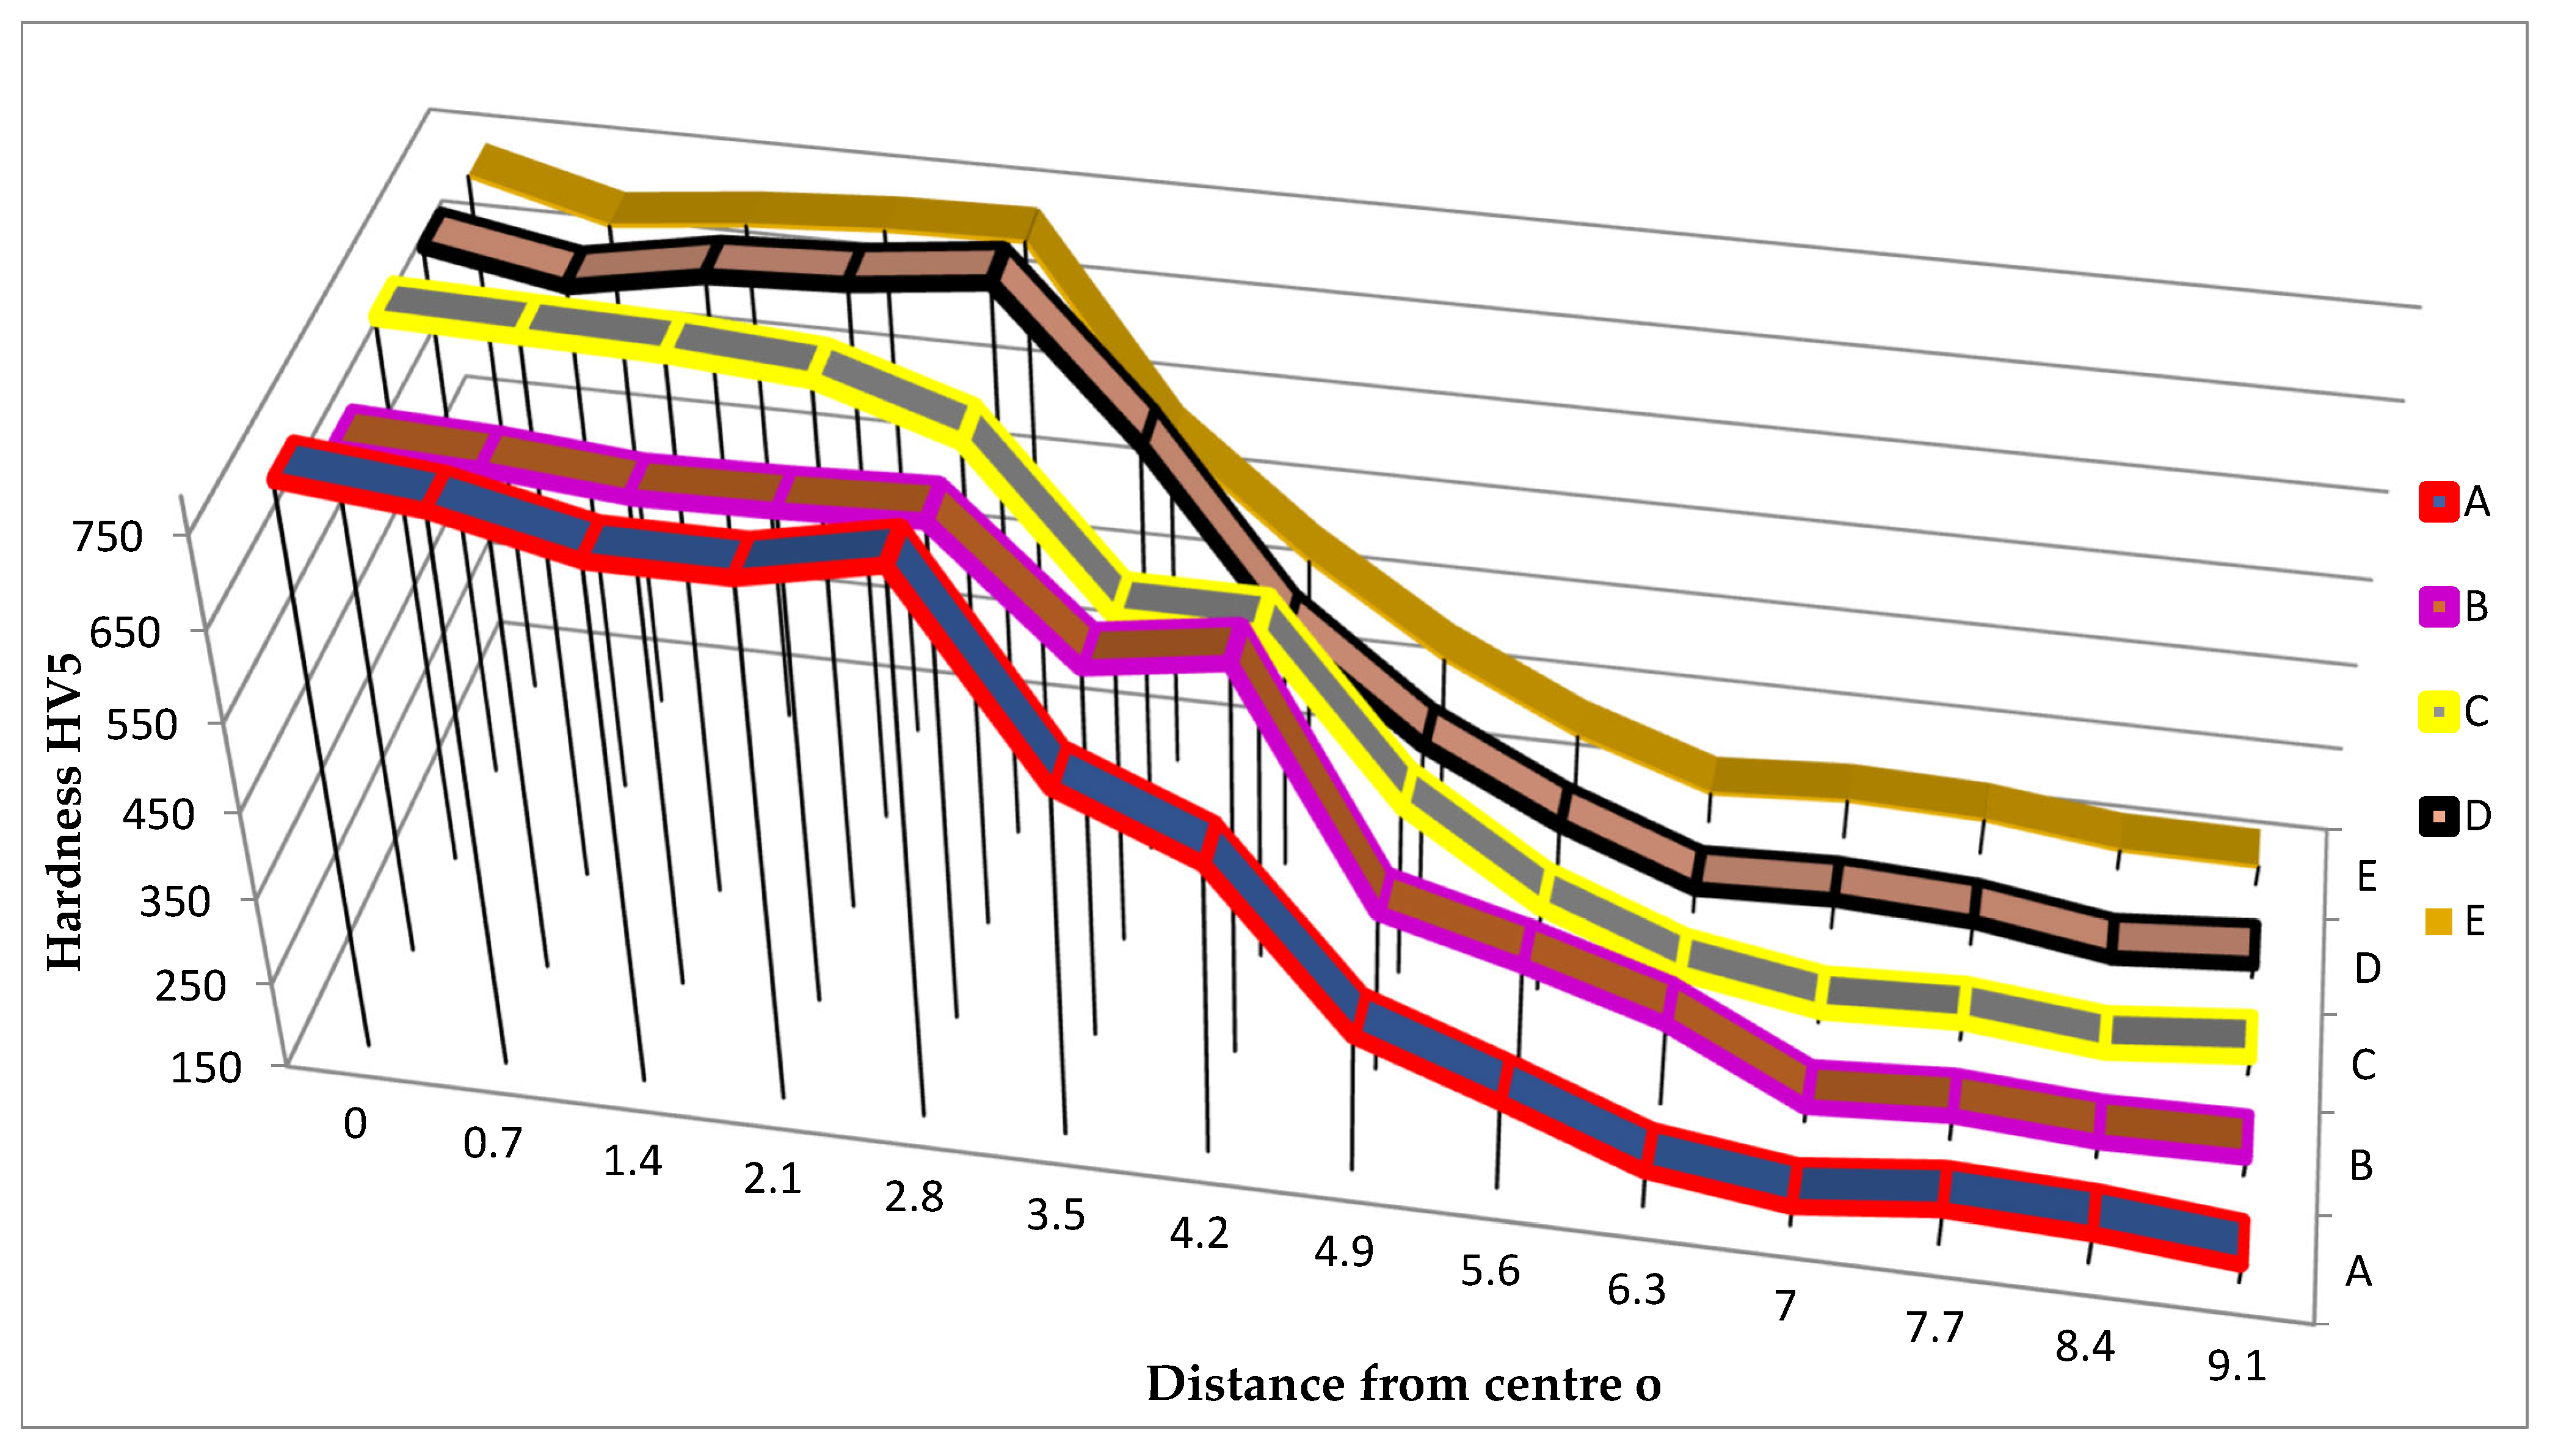
Figure 26 presents the variation in the microhardness of the specimens starting from the center of the deposited weld bead. The diagram is constructed based on the microhardness results presented in Table 7.
It can be observed that a relatively smooth hardness variation from the center of the deposited material (DM) toward the base material (BM) was recorded for specimen C. This behavior may be associated with a more gradual transition in material properties between the cladding material and the base material [30].

4.6. Microstructure Analysis

Considering that all specimens were etched simultaneously under identical conditions (same etching time, identical reagent concentration, and the same oxidation state of the solution), the observed differences in etching contrast can be primarily associated with microstructural characteristics of the analyzed materials.
The influence of mechanical vibrations on the weld pool can be explained through modifications in melt pool dynamics. The imposed oscillations generate additional fluid flow within the molten metal, enhancing thermal and solutal convection. This effect promotes a more uniform temperature distribution and facilitates the fragmentation of dendritic structures during solidification. As a result, the nucleation rate increases, leading to a finer and more homogeneous microstructure.
As a general observation, specimens A and B exhibit a brighter appearance in the CM region and a darker contrast in the BM region. The specimens subjected to vibration-assisted welding exhibit a more pronounced metallographic contrast compared to the non-vibrated specimens. This difference indicates variations in microstructural state and solidification conditions.
The simultaneous increase in hardness and etching reactivity observed in the vibrated specimens may support this hypothesis, although further investigations would be required to establish a definitive correlation.

4.6.1. CM Microstructure

Figure 13 shows the cooling surfaces of the welded beads. In this region, which is directly exposed to air, the high cooling rate promotes dendritic growth during the solidification process. However, a tendency toward reduced dendrite length can be observed in specimens C and E. In addition, these specimens exhibit a darker metallographic contrast, which may be associated with differences in microstructural characteristics resulting from the solidification process. In specimen C, this contrast is visible throughout the entire micrograph, whereas in specimen E it appears mainly near the surface corresponding to the cooling interface exposed to air [31,32].
The microstructures presented in Figure 14 indicate that the specimens subjected to VAW (C, D and E) appear to exhibit a more refined microstructure in the CM region, without the pronounced dendritic alignments observed in specimens A and B. This suggests that the mechanical vibrations applied during welding influence the solidification process of the molten pool, leading to microstructural refinement. It should be noted that all images presented in Figure 14 were taken at approximately 4 mm from the upper surface of the welded bead.
The analysis of the weld root region (Figure 15) reveals a distinct transition behavior in specimen C, characterized by a gradual variation between the cladding material (CM) and the base material (BM). This transition differs from that observed in the other specimens and may be relevant for the mechanical response of the interface.

4.6.2. BM Microstructure

In the base material BM, a different behavior can be observed. Specimens A and B exhibit higher chemical reactivity during metallographic etching, which may reflect differences in microstructural state or local thermal history in these regions. This effect is most clearly visible in Figure 16, where the microstructural contrast is more pronounced. As the distance from the weld zone increases, the metallographic contrast gradually decreases, as illustrated in Figure 17, Figure 18 and Figure 19. This progressive reduction in contrast indicates the decreasing thermal influence of the welding process on the base material.
The differences in etching contrast observed between the specimens may be related to variations in microstructural features; however, without direct residual stress measurements, these observations cannot be used as conclusive evidence of differences in internal stress levels.

4.7. S.E.M.

The SEM micrographs acquired at the same distance from the symmetry axis of the weld bead, namely 2.8 to 3.5 mm, corresponding to hardness measurements 5 and 6 in Table 7, and at the same height from the lower surface of the specimen, namely 5 mm, highlight the influence of the V.A.W. process on the weld bead geometry. It can thus be observed that the bead walls, which initially formed an angle of 45° between them and 22.5° relative to the symmetry axis, as shown in Figure 3d, underwent different melting conditions, leading to changes in the angle of the transition zone toward the BM. By comparing these angles, conclusions can be drawn regarding the way in which the vibrational parameters influence the dilution zone. An angle greater than 45° indicates that the melting of the BM was more advanced near the upper surface of the welded specimen, whereas an angle smaller than 45° indicates increased melting in the lower region, toward the weld root, thus increasing the penetration depth.
Figure 27 shows that the largest groove opening angle occurs in specimen A, which was welded without vibration, and where the linear energy El had a relatively low value. This behavior suggests that the electric arc produced predominantly surface melting of the specimen, with limited penetration toward the weld root. An interesting effect can be observed in specimen C, welded under the highest vibration accelerations. In this case, the groove angle remained unchanged compared to the initial geometry. However, as shown in Figure 28, this specimen exhibits the largest dilution zone between CM and BM, reaching a maximum distance of 148 µm.

4.8. EDS with Line Scanning Analysis

The LSA clearly highlights the distances over which atoms from the CM were transported toward the BM, eliminating subjective interpretation. As shown in Figure 28, a comparative analysis of specimens A and B welded without vibration, where the only difference between the two welding regimes is the welding speed, indicates that a decrease in welding speed, and therefore an increase in linear heat input, leads to an increase in dilution.
In the same context, when comparing the non-vibrated specimen B with the vibrated specimens C, D and E, it can be observed that a notable effect on dilution occurs in specimen C, which was excited with accelerations of az = 70 m/s2 and ax = 60 m/s2 at a vibration frequency of 50 Hz.
A comparison between specimens D and E, in which the vibration frequency was modified from 108 Hz in specimen D to 50 Hz in specimen E while the acceleration was kept constant at az = 35 m/s2 and ax = 30 m/s2, shows that vibration frequency also promotes dilution, although its effect is less significant than that of acceleration.
The transition zone between the cladding material (CM) and the base material (BM) is characterized by a gradual variation in chemical composition, as indicated by the EDS line scanning results. This behavior suggests the formation of a metallurgical bond without the presence of abrupt compositional discontinuities.
Such a gradual transition may contribute to improved mechanical compatibility between the two materials and reduce the likelihood of interfacial failure under service conditions.
No coarse precipitates were identified within the resolution limits of the optical and SEM observations, nor were significant local enrichments or depletions of alloying elements detected along the analyzed line scanning profiles.
In particular, no regions with pronounced compositional discontinuities that could indicate restricted interdiffusion between the cladding material (CM) and the base material (BM) were observed.
Therefore, the analysis focused on the extent of the diffusion zone, quantified through the dilution distance measured across the CM–BM interface.

5. Industrial Applications and Future Research

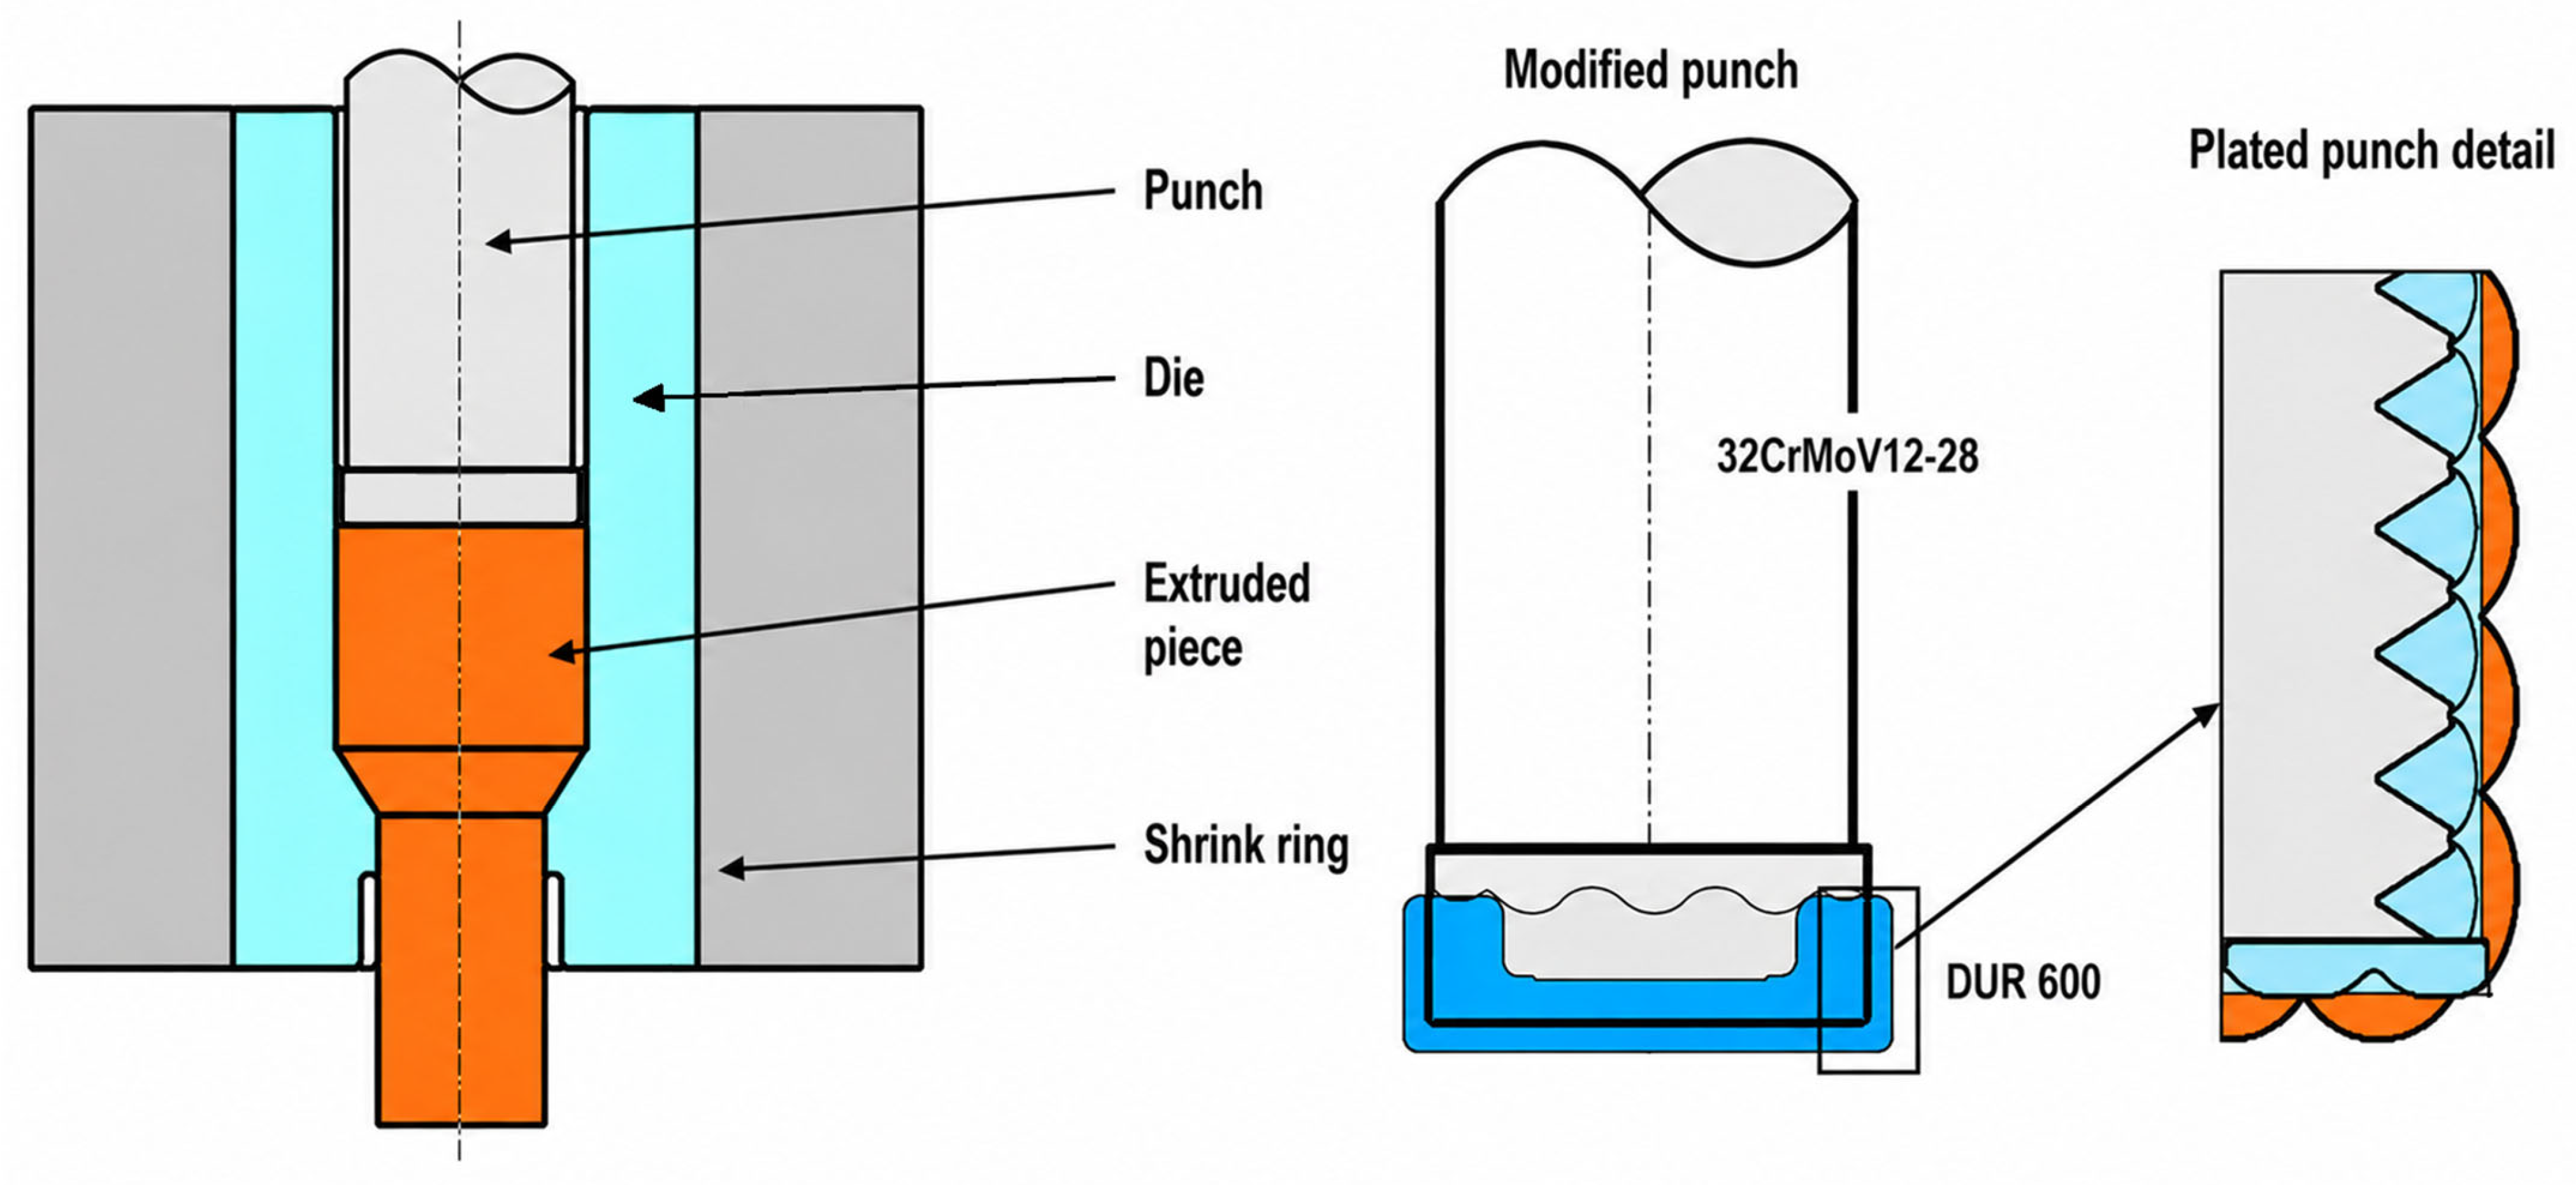
Figure 29 presents the schematic representation of the extrusion tools that were reconditioned. After approximately one month of service, the punch exhibited very low hardness values on its frontal surface (36–39 HRC), indicating that it had been overheated during operation. As a result, the edges of the pressing face experienced pronounced wear. The lateral surface of the punch did not undergo significant changes in shape or dimensions, and the hardness values remained in the range of 48–50 HRC.
Based on experience accumulated over time, it has been observed that layers clad with DUR 600 exhibit very good resistance to compressive loads but are prone to exfoliation under tangential stresses generated by friction forces. In order to reduce the risk of detachment of the clad layer, its adhesion can be significantly improved by creating grooves oriented perpendicular to the direction of the friction forces.
Accordingly, the investigations presented in this study focus on specimens in which the deposition of the anti-wear material was performed inside V-shaped grooves. Figure 29 also provides a detailed view of the method used to produce the clad layer.
Operations applied to the punch:
-
Stress-relief annealing and partial softening: 680 °C, 2 h → 32–35 HRC.
-
Removal by turning of the material from the area designated for DUR 600 deposition.
-
Preheating of the punch in a furnace to 300 °C.
-
VAW cladding, according to the regime applied to specimen C, using short deposits (approximately 4 cm), with air cooling to 600 °C between successive passes. Overlapping deposits were applied until a cladded layer thickness of 6–8 mm was achieved, including a machining allowance of 1.5–2 mm. The hardness of the deposited layer was 58–60 HRC.
-
Stress-relief annealing: 550 °C, 2 h, air cooling.
-
Final grinding to the required dimensions.
The punch reconditioned using this procedure operated together with the corresponding die and exceeded its service life prior to reconditioning. In view of this increased durability, this suggests that, upon replacement of the tool set, a punch cladded with DUR 600 will be manufactured from the outset.
While the industrial application indicates promising results, the improvement in service life observed in industrial conditions should be considered preliminary, as no quantitative data regarding wear rate, operating cycles, or failure criteria were recorded.
Future studies may consider alternative cladding materials and additional performance indicators.

6. Conclusions

The present study suggests that vibration-assisted welding (VAW) may influence the characteristics of the cladded layer, including microstructure, dilution behavior, and hardness distribution.
The experimental results indicate that higher hardness values can be obtained under certain vibration conditions, reaching up to approximately 900 HV in the deposited layer.
An increase in dilution between the cladding material and the base material was observed in some vibrated specimens, which may contribute to improved metallurgical bonding.
The observed microstructural features and hardness variations suggest a potential influence of vibration on the solidification process; however, these effects were not quantitatively evaluated.
Due to the limited number of samples and the absence of repeatability analysis, the results should be interpreted as indicative trends rather than definitive conclusions.
Among the tested conditions, the vibration regime characterized by a frequency of 50 Hz and higher acceleration levels appears to provide a favorable combination of properties, although further investigation is required.

7. Limitations

The present study is subject to several limitations that should be considered when interpreting the results.
The wear resistance and tribological behavior of the cladded layer were not directly evaluated, although they represent critical factors under hot extrusion conditions and should be addressed in future studies.
It should be noted that the present study is based on a limited number of experimental samples, and no statistical analysis or repeatability assessment was performed. Therefore, the results should be interpreted as indicative trends rather than definitive conclusions.
Phase analysis by X-ray diffraction (XRD) was not performed in the present study. Such analysis could provide additional insight into phase transformations occurring during weld cladding and their influence on the resulting mechanical properties. A quantitative correlation between phase composition and hardness would require such analysis.
The microstructural refinement was assessed qualitatively based on metallographic observations. However, a quantitative analysis of grain size would be required to establish a more rigorous correlation between microstructure, hardness, and bending behavior.
Finally, although the influence of vibration parameters was analyzed, the amplitude of the vibratory motion was not directly measured, but only estimated based on acceleration and frequency values.
During sample preparation, efforts were made to minimize both thermal and mechanical influences on the material. Specimen extraction was performed using water jet cutting, while grinding operations were carried out under abundant cooling conditions and non-aggressive parameters in order to reduce plastic deformation and heat input.
Despite these precautions, it was not possible to completely eliminate the potential influence of grinding-induced thermal and mechanical effects. The impact of such processes on the final microstructure and mechanical properties of the cladded layer was not specifically investigated and should be considered in future studies.
It should also be noted that, due to the complexity of the investigated phenomena and the wide range of potential influencing factors, the present work was intentionally limited to the most relevant parameters in order to maintain the structure of a research article. A more comprehensive treatment of the subject would require a significantly extended framework, beyond the scope of a single paper.

Author Contributions

Conceptualization, M.A.L.; Methodology, D.L.M.; Validation, M.H.T.; Formal analysis, D.L.M.; Investigation, M.A.L., D.-I.C., D.L.M. and M.H.T.; Resources, D.-I.C.; Data curation, D.-I.C.; Writing—original draft, M.A.L.; Writing—review and editing, M.A.L. and M.H.T.; Supervision, M.H.T.; Project administration, M.A.L.; Funding acquisition, M.A.L., D.-I.C., D.L.M. and M.H.T. All authors have read and agreed to the published version of the manuscript.

Funding

The APC was funded by Transilvania University of Brasov.

Data Availability Statement

The original contributions presented in this study are included in the article. Further inquiries can be directed to the corresponding author.

Conflicts of Interest

The authors declare no conflict of interest.

References

  1. Satyendra. Hot Extrusion Process and Its Application for Steel. Available online: https://www.ispatguru.com/hot-extrusion-process-and-its-application-for-steel/ (accessed on 5 May 2026).
  2. Liu, C.; Zhang, R.; Yan, Y. Lubrication behavior of the glass lubricated hot extrusion process. J. Mech. Eng. 2011, 47, 127. [Google Scholar] [CrossRef]
  3. Kargin, S.; Artyukh, V.; Ignatovich, I.; Dikareva, V. Development and efficiency assessment of process lubrication for hot forging. IOP Conf. Ser. Earth Environ. Sci. 2017, 90, 012190. [Google Scholar] [CrossRef]
  4. Guo, Y.Q.; Cui, J.H.; Pan, L.D.; Li, S. Key technologies of cooling and lubrication for closed hot extrusion automatic production line. Mater. Sci. Eng. 2022, 1270, 012028. [Google Scholar] [CrossRef]
  5. Golovko, O.; Danchenko, V.M.; Belyaev, S.M. Extrusion and air-water cooling of AlSi1MgMn alloy extruded profiles. Metall. Min. Ind. 2010, 2, 355–362. [Google Scholar]
  6. Zhang, Y.; Song, K.; Zhang, S.; Wang, Y.; Zhang, Z. Hardness and failure assessment of a hot extrusion punch during service. Eng. Fail. Anal. 2021, 125, 105382. [Google Scholar] [CrossRef]
  7. Qamar, S.Z.; Pervez, T.; Chekotu, J.C. Die defects and die corrections in metal extrusion. Metals 2018, 8, 380. [Google Scholar] [CrossRef]
  8. Luca, M.A.; Roata, I.C.; Croitoru, C.; Todi-Eftimie, A.L. Vibration assisted welding of EN 42CrMo4. Materials 2024, 17, 2708. [Google Scholar]
  9. Gowtham, A.V.S.; Kishore, T.L. A review on effect of vibration welding of different materials in various welding processes. Int. J. Innov. Technol. Explor. Eng. 2018, 3, 97–102. [Google Scholar]
  10. Jose, M.J.; Kumar, S.S.; Sharma, A. Vibration assisted welding processes and their influence on the quality of welds. Sci. Technol. Weld. Join. 2016, 21, 4. [Google Scholar] [CrossRef]
  11. Rao, M.V.; Rao, S.P.; Babu, B.S. Vibratory weld conditioning during gas tungsten arc welding of al 5052 alloys on the mechanical and micro-structural behavior. World J. Eng. 2020, 17, 831–836. [Google Scholar] [CrossRef]
  12. Kuo, C.-W.; Yang, S.-M.; Chen, J.-H.; Lai, G.-H.; Wu, W. Study of vibration welding mechanism. Sci. Technol. Weld. Join. 2008, 13, 357–362. [Google Scholar] [CrossRef]
  13. Bai, Y.; Lu, Q.; Ren, X.; Yan, H.; Zhang, P. Study of Inconel 718 Welded by Bead-On-Plate, Laser Welding under High-Frequency Micro-Vibration Condition. Metals 2019, 9, 1335. [Google Scholar] [CrossRef]
  14. Singh, P.K. Investigation on the effect of mechanical vibration in the mild steel weld pool. Manuf. Rev. 2019, 6, 21. [Google Scholar] [CrossRef]
  15. Xu, J.J.; Chen, L.G.; Ni, C.Z. Low-stress welding technology without post-weld heat treatment. Mater. Sci. Technol. 2009, 25, 976–980. [Google Scholar] [CrossRef]
  16. SteelNumber. Available online: https://www.steelnumber.com/en/steel_composition_eu.php?name_id=988 (accessed on 27 April 2026).
  17. SITHERM 2365 Steel. (Mat.No. 1.2365, DIN X32CrMoV3-3, AISI H10) (sij.si). Available online: https://steelselector.sij.si/steels/UTOP33.html (accessed on 27 April 2026).
  18. UTP A DUR 600 Datasheet. Available online: https://www.alruqee.com/Userfiles/Product/TablePdf/13062016000000UTP%20A%20DUR%20600.pdf (accessed on 27 April 2026).
  19. Luca, M.A.; Machedon, P.T.; Vas, A.L. Vibrating Welding Table, 2017-08-30 Publication of RO127504B1. Available online: https://patents.google.com/patent/RO127504B1/ro?oq=RO127504B1 (accessed on 5 May 2026).
  20. Ranjan, R.; Kumar, M.; Rathore, S.; Goyal, A. Enhancing shielded metal arc welding performance through process parameter optimization with low-frequency vibration assistance. Sci. Rep. 2025, 15, 40016. [Google Scholar] [CrossRef]
  21. Singh, P.K.; Patel, D.; Prasad, S.B. Optimization of process parameters during vibratory welding technique using Taguchi’s analysis. Perspect. Sci. 2016, 8, 399–402. [Google Scholar] [CrossRef]
  22. Ranjan, R.; Jha, S.K. Effect of low frequency vibration-assisted shielded metal arc welding on the properties of mild steel. Weld. Int. 2023, 37, 437–444. [Google Scholar] [CrossRef]
  23. Suresh, B.V.; Rao, S.; Rao, G. Influence of vibrations welding to enhance mechanical properties: A Review. Int. J. Res. Rev. 2019, 8, 576–585. [Google Scholar]
  24. Suresh, B.V.; Rao, P.S.; Rao, G.P. Improvement of Tensile Strength of 1018 Mild Steel Welded Joints Produced Under the Influence of Electrode Vibration. Int. J. Innov. Technol. Explor. Eng. 2019, 8, 1219–1222. [Google Scholar]
  25. Ingram, E.; Golan, O.; Haj-Ali, R.; Eliaz, N. The Effect of Localized Vibration during Welding on the Microstructure and Mechanical Behavior of Steel Welds. Materials 2019, 12, 2553. [Google Scholar] [CrossRef] [PubMed]
  26. Hussein, A.R.; Jail, N.A.A.; Abu Talib, A.R. Improvement of Mechanical Welding Properties by using Induced Harmonic Vibration. J. Appl. Sci. 2011, 11, 348–353. [Google Scholar] [CrossRef]
  27. Hsieh, C.-C.; Lai, C.-H.; Wu, W. Effect of vibration on microstructures and mechanical properties of 304 stainless steel GTA welds. Met. Mater. Int. 2013, 19, 835–844. [Google Scholar] [CrossRef]
  28. Kalpana, J.; Rao, P.S.; Rao, G.P. Effect of vibratory welding process on the hardness of dissimilar welded joints. Eng. Solid Mech. 2017, 5, 133–138. [Google Scholar] [CrossRef]
  29. Zargari, H.H.; Ito, K.; Miwa, T.; Parchuri, P.K.; Yamamoto, H.; Sharma, A. Metallurgical Characterization of Penetration Shape Change in Workpiece Vibration-Assisted Tandem-Pulsed Gas Metal Arc Welding. Materials 2020, 13, 3096. [Google Scholar]
  30. El Shrief, E.; Fadel, O.O.; Baraya, M.; El-Asfoury, M.S.; Abass, A. Data-Driven Prediction of Tensile Strength and Hardness in Ultrasonic Vibration-Assisted Friction Stir Welding of AA6082-T6. J. Manuf. Mater. Process 2026, 10, 123. [Google Scholar] [CrossRef]
  31. Harwood, J.J. The Influence of Stress on Corrosion (Part I of Two Parts). Corrosion 1950, 6, 249–259. [Google Scholar] [CrossRef]
  32. Krawiec, H.; Vignal, V. Mechanical and Electro-Chemical Interactions Under Tribocorrosion: From Measurements to Modelling for Building a Relevant Monitoring Approach; European Federation of Corrosion (EFC) Series; Woodhead Publishing: Cambridge, UK, 2021; Volume 70, pp. 7–27. [Google Scholar]
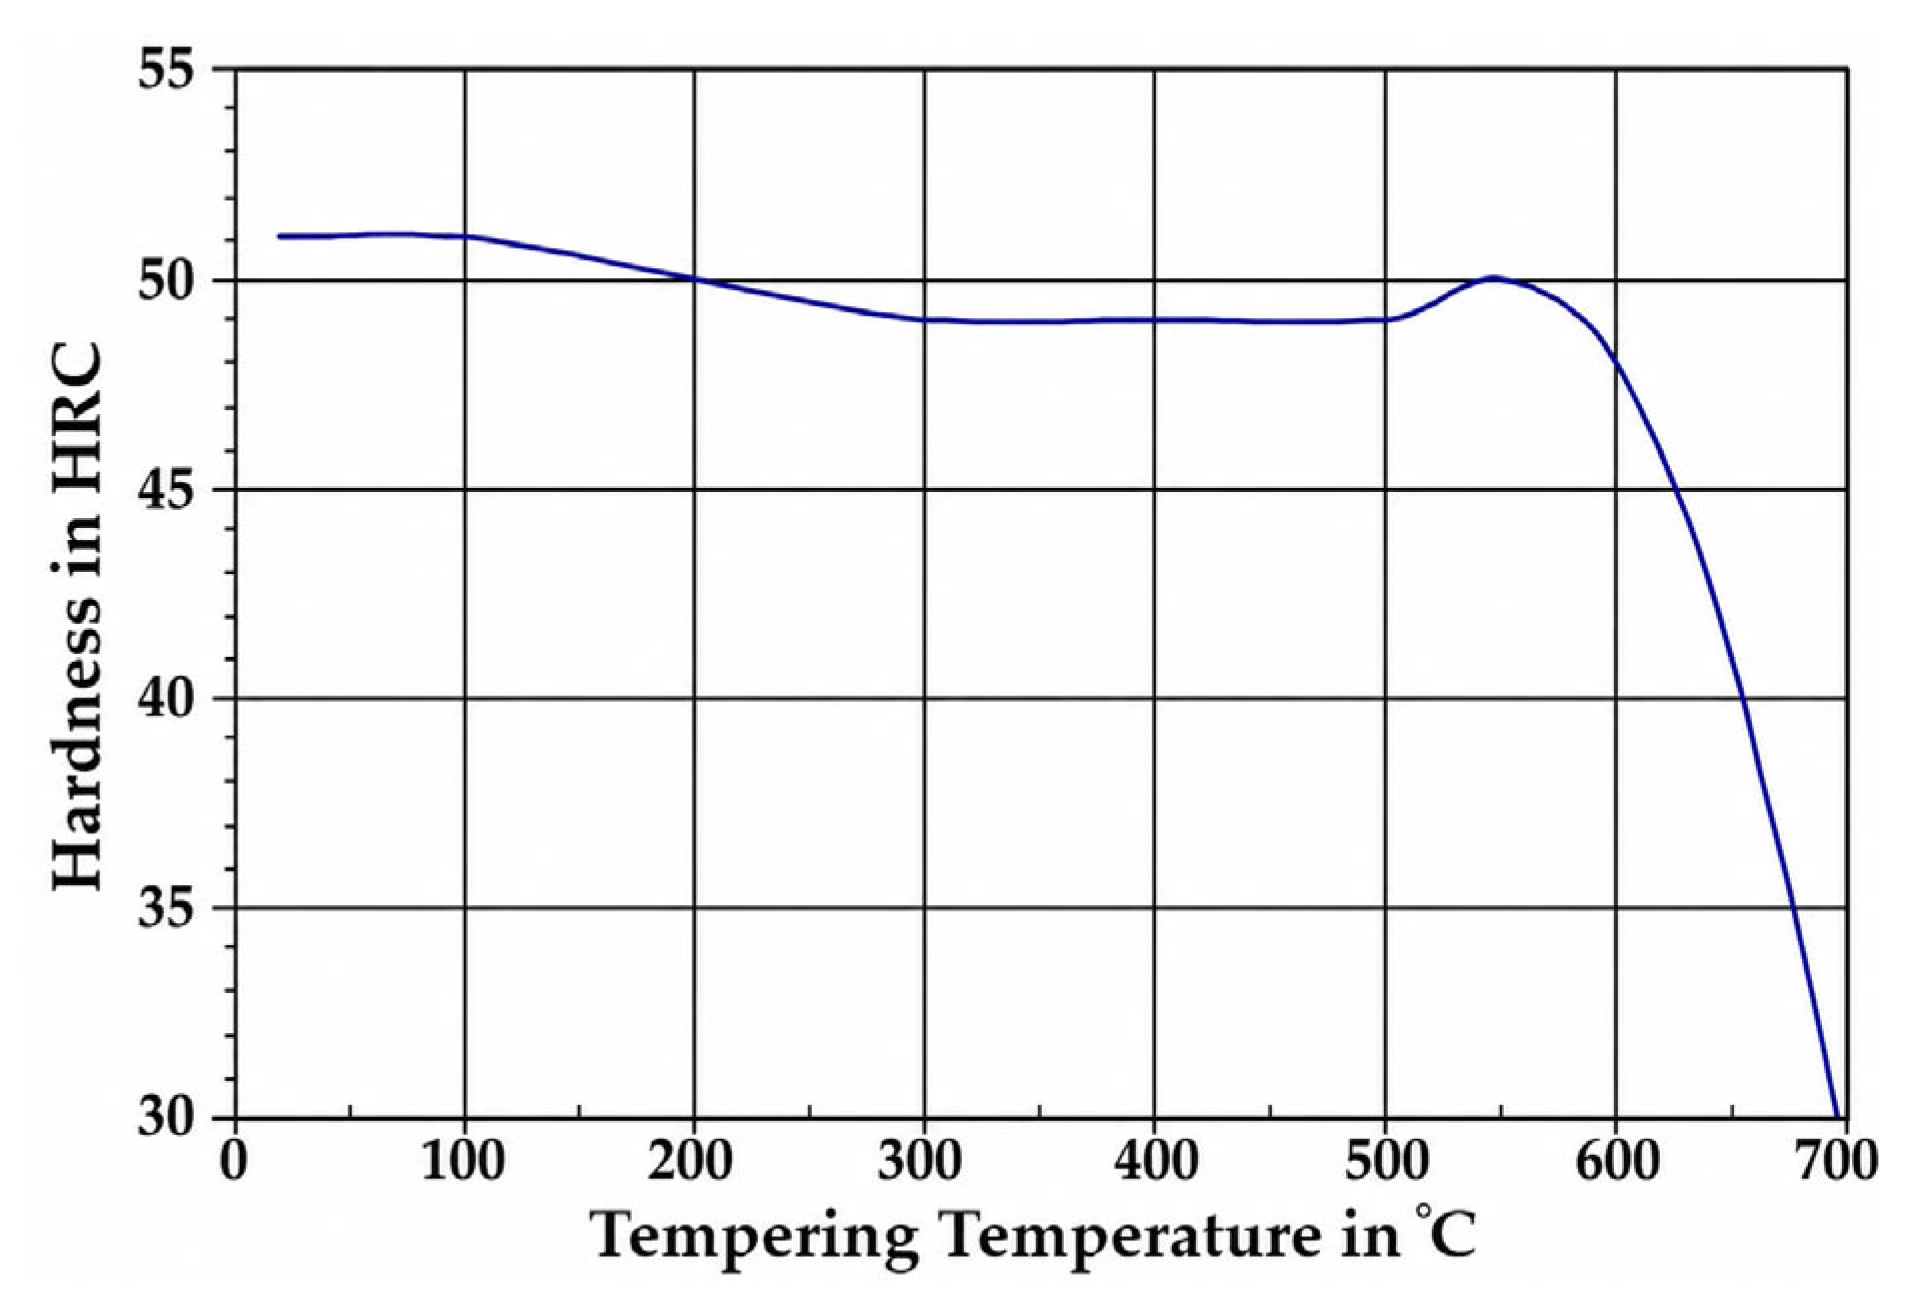
Figure 1. Variation in hardness as a function of tempering temperature (adapted from [17]).
Jmmp 10 00173 g001
Figure 2. Variation in yield strength as a function of temperature (adapted from [17]).
Jmmp 10 00173 g002
Figure 3. Shape and dimensions of test samples. (a) Base material workpiece (Ø213 mm, H = 100 mm); (b) after band-saw cutting (L = 150 mm, l = 60 mm, h = 10 mm); (c) after weld groove milling; (d) final specimen geometry with dimensions (mm).
Jmmp 10 00173 g003
Figure 4. Scheme and vibrating table used for welding.
Jmmp 10 00173 g004
Figure 5. Dynamic signal generator (a), analyzer Pulse System-Type 3560 C-E01 (b) and PCE-VT204 vibrometer (c).
Jmmp 10 00173 g005
Figure 6. Equipment used for vibration-assisted welding.
Jmmp 10 00173 g006
Figure 7. Appearance of the weld beads after welding under different conditions.
Jmmp 10 00173 g007
Figure 8. Bending test machine and position of tested sample.
Jmmp 10 00173 g008
Figure 9. The aspects of the HAZ’s corroborated dimensions and the hardness of these zones. (for visual interpretation).
Jmmp 10 00173 g009aJmmp 10 00173 g009b
Figure 10. Locations of Vickers hardness indentations.
Jmmp 10 00173 g010
Figure 11. Appearance of the specimen and location of the microhardness measurement lines.
Jmmp 10 00173 g011
Figure 12. Microstructural zones within the weld bead.
Jmmp 10 00173 g012
Figure 13. Microstructure in the vicinity of the weld surface (Zone 1, Figure 10), corresponding to the weld crown (Figure 12), magnification: ×2.5.
Jmmp 10 00173 g013
Figure 14. Microstructure in the central region of the weld bead (Zone 1, Figure 10), corresponding to the center (Figure 12), magnification: ×500.
Jmmp 10 00173 g014
Figure 15. Microstructure in the vicinity of the weld root (Zone 1, Figure 10), corresponding to the root (Figure 12), magnification: ×2.5.
Jmmp 10 00173 g015
Figure 16. Microstructure in the heat-affected zone (HAZ) (Zone 2, Figure 10), located 4 mm from the lower surface of the specimen, magnification: ×500.
Jmmp 10 00173 g016
Figure 17. Microstructure in the heat-affected zone (HAZ) (Zone 3, Figure 10), located 4 mm from the lower surface of the specimen, magnification: ×500.
Jmmp 10 00173 g017
Figure 18. Microstructure in the heat-affected zone (HAZ) (Zone 4, Figure 10), located 4 mm from the lower surface of the specimen, magnification: ×500.
Jmmp 10 00173 g018
Figure 19. Microstructure in the heat-affected zone (HAZ) (Zone 5, Figure 10), located 4 mm from the lower surface of the specimen, magnification: ×500.
Jmmp 10 00173 g019
Figure 20. SEM image including the 5–6 indentation points from Table 7.
Jmmp 10 00173 g020
Figure 21. EDS–line scanning analysis (LSA).
Jmmp 10 00173 g021aJmmp 10 00173 g021b
Figure 22. Effect of vibration-assisted welding on axial deformability.
Jmmp 10 00173 g022
Figure 23. Effect of vibration parameters on the heat-affected zone (HAZ).
Jmmp 10 00173 g023
Figure 24. Comparative effect of vibrations on lateral dilution: LSA versus macroscopic evaluation.
Jmmp 10 00173 g024
Figure 25. Comparative influence of vibrations on the hardness of the five zones shown in Figure 10, with values listed in Table 6.
Jmmp 10 00173 g025
Figure 26. Influence of vibrations on the microhardness in the HAZ for the five specimens.
Jmmp 10 00173 g026
Figure 27. Influence of welding and vibration parameters on the weld groove angle.
Jmmp 10 00173 g027
Figure 28. Dilution between CM and BM measured using line scanning analysis, LSA.
Jmmp 10 00173 g028
Figure 29. Schematic representation of the extrusion tools and the extrusion punch cladded by VAW.
Jmmp 10 00173 g029
Table 1. Chemical composition of EN 32CrMoV12-28 (1.2365) steel and values from the Certificate of Conformity.
ElementsCSiMnCrMoVPS
Standard tolerance (EN)0.28–0.350.10–0.400.15–0.452.70–3.202.60–3.000.40–0.70<0.030<0.030
From the Certificate of Conformity0.320.250.302.952.750.55--
Table 2. Chemical composition of UTP A DUR 600 electrodes (and measured values).
Chemical ElementsCSiMnCrPS
Measured composition *0.47%3.00%0.42%9.33%<0.025%<0.025%
* The chemical composition was analyzed using a TESCAN VEGA S5124 scanning electron microscope (SEM) (Tescan, Brno, Czech Republic)equipped with a BRUKER EDS (Energy-Dispersive X-ray Spectroscopy, Bruker, Berlin, Germany) system.
Table 3. Vibratory-assisted welding parameters.
SampleUW
[V]
IW
[A]
vw
[cm/min]
vf
[m/min]
Q
[kJ/cm]
G
[l/min]
f
[Hz]
Uex
[V]
az
[m/sec2]
ax
[m/sec2]
A19.427125811.3522----
B22.5812.6122----
C50207060
D108113530
E5073530
Uw is welding voltage.
Iw is welding current.
vw is welding speed.
vf is wire feed speed.
Q is heat input.
G is gas flow rate.
f is vibration frequency.
Uex is excitation voltage.
az is vertical acceleration.
ax is horizontal acceleration.
Table 4. Bending test—crack angle.
SampleCrack Angle
A2
B3
C7
D6
E5
Table 5. Measurements of the welding dimensions from Figure 9.
SamplePenetration at the RootDilution ZoneHAZ
A3 mm − 2.762 mm = 0.238 mm0.408 mm2.233 mm
B3 mm − 2.769 mm = 0.321 mm0.524 mm3.208 mm
C3 mm − 2.589 mm = 0.411 mm0.715 mm2.687 mm
D3 mm − 2.305 mm = 0.695 mm0.517 mm2.542 mm
E3 mm − 2.904 mm = 0.096 mm0.489 mm2.140 mm
Table 6. Measured hardnesses of the samples.
SampleHardness HV5-10
12345Mean in BM *
A608303159150163277
B697415178167177327
C908421181172168370
D702358163159165309
E768403189177162340
HV point 1 In CM (cladding material). HV point 2, 3, 4, 5 in * BM (base material).
Table 7. Microhardness values starting from the axis of symmetry of the weld.
DistanceABCDE
0785.28723.8767.14753.37743.6
0.7770.99717.61763.64726.93705.13
1.4736.85705.1760.2753.54720.8
2.1736.97708.22750760.41730.43
2.8767.49714.45702.08777.75733.7
3.5551.25575.41530.55621.11530.55
4.2487.19598.82530.51429.27409.51
4.9310.59336.5350.09313.4310.68
5.6253.38295.08248.81236.41236.4
6.3192.23246.9188.85177.84184.66
7171.38167.4162.86184.25194.97
7.7190.52178.23170.65177.06190.57
8.4185.07168.47155.28153.43172.5
9.1170.65171.75171.38166.33171.76
9.8171.01173.62156.5170.65168.48
10.5169.92161.84164.59175.14171.38
11.2167.04166.34180.6163.21170.29
11.9182.19166.34155.28165.28192.31
12.6171.39168.11183.83164.94166.34
13.3171.38168.48155.28163.55171.02
Media in BM177.26187.16175.25173.09172.07
Media in CM759.52713.84748.61754.40726.73
Table 8. Influence of VAW on the groove angle.
SampleInitial Groove
Angle (∠)
Increase in the Groove Angle After WeldingFinal Groove Angle (∠)
A22.532.555
B22.519.542
C22.5022.5
D22.513.536
E22.521.544
Table 9. Dilution values measured using Line Scanning Analysis (LSA).
SampleDilution Depth
Interpretation
[µm]
A120
B131
C148
D135
E130
Disclaimer/Publisher’s Note: The statements, opinions and data contained in all publications are solely those of the individual author(s) and contributor(s) and not of MDPI and/or the editor(s). MDPI and/or the editor(s) disclaim responsibility for any injury to people or property resulting from any ideas, methods, instructions or products referred to in the content.