


Abstract
Cotton production requires substantial nutrient inputs, while increasing fertilizer costs and concerns associated with intensive chemical fertilizer use highlight the need for more efficient nutrient management. However, information on whether farmyard manure can complement reduced chemical fertilizer rates while maintaining cotton productivity remains limited. The fertilizer treatments consisted of the recommended doses of N, P, K, and Zn (150, 80, 80, and 10 kg ha−1, respectively) and their 25% reduced rates, in combination with farmyard manure applied at rates of 5 and 10 t ha−1. The full recommended fertilizer rate combined with 10 t ha−1 farmyard manure produced the highest seed cotton yield (5680 kg ha−1) and lint yield (2670 kg ha−1), together with high values for boll number (14.6 bolls plant−1), boll weight (7.3 g), and seed cotton weight per boll (6.3 g). The same treatment also improved plant mineral nutrition, increasing leaf N from 2.60 to 2.85% in the control to 3.63–3.68%, P from 0.23 to 0.26% to 0.40%, Fe from 51 to 61–67 mg kg−1, and Zn from 25 to 32 mg kg−1 across the two experimental years. Post-harvest soil organic matter also increased from 2.65 to 2.76% in the control to 3.22–3.35% under this treatment. The treatment combining a 25% reduced mineral fertilizer rate with 10 t ha−1 farmyard manure increased seed cotton yield by 23.4% compared with the control. However, the observed response likely reflects the combined contribution of the reduced mineral fertilizer rate and nutrients supplied by farmyard manure, rather than the effect of either nutrient source alone. Therefore, combining farmyard manure with mineral fertilization may provide a practical nutrient management strategy for maintaining cotton productivity, although the contribution and short-term availability of manure-derived nutrients should be considered when interpreting fertilizer substitution effects.
1. Introduction
Cotton is an essential raw material for the textile and oil industry, an important crop in rotation systems as row crops, and a major export crop commodity. In 2022, cotton production was 26.4 million tons covering 33.4 million hectares, while consumption was 26.2 million tons. China has the biggest cotton production, followed by India, the USA, Brazil, Australia, Türkiye, Pakistan, and Uzbekistan. India ranks first in terms of area, followed by China, Pakistan, Uzbekistan, and Brazil [1]. Cotton is widely cultivated in Türkiye, particularly in Southeastern Anatolia, the Aegean region, Çukurova, and Antalya. In 2021, cotton was cultivated on approximately 478,000 ha, of which 86% was concentrated in Şanlıurfa, Diyarbakır, Hatay, Aydın, Adana, and İzmir provinces [2]. The average seed cotton yield was approximately 460 kg da−1. Southeastern Anatolia accounted for 55% of total production, while Çukurova and the Aegean regions each accounted for approximately 22%, and Antalya for 1% [2]. With limited agricultural land, increased world population emphasizes the need to enhance annual cotton productivity, but cotton cultivation area is declining in Türkiye. With only about 40% of local fiber demand being covered, imports are necessary. Cotton production costs are on the rise, encouraging farmers to shift toward alternative crops, resulting in a reduction in production of about 20–30% in the Çukurova Region [3].
A sustainable increase in cotton productivity and quality requires the efficient use of agricultural inputs and appropriate crop management practices. This can be achieved through the effective management of fertilizers, seeds, irrigation, and plant protection practices. Based on data, the use of chemical fertilizers is responsible for at least 50 percent of increases in crop production [4]. However, due to the rising costs, the efficient use of fertilizer is now needed. However, although cotton is among the most fertilized plants, the process of fertilizer application might not always be properly done. Thus, while applying fertilizers, it is important to keep in mind soil characteristics along with the relations between water, soil, and crops and use organic substances.
Organic fertilizers are believed to increase soil fertility as they improve the physical, chemical, and biological properties of soil and provide it with necessary nutrients needed for plants [5,6,7,8,9]. Mineral fertilizers, along with organic fertilizers, contribute to sustainable agricultural production as they enhance the availability of nutrients in soil and thus help also minimize the adverse effects on the environment owing to excessive use of chemical fertilizers. Organic substances play a significant role in increasing soil fertility by increasing the nutrients retention, water holding capacity, improving soil aeration properties, regulating pH in soil, and increasing microbial activity [10,11,12,13]. Therefore, integrated nutrient management aimed at combining organic and chemical fertilizers has become increasingly important for maintaining soil fertility while minimizing the use of synthetic fertilizers and, consequently, production costs.
Moreover, intensive chemical fertilizer use can contribute to greenhouse gas emissions through fertilizer production and soil nitrogen transformations following field application. These emissions contribute to global warming and may undermine the environmental sustainability of agricultural production systems [14,15].
Türkiye’s fertilizer sector is strongly dependent on external sources because domestic fertilizer production does not fully meet national demand and a large proportion of the raw materials required for fertilizer production, including natural gas, phosphate rock, and potassium salts, are imported [16]. Consequently, fertilizer costs in Türkiye are sensitive to exchange-rate fluctuations and changes in international market conditions [16]. In 2022, Türkiye imported approximately 1.79 million tonnes of N-, P-, and K-based fertilizers, and the value of chemical fertilizer imports exceeded USD 3 billion [17]. Global fertilizer and agricultural input markets have also been affected by supply-chain disruptions and geopolitical uncertainties, which intensified following the Russia–Ukraine conflict [18,19]. These conditions emphasize the importance of improving fertilizer use efficiency and partially replacing chemical fertilizers with locally available organic nutrient sources such as farmyard manure.
Although the combined use of organic and chemical fertilizers in cotton production has been investigated previously, important questions remain regarding the extent to which farmyard manure can compensate for a reduction in chemical fertilizer inputs without adversely affecting crop productivity and fiber quality. In particular, relatively limited information is available from two-year field studies simultaneously evaluating crop yield and yield components, fiber quality, plant nutrient status, and post-harvest soil fertility under defined combinations of reduced chemical fertilizer rates and farmyard manure doses. Such an integrated assessment is particularly relevant under Mediterranean field conditions, where fertilizer management strategies must balance crop productivity with improved nutrient use and soil fertility. Therefore, the present study evaluated a 25% reduction in the recommended N-P-K-Zn fertilizer rate in combination with two farmyard manure rates (5 and 10 t ha−1) and compared these treatments with the full recommended fertilizer rate and unfertilized control. We hypothesized that the addition of farmyard manure, particularly at 10 t ha−1, would partially compensate for the reduction in chemical fertilizer inputs by improving plant nutrient status and post-harvest soil fertility, thereby maintaining cotton yield without adversely affecting the main fiber quality characteristics. Accordingly, the objective of this study was to determine whether integrating farmyard manure with reduced chemical fertilization could provide a viable nutrient management strategy for cotton production under the environmental conditions of the study region.
2. Materials and Methods
2.1. Experimental Site and Soil Properties
The study was conducted during the 2022 and 2023 growing seasons at the Central Farm of the Tarsus Soil and Water Resources Research Station of the Alata Horticultural Research Institute, located in the Tarsus Plain within the Lower Seyhan Irrigation Area, Türkiye. The experimental site is located approximately 10 km southeast of Tarsus at 36°55′ N latitude and 34°55′ E longitude, at an elevation of approximately 12 m above sea level. The previous crop at the experimental site was maize. Different field plots were used in the 2022 and 2023 growing seasons; therefore, the treatments were established and randomized separately in each year rather than being maintained in the same plot locations. The composted farmyard manure used in the experiment consisted exclusively of cattle manure and was sourced from nearby livestock farms. As the farmyard manure was obtained from an external source, the exact duration of the composting process was not available. Prior to field application, the material was evaluated based on its physicochemical and sensory characteristics. The farmyard manure had a C/N ratio of 28.6 and showed no noticeable unpleasant odor or apparent characteristics of fresh manure. C/N ratios around 29 have been associated with favorable compost stability in composting systems containing dairy manure [20]. Based on these combined characteristics, the material was considered sufficiently stabilized and suitable for field application. Some physicochemical properties of the experimental soil and some chemical characteristics of FM are summarized in Table 1 and Table 2.
Table 1.
Physicochemical properties of the soil in the experimental area.
Table 2.
Organic matter content and nutrient concentrations of farmyard manure.
Before establishment of the experiment, soil samples were collected from the 0–30 cm soil layer to characterize the initial physicochemical properties of the soil in the experimental area. The selected soil properties are presented in Table 1.
The farmyard manure was applied at rates of 5 and 10 t ha−1 on an as-applied basis. The moisture content of the as-applied manure was determined gravimetrically by oven drying at 70 °C according to [21] and was 20 ± 1.20%. For the remaining analyses, the manure sample was air-dried. Organic matter was determined by loss-on-ignition according to AOAC 967.03–04–05 by incinerating the sample at 550 °C for 6 h and expressed on a dry-matter basis. Total N was determined by the Kjeldahl method (TS EN 15478 [22]), and total P was determined according to [23]. K, Ca, Mg, Fe, Zn, Mn, and Cu were determined according to the laboratory procedure. Organic C was estimated from organic matter using a conversion factor of 0.58 (C = OM × 0.58), and the C/N ratio was calculated from the estimated organic C and measured total N. The chemical characteristics of the farmyard manure are presented in Table 2.
2.2. Climatic Conditions
The experimental area has a Mediterranean climate. Monthly mean temperature, precipitation, mean wind speed, and relative humidity during the 2022 and 2023 growing seasons, together with the long-term averages (1950–2023), are presented in Table 3. Meteorological data were obtained from the weather station of the Tarsus Soil and Water Resources Research Station. Overall, the 2023 growing season was slightly warmer and drier than that of 2022, particularly during the summer months.
Table 3.
Monthly weather conditions during the 2022 and 2023 cotton growing seasons and long-term averages (1950–2023) at the experimental site.
2.3. Crop Management and Agronomic Practices
Cotton was sown at a row spacing of 70 cm and an intra-row spacing of approximately 20 cm, at a sowing depth of 3–4 cm depending on soil conditions. Each experimental plot consisted of four rows. The two central rows were used for measurements and harvesting, whereas the two outer rows were considered border rows. To minimize border effects, 0.5 m at both ends of each plot was excluded from the evaluation. Plants were thinned during the early growth stage to maintain the desired plant spacing, and weeds were controlled manually and by hoeing.
The experiment was irrigated using a drip irrigation system. Irrigation was initiated before flowering and continued until approximately 10% boll opening, with irrigation events scheduled according to crop water requirements. Plant protection measures were applied when necessary according to pest occurrence and population levels during both growing seasons. Cotton was harvested manually in November of each year. The outer rows and 0.5 m at both ends of each plot were excluded from harvesting, resulting in a net harvested area of 5.6 m2 per plot.
2.4. Setting up the Experiment
The experiment was conducted using a randomized complete block design (RCBD) with three replications in each growing season. Nine treatments were evaluated, resulting from the combination of three chemical fertilizer levels and three farmyard manure (FM) levels. The chemical fertilizer levels were: no chemical fertilizer, the recommended fertilizer dose (RDF; 150–80–80–10 kg ha−1 of N-P-K-Zn), and a 25% reduced recommended fertilizer dose (RDFR; 112.5–60–60–7.5 kg ha−1 of N-P-K-Zn). The FM levels were 0, 5, and 10 t ha−1. Thus, combining the three chemical fertilizer levels with the three FM levels resulted in nine treatment combinations (T0–T8), as presented in Table 4. Total N, P, K, and Zn inputs for each treatment, including the contributions from both mineral fertilizer and FM, are also presented in Table 4. Each treatment was randomly assigned once within each of the three blocks, resulting in 27 experimental plots per growing season. Each plot consisted of four rows measuring 5 m × 2.8 m. The ‘Lazer’ cotton cultivar was used as the test crop. Cotton was sown in mid-May at a row spacing of 70 cm and an intra-row spacing of approximately 20 cm.
Table 4.
Experimental groups, fertilizer combinations, and total nutrient inputs.
2.5. Evaluation of Plant Characteristics
The following traits were determined according to the methods described by Worley [24]. Boll Number Per Plant (number plant−1), boll weight (g), and seed cotton weight per boll (g) were calculated as the average of measurements obtained from 10 randomly selected plants in each plot. Seed cotton yield (kg ha−1): For each plot, the two outer rows and 0.5 m at each end of the plot were excluded from the harvest area. Seed cotton harvested from the two central rows was weighed, and the yield was converted to kg ha−1. Ginning outturn (%): Seed cotton obtained from bolls was processed using a laboratory-type roller gin to separate lint and seed, which were then weighed, and ginning outturn was calculated using Equation (1):
Ginning outturn (%) = [lint/(lint + seed)] × 100
Lint yield (kg ha−1) was calculated using the following formula: (seed cotton yield × ginning outturn)/100.
2.6. Fiber Analyses
Seed cotton samples obtained from randomly selected plants within the yield rows at harvest were ginned using a laboratory cotton gin. From each experimental plot, a 500 g seed cotton subsample was wrapped in paper packages and transported to the Fiber Cotton Analysis Laboratory of the Adana Commodity Exchange for fiber quality analyses. The lint samples were first conditioned under standard atmospheric conditions and subsequently analyzed using an HVI 1000 (USTER HVI 1000 (High Volume Instrument; Uster Technologies AG, Uster, Switzerland)) system to determine the fiber fineness (Micronaire), fiber strength (g tex−1), fiber yellowness (+b), fiber brightness (Rd), spinning consistency index (SCI), and fiber length (mm).
2.7. Soil Analysis
Soil samples were collected from the 0–30 cm soil layer before the establishment of the experiment. Soil organic matter content was determined according to the Walkley and Black (1934) method [25]. Soil pH and electrical conductivity (EC) were measured using pH and EC meters, respectively. Soil CaCO3 content was determined using the Calsimetric method. DTPA-extractable micronutrient concentrations were determined according to Lindsay and Norvell [26]. Available P was determined according to Olsen et al. [27]. Ammonium acetate-extractable K, Ca, and Mg were measured by atomic absorption spectrophotometer (AAS; Varian 240 FS, Varian, Inc., Palo Alto, CA, USA), as described by Pratt [28].
2.8. Leaf Analysis
Leaf samples were collected from the youngest expanded leaves on the main stem during the first square stage, after which every part was washed first with normal water and then with distilled water. After that, the leaves were dried in an oven at a temperature of 65–70 °C until they reached constant weight followed by the grinding of the dried leaves to pass through a fine sieve. Nitrogen concentration of the leaves was determined using the Kjeldahl method while phosphorus was measured using the vanadomolybdophosphoric yellow color method. Concentrations of the K, Ca, Fe, Mg, Zn, Mn and Cu were assessed using AAS after wet digestion of the leaves [29].
2.9. Statistical Analysis
Statistical analyses were performed using the JMP version 8.0 (SAS Institute Inc., Cary, NC, USA). Differences between treatment groups were evaluated using the Least Significant Difference (LSD) test, with statistical significance set at p < 0.05.
3. Results and Discussion
3.1. Yield Parameters
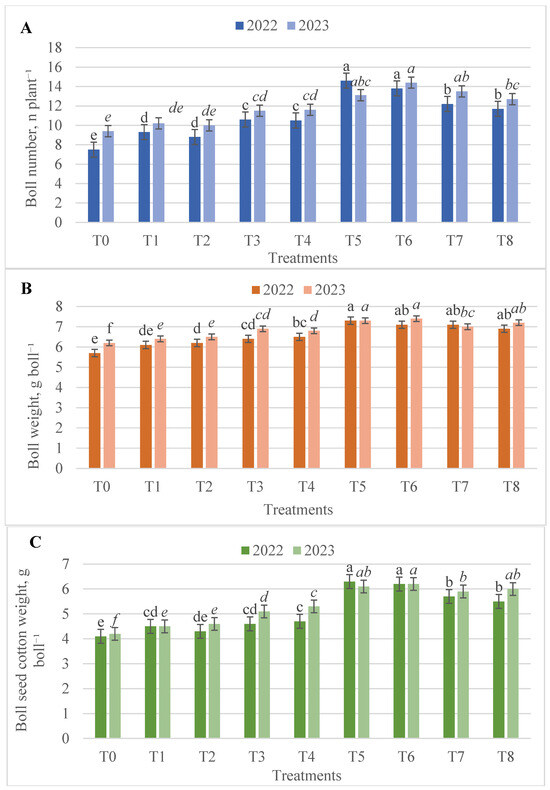
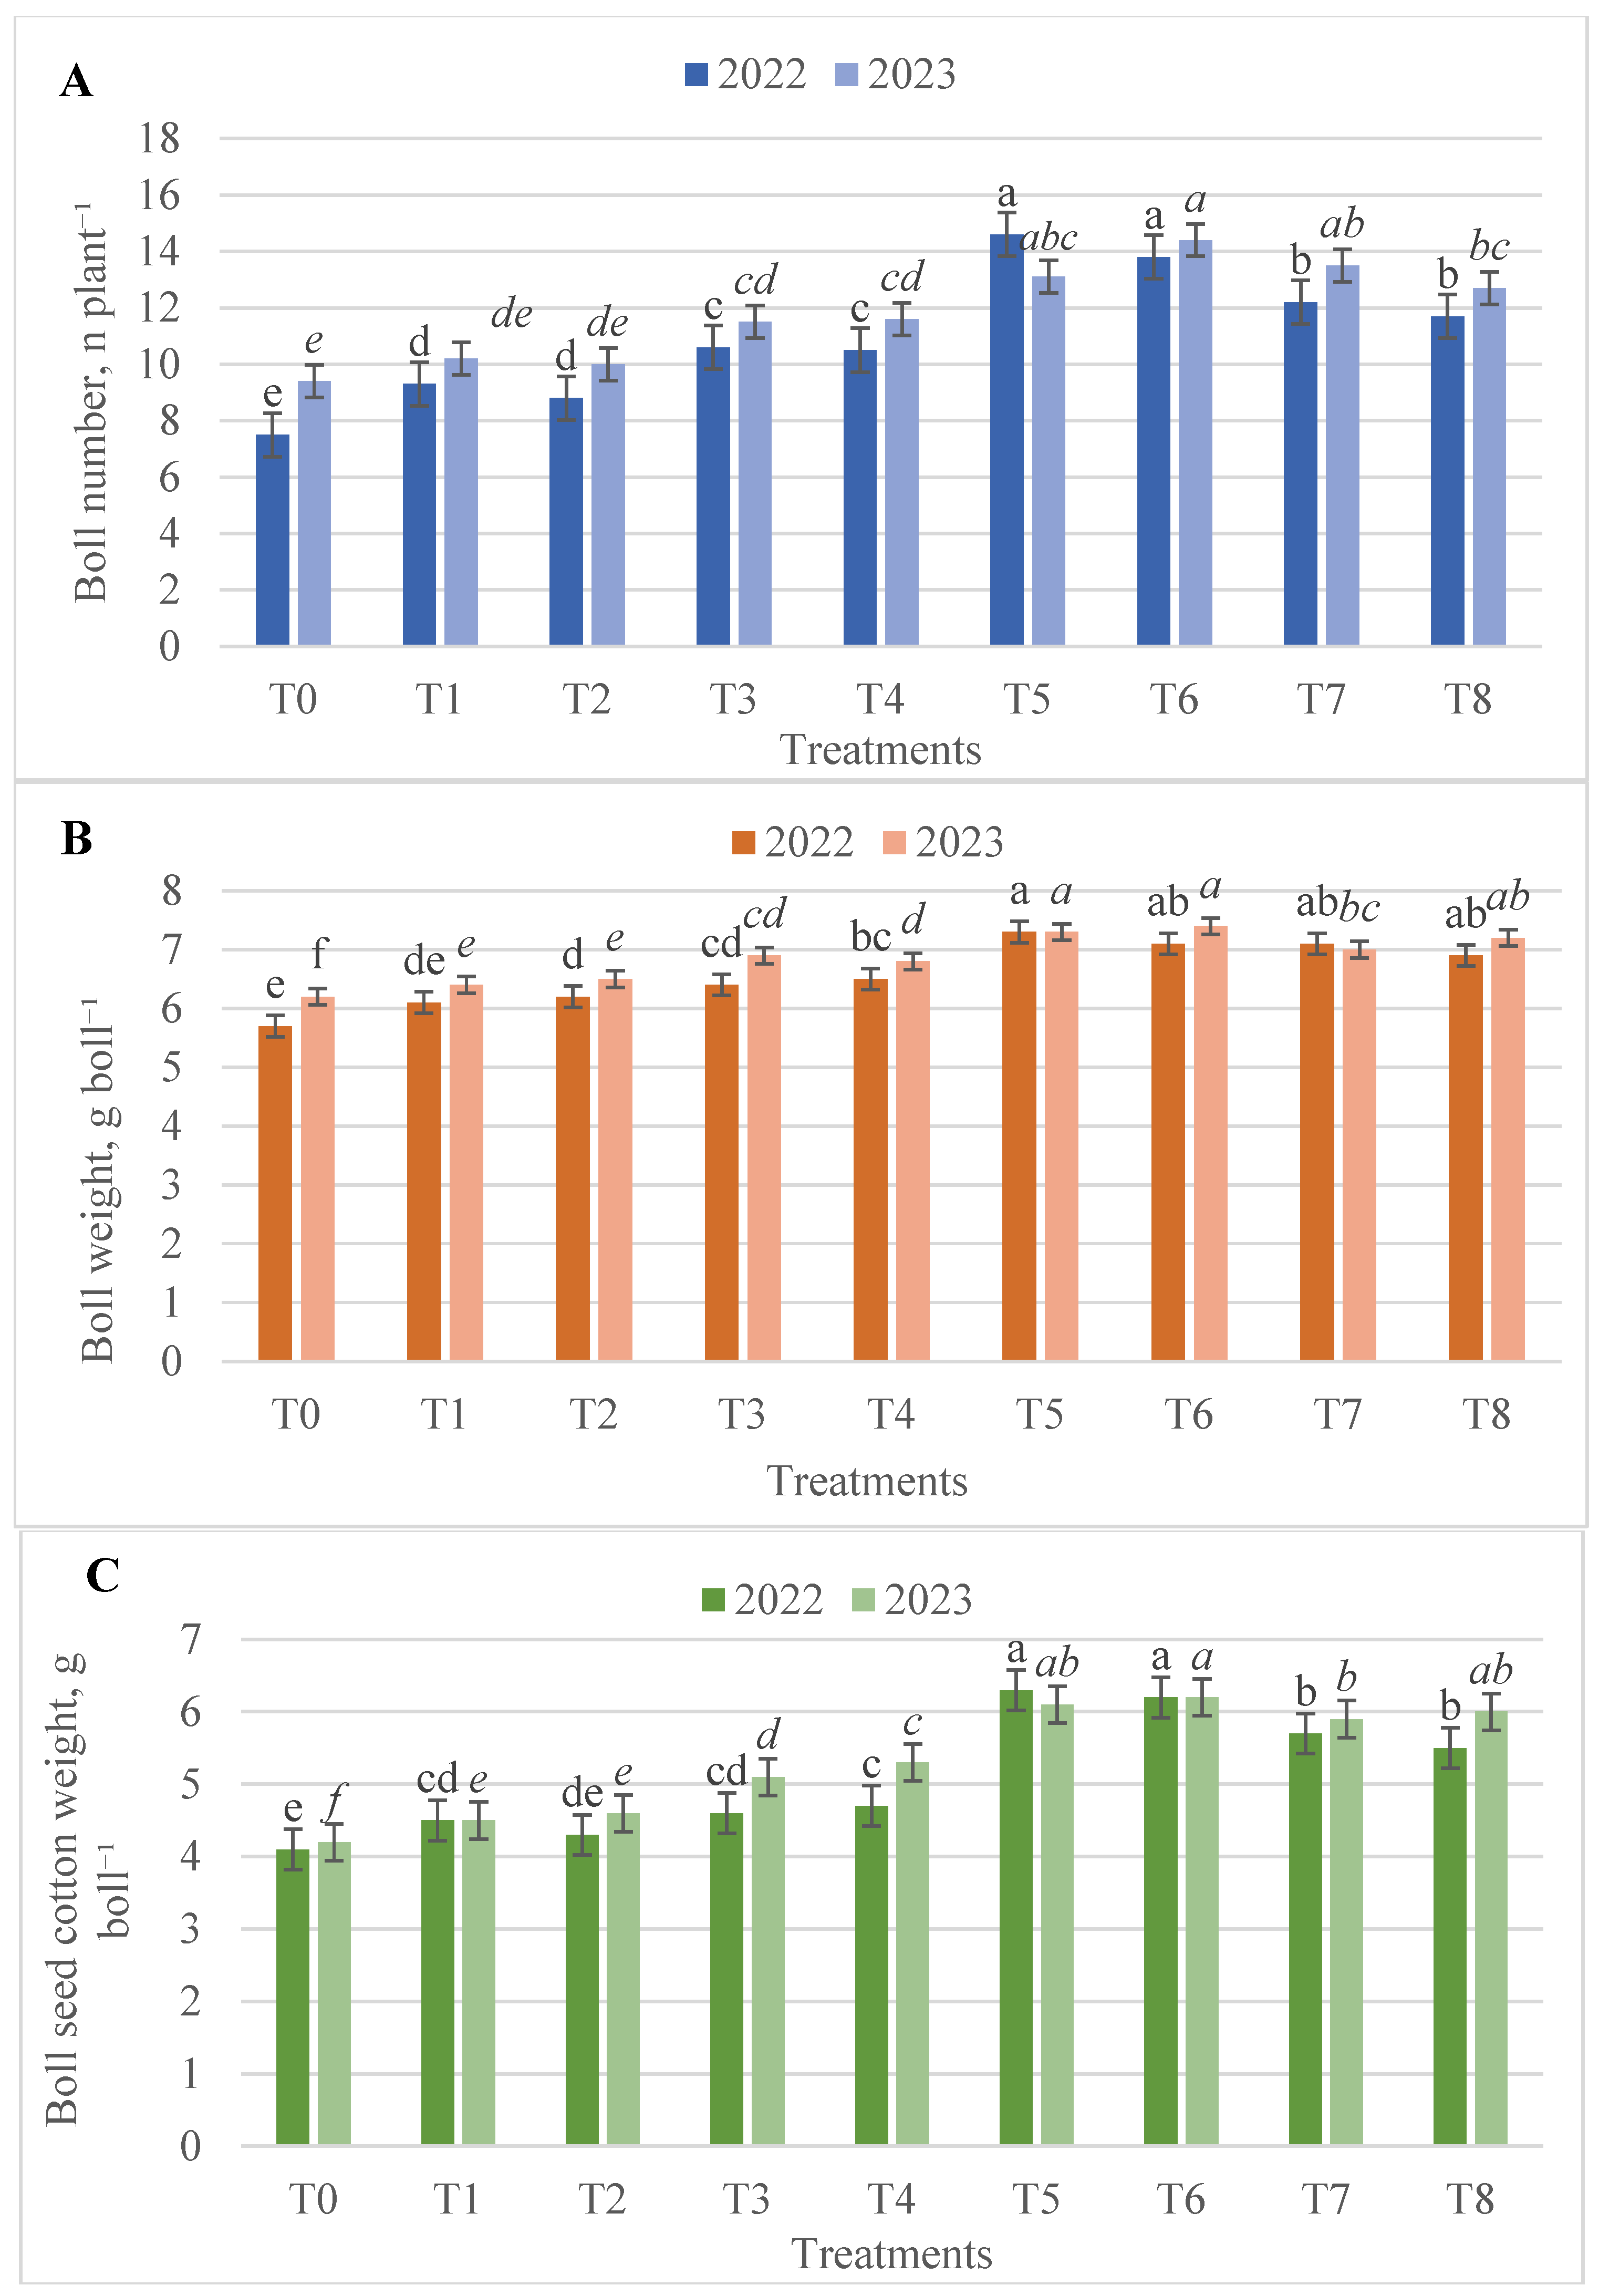
The boll number, boll weight, seed cotton weight per boll, seed cotton yield, ginning outturn, and lint yield were significantly affected by the treatments (p < 0.05). The number of bolls per plant ranged from 7.5 to 14.6 in 2022 and from 9.4 to 14.4 in 2023 (Figure 1A). In 2022, T5 and T6 belonged to the highest statistical group for boll number and did not differ significantly from each other. In 2023, T6 had the numerically highest boll number; however, it was statistically similar to T5 and T7, as indicated by the shared significance letters. The control treatment (T0) was included in the lowest statistical group in both years.
Figure 1.
Effects of the treatments on boll number (A), boll weight (B) and seed cotton weight (C). Means sharing the same letter are not significantly different (p < 0.05). Regular letters indicate the difference for the year 2022, while italic letters indicate the difference for the year 2023. T0: Control, T1: RDF (150–80–80–10 kg ha−1 of N-P-K-Zn), T2: RDFR (112.5–60–60–7.5 of N-P-K-Zn), T3: FM (10 t ha−1), T4: FM (5 t ha−1), T5: RDF + FM (10 t ha−1), T6: RDF + FM (5 t ha−1), T7: RDFR + FM (10 t ha−1), T8: RDFR + FM (5 t ha−1).
Boll weight ranged from 5.7 to 7.3 g boll−1 in 2022 and from 6.2 to 7.4 g boll−1 in 2023 (Figure 1B). In 2022, T5 was among the treatments with the greatest boll weight and was statistically similar to treatments sharing the same significance group. In 2023, T5 and T6 were included in the highest statistical group, whereas T0 was in the lowest group. Seed cotton weight per boll ranged from 4.1 to 6.3 g boll−1 in 2022 and from 4.2 to 6.2 g boll−1 in 2023 (Figure 1C). In 2022, T5 and T6 belonged to the highest statistical group. In 2023, T6 had the numerically greatest value but did not differ significantly from T5 and other treatments sharing the same significance letter. The control treatment generally remained within the lowest statistical group.
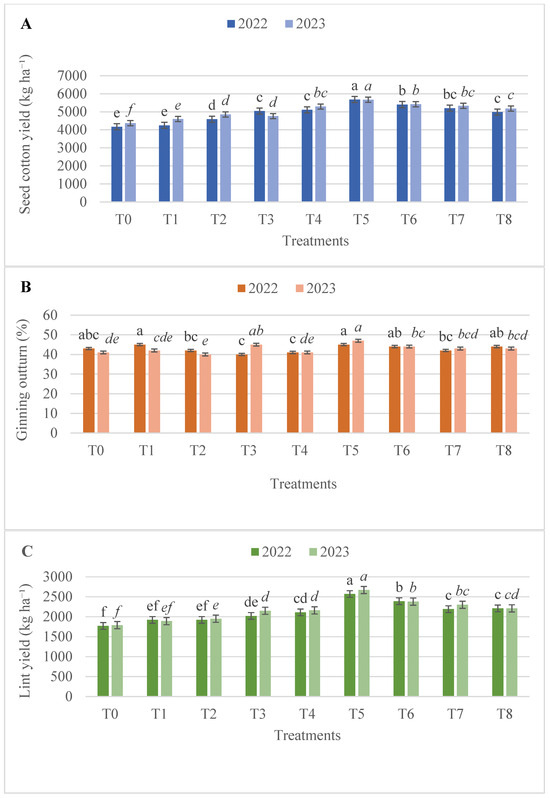
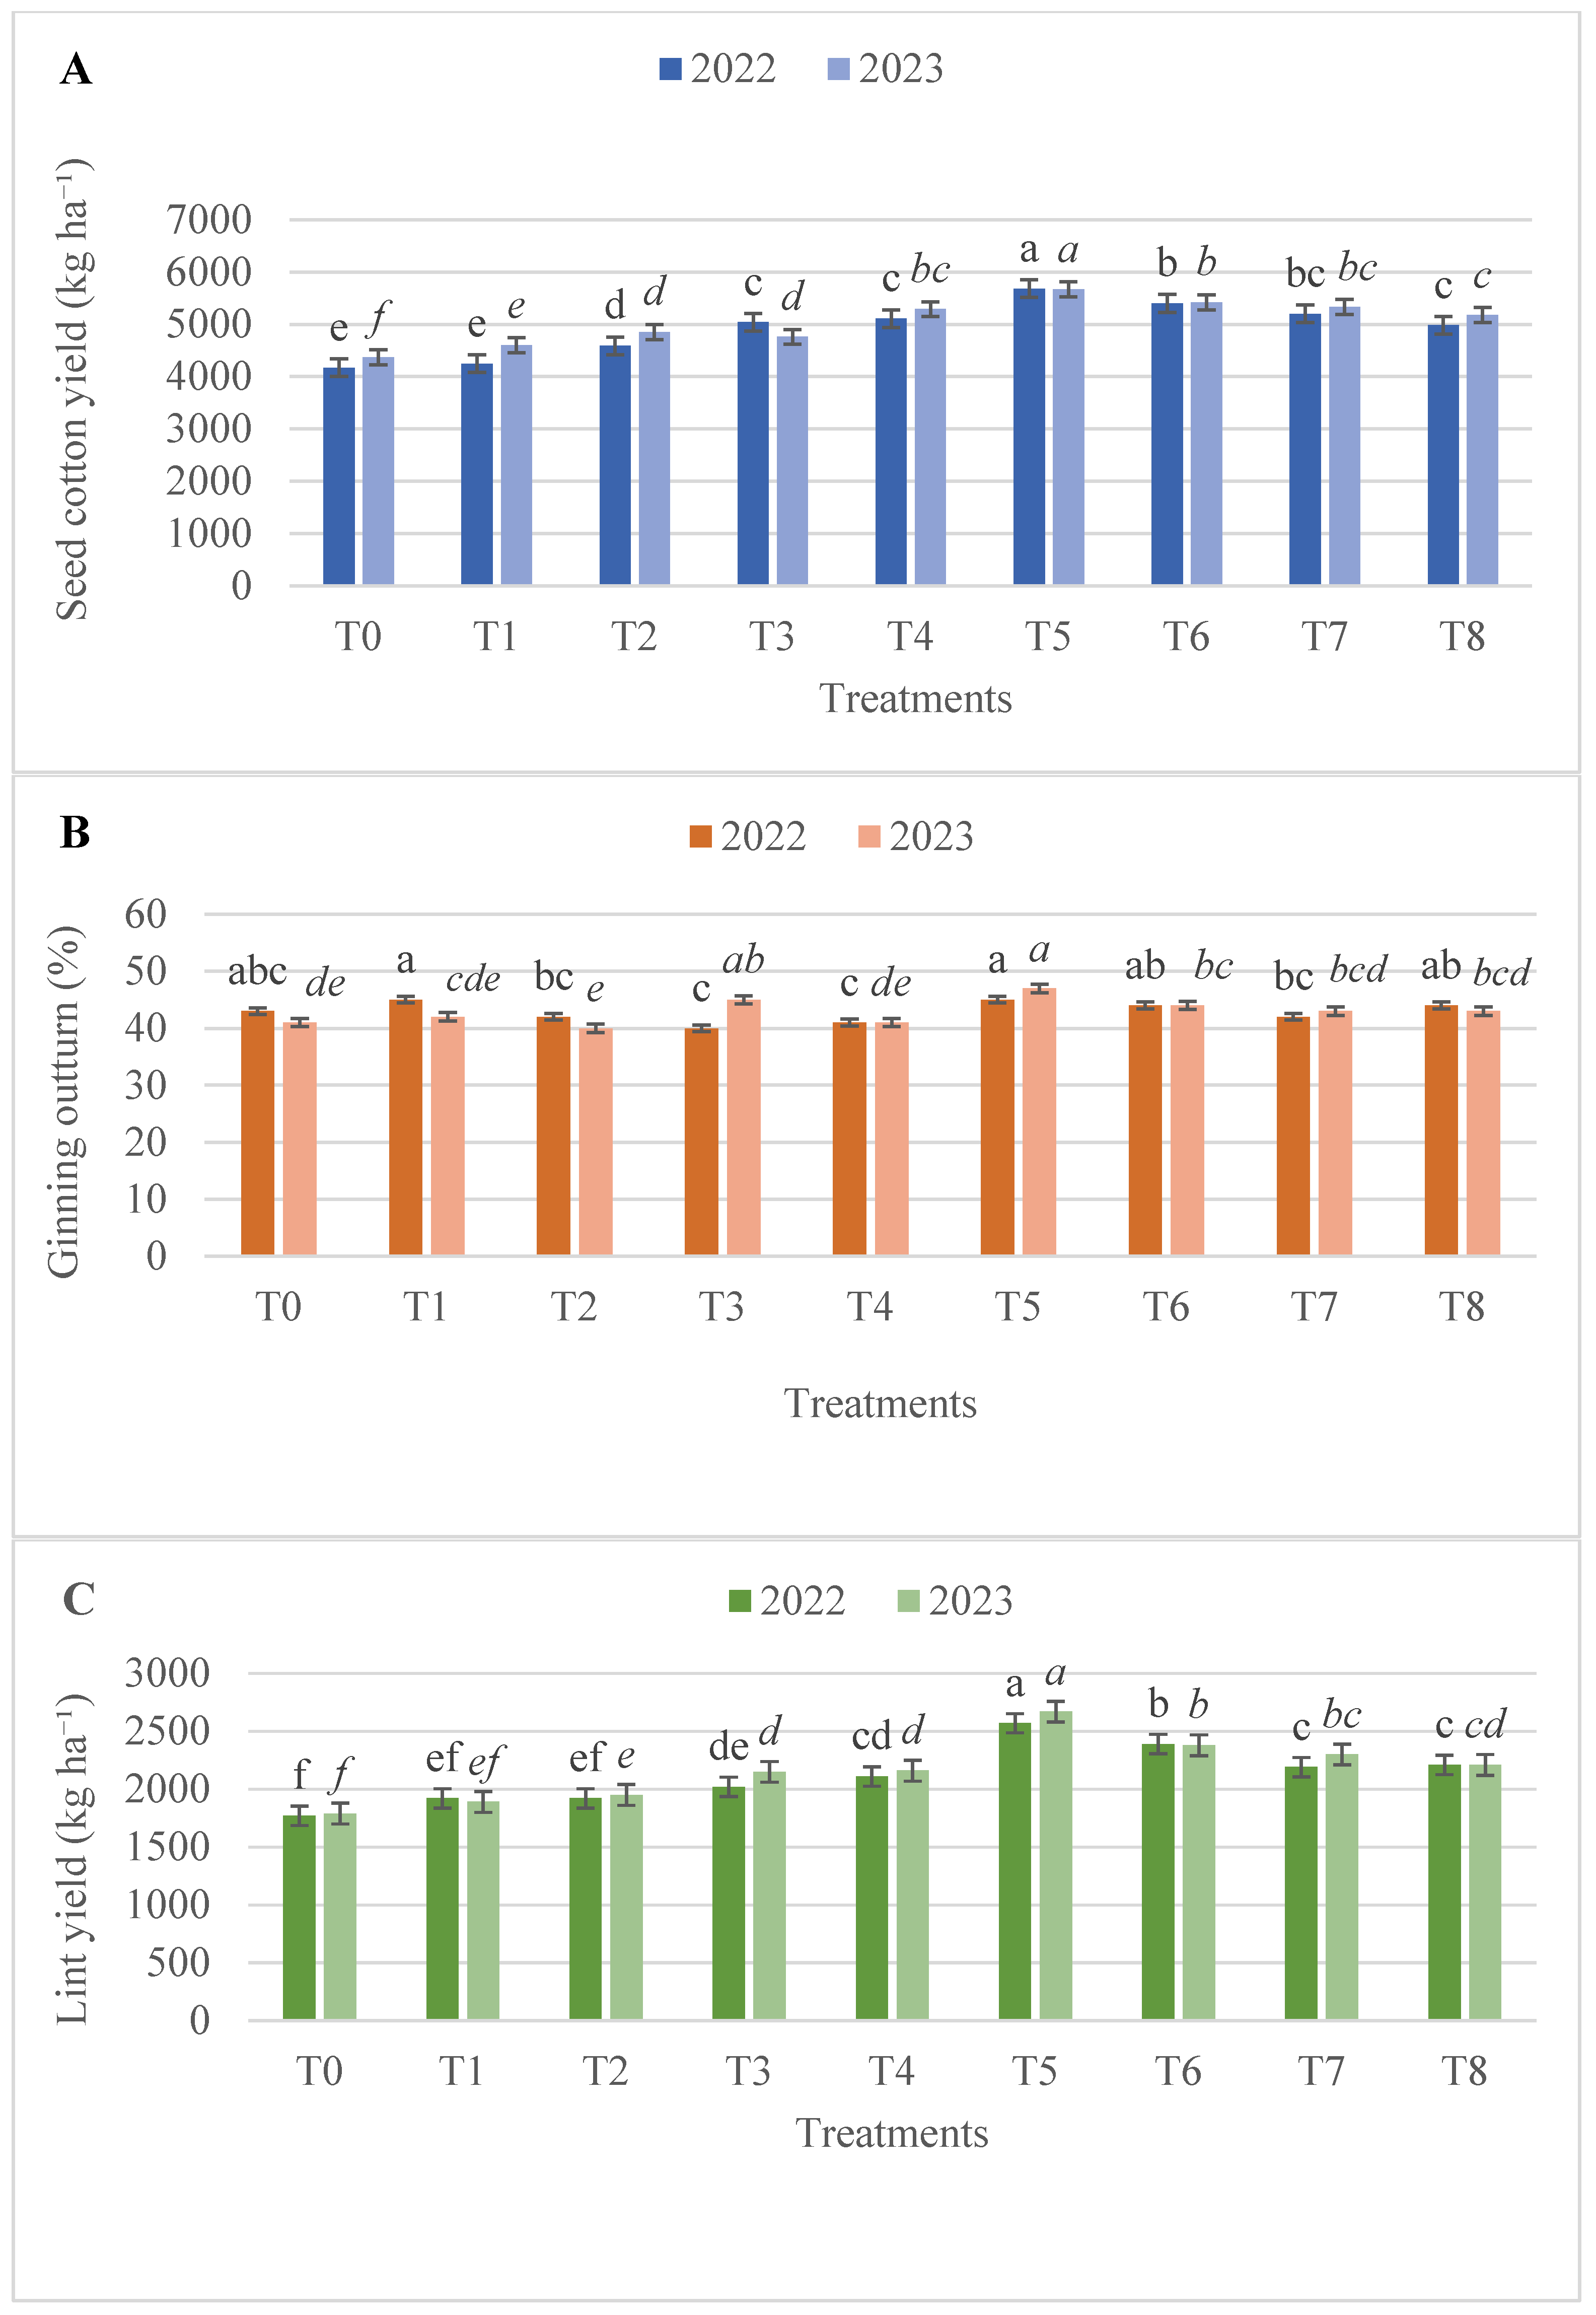
Seed cotton yield ranged from 4170 to 5680 kg ha−1 in 2022 and from 4370 to 5670 kg ha−1 in 2023 (Figure 2A). T5 (RDF + FM at 10 t ha−1) produced the greatest seed cotton yield in both years and was placed in the highest statistical group. In contrast, T0 was included in the lowest statistical group in both growing seasons. Lint yield followed a similar response, ranging from 1770 to 2570 kg ha−1 in 2022 and from 1790 to 2670 kg ha−1 in 2023 (Figure 2C). T5 was included in the highest statistical group for lint yield in both years, whereas the control treatment was consistently among the lowest groups. Ginning outturn ranged from 40 to 45% in 2022 and from 40 to 47% in 2023 (Figure 2B). Although significant differences among treatments were observed, the pattern was less consistent than that observed for seed cotton and lint yields.
Figure 2.
Effects of the treatments on seed cotton yield (A), ginning outturn (B) and lint yield (C). Means sharing the same letter are not significantly different (p < 0.05), Regular letters indicate the difference for the year 2022, while italic letters indicate the difference for the year 2023. T0: Control, T1: RDF (150–80–80−10 kg ha−1 of N-P-K-Zn), T2: RDFR (112.5–60–60–7.5 of N-P-K-Zn), T3: FM (10 t ha−1), T4: FM (5 t ha−1), T5: RDF + FM (10 t ha−1), T6: RDF + FM (5 t ha−1), T7: RDFR + FM (10 t ha−1), T8: RDFR + FM (5 t ha−1).
Overall, the statistical comparisons indicate that the combined application of FM and chemical fertilizer generally improved yield and yield components relative to the control and fertilizer-only treatments. For example, seed cotton yield under RDF alone (T1) was 4250 kg ha−1 in 2022, whereas the RDF + 10 t ha−1 FM treatment (T5) produced approximately 33% greater yield. Similarly, lint yield under T5 was approximately 45–50% greater than that of the control across the two growing seasons. The reduced chemical fertilizer treatments combined with FM (T7 and T8) also maintained relatively high seed cotton yields and were statistically superior to the untreated control. However, although these treatments received 25% less mineral fertilizer than RDF, the addition of FM increased their total nutrient inputs. For example, T7 supplied 224.5 kg total N ha−1 compared with 150 kg N ha−1 under RDF alone. It should also be noted that total manure N does not represent immediately plant-available N. Eghball [30] reported that approximately 11% of organic N from field-applied composted cattle manure was mineralized during the succeeding growing season. Therefore, the relatively high yield observed under the RDFR + FM treatments may be attributed to the combined contribution of RDFR and nutrients supplied by FM.
Recent evidence also supports the potential of integrating organic nutrient sources with mineral fertilization. Jiang et al. [31] reported improved N dynamics and N uptake in cotton under partial substitution of mineral fertilizer with an organic liquid fertilizer. Similarly, Wang et al. [32] reported that replacing chemical fertilizer topdressing with biogas slurry under an Equal-N substitution framework improved crop growth, N uptake, water and N use efficiencies, and yield. Although the organic fertilizer sources and experimental conditions differed from those of the present study, these findings support the broader potential of integrated organic and mineral nutrient management in cotton production.
3.2. Quality Parameters
The effects of the treatments on fiber quality parameters are presented in Table 5. Analysis of variance indicated that fiber fineness (micronaire), fiber strength, and fiber yellowness (+b) were significantly affected by the treatments in at least one growing season, whereas fiber brightness (Rd), spinning consistency index (SCI), and fiber length were not significantly affected.
Table 5.
Effects of the treatments on fiber quality parameters.
Fiber fineness ranged from 4.04 to 4.60 in 2022 and from 3.50 to 4.26 in 2023. In 2022, T4 and T8 had the numerically highest micronaire values and belonged to the highest statistical group (a); however, they were statistically similar to T2, T3, and T5, which shared the letter “a” in their significance groupings. T7 had the numerically lowest micronaire value (4.04) but was statistically similar to several other treatments. In 2023, T1 had the numerically highest micronaire value (4.26), whereas T3 had the lowest value (3.50). According to the significance groupings, however, T1 did not differ significantly from T0 and T4, while T3 was statistically similar to T5, T6, T7, and T8. Despite these statistical differences, the observed variation in micronaire values was relatively limited and did not indicate a consistent response to the fertilizer treatments across the two growing seasons.
Fiber strength was significantly affected by the treatments in 2022, ranging from 33.6 to 38.8 g tex−1. T7 had the numerically highest fiber strength (38.8 g tex−1) and belonged to the highest statistical group (a); however, it did not differ significantly from T5 and T6, which shared the letter “a” in their significance groupings. T3 had the numerically lowest fiber strength (33.6 g tex−1) and was statistically similar to T0, T1, and T2. In contrast, fiber strength was not significantly affected by the treatments in 2023.
Fiber yellowness (+b) was also affected by the treatments in 2022. The control (T0) was included in the highest statistical group, whereas T2, T3, and T4 were included in the lowest statistical group. In contrast, no significant treatment effect was observed for fiber yellowness in 2023. Fiber brightness (Rd), SCI, and fiber length did not differ significantly among treatments; therefore, the numerical variation observed for these parameters was not considered evidence of a treatment effect.
Overall, the results indicate that the effects of nutrient management on fiber quality were less consistent than those observed for yield parameters. Significant treatment effects on micronaire, fiber strength, and yellowness occurred only in particular years, whereas brightness, SCI, and fiber length remained statistically unaffected. This suggests that fiber quality characteristics were relatively stable under the fertilization treatments evaluated in this study and that year-specific environmental conditions and cultivar characteristics may have contributed to the observed variation. Similar responses have been reported by Wang et al. [33], who found that integrated nutrient management had a greater effect on cotton yield than on fiber properties. Zhao et al. [34] similarly reported improvements in soil fertility and yield following organic fertilizer application, whereas responses of some fiber quality characteristics were limited. Environmental factors such as moisture and temperature, together with genotype, may also have a greater influence on fiber quality than nutrient management alone [35,36].
The fiber quality values observed in the present study were generally comparable with those reported previously, although some differences were evident among studies. Micronaire values were similar to those reported by Yener [37] and Bozkurt [38], but lower than those reported by Akyol [35] and Cevheri [36], potentially reflecting differences in cultivar and growing conditions. Fiber strength values were also generally comparable with those reported by Akyol [35], Yener [37], and Cevheri [36]. However, because fiber strength was not significantly affected by treatment in 2023, the numerical variation observed in that year should not be attributed directly to fertilization. Fiber yellowness values were lower than those reported by Karademir et al. [39], Cevheri [36], and Bozkurt [38], whereas fiber brightness values were slightly lower and SCI values were generally higher than those reported in previous studies. These differences may be associated with cultivar-specific responses and environmental conditions.
3.3. Leaf Nutrient Concentrations
Leaf N, P, K, Fe, and Zn concentrations were significantly affected by the treatments in both growing seasons (p < 0.05), whereas Mg, Mn, and Cu concentrations were not significantly affected. Leaf Ca concentration was not significantly affected by the treatments in 2022 but differed significantly among treatments in 2023 (Table 6).
Table 6.
Effects of the treatments on leaf nutrient concentrations.
In 2022, leaf N concentration ranged from 2.60% to 3.67%. T6 had the numerically highest N concentration (3.67%) and belonged to the highest statistical group (a); however, it did not differ significantly from T2, T3, T4, and T5, which shared the letter “a” in their significance groupings. The control (T0) had the lowest N concentration (2.60%) and was statistically lower than all fertilized treatments. Leaf P concentration ranged from 0.23% to 0.40%. T5 had the numerically highest P concentration (0.40%) and did not differ significantly from T6 (0.38%), as both treatments shared the letter “a”. Leaf K concentration ranged from 2.19% to 2.69%. T8 had the highest K concentration (2.69%) and was statistically higher than the other treatments.
Among the micronutrients, leaf Fe and Zn concentrations were significantly affected by the treatments in 2022. Leaf Fe ranged from 51 to 61 mg kg−1. T5 had the numerically highest Fe concentration (61 mg kg−1) but did not differ significantly from T3 and T6, which shared the letter “a” in their significance groupings. Leaf Zn ranged from 25 to 34 mg kg−1. T6 had the numerically highest Zn concentration (34 mg kg−1) but did not differ significantly from T5, which shared the letter “a”. In contrast, leaf Ca, Mg, Mn, and Cu concentrations were not significantly affected by the treatments in 2022.
In 2023, leaf N, P, K, Ca, Fe, and Zn concentrations were significantly affected by the treatments, whereas Mg, Mn, and Cu were not significantly affected. Leaf N, P, and K concentrations ranged from 2.85 to 3.69%, 0.26 to 0.40%, and 2.24 to 2.72%, respectively. T6 had the numerically highest N concentration (3.69%) and did not differ significantly from T1, T4, T5, and T8. T5 had the numerically highest P concentration (0.40%) and did not differ significantly from T6 and T7. For K, T5 had the numerically highest concentration (2.72%) and did not differ significantly from T6.
Leaf Ca concentration ranged from 2.30% to 3.48% in 2023. T3 had the highest Ca concentration (3.48%) and was statistically higher than the other treatments. Leaf Fe and Zn concentrations ranged from 51 to 67 mg kg−1 and from 25 to 34 mg kg−1, respectively. T5 had the highest Fe concentration (67 mg kg−1) and was statistically higher than the other treatments. T7 had the numerically highest Zn concentration (34 mg kg−1) but did not differ significantly from T8. Mg, Mn, and Cu concentrations were not significantly affected by the treatments in 2023.
When evaluated in relation to established sufficiency ranges, leaf N, P, and K concentrations were generally within adequate levels [40,41]. The combined FM and chemical fertilizer treatments generally maintained higher nutrient concentrations than the untreated control, particularly for N, P, Fe, and Zn. However, the magnitude and statistical significance of these responses varied among nutrients and treatments. Overall, these results indicate that the combined application of FM and chemical fertilizers improved the nutritional status of cotton plants. This response was accompanied by higher post-harvest soil organic matter under the combined treatments, particularly T5 (RDF + 10 t ha−1 FM). The increase in soil organic matter may have contributed to improved nutrient availability and plant nutrient uptake through organic matter decomposition and nutrient mineralization [42,43].
3.4. Post-Harvest Soil Organic Matter Content and Available Nutrient Concentrations
The effects of the treatments on post-harvest soil properties are presented in Table 7. Soil organic matter (OM), K, P, Fe, Zn, and Mn concentrations were significantly affected by the treatments in both growing seasons (p < 0.05), whereas Ca, Mg, and Cu concentrations were not significantly affected by the treatments.
Table 7.
Effects of the treatments on post-harvest soil properties.
In 2022, soil OM content ranged from 2.76% in the control (T0) to 3.31% in T6. T6 had the numerically highest OM content (3.31%) and belonged to the highest statistical group (a); however, it did not differ significantly from T5 (3.22%), which also shared the letter “a”. Available K ranged from 317 to 352 mg kg−1, with T5 showing the numerically highest concentration (352 mg kg−1) and belonging to the highest statistical group. Available P ranged from 25 to 33 mg kg−1. T5 had the numerically highest P concentration (33 mg kg−1) and was statistically similar to T6 and T8, which shared the letter “a” in their significance groupings.
Soil Fe and Zn concentrations were also significantly affected by the treatments in 2022. Fe ranged from 4.07 to 4.30 mg kg−1, with T5 having the numerically highest value (4.30 mg kg−1); however, it was statistically similar to T6, T7, and T8. Soil Zn ranged from 1.69 to 2.98 mg kg−1. T5 had the highest Zn concentration (2.98 mg kg−1) and was statistically higher than all other treatments.
In 2023, soil OM content ranged from 2.41 to 3.35%. T5 had the numerically highest OM content (3.35%) and belonged to the highest statistical group (a); however, it was statistically similar to T6 (3.26%), which shared the letter “a”. Available K ranged from 320 to 364 mg kg−1. T5 had the highest K concentration (364 mg kg−1) and was statistically higher than all other treatments. Available P ranged from 25 to 32 mg kg−1. T8 had the numerically highest P concentration (32 mg kg−1), but it did not differ significantly from T5, T6, or T7.
In 2023, Fe concentrations ranged from 4.07 to 4.35 mg kg−1. T6 had the numerically highest Fe concentration (4.35 mg kg−1) but was statistically similar to T5 and T7. Soil Zn ranged from 1.83 to 2.56 mg kg−1, with T5 having the numerically highest concentration (2.56 mg kg−1); however, it did not differ significantly from T6. Soil Mn was significantly affected by the treatments in both growing seasons, although its response did not show a consistent pattern across treatments or years. In contrast, Ca, Mg, and Cu concentrations were not significantly affected by the treatments in either growing season.
Overall, the combined application of FM and chemical fertilizers generally resulted in higher post-harvest soil OM and available nutrient concentrations, particularly for K, P, Fe, and Zn, compared to the untreated control. However, the magnitude and statistical significance of these responses varied among treatments and between growing seasons. The increase in soil OM under the combined treatments may have contributed to improved nutrient retention and availability [42,44]. Mineralization of organic matter from FM may gradually release nutrients into the soil, while decomposition products and microbial processes may further influence nutrient availability [45]. These mechanisms may explain the generally greater availability of several nutrients under the combined FM and chemical fertilizer treatments. However, the absence of significant treatment effects on Ca, Mg, and Cu, together with the inconsistent response of Mn, suggests that these nutrients were less responsive to the short-term fertilization treatments [46].
Comparable responses to integrated organic and mineral fertilization have also been reported in other crops. In barley, Sungur [47] evaluated decreasing rates of chemical fertilizer combined with increasing rates of vermicompost and reported favorable responses in yield and quality parameters, particularly with the combined application of 50% chemical fertilizer and 50% vermicompost. In soybean, Demirtok [48] reported that organic amendments, including farmyard manure and vermicompost, influenced nodulation and increased rhizobial nitrogen fixation and rhizosphere microbial activity. These findings from different crop species support the potential of integrated organic and mineral nutrient management to reduce chemical fertilizer inputs while maintaining or improving crop performance. The present results in cotton are consistent with this general response, although the magnitude of the effects may vary depending on crop species, organic amendment type, application rate, and growing conditions.
When soil, leaf, and yield responses were considered together, a consistent pattern was observed for the combined fertilizer treatments. Treatments receiving farmyard manure together with chemical fertilizer generally maintained higher post-harvest soil organic matter and nutrient availability than the untreated control, while also supporting higher leaf N, P, Fe, and Zn concentrations. These improvements in soil fertility and plant nutrient status were accompanied by greater seed cotton and lint yields, particularly under T5 (RDF + 10 t ha−1 FM), which produced the greatest seed cotton yield in both growing seasons. The greater effectiveness of the combined FM and RDF treatment compared to FM or RDF alone may be attributed to the complementary nutrient-supply patterns of the two fertilizer sources. RDF provides readily available nutrients to meet immediate crop demand, whereas FM contributes organic matter and may gradually release nutrients through decomposition and mineralization while improving nutrient retention and availability in the soil. Thus, their combined application may provide both immediate nutrient availability and a more sustained nutrient supply during crop growth. However, because direct relationships among soil nutrient availability, leaf nutrient concentrations, and yield were not tested by correlation or regression analysis, these associations should be interpreted as plausible mechanisms rather than evidence of causality.
A limitation of this study is that baseline soil total and organic N were not determined, and the exact composting duration of the externally sourced farmyard manure was unavailable. In addition, the manure had a C/N ratio of 28.6. Consequently, initial soil N supply and the short-term availability of N from the farmyard manure could not be directly quantified, and the N-related treatment responses should be interpreted with these limitations in mind.
4. Conclusions
The results of this two-year study demonstrated that the combined application of farmyard manure (FM) and chemical fertilizers significantly improved cotton productivity and nutrient status. The best overall yield performance was obtained with the full recommended fertilizer dose combined with 10 t ha−1 FM (RDF + FM), which increased seed cotton yield by approximately 33% compared to the control. Reducing the chemical fertilizer dose by 25% resulted in some yield reduction compared to the full-dose treatment. However, the RDFR + FM (10 t ha−1) treatment still increased seed cotton yield by approximately 23.4% compared with the control. This finding indicates that FM can partially compensate for reduced mineral fertilizer inputs. Integrated fertilization also improved plant nutrition and post-harvest soil fertility. The RDF + FM treatment increased leaf N, P, Fe, and Zn concentrations compared with the control. Soil organic matter increased from 2.76 to 3.22% in 2022 and from 2.65 to 3.35% in 2023. These results indicate that combining FM with mineral fertilizer can improve both plant nutrient status and soil organic matter. Although some fiber quality parameters were significantly affected by the treatments, their values generally remained within acceptable classification ranges. Overall, the fertilization treatments caused only limited variation in fiber quality, indicating that the combined application of FM and chemical fertilizer improved cotton productivity without compromising the main fiber quality characteristics. Under the conditions of this study, the full recommended fertilizer dose combined with 10 t ha−1 FM provided the best overall performance; however, combining 10 t ha−1 FM with a 25% reduced chemical fertilizer dose maintained satisfactory cotton productivity while lowering mineral fertilizer input. Therefore, this integrated fertilization strategy offers a practical option for reducing chemical fertilizer use while supporting soil fertility and sustainable cotton production.
Author Contributions
Conceptualization, İ.E.; formal analysis, Ç.İ.; investigation, Ç.İ.; writing—original draft preparation, Ç.İ.; writing—review and editing, İ.E.; supervision, İ.E.; project administration, Ç.İ.; funding acquisition, Ç.İ. All authors have read and agreed to the published version of the manuscript.
Funding
This research was funded by the General Directorate of Agricultural Research and Policies (TAGEM), Republic of Türkiye Ministry of Agriculture and Forestry, grant number TAGEM/TSKAD/A/21/A9/P1/2399.
Data Availability Statement
The data presented in this study are available upon request from the corresponding author.
Conflicts of Interest
The authors declare no conflicts of interest.
References
- International Cotton Advisory Committee (ICAC). Production of Cotton Lint (‘000 Metric Tonnes). 2023. Available online: https://icac.org/dataportal/dataportal (accessed on 5 June 2026).
- Turkish Statistical Institute (TURKSTAT). Crop Production Statistics, 2022; Turkish Statistical Institute: Ankara, Türkiye, 2022. Available online: https://veriportali.tuik.gov.tr/en/press/45504 (accessed on 30 June 2026).
- Ulusal Pamuk Konseyi. Pamuk Sektör Raporu 2018 [Cotton Sector Report 2018]. 2019. Available online: http://www.upk.org.tr/user_files/editor/file/pamuksektorraporu.pdf (accessed on 30 June 2026).
- Krasilnikov, P.; Taboada, M.A.; Amanullah. Fertilizer use, soil health and agricultural sustainability. Agriculture 2022, 12, 462. [Google Scholar] [CrossRef] [Scilit]
- Akhtar, K.; Wang, W.; Khan, A.; Ren, G.; Zaheer, S.; Sial, T.A.; Feng, Y.; Yang, G. Straw mulching with fertilizer nitrogen: An approach for improving crop yield, soil nutrients and enzyme activities. Soil Use Manag. 2019, 35, 526–535. [Google Scholar] [CrossRef] [Scilit]
- Kononova, M.M. Soil Organic Matter: Its Nature, Its Role in Soil Formation and in Soil Fertility; Elsevier: Amsterdam, The Netherlands, 2013. [Google Scholar] [CrossRef] [Scilit]
- Havlin, J.; Heiniger, R. Soil fertility management for better crop production. Agronomy 2020, 10, 1349. [Google Scholar] [CrossRef] [Scilit]
- Wu, L.P.; Ma, H.; Zhao, Q.L.; Zhang, S.R.; Wei, W.L.; Ding, X.D. Changes in soil bacterial community and enzyme activity under five years of straw returning in paddy soil. Eur. J. Soil Biol. 2020, 100, 103215. [Google Scholar] [CrossRef] [Scilit]
- Erdal, İ.; Ekinci, K.; Kumbul, B.S.; Madenli, E.C. Effect of dairy manure derived bokashi prepared from different organic materials on lettuce growth and mineral nutrition. J. Soil Sci. Plant Nutr. 2025, 25, 2923–2936. [Google Scholar] [CrossRef] [Scilit]
- Lal, R. Soil organic matter and water retention. Agron. J. 2020, 112, 3265–3277. [Google Scholar] [CrossRef] [Scilit]
- Diacono, M.; Montemurro, F. Long-term effects of organic amendments on soil fertility: A review. Agron. Sustain. Dev. 2010, 30, 401–422. [Google Scholar] [CrossRef] [Scilit]
- Agegnehu, G.; Nelson, P.N.; Bird, M.I. The effects of biochar, compost and their mixture on soil properties and crop productivity: A review. Appl. Soil Ecol. 2017, 119, 156–170. [Google Scholar] [CrossRef] [Scilit]
- Zhang, X.; Davidson, E.A.; Mauzerall, D.L.; Searchinger, T.D.; Dumas, P.; Shen, Y. Managing nitrogen for sustainable development. Nature 2015, 528, 51–59. [Google Scholar] [CrossRef] [Scilit]
- Kuzu, H.; Bilgili, M.E.; Aybek, A. Doğu Akdeniz Bölgesinde Pamuk Bitkisinin Üretiminden Kaynaklı Karbondioksit Emisyonu. Int. J. East. Mediterr. Agric. Res. 2023, 6, 31–38. [Google Scholar]
- Kuşcu, S.; Çaktü Güler, K. The Effect of Fertilizers Used in Wheat Production on the Carbon Foot Print in Türkiye. Turk. J. Agric.-Food Sci. Technol. 2024, 12, 418–422. [Google Scholar] [CrossRef] [Scilit]
- Altuntepe, V.; Aşkan, E. Türkiye’de gübre üretim tüketim ve ticaretinde mevcut durum analizi. In Sürdürülebilir Kalkınmada Tarımsal Faaliyetlerin Yeri ve Önemi 2; Aslan, Ö.F., Gövez, E., Eds.; Efe Akademi: İstanbul, Türkiye, 2023; pp. 191–206. [Google Scholar]
- Semerci, A.; Ken, E. Production, foreign trade, use, and support policies of chemical fertilizers in Türkiye. In Proceedings of the 7th International Anatolian Agriculture, Food, Environment and Biology Congress (TARGID 2024), Kastamonu, Türkiye, 26–29 September 2024; Turkish Science and Technology Publishing (TURSTEP): Sivas, Türkiye, 2024; pp. 312–320. [Google Scholar]
- Can, M. Foreign trade policies implementation of Türkiye within the scope of food security: An analysis for the COVID-19 pandemic period and afterwards the Russian Federation’s invasion of Ukraine. GIDA 2026, 51, 423–438. [Google Scholar]
- Jagtap, S.; Trollman, H.; Trollman, F.; Garcia-Garcia, G.; Parra-López, C.; Duong, L.; Martindale, W.; Munekata, P.E.S.; Lorenzo, J.M.; Hdaifeh, A.; et al. The Russia-Ukraine conflict: Its implications for the global food supply chains. Foods 2022, 11, 2098. [Google Scholar] [CrossRef] [Scilit]
- Ekinci, K.; Tosun, İ.; Şevik, F.; Bıtrak, N.B.; Sülük, K.; Kumbul, B.S. Effects of initial C/N ratio on maturity and stability of compost produced from two-phase olive mill pomace, poultry and dairy manure and straw. Compost Sci. Util. 2021, 29, 95–106. [Google Scholar] [CrossRef] [Scilit]
- AOAC International. Official Methods of Analysis of AOAC International, 16th ed.; Association of Official Analytical Chemists: Arlington, VA, USA, 1995. [Google Scholar]
- TS EN 15478; Fertilizers—Determination of Total Nitrogen in Urea. Turkish Standards Institution (TSE): Ankara, Türkiye, 2010.
- Kacar, B.; Kütük, C. Fertilizer Analysis; Nobel Academic Publishing: Ankara, Türkiye, 2009. [Google Scholar]
- Worley, S., Jr.; Ramey, H.H., Jr.; Harrell, D.C.; Culp, T.W. Ontogenetic model of cotton yield. Crop Sci. 1976, 16, 30–34. [Google Scholar] [CrossRef] [Scilit]
- Walkley, A.; Black, I.A. An examination of the Degtjareff method for determining soil organic matter. Soil Sci. 1934, 37, 29–38. [Google Scholar] [CrossRef] [Scilit]
- Lindsay, W.L.; Norvell, W.A. Development of a DTPA soil test for zinc, iron, manganese, and copper. Soil Sci. Soc. Am. J. 1978, 42, 421–428. [Google Scholar] [CrossRef] [Scilit]
- Olsen, S.R.; Cole, C.V.; Watanabe, F.S.; Dean, L.A. Estimation of Available Phosphorus in Soils by Extraction with Sodium Bicarbonate; Circular No. 939; U.S. Department of Agriculture: Washington, DC, USA, 1954.
- Pratt, P.F. Potassium. In Methods of Soil Analysis, Part 2: Chemical and Microbiological Properties; Black, C.A., Ed.; Agronomy Monograph No. 9; American Society of Agronomy: Madison, WI, USA, 1965; pp. 1022–1030. [Google Scholar] [CrossRef] [Scilit]
- Jones, J.B., Jr.; Wolf, B.; Mills, H.A. Plant Analysis Handbook: A Practical Sampling, Preparation, Analysis, and Interpretation Guide; Micro-Macro Publishing: Athens, GA, USA, 1991. [Google Scholar]
- Eghball, B. Nitrogen mineralization from field-applied beef cattle feedlot manure or compost. Soil Sci. Soc. Am. J. 2000, 64, 2024–2030. [Google Scholar] [CrossRef] [Scilit]
- Jiang, L.; Zhi, J.; Bai, X.; Wang, L.; Chai, S.; Hayat, M.A.B.; Zhang, S.; Wang, R.; Xue, S. Enhanced nitrogen dynamics and uptake in cotton via organic liquid fertilizer partial substitution. Front. Plant Sci. 2026, 17, 1781486. [Google Scholar] [CrossRef] [Scilit]
- Wang, H.; Liang, X.; Feng, X.; Qiu, X.; Wang, S.; Wang, J.; Chen, B. Biogas slurry topdressing as replacement of chemical fertilizers boosts water and nitrogen use efficiency and yield in semiarid rainfed field crops. Agric. Water Manag. 2025, 318, 109725. [Google Scholar] [CrossRef] [Scilit]
- Wang, N.; Zhan, J.; Feng, K.; Qi, J.; Nan, H. Higher yield sustainability and soil quality by reducing chemical fertilizer with organic fertilizer application under a single-cotton cropping system. Front. Plant Sci. 2024, 15, 1494667. [Google Scholar] [CrossRef] [Scilit]
- Zhao, Y.; Bian, Q.; Dong, Z.; Rao, X.; Wang, Z.; Fu, Y.; Chen, B. The input of organic fertilizer can improve soil physicochemical properties and increase cotton yield in southern Xinjiang. Front. Plant Sci. 2025, 15, 1520272. [Google Scholar] [CrossRef] [Scilit]
- Akyol, N. Evaluation of the Use of Liquid Animal Manure as a Top Fertilizer in Cotton and Determination of Optimum Dose. Master’s Thesis, Adnan Menderes University, Graduate School of Natural and Applied Sciences, Aydın, Türkiye, 2013. [Google Scholar]
- Cevheri, C. Effects of Organic and Microbial Fertilizer Applications on Agronomic and Fiber Quality Characteristics of Some Cotton Varieties under Organic Production Conditions in the Harran Plain. Ph.D. Thesis, Harran University, Graduate School of Natural and Applied Sciences, Şanlıurfa, Türkiye, 2016. [Google Scholar]
- Yener, T. Effects of Foliar Fertilizers on Yield, Yield Components, and Fiber Quality in Second-Crop Cotton Cultivation. Master’s Thesis, Adnan Menderes University, Graduate School of Natural and Applied Sciences, Aydın, Türkiye, 2015. [Google Scholar]
- Bozkurt, Ş. Effects of Different Fertilizer Forms on Yield, Yield Components and Fiber Technological Properties of Cotton under Kahramanmaraş Conditions. Master’s Thesis, Kahramanmaraş Sütçü İmam University, Graduate School of Natural and Applied Sciences, Kahramanmaraş, Türkiye, 2021. [Google Scholar]
- Karademir, E.; Karademir, Ç.; Ekinci, R.; Sevilmiş, U. Determination of yield and fiber quality traits in advanced cotton lines. Turk. J. Agric. Res. 2015, 2, 100–107. [Google Scholar]
- Mills, H.A.; Jones, J.B. Plant Analysis Handbook II: A Practical Sampling, Preparation, Analysis, and Interpretation Guide; Micro-Macro Publishing: Athens, GA, USA, 1996. [Google Scholar]
- Reuter, D.J.; Robinson, J.B. Plant Analysis: An Interpretation Manual, 2nd ed.; CSIRO Publishing: Collingwood, Australia, 1997. [Google Scholar]
- Dhaliwal, S.S.; Naresh, R.K.; Mandal, A.; Walia, M.K.; Gupta, R.K.; Singh, R.; Dhaliwal, M.K. Effect of manures and fertilizers on soil physical properties, build-up of macro- and micronutrients and uptake in soil under different cropping systems: A review. J. Plant Nutr. 2019, 42, 2873–2900. [Google Scholar] [CrossRef] [Scilit]
- Khan, N.; Raza, T.; Eash, N.S.; Mechri, M.; Asghar, W. Effect of combined FYM and P fertilizer application on soil health and crop performance. Commun. Soil Sci. Plant Anal. 2024, 55, 579–595. [Google Scholar] [CrossRef] [Scilit]
- Paramesh, V.; Mohan Kumar, R.; Rajanna, G.A.; Gowda, S.; Nath, A.J.; Madival, Y.; Jinger, D.; Bhat, S.; Toraskar, S. Integrated nutrient management for improving crop yields, soil properties, and reducing greenhouse gas emissions. Front. Sustain. Food Syst. 2023, 7, 1173258. [Google Scholar] [CrossRef] [Scilit]
- Al-Suhaibani, N.; Selim, M.; Alderfasi, A.; El-Hendawy, S. Comparative performance of integrated nutrient management between composted agricultural wastes, chemical fertilizers, and biofertilizers in improving soil quantitative and qualitative properties and crop yields under arid conditions. Agronomy 2020, 10, 1503. [Google Scholar] [CrossRef] [Scilit]
- Mejri, R.; Erdal, I. Contribution of different bio-solids on the growth, npk nutrition and npk use efficiency of corn under different npk dosages. Agric. For./Poljopr. Šumar. 2026, 72, 137. [Google Scholar] [CrossRef] [Scilit]
- Sungur, N.C. Investigation of the Effects of Different Rates of Vermicompost Applications on Yield and Quality Parameters in Barley. Master’s Thesis, Ankara University, Graduate School of Natural and Applied Sciences, Ankara, Türkiye, 2024. [Google Scholar]
- Demirtok, H. Effects of Vermicompost, Farmyard Manure, and Nitrogen Fertilizer Applications on N2 Fixation and Soil Microbial Activities in Different Soybean Genotypes. Master’s Thesis, Hatay Mustafa Kemal University, Graduate School of Natural and Applied Sciences, Hatay, Türkiye, 2022. [Google Scholar]

Disclaimer/Publisher’s Note: The statements, opinions and data contained in all publications are solely those of the individual author(s) and contributor(s) and not of MDPI and/or the editor(s). MDPI and/or the editor(s) disclaim responsibility for any injury to people or property resulting from any ideas, methods, instructions or products referred to in the content. |
© 2026 by the authors. Licensee MDPI, Basel, Switzerland. This article is an open access article distributed under the terms and conditions of the Creative Commons Attribution (CC BY) license.