


Abstract
The Gulong shale oil reservoir is characterized by high clay content and strong heterogeneity, with substantial variations in mineral composition among different intervals. However, existing fracability evaluation methods for such continental shales remain inconsistent and often rely on oversimplified two-dimensional fracture descriptors, lacking a multi-parameter quantitative framework derived from three-dimensional fracture characterization. In this study, the Q1 and Q9 members of the Gulong shale oil were selected, and laboratory-scale hydraulic fracturing simulation experiments were conducted using supercritical carbon dioxide (SC-CO2), liquid CO2, and water as the fracturing media. Within a fractal-theory framework based on CT-derived three-dimensional reconstructions, a multi-scale evaluation index system was established by integrating fractal dimension, fracture density, and spatial connectivity. The experimental results demonstrate that fluid properties exert a decisive influence on rock failure behavior. Owing to its ultra-low viscosity and strong diffusivity, SC-CO2 can significantly reduce formation breakdown pressure while effectively activating natural weak planes to generate a more complex fracture network. For the Q9 shale, the breakdown pressure under SC-CO2 is reduced by 11.91% and 8.33% relative to water and liquid CO2, respectively. Moreover, the fracture fractal dimension reaches 2.41 under SC-CO2, which is markedly higher than the values obtained under liquid CO2 (2.18) and water (2.12). Mineral composition and densely developed bedding are the key factors inducing fracture branching and deflection, whereas injection rate and an asymmetric stress field regulate the internal energy-release rate and stress path, thereby influencing fracture crossing capability and aperture evolution. Based on the experimental dataset, a fracture complexity index (FCI) evaluation model was developed: under SC-CO2 fracturing, the FCI values are 8.92 for the Q9 member and 4.43 for the Q1 member, and the model predictions are in good agreement with physical observations. This work elucidates the failure mechanism of the Gulong shale under multi-field coupling and provides a theoretical basis for optimizing hydraulic fracturing and evaluating fracability in unconventional reservoirs through the proposed FCI-based assessment framework.
1. Introduction
Unconventional hydrocarbon resources—particularly shale gas and shale oil—are playing an increasingly important role in the global transition of the energy mix, and their efficient development is of great significance for ensuring energy security [1]. The Gulong shale oil represents a key breakthrough for increasing reserves and production of continental shale oil in China; its efficient exploitation therefore carries strategic importance for safeguarding national energy security and advancing technological innovation in the oil and gas industry. However, shale reservoirs exemplified by the Gulong shale are inherently characterized by low porosity and ultra-low permeability, which severely constrain their natural productivity. Consequently, artificial stimulation measures such as hydraulic fracturing are indispensable for creating effective seepage pathways [2]. The essence of hydraulic fracturing lies in generating a complex fracture network with high conductivity; yet the pronounced heterogeneity and anisotropy of shale—arising from substantial variations in mineral composition, bedding architecture, natural fractures, and mechanical properties—render fracture propagation exceptionally complex [3]. Therefore, elucidating the mechanisms governing fracture-network generation and the associated morphological evolution under varying geological and engineering conditions constitutes a key scientific issue for optimizing fracturing design and improving development performance.
In recent years, research on shale fracturing mechanisms has achieved substantial advances in terms of technology, characterization, and theoretical modeling. From the perspective of fracturing technologies, supercritical carbon dioxide (SC-CO2) fracturing has attracted extensive attention owing to its distinctive physicochemical properties, including low viscosity, high diffusivity, and near-zero interfacial tension. Studies have shown that, compared with conventional water-based hydraulic fracturing, SC-CO2 can markedly reduce shale breakdown pressure and more readily generate complex fracture networks; the underlying mechanisms involve a combination of physical seepage, chemical dissolution, and organic-matter extraction, among other effects [4,5,6,7]. Liquid CO2 fracturing, by contrast, promotes fracture creation primarily through phase-change-induced volumetric expansion, and its stimulation performance generally lies between that of SC-CO2 and hydraulic fracturing [8]. In the field of fracture characterization, X-ray computed tomography (CT) enables three-dimensional, non-destructive, and quantitative characterization of fracture systems; when combined with real-time monitoring techniques such as acoustic emission (AE), it provides rich datasets for elucidating dynamic fracture propagation [9,10,11]. From a theoretical perspective, multi-physics coupled models and numerical approaches such as the discrete element method (DEM) have been employed to represent the complex interactions during hydraulic fracturing. Birkholzer et al. [8] coupled TOUGH+ and GEOS to simulate SC-CO2 leakoff and pore-pressure redistribution; Yi et al. [12] developed a THMC-coupled model based on COMSOL Multiphysics and PHREEQC to quantify mineral dissolution; and Li Xiaogang et al. [13] advanced a multiscale finite-element framework to achieve cross-scale characterization of fractures, linking microscale damage evolution to macroscale fracture propagation. Nevertheless, most existing models are developed for water-based fracturing fluids, and the coupled mechanisms specific to SC-CO2 and shale—particularly continental shale—remain to be further refined [14,15,16].
With respect to multi-physics coupling mechanisms, SC-CO2 fracturing exhibits more intricate dynamic behavior. Feng et al. [11] reported that SC-CO2 adsorption in shale and the orientation relative to bedding can significantly alter failure behavior, inducing a mixed tensile–shear failure mode. Yi et al. [12] developed a transient wellbore thermal-pressure model for SC-CO2 jet fracturing and verified optimizing injection rate maintains SC-CO2 at the jet point. Through micro-scale experiments, Li et al. [13] demonstrated that slickwater fracturing fluid coupled with microwave heating promotes more developed fractures in coal reservoirs. In addition, Ao et al. [14] revealed SC-CO2 changes shale pores and minerals, induces swelling, and reduces its mechanical strengths. Regarding the physical factors governing fracture propagation, Wu et al. [17] emphasized that the high diffusivity and low viscosity of SC-CO2 under high-temperature and high-pressure conditions facilitate dynamic fracture extension. Zhang et al. [18] developed a phase-state prediction model based on the Peng–Robinson equation of state, providing a theoretical basis for CO2 phase transformation from the wellbore to the formation. Collectively, these studies on micro-scale mechanisms and physical modeling have laid the groundwork for quantitatively evaluating fracture-network evolution under SC-CO2 fracturing. Sun et al. [19], through a systematic review, identified the key mechanisms and controlling factors of SC-CO2 fracturing in shale. Suo et al. [20], through comparative experiments, demonstrated that CO2 causes the least mechanical damage and produces more complex fractures than water-based fluids.
Despite these advances, several limitations remain. First, most studies have focused on a single shale type or a single fracturing fluid, and systematic comparisons of the response of shales with differing mineral compositions and bedding structures under multiple fracturing fluids are still scarce [21,22]. Second, quantitative assessment of fracture complexity often relies on two-dimensional sections or simplified models, and a comprehensive indicator system based on three-dimensional CT data has yet to be fully established [13,23]. Third, many models do not adequately account for the controlling effects of geological discontinuities—such as natural fractures and densely developed bedding—on the propagation paths of induced fractures, which can lead to prediction bias [24,25]. Finally, existing multi-physics coupled models exhibit limited applicability to strongly heterogeneous continental shales with high clay content (e.g., the Gulong shale); model parameters are often treated as static and insufficiently calibrated for specific formations, making it difficult to accurately capture short-term non-equilibrium processes during SC-CO2 fracturing [26,27].
To address the above issues, this study selects two shale members, Q1 and Q9, from the same block, which exhibit pronounced differences in mineral composition, bedding characteristics, and mechanical properties. A multi-fluid pseudo-triaxial experimental system was employed to inject three fracturing fluids—supercritical CO2 (SC-CO2), liquid CO2, and water—and to comparatively analyze fracturing responses under different combinations of member, fluid type, stress state, and injection rate. Based on the experimental results, a three-dimensional quantitative evaluation framework for fracture-network complexity was established by integrating multiple parameters, including fractal dimension, fracture density, aperture distribution, connectivity indices, and spatial orientation. The synergistic control mechanisms of geological factors and engineering parameters on fracture morphology were clarified, providing theoretical and methodological support for precise fracturing design tailored to different shale characteristics.
2. Geological and Mechanical Analysis of the Gulong Shale Q1 and Q9 Members
2.1. Geological Characterization of the Target Shale Intervals
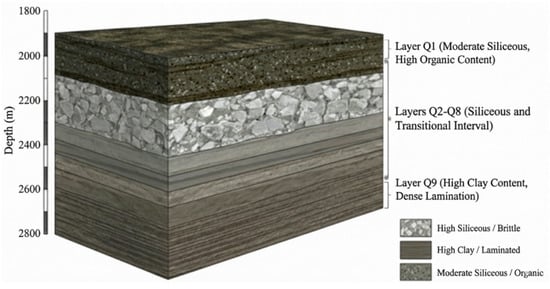
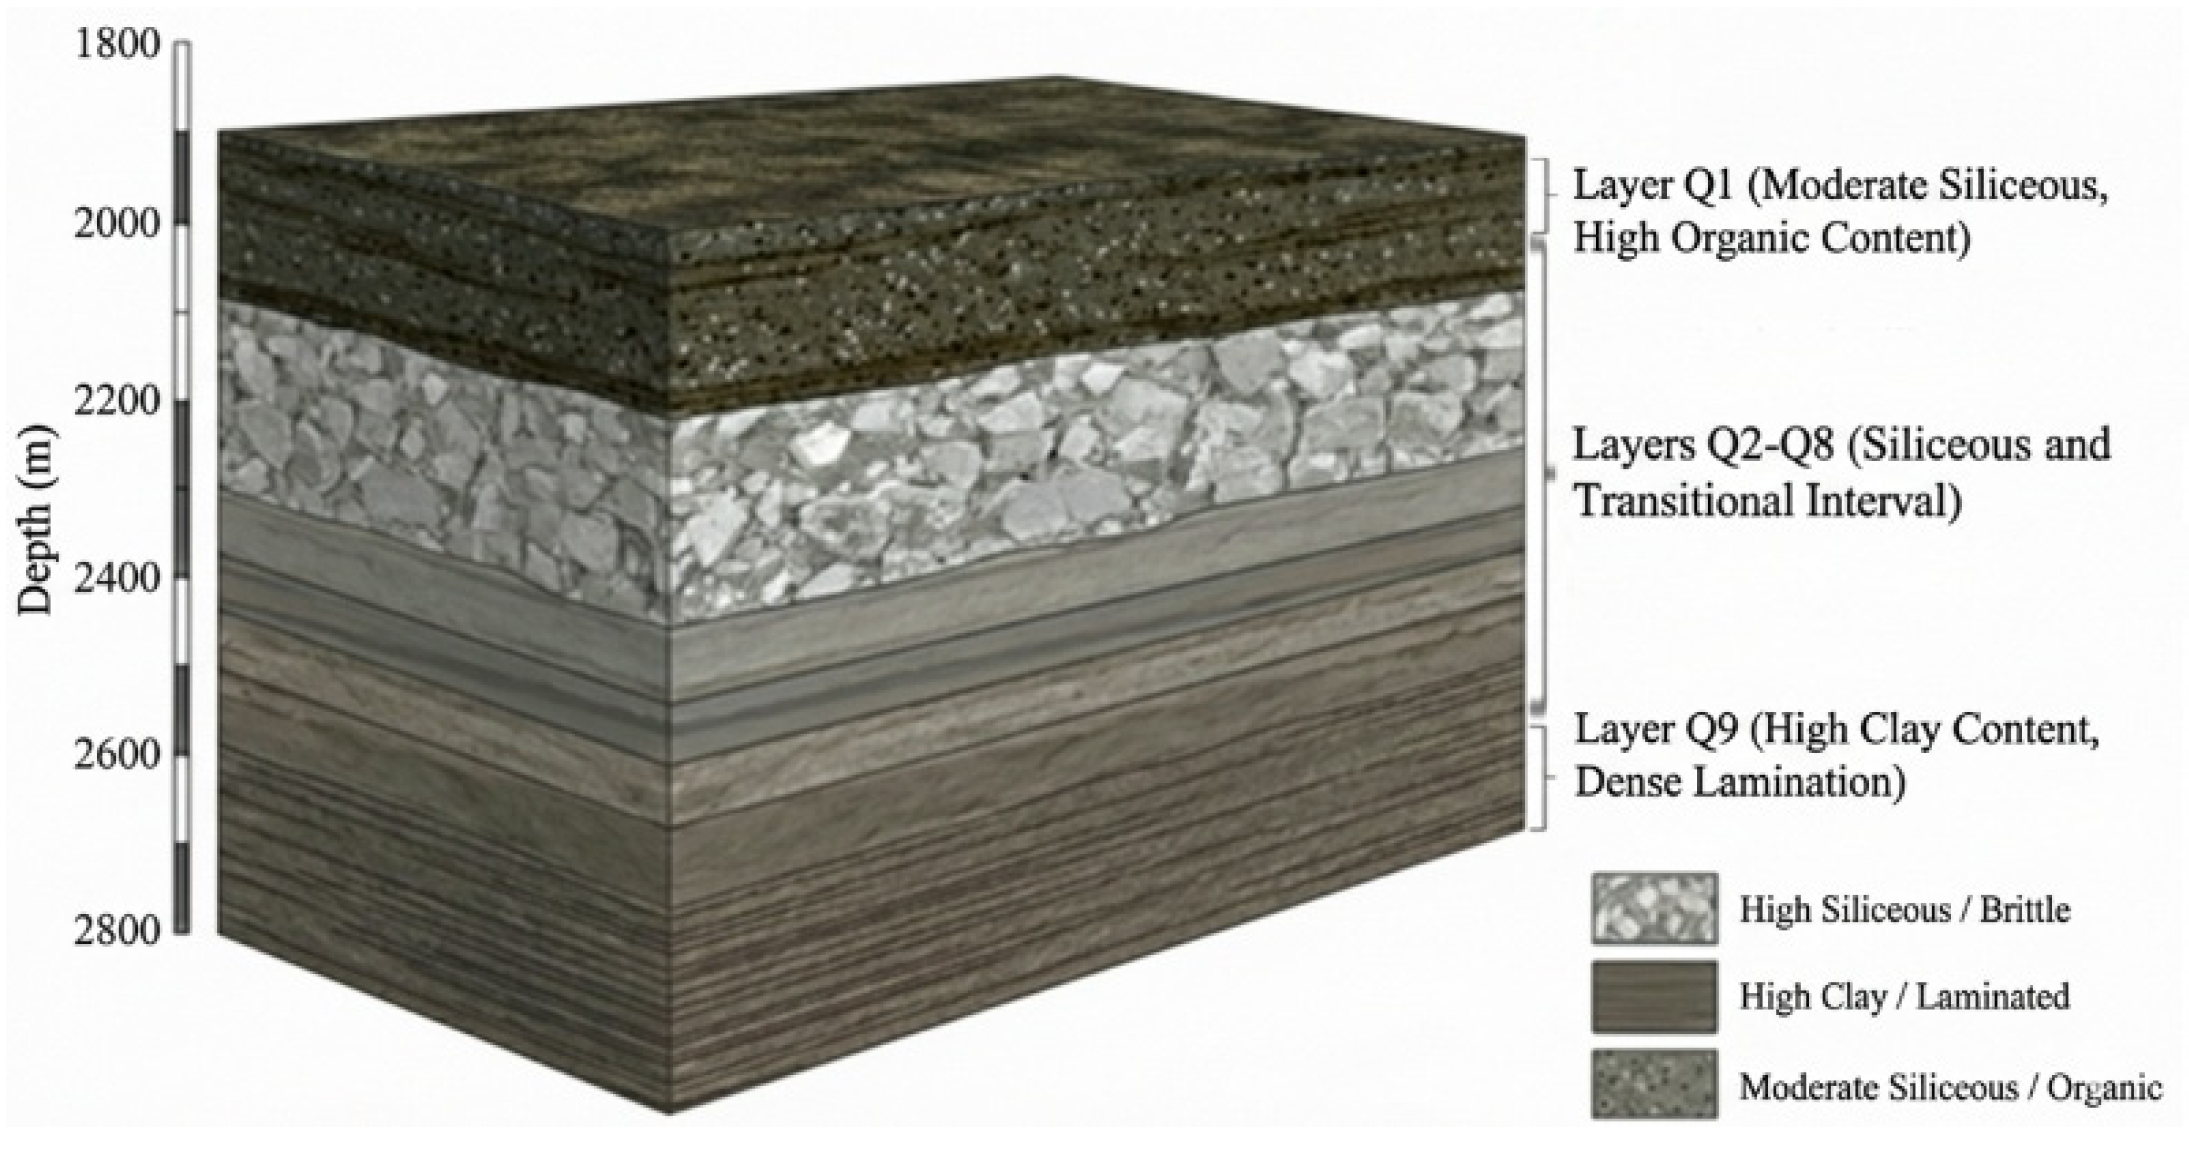
The development potential of unconventional hydrocarbon reservoirs is closely linked to their geological setting. In particular, shales exhibit pronounced variability in depositional environment, diagenetic evolution, mineral composition, and rock-mechanical behavior, all of which directly influence the effectiveness of hydraulic-fracturing stimulation. This section focuses on the Q1 and Q9 members of the Gulong shale oil reservoir (Figure 1) and systematically analyzes their geological characteristics, with an emphasis on inter-member differences, thereby providing a geological basis for subsequent fracturing experiments and fracture characterization.
Figure 1.
Schematic stratigraphic column of the Gulong shale oil intervals.
Both the Q1 and Q9 members were deposited in a deep-water shelf setting; however, they differ in depositional microfacies and paleo-water conditions. The Q1 member was formed in the anoxic, organic-rich central deep-water basin, characterized by high organic matter content (TOC 4–6%) and strong hydrocarbon generation potential. It experienced middle to shallow diagenesis, during which microfractures became relatively well developed. In contrast, the Q9 member belongs to a shallower shelf facies with higher argillaceous content, and its clay minerals are dominated by illite and illite–smectite mixed layers. Having undergone stronger compaction and mineral transformation, Q9 exhibits enhanced plasticity, and its natural fractures are commonly closed or infilled.
Mineral composition exerts a fundamental control on rock mechanical properties and fracturing behavior. XRD results indicate (Table 1) that the Q1 member contains 40–50% clay minerals and 30–40% quartz, with a relatively low brittleness index (~35–45), which is conducive to the development of complex fracture networks during hydraulic fracturing. The Q9 member has the highest clay-mineral content (50–60%) and only 20–30% quartz, yielding a lower brittleness index (30–40); consequently, induced fractures tend to propagate preferentially along bedding planes, and the resulting fracture-network complexity is comparatively lower.
Table 1.
Comparison of mineral composition and brittleness index for different stratigraphic intervals.
In terms of reservoir properties, the Q1 member is characterized by high organic-matter content and well-developed microfractures, yet it still exhibits low permeability; economically viable production therefore requires hydraulic fracturing to generate a complex fracture network. The Q9 member, in contrast, has a high clay content and is dominated by nanopore-scale storage space, resulting in poor flow capacity and greater difficulty in stimulation by hydraulic fracturing.
Bedding architecture also influences fracture propagation. The Q1 member exhibits well-developed bedding and pronounced mechanical contrasts, enabling fractures to propagate preferentially along bedding planes and form a more complex network. Although the Q9 member contains densely spaced bedding, its high clay content and strong interlaminar bonding constrain fracture growth, thereby limiting fracture propagation.
In summary, the Q1 and Q9 members exhibit pronounced differences in depositional setting, mineral composition, mechanical behavior, and reservoir properties, which directly govern their fracturing responses and their capacity to develop fracture networks. In the following sections, multi-fluid hydraulic fracturing experiments combined with CT scanning are employed to quantitatively characterize fracture complexity, thereby providing a basis for fracturing optimization.
2.2. Comparison of Mechanical Characteristics
Rock mechanical properties are key factors governing fracture initiation, propagation, and the development of complex fracture networks during hydraulic fracturing. Owing to differences in mineral composition, diagenetic evolution, and microstructural features, shale intervals can exhibit markedly different mechanical behaviors. In this section, the mechanical characteristics of the Q1 and Q9 shales are systematically compared based on triaxial compression tests, Brazilian splitting tests, and acoustic emission monitoring. Particular attention is paid to parameters such as elastic modulus, compressive strength, brittleness index, and failure characteristics and their implications for fracturing performance, thereby providing a mechanical basis for designing hydraulic-fracturing treatments in different reservoirs.
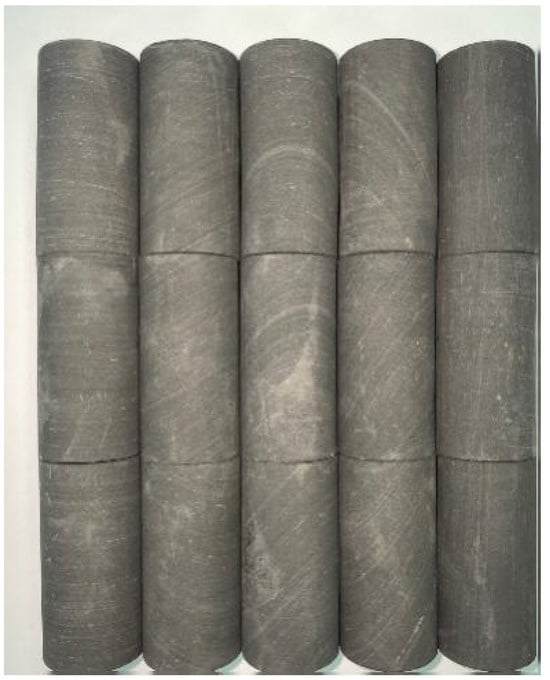
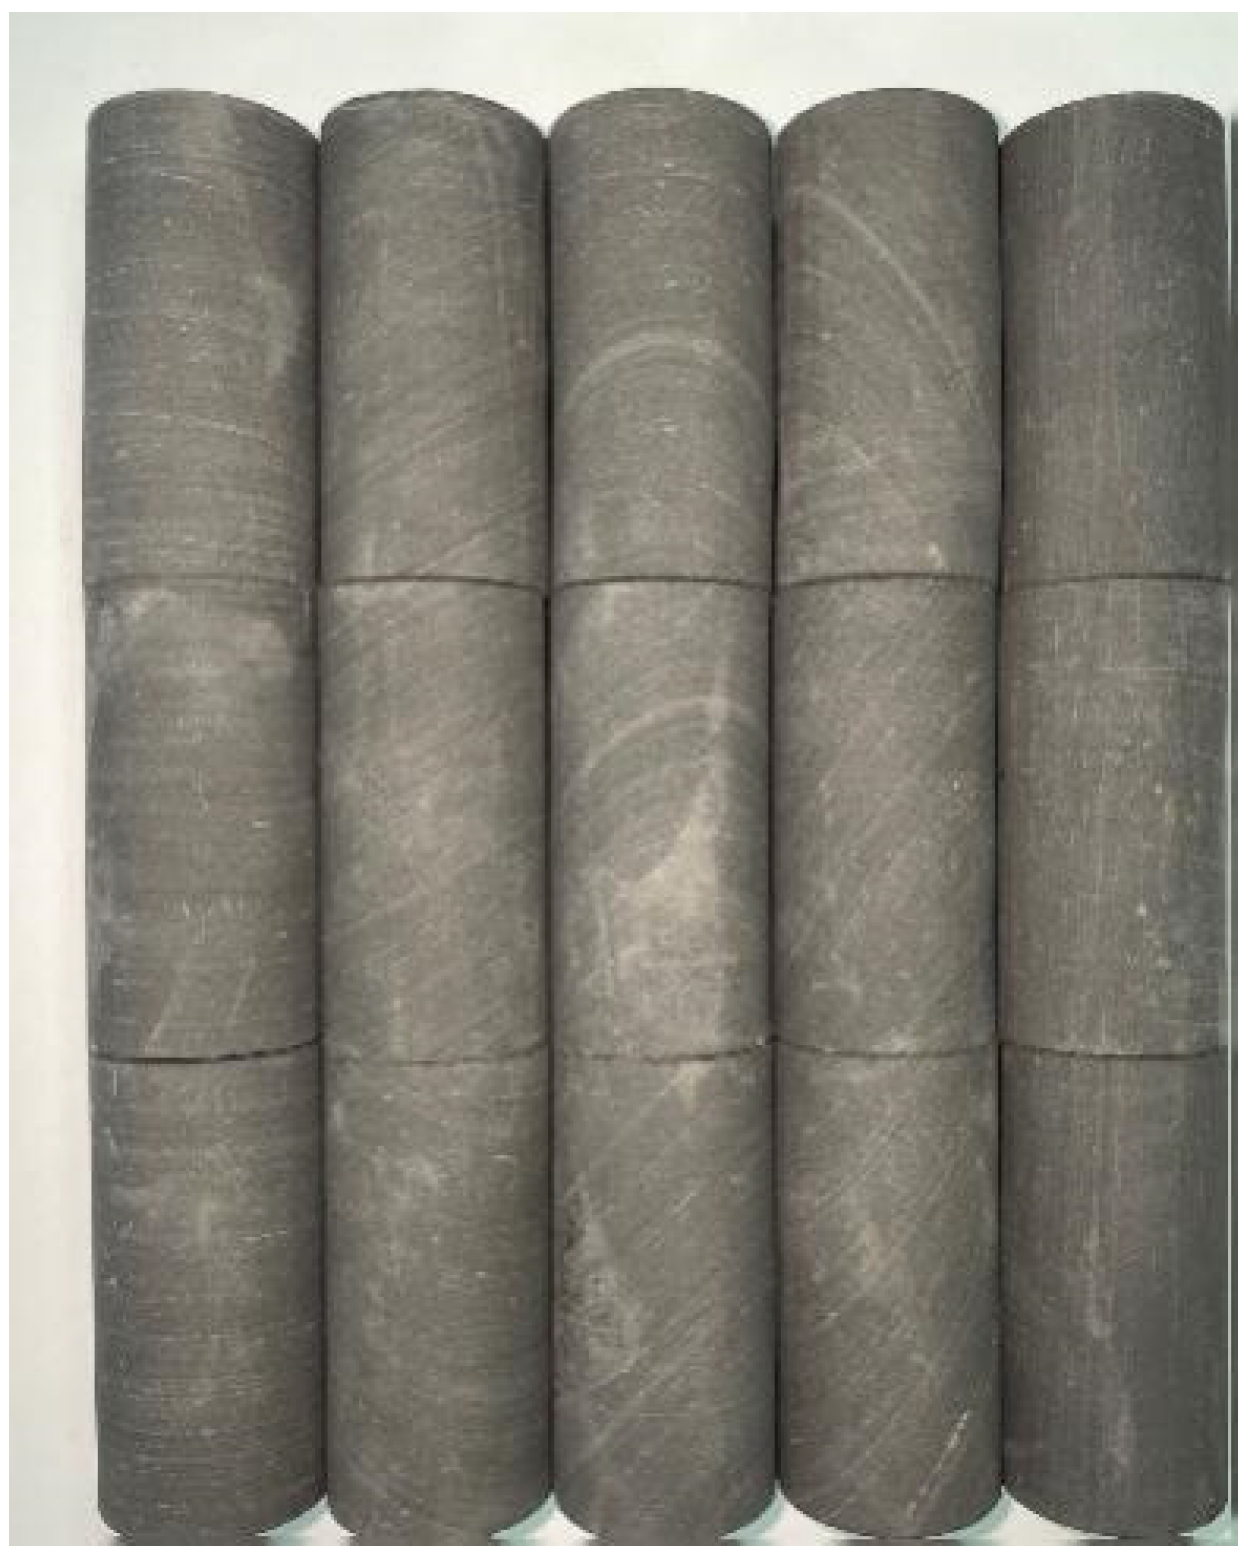
To accurately determine the mechanical parameters of rocks from different intervals, triaxial compression tests were conducted using a TAW-2000 computer-controlled electro-hydraulic servo triaxial testing system. The confining stress was set to 20 MPa to approximate in situ stress conditions. In addition, Brazilian splitting tests were performed to measure tensile strength. Core specimens were taken from the Q1 and Q9 shale members; drilling was oriented perpendicular to bedding planes. All specimens were prepared with dimensions of Φ25 mm × 50 mm (Figure 2). For each core type, five replicate tests were carried out to obtain representative mechanical properties. During testing, acoustic emission (AE) sensors were used to monitor the failure process, and the mechanical behavior was analyzed in conjunction with the stress–strain responses.
Figure 2.
Photograph of Φ25 mm × 50 mm core specimens.
Through systematic experimental investigations, detailed mechanical parameters of the Q1 and Q9 shales were obtained, including elastic modulus (E), Poisson’s ratio (ν), compressive strength (σc), tensile strength (σt), cohesion (C), and internal friction angle (φ) (Table 2). The results indicate that, owing to differences in mineral composition and structural characteristics, the two intervals exhibit markedly different mechanical properties.
Table 2.
Comparison of mechanical parameters for rocks from different stratigraphic intervals.
The Q1 shale exhibits moderate strength with pronounced plasticity. Its elastic modulus ranges from 12.5 to 15.8 GPa, the compressive strength from 85 to 105 MPa, and the tensile strength from 5.2 to 6.8 MPa. The stress–strain response shows a distinct post-peak plastic plateau. This behavior is closely associated with its relatively high clay-mineral content (40–50%). The Q9 shale displays the lowest mechanical strength and the most pronounced plasticity. Its elastic modulus is 10.5–13.2 GPa, compressive strength 75–95 MPa, and tensile strength 4.5–5.8 MPa. The stress–strain curve exhibits no pronounced peak and is characterized by large failure strains. The high clay content (50–60%) governs its plastic flow behavior, resulting in relatively high resistance to fracture initiation and propagation.
3. Multi-Fluid Triaxial Fracturing Experiments on Different Target Intervals and Result Analysis
3.1. Experimental Preparation
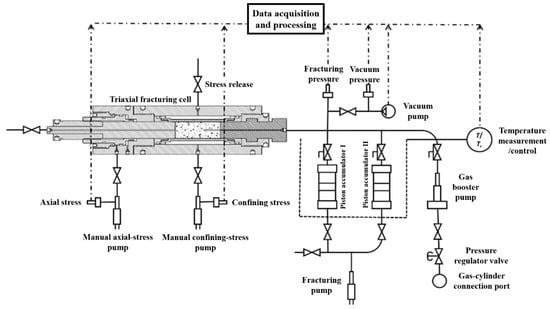
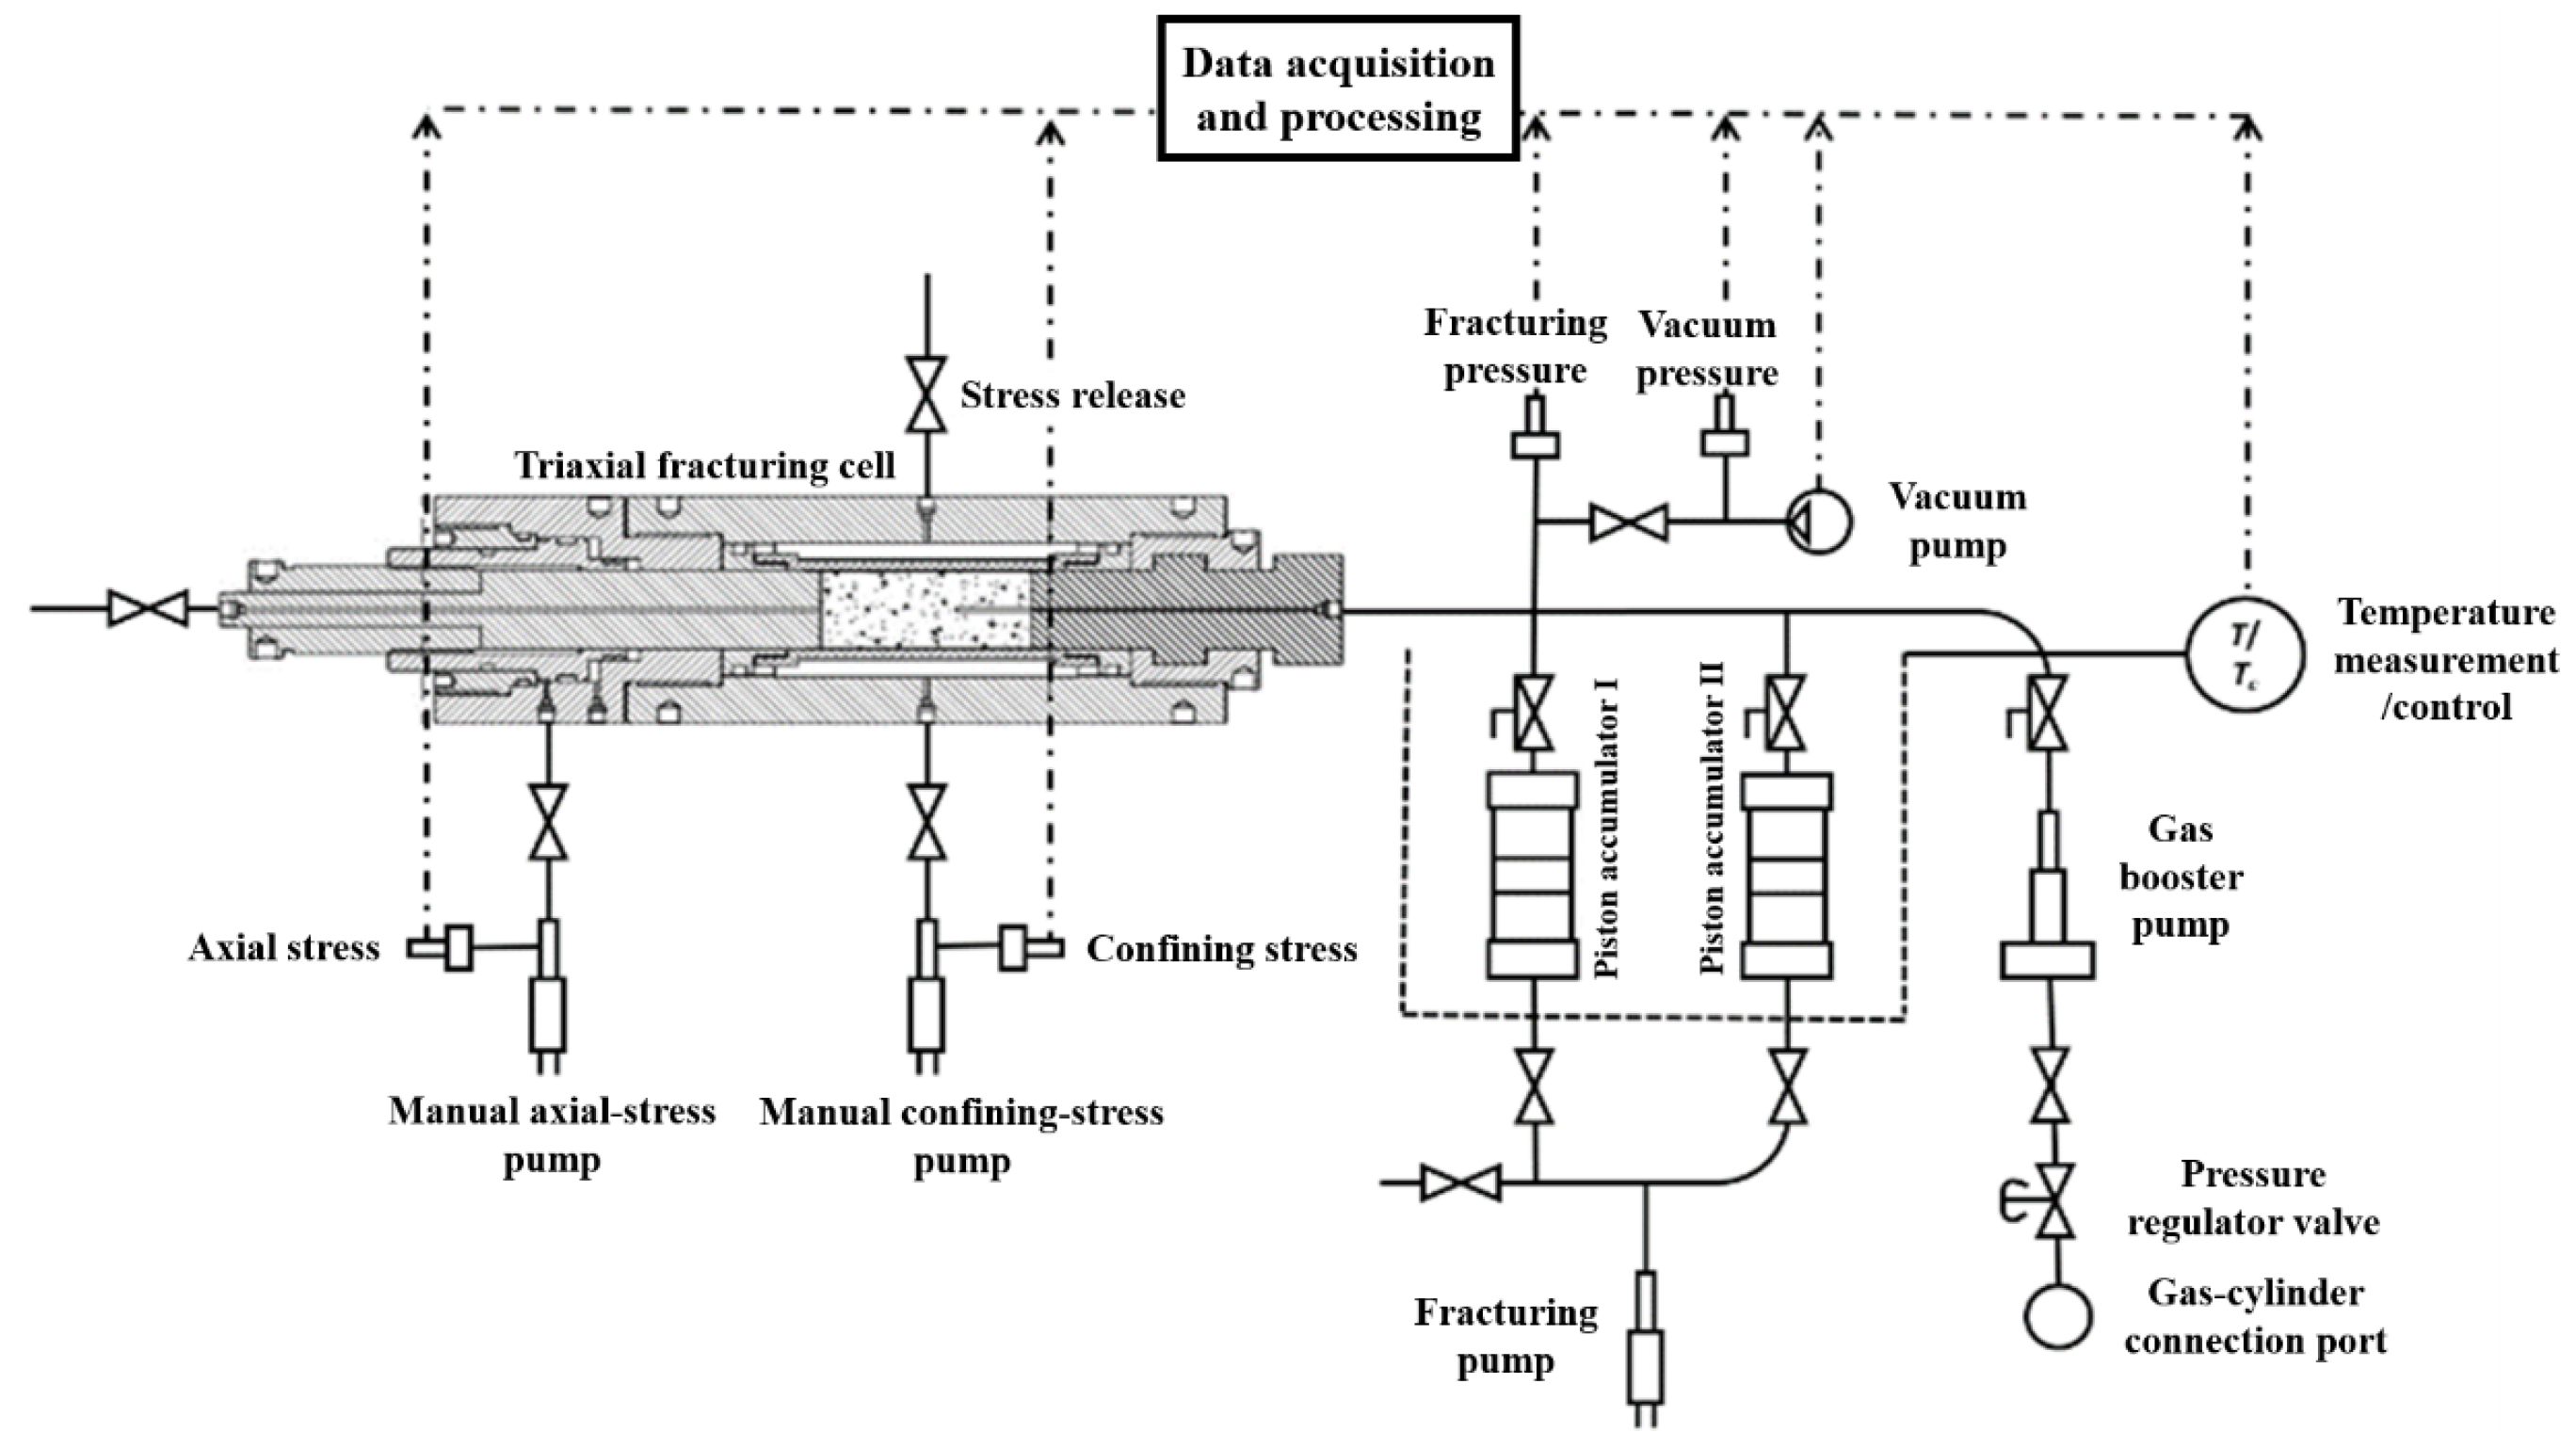
This part of the study employs a multi-fluid triaxial hydraulic fracturing experimental system (Figure 3) to reproduce fracturing responses of different lithologies under representative in situ conditions. The system consists of five main modules: (i) a gas/liquid pressurization and control unit with a maximum pressure of 50 MPa, (ii) a precision heating and thermal insulation unit with a controllable temperature range from ambient to 100 °C, (iii) a triaxial servo-control unit, (iv) a high-speed data acquisition and processing unit, and (v) a dedicated triaxial fracturing cell. The apparatus allows independent regulation of axial and confining stress, enabling asymmetric stress loading (e.g., axial stress > confining stress or axial stress < confining stress). It also integrates a multi-fluid injection capability compatible with various fracturing media, including supercritical carbon dioxide (SC-CO2), liquid CO2, and water. High-precision pressure transducers (±0.1% full scale) and temperature sensors (±0.5 °C) were used to continuously monitor injection pressure, confining stress, axial temperature, and fluid temperature at a sampling frequency of 100 Hz, ensuring that transient variations during fracturing were captured.
Figure 3.
Schematic diagram of the experimental apparatus.
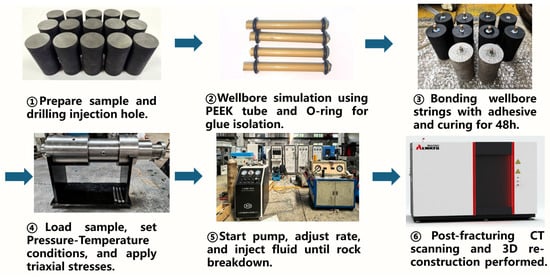
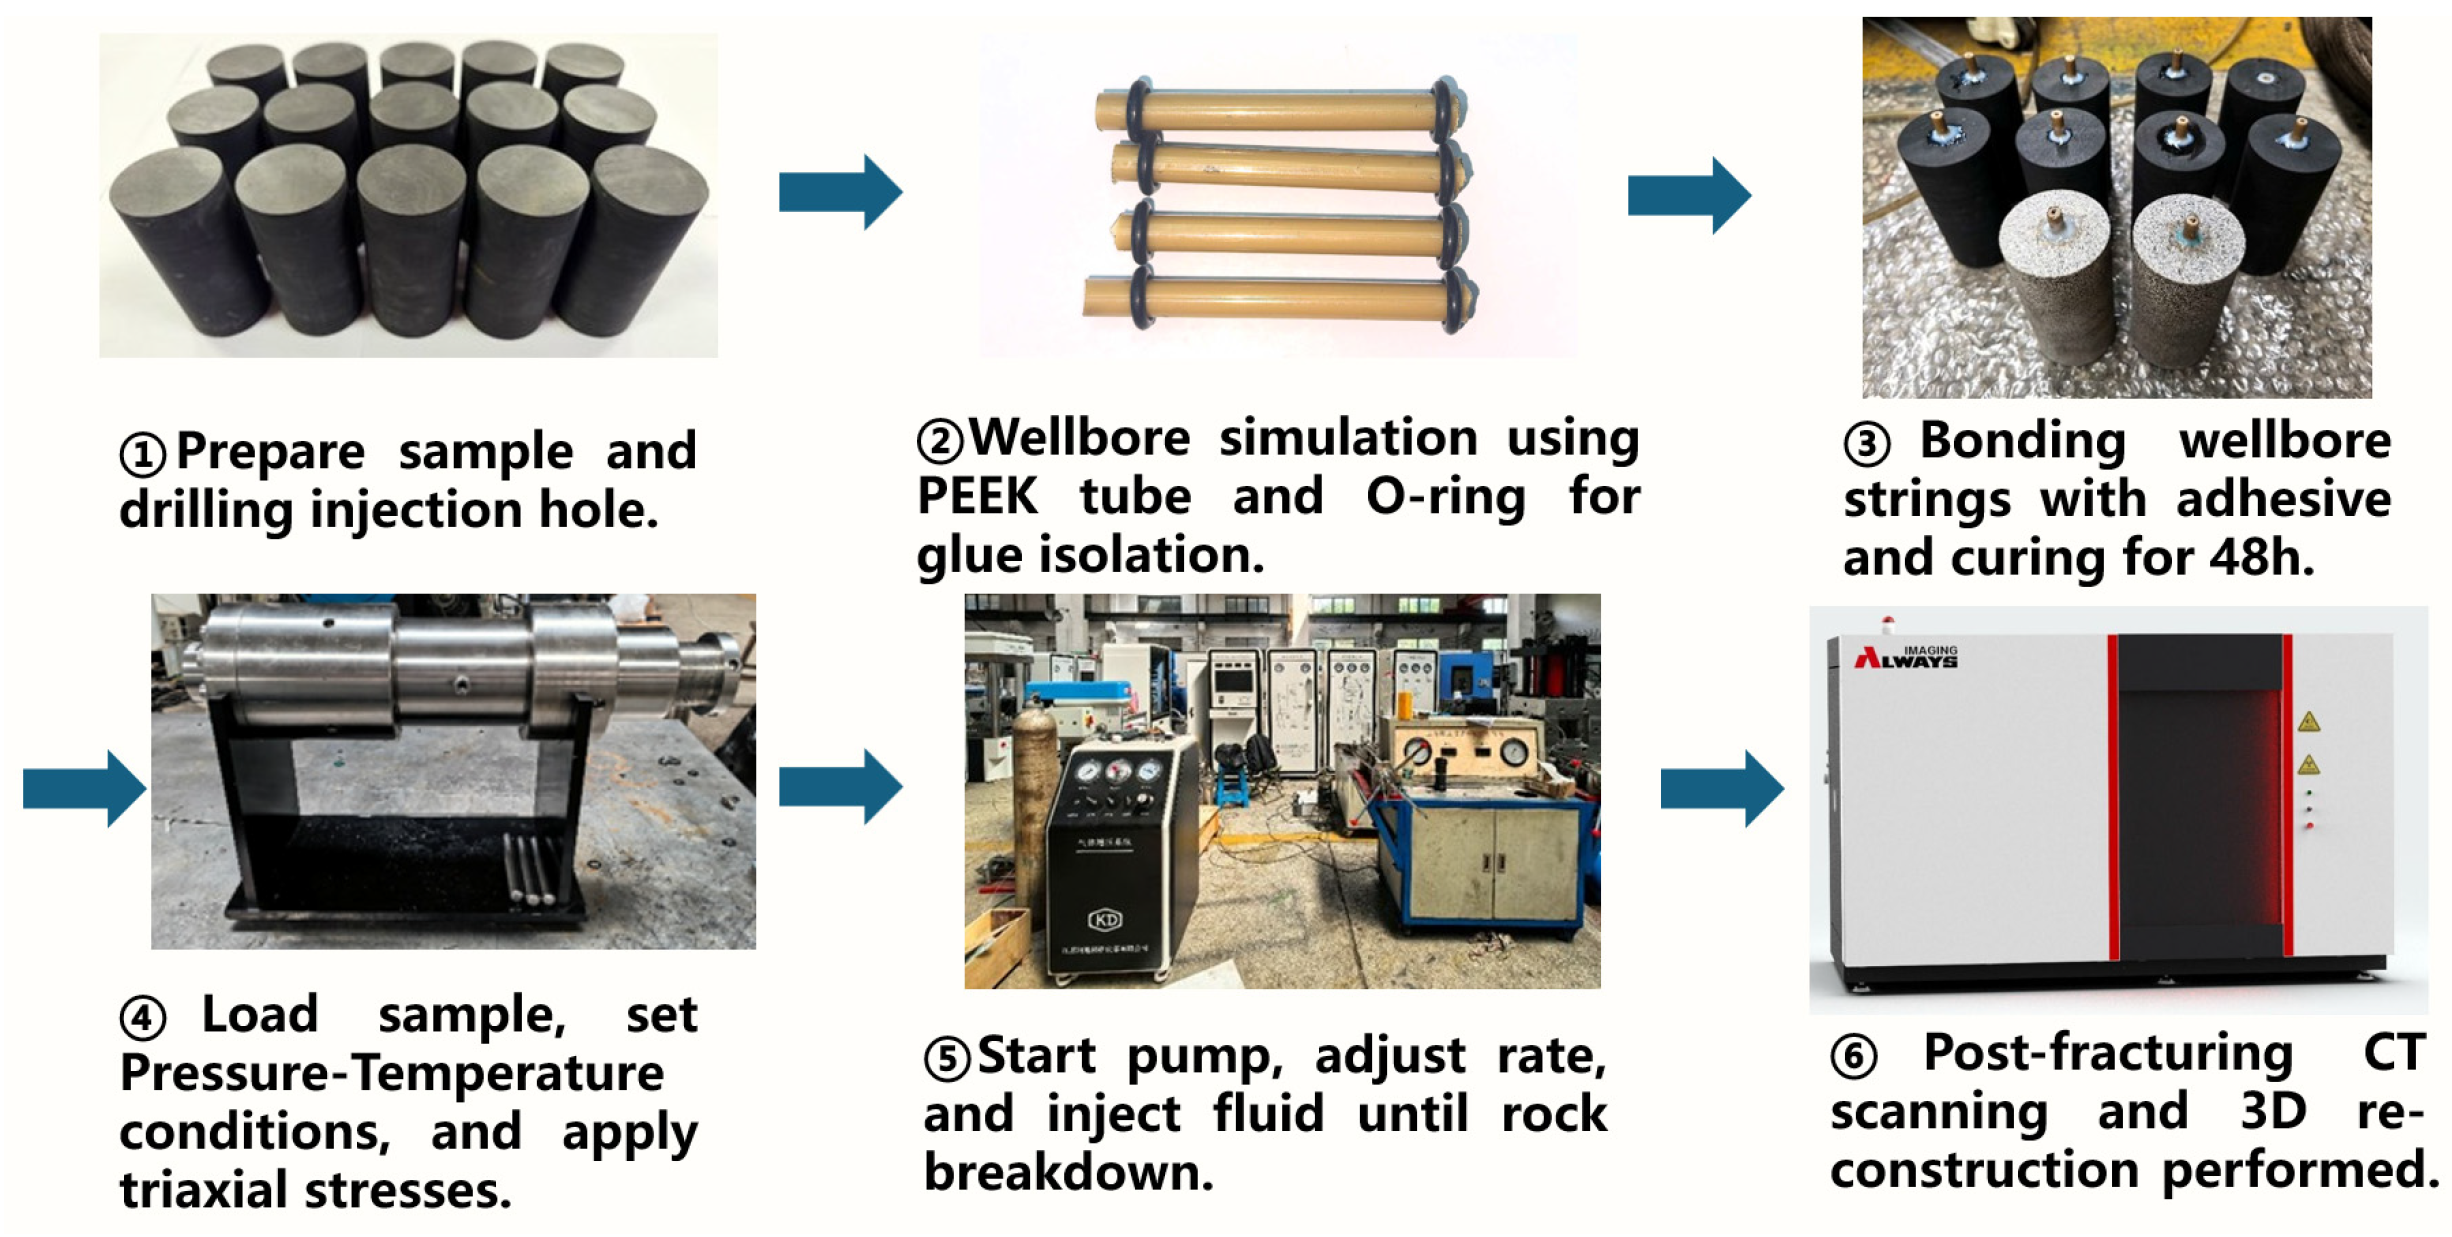
Core samples were collected from the Q1 and Q9 shale members within the same block. The coring orientation was strictly controlled to be perpendicular to bedding planes in order to minimize anisotropy-related interference. After cutting and polishing, the cores were machined into standard cylindrical specimens with dimensions of Φ50 mm × 100 mm, and the end-face parallelism error was kept below 0.02 mm. To simulate wellbore conditions, an injection borehole with a diameter of 10 mm and a depth of 45 mm was drilled at the center of one end face, and a PEEK fracturing tube was fixed using a specialized adhesive. An O-ring was used to leave a 3 mm open-hole section at the bottom of the borehole, forming an effective temporary isolation interval, thereby ensuring that the fracturing fluid acted directly on the rock matrix rather than leaking along the tube wall. After adhesive curing, excess surface material was removed to maintain a smooth injection surface. All specimens were CT-scanned prior to testing to evaluate initial fractures and pore structures, ensuring sample quality and uniformity.
A multivariable orthogonal experimental design was adopted to systematically evaluate the effects of lithology (two types), fluid type (three types), stress condition (three types), and injection rate (three levels). To account for differences in shale bedding and composition, comparative groups were established for the Q9 member (high clay content) and the Q1 member (moderately siliceous). The fracturing media included SC-CO2 (10 MPa, 60 °C), liquid CO2 (5 MPa, 20 °C), and water (ambient temperature). The stress conditions covered three loading states: axial stress equal to confining stress (10/10 MPa), axial stress greater than confining stress (15/10 MPa), and axial stress lower than confining stress (10/15 MPa). Injection rates were differentiated according to the phase-dependent characteristics of the fluids: 2–6 mL/min for SC-CO2, and 0.4 mL/min for both liquid CO2 and water. In this experiment, a total of 20 experimental conditions were established, and each condition was repeated at least twice, yielding 40 valid data sets to ensure statistical reliability.
The experimental procedure (Figure 4) followed a standardized protocol. First, the specimen was installed in the fracturing cell, sealed with a CO2-resistant rubber sleeve, and connected to the fluid lines. A leak-tightness test was then performed by pressurizing with nitrogen to 20 MPa and holding for 30 min; a pressure drop of less than 0.01 MPa was considered acceptable. Subsequently, axial and confining stresses were simultaneously increased to the preset values, and constant stresses were maintained using an independent servo-control system. Temperature was regulated using a staged preheating strategy: the system was heated to the target temperature at 5 °C/min and held for 1 h to ensure thermal equilibration within the core (temperature difference < 0.5 °C). During the fluid injection stage, a high-pressure pump injected the fracturing fluid at a constant flow rate as specified, while the data acquisition system recorded the pressure–time response until specimen failure. Breakdown was identified when the pressure dropped by more than 10% after reaching the peak value. After the test, the system was depressurized and cooled according to standard procedures, and the recovered cores were subjected to CT scanning for post-fracture analysis.
Figure 4.
Flowchart of the experimental procedure.
3.2. Analysis of Breakdown Pressure and CT Scanning Results
The fracturing pressure curve is a key indicator reflecting rock failure behavior and the fracture propagation process. When integrated with three-dimensional fracture morphology data obtained from CT scanning, it enables a systematic interpretation of fracture initiation and propagation mechanisms, as well as fracture-network complexity, from both macroscopic and microscopic perspectives under different lithologies, fluid types, and stress conditions. Based on pump-pressure–time responses and CT scanning results from multiple fracturing tests, this section provides both quantitative and qualitative analyses of fracturing behavior under varying conditions. Particular emphasis is placed on pressure-response characteristics, the influence of stress state, injection-rate effects, and the relationships between CT-derived quantitative parameters and fracturing pressure.
3.2.1. Characteristics of Fracturing Pressure and Breakdown Mechanism Analysis
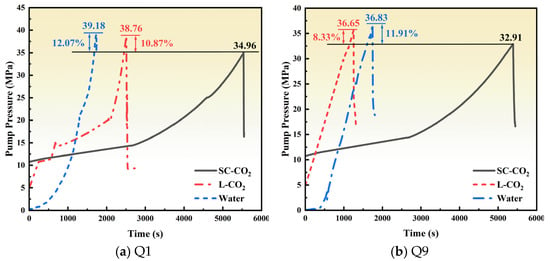
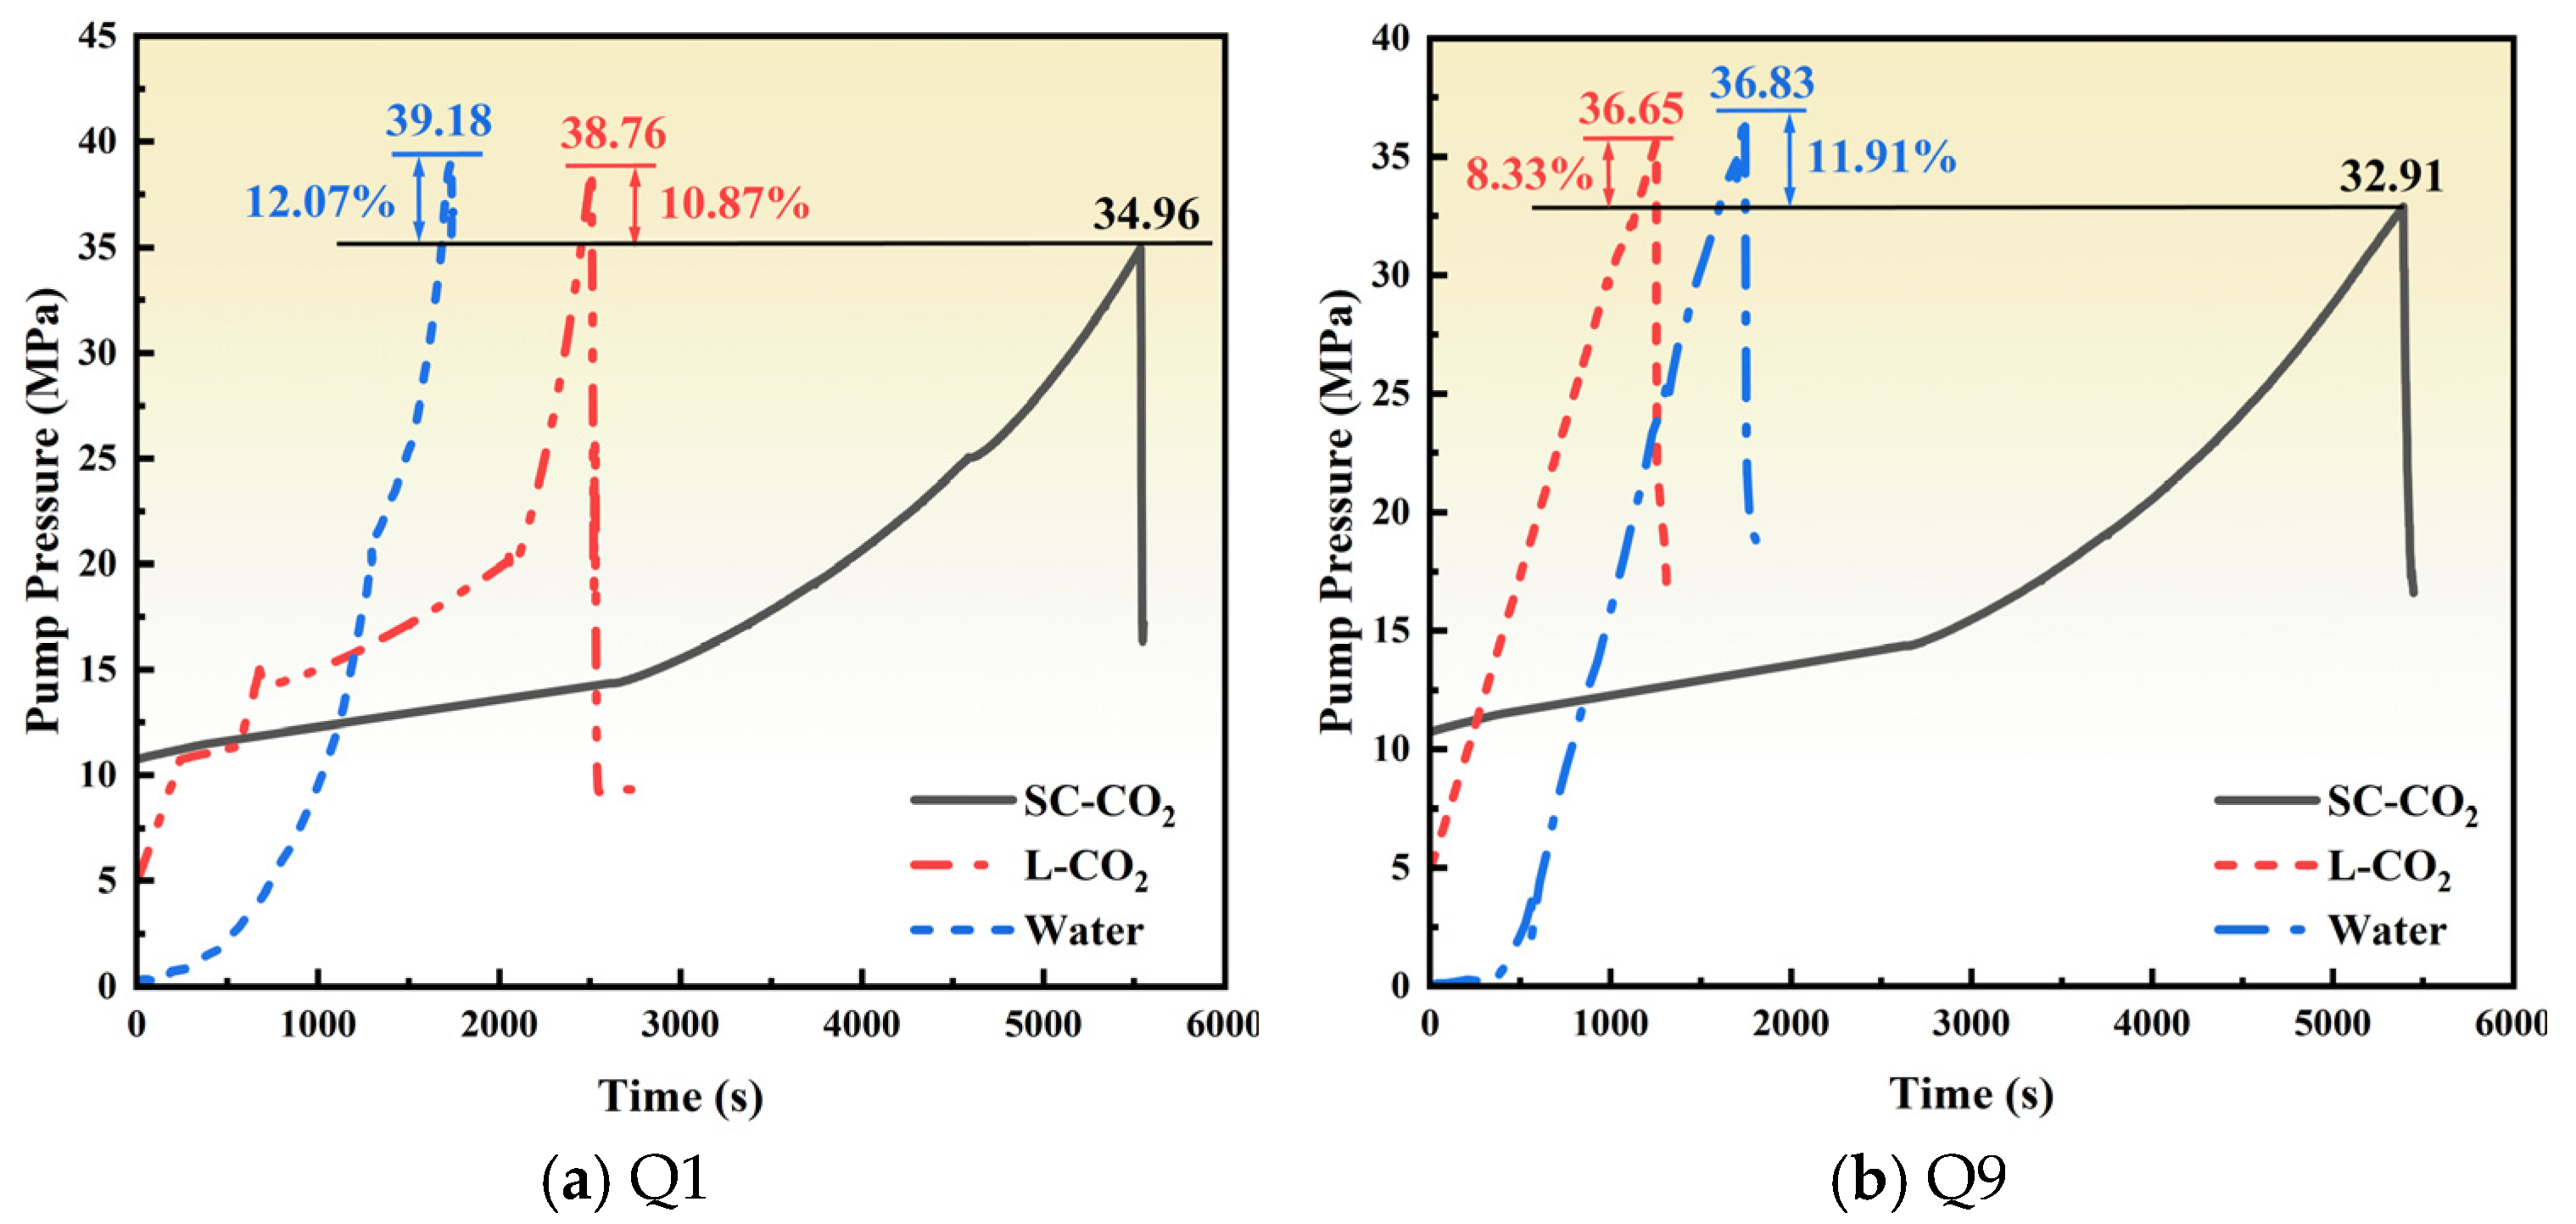
The experimental system recorded complete pressure–time curves, capturing the rock breakdown process under different conditions. Statistical analysis of 20 sets of valid experimental data indicates that the fracturing medium exerts a significant influence on breakdown pressure (Figure 5). Under the standard stress state (axial stress/confining stress = 10/10 MPa), the breakdown pressures for the three fluids follow a consistent trend: SC-CO2 < liquid CO2 < water. Taking the representative Q9 shale as an example, the breakdown pressure is 32.91 MPa for SC-CO2 fracturing, 35.65 MPa for liquid CO2, and 36.83 MPa for water.
Figure 5.
Pump-pressure–time curves under different fracturing media.
SC-CO2 combines the high diffusivity of a gas with the strong penetrability of a liquid. Its ultra-low viscosity enables it to effectively invade micro- to nano-scale pore structures and establish a more uniform pore-pressure field. According to fracture mechanics, a more homogeneous pore-pressure distribution can substantially reduce the energy barrier required for fracture initiation, thereby decreasing resistance to breakdown. Liquid CO2 possesses a certain degree of diffusivity; however, its viscosity is markedly higher than that of SC-CO2, which diminishes its penetration efficiency into micropores and correspondingly results in higher pump pressure. Water not only has a higher viscosity, but more importantly, it can induce hydration of clay minerals, strengthening interlaminar bonding while generating non-uniform swelling stresses, which further increases the breakdown pressure.
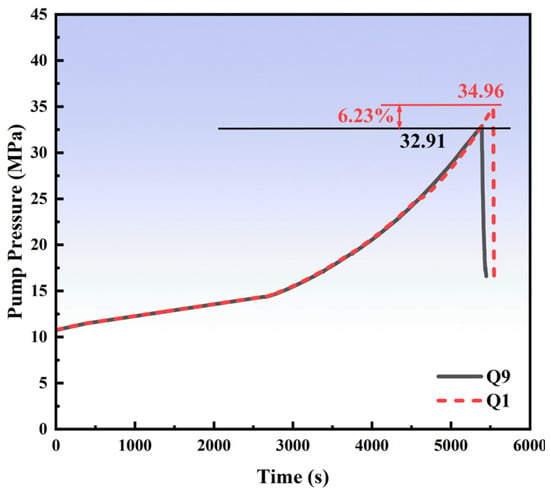
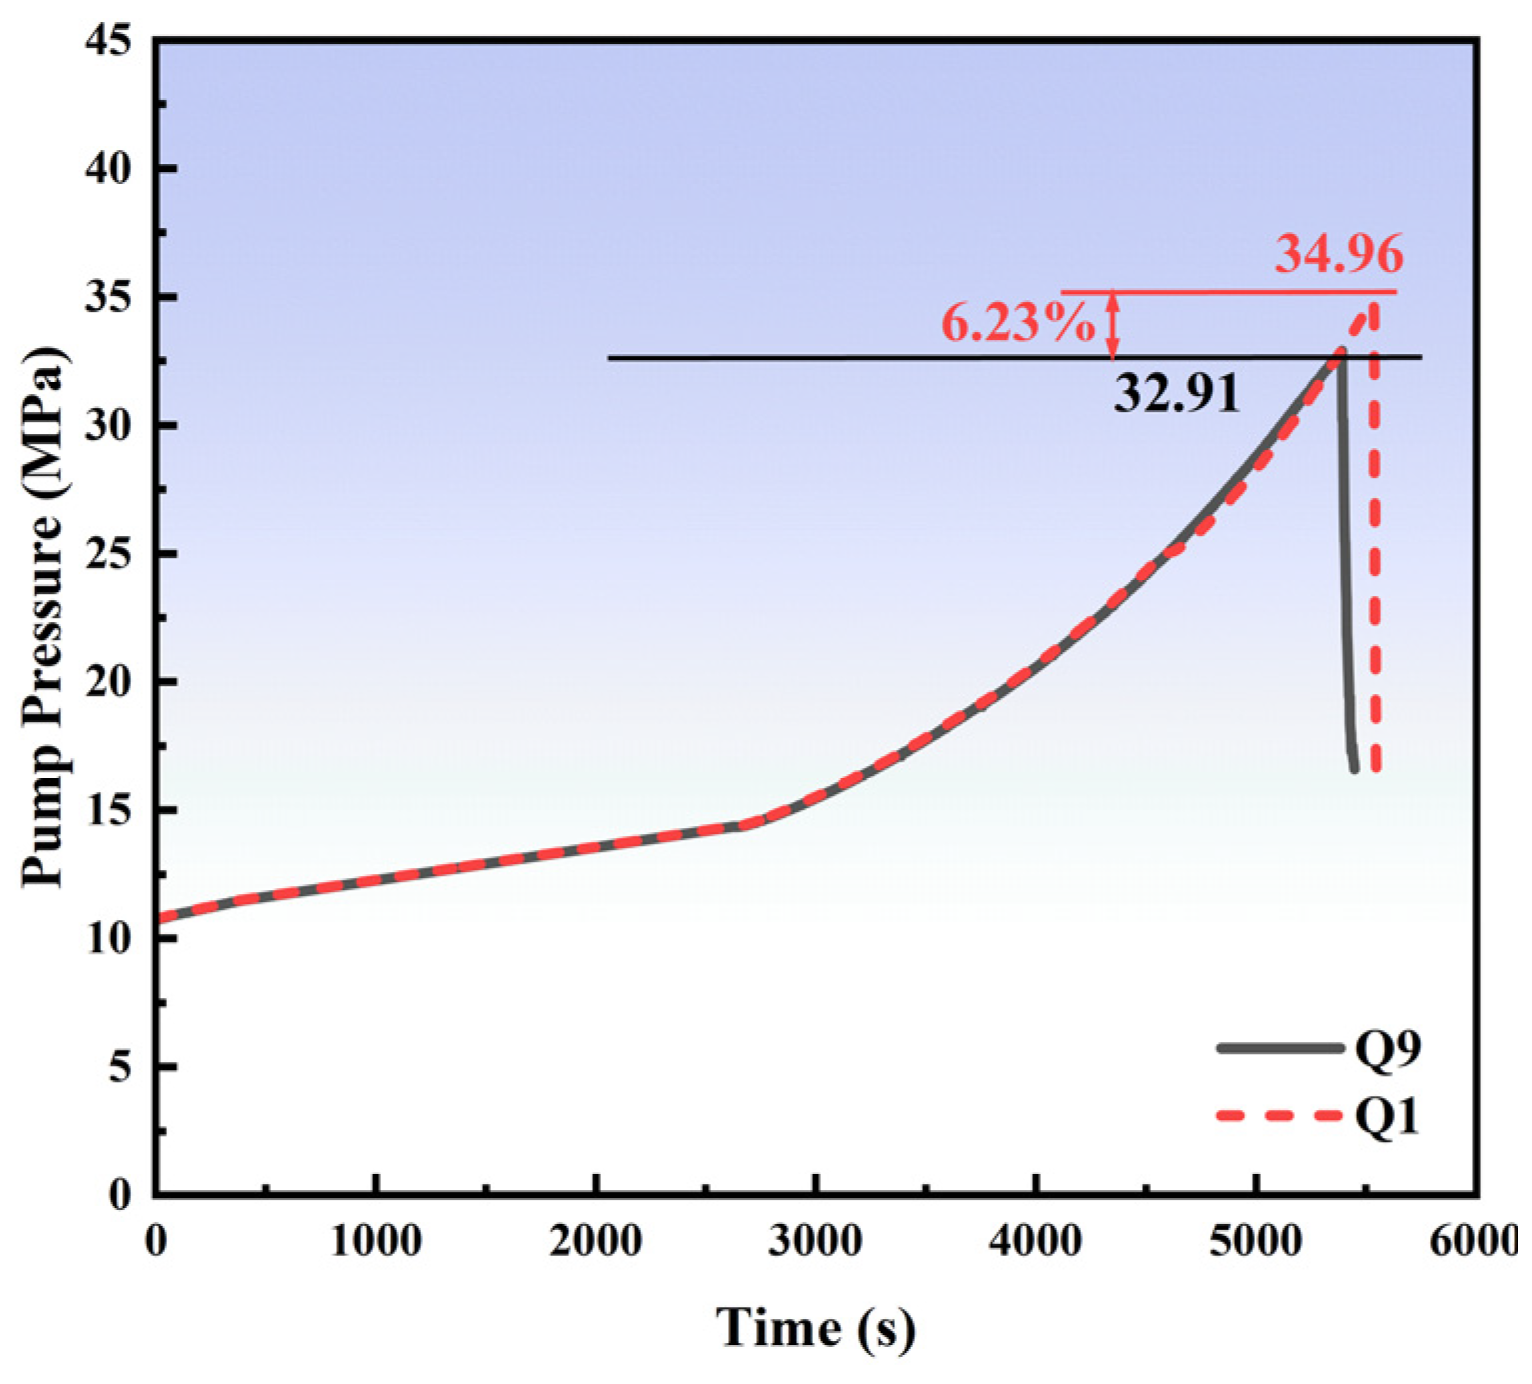
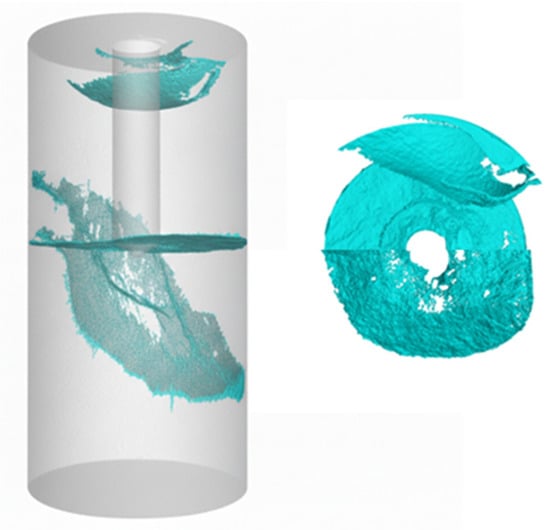
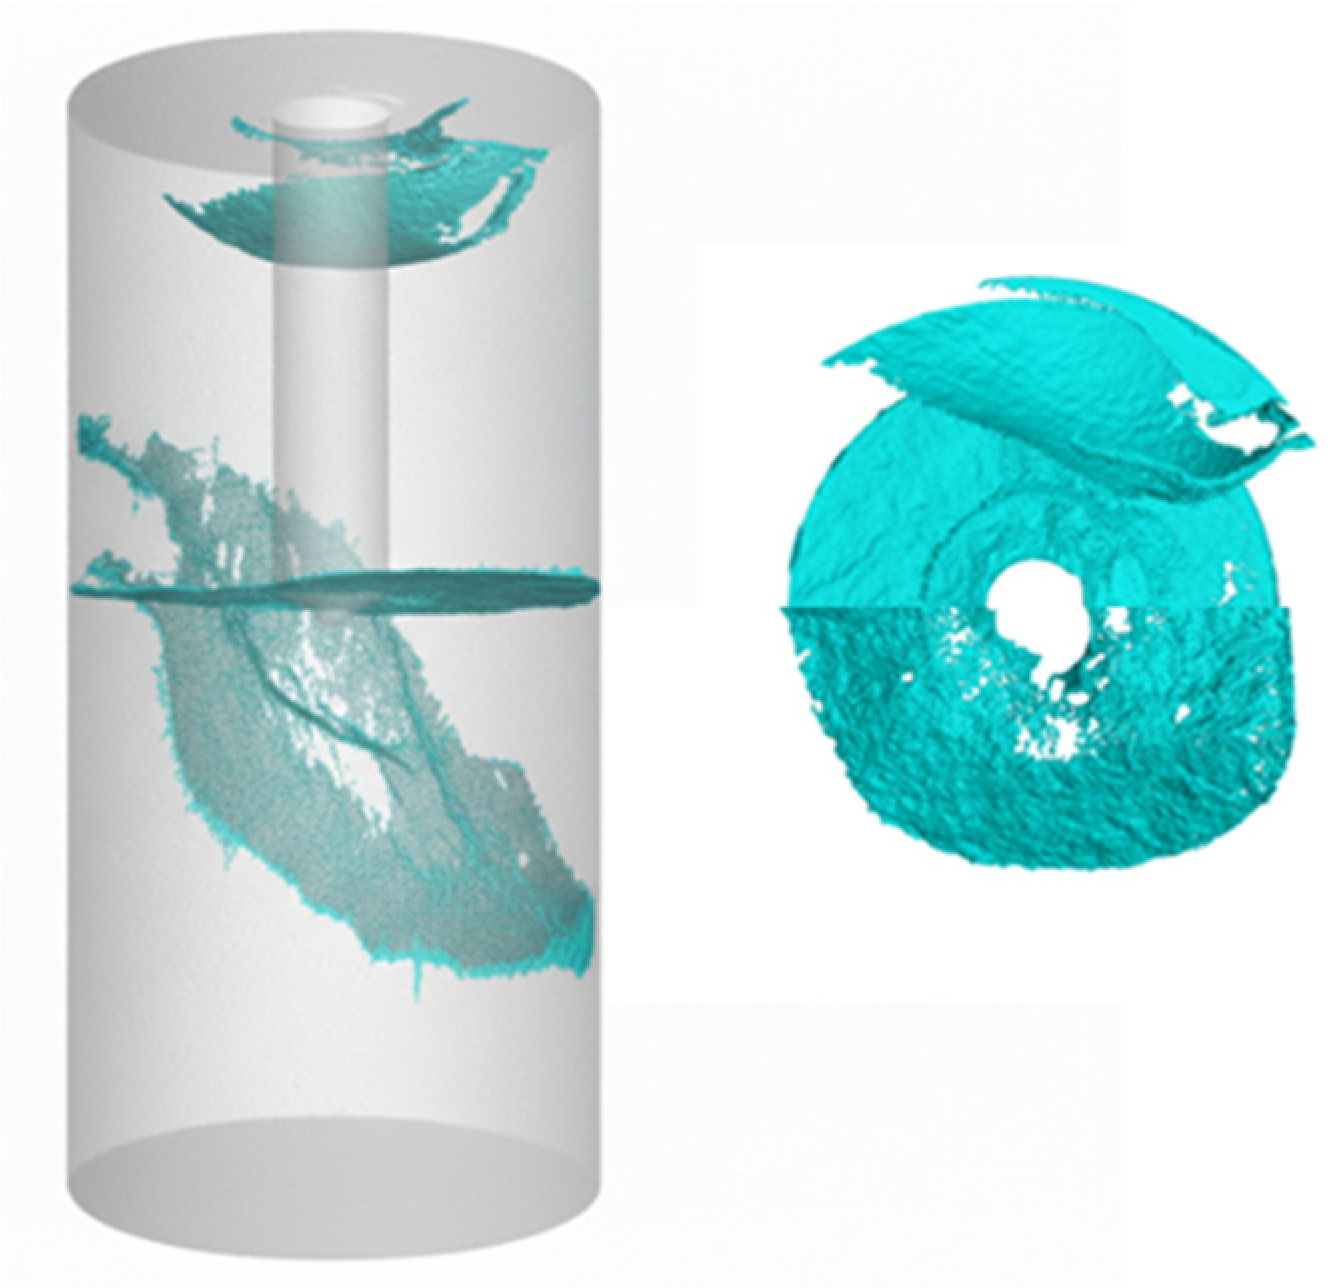
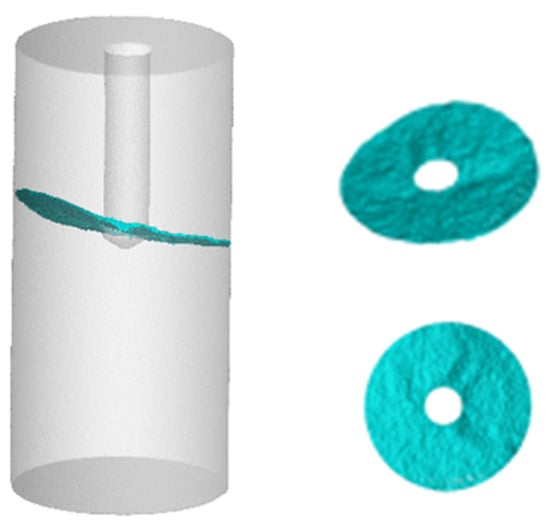
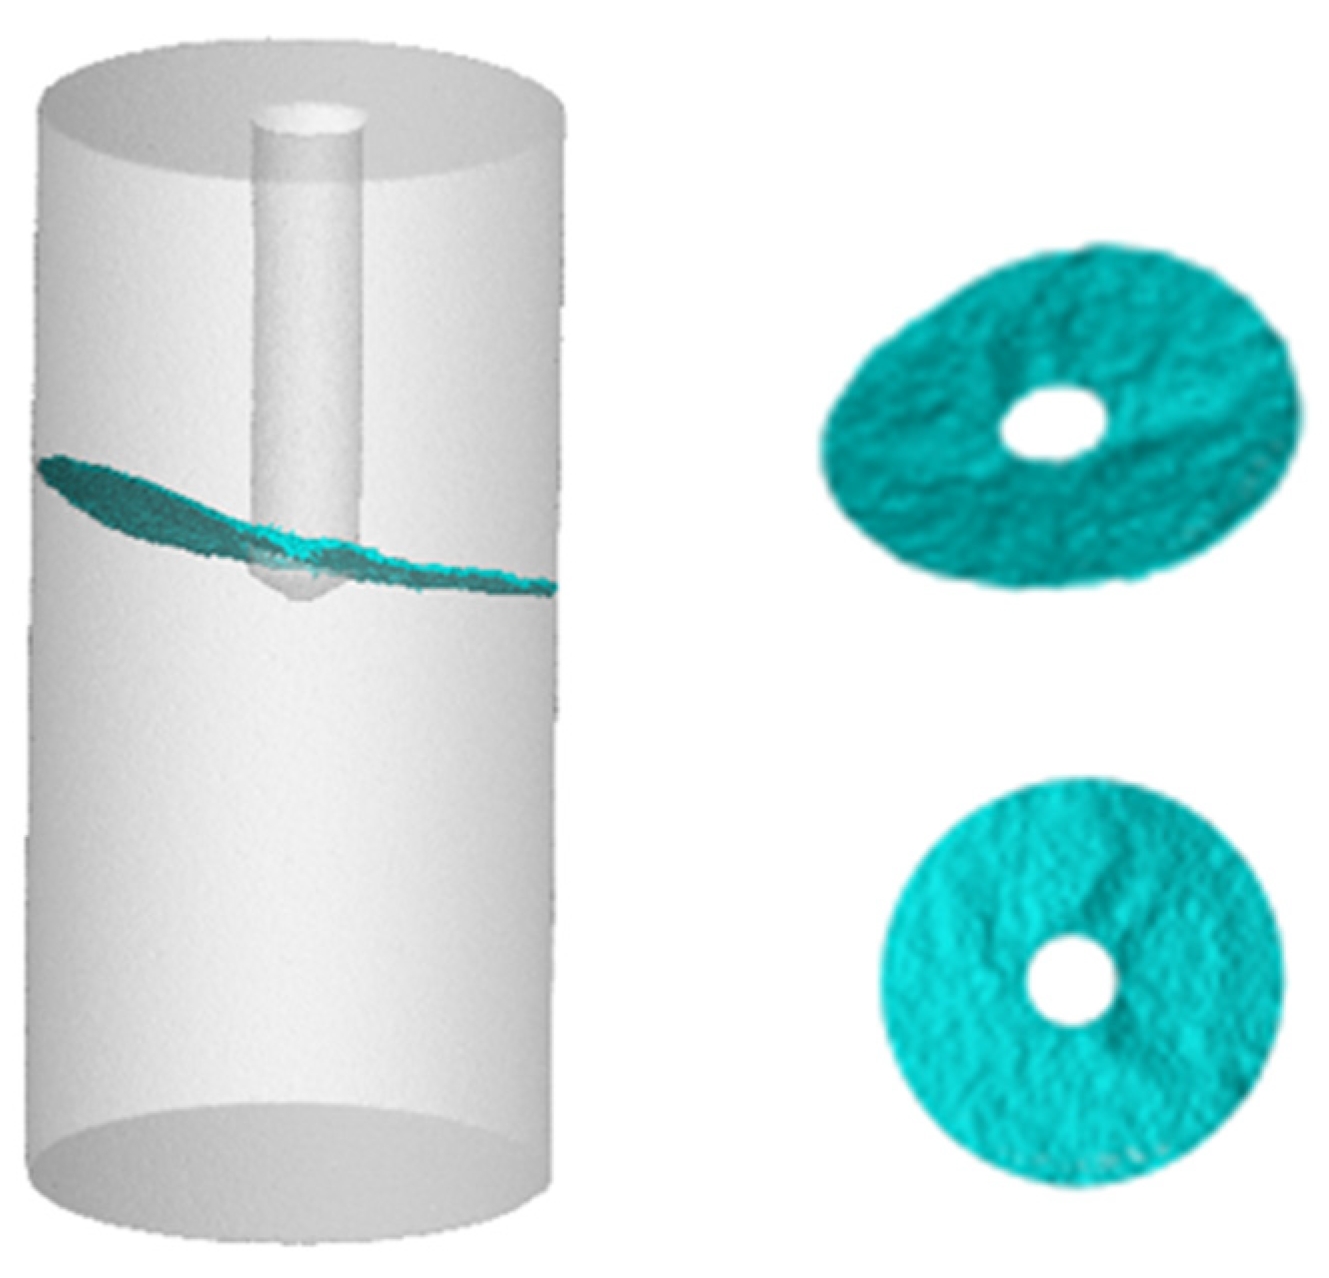
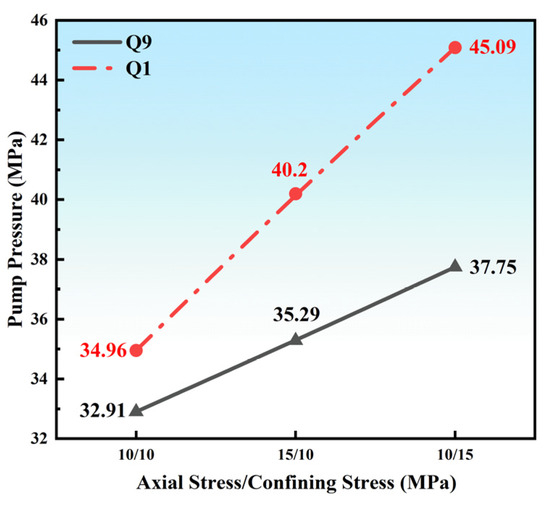
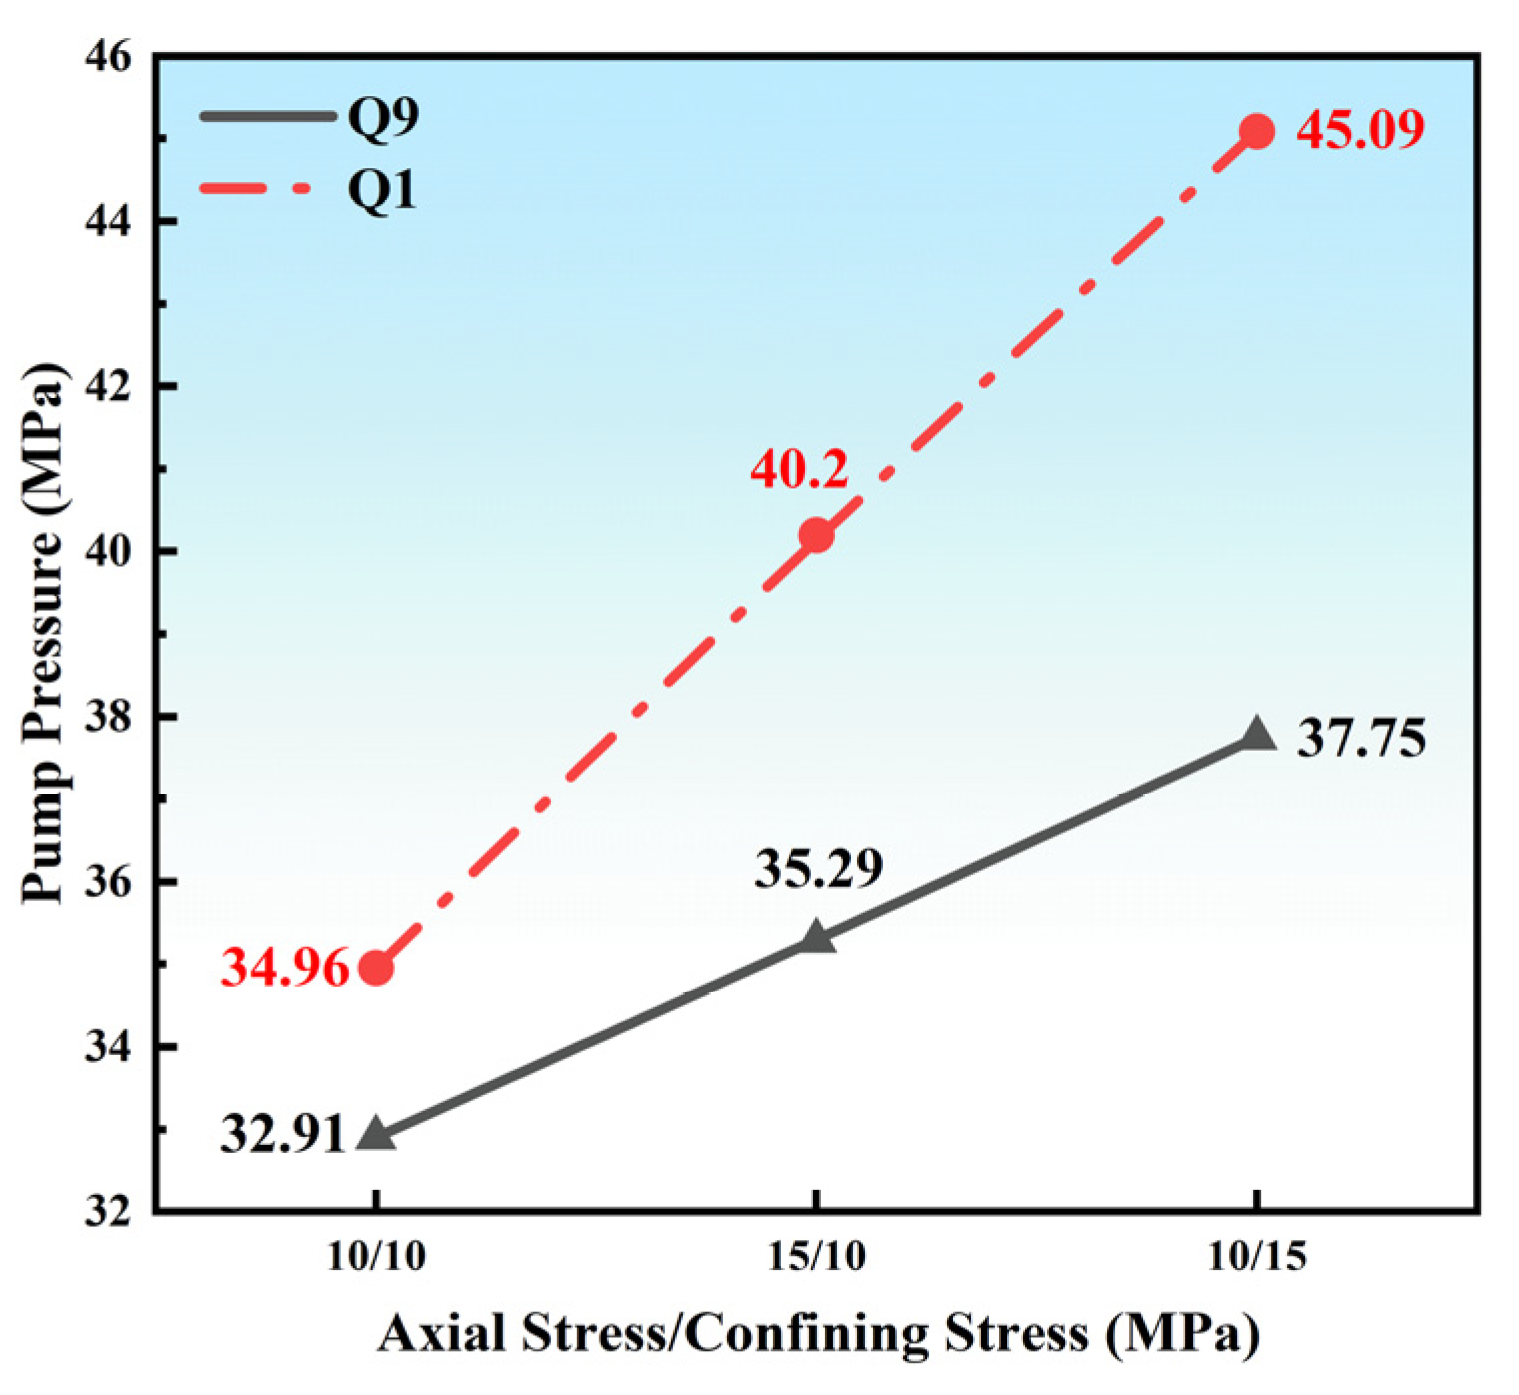
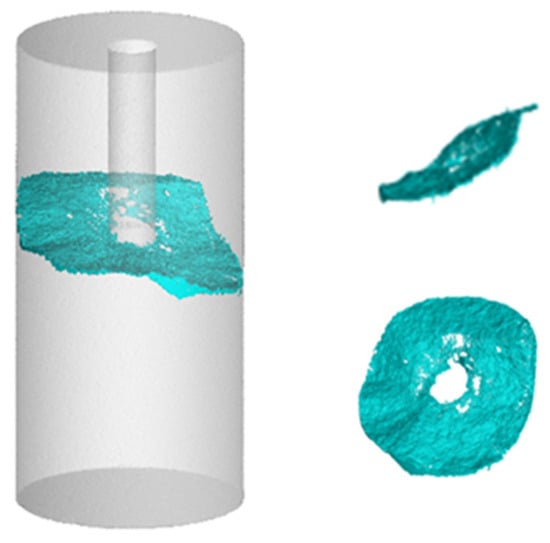
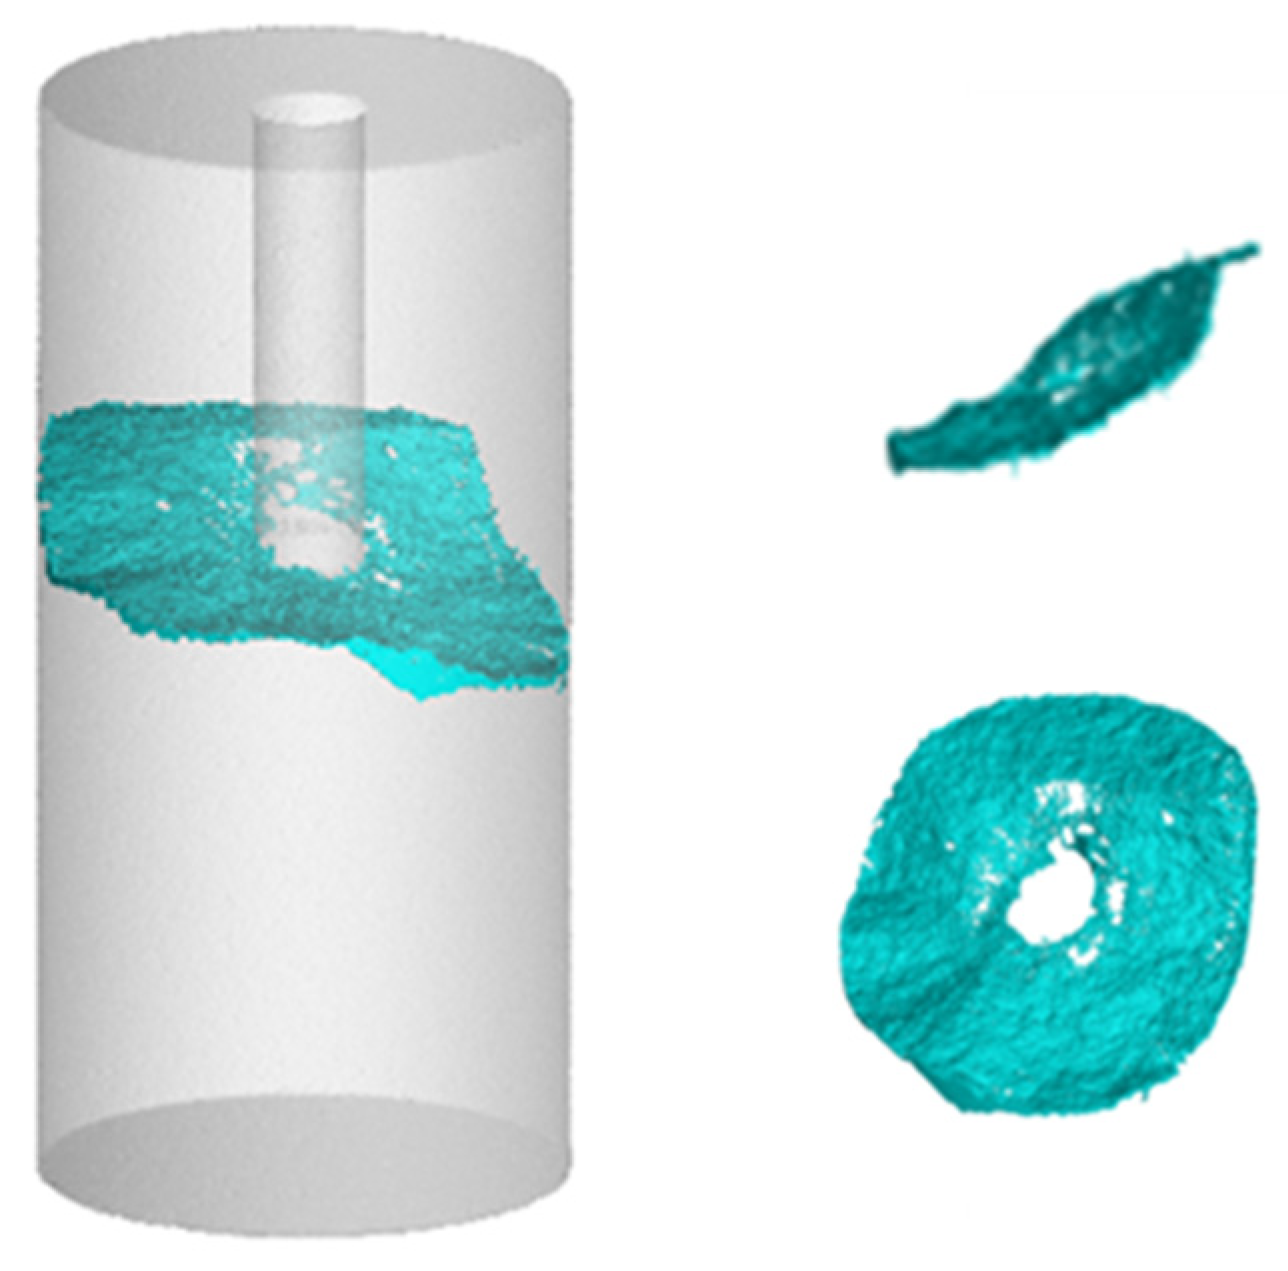
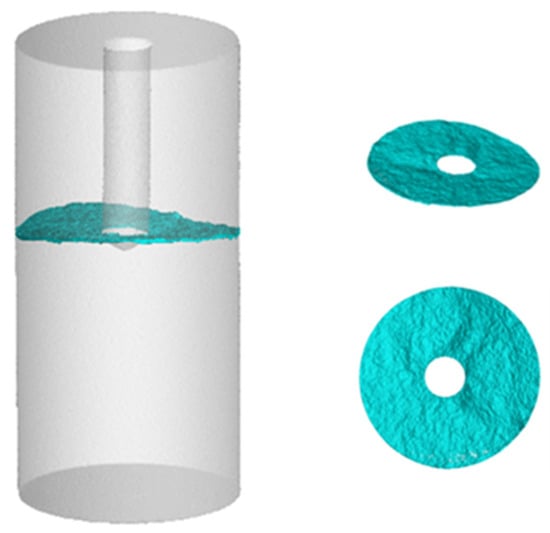
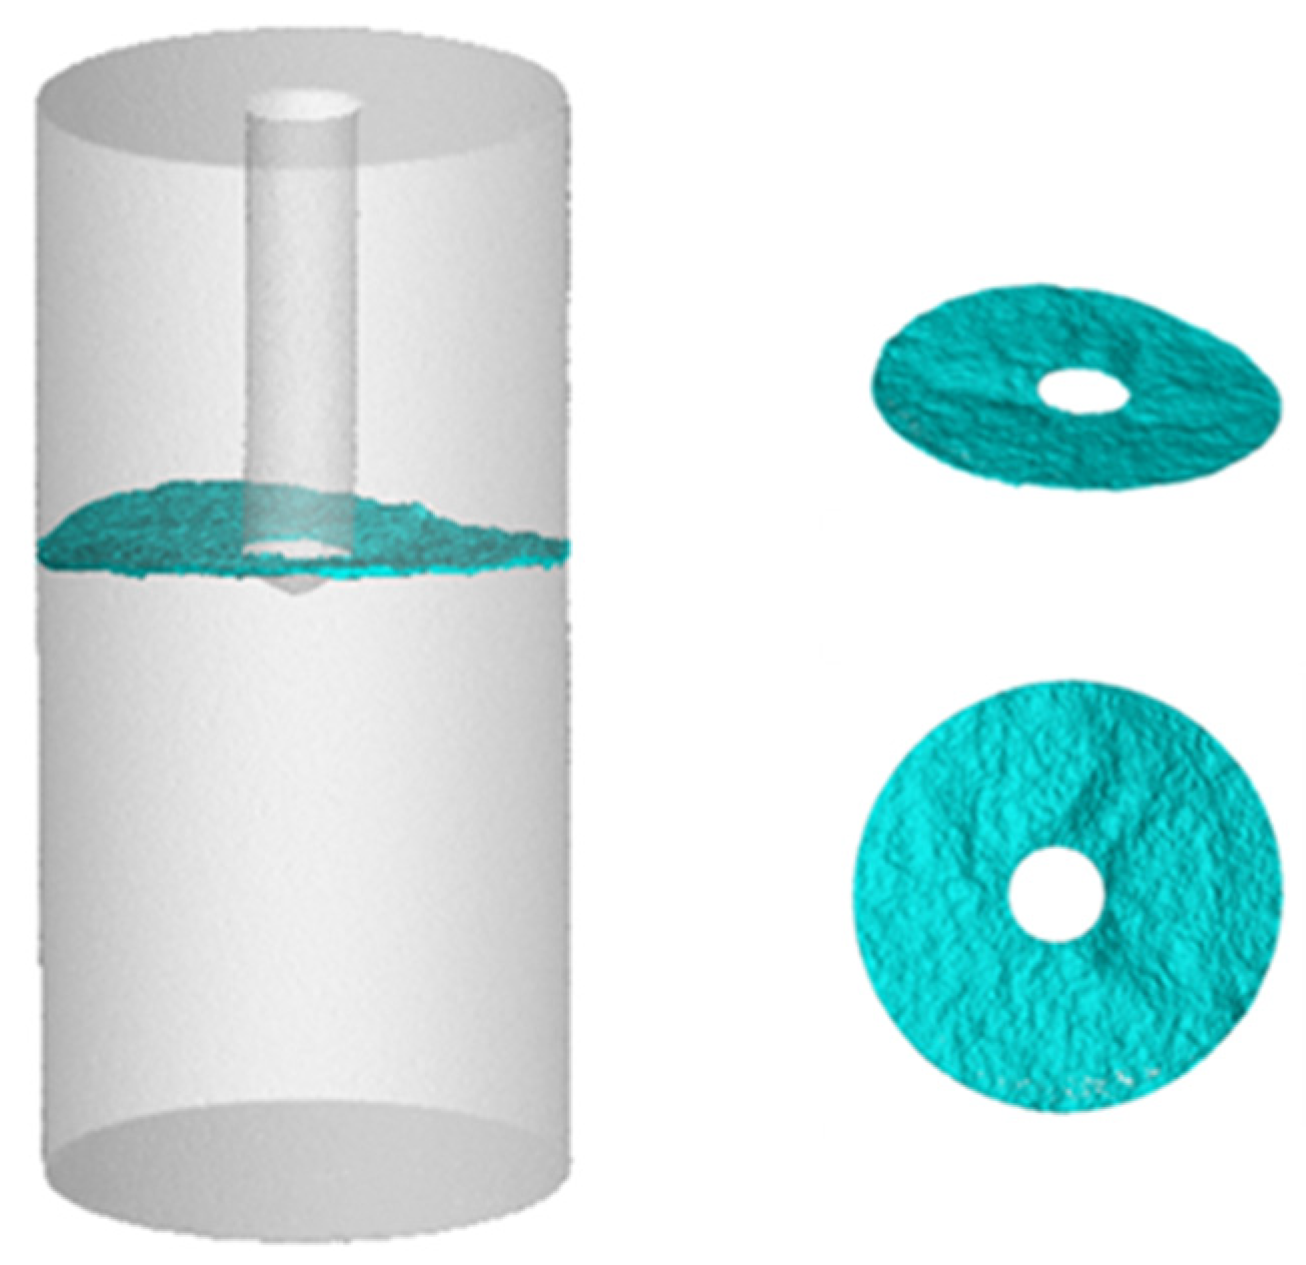
From the perspective of lithological differences (Figure 6), the Q9 shale exhibits the lowest breakdown pressure (32.91 MPa), whereas the Q1 shale shows a relatively higher value (34.96 MPa). This contrast is closely related to differences in mineral composition and structural characteristics. The Q9 member contains a high clay-mineral content of 50–60% and densely developed bedding (50–70 laminations per meter). Its distinctive weak planes and anisotropy provide preferential pathways for fracture initiation. Three-dimensional CT reconstructions show that, under SC-CO2 fracturing, the Q9 shale develops a typical multi-branch fracture network (Figure 7), with fractures propagating along bedding planes and frequently deflecting to form a spatially connected three-dimensional system. In contrast, the Q1 shale is dominated by a single main fracture with limited branching and poor cross-bedding penetration (Figure 8).
Figure 6.
Pump-pressure–time curves for shales from different target intervals.
Figure 7.
Three-dimensional reconstruction of the fractured Q9 shale specimen.
Figure 8.
Three-dimensional reconstruction of the fractured Q1 shale specimen.
3.2.2. Controlling Effects of Stress Conditions on Breakdown Pressure and Fracture Morphology
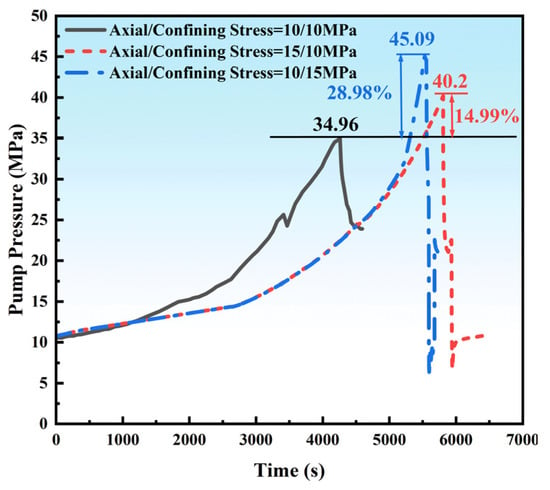
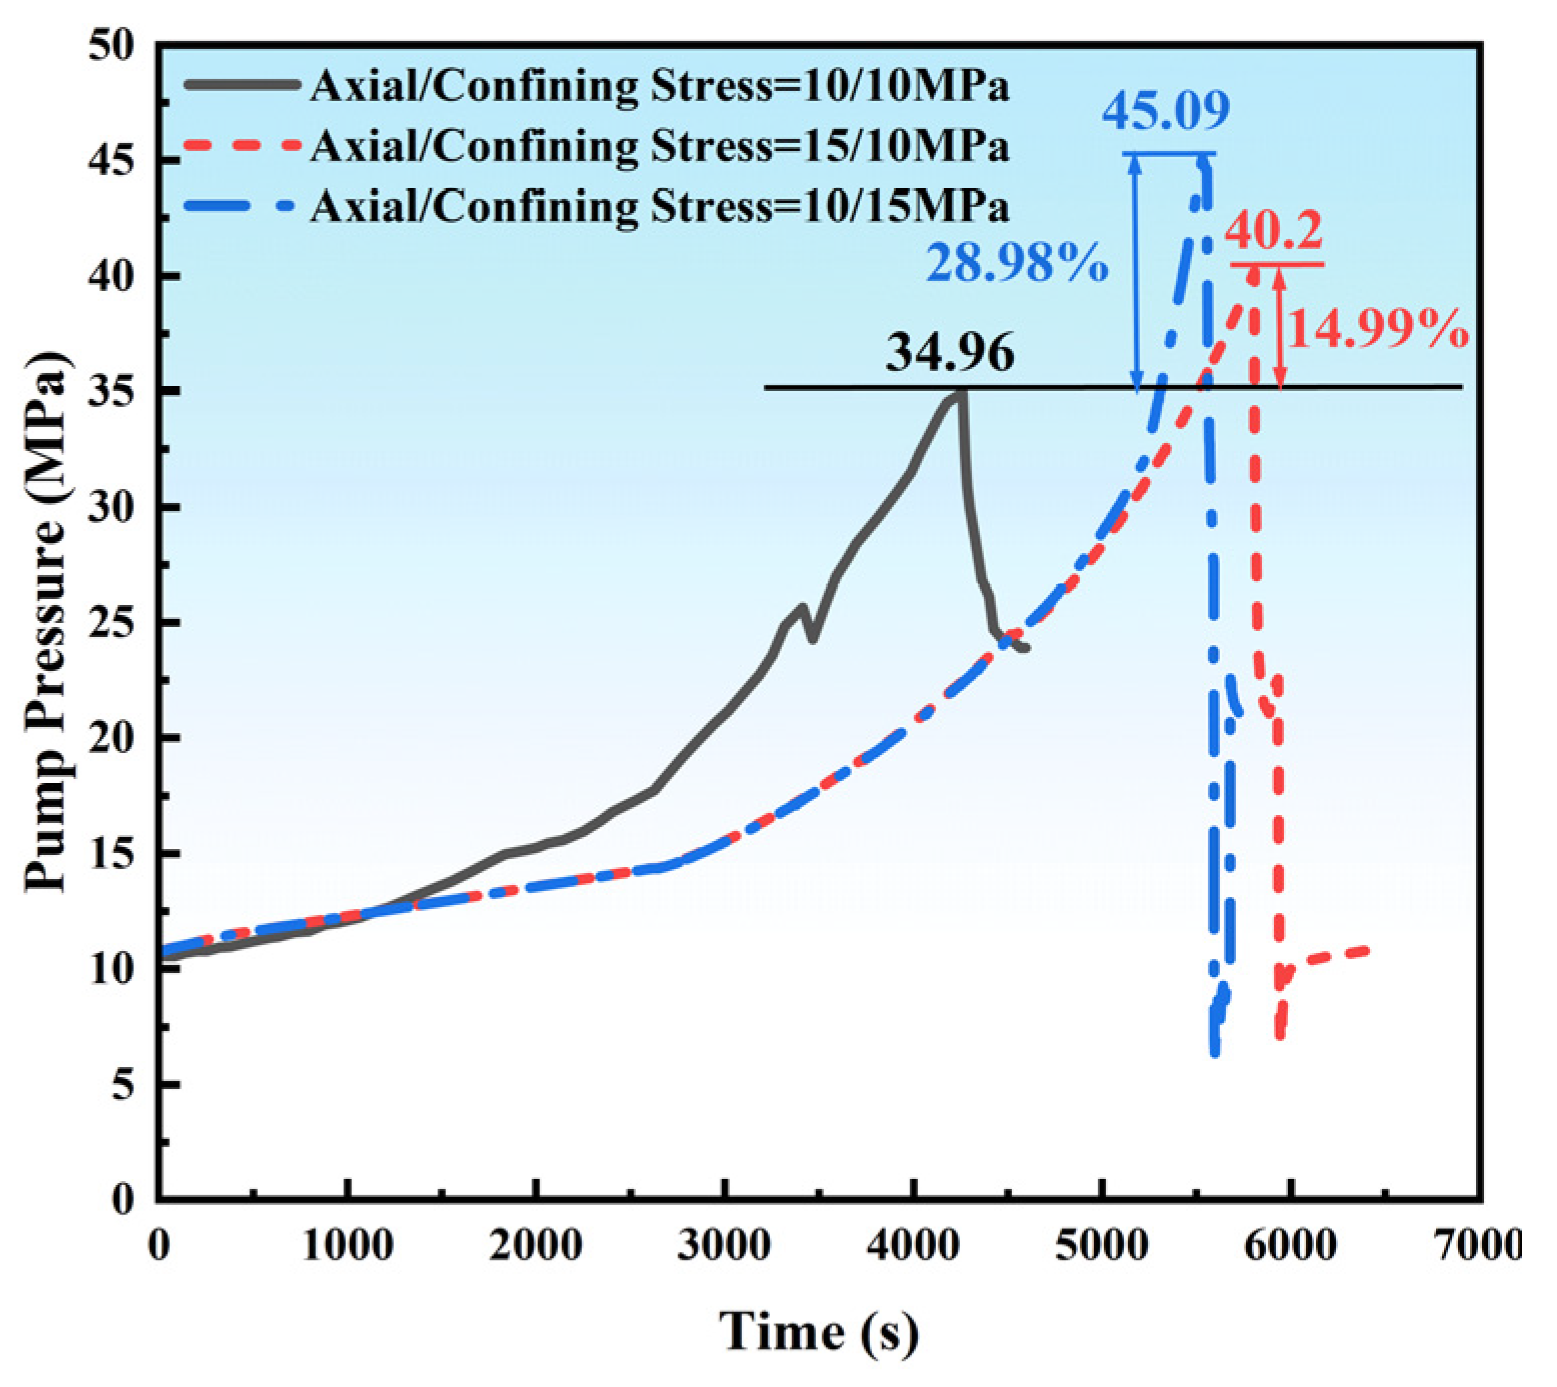
Stress conditions are a key factor controlling the direction and complexity of fracture propagation. The experimental system investigated the effects of three representative stress states—axial stress equal to confining stress, axial stress greater than confining stress, and axial stress lower than confining stress—on the hydraulic fracturing process. The results indicate that shale exhibits the highest breakdown pressure under the condition of axial stress < confining stress, and the lowest breakdown pressure when axial stress equals the confining stress. This stress sensitivity reflects a shift in the failure mechanism under different stress states. The breakdown pressure results are shown in Figure 9 and Figure 10.
Figure 9.
Breakdown pump pressure of different core specimens under different stress conditions.
Figure 10.
Pump-pressure–time curves of the Q1 shale under different stress conditions.
From a mechanical perspective, when the axial stress is lower than the confining stress, the rock is subjected to a “circumferentially constrained” stress state, in which confinement along the minimum principal-stress direction is enhanced. As a result, fracture initiation must overcome a higher energy barrier. According to linear elastic fracture mechanics, the mode-I stress intensity factor () at the crack tip is closely related to the prevailing stress state, as shown in Equation (1):
where is the geometric factor, is the far-field stress, and is the crack half-length. Under the condition of axial stress < confining stress, the altered effective stress field leads to an increase in the geometric factor , thereby raising the critical pressure required for fracture initiation.
CT results show that fracture trajectories become more tortuous under axial stress < confining stress, and the fracture fractal dimension increases significantly. For the Q1 shale, the fractal dimension reaches 2.37 under this stress state, representing an increase of approximately 3.9% compared with the axial stress = confining stress condition. Micro-mechanistic analysis indicates that an asymmetric stress field activates more potential fracture-initiation sites and promotes multidirectional fracture growth (Figure 11 and Figure 12). Notably, under axial stress < confining stress, fractures frequently cross bedding planes and connect pre-existing microfractures, forming a characteristic three-dimensional connected network. This “stepped” fracture system can markedly enhance the stimulated reservoir volume.
Figure 11.
Three-dimensional reconstruction of the fractured Q1 shale specimen under axial stress < confining stress.
Figure 12.
Three-dimensional reconstruction of the fractured Q1 shale specimen under axial stress = confining stress.
3.2.3. Coupled Effects of Injection Rate on Breakdown Pressure and Fracture Propagation
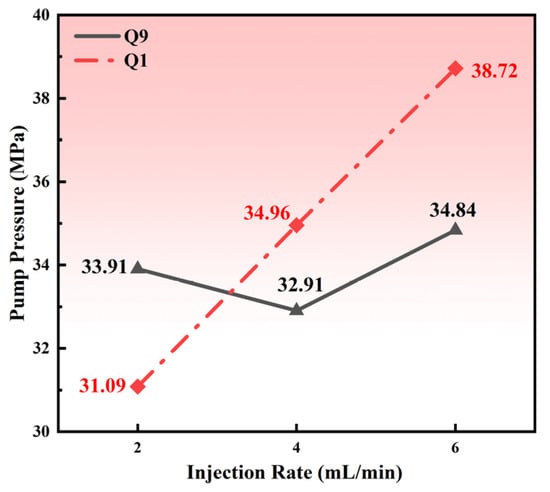
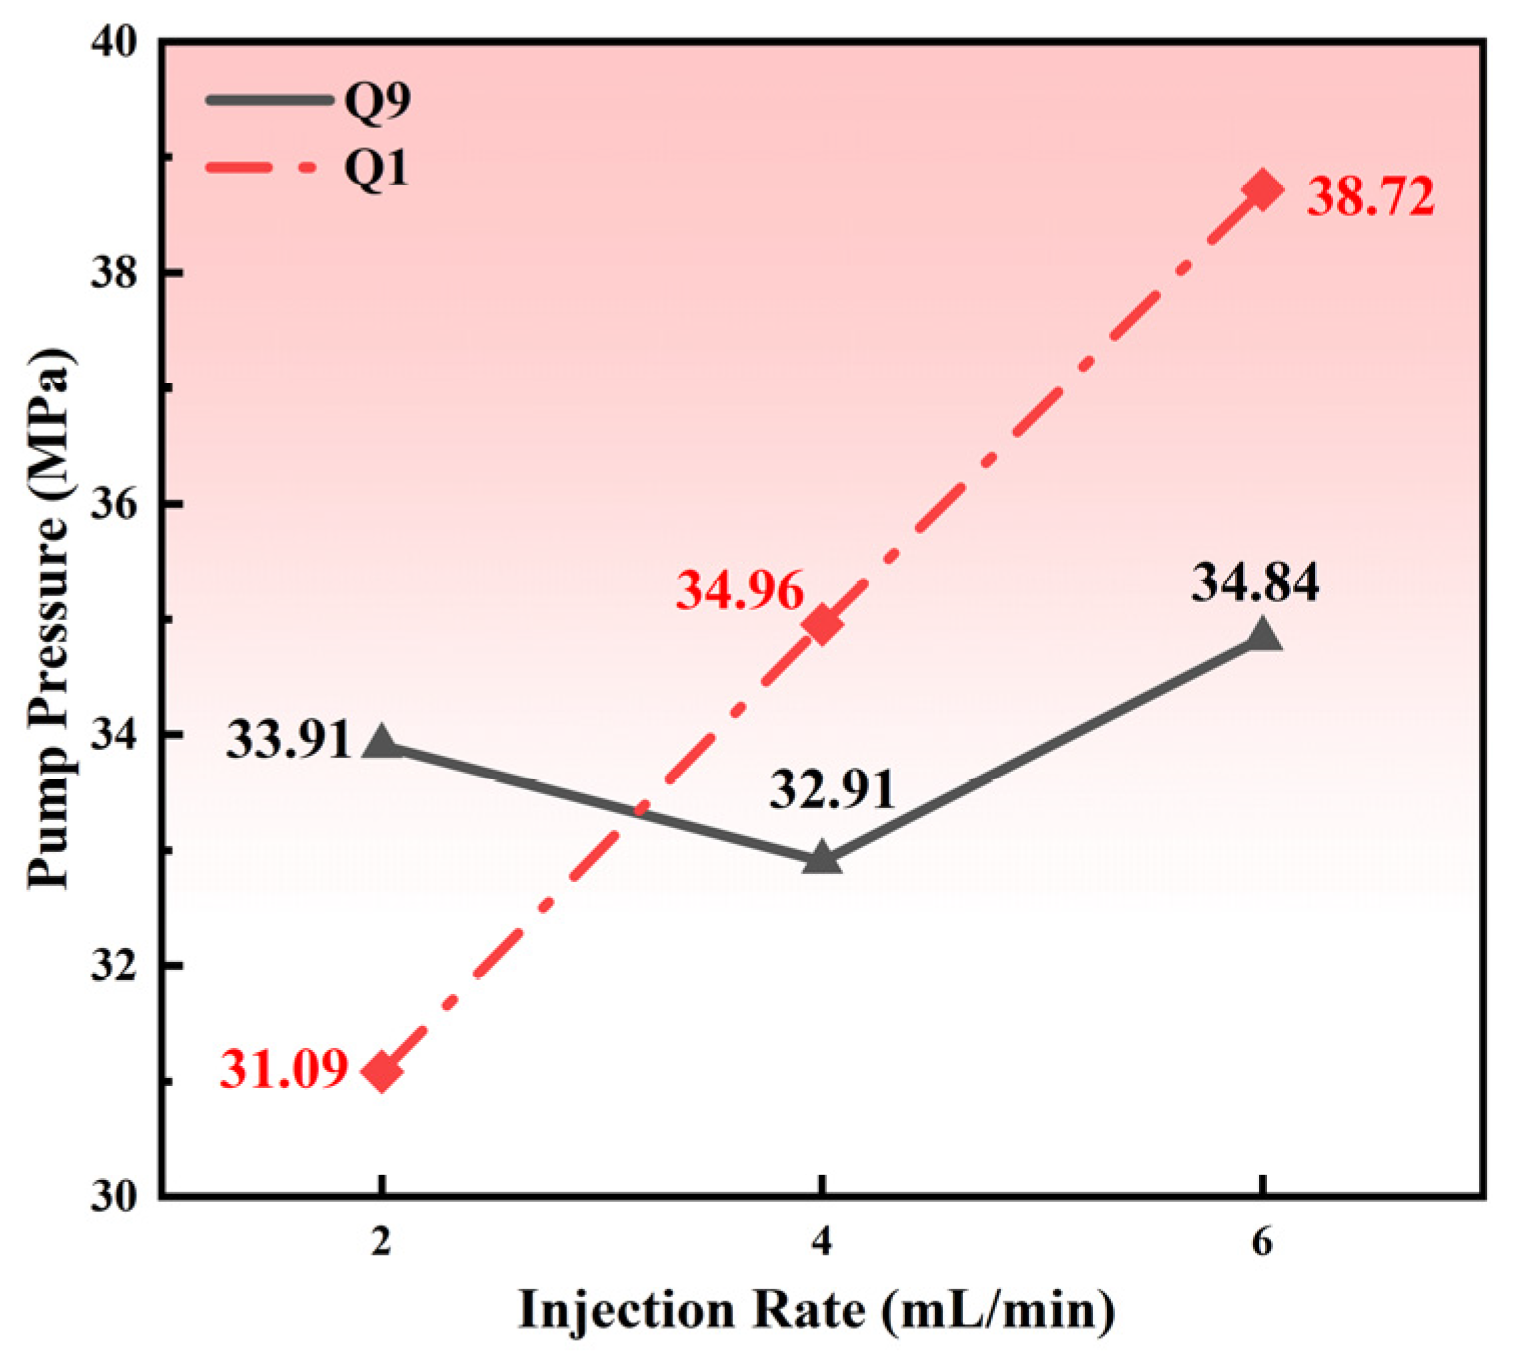
Injection rate, as a key controllable parameter in hydraulic fracturing operations, exerts lithology-dependent effects on breakdown pressure and fracture morphology. The experimental system investigated fracturing responses under three injection-rate levels (low, intermediate, and high), as shown in Figure 13.
Figure 13.
Breakdown pump pressure of different core specimens under different injection rates.
For the Q9 shale, as the SC-CO2 injection rate increases from 2 to 6 mL/min, the breakdown pressure exhibits a distinctive “V-shaped” trend (33.91 MPa → 32.91 MPa → 34.84 MPa). CT image analysis shows that the intermediate rate (4 mL/min) produces the greatest degree of fracture branching and the best connectivity. This behavior can be interpreted in terms of the coupled effects of fluid diffusion and pressure accumulation. At a low injection rate, diffusion toward the fracture front dominates, leading to insufficient pressure build-up and constrained fracture growth. At an intermediate injection rate, diffusion and accumulation reach an optimal balance, favoring the development of a complex fracture network. At a high injection rate, pressure accumulates too rapidly, causing fractures to propagate quickly without sufficient time for extensive branching.
In contrast, the Q1 shale exhibits a different response. With increasing injection rate, the breakdown pressure rises monotonically (e.g., from 31.09 MPa to 38.72 MPa for the Q1 member). CT-based observations further indicate that at high injection rates the fracture morphology becomes simpler, dominated by a main fracture with insufficient development of secondary branches. This contrast reflects the modulating role of rock permeability on injection-rate effects: a relatively more permeable rock mass (e.g., the Q9 member) can achieve a more favorable fluid distribution at an intermediate injection rate, whereas a lower-permeability rock (e.g., the Q1 member) cannot effectively diffuse the injected fluid at high rates, resulting in excessive pressure accumulation.
3.3. Fracture Complexity and Fractal Dimension
Quantitative evaluation of fracture complexity is a critical step in assessing stimulation effectiveness and optimizing fracturing design. The fractal dimension ()—a key parameter describing the irregularity of fracture geometry and the complexity of its spatial distribution—can, when combined with CT-based three-dimensional reconstruction, effectively characterize the structural attributes of fracture networks. In this section, CT images are used to systematically calculate the fractal dimension and a concentration metric under different experimental conditions, enabling a quantitative assessment of fracture complexity. The relationships between fracture complexity and lithology, fluid type, and stress conditions are then examined to further elucidate the micro-mechanisms and controlling factors governing the formation of complex fracture networks.
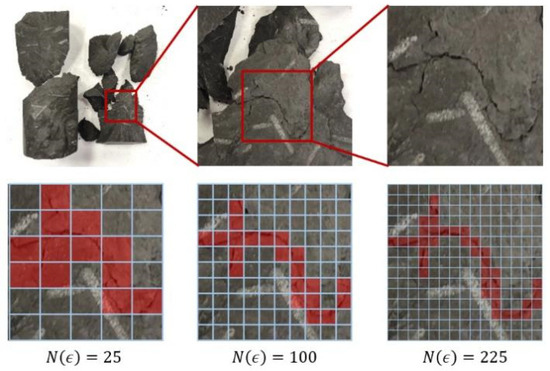
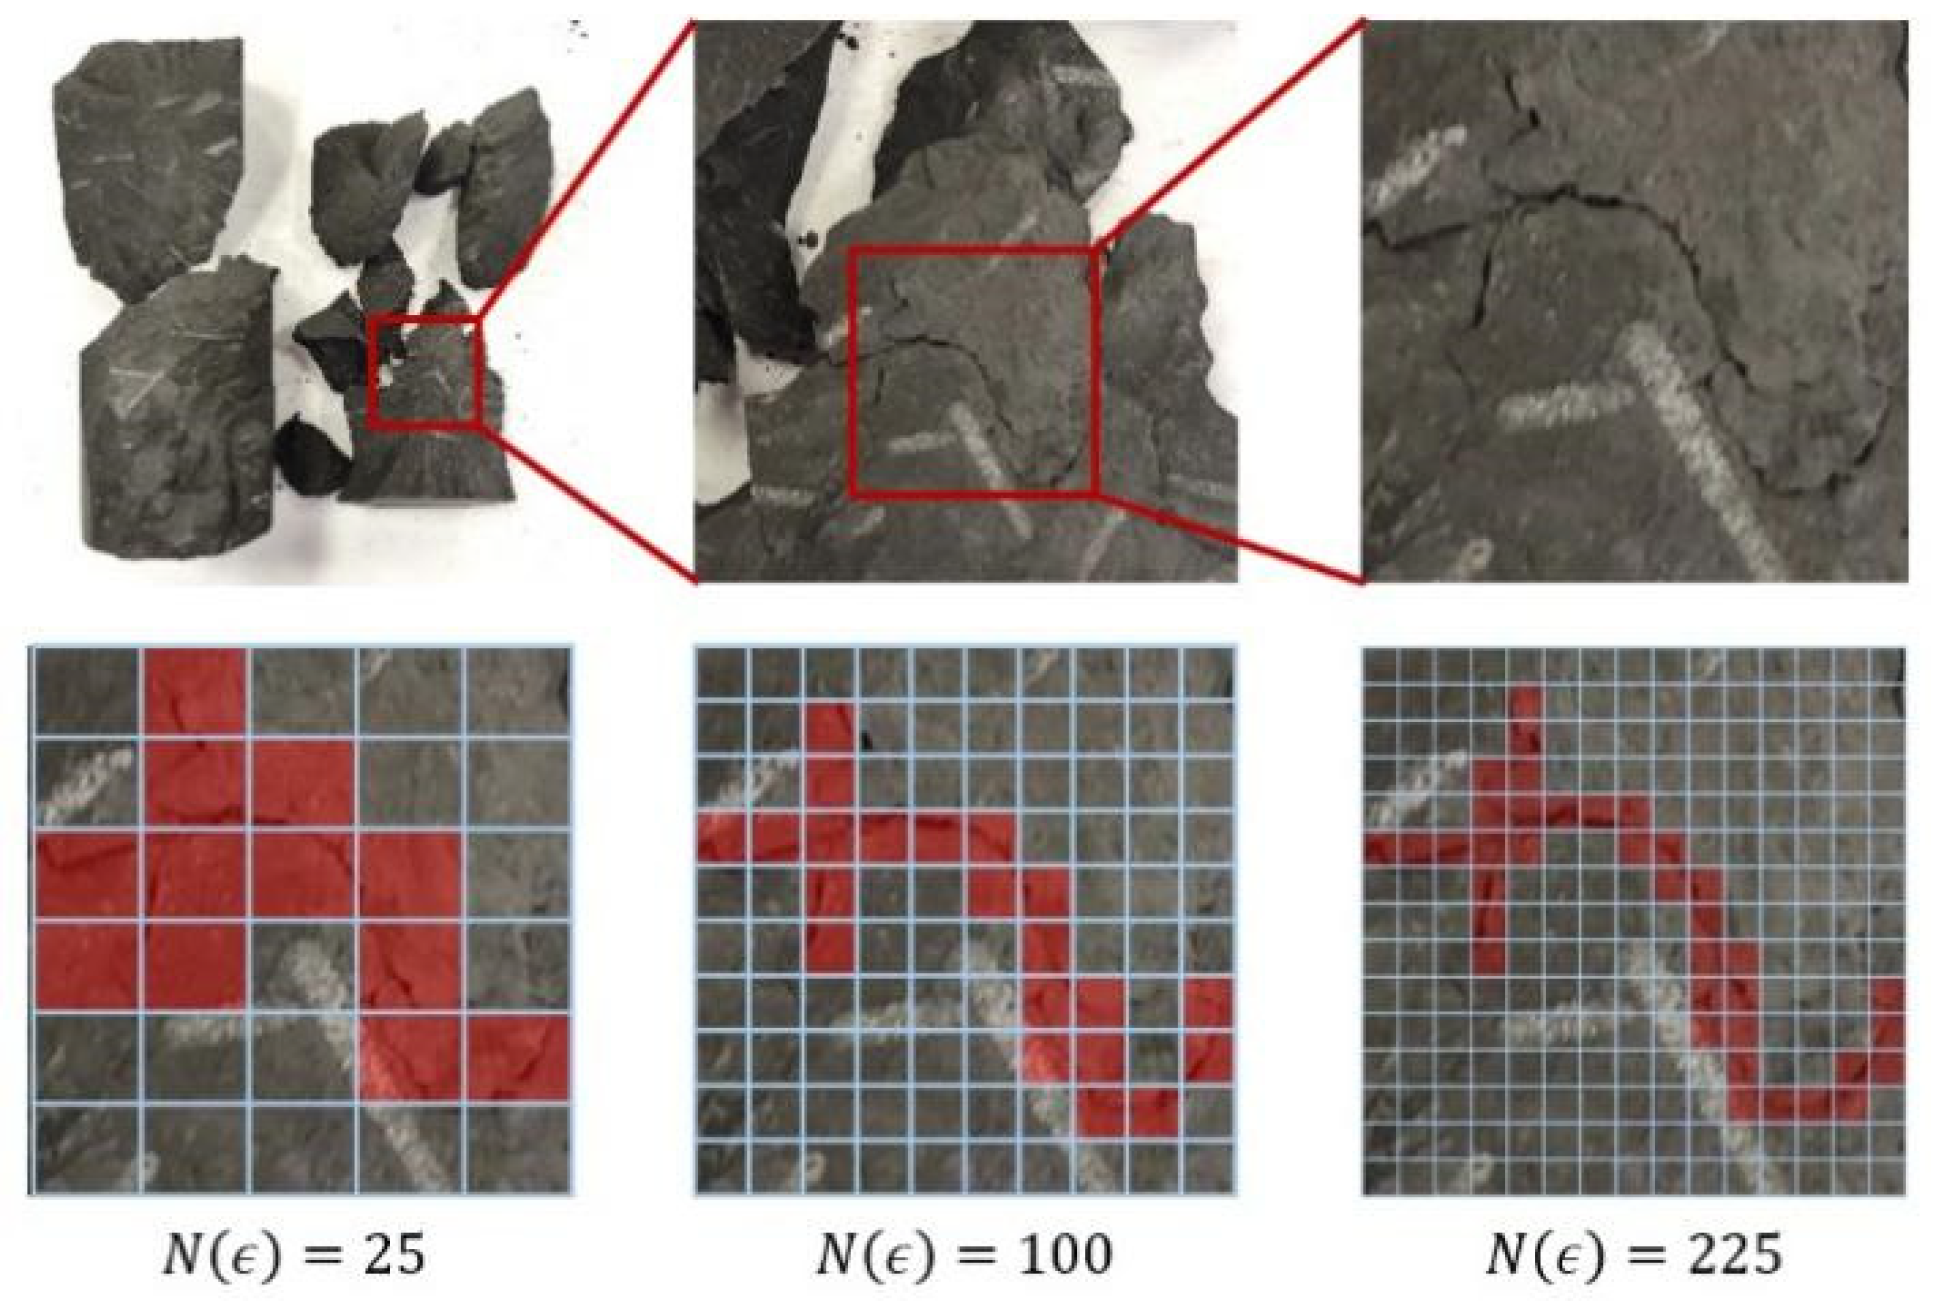
The fractal dimension is computed using the box-counting method, which is well suited for describing complex geometries exhibiting self-similar characteristics. The calculation follows a standardized workflow. First, the consecutive two-dimensional CT slice sequence (slice thickness: 0.625 mm) is preprocessed to accurately extract fracture pixels. A three-dimensional cubic grid system is then constructed, and the cube size () is progressively reduced. For each , the number of cubes that contain fractures is counted. The fractal dimension is obtained by fitting the slope of the linear relationship between and , as shown in Equation (2) (Figure 14):
Figure 14.
Schematic illustration of fracture identification and fractal-dimension calculation using the box-counting method. The red part in the figure represents the portion that is included in the calculation each time.
To ensure computational accuracy and comparability, all specimens were processed using a uniform pixel resolution (15 μm/pixel) and an identical cube-size range (1–512 pixels). Validation calculations performed on standard geometric objects (e.g., planes and cylinders) indicate that the relative error is less than 2.3%, satisfying engineering accuracy requirements. To further verify the robustness of the results, the perimeter–area method was also applied for cross-validation. The fractal dimensions obtained by the two methods exhibit a correlation coefficient of 0.94, demonstrating that the box-counting approach is well suited for characterizing fracture-network complexity.
3.3.1. Coupled Relationships Between Fracture Complexity, Lithology, and Fracturing Fluid
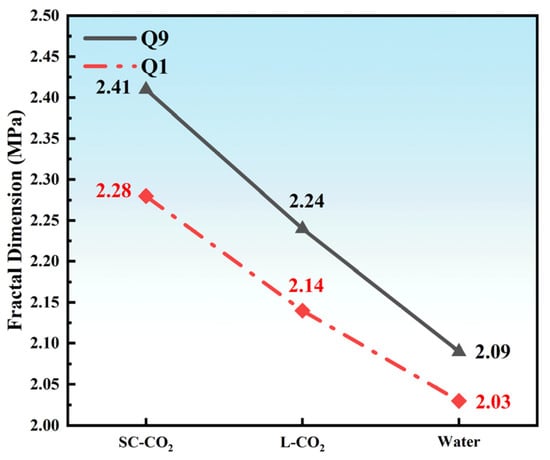
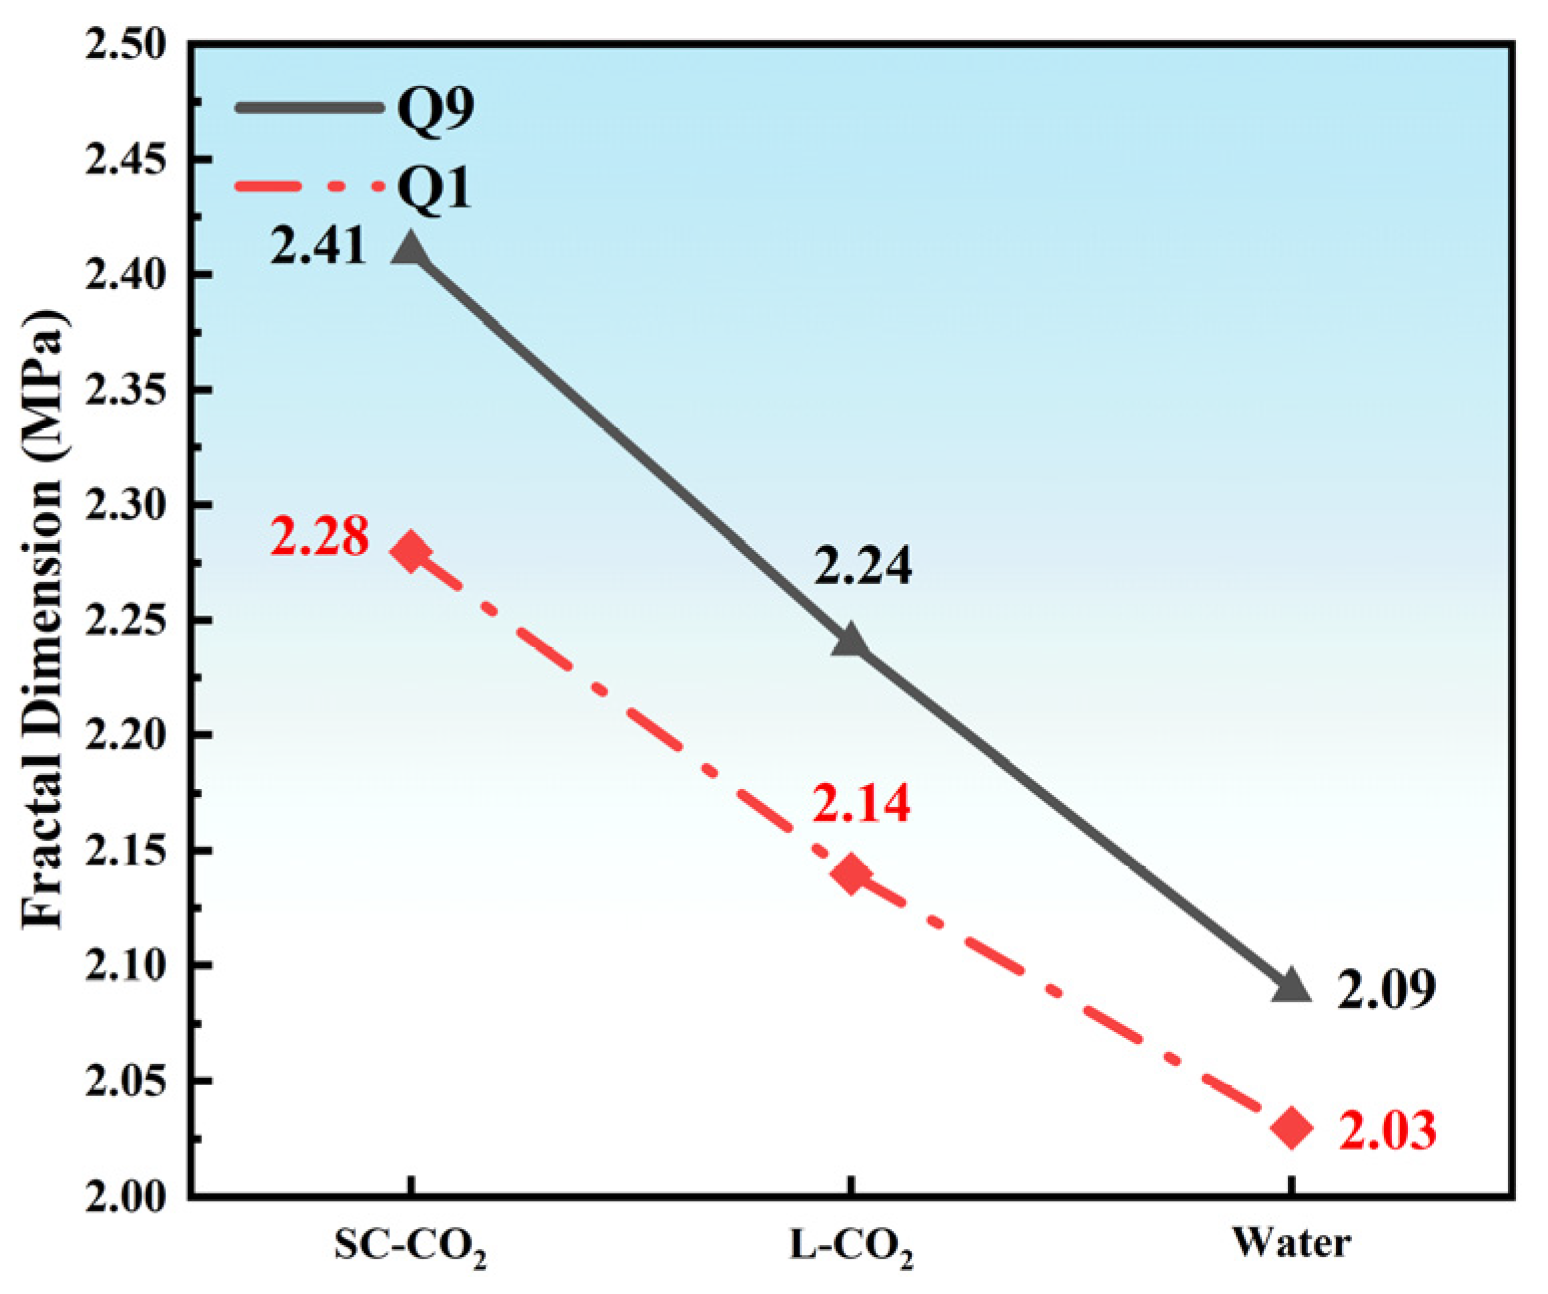
Fractal-dimension analysis indicates that fracture complexity differs markedly among lithologies and fracturing fluids (Figure 15). Under SC-CO2 fracturing, the Q9 shale exhibits a higher () value (2.41) than the Q1 shale (2.28). This trend is highly consistent with the CT-based three-dimensional reconstructions: owing to its high clay-mineral content (50–60%) and densely developed bedding (50–70 laminations per meter), the Q9 shale develops a complex fracture network with multi-level branching and tortuous geometry under SC-CO2 stimulation.
Figure 15.
Fractal dimension under different fracturing fluids.
A more detailed examination of the mechanisms by which fluid type influences fracture complexity shows that the average obtained under SC-CO2 fracturing is 12.31–15.31% higher than that under water fracturing and 6.54–7.59% higher than that under liquid CO2. These differences primarily stem from the distinct physicochemical properties of the three fluids. SC-CO2, with its ultra-low viscosity and relatively high diffusion coefficient, can effectively invade nanopores and pre-existing microfractures; by reducing fracture surface energy and promoting stress corrosion at crack tips, it induces multidirectional fracture propagation. Liquid CO2 has a slightly higher viscosity and weaker diffusivity than SC-CO2, yet it can still facilitate fracture growth through phase-change-induced volumetric expansion. In contrast, water exhibits higher viscosity and can hydrate clay minerals, strengthening interlaminar bonding and causing fractures to propagate preferentially along the maximum principal-stress direction, thereby significantly reducing fracture-network complexity.
From a micro-mechanistic perspective, SC-CO2 exhibits distinctive supercritical effects during fracture propagation. When it penetrates micro- to nano-scale pores, the interfacial tension approaches zero and the contact angle decreases markedly, enabling effective wetting of fracture surfaces and reducing the energy barrier required for fracture growth. Moreover, SC-CO2 has strong affinity for shale organic matter and can dissolve part of the organic phase, thereby weakening interparticle cementation; this chemical effect is particularly pronounced in the Q1 shale, which is characterized by higher organic-matter content. In contrast, during water-based fracturing, hydration of clay minerals can lead to the formation of a hydration film on fracture surfaces, increasing the friction coefficient along fracture planes and, consequently, suppressing the development of branched fractures.
3.3.2. Controlling Mechanisms of Stress Conditions on Fracture Complexity
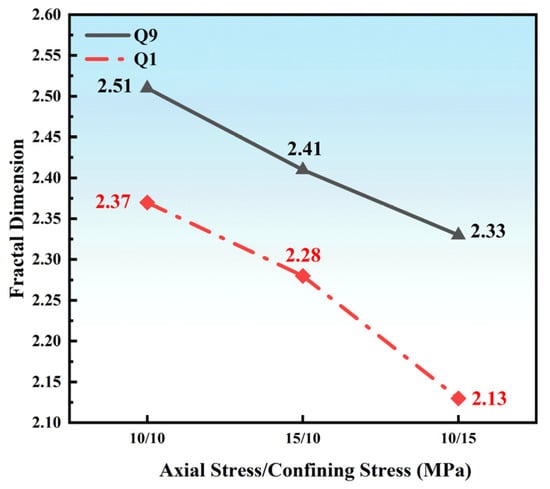
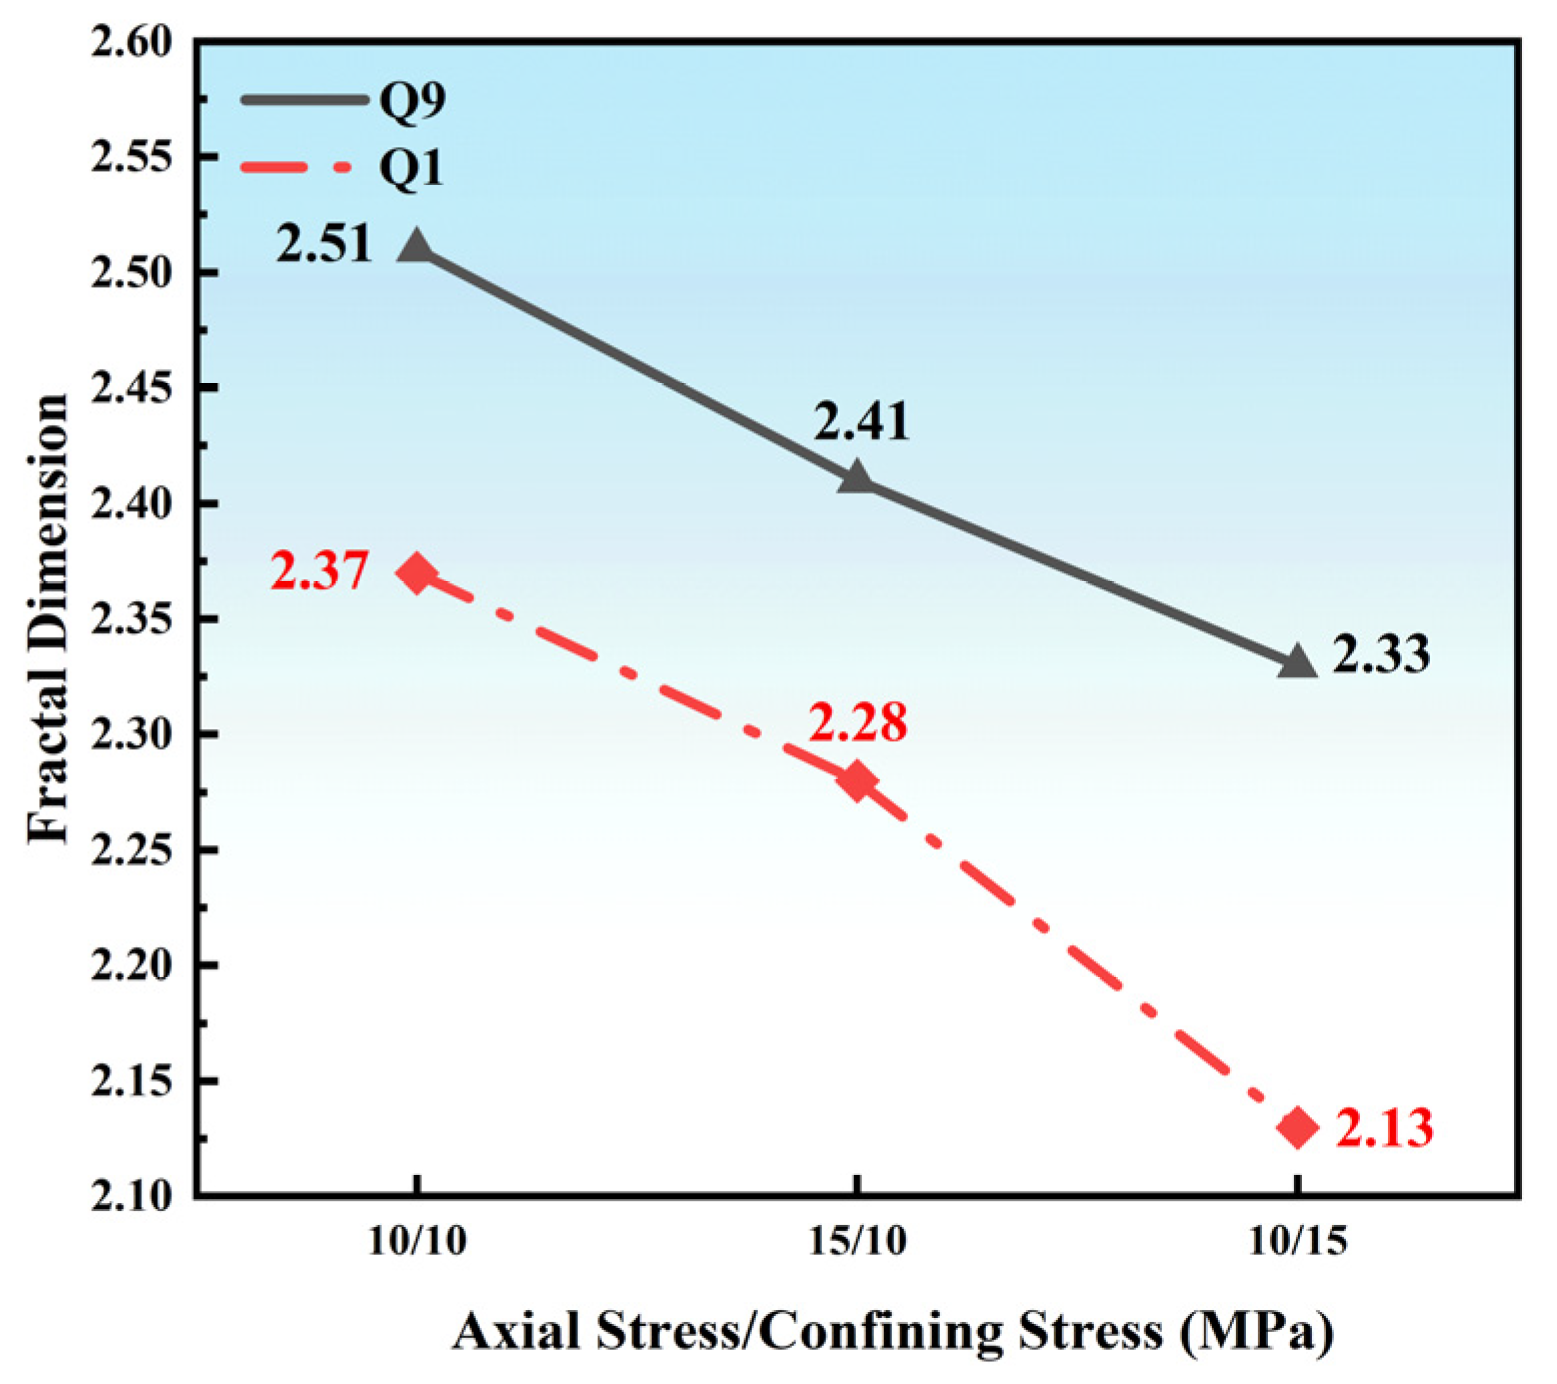
The mechanisms by which stress conditions affect fracture complexity are both significant and multifaceted. Under the condition of axial stress < confining stress, shale specimens generally exhibit higher values (e.g., = 2.37 for the Q1 member), indicating that an asymmetric stress field promotes the development of a multidimensional fracture system. CT observations show that, under this stress state, fractures frequently cut across bedding planes and connect with pre-existing natural fractures, forming a spatially three-dimensional network (Figure 16).
Figure 16.
Fractal dimension under different stress conditions.
From a mechanical standpoint, when the axial stress is lower than the confining stress, the rock is in a “potentially tensile” stress state in which confinement along the minimum principal-stress direction is relatively weaker, making fractures more prone to deflection and branching. Particularly in bedded shales, this stress state can markedly reduce the energy required for fractures to cross bedding planes, thereby promoting stepwise propagation between laminae. In contrast, under axial stress = confining stress or axial stress > confining stress, the stress field is either more uniform or exhibits stronger directional dominance. Consequently, fracture growth becomes more strongly constrained by the maximum principal-stress direction, the values decrease accordingly (to 2.18 and 2.13 for the Q1 member, respectively), and fracture morphologies tend to become simpler.
The responses to stress conditions differ markedly among lithologies. The () values of the Q1 shale vary only slightly across different stress states, further indicating that its relatively more homogeneous fabric and higher brittleness constrain the enhancement of fracture complexity. In contrast, the Q9 shale maintains a comparatively high () value (2.31) even under axial stress > confining stress. This behavior is closely associated with its densely developed bedding and higher clay content, whereby bedding planes serve as natural weak pathways that facilitate fracture deflection.
3.3.3. Analysis of Fracture Concentration and Spatial Distribution Characteristics
In addition to fractal dimension, the fracture concentration coefficient () was also employed to evaluate the spatial uniformity of fracture distribution. The value is derived from the standard deviation of the fracture volume density distribution; a higher indicates that fractures are more concentrated in localized regions and that network connectivity is poorer. The results show that the Q9 shale under SC-CO2 fracturing exhibits the lowest (0.18), indicating a relatively uniform fracture distribution and good connectivity. In contrast, the Q1 shale under water fracturing has the highest (0.42), reflecting localized fracture concentration and limited branching.
By integrating the fractal dimension and the concentration coefficient, a comprehensive index of fracture complexity was constructed (CI = ). The CI value simultaneously accounts for geometric complexity and spatial uniformity of fracture distribution, thereby providing a more holistic assessment of fracture system quality. In this study, the Q9 shale under SC-CO2 fracturing exhibits the highest CI value (13.39), whereas the Q1 shale under water fracturing shows the lowest value (4.88), further confirming the advantage of SC-CO2 in low-permeability, high-clay-content reservoirs.
To verify the relationship between fractal dimension and stimulation effectiveness, regression analysis was performed between and the post-fracturing gas permeability enhancement factor (). The results show a significant positive correlation (R2 = 0.86), indicating that higher fracture complexity leads to greater permeability improvement.
Further analysis of the relationship between breakdown pressure and fracture complexity reveals a negative correlation between and breakdown pump pressure (R2 = 0.79), confirming that complex fracture networks are more readily generated under lower breakdown-pressure conditions. This phenomenon can be interpreted in terms of energy dissipation: at lower breakdown pressures, fracture propagation proceeds relatively slowly, allowing more energy to be consumed in the formation of branched fractures rather than being concentrated into rapid extension of a single dominant fracture. Conversely, at higher breakdown pressures, energy is released more abruptly, promoting fast propagation of the main fracture and suppressing branching.
A fracture-complexity prediction model was further established through multivariate regression analysis, as shown in Equation (3):
where is the normalized breakdown pressure, denotes the fluid diffusivity class, represents the clay content, and is the brittleness index. The model yields a coefficient of determination of R2 = 0.89, indicating good predictive capability for fracture complexity under varying conditions.
For the developed model, numerical prediction and validation were carried out by incorporating the mechanical testing data and compositional analysis results. The validation results are presented in Table 3.
Table 3.
Validation results for the fracture complexity prediction model.
Overall, the validation results indicate that the model predictions of fracture complexity—represented by the fractal dimension ()—agree well with the measured values and can reliably reproduce the variations in complexity across different operating conditions. Taking the Q9 shale as an example, the predicted () values are 2.403, 2.235, and 2.072, which are highly consistent in magnitude with the corresponding measured values of 2.41, 2.18, and 2.12. The model also correctly captures the ordering of “SC-CO2 highest, liquid CO2 intermediate, and water lowest.” Moreover, for different lithologies under SC-CO2 fracturing, the predicted fractal dimensions for the Q9 and Q1 members are 2.403 and 2.236, respectively, which is consistent with the CT-based conclusion that Q9 exhibits higher complexity whereas Q1 is lower. These results demonstrate that the model responds reasonably to key controlling factors, such as fluid diffusivity and breakdown pressure.
4. Discussion and Analysis
4.1. Comparison of Fracture Characteristics Between the Q1 and Q9 Shale Members
Based on CT-derived three-dimensional reconstructions and quantitative fractal-dimension analyses, the Q1 and Q9 shale members exhibit pronounced differences in fracture morphology, spatial distribution, and overall complexity. These differences are primarily governed by variations in mineral composition, bedding architecture, and mechanical properties.
Under SC-CO2 fracturing, the Q9 shale develops the most complex fracture network, with a fractal dimension of 2.41. CT images show that the fractures are characterized by multi-level branching, with frequent deflection along densely developed bedding planes (50–70 laminations per meter), ultimately forming a three-dimensionally connected network. The mean fracture aperture is 28.5 μm, and the fracture density reaches 12.3 fractures/cm3, indicating excellent spatial propagation and connectivity. This high complexity is mainly attributed to the high clay-mineral content (50–60%) and dense bedding structure, which provide abundant weak-plane pathways for fracture growth. Moreover, the supercritical properties of SC-CO2 enable effective wetting of clay-mineral surfaces, reducing resistance to fracture propagation and facilitating multidirectional extension.
In contrast, the Q1 shale exhibits a relatively lower fracture complexity, with a fractal dimension of 2.28. The fracture pattern is dominated by a single main fracture with limited branching; the fracture density is 7.2 fractures/cm3 and the mean aperture is 22.6 μm. The intermediate clay content (40–50%) and high organic-matter content (TOC 4–6%) impart a pronounced transitional behavior between ductile and brittle deformation. Although fracture growth is strongly influenced by bedding planes, the relatively strong cementation between laminae constrains fracture deflection, making it difficult to develop a highly complex spatial network.
From an energy-dissipation perspective, the observed differences in fracture complexity between the two members reflect distinct energy partitioning mechanisms during failure. The Q9 shale releases energy progressively through the formation of multi-level branched fractures, whereas the Q1 shale tends to release energy in a more concentrated manner through rapid propagation of a dominant main fracture. This contrast directly influences the stimulated reservoir volume and the overall effectiveness of fracturing treatments.
4.2. Effects of Fluid Type on Hydraulic Fracturing Performance
Different fracturing fluids exhibit markedly different mechanisms and stimulation outcomes in shale reservoirs, with their effects governed by fluid physical properties, chemical interactions, and fluid–rock coupling processes.
SC-CO2 fracturing demonstrates distinct advantages in shale stimulation, and the unique physicochemical properties under supercritical conditions (10 MPa, 60 °C) are crucial for generating complex fracture networks. With ultra-low viscosity and near-zero interfacial tension, SC-CO2 can effectively invade nanopores (10–100 nm) and establish a relatively uniform pore-pressure field at fracture tips. Experimental results show that the breakdown pressure under SC-CO2 fracturing is 10–15% lower than that under water fracturing, while the fractal dimension increases by approximately 12%. Mechanistically, SC-CO2 promotes the formation of complex fractures mainly through two pathways: (i) reducing fracture surface energy and thereby lowering the energy barrier for fracture propagation, and (ii) dissolving organic matter and certain carbonate minerals, which weakens cementation between mineral grains—an effect that is particularly pronounced in the organic-rich Q1 shale.
The performance of liquid CO2 fracturing lies between that of SC-CO2 and water. Its breakdown pressure is 7–10% higher than that of SC-CO2, and its fractal dimension is approximately 6% lower. Liquid CO2 (5 MPa, 20 °C) has a certain diffusion capacity and can penetrate micron-scale pores; however, its higher viscosity limits its ability to infiltrate nanopores. Liquid CO2 facilitates fracture propagation through phase-change-induced volumetric expansion, producing rapid expansion during pressure release that helps activate pre-existing microfractures. Nevertheless, due to its limited diffusivity, it is less capable of forming the uniform pore-pressure distribution characteristic of SC-CO2, resulting in relatively lower fracture complexity.
Water-based fracturing performs relatively poorly in shale reservoirs, exhibiting the highest breakdown pressure and the lowest fractal dimension. Hydration of clay minerals is a key factor controlling its stimulation effectiveness. Experiments indicate that after water injection, swelling clays such as montmorillonite undergo hydration-induced expansion, which can increase interlaminar bonding strength by 15–20% over the short term, thereby elevating resistance to fracture propagation. Moreover, the non-uniform distribution of swelling stresses causes fractures to preferentially propagate along the maximum principal-stress direction, suppressing the formation of branched fractures. In addition, the higher viscosity of water severely limits its penetration into nanopores, making it difficult to effectively connect isolated pores and natural microfractures.
In terms of stimulation outcome, the more uniform aperture distribution produced by SC-CO2 fracturing is favorable for maintaining long-term fracture conductivity, whereas the main-fracture-dominated system generated by water fracturing is more susceptible to conductivity loss due to proppant embedment or fines migration. This contrast has important implications for the long-term production performance of shale reservoirs.
4.3. CT-Based Fracability Evaluation
Based on three-dimensional fracture information obtained from CT scanning, a comprehensive fracability evaluation model was established by integrating rock physical properties and fracturing operational parameters, thereby providing a quantitative basis for optimizing fracturing design in shale reservoirs.
The model adopts the fracture complexity index (FCI) as the core evaluation metric and jointly considers the fracture fractal dimension, the spatial uniformity of fracture distribution, and the characteristics of aperture distribution, as shown in Equation (4):
where is the fractal dimension, is the fracture concentration coefficient, is the fracture height, and is the coefficient of variation of the aperture distribution.
The model was applied to evaluate the fracability of the Q1 and Q9 shale members. The calculated results for different experimental groups are listed in Table 4. The results show that the Q9 member has a higher FCI value (8.92), whereas the Q1 member exhibits a lower value (4.43). This evaluation is highly consistent with the experimentally observed stimulation performance, thereby validating the reliability of the proposed model.
Table 4.
Selected CT-derived parameter calculation results for experimental groups.
Further analysis of favorable fracturing conditions for each interval indicates that the Q9 shale performs best under SC-CO2 fracturing and the stress state of axial stress < confining stress, with its FCI increasing by approximately 35% relative to the baseline condition. In contrast, the Q1 shale requires optimization of injection parameters and stress conditions to overcome its intrinsic petrophysical constraints.
Correlation analyses between CT-derived fracture parameters and reservoir properties demonstrate that the initial pore structure exerts a strong influence on the final fracture morphology. The initial pore fractal dimension obtained from pre-test CT scans shows a positive correlation with the post-fracturing fracture fractal dimension (R2 = 0.83), suggesting a potential pathway for predicting reservoir fracability prior to stimulation.
The proposed integrated decision model incorporates multiple factors—including mineral composition, mechanical parameters, in situ stress conditions, and fluid type—and can provide tailored parameter-optimization strategies for shale intervals. For example, for the clay-rich Q9 member, SC-CO2 is recommended as the fracturing fluid, with an injection rate of approximately 4 mL/min to leverage its strong penetration capability and activate bedding planes, whereas for the more brittle Q1 member, adjusting stress conditions can be used to promote the development of a more complex fracture network.
To provide a clear comparison of the three fracturing fluids, key performance indicators based on the experimental results are summarized in Table 5.
Table 5.
Comparison of hydraulic fracturing performance for different fluid types (based on Q9 shale results).
5. Conclusions
This study systematically investigated fracture propagation behavior and fracability of the Q1 and Q9 shale members by integrating multi-fluid triaxial fracturing experiments with CT scanning. The main conclusions are as follows:
(1) Fracture complexity in different shale intervals is primarily controlled by mineral composition and bedding architecture, and a single brittleness index cannot adequately characterize stimulation effectiveness. Under SC-CO2 fracturing, the Q9 shale exhibits the highest fractal dimension ( = 2.41) and a fracture density of 12.3 fractures/cm3, whereas the Q1 shale shows the lowest fractal dimension ( = 2.28). Fracture complexity is positively correlated with the ratio of brittleness index to clay content (R2 = 0.91).
(2) The fracturing fluid type exerts a significant influence on breakdown pressure and fracture morphology, with SC-CO2 delivering the most effective stimulation in shale. Compared with water, SC-CO2 reduces breakdown pressure by 10–15% and increases the fractal dimension by approximately 12%; liquid CO2 yields breakdown pressures 7–10% higher than SC-CO2 and a fractal dimension about 6% lower. SC-CO2 fracturing produces a more uniform fracture aperture distribution, whereas water fracturing results in a more concentrated aperture distribution. The low viscosity and high diffusivity of SC-CO2 are key to forming complex fracture networks.
(3) Stress state and injection parameters markedly regulate fracture propagation across shale intervals. Under axial stress < confining stress, the fractal dimension of the Q1 shale increases to 2.37. The injection-rate effect on the more permeable Q9 shale follows a “V-shaped” trend, with the highest fractal dimension ( = 2.41) achieved at an intermediate injection rate of 4 mL/min. For the lower-permeability Q1 shale, increasing the injection rate from 2 to 6 mL/min raises the breakdown pressure from 31.09 MPa to 38.72 MPa, and fracture morphology tends to become simpler.
(4) The CT-based fracture complexity index (FCI) model enables quantitative prediction of stimulation outcomes and provides a new approach for shale fracability evaluation. By integrating fractal dimension, fracture concentration, fracture height, and aperture distribution, the model yields predictions consistent with observed fracturing performance for the Q1 and Q9 members (R2 = 0.94). Moreover, the initial pore fractal dimension derived from pre-test CT scans is significantly correlated with post-fracturing fracture complexity (R2 = 0.83), offering a robust basis for pre-fracturing fracability assessment.
(5) For high-clay shale intervals such as the Q9 member, SC-CO2 fracturing is strongly recommended over water or liquid CO2. The ultra-low viscosity and high diffusivity of SC-CO2 reduce breakdown pressure by 11.91% (from 36.83 MPa for water to 32.91 MPa) and increase fracture complexity by approximately 12% in terms of fractal dimension. An intermediate injection rate of 4 mL/min optimizes the balance between pressure accumulation and fluid diffusion, yielding the most complex fracture network ( = 2.41). For lower-permeability, more brittle shales such as the Q1 member, higher injection rates (6 mL/min) lead to simpler fractures and elevated breakdown pressure; therefore, moderate injection rates combined with an asymmetric stress field (axial stress < confining stress) should be adopted to enhance fracture complexity. These quantitative findings provide direct guidelines for field-scale fracturing fluid selection, injection rate optimization, and stress management in continental shale reservoirs.
Author Contributions
Conceptualization, Y.S. and N.Y.; methodology, Z.P.; software, Y.S. and N.Y.; validation, Y.S., N.Y. and Z.L.; formal analysis, Z.P.; investigation, N.Y.; resources, Y.S.; data curation, N.Y.; writing—original draft preparation, Y.S. and N.Y.; writing—review and editing, Y.S. and N.Y.; visualization, B.H.; supervision, B.H. and H.J.; project administration, B.H.; funding acquisition, Y.S. All authors have read and agreed to the published version of the manuscript.
Funding
This work was supported by the National Natural Science Foundation of China (U24B6004, 52574005); the First-Class Discipline Collaborative Innovation Program of Heilongjiang Province (LJGXCG2024-F02); and The Key Research and Development Program of Heilongjiang Province (2024ZX09C01).
Data Availability Statement
Data is contained within the article.
Conflicts of Interest
Author Haiqing Jiang was employed by the company Daqing Xinchen Oil Field Technical Service Ltd. The remaining authors declare that the research was conducted in the absence of any commercial or financial relationships that could be construed as a potential conflict of interest.
References
- Middleton, R.S.; Carey, J.W.; Currier, R.P.; Hyman, J.D.; Kang, Q.; Karra, S.; Jiménez-Martínez, J.; Porter, M.L.; Viswanathan, H.S. Shale gas and non-aqueous fracturing fluids: Opportunities and challenges for supercritical CO2. Appl. Energy 2015, 147, 500–509. [Google Scholar] [CrossRef] [Scilit]
- Mikhalov, V.; Patzek, T.W.; Makhnenko, R.Y. Poroelastic response of shale to supercritical CO2 injection. J. Geophys. Res. Solid Earth 2019, 124, 13240–13258. [Google Scholar]
- He, W.Y.; Liu, B.; Zhang, J.Y.; Bai, L.H.; Tian, S.S.; Chi, Y.A. Geological characteristics and key scientific and technological problems of Gulong shale oil in Songliao Basin. Earth Sci. 2023, 48, 49–62. [Google Scholar]
- Kizaki, A.; Tanaka, H.; Ohashi, K.; Sakaguchi, K.; Matsuki, K. Hydraulic fracturing in Inada granite and Ogino tuff with super critical carbon dioxide. In ISRM International Symposium-Asian Rock Mechanics Symposium; ISRM: Lisbon, Portugal, 2012; p. ISRM-ARMS7-2012-109. [Google Scholar]
- Lu, Y.; Liao, Y.; Tang, J.; Zhang, X.; Han, S.; Ling, Y. Experimental study on fracture initiation pressure and morphology in shale using supercritical CO2 fracturing. J. China Coal Soc. 2018, 43, 175–180. [Google Scholar] [CrossRef]
- Zhu, Y. Supercritical Carbon Dioxide Fracturing and Adsorption Behavior of Typical Shales from Chongqing. Master’s Thesis, Shanghai University, Shanghai, China, 2016. [Google Scholar]
- Zhang, X.; Lu, Y.; Tang, J.; Zhou, Z.; Liao, Y. Experimental study on fracture initiation and propagation in shale using supercritical carbon dioxide fracturing. Fuel 2017, 190, 370–378. [Google Scholar] [CrossRef] [Scilit]
- Birkholzer, J.T.; Morris, J.; Bargar, J.R.; Brondolo, F.; Cihan, A.; Crandall, D.; Deng, H.; Fan, W.; Fu, W.; Fu, P.; et al. A new modeling framework for multi-scale simulation of hydraulic fracturing and production from unconventional reservoirs. Energies 2021, 14, 641. [Google Scholar] [CrossRef] [Scilit]
- Zhang, N.; Luo, Z.; Chen, Z.; Liu, F.; Liu, P.; Chen, W.; Wu, L.; Zhao, L. Thermal–hydraulic–mechanical–chemical coupled processes and their numerical simulation: A comprehensive review. Acta Geotech. 2023, 18, 6253–6274. [Google Scholar] [CrossRef] [Scilit]
- Li, W.; Soliman, M.; Han, Y. Microscopic numerical modeling of Thermo-Hydro-Mechanical mechanisms in fluid injection process in unconsolidated formation. J. Pet. Sci. Eng. 2016, 146, 959–970. [Google Scholar] [CrossRef] [Scilit]
- Feng, G.; Kang, Y.; Sun, Z.D.; Wang, X.C.; Hu, Y.Q. Effects of supercritical CO2 adsorption on the mechanical characteristics and failure mechanisms of shale. Energy 2019, 173, 870–882. [Google Scholar] [CrossRef] [Scilit]
- Yi, L.P.; Jia, M.; Li, X.G.; Yang, Z.Z. Transient wellbore temperature and pressure calculation model for supercritical CO2 jet fracturing. Energy Sources Part A Recovery Util. Environ. Eff. 2021, 43, 1396–1411. [Google Scholar] [CrossRef] [Scilit]
- Li, X.; Qin, Y.; Liu, Z.; Zhu, J.; Yang, Z.; Xie, S.; Jin, X.; Gao, C. Physical property law of coalbed methane well fracturing development enhanced by microwave. Spec. Oil Gas Reserv. 2024, 31, 70. [Google Scholar]
- Ao, X.; Lu, Y.; Tang, J.; Chen, Y.; Li, H. Investigation on the physics structure and chemical properties of the shale treated by supercritical CO2. J. CO2 Util. 2017, 20, 274–281. [Google Scholar] [CrossRef] [Scilit]
- Pan, Y.; Hui, D.; Luo, P.; Zhang, Y.; Sun, L.; Wang, K. Experimental investigation of the geochemical interactions between supercritical CO2 and shale: Implications for CO2 storage in gas-bearing shale formations. Energy Fuels 2018, 32, 1963–1978. [Google Scholar] [CrossRef] [Scilit]
- Hazra, B.; Vishal, V.; Sethi, C.; Chandra, D. Impact of supercritical CO2 on shale reservoirs and its implication for CO2 sequestration. Energy Fuels 2022, 36, 9882–9903. [Google Scholar] [CrossRef] [Scilit]
- Wu, L.; Hou, Z.; Xie, Y.; Luo, Z.; Xiong, Y.; Cheng, L.; Wu, X.; Chen, Q.; Huang, L. Fracture initiation and propagation of supercritical carbon dioxide fracturing in calcite-rich shale: A coupled thermal-hydraulic-mechanical-chemical simulation. Int. J. Rock Mech. Min. Sci. 2023, 167, 105389. [Google Scholar] [CrossRef] [Scilit]
- Zhang, C.P.; Cheng, P.; Ranjith, P.G.; Lu, Y.Y.; Zhou, J.P. A comparative study of fracture surface roughness and flow characteristics between CO2 and water fracturing. J. Nat. Gas Sci. Eng. 2020, 76, 103188. [Google Scholar] [CrossRef] [Scilit]
- Sun, Y.X.; Wang, X.L.; Meng, Y.Z.; Tian, J.L.; Lu, C.H. Fracture propagation mechanism and application of supercritical CO2 fracturing in shale: A review. Pet. Sci. 2025, 22, 1625–1652. [Google Scholar] [CrossRef] [Scilit]
- Suo, Y.; Yang, N.; Gao, J.; Lin, Q.; Zhou, L.; Jiang, H.; Zhu, Y.; Pan, Z.; Huang, B. Study on the mechanical damage characteristics of gulong shale oil with different types of fracturing fluids. Environ. Earth Sci. 2025, 84, 681. [Google Scholar] [CrossRef] [Scilit]
- Li, N.; Jin, Z.; Wang, H.; Yang, P.; Zou, Y.; Zhou, T. Micro-mechanical properties of shale due to water/supercritical carbon dioxide-rock interaction. Pet. Explor. Dev. 2023, 50, 1001–1012. [Google Scholar] [CrossRef] [Scilit]
- Wang, H.T.; Zuo, L.; Guo, Y.T. Effect of carbon dioxide on the degradation of shale mechanical properties. Sci. Technol. Eng. 2021, 21, 12536–12542. [Google Scholar]
- Du, B.G.; Zhang, G.Q.; Zhou, D.W.; Qu, L.; Qiu, R.Y.; Fan, Z.Y. Effect of microscopic damage on tensile failure of laminated shale after CO2-H2O treatment. Rock Soil Mech. 2024, 45, 3. [Google Scholar]
- Zou, Y.; Li, Y.; Li, S. Influence of CO2 pre-injection on fracture mophology and the petrophysical properties in shale fracturing. Nat. Gas Ind. 2021, 41, 83–94. [Google Scholar]
- Li, J.; Wang, H.; Zhang, Q. Numerical simulation of supercritical CO2 proppant transport in complex fracture networks considering adsorption effect. J. Pet. Sci. Eng. 2022, 215, 110689. [Google Scholar]
- Ishida, T.; Nagaya, Y.; Inui, S.; Aoyagi, K.; Nara, Y.; Chen, Y.; Chen, Q.; Nakayama, Y. AE monitoring of hydraulic fracturing experiments conducted using CO2 and water. In ISRM EUROCK; ISRM: Lisbon, Portugal, 2013; p. ISRM–EUROCK-2013-149. [Google Scholar]
- Wang, H.; Li, G.; Zheng, Y.; Kamy, S.; Shen, Z.; Yang, B.; Shi, L. Research status and prospects of supercritical CO2 fracturing technology. Acta Pet. Sin. 2020, 41, 116. [Google Scholar]

Disclaimer/Publisher’s Note: The statements, opinions and data contained in all publications are solely those of the individual author(s) and contributor(s) and not of MDPI and/or the editor(s). MDPI and/or the editor(s) disclaim responsibility for any injury to people or property resulting from any ideas, methods, instructions or products referred to in the content. |
© 2026 by the authors. Licensee MDPI, Basel, Switzerland. This article is an open access article distributed under the terms and conditions of the Creative Commons Attribution (CC BY) license.