


Abstract
This study explores the interconnection between the variables of ChatGPT usage, energy consumption, water consumption, and carbon dioxide CO2 emissions. A new integer and fractional order model using the Caputo derivative is proposed to comprehend the long-term dependencies of these variables. Boundedness, and global and local stability are examined for the fractional order model. The equilibrium points of these variables are shown to determine the stability of the model. The Runge–Kutta 7 numerical method is employed for the integer order model, whereas the semi-implicit linear interpolation (L1) method is used for the fractional order model. The parameter sensitivity is conducted on the system’s parameters to understand the variables’ impact by varying the relevant parameters for the system. To increase the efficacy of our analysis, we used machine learning approaches to model and predict the dynamics of CO2 emissions, energy and water consumption, and ChatGPT usage. The Prophet ML model stood out among the other methods because it is adept at identifying long-term growth trends, seasonal changes, and the impact of outside variables in intricate time-series data. It is extremely beneficial for research centered on sustainability, where accurate projections are essential for wellinformed decision-making, because it can produce robust, interpretable forecasts against missing values and outliers. Using the Prophet ML model, our research guarantees precise and expandable predictions and provides valuable information that can direct tactics to balance environmental sustainability and technological progress.
1. Introduction
Mathematical modeling is one of the most effective tools for deciphering and interpreting complicated real-world phenomena. Scientists can precisely represent dynamic systems using differential and integral equations, matrices, and linear programming. One of the most useful of them for describing the behavior of systems that change over time is differential equations. In recent years, mathematical modeling has been incorporated into interdisciplinary fields to address urgent economic and environmental issues, marking an exciting shift. This change has made new fields in biology, chemistry, physics, engineering, and environmental sciences. Real-world complexity is reduced to equations that can be simulated, examined, and evaluated through mathematical abstraction, providing insightful information that supports well-informed, fact-based decision-making [1,2]. Mathematical systems increasingly influence our understanding and behavior toward our environment, from predicting ecosystem reactions to assessing public health consequences and refining forest conservation techniques [3].
Calculus traditionally deals with integrals and derivatives of integer orders. However, fractional calculus emerged as a result of the curiosity about what would happen if we expanded this idea to non-integer or fractional orders [4]. The concept originated in a letter from Leibniz and L’Hospital in 1695, in which they discussed the meaning of a derivative of order . As Leibniz once said, “One day, useful consequences will be drawn from this apparent paradox.” Lacroix and later Riemann, Liouville, Caputo, and other mathematicians formalized the definitions that currently form the basis of fractional calculus. The sophisticated behavior of systems where traditional calculus fails to grasp is now captured by fractional derivatives, particularly those specified by the Riemann-Liouville, Caputo, Caputo-Fabrizio, and Atangana-Baleanu operators [5,6]. Consequently, fractional calculus has become a potent framework for simulating physical processes representing history, memory, and complexity. Recent studies have also focused on refining classical integral inequalities within the framework of fractional calculus [7].
Artificial Intelligence is rapidly transforming industries by enabling systems to perform tasks that require human-like intelligence, such as learning, reasoning, and language processing. Among these, ChatGPT represents a prominent advancement of conversational AI, which is widely adopted for its ability to generate coherent and context-aware responses. However, the growing reliance on such large-scale models raises important concerns about the environmental impact, particularly in energy consumption, water consumption, and CO2 emissions. Our world is changing quickly due to the many technological breakthroughs of today. Cloud computing, the internet of things, machine learning, and artificial intelligence are just a few of the technologies influencing almost every part of our lives and spurring innovation in various industries. Artificial intelligence (AI), a large field of computer science, aims to build intelligent machines capable of carrying out tasks that have historically required human intelligence. Computers can now mimic and even surpass the powers of the human mind thanks to artificial intelligence. It functions by merging vast volumes of data with clever algorithms that enable quick processing and automatically discover patterns or characteristics in the data. One such advancement is “ChatGPT” [8,9].
In November 2022, OpenAI released ChatGPT-3.5, which was a breakthrough in conversational AI. Since then, AI has rapidly evolved into a technology people use daily. Examining the Natural Language Processing (NLP) and the influence of the transformer architecture is necessary to comprehend the evolution of ChatGPT. When Vaswani et al. presented the transformer model in their 2017 paper [10] “Attention Is All You Need,” NLP made a significant breakthrough. To avoid the necessity for sequential data processing, this work introduced the transformer architecture, which incorporates self-attention processes into natural language processing. The model is composed of an encoder-decoder structure, where the decoder produces outputs based on the representations created by the encoder after processing the input data. ChatGPT became instantly accessible to the average Internet user. Within five days, the chatbot attracted over one million users [11]. The hype surrounding ChatGPT was matched by a collection of shocked media outlets projecting some of the panic that was felt across the globe, from universities and economists to business leaders and labor unions. Although this topic can potentially have significant environmental impacts, it has not received much attention in academic circles. This investigation examines earlier studies on the water usage of AI models, specifically ChatGPT [12]. The present state of knowledge in this field will be thoroughly reviewed. This review will examine the quantity of water AI models utilize, the possible environmental effects, and the suggested conservation measures. To sum up, this literature review highlights the importance of considering the ecological impacts of AI systems and the requirement for sustainable development and use methods [13].
The 17 Sustainable Development Goals (SDGs) set forth by the United Nations (UN) provide a global framework for addressing pressing issues about environmental sustainability, energy, and water. To protect this essential resource, Goal 6 emphasizes sustainable water management while focusing on providing clean water and sanitation. Similarly, Goal 14 recognizes the vital role that oceans and marine ecosystems play in sustaining life on Earth and works to safeguard them. Last, Goal 7 promotes reasonably priced, dependable, and sustainable energy availability. When taken as a whole, these goals contribute to creating a more just and sustainable future [14,15,16]. In recent years, there has been an increasing amount of research aiming to quantify the energy, carbon, and water costs associated with training and implementing LLMs, highlighting the increasing environmental effects of AI systems. Energy can be produced in various ways with varying impacts on the environment. They fall into two categories: non-renewable and renewable energy sources. Solar, hydro, and wind energy are examples of renewable energy sources [17]. There is a residue left over after burning fossil fuels. The residue must be disposed of because it is not reusable, which increases pollution and waste and slows down environmental progress [18]. Currently, OpenAI’s servers are in the United States, albeit it is unclear which state or states they are in [19]. 74% of the US’s energy is produced by the country’s two primary energy producers: petroleum and natural gas. They’re both non-renewable. Furthermore, only 9% of power came from renewable sources, while 18% came from coal and nuclear [20].
The predicted total electricity consumption of all data centers worldwide in 2022 is 460 Terawatt hours (TWh). Energy consumption is expected to surpass 1000 TWh in 2026 due to the expansion of AI, unless new laws and technological breakthroughs are implemented [21]. To put it in perspective, Sweden used 503 TWh of energy overall in 2023 [22]. ChatGPT’s training and operations demand a substantial amount of energy. The training of GPT-3 in 2020 required 1287 MWh of energy [23], which was 0.012% of Microsoft’s total energy consumption in 2020 [24]. The energy consumption increased significantly when training GPT-4; it consumed approximately 7200 MWh of electricity [25], which is close to 5.5 times more than for GPT-3. Due to the larger and more complicated model, GPT-4 required more than 25,000 GPUs to train, while GPT-3 only required 10,000 GPUs [24]. This is the reason for the rise in energy consumption between the two models. Furthermore, GPT-4 has 1.7 trillion parameters, 9.7 times more than GPT-3, compared to 175 billion in GPT-3 [26]. An estimated 0.004 kWh, or 0.4 kWh per 100 pages, is used by ChatGPT to generate a page of text [27]. In contrast, it is estimated that a Google search uses 0.3 Wh of electricity, whereas a ChatGPT request uses 2.9 Wh. Google searches would use ten times more energy if they integrated AI, even though they cannot produce text in response to prompts [25]. Google searches would use ten times more energy if they integrated AI, even though they cannot produce text in response to prompts [28].
ChatGPT uses water both directly and indirectly. Water used at data centers is referred to as “direct water usage”. It is primarily associated with cooling towers, which most data centers utilize. Although the cooling towers in various data centers may have varied designs, they all function similarly. The functional design includes two water loops and one closed loop connecting the data center server room and the chiller. The second, open loop, separates the chiller and cooling tower. The closed loop circulates water without using any water itself. The loop that “consumes” the water through evaporation is known as the open loop. To prevent an excessive concentration of minerals in the water before it must be disposed of, the water in the open loop can only be cycled a few times. Fresh water is supplied to the loop to make up for the water that evaporates or replenish the water. When using outside air conditioning, water is also employed to maintain the proper humidity if the outside air is excessively warm or dry. The water used to produce the electricity that runs servers is called indirect water usage [29]. Evaluating this indirect water consumption is more challenging because it is linked to the generation of power needed to run data centers [30]. ChatGPT uses tons and tons of water for the cooling process of the data centers. The water use of Microsoft increased by 34% between 2021 and 2022. According to estimates, Microsoft lost 700,000 L of pure fresh water during ChatGPT-3 training [30]. The water use of a Swedish home consisting of two adults and two children over 3.5 years can be compared to this [31]. ChatGPT uses an estimated 500 milliliters of water for every 10 to 50 responses it generates [29]. The season, the servers’ infrastructure, and the locations of data centers all affect how many requests are sent at any one time [32]. Although ChatGPT has 1.5 million daily users, the amount of water used may not seem like much for a single user, but it quickly grows significantly [33]. Water scarcity is a problem in Southeast Asia, India, and the United States. In addition to lowering water quality and aggravating water shortages, excessive water withdrawal can worsen the issue of disturbed ecosystems [12]. Already, 4 billion people experience severe water scarcity for at least one month each year [30]. Innovations to decrease the need for water in larger quantities are being explored and have included technologies such as liquid cooling, which requires less fresh water, and the usage of recycled or rainwater. Another explored solution is relocating data centers to regions with cooler climates to use naturally lower temperatures, such as Sweden or Finland [34].
When utilizing ChatGPT, the vast majority of users (80.5%) do not consider the possible environmental impact. Just 19.4% of users consider ChatGPT’s potential environmental impact. This demonstrates their ignorance or indifference to any potential environmental effects of their tool use. Talking about the CO2 emission from ChatGPT is tedious because gathering the details from all data centers is very difficult. Concerns regarding the environmental sustainability of AI are urgently raised by the frightening levels of carbon emissions from AI, with ChatGPT alone producing over 260,000 kg of CO2 each month. Recent evidence shows that ChatGPT’s environmental effect is comparable to that of international air travel, bringing the startling size of AI carbon emissions into greater light. According to a thorough analysis by Known Host, the well-known AI service produces around 260,930 kg of carbon dioxide every month, the same as 260 flights from New York to London. Individual exchanges can seem insignificant, as each page view on ChatGPT emits only 1.59 g of CO2. However, the platform’s enormous monthly user base of 164 million leads to a significant cumulative environmental impact. AI has environmental costs that go beyond ChatGPT. Despite having lower monthly emissions overall, other AI systems generate more CO2 every engagement. For example, Rytr creates 10.1 g of CO2 each page view, but Spellbook yields 6.5 g, far more than ChatGPT’s per-view impact.
Large AI models require a lot of resources to train. For example, the training of GPT-3, the basis for ChatGPT, used around 1287 MWh of electricity and generated 552 tons of CO2 (Carbon Credits), which is the same as the emissions from 110 gas-powered cars during one year (karmametrix.com). Thousands of GPUs that use a lot of electricity are needed to process massive datasets over weeks or months to train these models. Inference, the operational phase that follows model training, also uses a significant amount of energy. ChatGPT’s query execution necessitates constant computational resource use. According to industry estimates, generative AI queries consume four to five times as much energy as a typical search engine query. A ChatGPT inquiry can release up to 1 g of CO2 (Greenpeace), compared to roughly 0.2 g from a regular Google search [35]. Assuming that ChatGPT completes a monthly model retraining and continues to process an expected 10,000,000 queries daily, the amortized training cost of the 552 metric tons divided by 300,000,000 queries equals 1.84 g CO2 emission each query. The overall effect of ChatGPT’s operation and training is roughly 2.2 g CO2 emission per inquiry. The per-query training impact for BLOOM is 0.10 g CO2 emission, while the per-query operational cost is 1.47 g, assuming the same usage level and retraining frequency as ChatGPT. The training and per-query emissions were two to five orders of magnitude more than the embodied energy of the chips used to train the model, the server used to provide the query, and the end-of-life recycling of those devices. A 100-GPU has an embodied energy footprint of 150 kg CO2 emission. Therefore, it’s critical to comprehend and lessen AI’s environmental impact as it develops and becomes more integrated into many facets of society. Given how frequently the model is used, the CO2 emissions from a single ChatGPT query may not seem like much, but the total impact can be substantial. The carbon footprint of AI can be controlled and decreased by combining sustainable practices, efficient model design, and greener energy sources [36].
Based on the above description and understanding. We have developed a mathematical model to understand the interconnection between the variables of ChatGPT usage, energy consumption, water consumption, and CO2 emission. During this study, we understood the tool’s usage and how critical it is to be handled to support well-being.
2. Description of General Sections
Basic results are presented in Section 3, together with preliminary lemmas, basic definitions, and key mathematical tools needed for the qualitative examination of the suggested system. In Section 4, the governing differential equations are developed based on the underlying physical and environmental mechanisms. A Section 4 on the fractional-order system in the Caputo sense, which takes memory effects and hereditary effects into account, follows the description of the novel mathematical system. The boundedness of solutions is established in Section 5, guaranteeing that all state variables stay non-negative and contained inside an area that is both physically and biologically possible. The stability analysis of the fractional-order system is the main topic of Section 6. It starts with local stability analysis using linearization and eigenvalue criteria and progresses to global Lyapunov stability using a Lyapunov function that has been properly designed to ensure asymptotic convergence. The well-posedness of the model is confirmed by Section 7, which rigorously establishes the existence and uniqueness of solutions under appropriate Lipschitz condition. In order to improve prediction, identifying important patterns, seasonality, and data fluctuations of the real-world data ML techniques are incorporated in Section 8. After a thorough description of the observed behaviors, Section 9 provides numerical simulations, graphical representations, and a comparative comparison of integer and fractional-order dynamics. The study is finally concluded in Section 10, which provides a summary of the main conclusions, theoretical contributions, and possible future research directions.
3. Basic Results
Definition 1
([37]). The following series determines the Mittag-Leffler function, an entire function
A more general definition of the Mittag-Leffler function [38] can be given as
Definition 2.
Let and be m times continuously differentiable, where m is an integer such that . Then the Caputo fractional derivative [39] of the function f of order Ψ is defined by
Definition 3
((Stability of a System) [40]). The autonomous system exhibits
(i) asymptotically stable nature iff
(ii) stable behavior iff those crucial eigenvalues that satisfy the condition, or if it is asymptotically stable, then have geometric multiplicity one.
In the definition above, represents the argument, and denotes the eigenvalues of the square matrix A.
Lemma 1
([41]). Consider a continuous function on that satisfies
where and Then
Lemma 2
([42]). Consider the system
using and In the system then has a unique solution, if locally meets the Lipschitz condition with regard to
Lemma 3
([43]). Let be a derivable and continuous function, then for any time instant ,
Lemma 4
([43]). If, for every x, is satisfied in the case of the fractional order differential equation , where , then the origin of the system is asymptotically stable. If all have , then the system’s origin is stable.
Lemma 5
([44]). (Lyapunov’s Stability Theorem) Let V be a radially unbounded, globally positively definite function. V has a universally negative first-order derivative, , for every In this case, is the globally stable equilibrium point.
4. Description of the Novel Proposed Mathematical System
In this section, we will discuss the formation of the new model based on a few presumptions required for the study. The proposed model consists of a system of nonlinear differential equations, namely ChatGPT usage , energy consumption , water consumption , and CO2 emission
- ChatGPT Usage: The rate of change in ChatGPT utilization is described by a differential equation and is influenced by internal technical adoption and external feedback from resource consumption. With representing the rate of increase in ChatGPT usage in a growing market, and K representing the carrying capacity that places an upper limit on usage due to access, financial, and infrastructure constraints. The first term, , exhibits a logistic growth pattern. The growth rate decreases when gets closer to K, signifying saturation. The indirect increase in ChatGPT usage brought on by increased energy and water consumption is captured by the second term, . measures the strength with which the combined resource utilization encourages more adoption and reliance on AI services. This represents situations where increased infrastructure (cooled by water and driven by energy) facilitates and increases use. Although , , and are not explicitly included in this equation, they have an impact on , which in turn influences via the route. The inherent rise of energy consumption is governed by , ChatGPT usage is linked to energy demand by , and the way that water use increases energy demand is captured by . Similar to this, parameters like and affect by simulating how ChatGPT-related infrastructure uses more water for cooling () and how energy is used for water generation and AI operation (). Long-term sustainability is impacted by the environmental feedback, including , , , and Q (CO2-related impacts), which are not specifically included in this equation but interact in the larger system context. In general, the model illustrates how resource-linked feedback () and direct usage growth () work together to influence ChatGPT adoption dynamics in a system with environmental and infrastructure constraints. From the above understanding, we have formed the following equation for the dynamics of the variable :
- Energy Consumption: The rate of change of energy consumption as influenced by external dependencies on water and ChatGPT usage and internal growth dynamics is modeled using the differential equation. The first term, , indicates logistic growth limited by the non-renewable resource limit L, where is the carrying capacity of available non-renewable resources and L is the intrinsic growth rate of energy consumption. Resource exhaustion is seen in this expansion slowing down as gets closer to L. The second element, , links energy use to ChatGPT usage . represents the rate at which ChatGPT use influences energy demand; although it is a small value, it can have a big impact when used extensively. The energy needed for cooling in data centers and other infrastructure is captured by the third term, , where represents the energy intensity utilized per unit water consumed. Parameters like (the rate at which ChatGPT usage is growing) and (the rate at which indirect usage increases via energy and water) indirectly affect , which in turn feeds into . , which controls the rise in cooling water consumption, and , which simulates the energy required to generate water and sustain usage, have an indirect impact on and, consequently, the term. Environmental factors such as , , , and the baseline CO2 concentration Q affect the larger coupled system through feedback loops including emissions, carbon sinks, and heat exchange processes, even though they are not stated directly in this equation. The equation illustrates the intricate and interconnected character of energy usage in the AI ecosystem, showing how environmental limitations and technological advancements interact dynamically through the specified parameters. Below is the equation for the dynamics of the variable that is formulated based on the above assumptions.
- Water Consumption: This differential equation, which is mostly utilized in data centers for infrastructure support and cooling for ChatGPT and other technologies, characterizes the rate of change of water consumption . The justment mechanism between current water usage and energy consumption is represented by the term . functions as a heat transfer coefficient that establishes the rate at which water consumption reacts to the difference between energy demand and current cooling capacity. Given that increased energy use usually necessitates more cooling, a larger indicates faster adjustment and stronger sensitivity of water usage to energy consumption. Water-intensive operational demands like server cooling and maintenance are reflected in the second term, , which measures the additional water needed as AI service usage rises. This increase in water consumption is directly caused by ChatGPT usage . This equation is indirectly influenced by additional parameters that modulate the inputs and . The increase of energy consumption is specifically influenced by , , and . regulates the natural growth of , connects energy use to ChatGPT questions, and illustrates how increasing water use feeds back into energy use. and are two parameters that affect , where controls direct ChatGPT adoption and takes resource usage into account for indirect growth. Additionally, shows the rate of rise in water use, notably for data center cooling, which corresponds to the operational requirements of ChatGPT infrastructure. The dynamics of are further influenced by the parameter , which introduces feedback where energy is needed to manufacture water and sustain usage. Water and energy consumption are shaped by the larger environmental context, even though characteristics like , , and Q have a greater impact on climatic feedback mechanisms (such as CO2 exchange and atmospheric conditions). Overall, this equation demonstrates how water use is an actively controlled element impacted by intricate interdependencies among infrastructure, usage, and environmental feedback, rather than only a passive response to energy and artificial intelligence needs. The equation for the variable is constructed based on the above assumptions.
- CO2 Emission: The differential equation simulates the rate of change of atmospheric CO2 emissions , which are offset by natural CO2 sinks and driven by ChatGPT usage and energy consumption . The reduction of CO2 through natural sinks is denoted by the expression , where Q is the pre-industrial baseline CO2 level and is the sink rate. The effectiveness is constrained by the modest value of , but the term grows more negative when ChatGPT usage surpasses Q, suggesting a greater potential for sink activity. The increase in CO2 emissions linked to water consumption processes, particularly cooling in data centers, is reflected in the second term, , where indicates the degree to which utilization translates into water-based operational emissions. Emissions from the combined usage of water and energy in response to ChatGPT activity are modeled by the third term, . captures the compound rate at which emissions increase due to the energy intensity of both water generation and AI activities. Even though is minuscule, its impact becomes significant when multiplied by the number of users and the amount of energy consumed. Other parameters that affect the dynamics of and are and , which regulate the direct and indirect growth of ChatGPT usage, respectively. At the same time, , , and influence energy consumption through dependence on water systems, user-driven demand, and natural growth. Although they are not directly engaged in this equation, parameters such as , which describe the thermal exchanges between the ocean and atmosphere, have a background function in climate coupling. As a result, the evolution of is a crucial measure of the environmental impact of technological infrastructure since it represents the equilibrium between increasing emissions from increased use of AI services and the natural environment’s limited ability to reduce these emissions. The equation for the dynamics of the variable that was developed using the aforementioned presumptions is shown below.
Therefore, the System given below has been suggested based on the parameters listed in Table 1 and the explanation given above:
Table 1.
The parameter descriptions and values used for System (2).
Fractional Order System
Traditional environmental models, which rely on integer-order derivatives, presume that each state variable’s rate of change is exclusively determined by its current state. On the other hand, memory and inherited traits are inherent in many ecological and environmental processes. For example, because of its long atmospheric residence time, atmospheric CO2 accumulation depends on both current and past emissions. Similar to this, historical infrastructure growth, technical developments, and cumulative demand all have an impact on data center water and energy consumption trends. Because environmental systems are essentially non-local in time, these persistence effects show that traditional integer-order models are unable to adequately capture their long-term dynamics. For incorporating such memory effects, fractional calculus offers a natural and adaptable mathematical framework. Specifically, the Caputo fractional derivative of order provides a convolution integral with a power-law memory kernel, enabling the behavior of the current system to be dependent on the full historical history of the state variables. The model can account for long-term persistence, delayed reactions, and hereditary effects that are seen in environmental systems because of this non-local feature. In order to incorporate memory into System (2), the integer-order time derivatives are substituted with Caputo fractional derivatives. This results in the corresponding fractional-order formulation, in which represents ChatGPT usage, represents energy consumption, represents water consumption, and represents atmospheric CO2 emissions.
Here, is fractional order. The initial conditions are (in queries), (GWh), (in million liters), and (in tons), which are considered to understand the behavior of the system. Table 1 provides the values and description for each parameter. For the study, the parameter values are assumed.
5. Boundedness
It is crucial to prove a new mathematical model’s boundedness since it guarantees that the model’s boundaries are clearly defined [41].
Theorem 1.
The System (2) has a bounded solution.
Proof.
Consider the function and Assuming the Caputo fractional derivative, we obtain
A unique solution exists in and hence we get
By applying Lemma 1, we can write
Clearly,
Therefore, there exists a positive constant
such that
Since the solutions of the system are non-negative and
It follows directly that
Hence, each state variable admits an individual bound M. Consequently, all the solutions of System (2) are bounded in
Thus, the boundedness holds for each variable individually, which completes the proof. □
6. Stability Analysis for the Fractional Order System
6.1. Local Stability
We examine the stability of System (2) at each equilibrium point. To determine the equilibrium positions, we solve the following system of equations:
The above system admits multiple equilibrium points. Let be any equilibrium point of System (2). The Jacobian matrix J evaluated at is given by
The local stability of each equilibrium point is determined by the eigenvalues of the above Jacobian matrix. The equilibrium point is locally asymptotically stable if all eigenvalues satisfy the fractional-order stability condition
The System (2) stability is examined using the equilibrium points and the parameter values shown below. For these parameter values, the equilibrium point is .
Theorem 2.
The System (2) is not asymptotically stable at the equilibrium point.
Proof.
Here, we are discussing the stability of the equilibrium point in the following manner:
- (i)
- The related eigenvalues for the equilibrium point areBy calculating the arguments of and we discover thatSince, implies that at least one of the arguments of the eigen values is The System (2) at is unstable according to the Definition 3.
□
6.2. Global Lyapunov Stability
Theorem 3.
The following conditions must be met for the System (2) to be globally stable at the trivial equilibrium point:
Proof.
Let the Lyapunov function be considered as
Here,
The System (2) is solved using the Caputo derivative, which provides the solution as
By Lemma 3, we get
We obtain the following solution by substituting the values of the fractional derivative for the System (2)
Then, for
Therefore, by using Lemma 4, for every . The System (2) equilibrium point is globally stable. □
7. Existence and Uniqueness of the Solution
A critical stage in the mathematical analysis of dynamical systems is the examination of the existence and uniqueness of solutions. By establishing existence, the suggested model is guaranteed to permit at least one solution that matches the specified initial conditions, thus validating the formulation’s mathematical soundness. Since uniqueness ensures that this solution is well-defined and deterministic, the evolution of the system is entirely controlled by its initial state. In addition, the existence–uniqueness framework confirms the accuracy of numerical simulations used to assess the long-term behavior of the system and supports the stability analysis [45].
Theorem 4.
There is only one solution to the System (2) in the region where D is finite, then we get
Proof.
Let , and
where
The norm is Let . In this case, N is defined on We will show that the constant exists in such a way that
Considering,
Here,
Let As a result, we have
The fractional integral and N, we construct a Picard’s operator as follows:
As we know, the contraction map is an operator on a non-empty complete metric space. Let us consider
After normalizing the Equation (12) on both sides, we result in
The inequality is true for Given that a condition has been added to make a contraction map, we start with
By using above Inequality (15), we can determine that is a contraction if
is considered the contraction map from the above condition. By applying Banach’s Fixed-Point Theorem, we assure a single fixed point as . The System (2) offers a special solution when
□
8. Machine Learning Analysis
Humans have utilized various tools to accomplish multiple tasks more rapidly and effortlessly since the beginning. Human ingenuity led to the creation of numerous devices. These technologies, the first being Machine Learning (ML), made life easier for people by allowing them to fulfill various needs, including computers, travel, and industry. ML is the field of study that will enable computers to learn without explicit programming, according to Arthur Samuel [46]. According to Arthur Samuel, the field of study that allows computers to learn without explicit programming is known as ML. Arthur Samuel’s checkers-playing program made him renowned. ML can handle data more effectively. After looking at the data, there are instances when we are unable to understand the information that has been collected. We use ML in that scenario. The need for ML is growing due to the large number of available datasets. The ML is used in many industries to retrieve pertinent data. Learning from the data is the aim of ML. How to teach robots to learn without explicit programming has been the subject of numerous studies [47]. Its foundations lie in the artificial intelligence movement of the 1950s, which heavily emphasized worthwhile objectives and uses, particularly in prediction and optimization [48]. ML is the scientific study of statistical models and methods that computer systems employ to do specific tasks without explicit programming, encompassing algorithms for various commonplace uses. A learning algorithm that has found out how to rank webpages is one of the reasons why a search engine like Google works so well every time it is used to look up information online. Numerous domains, such as data mining, image processing, and predictive analytics, use these techniques.
In this study, we have used the “Prophet Forecasting Model (PFM)”, a versatile and accurate prediction tool. Prophet is an open-source time series forecasting model created by Facebook, which projects a desired variable over time. The versatility and uses of PFM are significantly increased by its unique ability to forecast effectively without requiring a large number of complex datasets. Prophet is resilient to outliers, missing data, and abrupt trend changes. Using a generalized additive model, it captures long-term trends, seasonality (daily, weekly, and annual), and holiday effects. It is essential because it balances scalability and interpretability, enabling analysts to provide accurate forecasts at scale without extensive statistical knowledge. Business (sales, revenue), energy (electricity demand, renewables), public health (COVID-19 cases, hospital admissions), and environmental studies (air quality, climate trends) are just a few of the fields where Prophet has been successfully used. Because ChatGPT usage, energy and water consumption, and CO2 emissions typically show distinct upward growth trends with seasonal fluctuations, Prophet can be a handy tool for modeling these variables (e.g., higher digital usage at certain times of year, variations in energy and water demand, and associated emissions). Prophet can be used to examine how rising AI usage affects resource consumption and emissions by breaking down the time series into trend, seasonality, and external regressors. This allows for the interpretation of data for sustainability and policy analysis. Prophet is an effective tool for identifying trends and seasonality. Still, hybrid approaches that combine Prophet with ML models (such as LSTM or XGBoost) may perform better if the relationships between the variables are highly interdependent and nonlinear (for example, feedback loops between usage, energy efficiency, and emissions) [49,50,51,52].
9. Results and Discussion
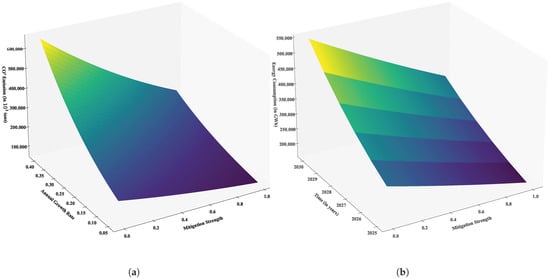
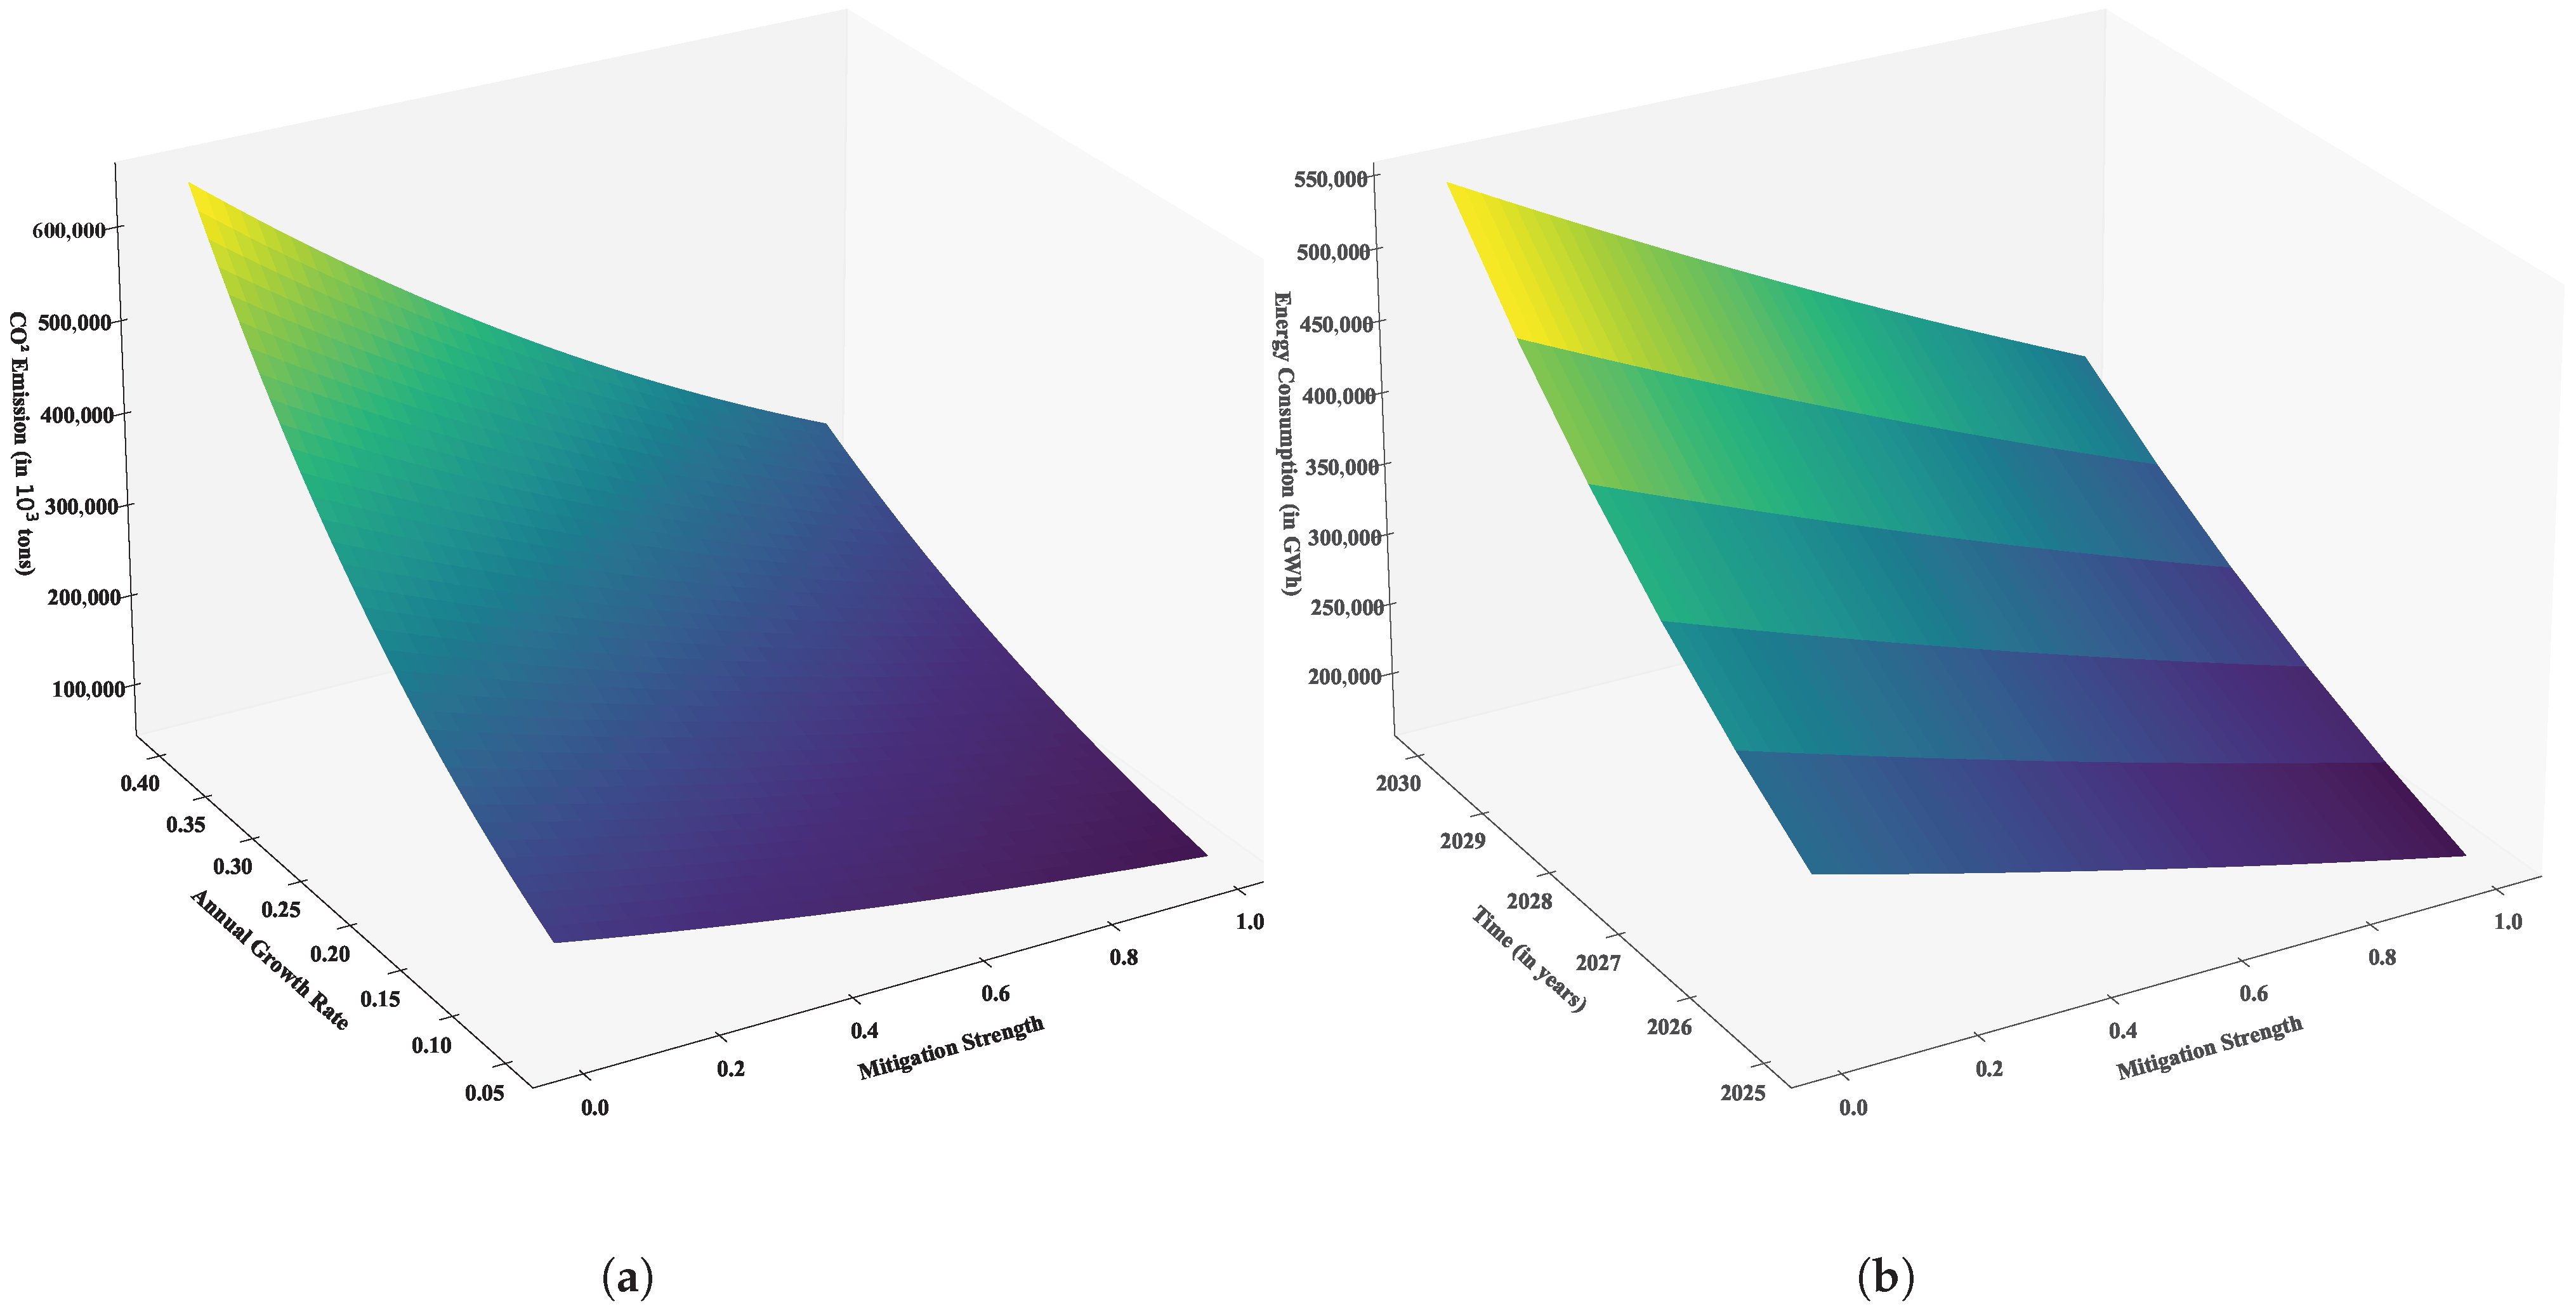
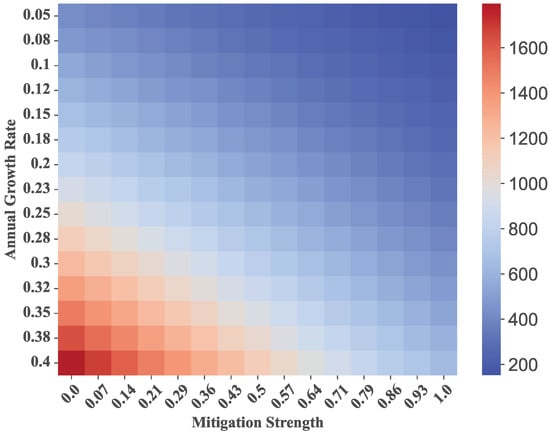
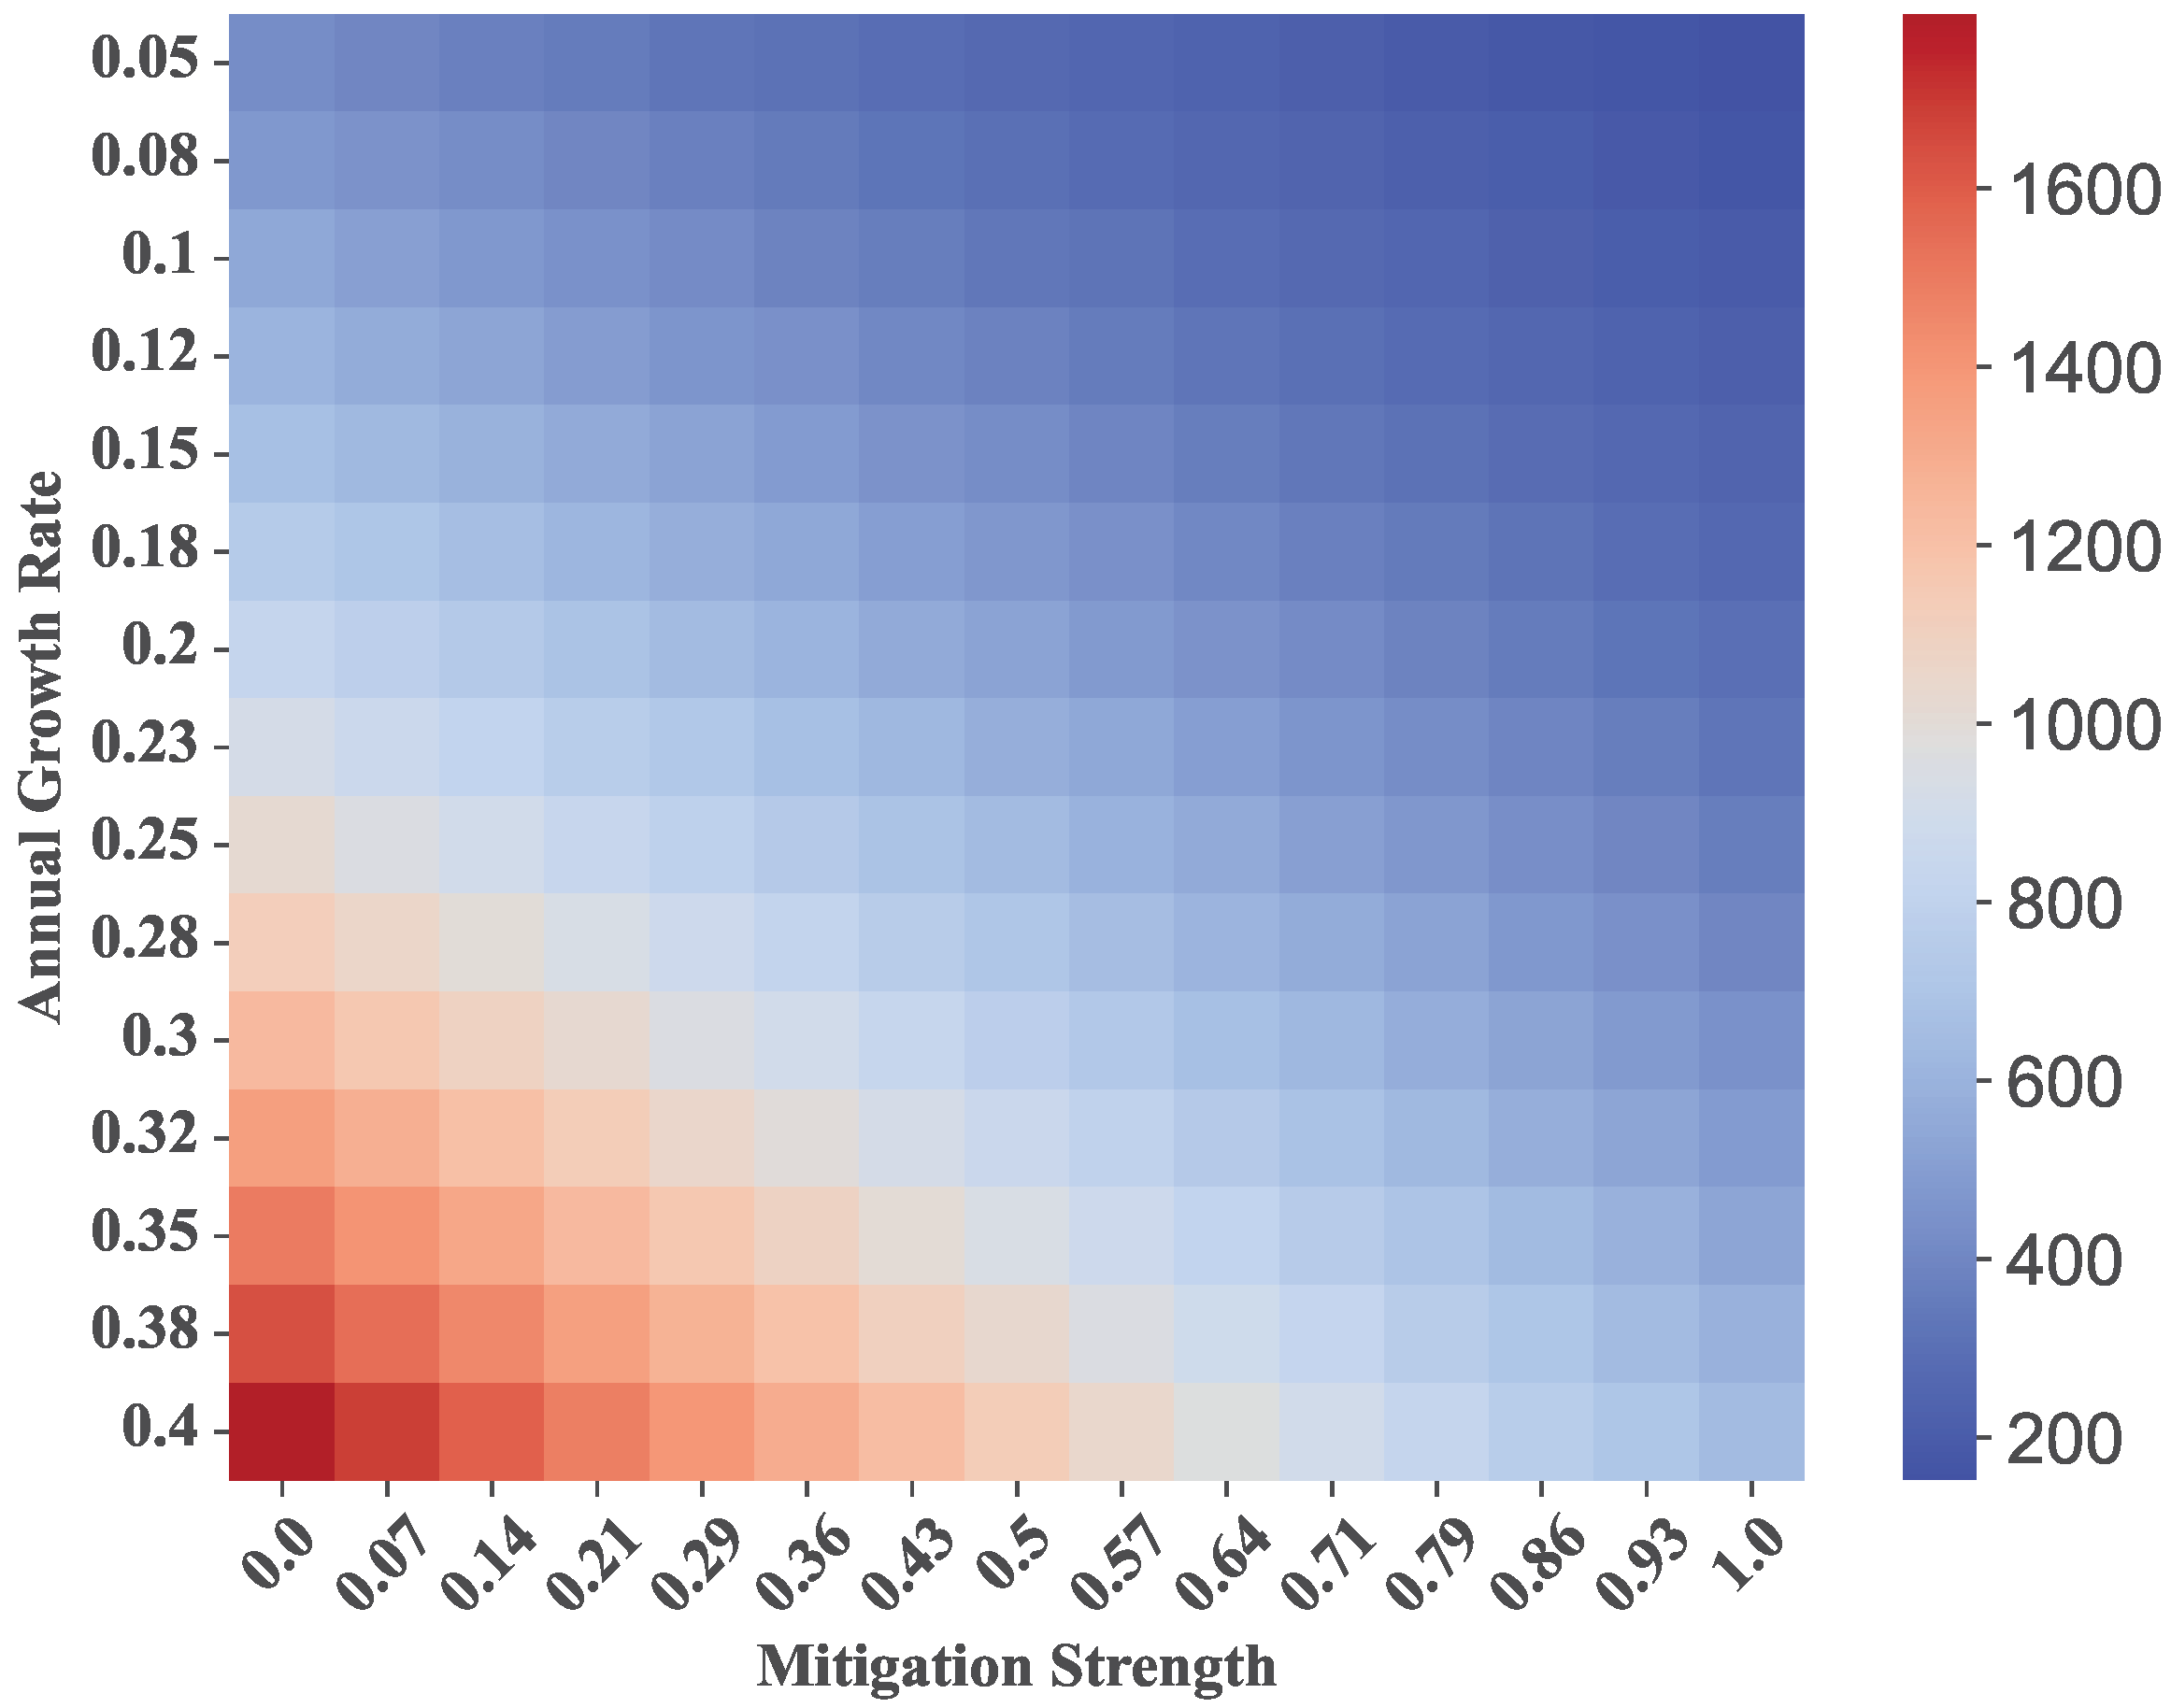
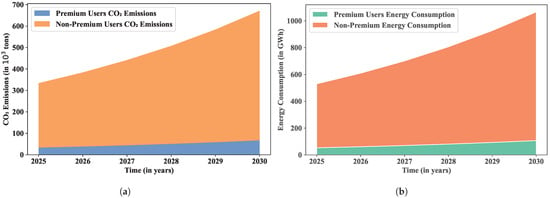
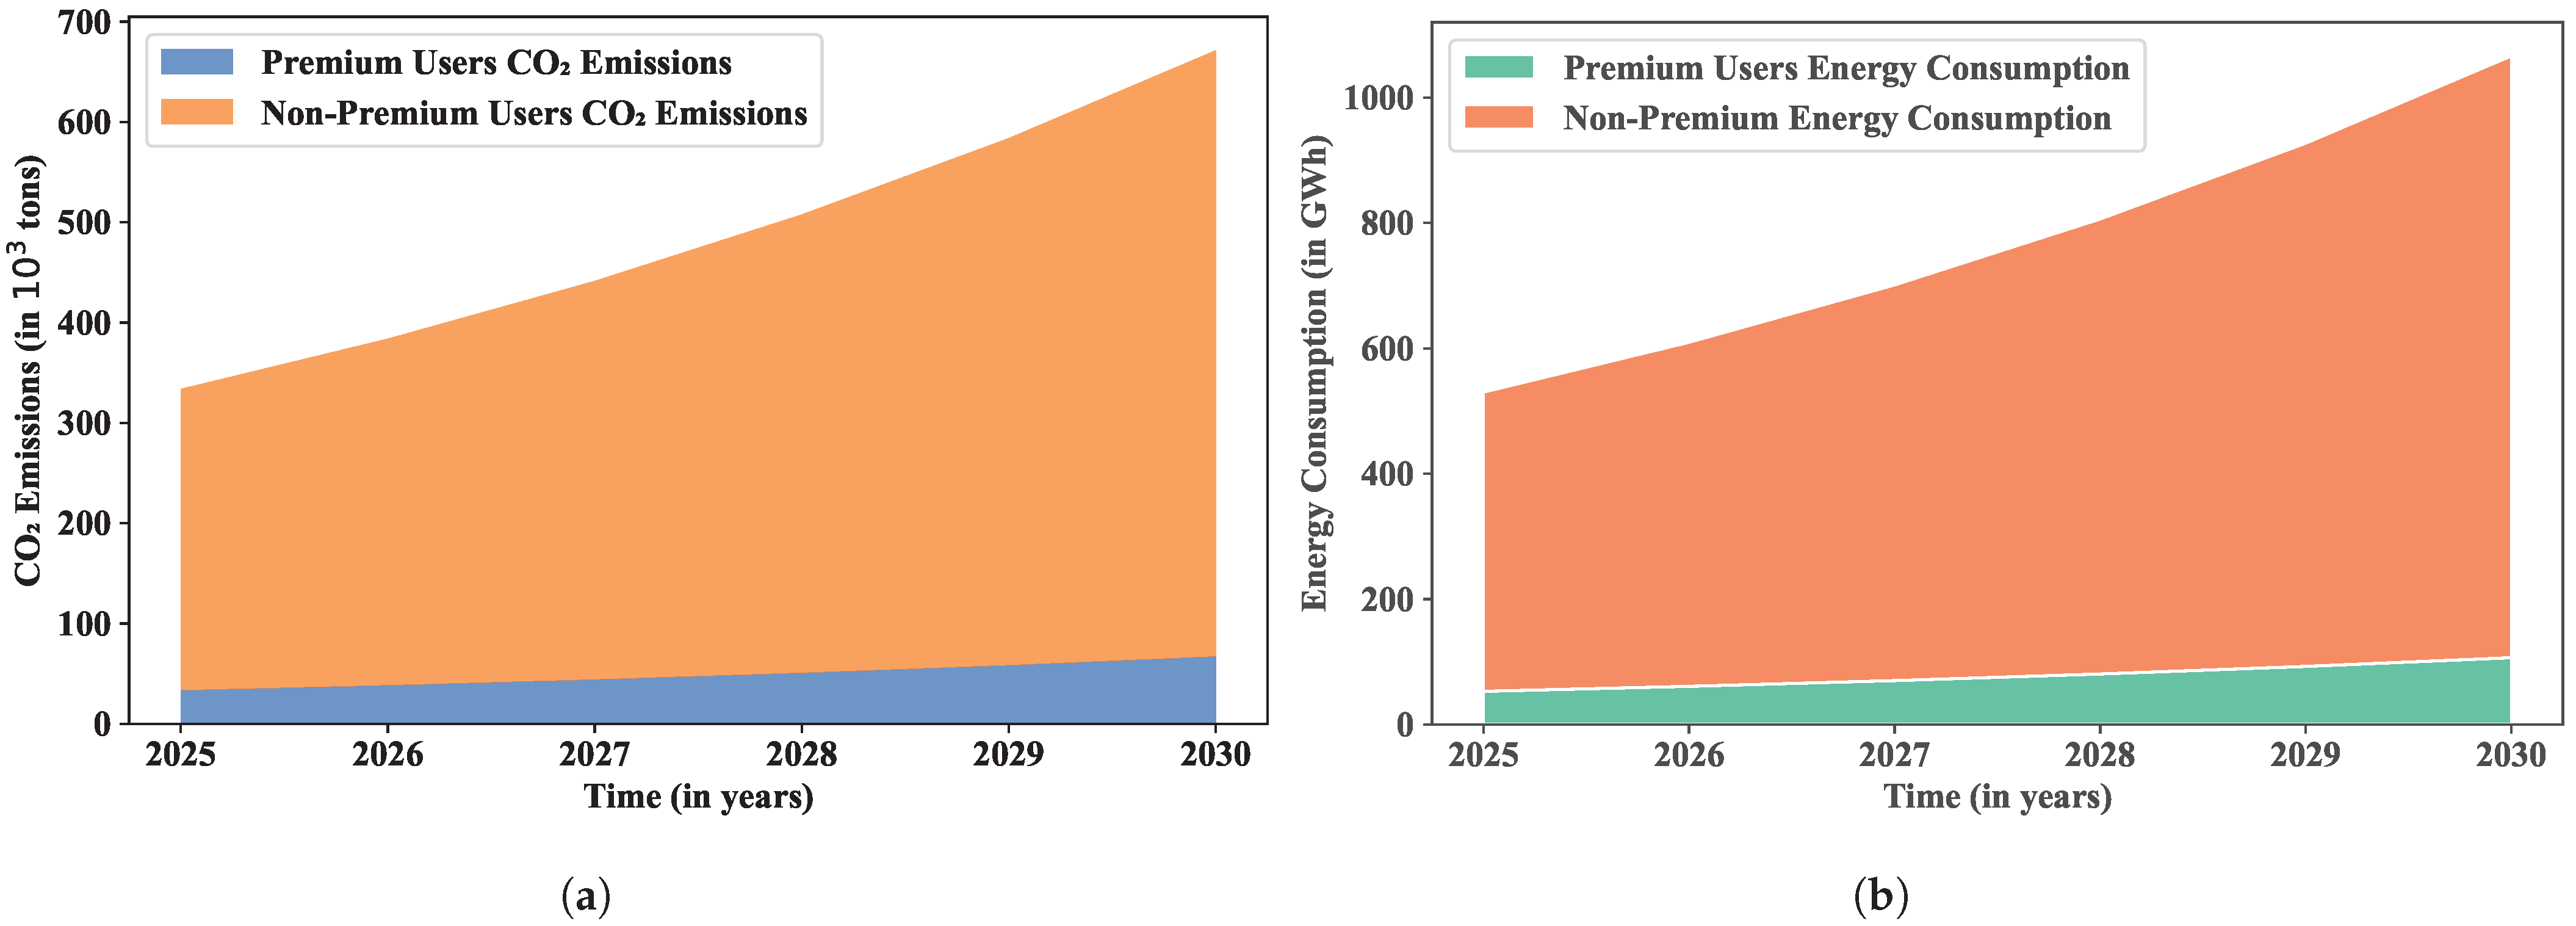
The general findings of the study are discussed in this section. To solve the System (2), we have employed two distinct numerical methods, the RK7 method [53,54] for order and the semi-implicit L1 method [55,56,57] for orders . The initial conditions (assumed values) are , and , and the parameters are as stated in Table 1. To keep the system intact and realistic to the real-world data, we have used “Nudging or Exponential Smoothing,” which is also essential for practical forecasting [58]. Also, “Cubic Spline Interpolation” is used to help the results be interpretably smooth and visually presentable without influencing the model’s dynamics [59]. Figure 1, shows the 3D surface plots of CO2 emission and energy consumption vs mitigation strategy. Figure 1a, this graph illustrates the relationship between CO2 emissions from ChatGPT use, the strength of mitigation measures, and the growth in AI use (more queries, more users). Emissions increase sharply as usage increases because data centers require more electricity, which reflects India’s growing internet access, digital services, and AI integration. Walking the mitigation axis, however, demonstrates that even in the face of rapidly increasing demand, robust efficiency measures, the integration of renewable energy, and optimized AI models may dramatically reduce emissions. With growing EdTech, digital services, and government e-governance technologies, India is seeing one of the fastest boosts in AI usage. If cleaner data centers and effective AI models don’t support this expansion, CO2 emissions could rise significantly. To make sure India’s AI development is in line with its net-zero 2070 climate goal, aggressive mitigation measures, including moving data centers to solar or wind, utilizing energy-efficient chips, and improving model inference, are essential. Figure 1b shows the projected growth in energy consumption from ChatGPT queries between 2025 and 2030. Without mitigation, the curve progressively climbs, reflecting India’s growing internet user base, digital expansion, and AI-driven services. However, with more robust mitigation, cloud computing powered by renewables, effective cooling systems, and optimal AI inference can flatten or even reduce energy demand. India is predicted to have over a billion internet users by 2030, and AI will be incorporated into governance, healthcare, and education. This increase might strain India’s energy grid, which is already under stress from peak demand, if efficiency measures are not taken. To help India prevent blackouts, lessen its reliance on fossil fuels, and improve its energy security, strong mitigation means that AI’s expanding energy hunger might be satisfied sustainably through eco-friendly cooling, AI model optimization, and renewable data centers. Figure 2 shows the 2D heatmap of CO2 emission and mitigation scenarios. ChatGPT’s CO2 emissions are shown top-down in the heatmap, which uses color gradients to indicate safe and dangerous areas. Whereas dark purple zones demonstrate negligible emissions under strong mitigation, bright yellow areas represent unsustainable emissions when usage is high and mitigation is weak. Millions of daily queries, fueled by coal-heavy grids, could easily push India’s growing AI ecosystem into the “danger zone,” especially because a large portion of the country’s electricity is still derived from fossil fuels. To ensure that digital growth doesn’t exacerbate climate issues like air pollution and growing CO2 footprints, India can force ChatGPT’s emissions into “safe zones” by requiring green-powered data centers. Figure 3 shows the stacked graphs for CO2 emission and energy consumption.
Figure 1.
The 3D surface plots (a) shows CO2 emission vs. growth rate and mitigation strategy and (b) shows energy consumption vs years and mitigation strength.
Figure 2.
The 2D heatmap showing the contour-like view of CO2 emission levels under growth and mitigation scenarios.
Figure 3.
The stacked graphs showing the (a) CO2 emission and (b) energy consumption of premium and non- premium users.
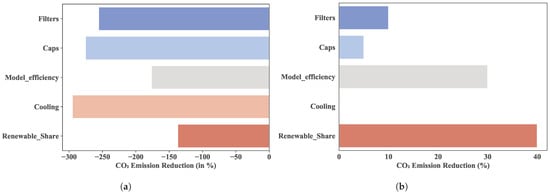
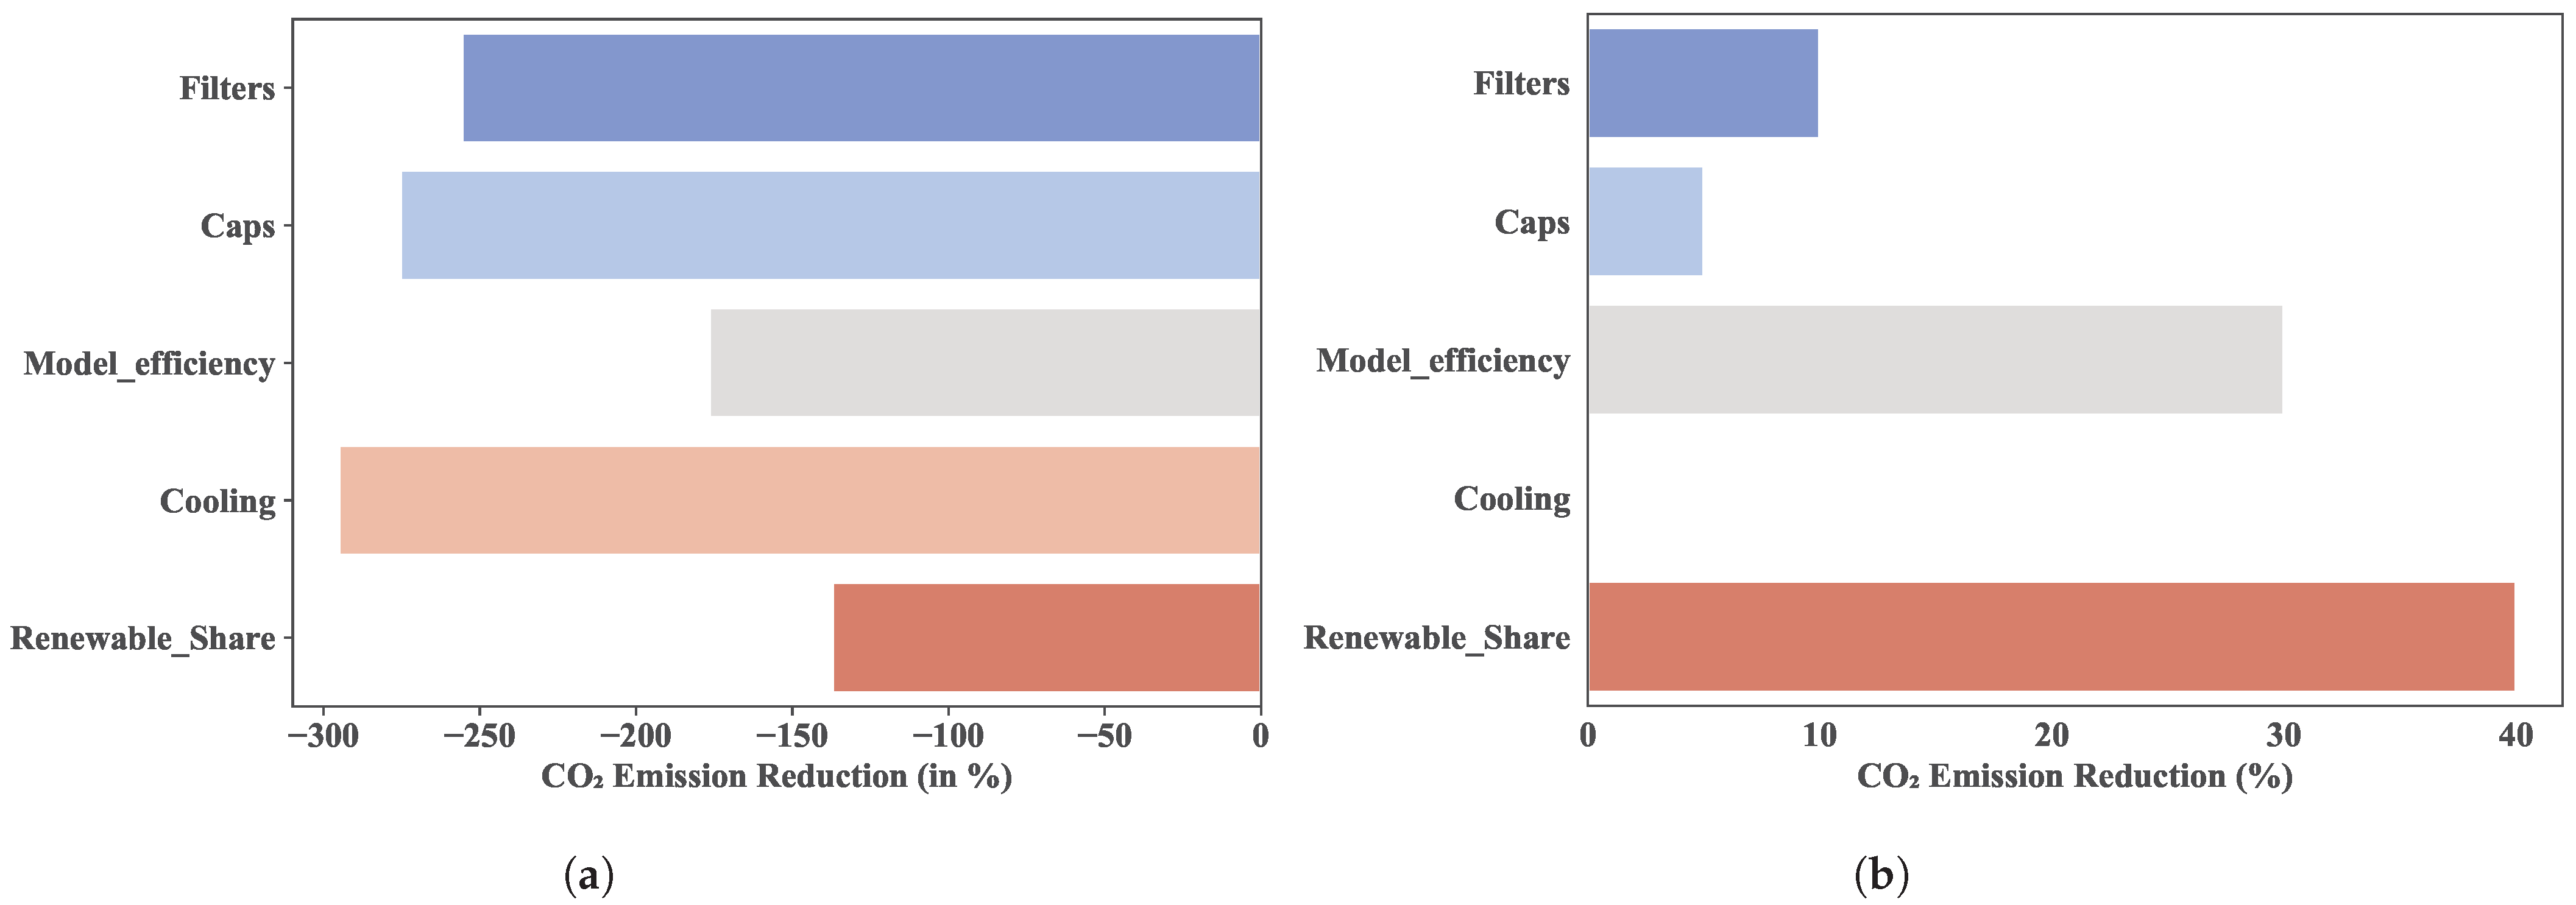
Figure 3a shows that between 2025 and 2030, global CO2 emissions from digital use will almost triple, with non-premium users accounting for most of these emissions. Although they do contribute, the premium users’ contribution is still minor. This suggests that the increase in mass non-premium users will be the primary source of emissions on a worldwide scale as internet access grows in emerging nations. It demonstrates the need for digital justice and climate goals to coexist to prevent a sharp rise in global emissions as billions of people access the internet Figure 3b. This graph indicates that, once more, non-premium users will dominate the worldwide energy consumption of digital infrastructure, which is expected to increase from about 530 GWh in 2025 to over 1000 GWh in 2030. This rising energy demand runs the risk of locking in increased emissions unless renewable energy accelerates, as a large portion of the world still depends on fossil fuels for electricity. Globally, this emphasizes how urgent it is to use clean energy sources like solar, wind, hydro, and nuclear to power new data centers and AI infrastructure to keep the digital economy from majorly impeding climate ambitions. Figure 4, the horizontal bar chart of the CO2 emission and the normalized contribution of CO2 emission in percentage. Figure 4a demonstrates how various mitigation techniques, such as usage limitations, filters, improved cooling, model efficiency, and the use of renewable energy, can lower CO2 emissions associated with ChatGPT. Emissions are reduced somewhat by filters and caps, more significantly by efficiency and cooling, and most significantly by renewable energy sources. This implies that minor solutions like filters or restrictions cannot counteract the climate cost of large-scale AI models in India, where digital demand is skyrocketing due to AI adoption. India’s vigorous drive for renewable energy (wind farms, solar parks) and initiatives to improve the energy efficiency of data centers will have the largest influence. This is similar to India’s national policy, which views increasing renewable energy to 500 GW by 2030 as the primary decarbonization engine, having a significantly greater impact than discrete regulatory measures. Figure 4b shows the graph and its respective proportional contributions. Nearly 40% of the reduction comes from the renewable share, 30% from the model efficiency, and just 5% to 10% from filters and caps. This indicates that AI-driven digital growth in India can only be sustained if it is fueled by renewable energy. With more than 70% of the nation’s electricity still coming from coal, the normalization emphasizes that efficiency and renewable energy sources will bear the most of the burden.
Figure 4.
The horizontal bar chart (a) shows CO2 emission reduction in % and (b) shows normalized % contribution of CO2 emission.
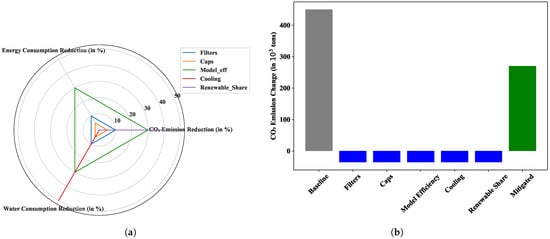
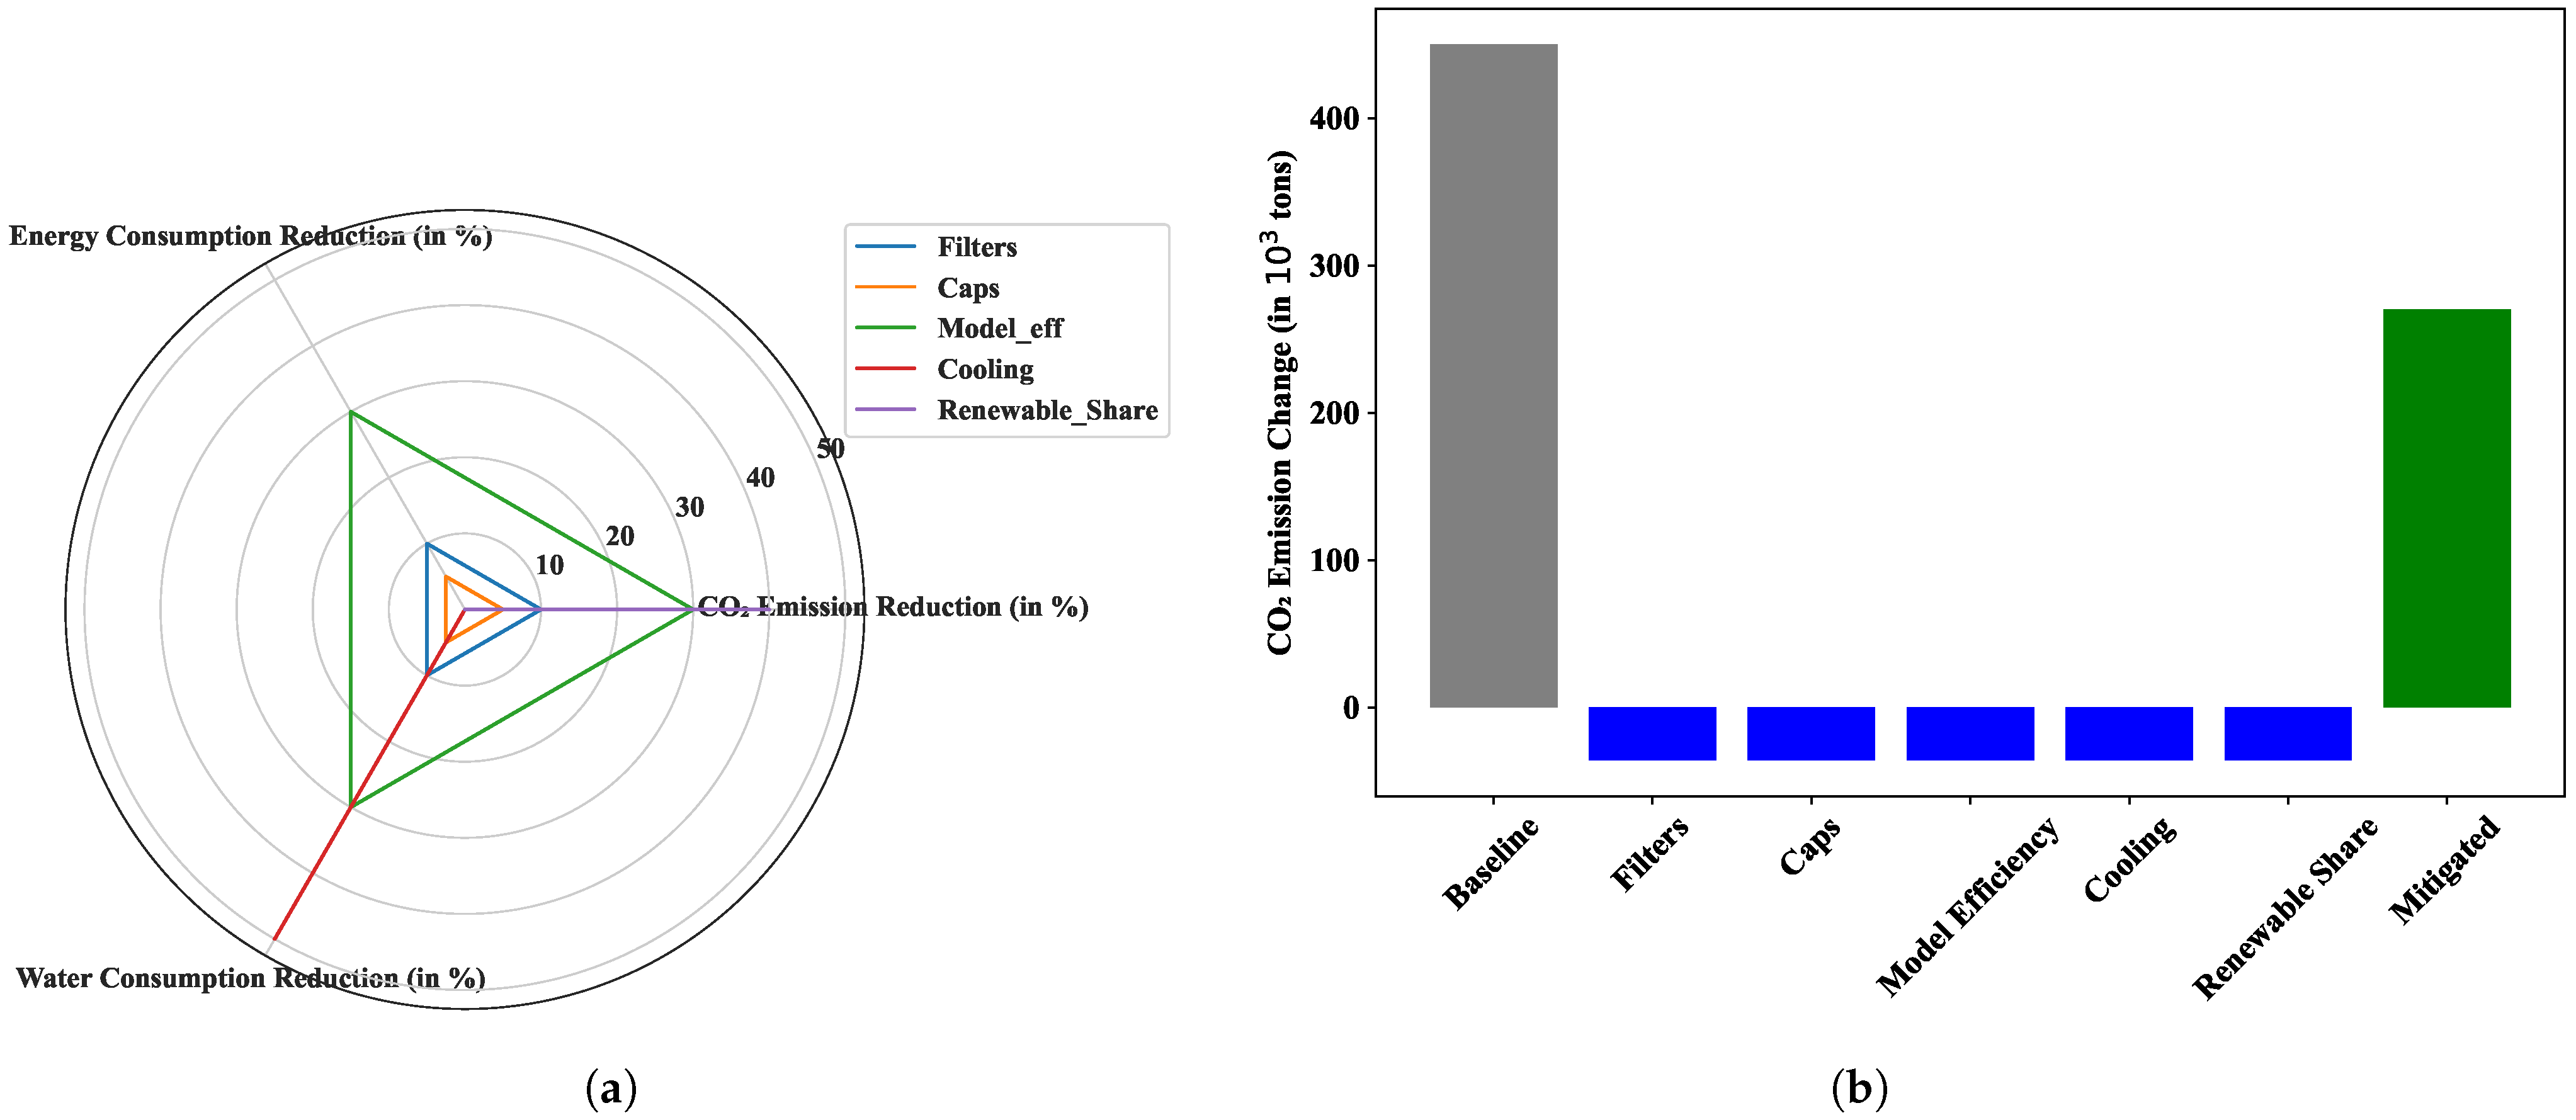
Figure 5 shows the radar chart and the multiple impacts of introducing CO2 emission. Figure 5a, this radar chart contrasts the three effects of each strategy: water, energy, and CO2 reduction. The model’s efficiency is balanced; cooling saves the most water, while renewables have the most impact on CO2. In all three, filters and caps continue to be weak. This demonstrates that not all initiatives are equally helpful across sustainability dimensions, particularly for India, where water shortage and energy demand are urgent challenges. Adopting renewable energy reduces emissions but might not lessen water stress, which is crucial because data centers in India frequently use water-intensive cooling systems. The radar chart evaluates how well various mitigation strategies work to cut CO2 emissions, energy use, and water use. The figures (10, 20, 30, etc.) represent percentage reductions; for instance, sophisticated cooling technologies result in significant water savings, while model efficiency and renewable share can produce reductions of about 30%. This demonstrates how different locations may prioritize different policies on a global scale. For example, countries with coal-heavy electrical systems must prioritize renewable energy, whereas water-scarce regions may favor cooling technology. The main lesson is that, to achieve true sustainability, a balanced combination of local context-specific measures is required; no single measure is adequate globally. Figure 5b illustrates how digital infrastructure’s baseline CO2 emissions are quite high (450 tons), but that they may be greatly decreased to 270 tons by combining several mitigation strategies. When together, filters, caps, efficiency upgrades, cooling, and renewable energy all significantly reduce, but when taken separately, they only make minor reductions. From renewable-powered data centers to energy-efficient AI models, the tech sector must embrace a range of solutions to reduce emissions and satisfy the growing demand for digital services on a global scale. The blue bars, which are presented as negative values to show reductions relative to the baseline (450 tons), represent the emission reductions attained by each particular mitigation measure: filters, caps, model efficiency, cooling, and renewable energy. These bars thus seem below zero. Instead of implying that emissions go negative, this illustrates how much each technique deducts from the baseline emissions. The final green bar, labeled “Mitigated,” displays the new, lower total (270 tons) after combining all of these reductions, highlighting the fact that, even if each measure makes a small contribution on its own, when taken as a whole, they result in a large worldwide decrease in emissions.
Figure 5.
(a) The radar chart showing the multiple impacts in reduction of CO2 emission, energy, and water consumption during sequential CO2 reduction and (b) bar graph of CO2 emission reductions from baseline across mitigation strategies.
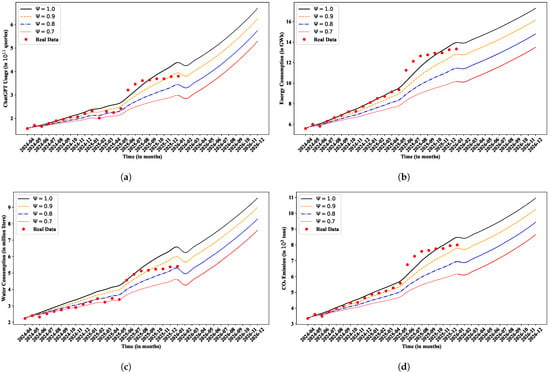
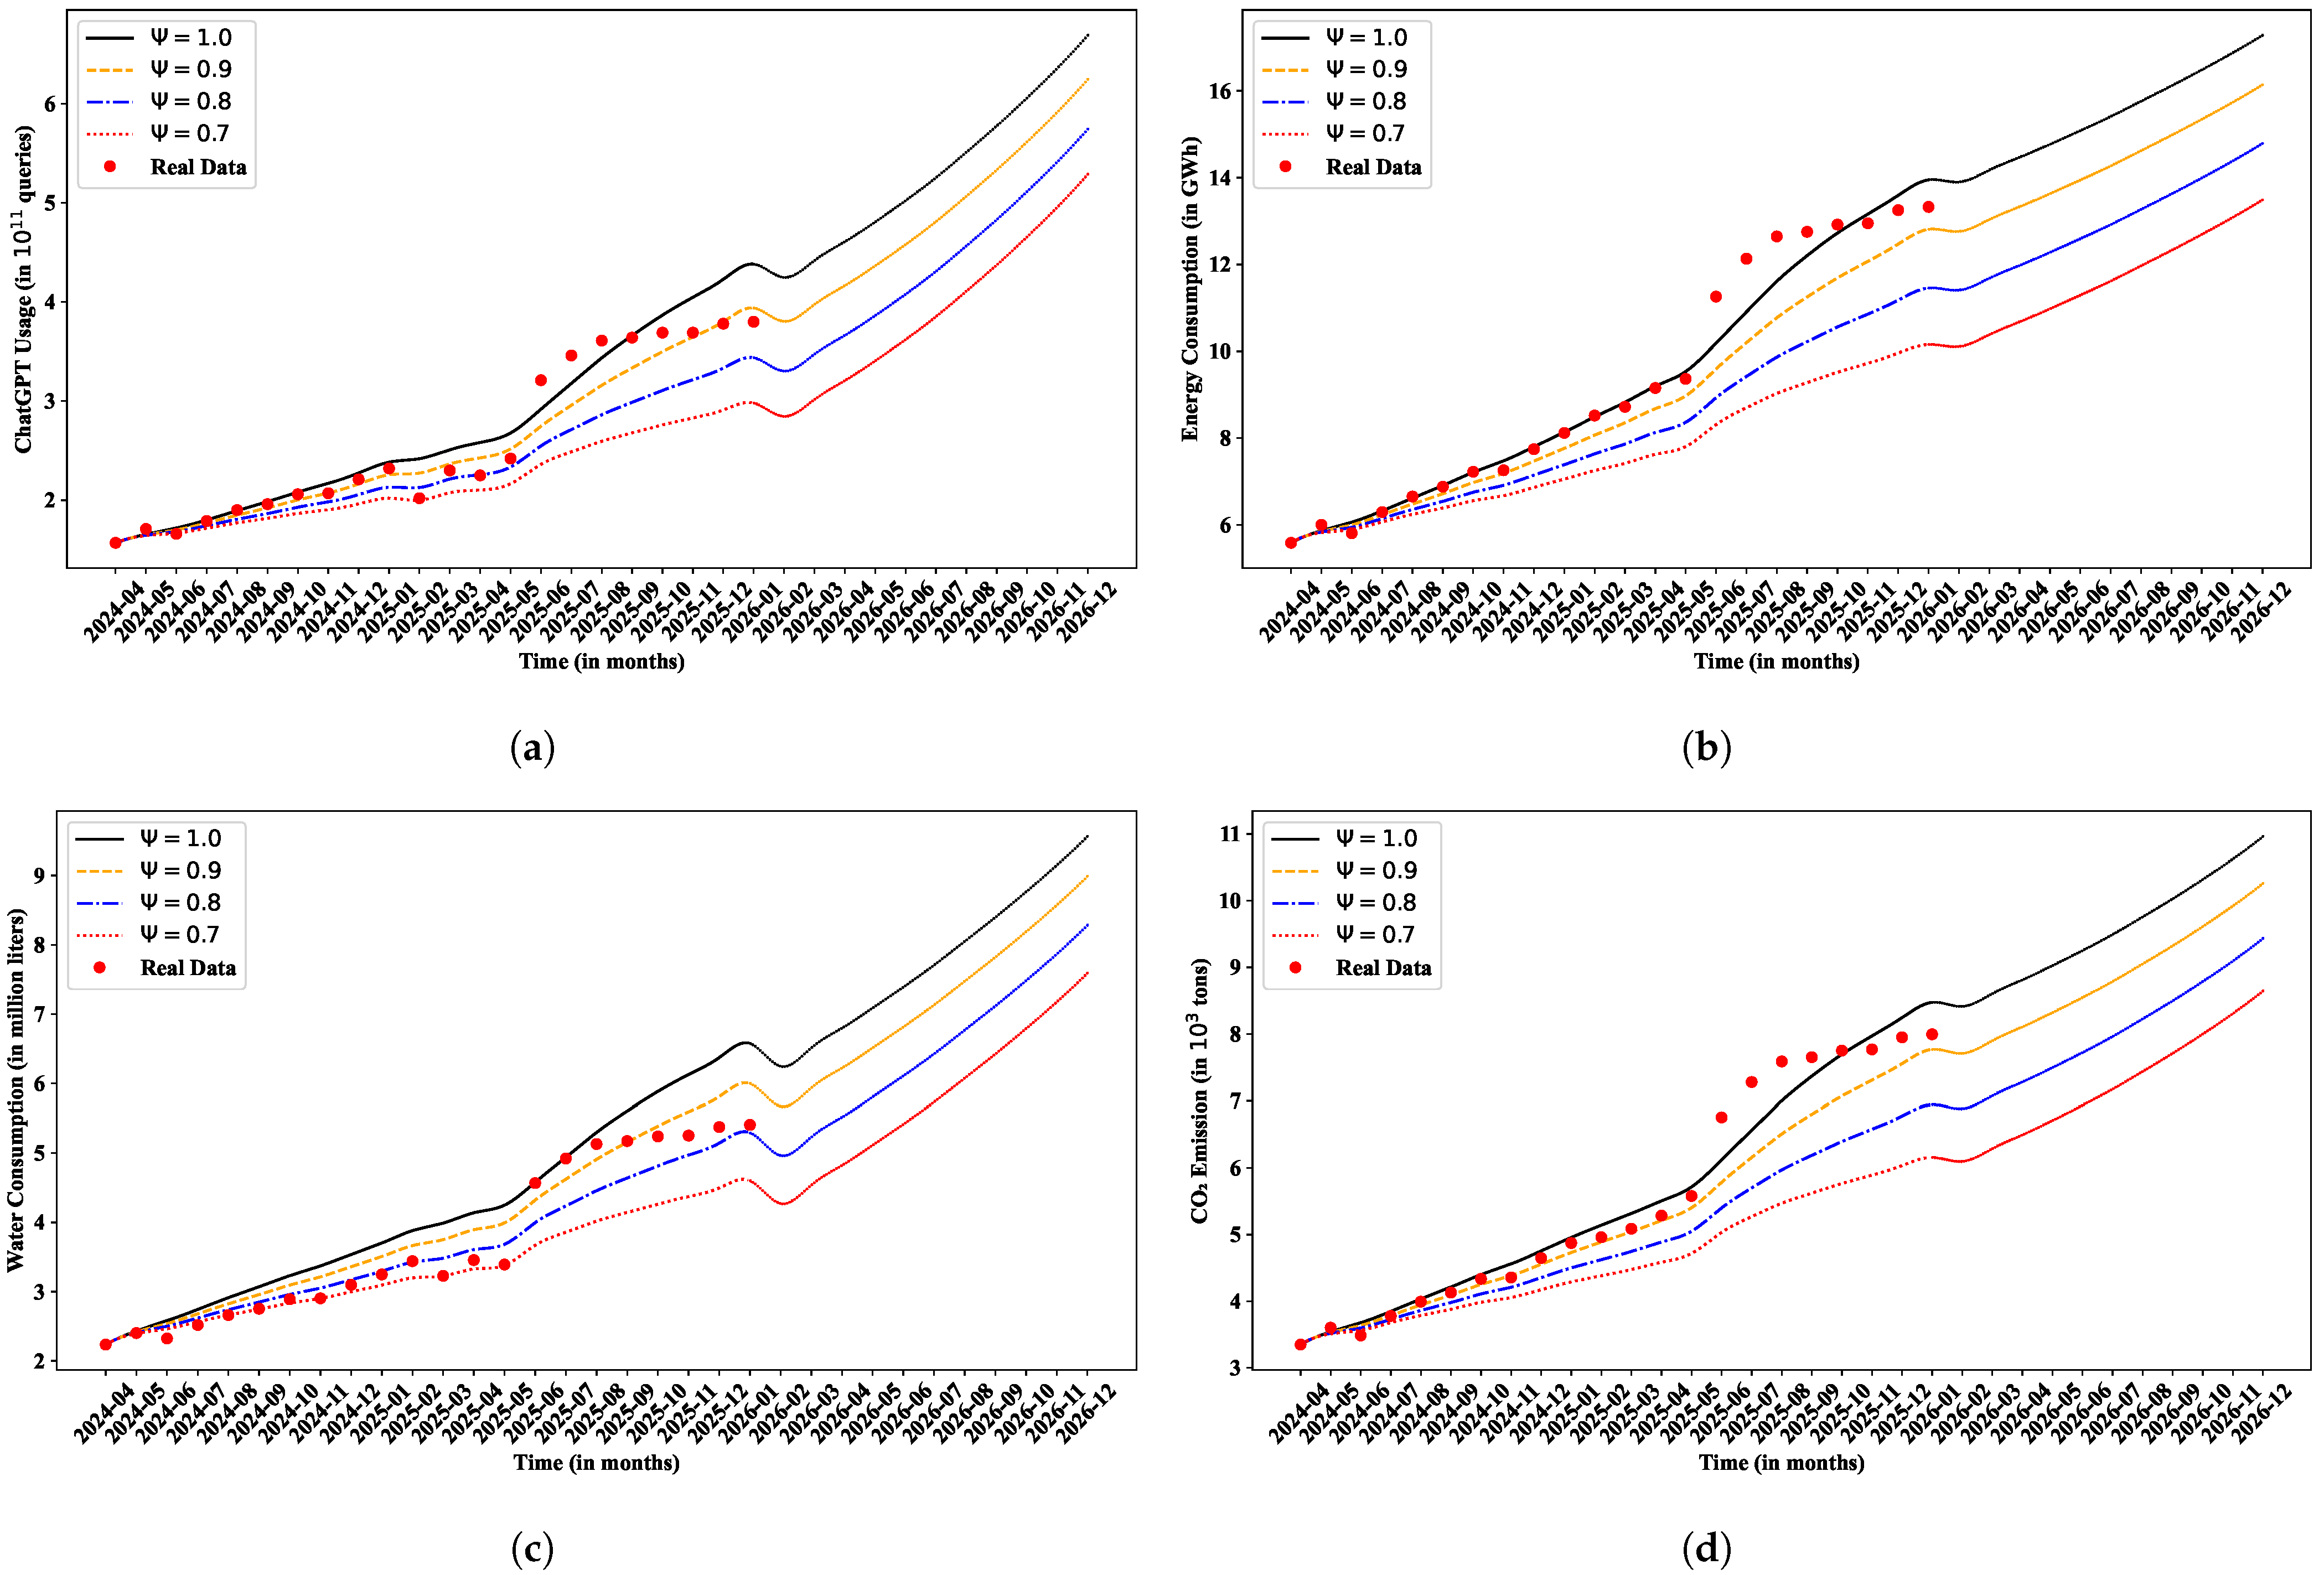
Figure 6 displays the behavior of the System (2) for the variables Figure 6a, Figure 6b, Figure 6c, and Figure 6d for various orders. In the figures, the red dotted points indicate the curated real-world data, and the predictions are from June 2025 to December 2025 to understand the System (2) in the future trends. We have used “Data assimilation-based residual correction or blending correction” for the model fitting. The model’s correction technique is essential to improving the simulation’s realism and accuracy. The model dynamically aligns its trajectory with observable trends by implementing a weighted residual correction, in which simulated values are modified according to the discrepancy between the model output and actual data. This is especially important in systems with fractional-order or nonlinear dynamics, where even minor variations can result in considerable forecasting mistakes. The adjustment permits smoother, more accurate future forecasts and guarantees that the simulation does not stray from empirical patterns. It successfully closes the gap between theoretical modeling and empirical reality, assisting the model in better capturing the intricate and dynamic environmental effects of ChatGPT use, such as CO2 emissions, water consumption, and energy consumption [60,61,62,63].
Figure 6.
The time series plots for the fractional orders for the variables (a) , (b) , (c) and (d) for the parameter values as shown in Table 1.
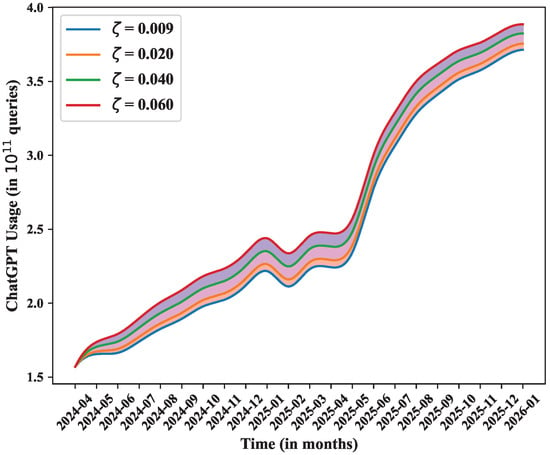
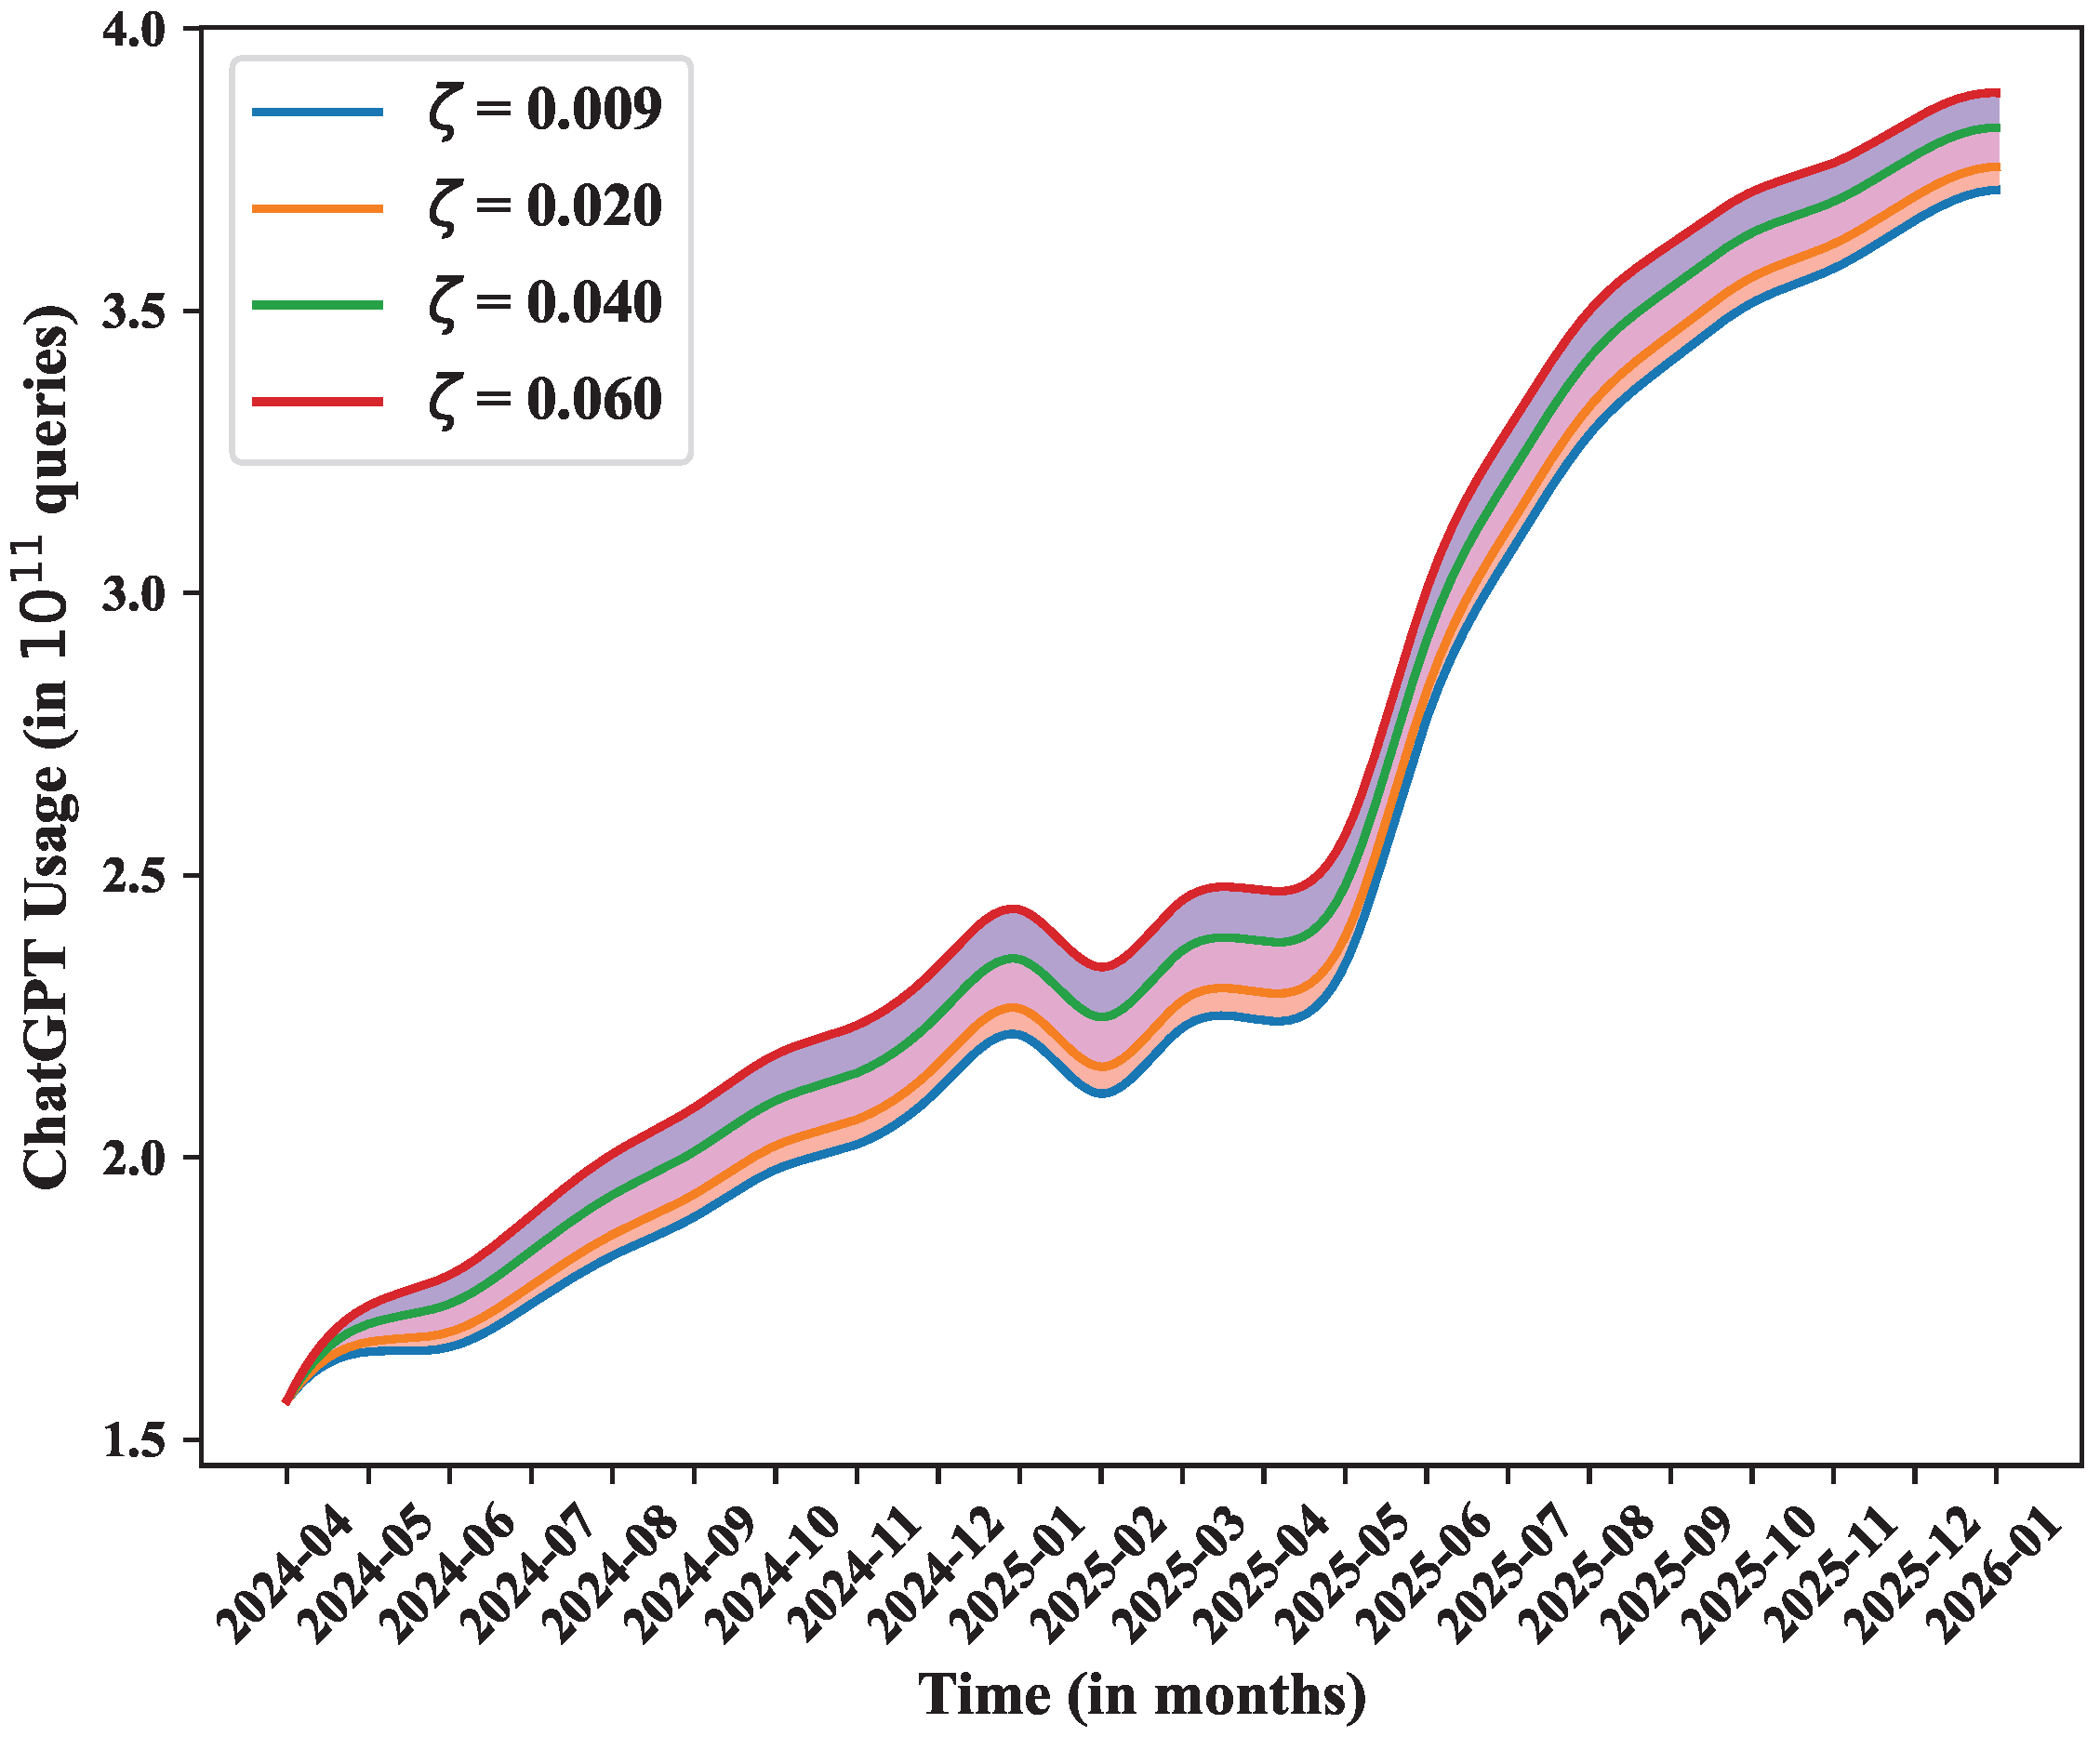
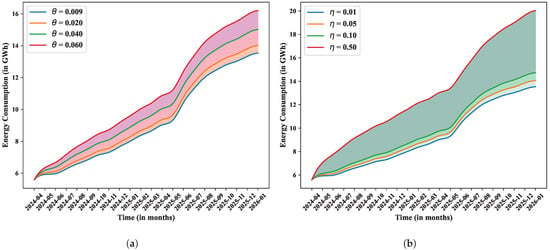
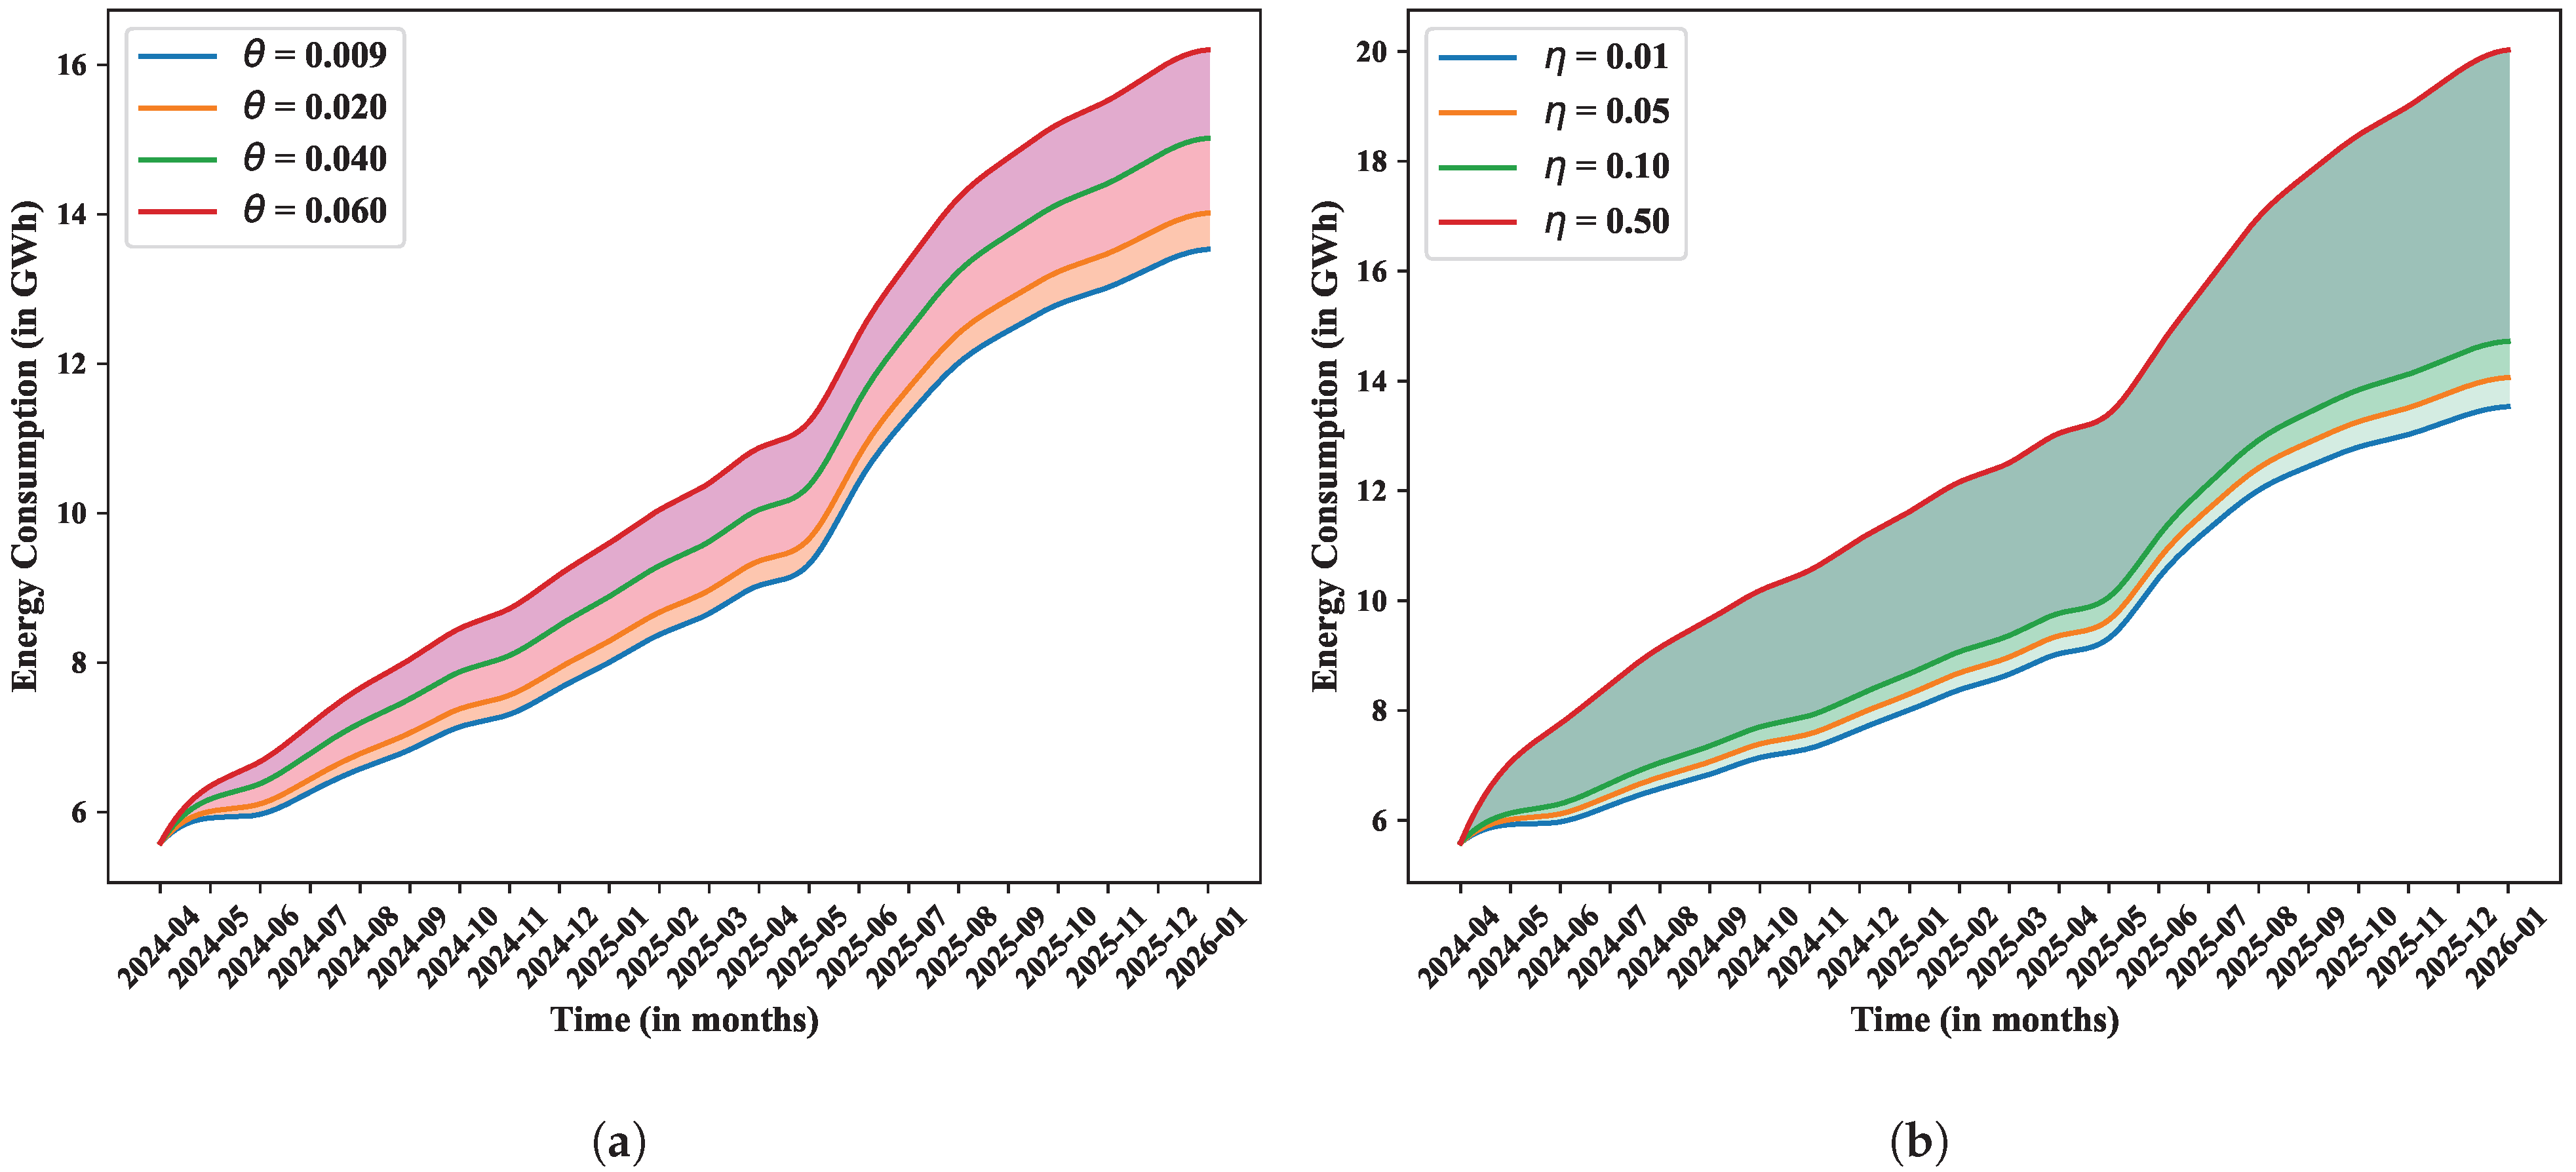
In Figure 7, when the parameter value are changed, the only variable impacted was . Changes in parameter value have a substantial impact on ChatGPT usage time. Both curves steepen with increasing , particularly after mid-2025, suggesting that higher causes resource consumption and emissions to expand more quickly. This parameter probably regulates the model’s feedback sensitivity or rate of environmental resource intake. Thus, seems to be an important environmental sensitivity parameter, and long-term resource use and emissions stability depend on keeping it low. Figure 8, the only variable impacted by changing the parameters is , which is displayed in Figure 8a. Figure 8a illustrates the significant impact of raising on CO2 emissions. Over time, the effect becomes more nonlinear, increasing emissions even at comparable usage levels. This suggests that correlates with the intensity of emissions or dependence on high-carbon energy sources. Reducing through the use of renewable energy is crucial for the development of climate-aligned AI. When the parameter values are changed as indicated in the Figure 8, the only variable impacted was Figure 8b, shows how changes affect CO2 emissions, water use, and ChatGPT usage. All three variables increase more quickly with higher values of , suggesting that most likely controls the rate at which ChatGPT usage grows. Emissions and resource consumption increase with usage. As a result, stands for the rate of technological adoption and is a key factor in assessing the environmental impact of AI growth.
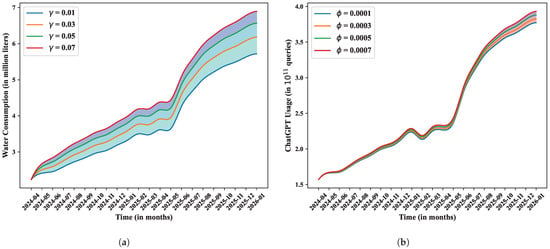
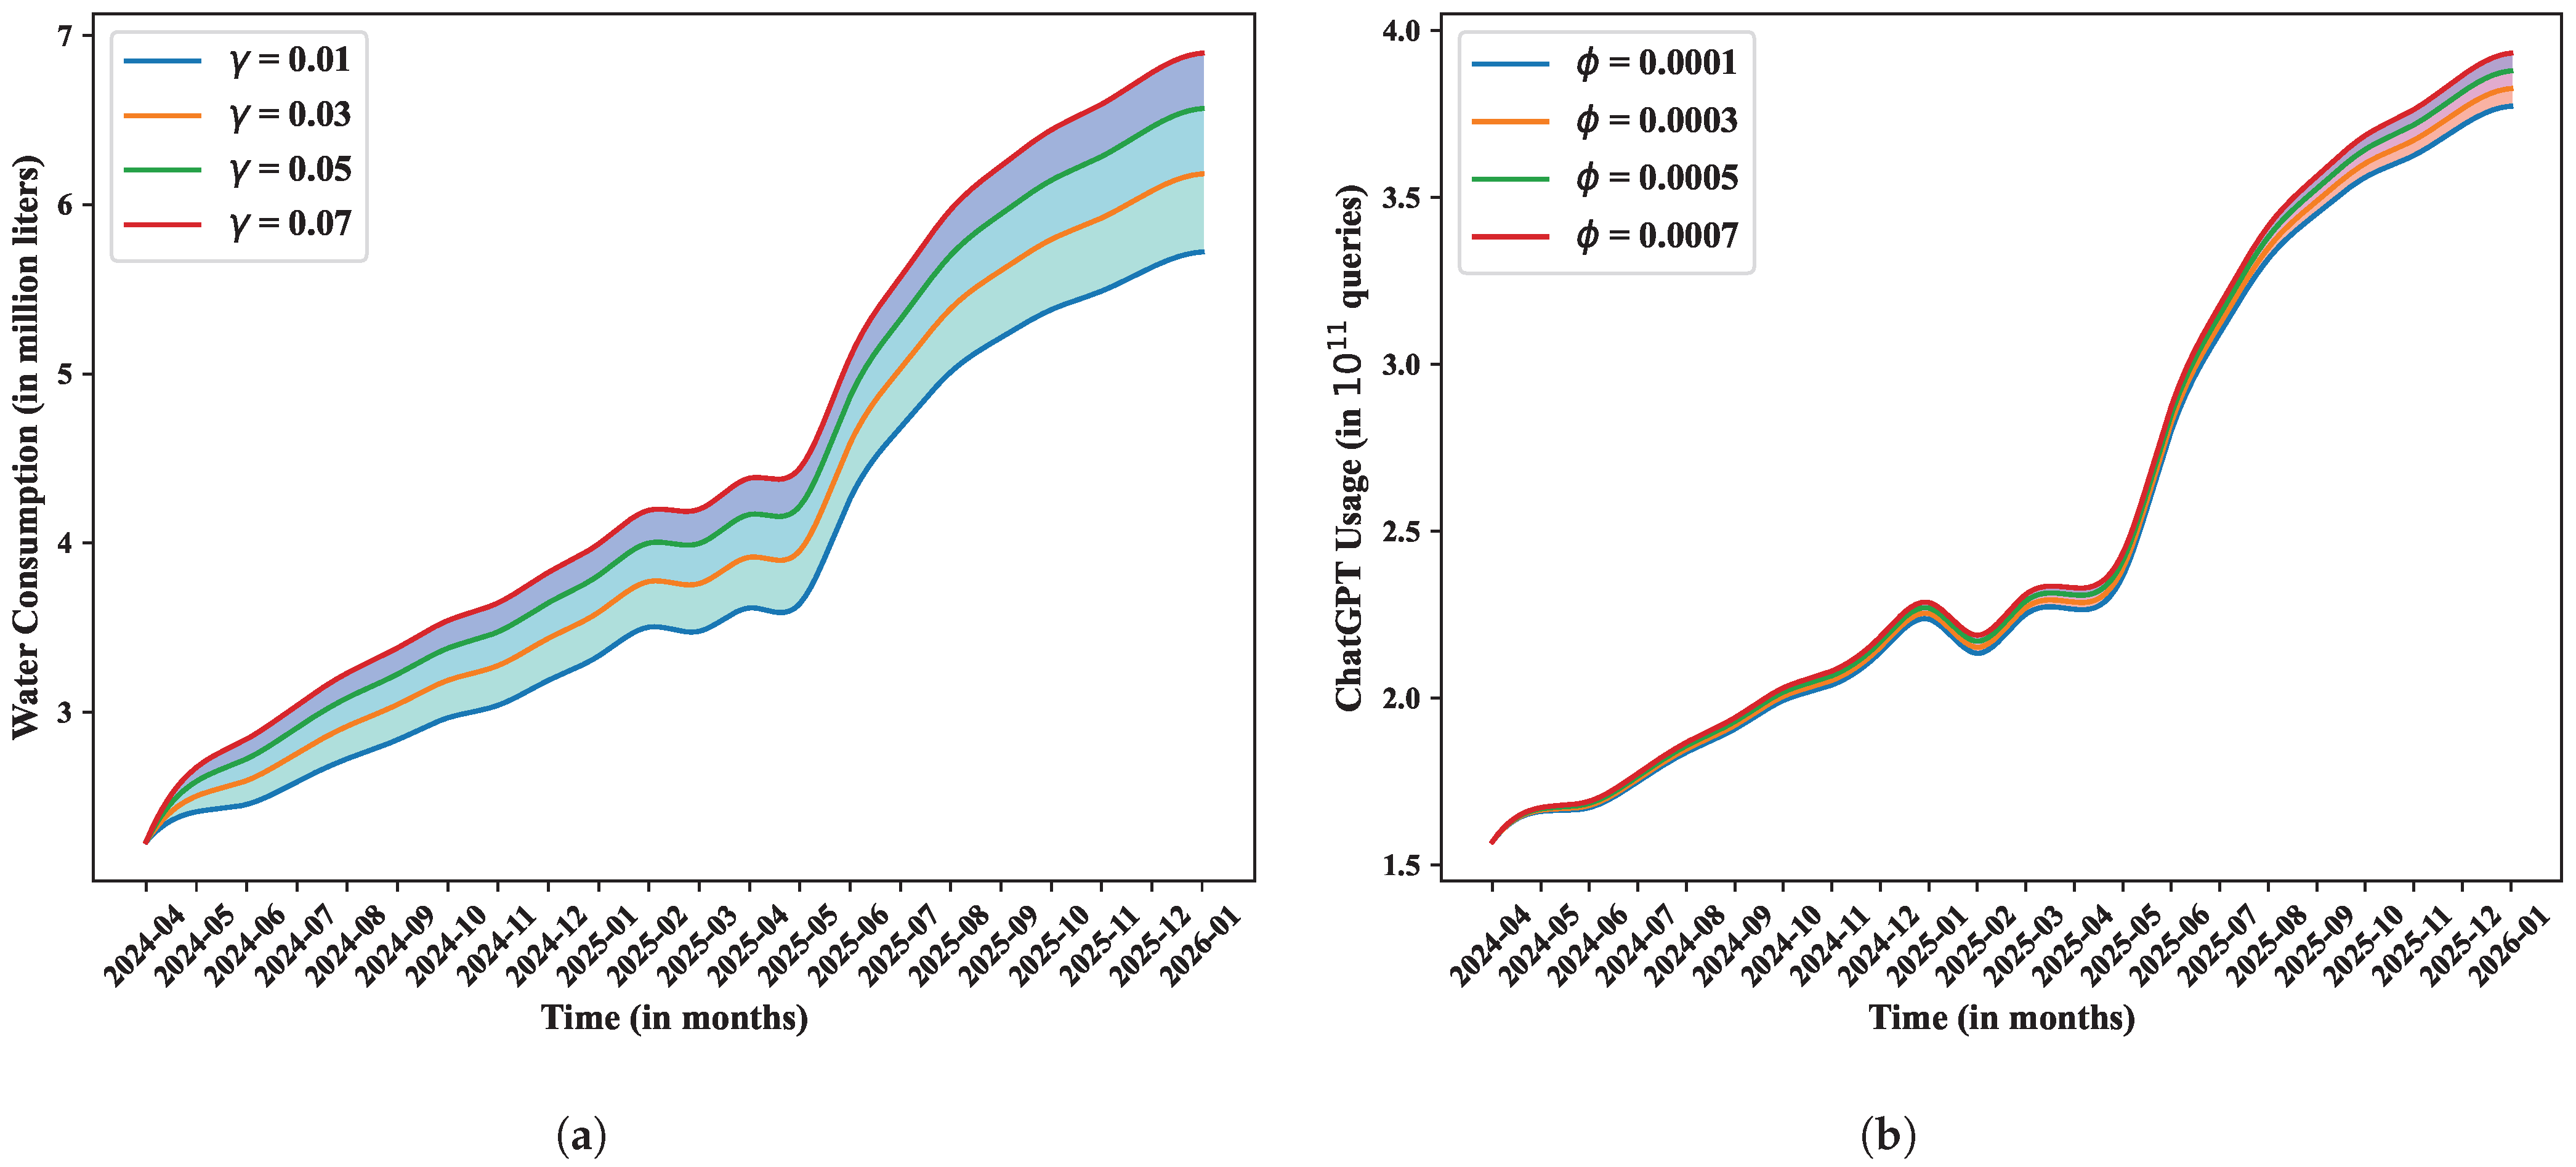
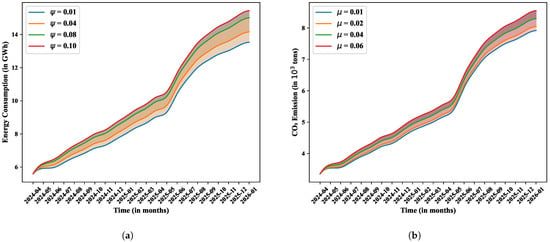
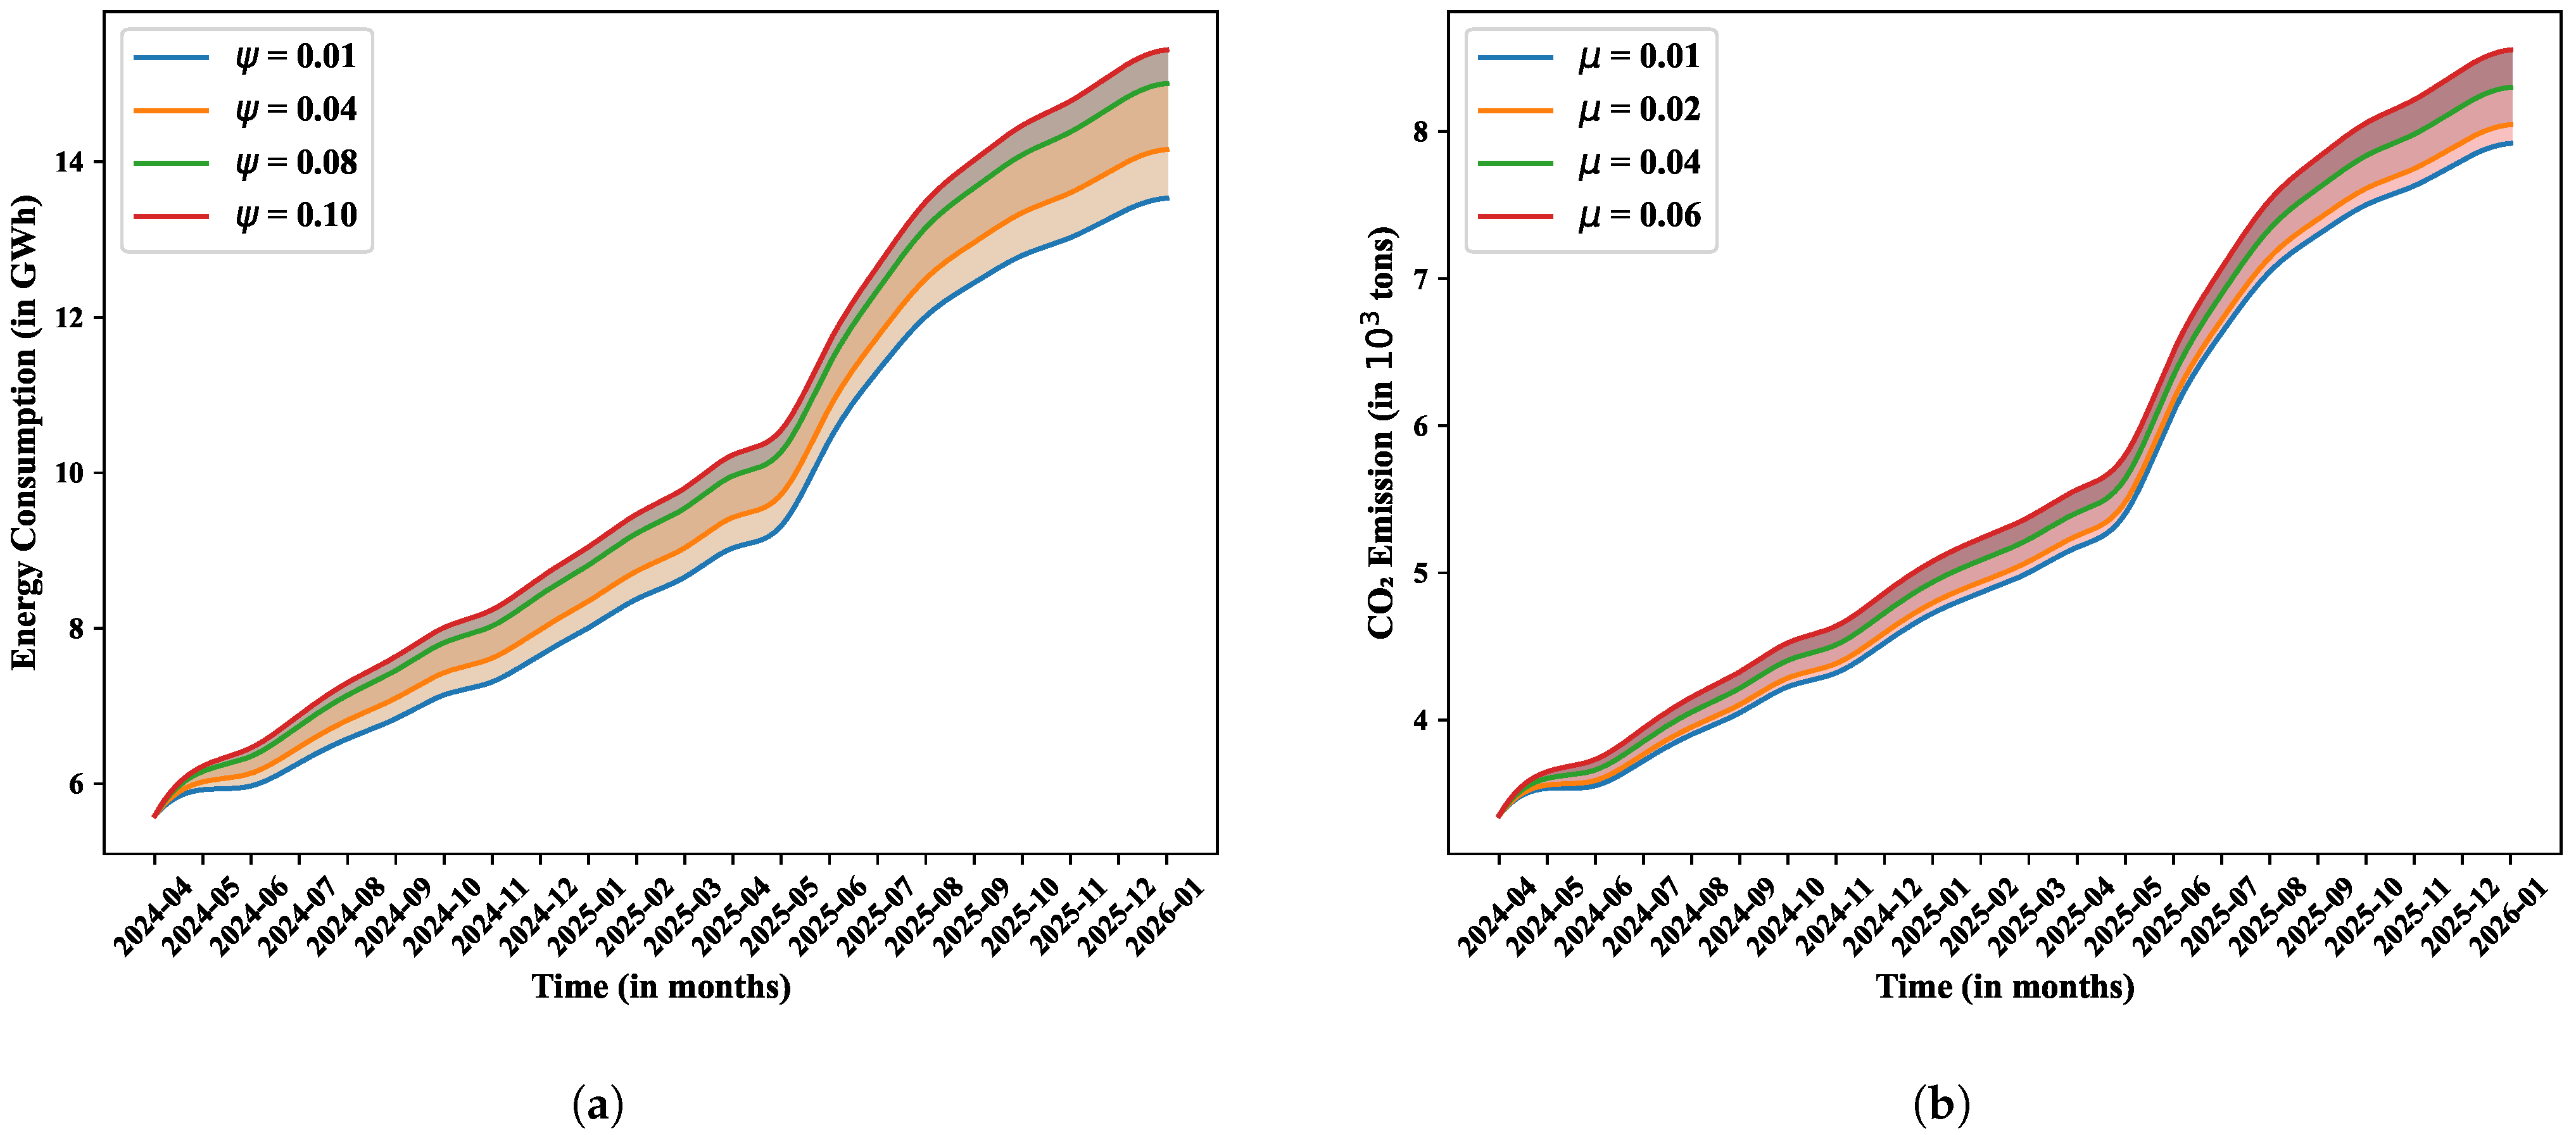
As can be shown in Figure 9, the only variable that is impacted is , Figure 9a when the values of the parameter . shows that energy usage increases dramatically and nonlinearly as a result. There comes a moment at which larger values lead to exponential rises, particularly after mid-2025. This suggests that might represent the system’s scaling effects or energy sensitivity. The high amplification emphasizes that if is not limited, there may be unsustainable energy needs. Additionally, the affected variable, , Figure 9b indicates a constant increase in energy consumption for . Higher values considerably raise total energy consumption over time, even though the curve divergence is not as great as in the situation. This implies that is a secondary growth factor or variables’ coupling coefficient (e.g., energy and utilization). Long-term energy trajectories can be moderated by controlling , shown in the same Figure 9. When the values of the parameter , as shown in Figure 10, indicate that the energy consumption increases more sharply and consistently, the only variable impacted is , Figure 10a. After 2025, the curves’ divergence becomes increasingly apparent. This trend implies that functions as a continuous amplification factor, which could reflect decreased scaling intensity or energy efficiency. Controlling energy growth can be achieved by mitigating through better hardware or algorithms. It is also demonstrated in the same figure that is the variable that is impacted when , Figure 10b. Water use consistently rises as a result of the rising values. After 2025, the gap between curves widens, suggesting that controls water sensitivity in the system, most likely because of data center cooling requirements. This metric emphasizes how crucial water-efficient infrastructure is to implementing scalable AI.
10. Conclusions
In the current study, we have comprehended and explored the environmental effects of artificial intelligence; hence, we have developed a novel mathematical model. As a result, we have established four critical variables: ChatGPT usage, energy consumption, water consumption, and CO2 emissions. We have generalized the proposed model with a fractional operator called the Caputo fractional operator to investigate the relationships between the variables and long-range dependencies. Additionally, this work comprehensively investigates the stability and dynamical behavior of a fractional-order system using a variety of theoretical and computational approaches. The stability of the equilibrium point is studied, and the Lyapunov stability criterion is employed to assess global stability. Determining the boundedness of the system’s solutions guarantees the physical feasibility of the model. To further ensure conditions for the existence and uniqueness of solutions, we used the Picard iterative operator and Banach’s fixed-point theorem. The RK7 numerical method for the integer order and the semi-implicit L1 method for the fractional orders are used for numerical simulation of the system, which accurately captures its long-term behavior and environmental dynamics. The parameter sensitivity analysis is carried out for the parameter that has the most significant influence on the system’s behavior and captures the ecological influences caused by ChatGPT usage.
Furthermore, to increase the effectiveness of our research, we used ML techniques. Specifically, the Prophet ML model is considered for precise predictions by identifying important patterns, seasonality, and data fluctuations. Simultaneously, we examined several mitigation techniques aimed at lowering CO2 emissions, water use, and energy consumption, and we assessed how well these worked compared to the baseline predictions. The study shows how ML and focused tactics might work together to more successfully solve environmental issues by fusing scenario-based analysis and predictive modeling. Also, it reveals the hidden costs of AI convenience by measuring the interconnected consequences of ChatGPT usage on energy, water, and pollution. It highlights the necessity of sustainable AI techniques, including using renewable energy sources, better algorithmic design, and energy-efficient hardware. A forward-looking perspective is made possible by the modeling approach employed in the study, which enables stakeholders to evaluate probable future situations and make appropriate preparations. Therefore, it highlights the environmental costs of conversational AI and promotes a change to more environmentally mindful and conscientious technology use. By offering a thorough framework for comprehending and measuring the environmental impact of AI systems like ChatGPT, this study can help researchers, legislators, and technology developers. It facilitates data-driven decisions targeting ecological harm by modeling the connections between usage, energy consumption, water consumption, and CO2 emissions. A valuable tool for designing sustainable AI infrastructure, fractional calculus, and ML enhances prediction and long-term evaluation accuracy. Ultimately, the research encourages responsible innovation in line with international environmental goals and fosters the creation of greener AI systems.
Author Contributions
S.K.: Conceptualization (equal), Formal analysis (equal), Investigation (equal) Methodology (equal), Software (equal), Validation (equal), Visualization (equal), Writing—original draft (equal). P.V. Formal analysis (equal), Investigation (equal), Supervision (equal), Validation (equal), Writing—review and editing (equal). H.M.B. Formal analysis (equal), Investigation (equal), Supervision (equal), Validation (equal), Writing—review and editing (equal). All authors have read and agreed to the published version of the manuscript.
Funding
The authors received no financial support for the research, authorship, and/or publication of this article.
Data Availability Statement
The authors curated the dataset used in this study. Monthly user numbers were obtained from publicly available sources [64], and corresponding average estimates of variables were derived from data reported across various internet sources. Due to the lack of an officially authenticated or centralized database for these metrics, values were compiled and averaged based on the most consistent and credible online information.
Conflicts of Interest
We, the authors, formally attest that there are no conflicts of interest in the study described in this paper. We declare that we have no financial relationships or affiliations with any groups or entities that might be considered to have a conflict of interest in this research.
References
- Baranyi, J.; Roberts, T.; McClure, P. A non-autonomous differential equation to model bacterial growth. Food Microbiol. 1993, 10, 43–59. [Google Scholar] [CrossRef] [Scilit]
- Blum, W.; Ferri, R.B. Mathematical modelling: Can it be taught and learnt? J. Math. Model. Appl. 2009, 1, 45–58. [Google Scholar]
- Amine, G.; Marouane, L.; Soukaina, B.R.; Marouane, K.; Mostafa, R. On the mathematical modeling and control of leaf movements. Model. Earth Syst. Environ. 2024, 10, 1109–1116. [Google Scholar] [CrossRef] [Scilit]
- Boutiba, M.; Baghli-Bendimerad, S.; El Houda Bouzara-Sahraoui, N. Numerical solution by finite element method for time Caputo-Fabrizio fractional partial diffusion equation. Adv. Math. Models Appl. 2024, 9, 316–328. [Google Scholar]
- Ross, B. A brief history and exposition of the fundamental theory of fractional calculus. In Fractional Calculus and its Applications; Springer: Berlin/Heidelberg, Germany, 1975; pp. 1–36. [Google Scholar]
- Miller, K.S.; Ross, B. An Introduction to the Fractional Calculus and Fractional Differential Equations; Wiley: Hoboken, NJ, USA, 1993. [Google Scholar]
- Gasimov, Y.S.; Napoles-Vald, J.E. Some refinements of Hermite-Hadamard inequality using k-fractional Caputo derivatives. Fract. Differ. Calc. 2022, 12, 209–221. [Google Scholar] [CrossRef] [Scilit]
- Singh, M.S.P. The use of al in today’s technology devices. Stanf. J. 2025, 2. [Google Scholar]
- Journal, S.E. The History of ChatGPT: A Timeline of Generative AI. 2024. Available online: https://www.searchenginejournal.com/history-of-chatgpt-timeline/488370/ (accessed on 18 June 2025).
- Vaswani, A.; Shazeer, N.; Parmar, N.; Uszkoreit, J.; Jones, L.; Gomez, A.N.; Kaiser, Ł; Polosukhin, I. Attention is all you need. In Advances in Neural Information Processing Systems; 2017; Volume 30. [Google Scholar]
- Lucia, B.; Vetter, M.; Patel, V. The dystopian imaginaries of ChatGPT: A designed cycle of fear. Convergence 2025, 31, 1–18. [Google Scholar] [CrossRef] [Scilit]
- Mytton, D. Data centre water consumption. npj Clean Water 2021, 4, 11. [Google Scholar] [CrossRef] [Scilit]
- Wynsberghe, A.V. Sustainable AI: AI for sustainability and the sustainability of AI. AI Ethics 2021, 1, 213–218. [Google Scholar] [CrossRef] [Scilit]
- United Nations. Affordable and Clean Energy Sustainable Development. 2025. Available online: https://www.un.org/sustainabledevelopment/energy/ (accessed on 18 June 2025).
- United Nations. Life Below Water Sustainable Development. 2025. Available online: https://www.un.org/sustainabledevelopment/oceans/ (accessed on 18 June 2025).
- United Nations. Clean Water and Sanitation Sustainable Development. 2025. Available online: https://www.un.org/sustainabledevelopment/water-and-sanitation/ (accessed on 18 June 2025).
- Khan, I.; Han, L.; Khan, H.; Kim Oanh, L.T. Analyzing renewable and nonrenewable energy sources for environmental quality: Dynamic investigation in developing countries. Math. Probl. Eng. 2021, 2021, 3399049. [Google Scholar] [CrossRef] [Scilit]
- Güney, T. Renewable energy, non-renewable energy and sustainable development. Int. J. Sustain. Dev. World Ecol. 2019, 26, 389–397. [Google Scholar] [CrossRef] [Scilit]
- OpenAI. OpenAI Platform. 2025. Available online: https://platform.openai.com/ (accessed on 18 June 2025).
- U.S. Energy Information Administration. US Energy Facts. 2025. Available online: https://www.eia.gov/energyexplained/us-energy-facts/ (accessed on 18 June 2025).
- International Energy Agency. Electricity 2024 Executive Summary. 2024. Available online: https://www.iea.org/reports/electricity-2024/executive-summary (accessed on 18 June 2025).
- Energimyndigheten. Energianvändning i Sveriges Energisystem. 2025. Available online: https://www.energimyndigheten.se/energisystem-och-analys/sveriges-energisystem/hur-fungerar-energisystemet/energianvandning/ (accessed on 18 June 2025).
- Haghighi, S.R.; Saqalaksari, M.P.; Johnson, S.N. Artificial intelligence in ecology: A commentary on a chatbot’s perspective. Bull. Ecol. Soc. Am. 2023, 104, e2097. [Google Scholar] [CrossRef] [Scilit]
- Patterson, D.; Gonzalez, J.; Hölzle, U.; Le, Q.; Liang, C.; Munguia, L.M.; Rothchild, D.; So, D.R.; Texier, M.; Dean, J. The carbon footprint of machine learning training will plateau, then shrink. Computer 2022, 55, 18–28. [Google Scholar] [CrossRef] [Scilit]
- Jiang, P.; Sonne, C.; Li, W.; You, F.; You, S. Preventing the immense increase in the life-cycle energy and carbon footprints of LLM-powered intelligent chatbots. Engineering 2024, 40, 202–210. [Google Scholar] [CrossRef] [Scilit]
- Jia, Y. Analysis of the Impact of Artificial Intelligence on Electricity Consumption. In Proceedings of the 2024 3rd International Conference on Artificial Intelligence, Internet of Things and Cloud Computing Technology (AIoTC), Wuhan, China, 13–15 September 2024; pp. 57–60. [Google Scholar]
- Li, Y.; Chen, Y.; Podlubny, I. Stability of fractional-order nonlinear dynamic systems: Lyapunov direct method and generalized Mittag-Leffler stability. Comput. Math. Appl. 2010, 59, 1810–1821. [Google Scholar] [CrossRef] [Scilit]
- Håkans, O. The environmental impact of using Artificial Intelligence: Exploring the Environmental Impact of ChatGPT: A Literature Study and User Perception Analysis. 2025. Available online: https://share.google/gSEZKN7Cc6Oqs6b1G (accessed on 18 June 2025).
- George, A.S.; George, A.H.; Martin, A.G. The environmental impact of AI: A case study of water consumption by Chat GPT. Partn. Univers. Int. Innov. J. 2023, 1, 97–104. [Google Scholar]
- Li, P.; Yang, J.; Islam, M.A.; Ren, S. Making AI less “thirsty”: Uncovering and addressing the secret water footprint of AI models. arXiv 2023, arXiv:2304.03271. [Google Scholar] [CrossRef] [Scilit]
- Energilösningar, E. Vattenförbrukning i Villa vad är Normal Förbrukning? 2025. Available online: https://www.eon.se/el/guider-tips/el-vattenforbrukning (accessed on 18 June 2025).
- O’Brien, M.; Fingerhut, H. Artificial Intelligence Technology Behind ChatGPT was Built in Iowa with a Lot of Water. 2023. Available online: https://apnews.com/article/chatgpt-gpt4-iowa-ai-water-consumption-microsoft-f551fde98083d17a7e8d904f8be822c4 (accessed on 18 June 2025).
- Singh, S. ChatGPT Statistics 2025—DAU & MAU Data [Worldwide]. 2025. Available online: https://www.demandsage.com/chatgpt-statistics/ (accessed on 18 June 2025).
- Das, A. AI chatbots may be fun, but they have a drinking problem. Foundry J. 2023, 26, 27–30. [Google Scholar]
- Smartly, AI. The Carbon Footprint of ChatGPT: How Much CO2 Does a Query Generate? 2024. Available online: https://smartly.ai/blog/the-carbon-footprint-of-chatgpt-how-much-co2-does-a-query-generate (accessed on 19 June 2025).
- Tomlinson, B.; Black, R.W.; Patterson, D.J.; Torrance, A.W. The carbon emissions of writing and illustrating are lower for AI than for humans. Sci. Rep. 2024, 14, 3732. [Google Scholar] [CrossRef] [Scilit]
- Rogosin, S. The role of the Mittag-Leffler function in fractional modeling. Mathematics 2015, 3, 368–381. [Google Scholar] [CrossRef] [Scilit]
- Haubold, H.J.; Mathai, A.M.; Saxena, R.K. Mittag-Leffler functions and their applications. J. Appl. Math. 2011, 2011, 298–628. [Google Scholar] [CrossRef] [Scilit]
- Podlubny, I. Fractional Differential Equations; Academic Press: San Diego, CA, USA, 1999. [Google Scholar]
- Matignon, D. Stability results for fractional differential equations with applications to control processing. In Proceedings of the Computational Engineering in Systems Applications, Lille, France, 9–12 July 1996; Volume 2, pp. 963–968. [Google Scholar]
- Li, H.L.; Zhang, L.; Hu, C.; Jiang, Y.L.; Teng, Z. Dynamical analysis of a fractional-order predator-prey model incorporating a prey refuge. J. Appl. Math. Comput. 2017, 54, 435–449. [Google Scholar] [CrossRef] [Scilit]
- Wang, B.; Chen, L.Q. Asymptotic stability analysis with numerical confirmation of an axially accelerating beam constituted by the standard linear solid model. J. Sound Vib. 2009, 328, 456–466. [Google Scholar] [CrossRef] [Scilit]
- Aguila-Camacho, N.; Duarte-Mermoud, M.A.; Gallegos, J.A. Lyapunov functions for fractional order systems. Commun. Nonlinear Sci. Numer. Simul. 2014, 19, 2951–2957. [Google Scholar] [CrossRef] [Scilit]
- Martcheva, M. An Introduction to Mathematical Epidemiology; Springer: Berlin/Heidelberg, Germany, 2015; Volume 61. [Google Scholar]
- Diethelm, K.; Ford, N.J. Analysis of fractional differential equations. J. Math. Anal. Appl. 2002, 265, 229–248. [Google Scholar] [CrossRef] [Scilit]
- Mahesh, B. Machine learning algorithms-A review. Int. J. Sci. Res. 2020, 9, 381–386. [Google Scholar] [CrossRef] [Scilit]
- Samuel, A.L. Some studies in machine learning using the game of checkers. IBM J. Res. Dev. 1959, 3, 210–229. [Google Scholar] [CrossRef] [Scilit]
- Mitchell, T.M. Does machine learning really work? AI Mag. 1997, 18, 11. [Google Scholar]
- Shen, J.; Valagolam, D.; McCalla, S. Prophet forecasting model: A machine learning approach to predict the concentration of air pollutants (PM2.5, PM10, O3, NO2, SO2, CO) in Seoul, South Korea. PeerJ 2020, 8, e9961. [Google Scholar] [CrossRef] [Scilit]
- Yurdagül, H.H.; Özdemir, H.; Seller, A.; Ulus, F.C.; Akay, M.F. Staff churn and lifetime prediction using machine learning. Int. J. Math. Comput. Eng. 2025, 3, 325–348. [Google Scholar] [CrossRef] [Scilit]
- Öztürk, M.E.; Tunç, A.A.; Akay, M.F. Machine learning based churn analysis for sellers on the e-commerce marketplace. Int. J. Math. Comput. Eng. 2023, 1, 171–176. [Google Scholar] [CrossRef] [Scilit]
- Oduleye, B.E. The future of web application security: Opportunities and challenges for machine learning-based techniques. Int. J. Math. Comput. Eng. 2026, 4, 11–32. [Google Scholar] [CrossRef] [Scilit]
- Burnley, S.J. A review of municipal solid waste composition in the United Kingdom. Waste Manag. 2007, 27, 1274–1285. [Google Scholar] [CrossRef] [Scilit]
- Trikkaliotis, G.D.; Gousidou-Koutita, M.C. Production of the reduction formula of seventh order Runge-Kutta method with step size control of an ordinary differential equation. Appl. Math. 2022, 13, 325–337. [Google Scholar] [CrossRef]
- Zeng, F.; Turner, I.; Burrage, K.; Karniadakis, G.E. A new class of semi-implicit methods with linear complexity for nonlinear fractional differential equations. SIAM J. Sci. Comput. 2018, 40, A2986–A3011. [Google Scholar] [CrossRef] [Scilit]
- Ji, B.; Liao, H.l.; Zhang, L. Simple maximum principle preserving time-stepping methods for time-fractional Allen-Cahn equation. Adv. Comput. Math. 2020, 46, 37. [Google Scholar] [CrossRef] [Scilit]
- Mustapha, K. An L1 approximation for a fractional reaction-diffusion equation, a second-order error analysis over time-graded meshes. SIAM J. Numer. Anal. 2020, 58, 1319–1338. [Google Scholar] [CrossRef] [Scilit]
- Pazó, D.; Carrassi, A.; López, J.M. Data assimilation by delay-coordinate nudging. Q. J. R. Meteorol. Soc. 2016, 142, 1290–1299. [Google Scholar] [CrossRef] [Scilit]
- Meshram, S.G.; Powar, P.L.; Singh, V.P.; Meshram, C. Application of cubic spline in soil erosion modeling from Narmada Watersheds, India. Arab. J. Geosci. 2018, 11, 362. [Google Scholar] [CrossRef] [Scilit]
- Farchi, A.; Laloyaux, P.; Bonavita, M.; Bocquet, M. Using machine learning to correct model error in data assimilation and forecast applications. Q. J. R. Meteorol. Soc. 2021, 147, 3067–3084. [Google Scholar] [CrossRef] [Scilit]
- Cheng, S.; Quilodrán-Casas, C.; Ouala, S.; Farchi, A.; Liu, C.; Tandeo, P.; Fablet, R.; Lucor, D.; Iooss, B.; Brajard, J.; et al. Machine learning with data assimilation and uncertainty quantification for dynamical systems: A review. IEEE/CAA J. Autom. Sin. 2023, 10, 1361–1387. [Google Scholar] [CrossRef] [Scilit]
- Aljarrah, H.; Alaroud, M.; Ishak, A.; Darus, M. Adaptation of residual-error series algorithm to handle fractional system of partial differential equations. Mathematics 2021, 9, 2868. [Google Scholar] [CrossRef] [Scilit]
- Ghorbani, A.; Ghorbani, V.; Nazari-Heris, M.; Asadi, S. Data assimilation for agent-based models. Mathematics 2023, 11, 4296. [Google Scholar] [CrossRef] [Scilit]
- First Page Sage. ChatGPT Usage Statistics: July 2025. 2025. Available online: https://firstpagesage.com/seo-blog/chatgpt-usage-statistics/ (accessed on 15 June 2025).

Disclaimer/Publisher’s Note: The statements, opinions and data contained in all publications are solely those of the individual author(s) and contributor(s) and not of MDPI and/or the editor(s). MDPI and/or the editor(s) disclaim responsibility for any injury to people or property resulting from any ideas, methods, instructions or products referred to in the content. |
© 2026 by the authors. Licensee MDPI, Basel, Switzerland. This article is an open access article distributed under the terms and conditions of the Creative Commons Attribution (CC BY) license.