


Abstract
Granular materials subjected to complex stress histories exhibit pronounced path dependence, multi-scale heterogeneity and scale-invariant characteristics, especially when particle breakage leads to gradation evolution with fractal features. Discrete element simulations are performed on granular assemblies with prescribed idealized fractal gradations under constant stress ratio loading–turning paths, while maintaining identical solid volume and initial relative density. The results show that, for a given gradation, both the peak strength envelope and the critical state line exhibit high consistency and are effectively independent of the examined stress paths, which are supported by high R2 values from regression. At the critical state, microstructural parameters together with energy measures consistently follow stable power–law relationships with mean effective stress. For different gradations, the critical stress ratio remains nearly unchanged, whereas peak strength increases with increasing fractal dimensions; although critical state points remain nearly collinear in the deviatoric stress (q) –mean effective stress (p) plane, the critical state line in void ratio (e)–p plane shifts downward as the particle size distribution becomes broader. The evolution of microstructural and energy-related power–law relationships with fractal dimension exhibits a clear saturation trend. This study demonstrates that, within the simulated framework, fractal gradation primarily governs the position of the critical state in e–p space without altering its fundamental path-independent nature, providing fundamental insights into the multi-scale mechanics of graded granular materials under complex loading.
1. Introduction
Granular materials are ubiquitous in high rockfill dams and many geotechnical systems, where their mechanical behavior is characterized by pronounced heterogeneity, strong path dependence and intrinsic multi-scale features [1,2]. Field observations from large rockfill dams indicate that, during construction, stress evolution within the dam body often follows approximately constant stress ratio paths, whereas during reservoir impoundment and operational stages, stress paths may undergo directional turning in the q–p space [3,4]. Such complex loading histories induce spatially dependent mechanical responses and play a critical role in controlling deformation and stability [5,6].
As the dam height increases, the stress level acting on granular materials rises accordingly. Once applied stress exceeds the strength of individual particles, particle breakage occurs, leading to the generation of fines and progressive broadening of the particle size distribution [7]. This breakage-induced gradation evolution results in continuous reorganization of the load-bearing skeleton and force-chain network, fundamentally altering the macroscopic mechanical behavior [8,9]. These processes highlight that the evolution of granular materials is governed not only by stress paths, but also by scale-dependent mechanisms such as particle fragmentation, gradation redistribution and force-chain restructuring.
Extensive experimental and numerical studies have shown that particle size distributions produced by breakage commonly exhibit fractal characteristics [10,11,12]. Consequently, the fractal dimension has emerged as a powerful descriptor for quantifying gradation evolution and internal structural complexity in granular systems [13]. From a broader perspective, fractal theory provides a natural framework for describing scale invariance, self-similarity and power-law distributions that are widely observed in granular materials. In parallel, fractional-order and multi-scale modeling approaches have gained increasing attention for their ability to capture non-local interactions, memory effects and long-range correlations in complex materials [14,15]. These developments have significantly advanced the theoretical foundations for understanding granular behavior beyond classical continuum descriptions.
Within this study, the discrete element method (DEM), when combined with fractal gradations, offers a particularly suitable platform for exploring the scale transition from particle-scale mechanics to macroscopic responses [16,17,18]. DEM simulations enable direct access to microstructural variables such as fabric anisotropy, coordination number, force-chain topology and energy dissipation, which are essential for revealing the emergence of macroscopic laws from microscopic interactions [19,20]. Notably, the critical state of granular materials is often associated with scale-invariant behavior and power–law relationships between stress, structure and energy variables, suggesting a close connection between critical state mechanics and fractal concepts [21,22,23].
Despite these advances, a systematic understanding that integrates these three aspects, i.e., fractal gradation, complex stress paths, and the uniqueness of the critical state, remains underdeveloped. Prior studies have often treated these elements in isolation. Research on particle breakage has established the downward shift in the CSL with gradation broadening but typically employs simplified stress paths [24]; DEM investigations into fabric evolution have revealed power-law scaling at the critical state but are largely confined to fixed gradations [25]; while fractal dimensions are widely adopted, their coupled effect with stress paths on the complete set of macro–micro-energetic critical state characteristics is not fully investigated. Consequently, it is still unclear how, under the dual control of prescribed fractal dimensions and constant stress ratio loading–turning paths, the relationships between mean effective stress and key microstructural (e.g., fabric anisotropy, coordination number) and energetic descriptors at the critical state are preserved.
Motivated by this specific gap, the present study performs a comprehensive DEM investigation on granular materials with idealized fractal gradations subjected to constant stress ratio loading–turning paths. The path dependence of both the peak strength envelope and the critical state line for a given gradation and how the critical state line shifts in e–p space with increasing D are systematically examined. Furthermore, the analysis extends to the scaling relationships between the mean effective stress and key microstructural descriptors at the critical state, including fabric anisotropy, coordination number, and energy components, across given idealized fractal gradations and stress paths. This work aims to provide multi-scale evidence that links the evolution of fractal gradation to the critical state under complex loading histories.
2. DEM Modeling
2.1. DEM Model with Different Gradings
During the particle breakage process, large grains progressively fracture into smaller fragments, resulting in a continuous enrichment of fines and widening of the particle size distribution [26,27]. This evolutionary process is commonly reflected by an increase in the fractal dimension D, which has been widely recognized as an effective index to characterize the degree of fragmentation and the particle size distribution can be described by the following equation [28]:
where d is the particle size; dmax is the maximum particle size; M (L < d) is the granular mass less than particle size d; MT is the total mass.
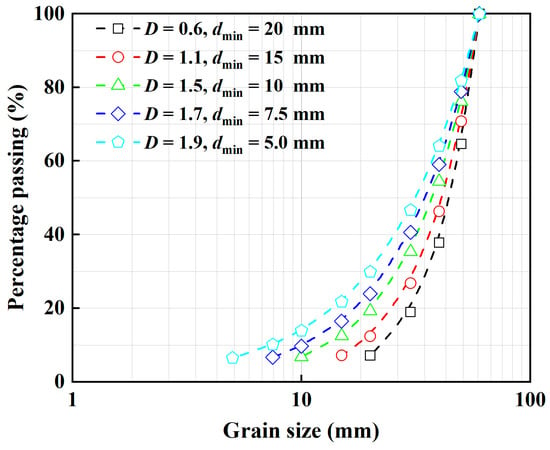
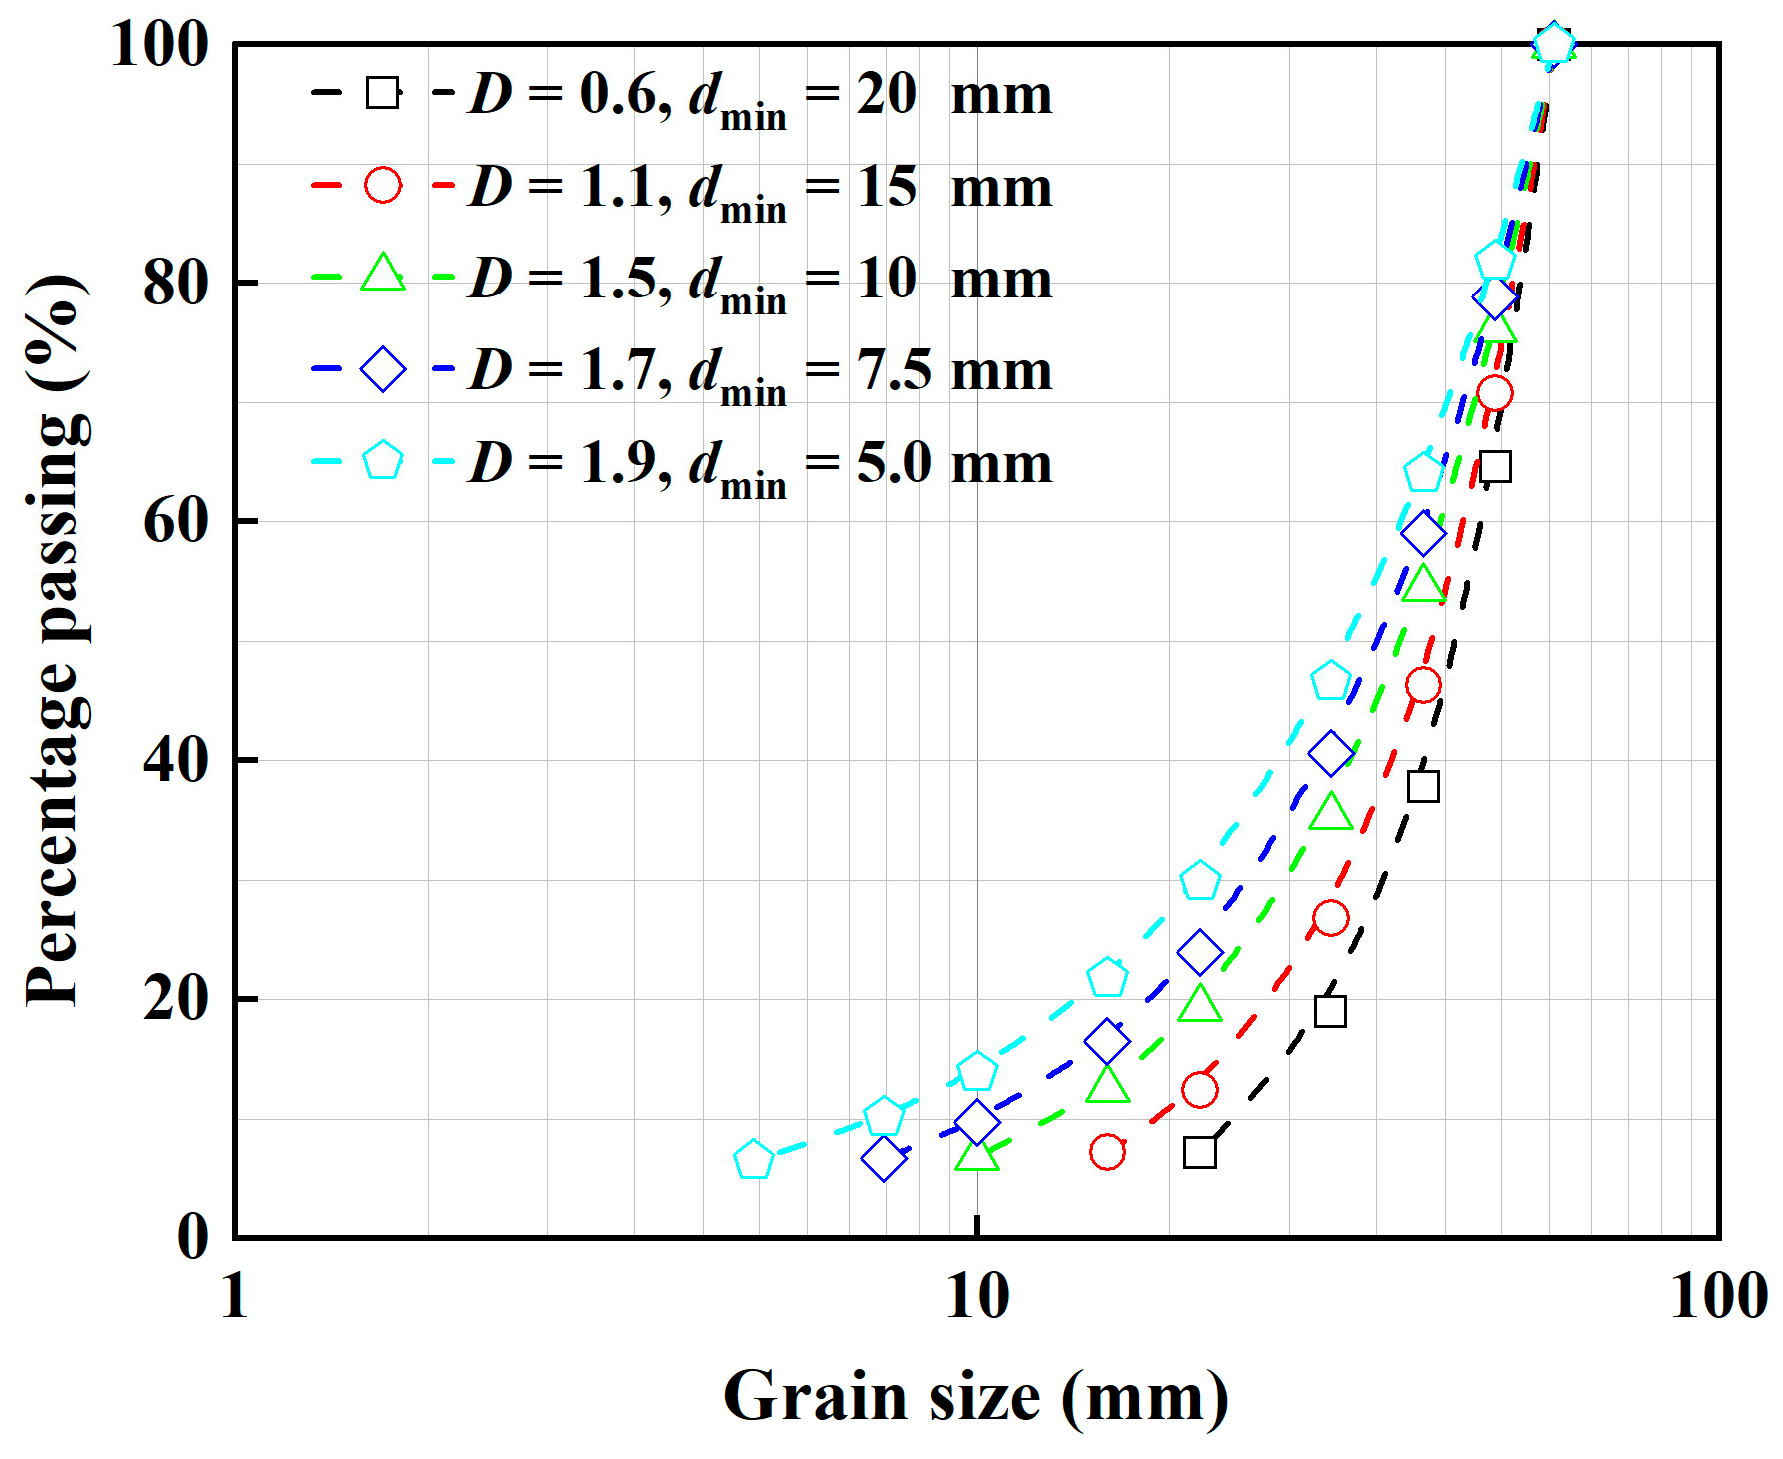
Five representative fractal dimensions, D = 0.6, 1.1, 1.5, 1.7, 1.9, were selected as a controlling variable to generate a spectrum of idealized gradations, enabling a systematic investigation of how the breadth of particle size distribution influences mechanical behavior. These values span from weakly graded systems with limited fine content to highly fractal and well-graded assemblies enriched with a substantial amount of fine particles, thereby covering a broad and continuous spectrum of gradation states typically observed in fragmentation-dominated granular materials. As shown in Figure 1, the minimum particle size dmin decreases from 20.0 mm to 5.0 mm with increasing fractal dimension. It is worth noting that the total solid particle volume Vs is maintained constant for all specimens with different gradations.
Figure 1.
Particle size distribution of DEM specimens with different fractal dimension D.
In preparing DEM specimens, it is generally required that the initial states of different samples remain comparable, typically by ensuring either the same porosity or relative density. In this study, all numerical specimens were prepared with identical initial relative density conditions. Specifically, during the pre-consolidation stage to 20 kPa, the same inter-particle sliding friction coefficient of 0.5 was assigned to all samples to achieve a uniform compaction state. This specimen preparation procedure is consistent with those adopted by De Frias Lopez et al. [29] and Minh et al. [30].
The numerical sample had an initial dimension of 300 mm (W) × 300 mm (D) × 600 mm (H). The input parameters are listed in Table 1, which were chosen based on trial calculations and show similar characteristics to those reported in the literature [31], suggesting their overall reasonableness. The linear-based rolling resistance model was used in PFC3D 5.0 software, and the stiffness kn of a particle with size d was calculated using the elastic contact modulus, Ec
Table 1.
Input parameters for three-dimensional DEM simulation.
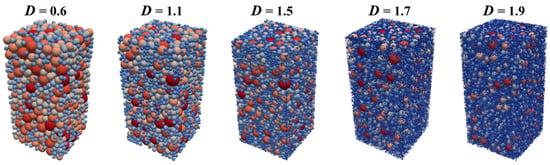
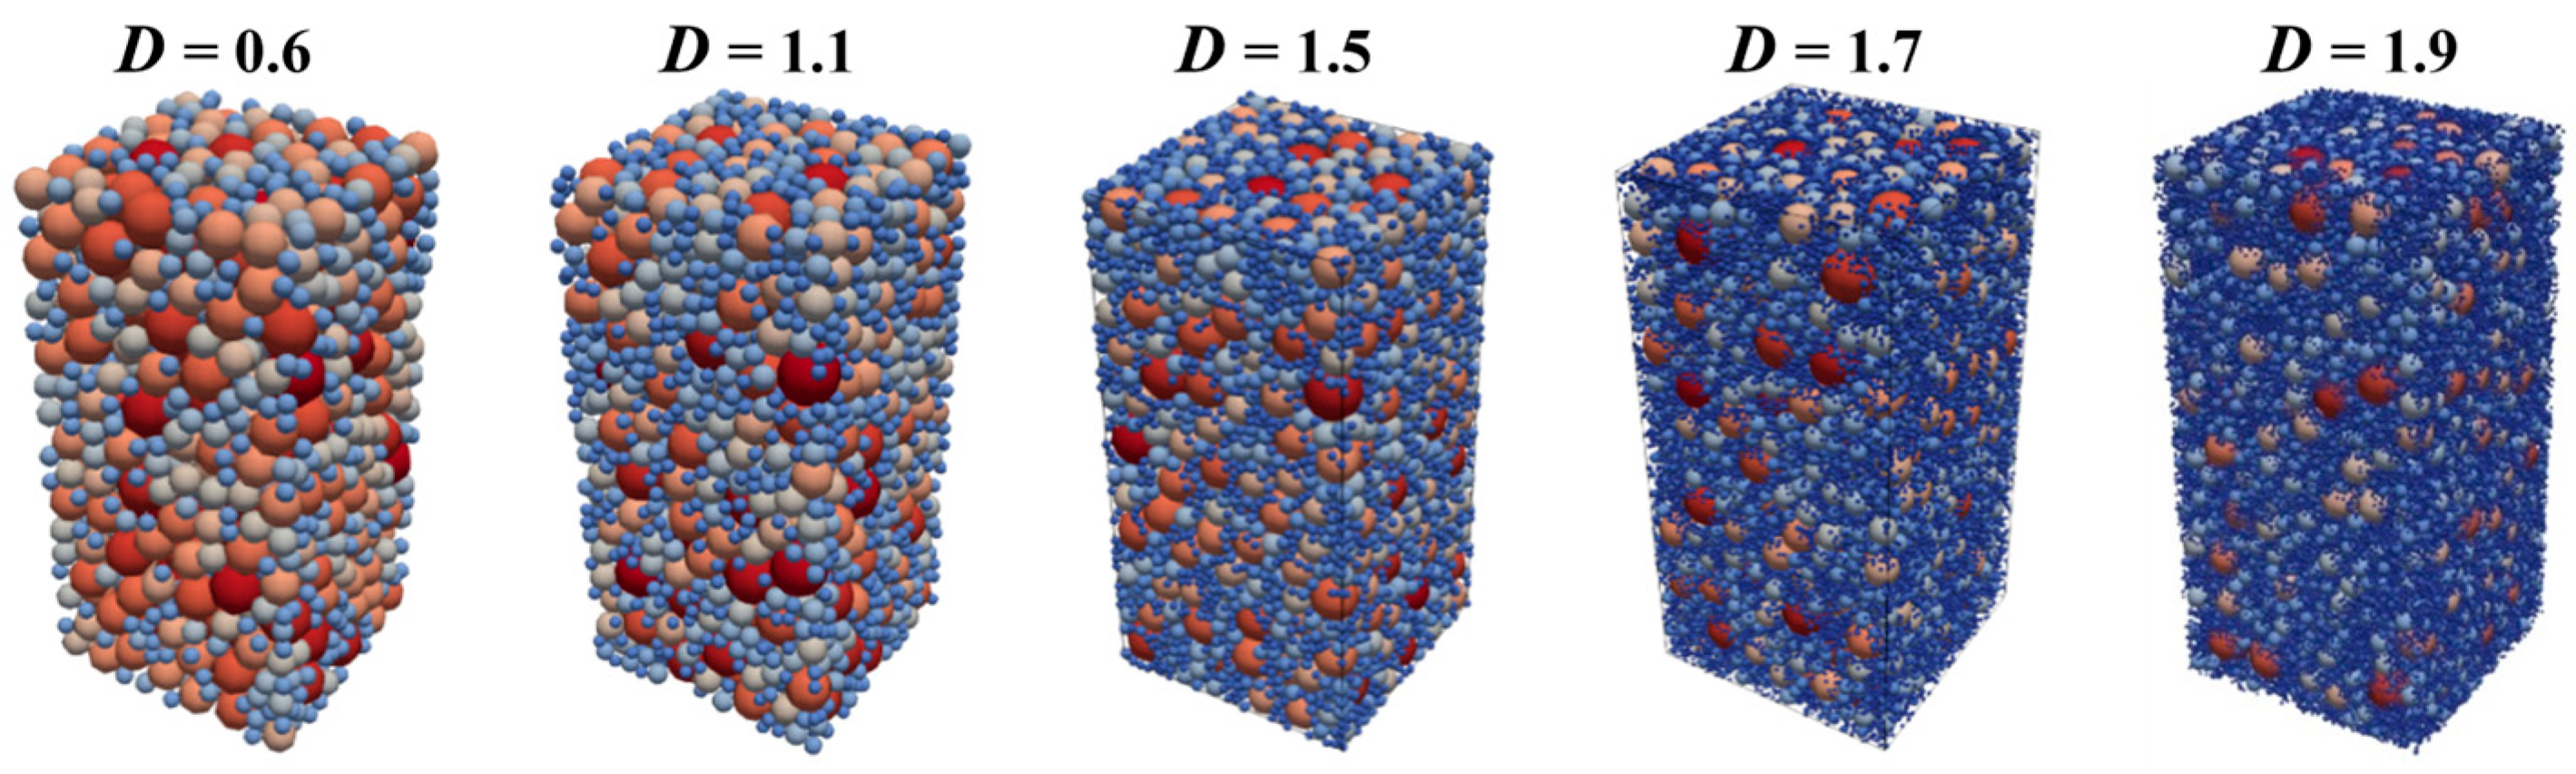
After pre-consolidation to 20 kPa, the front views of the specimens with different fractal dimensions are shown in Figure 2. Detailed information on the DEM samples, including the coefficient of uniformity, coefficient of curvature, maximum and minimum particle sizes, and the number of particles, is summarized in Table 2.
Figure 2.
Sectional elevation of DEM specimens with different fractal dimension D.
Table 2.
Information on the DEM specimens with different fractal dimension D.
2.2. Simulation of Constant Loading–Transitional Stress Paths
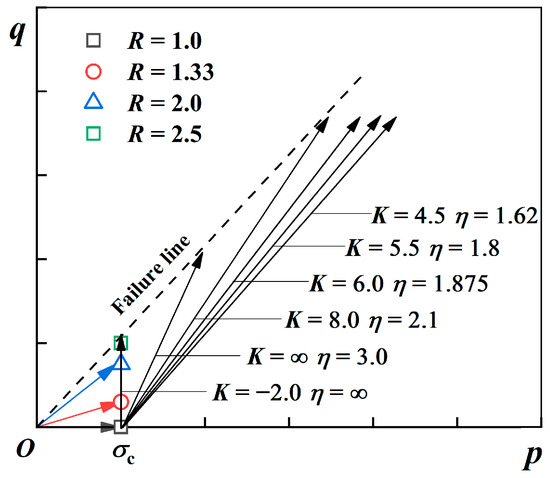
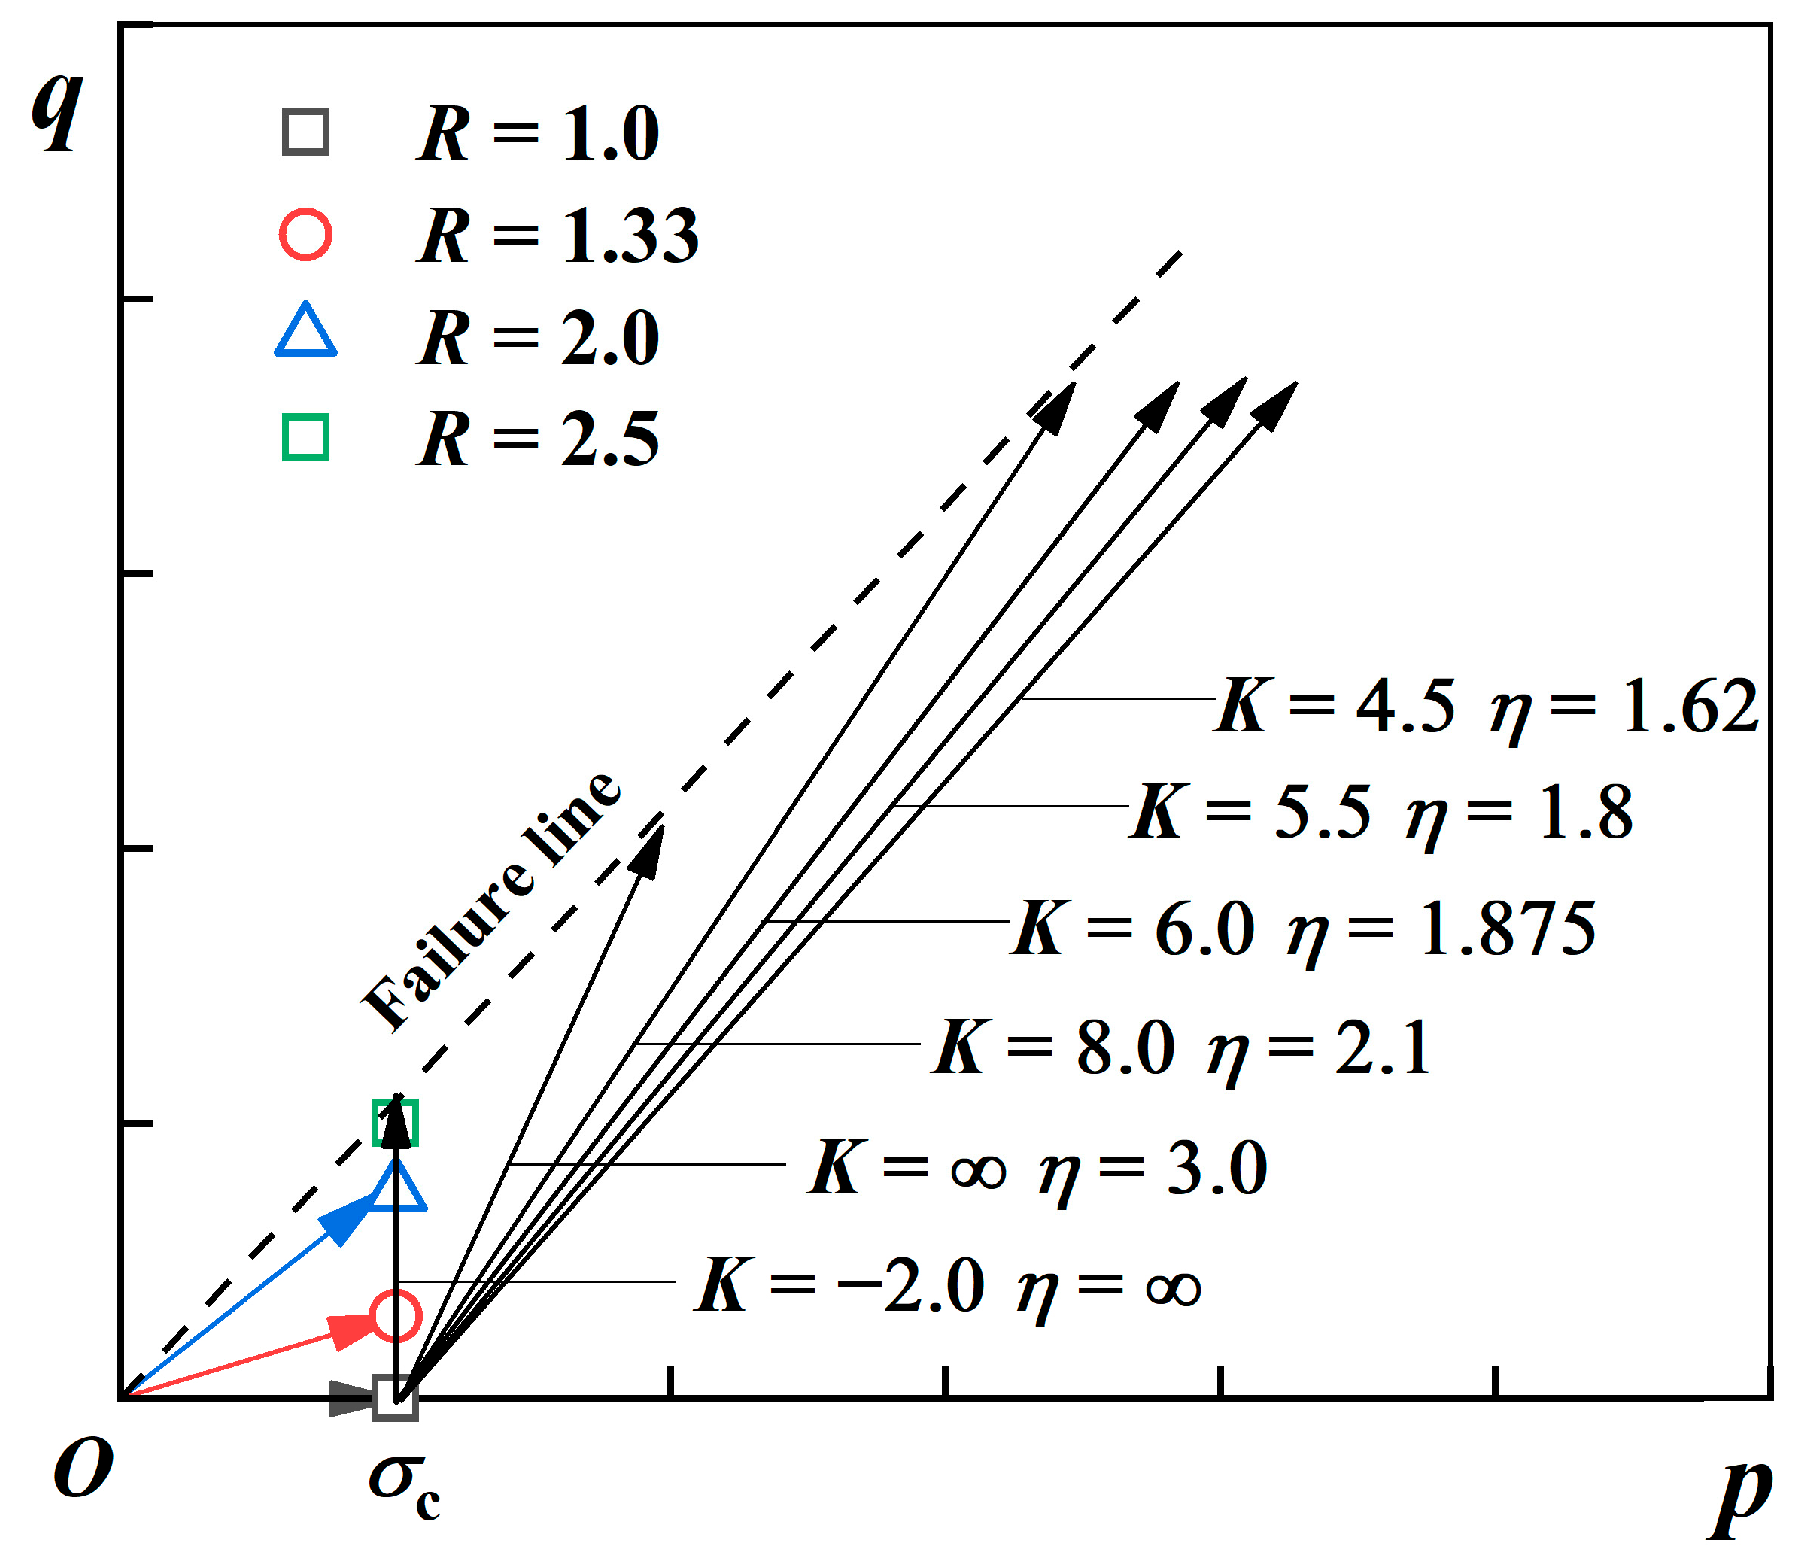
In the numerical simulations, the stress paths during the dam construction stage were first considered. Numerical specimens with different gradations were subjected to constant stress ratio loading paths with various values of R = σ1/σ3. In q–p space, this path is a straight ray from the initial point. The stress ratio η and the terminal point (p0, q0) at the end of this stage are uniquely defined by R and σc:
A value of R = 1.0 corresponds to isotropic loading, while R ≠ 1 represents anisotropic loading, thereby allowing the generation of different levels of initial anisotropy through the control of R.
Subsequently, constant stress ratio transitional path tests were performed with principal stress increment ratios K = Δσ1/Δσ3, to simulate the condition in which both the major principal stress σ1 and the minor principal stress σ3 increase simultaneously during reservoir impoundment on the downstream rockfill zone. Expressing the current deviatoric stress q and mean effective stress p′ in terms of the axial stress increment Δσ1 yields the governing equation for the path in q–p space:
Among these paths, K = +∞ corresponds to the conventional triaxial compression path, while K = −2.0 represents an equal–p path.
During the constant stress ratio loading process, vertical compression was applied under strain control at a constant rate of 10−2/s and a stress servo-controlled system was applied to the lateral walls to gradually increase the confining pressure until it reached the target value σc. In the next stress transitional path, to ensure the specimen reached the critical state, shearing was continued to a maximum axial strain ε1 of 30.0%, at which deformation occurred at constant volume and constant stresses. The critical state parameters (ec, pc, qc, etc.) were then determined by averaging their values over the final 5% to 10% of axial strain.
The constant stress ratio loading–transitional stress paths in the q–p space are illustrated in Figure 3. The complete set of parameters used in this study is as follows: R ∈ {1.0, 1.33, 2.0, 2.5}, σc ∈ {100, 200, 400, 800} kPa and K ∈ {4.5, 5.5, 6.0, 8.0, +∞, −2.0}.
Figure 3.
Schematic diagram of the constant stress ratio loading–transitional stress path.
2.3. Micro–Macro Mechanical Variable Definitions in DEM Analysis
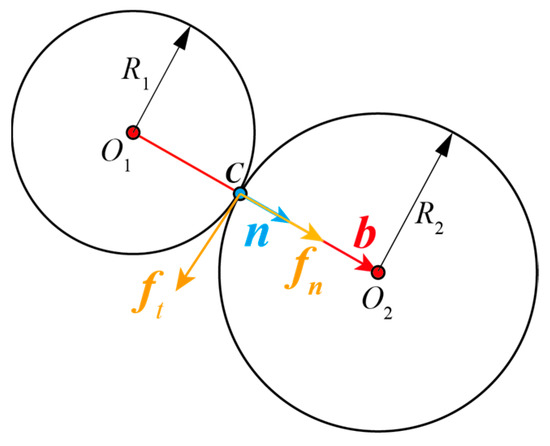
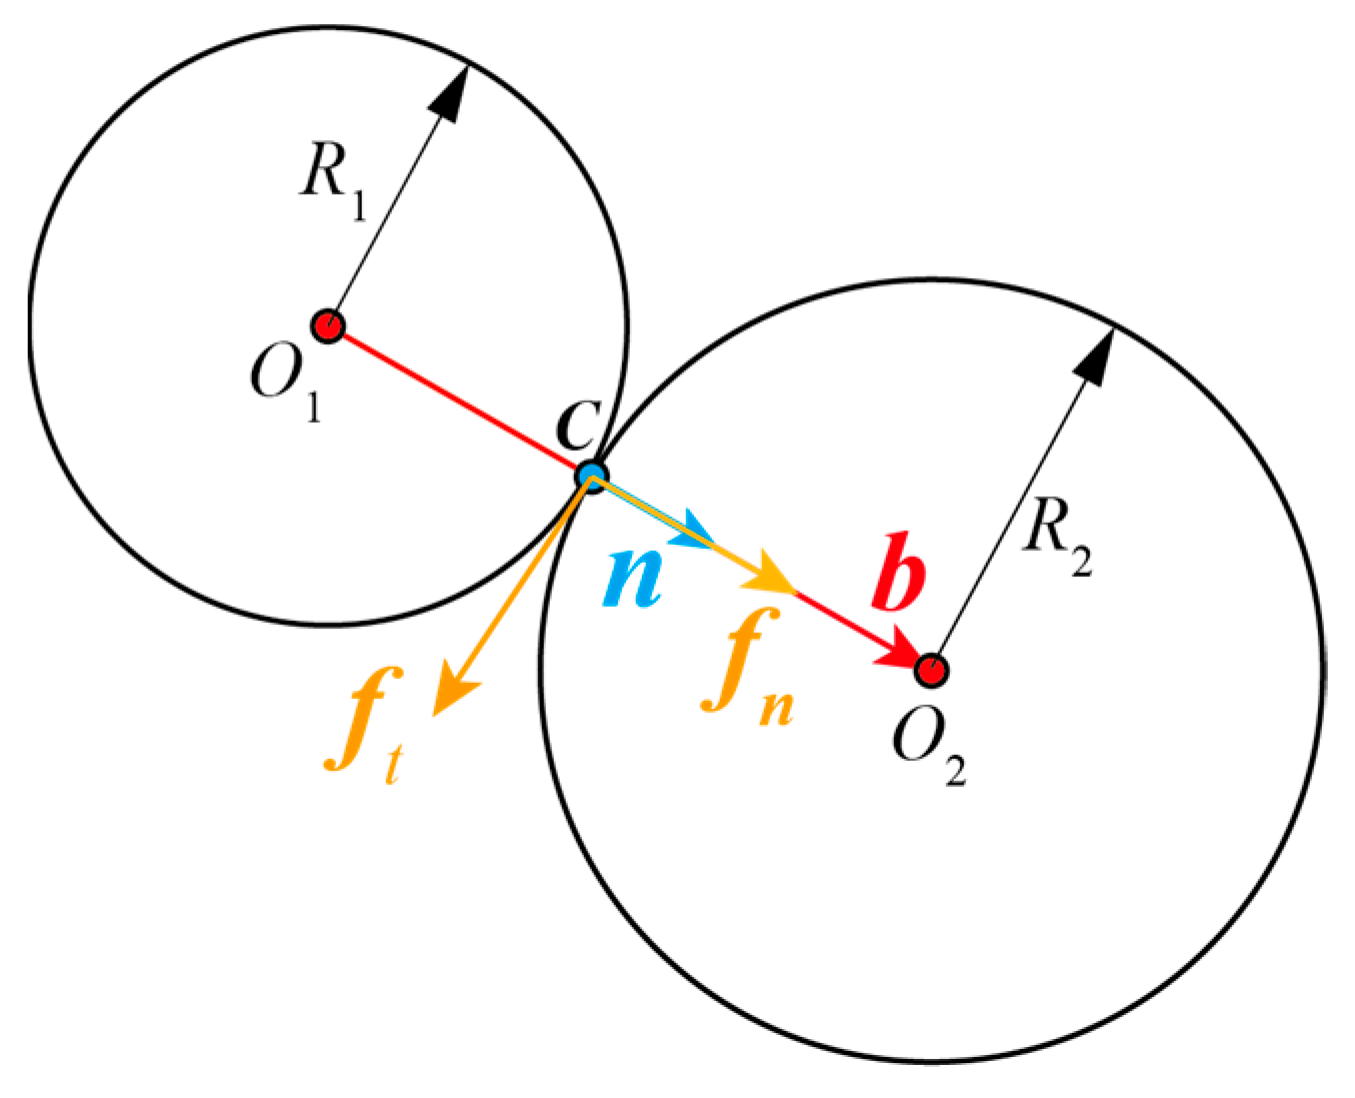
At the microscopic level, the global contact network is constituted by the contact interactions between particles and is highly heterogeneous and complex during shearing. Figure 4 shows four vectors used to describe the particle-scale interaction, which are the contact unit normal n, branch vector b, normal contact force fn and tangential contact force ft.
Figure 4.
The interaction between particles.
The anisotropy of granular materials can be divided into two categories according to the different origins, namely, the geometrical anisotropy and the mechanical anisotropy [25]. The geometric anisotropy can be expressed using the distribution of contact normal n and branch vector b, while the mechanical anisotropy is contributed by the normal contact force fn and tangential contact force ft [32,33].
The distribution of contact normal is described by the fabric tensor ϕij proposed by Oda [34] as follows:
where denotes the unit contact normal component at contact α in the ith direction.
The geometric anisotropies can be described by the second-order deviatoric directional probability density tensor of contact normal and branch vector as follows [34]:
where δij is the Kronecker delta, bij is the second-order tensor, which can be calculated from DEM simulations, expressed as follows:
b0 = bkk is the average length of branch vectors over all directions.
Similarly, the mechanical anisotropies can be determined using the second-order deviatoric directional representative value tensors for normal and tangential contact forces [35], respectively:
where and are the second-order tensors of the normal and tangential contact forces, expressed as follows:
= is the average normal force over all directions instead of the mean normal contact force. Because the four tensors , , , are deviatoric in nature, their second invariants can be used to quantify the degree of anisotropy as follows:
where α* is a scalar measure of the degree of anisotropy associated with the kth subnetworks and the sub/super-script * stands for c, b, n, t, corresponding to one of the four anisotropies mentioned above.
In the macroscopic level, the average stress tensor σij can be calculated by the statistical average of the inter-particle contact force f and the branch vector b:
where V is the total volume of the assembly; Nc is the number of contacts in the global contact network. At the macroscopic level, the deviatoric stress q, the mean stress p, the principal strain εi in direction i (i = 1, 2, 3) and the volumetric strain εv are defined as follows:
where σij′ is the deviatoric part of σij, equal to σij − δijσkk; li0 and li are the initial and current length of the sample in the i direction.
Furthermore, by combining the macroscopic stress state with microscopic fabric anisotropy, the first joint invariant Kc can be adopted [35] to characterize the fabric anisotropy, which is expressed as follows:
2.4. Energy Allocation Mechanism
According to the first law of thermodynamics, the incremental input work W obtained by the macro stress and strain is equal to the sum of the elastic energy U and the plastic energy Wp per unit volume of the system. For the polydisperse granular system with periodic boundary condition, the incremental input work dW can be calculated by the following:
In the linear-based rolling resistance model, the elastic energy U stored at particle contacts consists of the energy in the linear contact model Ee and the rolling resistance model Eer. The plastic energy Wp is composed of two parts: the energy dissipated by sliding Eμs and rolling Eμr, respectively. Considering the quasi-static nature of the simulation, the kinetic energy Ek can be ignored during the shearing process. As the local damping coefficient α is set to 0, the energy dissipated by local damping Ed can also be ignored. Therefore, the following equation can be obtained:
The calculation methods of each energy are detailed in ref. [36], which are not listed in this paper. In DEM simulation, for each calculation timestep, the energy in timestep n can be obtained by summing the energy in timestep n − 1 to the incremental energy in timestep n, which can be described as follows:
The calculated energy here refers to the per-unit-volume energy of the system. In the quasi-static loading process, energy conservation is guaranteed at any time.
3. Influence of Constant Stress Ratio Loading–Turning Paths on the Anisotropy and Peak Strength of Fractal Distributed Specimens
3.1. Influence of Constant Stress Ratio R on the Void Ratio and Anisotropy
The constant stress ratio loading path not only determines the stress condition at the target confining pressure but also significantly affects the anisotropy of the specimens. Table 3 lists the void ratios e of specimens with different gradations when they are loaded to the target confining pressure σc = 200 kPa under various principal stress ratios R = σ1/σ3. For specimens with the same gradation, the void ratio slightly decreases with increasing , indicating that a larger principal stress ratio induces a stronger compressive effect and leads to a slightly denser initial packing state.
Table 3.
Correlation between void ratio and R-value after constant stress ratio loading path.
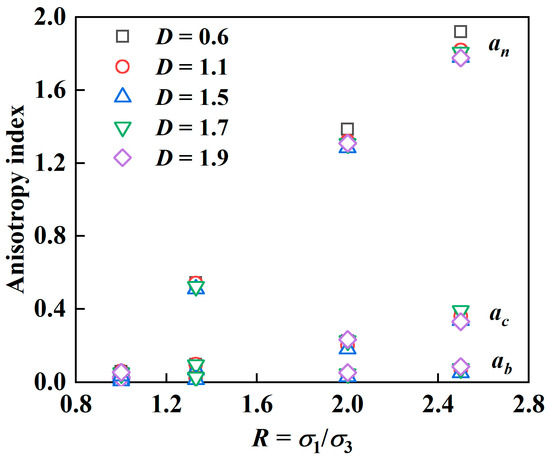
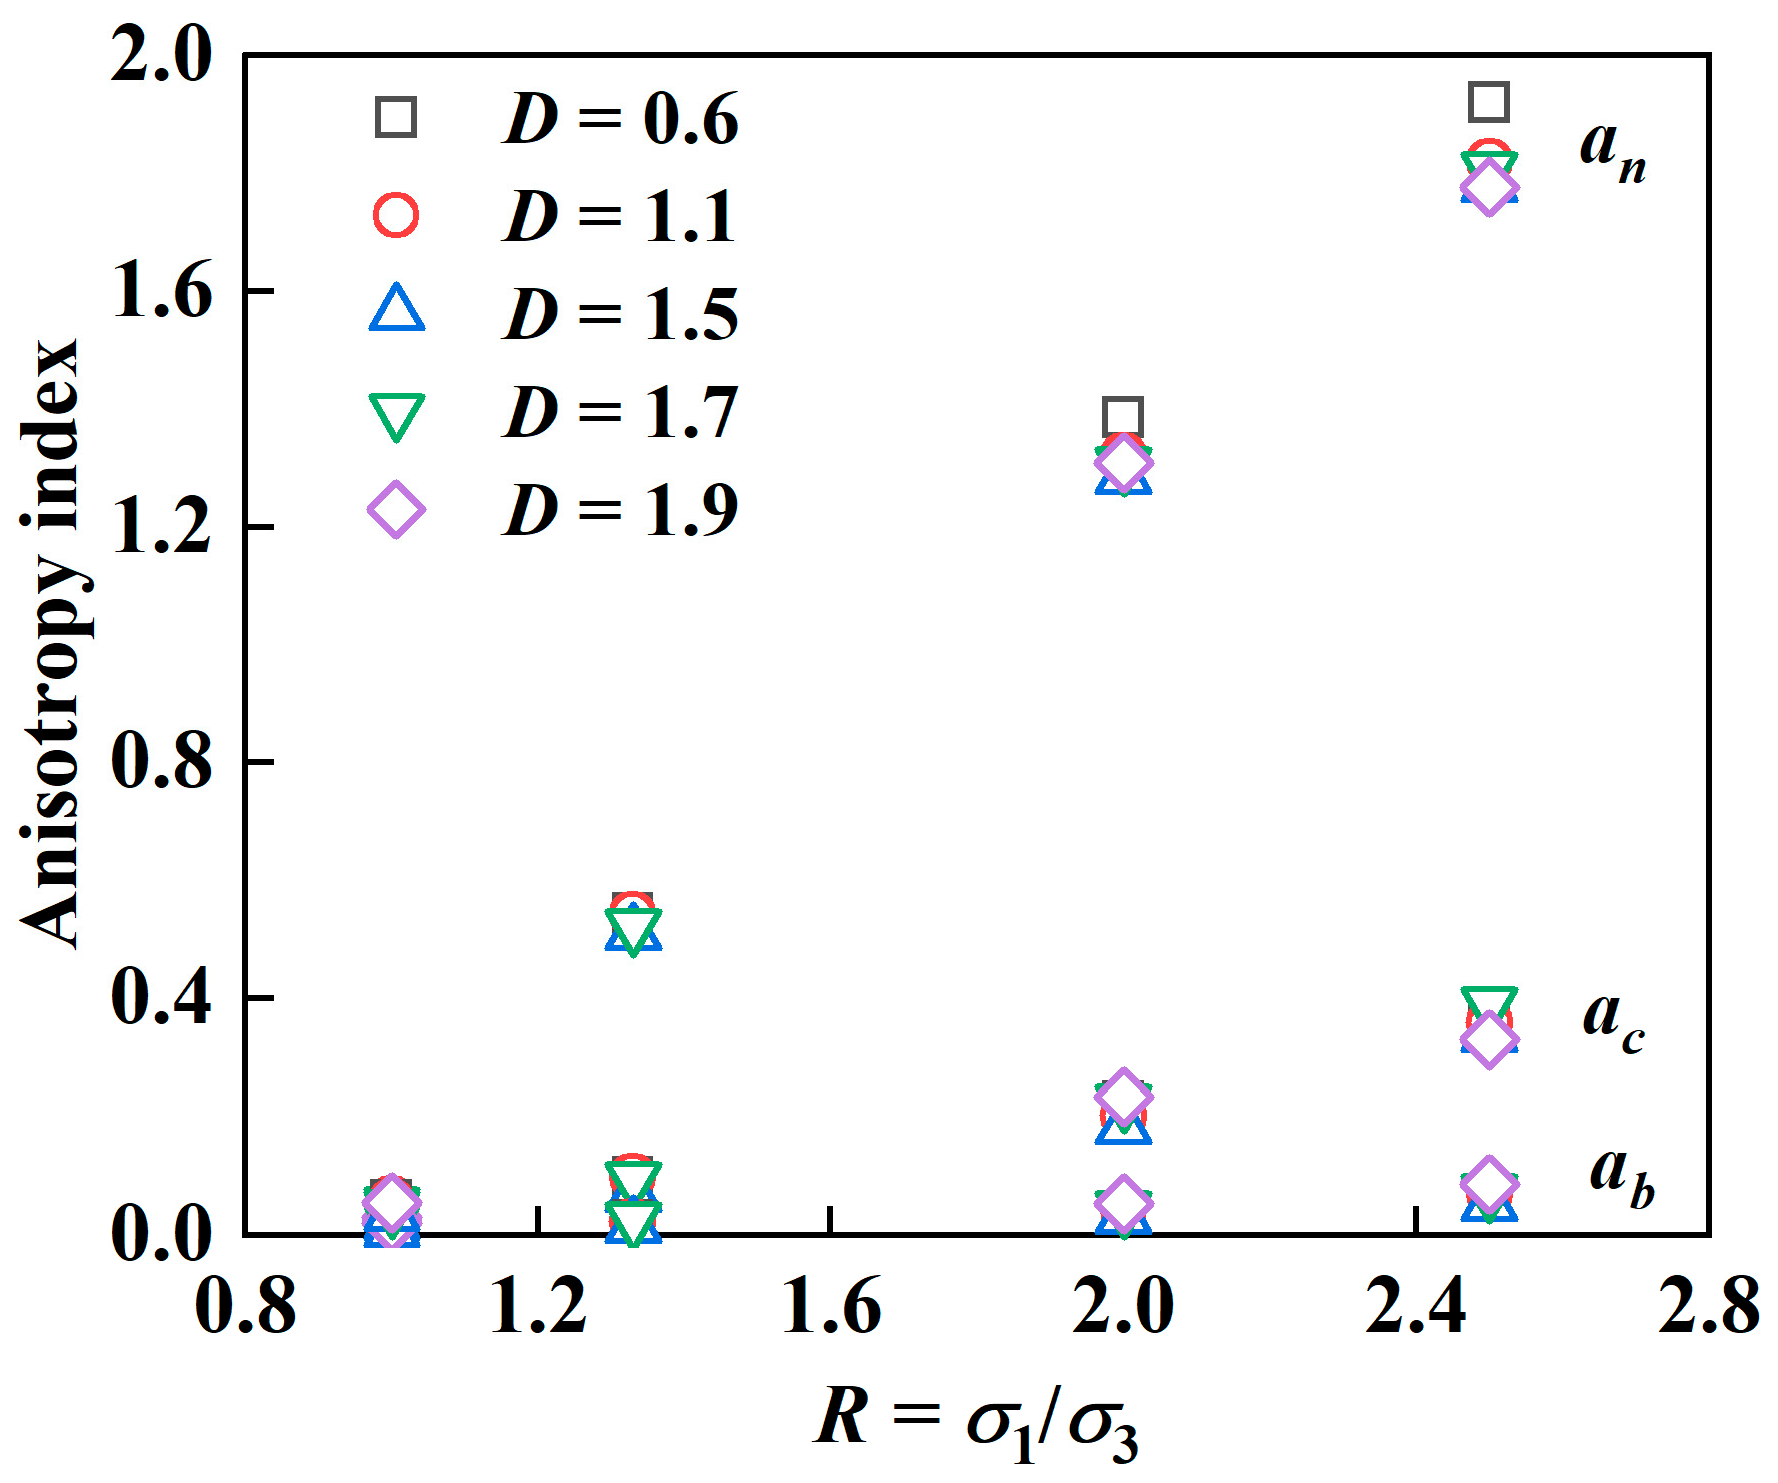
The parameter R also has a pronounced influence on the initial anisotropy of the specimens. As shown in Figure 5, the anisotropy indices of contact normal orientation ac, branch vector orientation ab, and contact normal force an all increase with increasing R, among which an exhibits the most significant growth. This suggests that the concentration of contact forces along the major principal stress direction contributes most strongly to the development of anisotropy.
Figure 5.
Influence of R-value on the anisotropy indexes of specimens with different fractal dimensions.
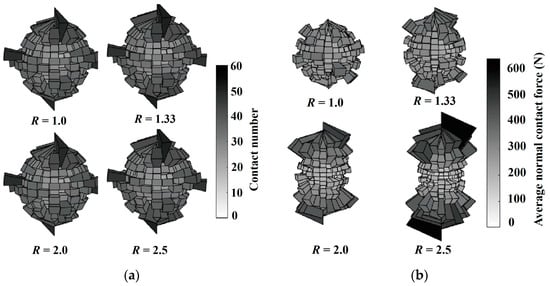
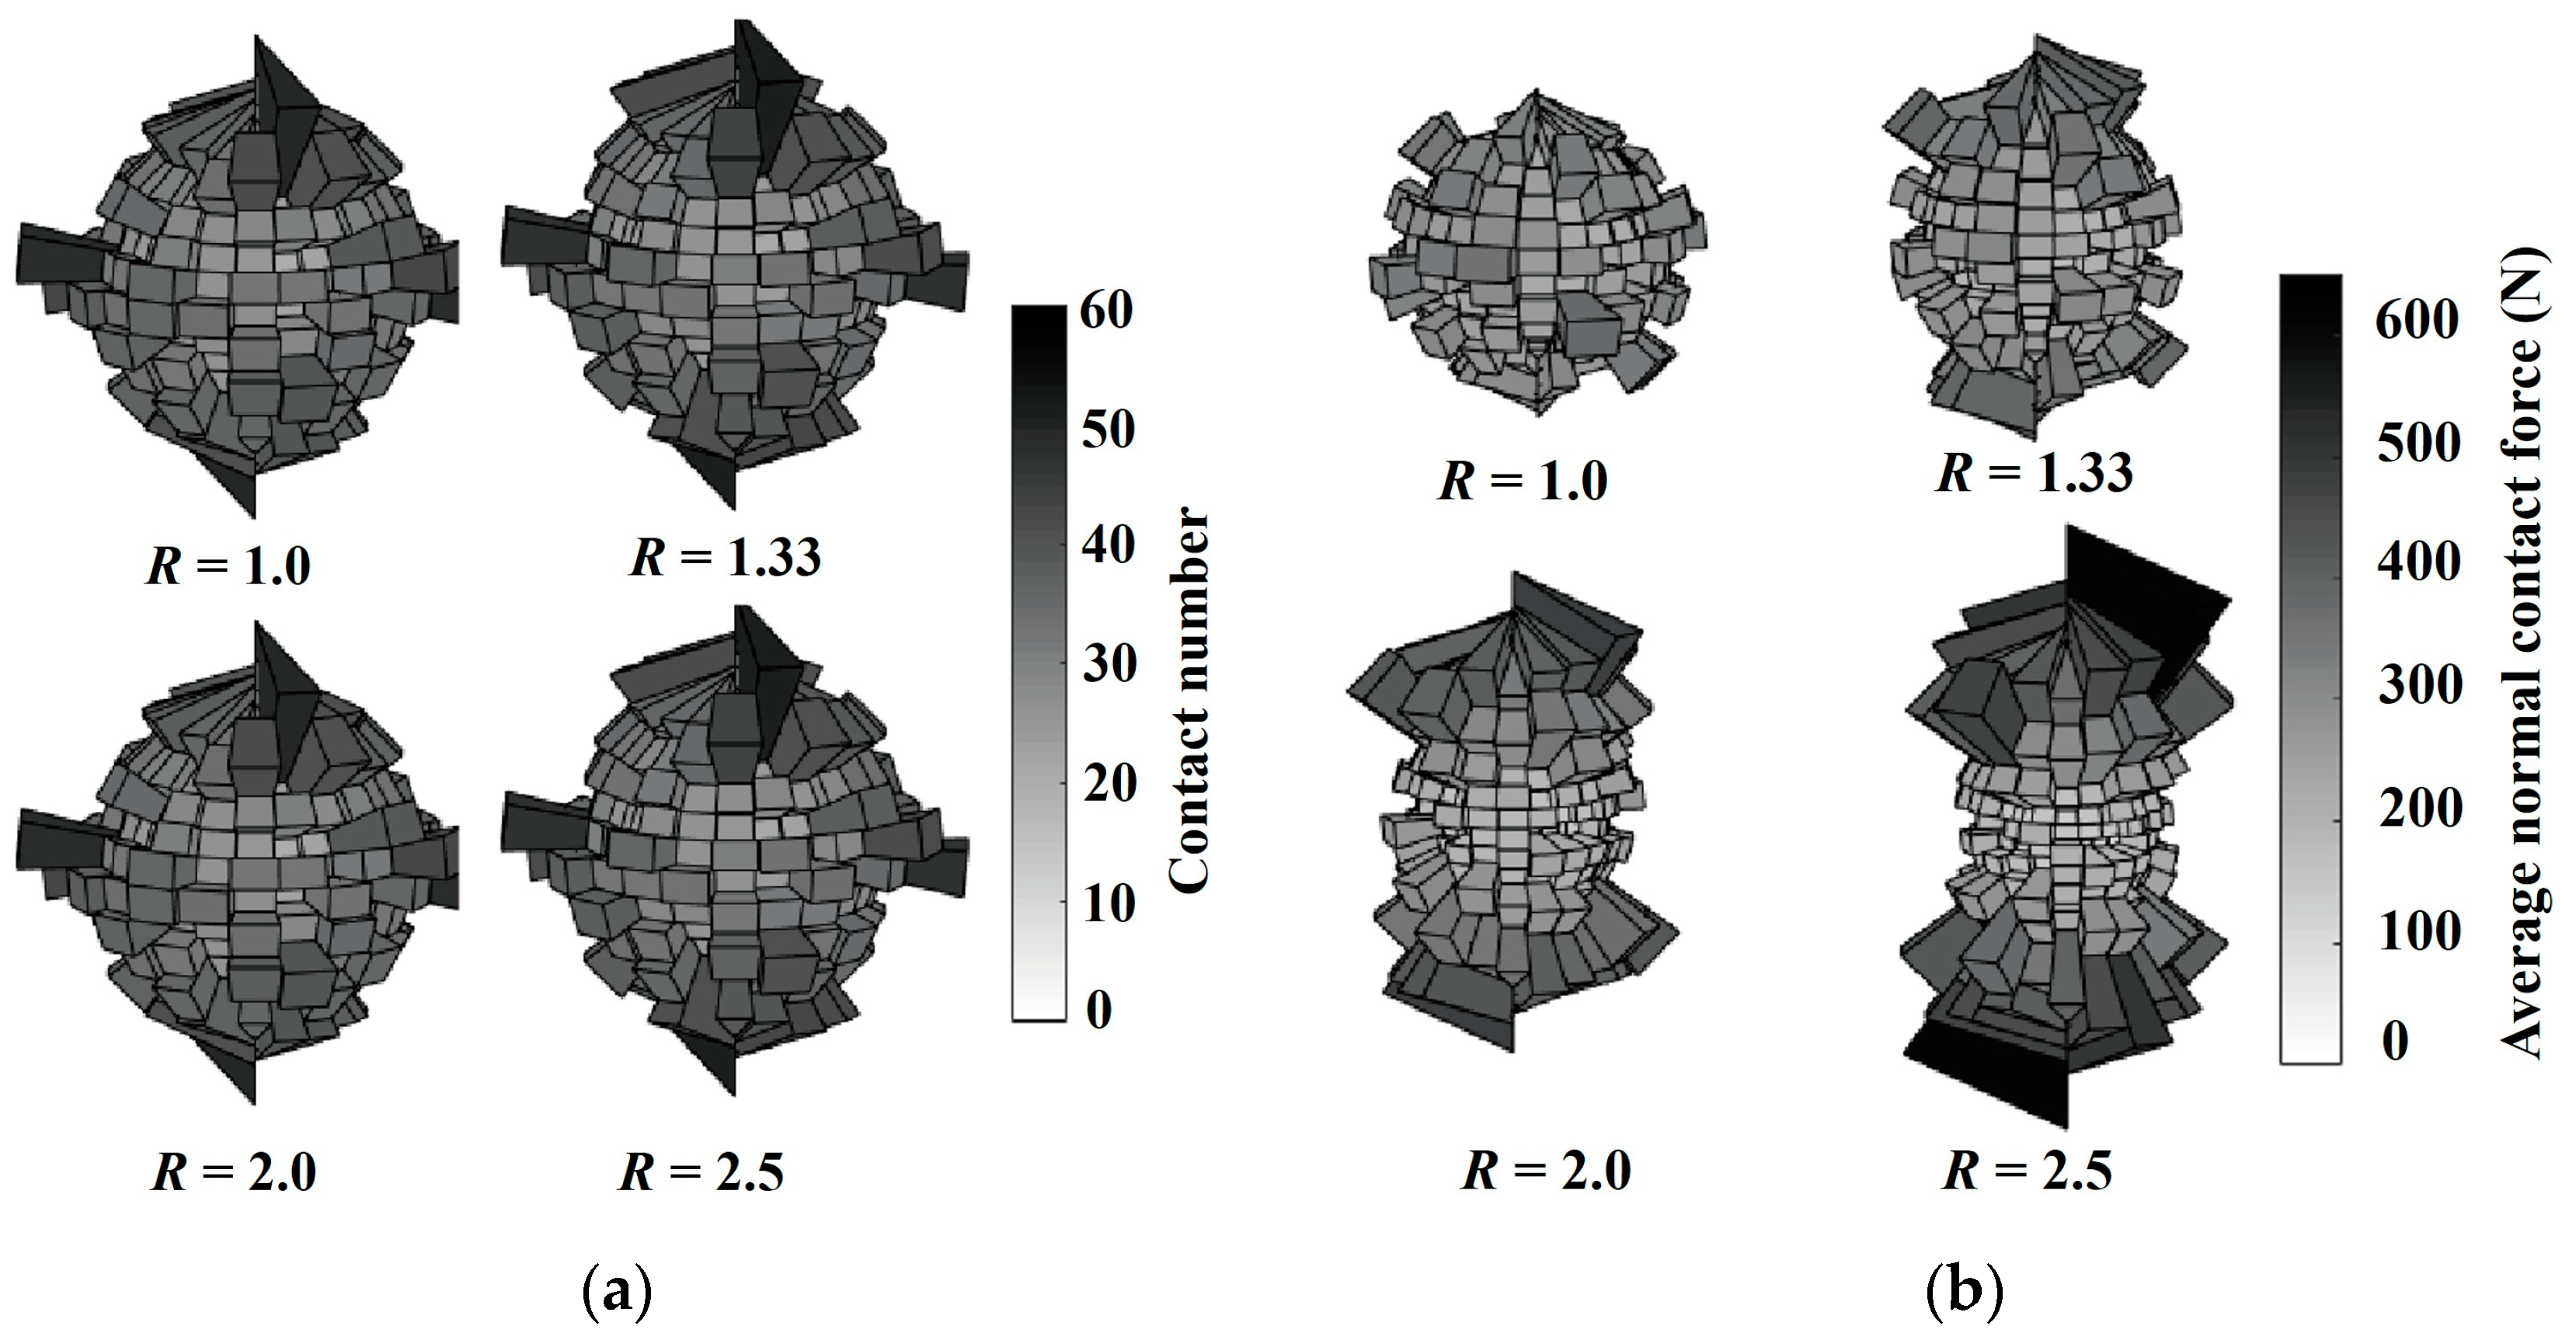
Figure 6 further illustrates the spatial distributions of contact normals and contact normal forces in the specimen with fractal dimension D = 1.1 under different R values. When R = 1.0, both the contact fabric and contact force distribution exhibit nearly isotropic characteristics. When R > 1.0, the contact density and contact force along the major principal stress direction become significantly higher than those in the horizontal direction, and the degree of anisotropy increases markedly with increasing R. Therefore, although all specimens are consolidated to the same confining pressure under different constant stress ratio loading paths, variations in R reshape their internal fabric and lead to distinct initial anisotropic structures. The following analyses focus on how these different initial fabrics influence the subsequent macroscopic stress–strain responses during shearing.
Figure 6.
Spatial distribution of (a) contact normal and (b) average normal contact force under different R-value (D = 1.1).
3.2. Combined Influence of Gradation and Stress Paths on Peak Strength
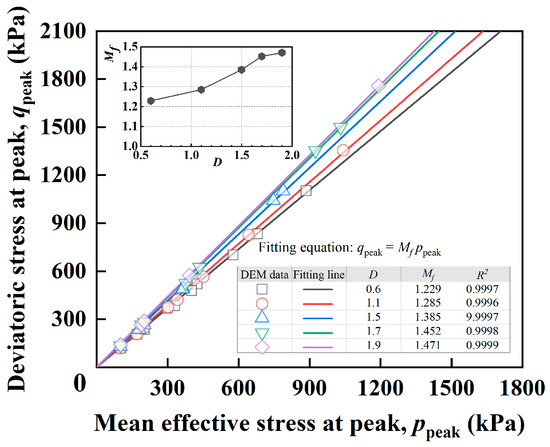
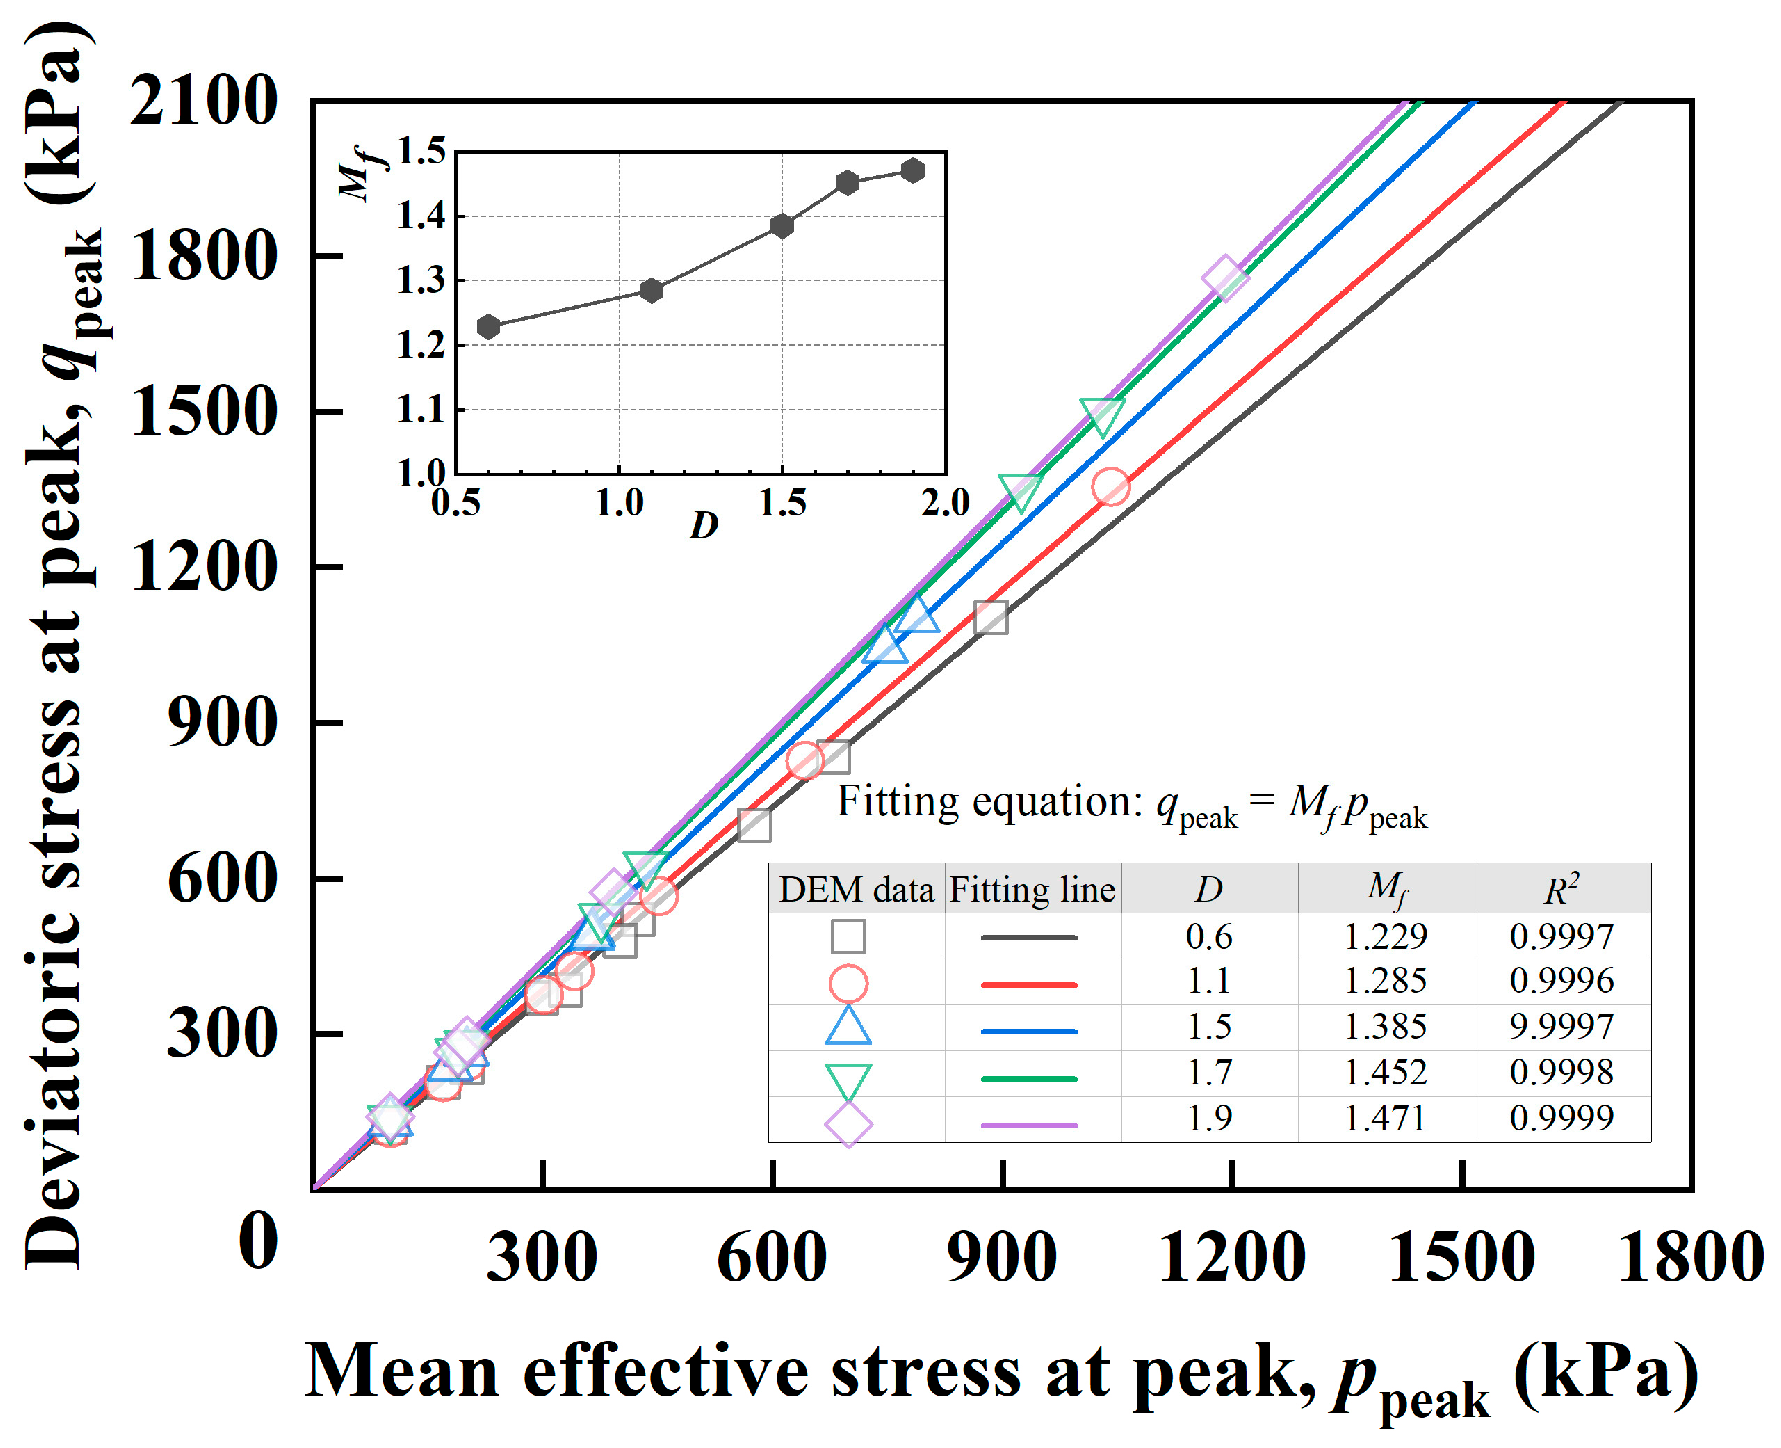
After clarifying the role of constant stress ratio loading in establishing different initial structural states, five initial isotropic specimens with different gradations were further subjected to shearing under various confining pressures (100, 200, 400 and 800 kPa) and constant stress ratio turning paths to investigate the influence of gradation and principal stress increment ratios K on the peak strength behavior. Figure 7 presents the peak strength envelopes of specimens with different gradations. The peak stress ratio Mf increases with increasing fractal dimension D, indicating that specimens with higher fine content possess higher peak shear resistance.
Figure 7.
Peak strength line of DEM specimen with different gradations.
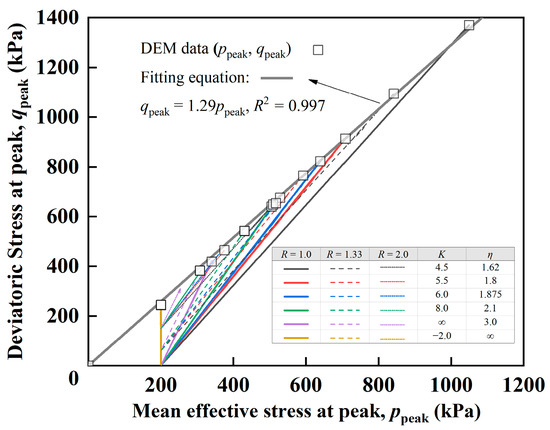
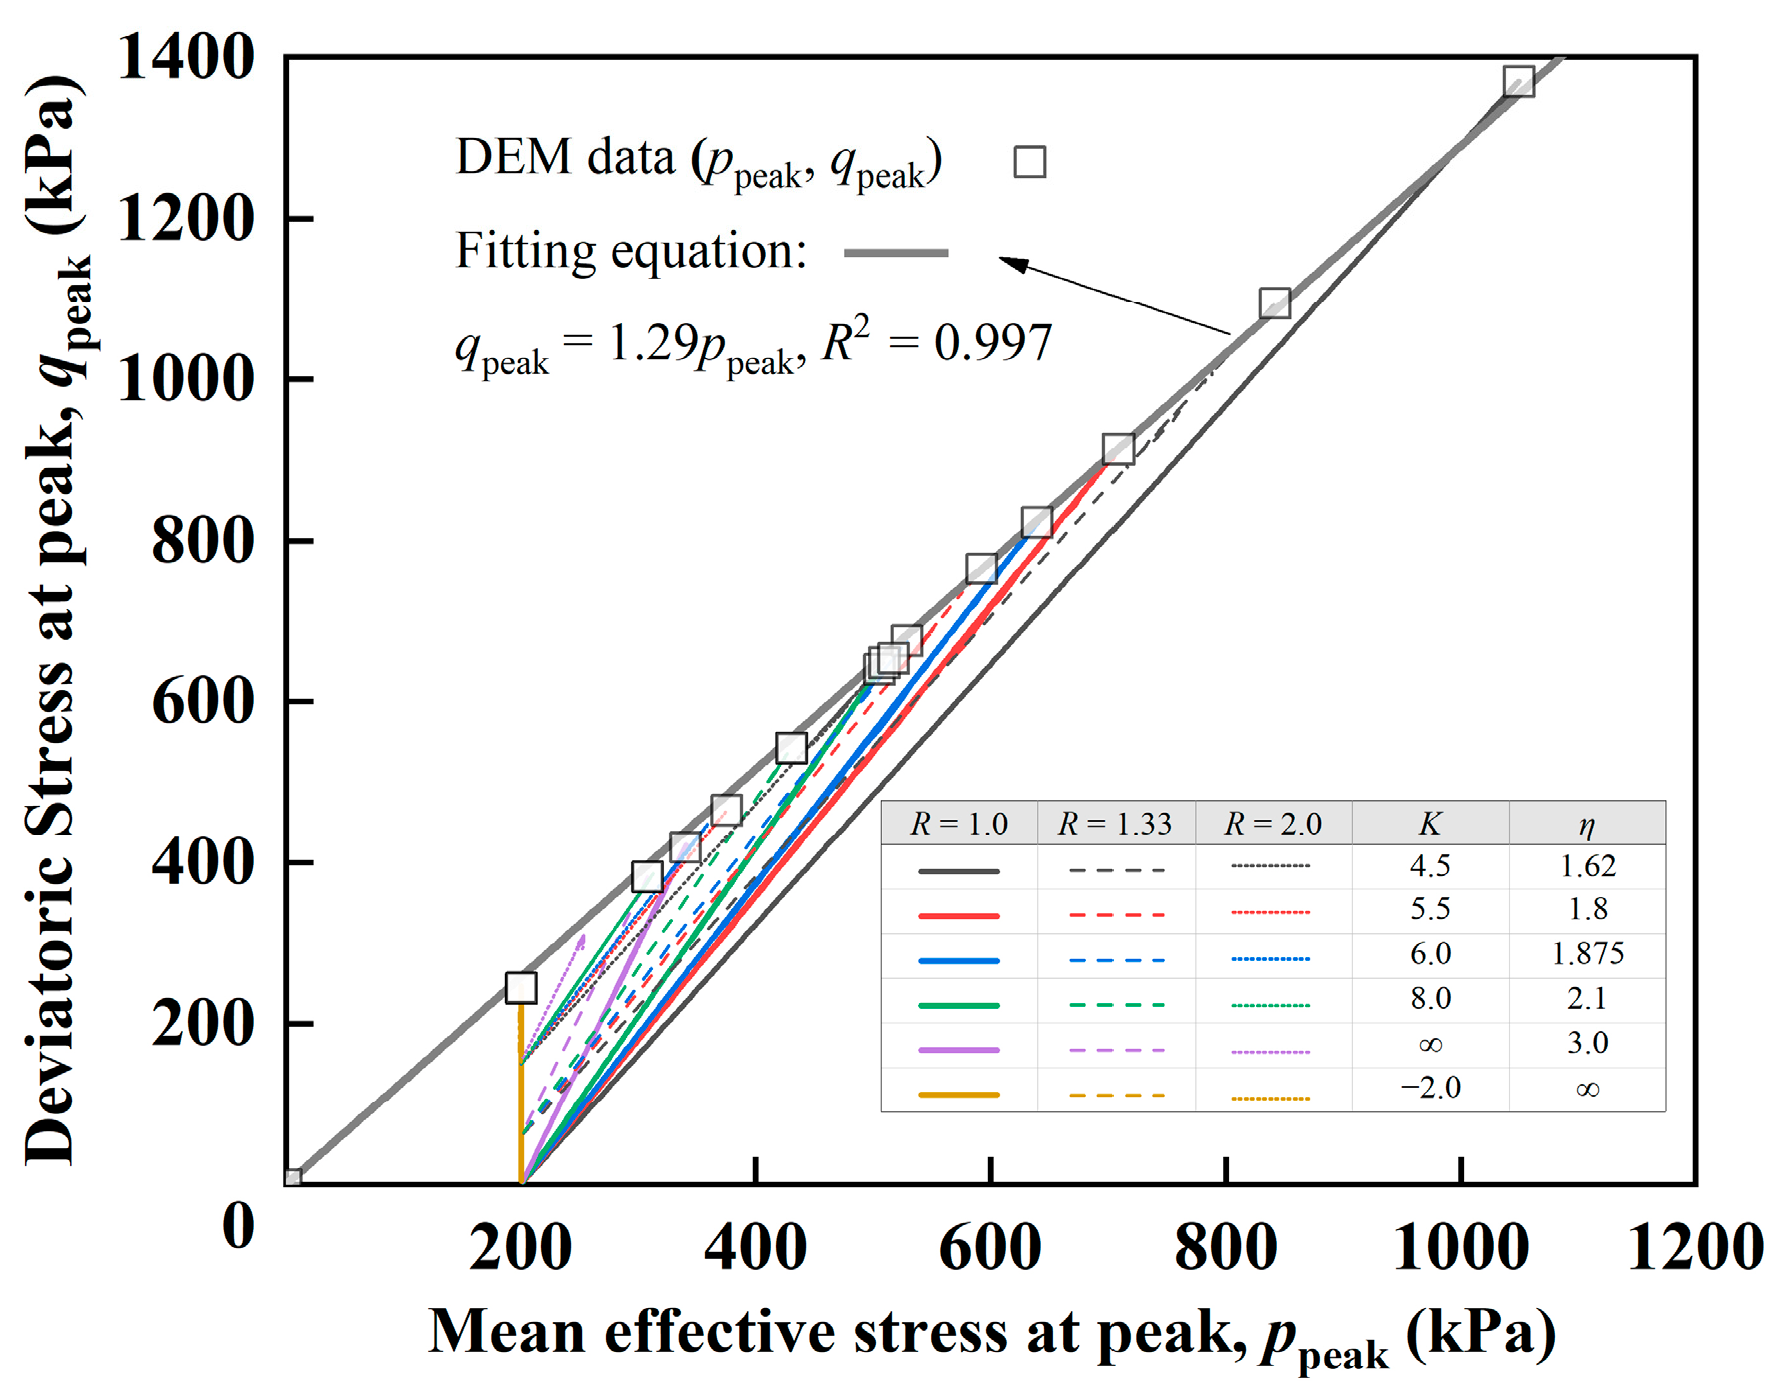
Figure 8 further explores the peak strength lines under different constant stress ratio loading–turning paths for specimens D = 1.1 with different initial anisotropies corresponding to R = 1.0, 1.33, 2.0, at three confining pressures (200, 400 and 800 kPa).
Figure 8.
Peak strength line at the q–p space under different R and K values for specimen D = 1.1.
A linear regression was performed on all peak stress points (ppeak, qpeak), yielding a best-fit line with a slope Mf ≈ 1.29 and a coefficient of determination R2 = 0.997. This indicates that the influence of initial anisotropy on the peak strength envelope is statistically negligible, supporting its characterization as path-independent.
4. Microscopic Interpretation of Critical State Behavior of Fractal Distributed Specimens Under Constant Stress Ratio Paths
4.1. Uniqueness of Critical State Line Under Constant Stress Ratio Loading–Transitional Paths
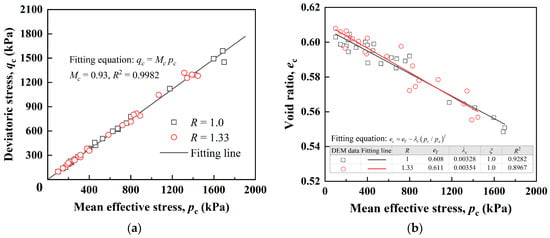
Figure 9a presents the distribution of the critical state points of specimens D = 1.1 with different initial stress ratios R under various stress turning paths in the q–p plane. It is observed that, for a given gradation, all critical state points corresponding to different initial anisotropies and stress paths fall on a single straight line, with a critical stress ratio of approximately 0.93. This indicates that the critical friction angle is independent of both the loading path and the initial anisotropy and thus represents an intrinsic material property. From a physical viewpoint, the critical friction angle reflects the interlocking and frictional resistance of particles, which are mainly governed by particle shape and mineral characteristics rather than loading history.
Figure 9.
Influence of the initial anisotropy and constant stress ratio turning stress paths for specimen D = 1.1 on the critical state line at (a) q–p space and (b) e–p space.
Figure 9b further shows the distribution of critical state points in the e–log(p) plane for specimens with R = 1.0 and 1.33, where all data points were found to collapse to the following general form proposed by Li et al. [37]:
where eГ denotes the critical void ratio at pc = 0, λc and ξ are material constants, and pa = 101 kPa is the atmospheric pressure. Slight differences between the two critical state lines can be observed under low-stress levels, but the discrepancies are extremely small. As the stress level increases, the two lines gradually coincide, implying that at high confining pressures the critical state becomes completely independent of the stress path.
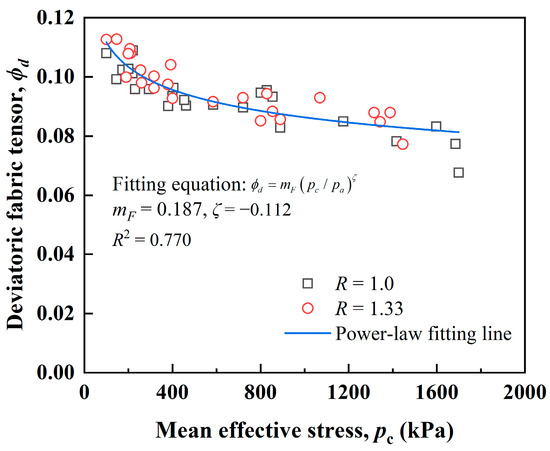
To uncover the microstructural origin of the macroscopic uniqueness of the critical state, Figure 10 illustrates the relationship between the second invariant of the fabric tensor ϕd and the mean effective stress pc at the critical state, which can be described by the power-law equation observed by Guo and Zhao [32] as
where mF and ζ denote material parameters. The value of ϕd decreases with increasing confining pressure, indicating that larger confining pressure weakens fabric anisotropy at the critical state, consistent with the trend of the critical void ratio. Fitting results further show that although minor differences exist between different initial anisotropies in the low-stress range, these discrepancies vanish at high stress levels, and the fitted curves fully coincide, reinforcing the uniqueness of the critical state.
Figure 10.
Correlation between the fabric anisotropy ϕd and mean effective stress pc at the critical state under different constant stress ratio loading–transitional paths.
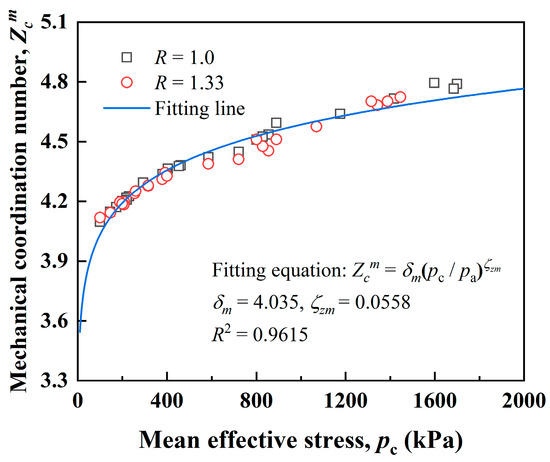
Figure 11 demonstrates that the critical mechanical coordination number increases with the mean effective stress pc, and all data corresponding to different initial anisotropies and stress paths can also be satisfactorily described by a single power–law relationship, expressed as follows:
where δm and ζZm are fitting parameters.
Figure 11.
Correlation between the mechanical coordination number and mean effective stress pc at the critical state under different constant stress ratio loading–turning paths.
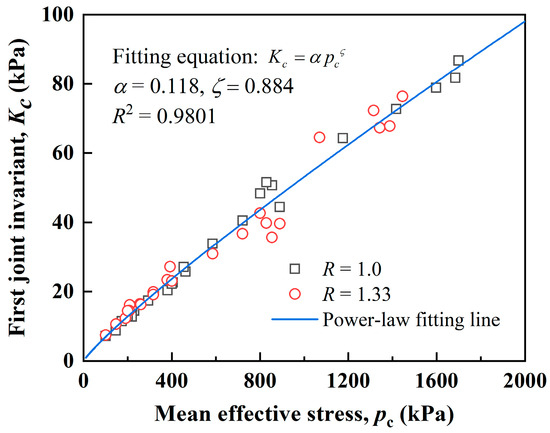
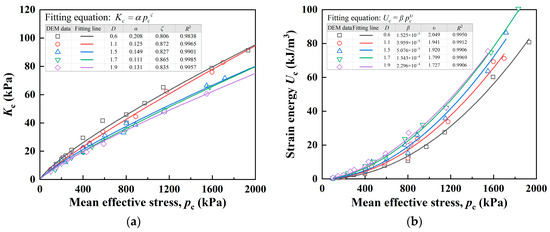
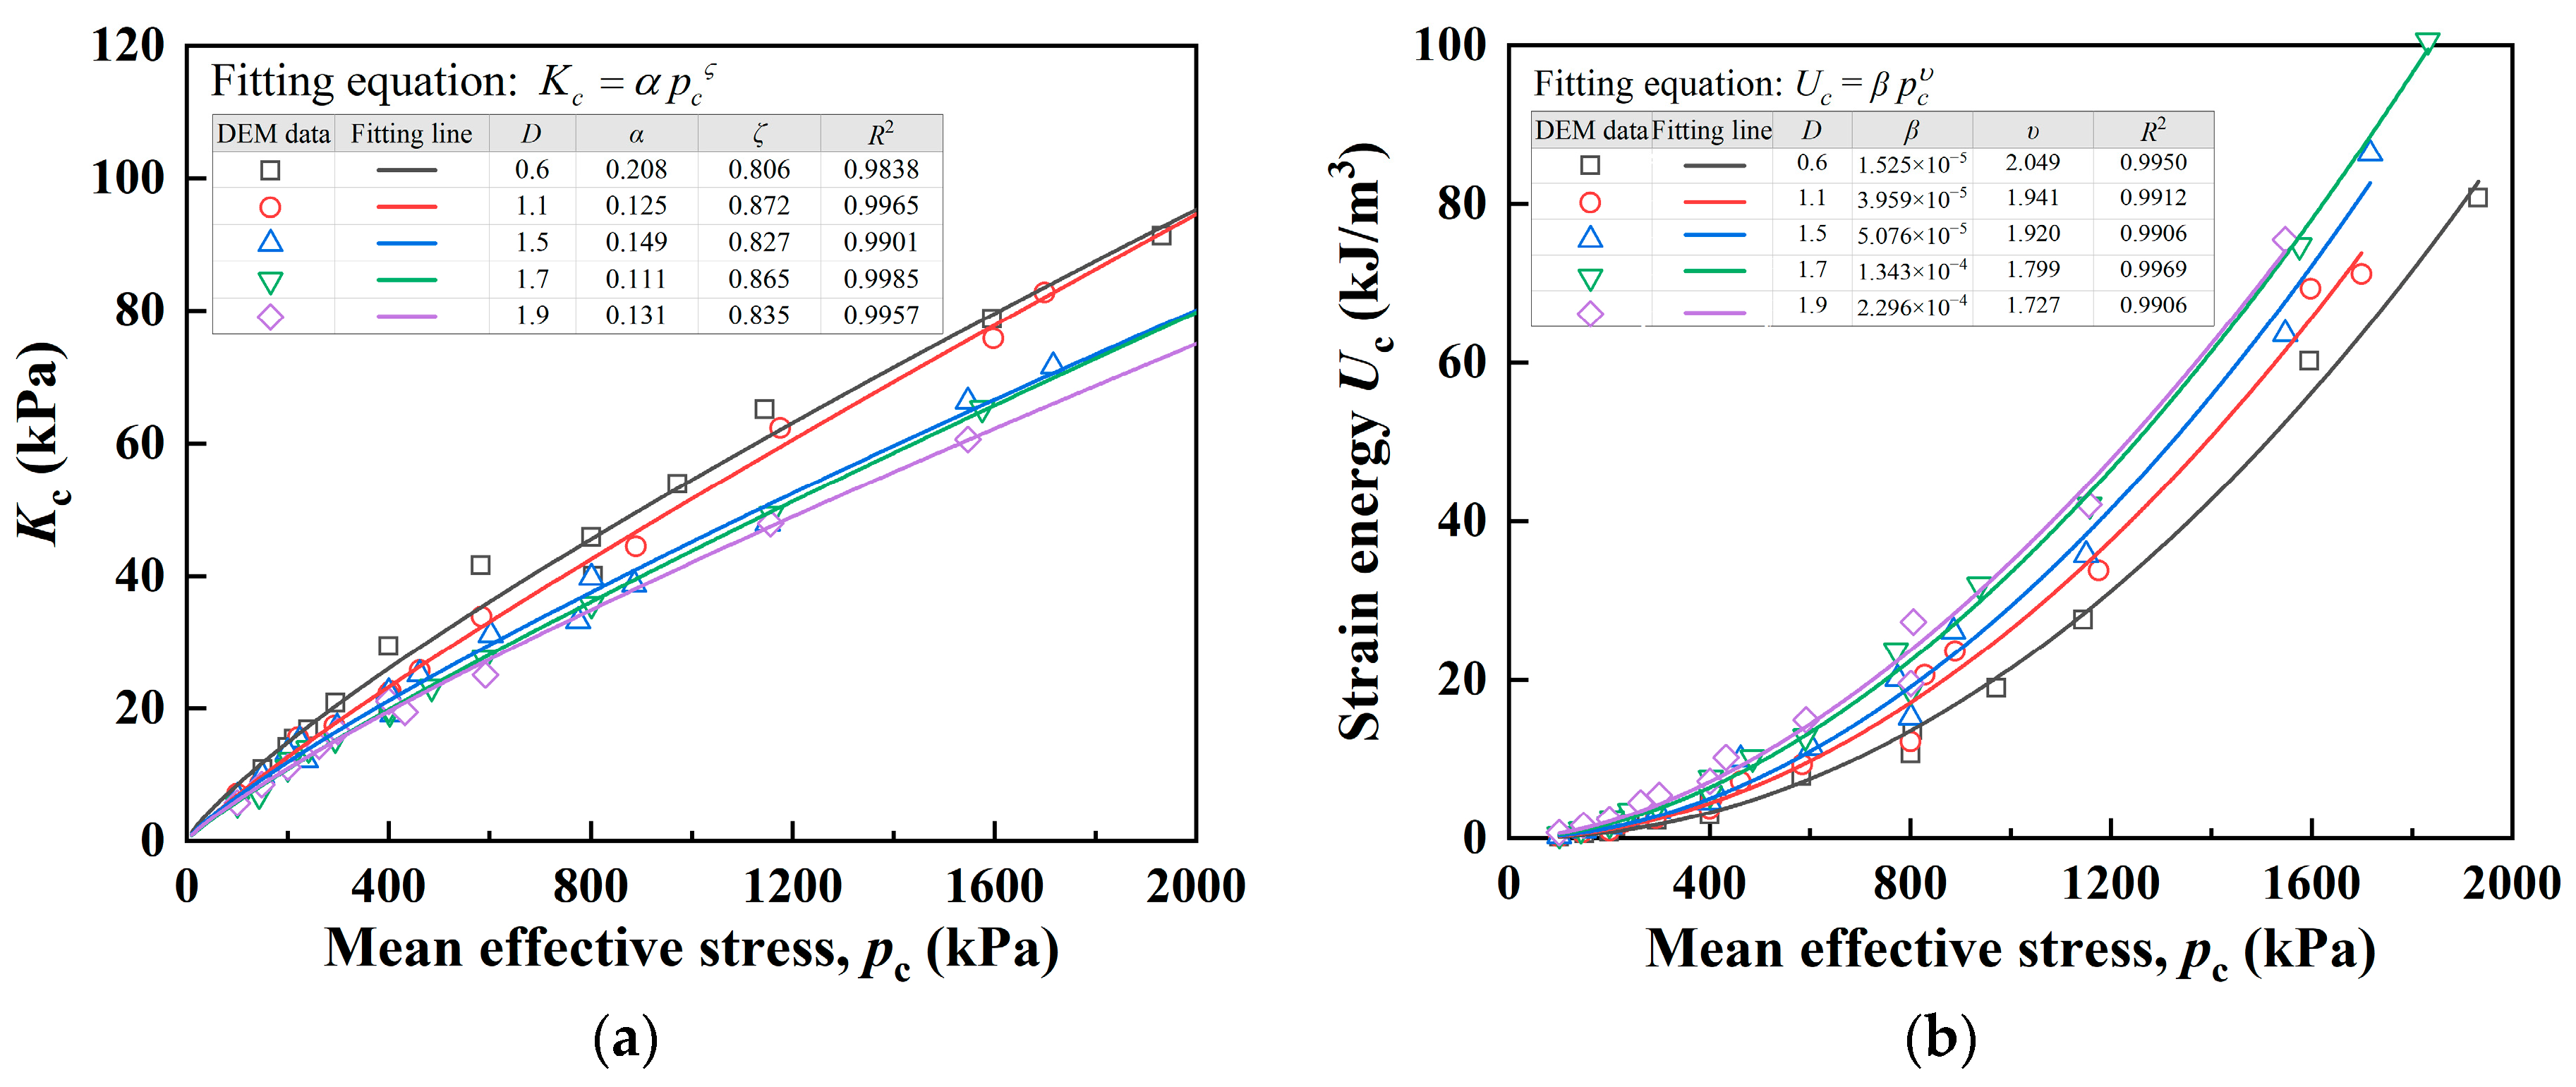
To offer a more accurate characterization of soil at the critical state, the first joint invariant of the stress tensor and fabric anisotropy, Kc, is quantified. The correlation between Kc and pc is presented comparatively in both a natural scale in Figure 12. The data indicates that Kc uniquely scales with the critical mean effective stress, pc, according to the power law. Zhao and Guo [35] presented a more general power law considering the great variety of sands:
where α and ϛ are material constants.
Figure 12.
Correlation between the Kc and mean effective stress, pc, at the critical state under different constant stress ratio loading–turning paths.
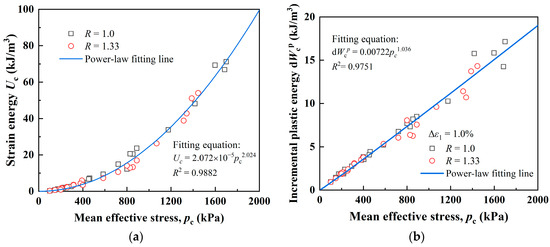
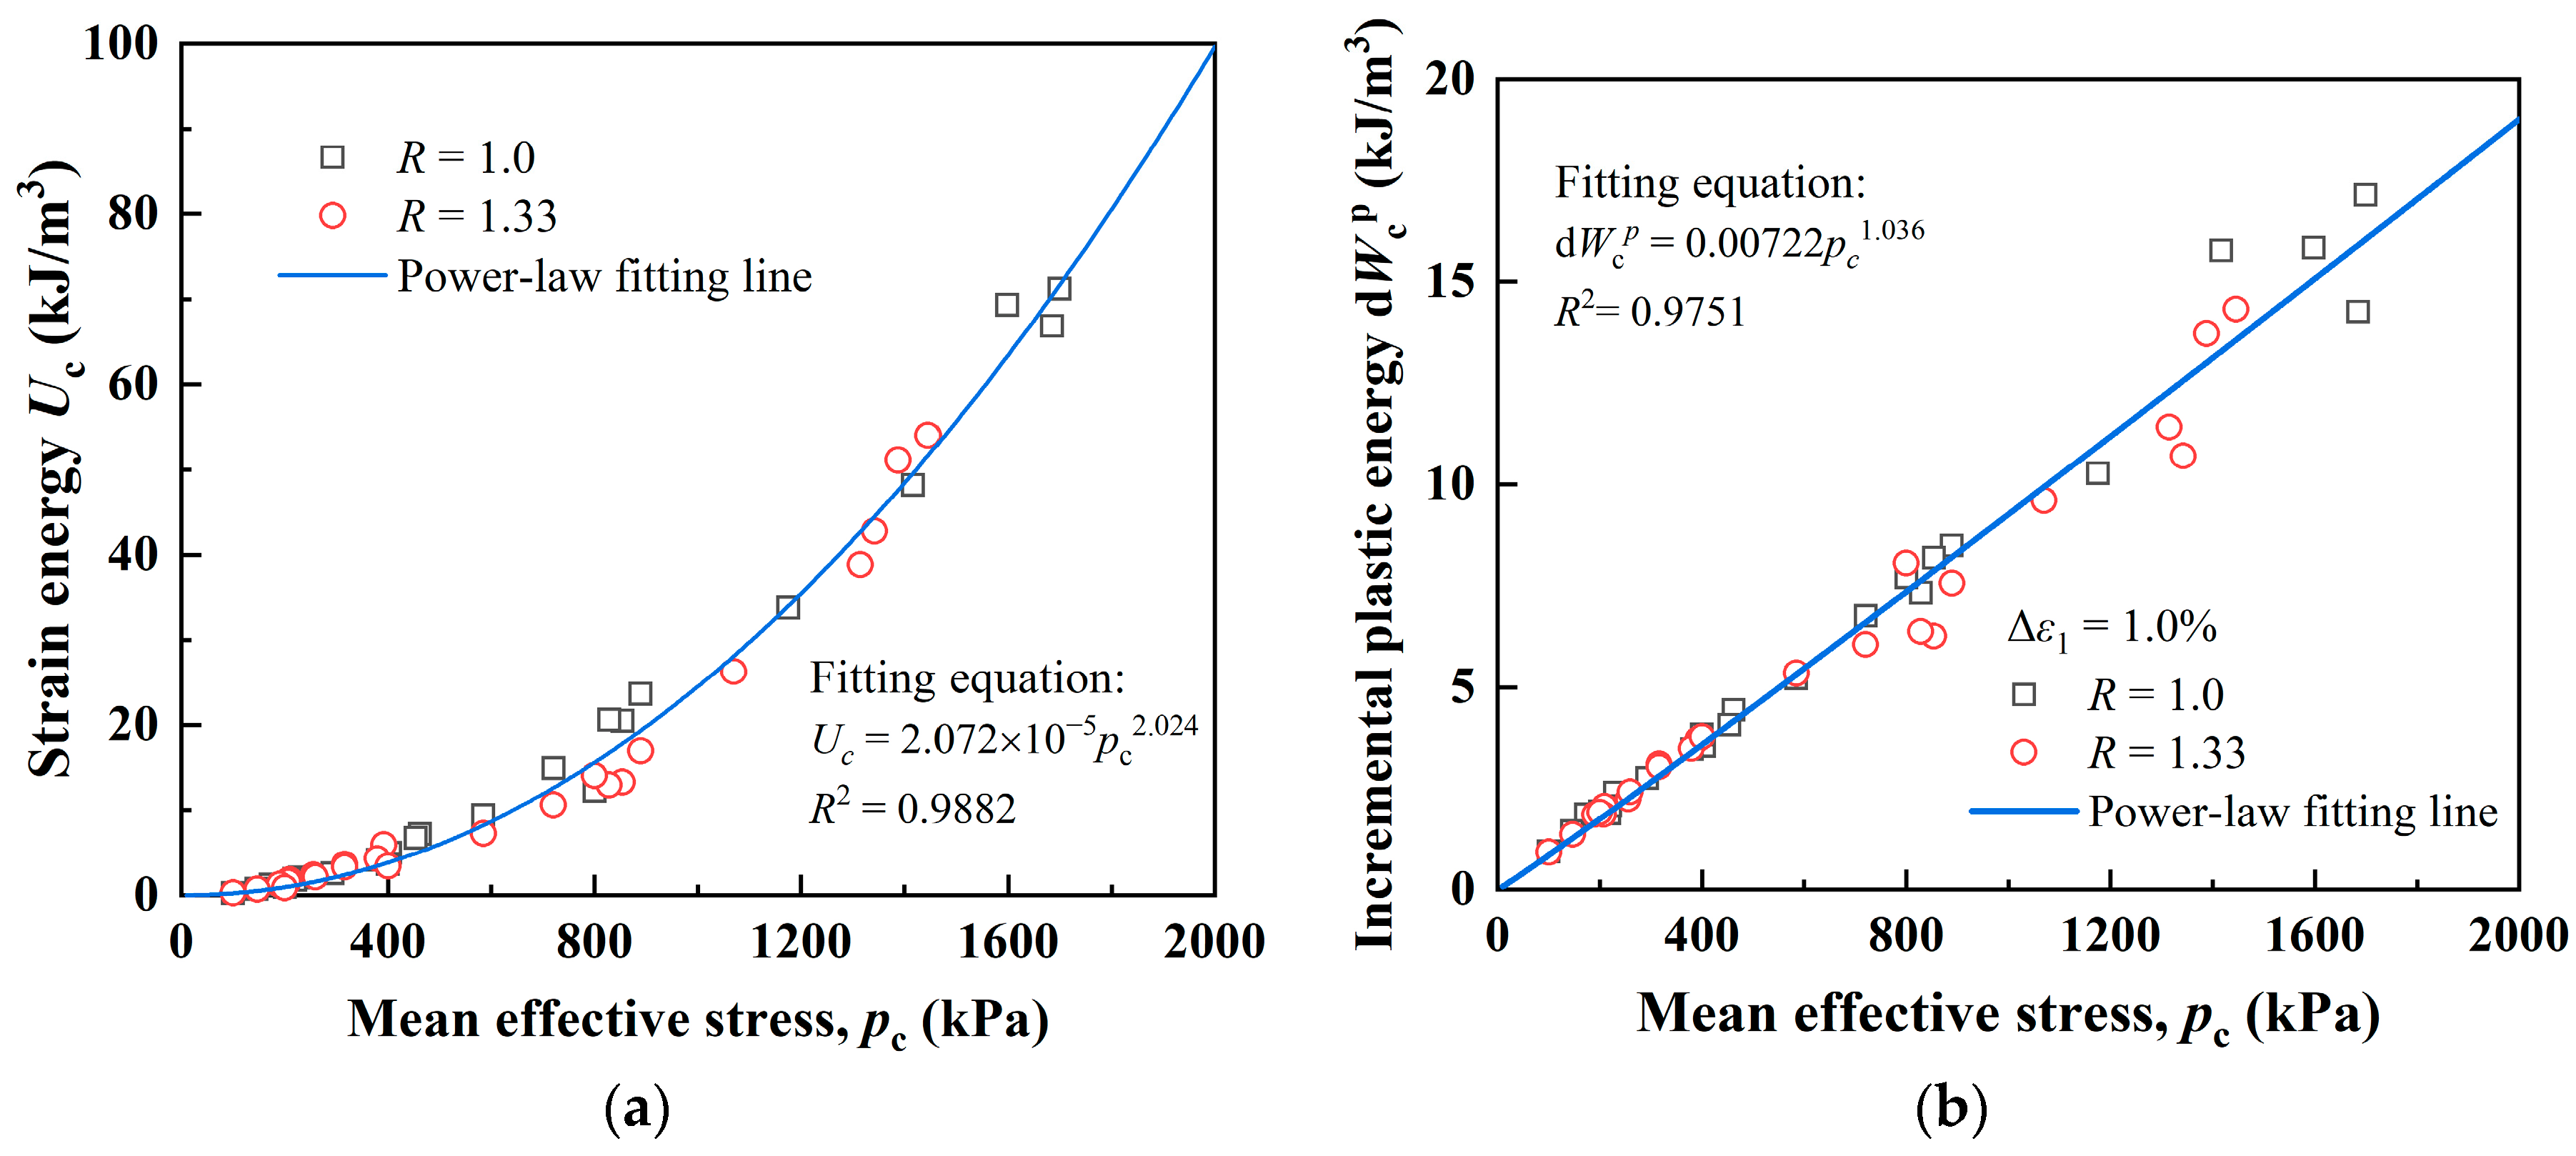
In Figure 13, the correlation of elastic energy Uc and incremental plastic energy dWp with mean effective stress pc at the critical state is investigated for the first time. Both the natural scale and log–log scale are presented to justify the function forms of Uc vs. pc and dWp vs. pc. A power law is found to accurately fit the evolution of the variables, with small fitting errors. It is worth noting that depends on the selected axial strain increment dε1, and at the critical state, , equals the incremental total input work ( = dWc) [35].
Figure 13.
Relationships between (a) strain energy Uc, (b) incremental plastic energy and mean effective stress pc at the critical state under different constant stress ratio loading–transitional paths.
In summary, although the stress path and initial anisotropy significantly influence the evolutionary process of granular materials, once the critical state is reached, the macroscopic stress, void ratio, fabric, coordination number and energy parameters all exhibit path-independent uniqueness. This confirms that the critical state is essentially independent of stress path.
4.2. Influence of Gradation at the Critical State
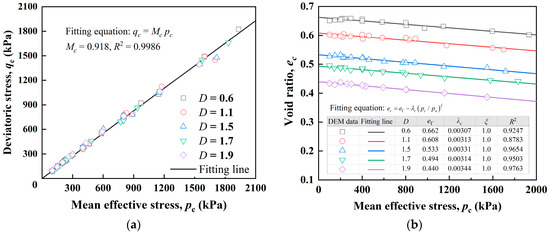
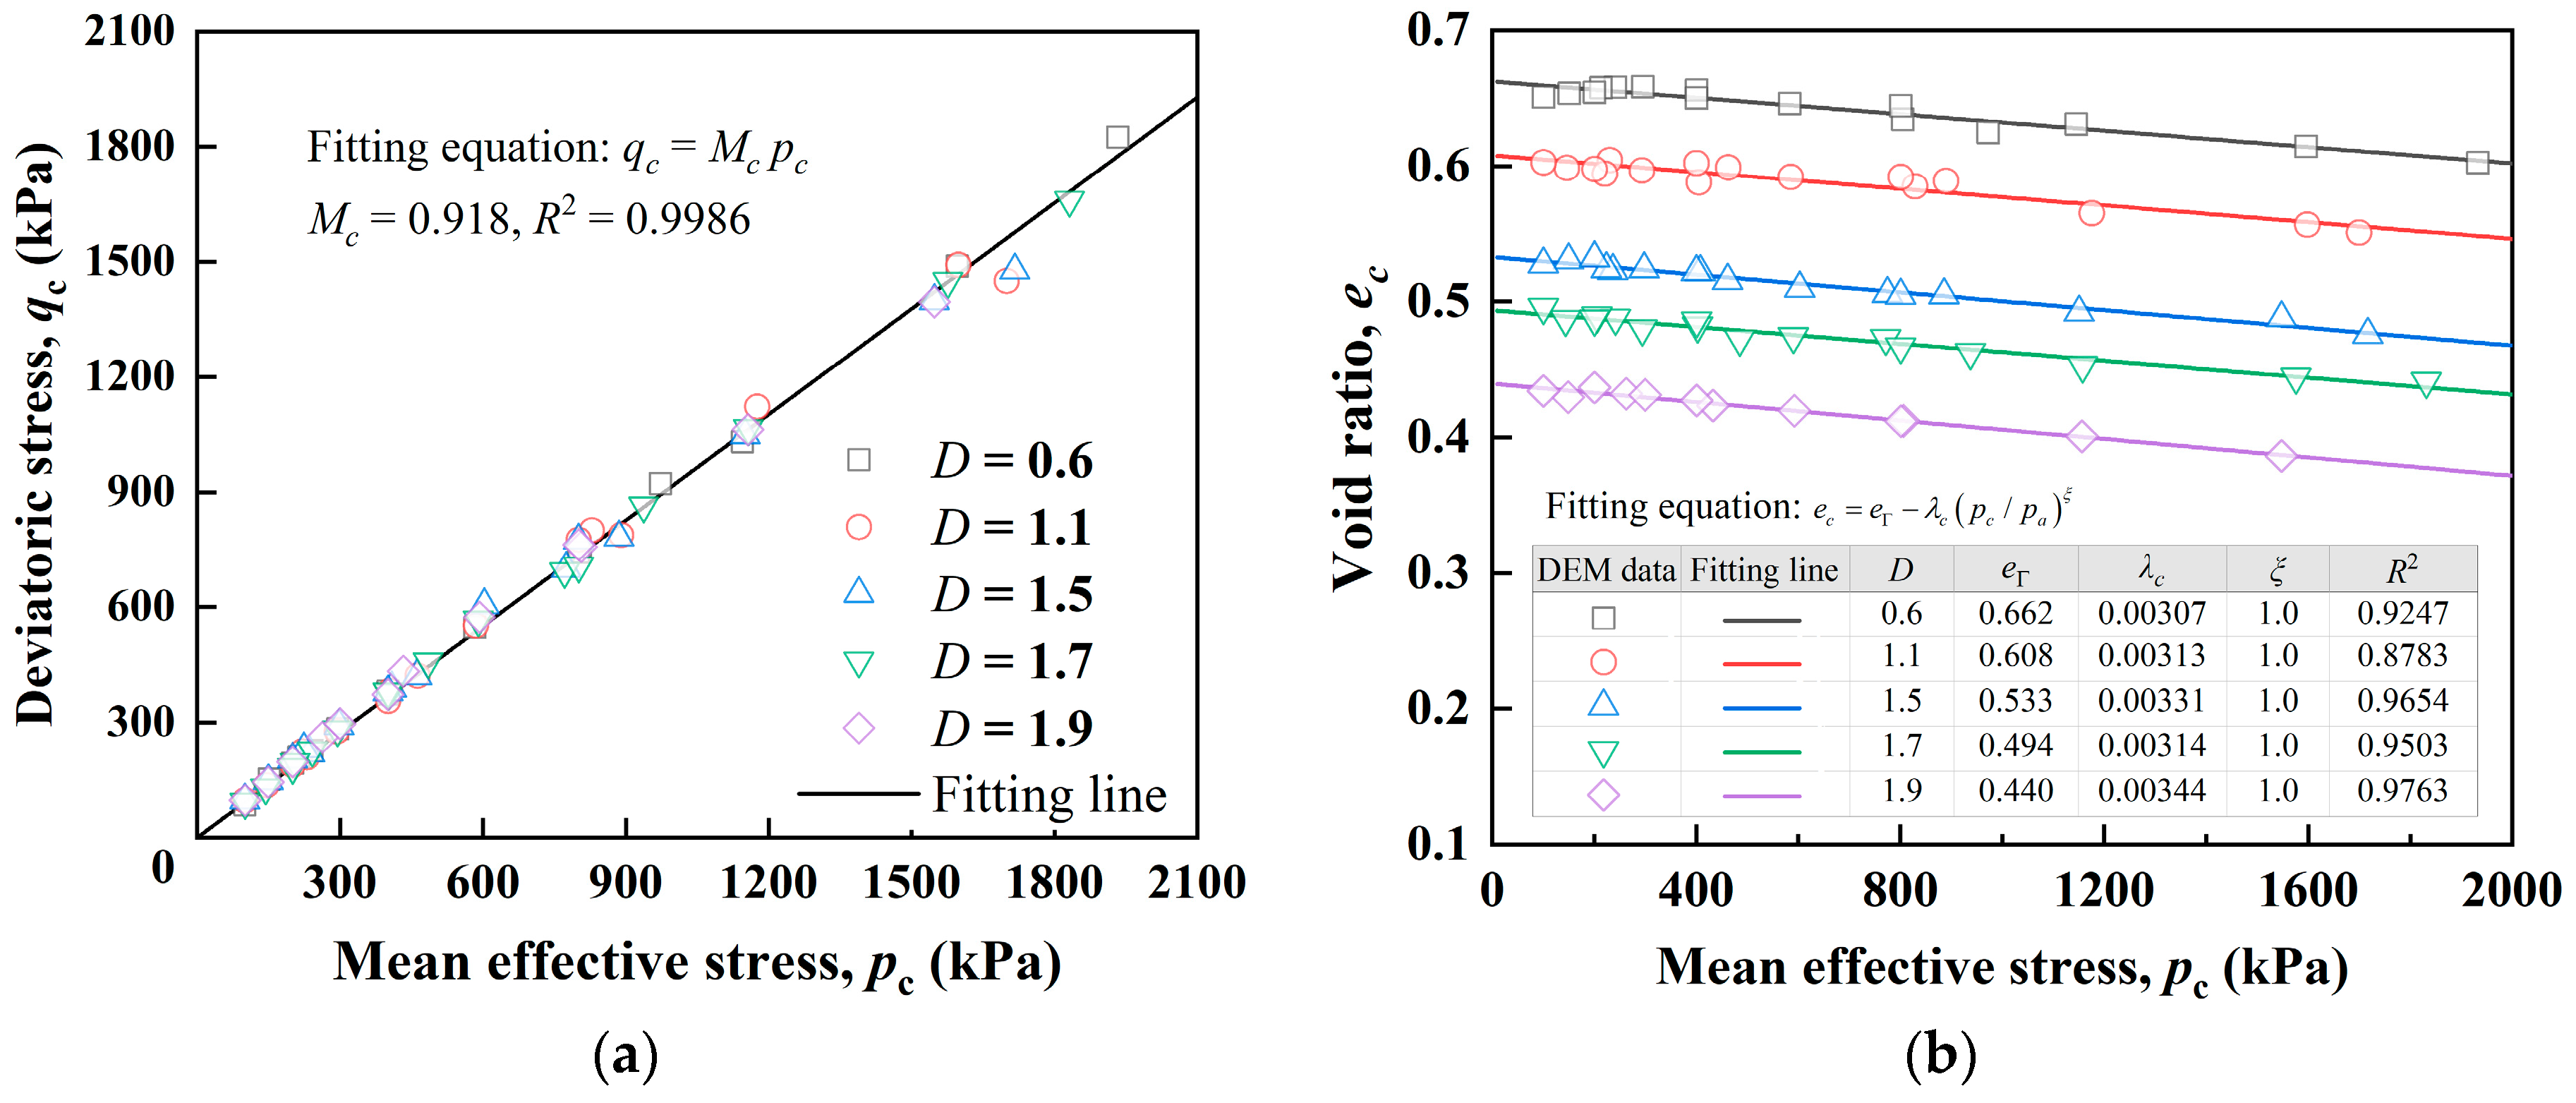
Figure 14 presents the critical state lines of initially isotropic specimens with different gradations in both the q–p and e–p planes. In the q–p plane, all critical state points are nearly collinear, with a slope of Mc ≈ 0.918. This value differs slightly from the value of 0.93 reported in Figure 9a, a refinement attributed to the increased number of data points incorporated into the regression analysis of the full dataset, thereby providing a more robust statistical representation. In contrast, Figure 14b clearly shows that in the e–p plane, the position of the critical state line is strongly influenced by gradation: the line shifts downward with fractal dimension D increasing from 0.6 to 1.9. This implies that the better the gradation (i.e., higher fine content), the lower the achievable critical void ratio, a phenomenon consistent with the commonly recognized downward shift in the critical state line induced by particle breakage.
Figure 14.
The critical state line at (a) q–p plane and (b) e–p plane of DEM specimens with different gradations.
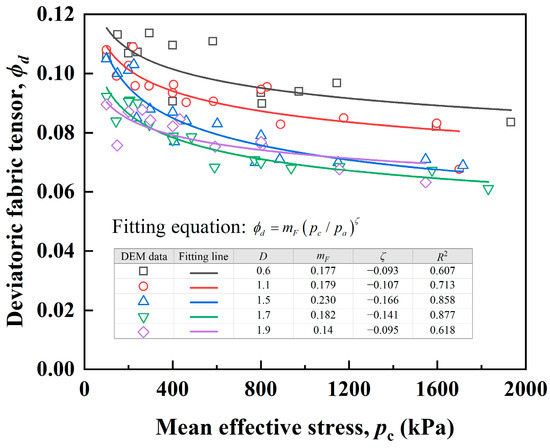
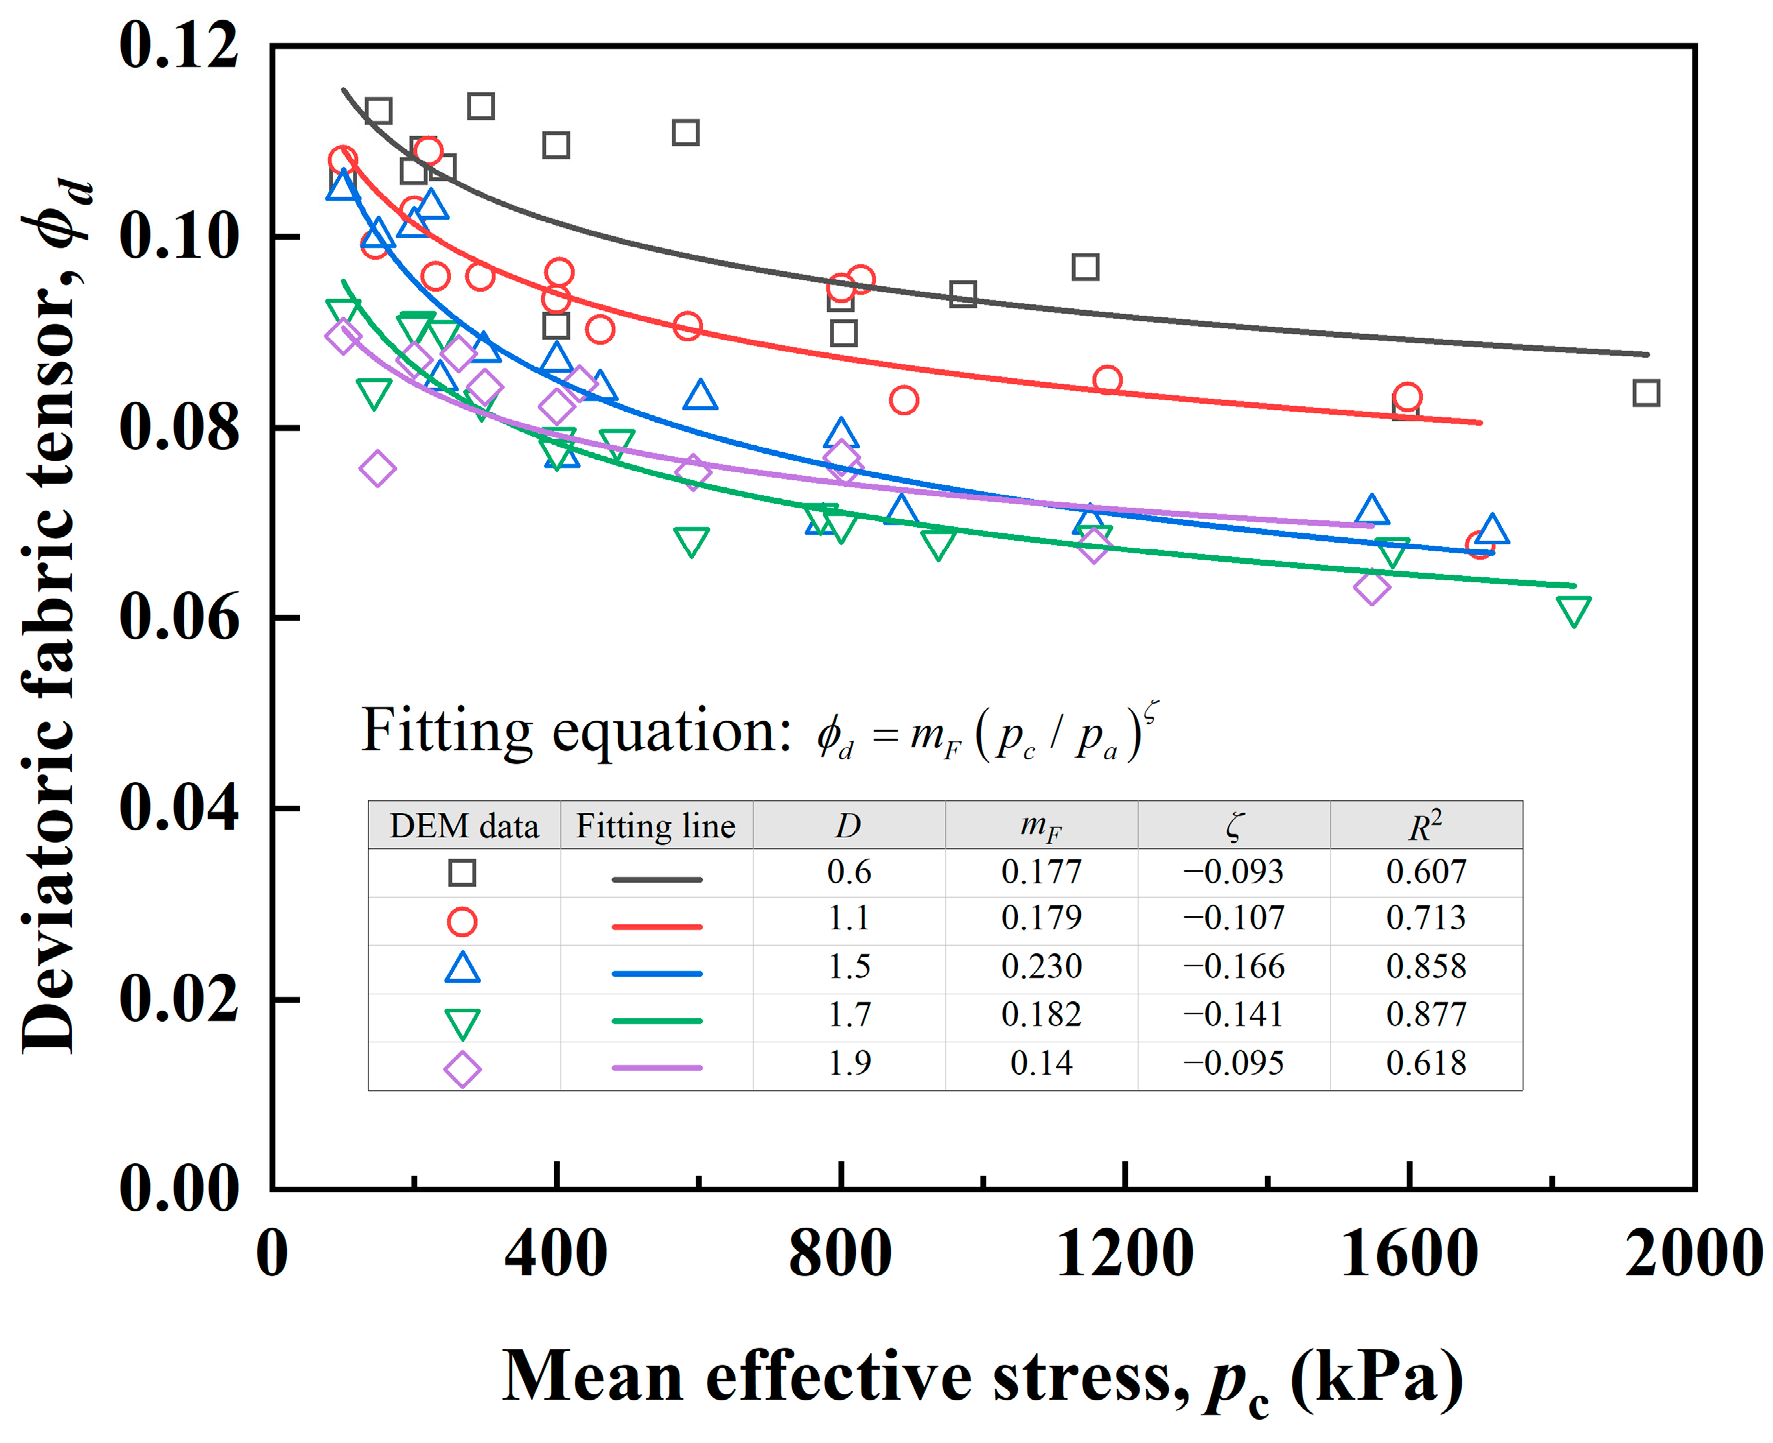
The microscopic origin of this phenomenon is further elucidated. Figure 15 shows that the ϕd–pc curves at the critical state move downward as D increases, indicating that specimens with higher fine content exhibit weaker fabric anisotropy at the critical state. The downward shift gradually diminishes, and the curves for D = 1.7 and D = 1.9 almost coincide. This observed convergence may imply that, for specimens with the same solid volume, the effect of increasing fines on fabric anisotropy reaches a limiting effect within the higher range of the fractal dimensions studied.
Figure 15.
Correlation between the deviatoric fabric tensor ϕd and mean effective stress pc at the critical state of DEM specimens with different gradations.
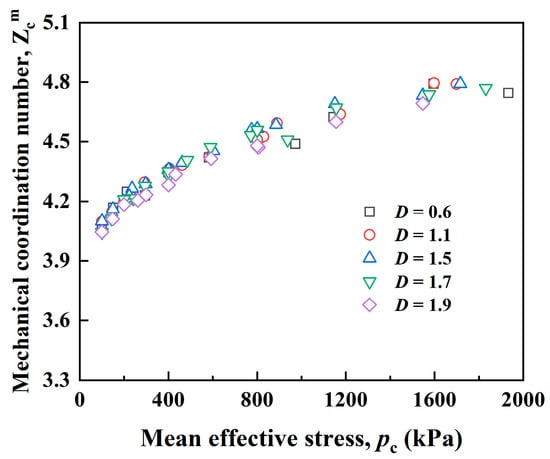
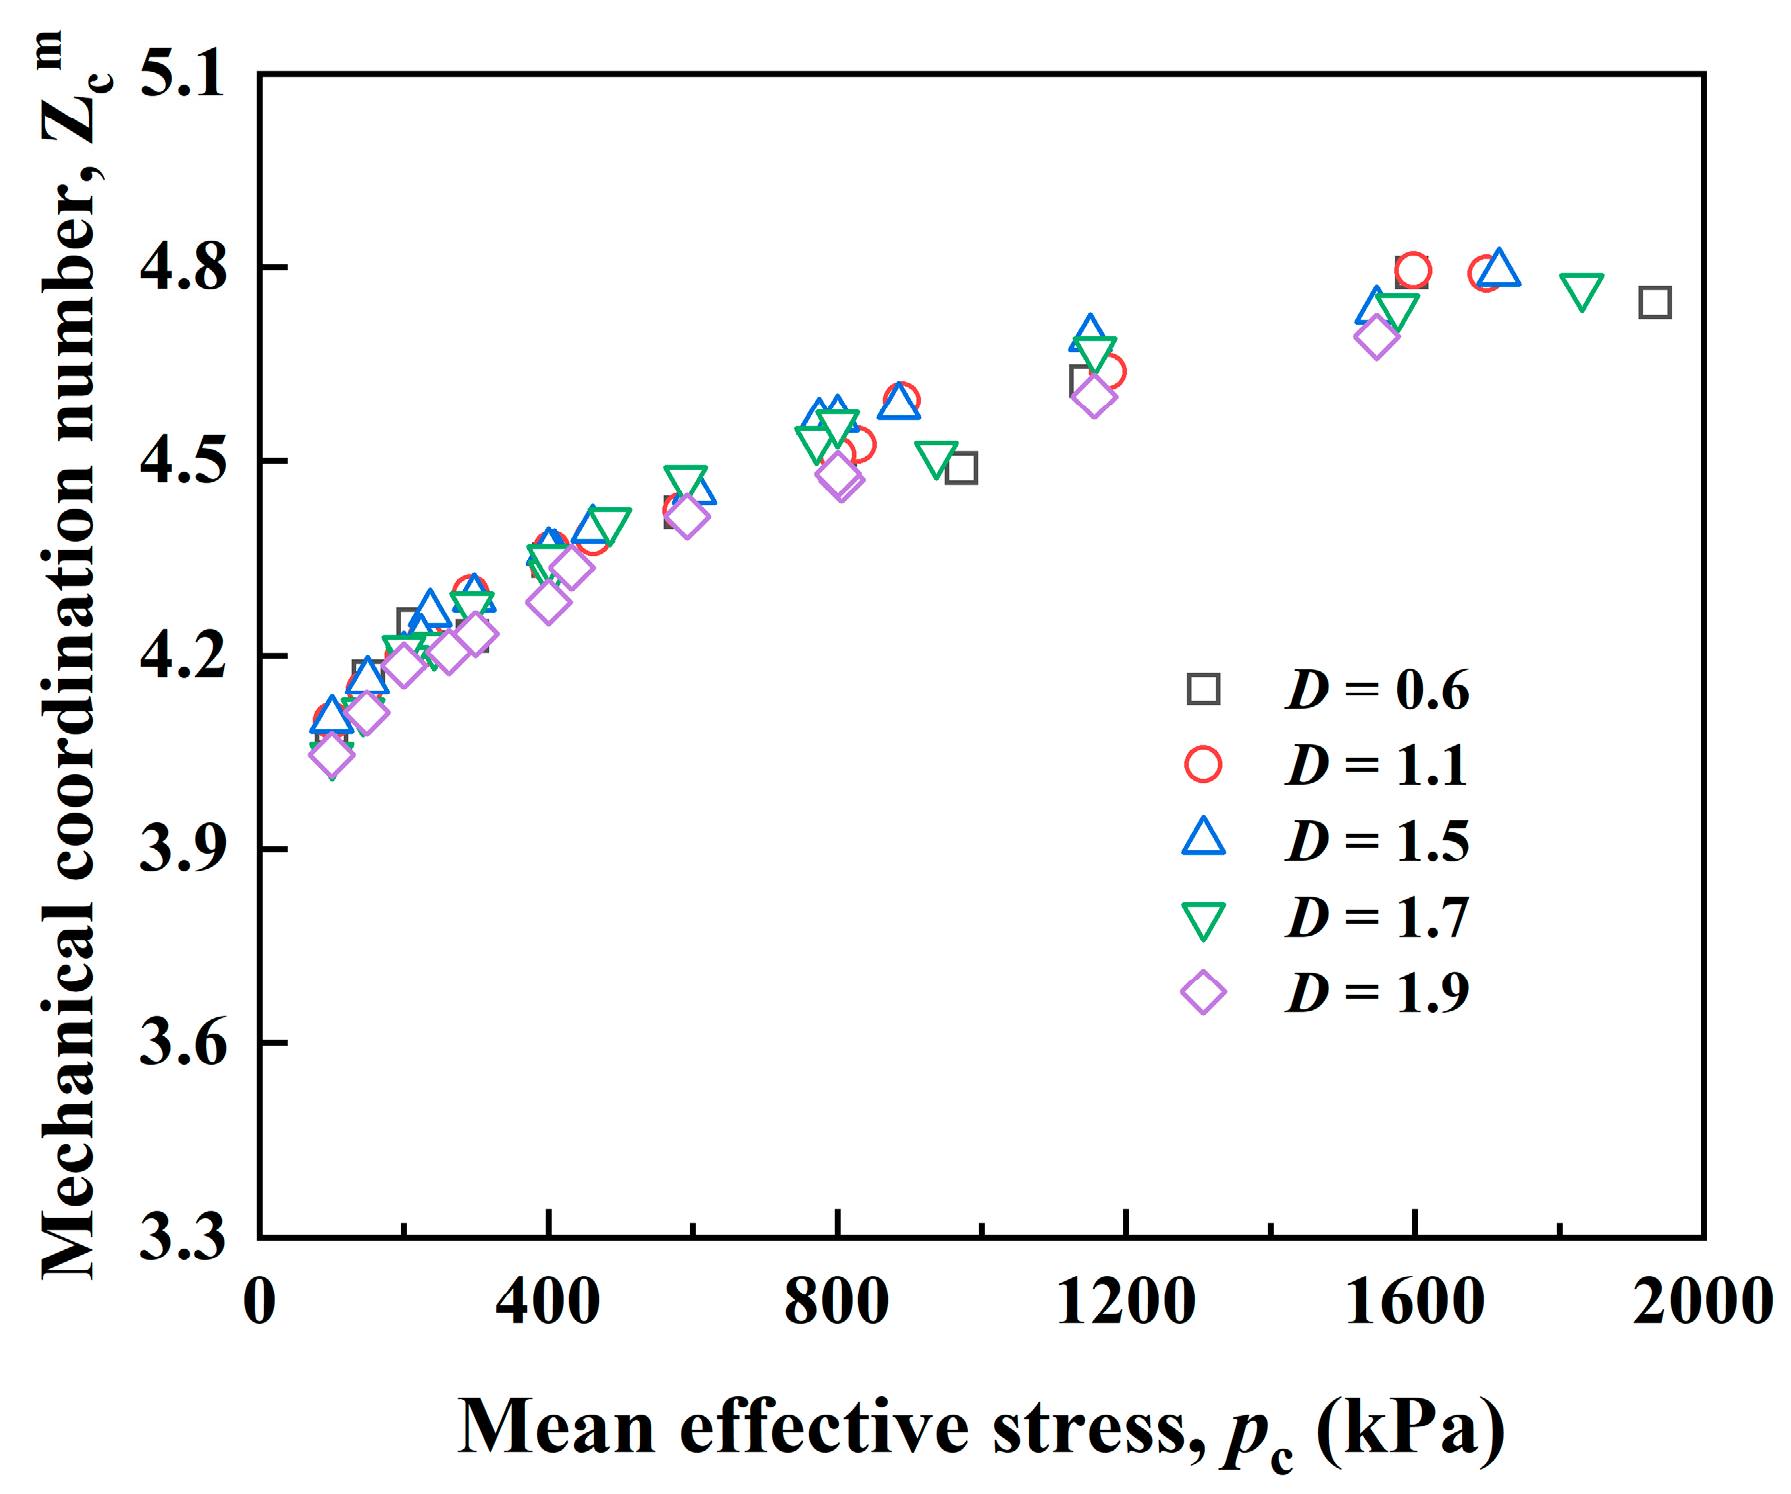
Figure 16 demonstrates that the differences in mechanical coordination number at the critical state among specimens with different gradations are relatively small. This suggests that gradation mainly influences the quality of the effective contact structure rather than simply increasing the number of contacts.
Figure 16.
Correlation between the mechanical coordination number and mean effective stress pc at the critical state of DEM specimens with different gradations.
Figure 17a shows that the Kc–pc curves shift downward with increasing D, while the extent of the downward shift progressively diminishes, suggesting a trend toward a saturated response within the studied D range. Figure 17b indicates that the Uc–pc curves shift upward with increasing D. This suggests a capacity for greater strain energy storage at the critical state in specimens with higher fine content under these simulated conditions. Again, the upward shift diminishes and the curves for D = 1.7 and D = 1.9 become nearly identical. Combining the trends observed in Figure 15, Figure 16 and Figure 17, it may be inferred that the influence of gradation on the examined microstructure and energy characteristics at the critical state appears to saturate at higher fractal dimensions.
Figure 17.
Correlation between the (a) Kc, (b) Uc and mean effective stress pc at critical state of DEM specimen with different gradations.
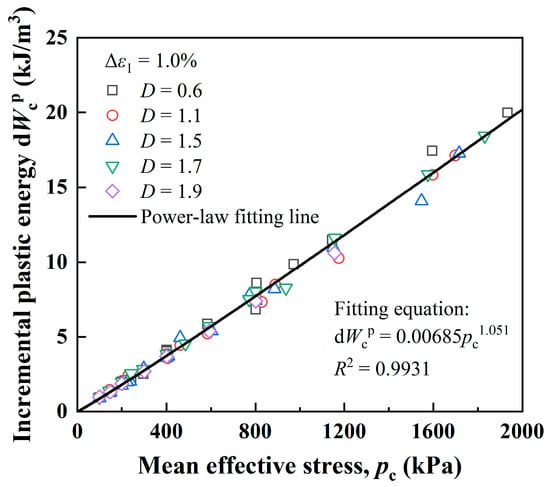
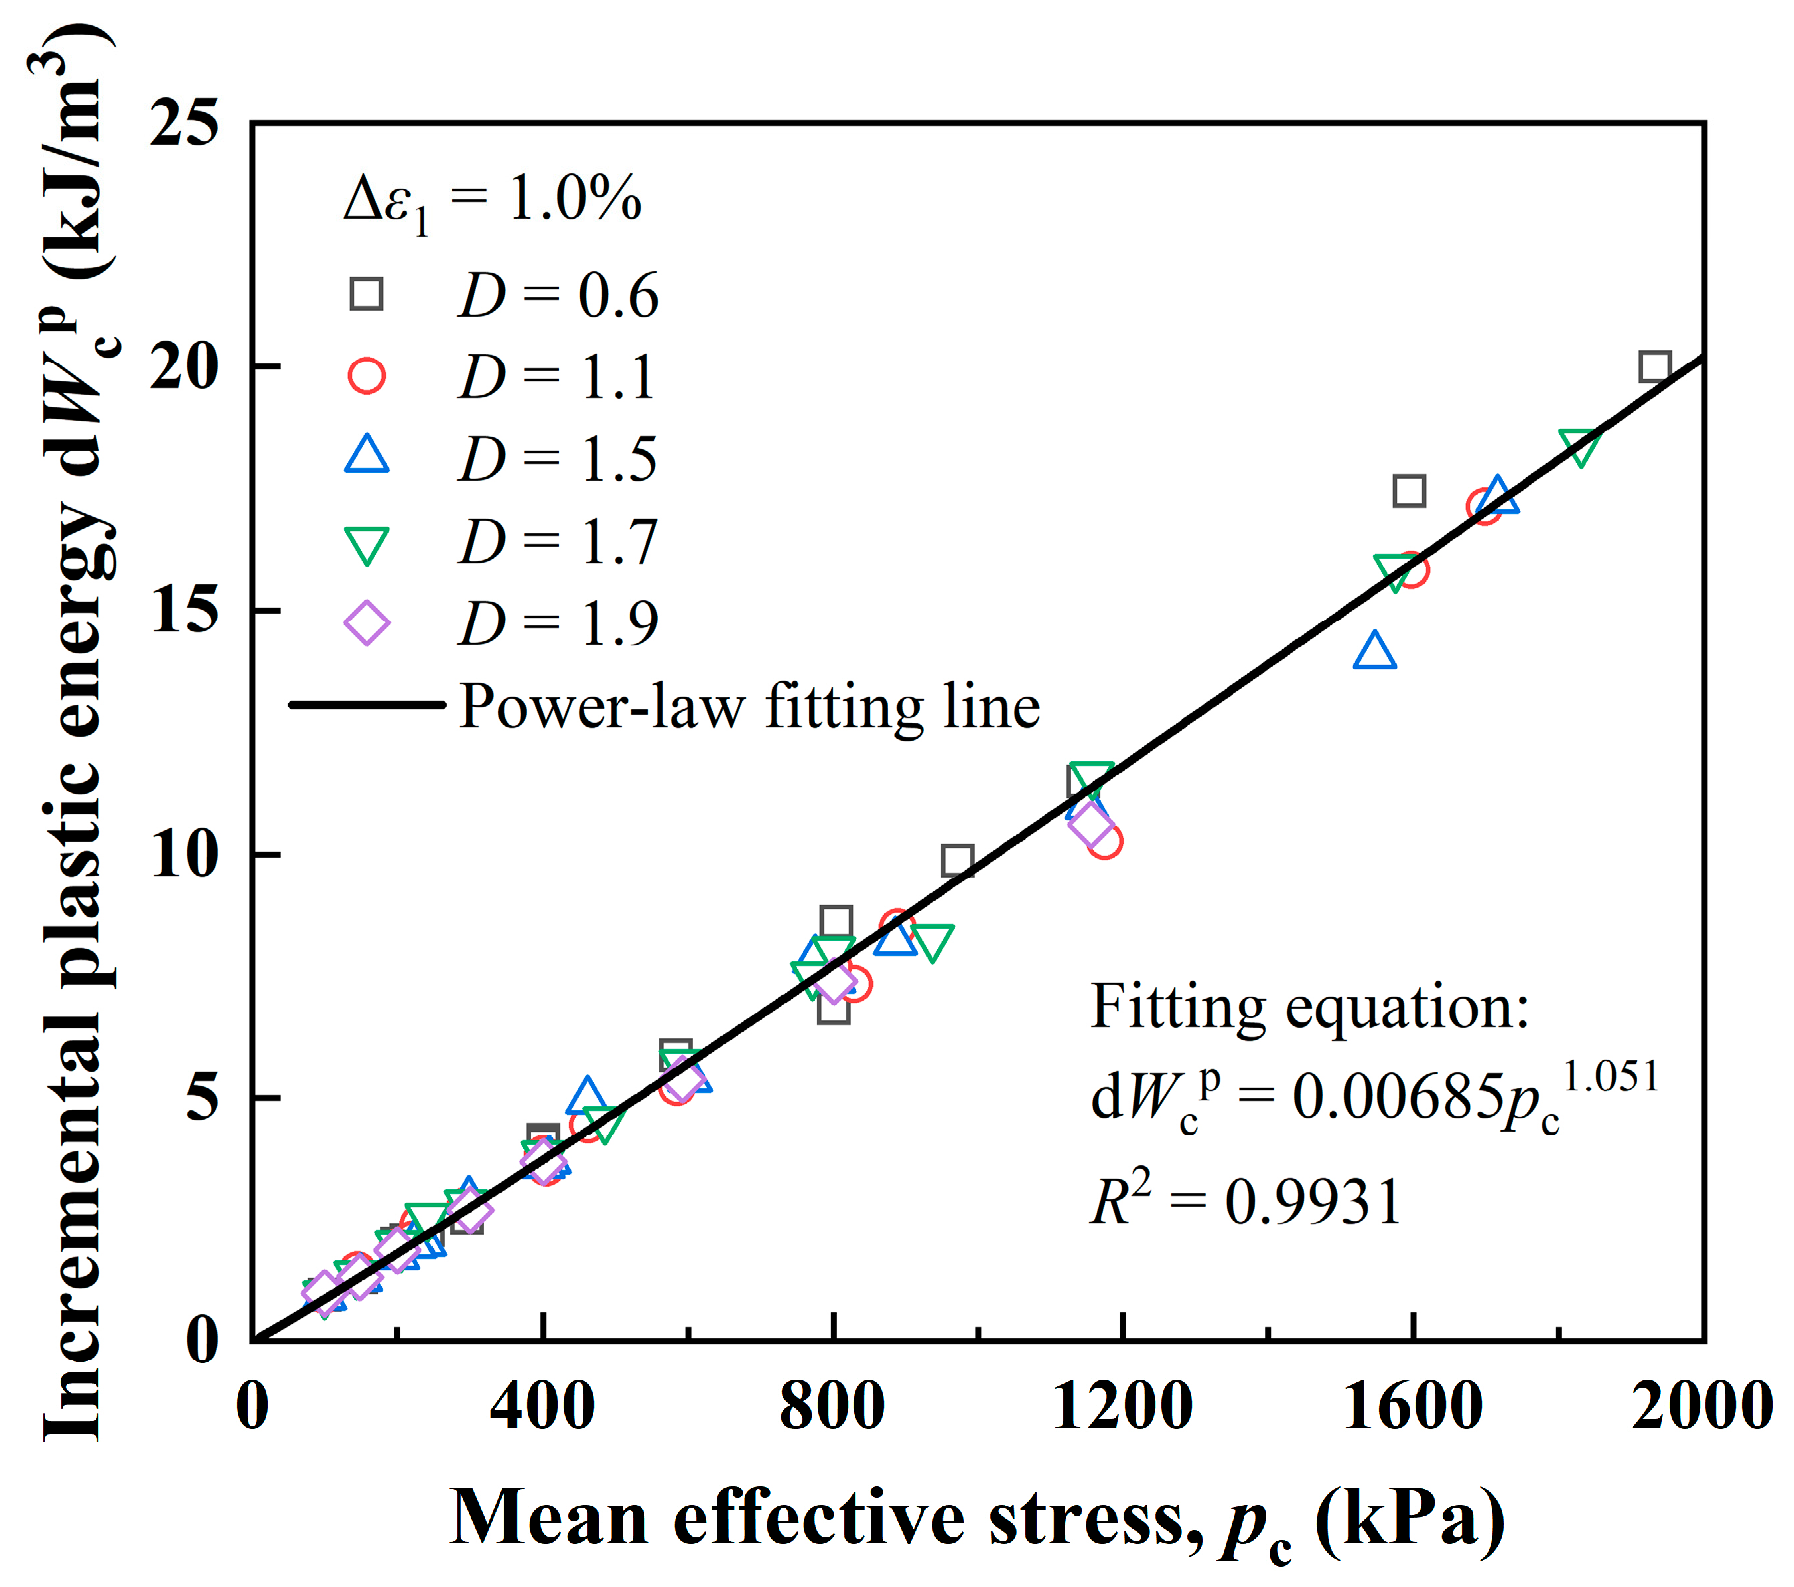
Figure 18 shows that the incremental plastic energy exhibits a unique power–law relationship with pc for specimens with different gradations, consistent with the uniqueness of the critical state line in the q–p plane shown in Figure 14a.
Figure 18.
Correlation between the incremental plastic energy and mean effective stress pc at critical state of DEM specimen with different gradations.
It can be concluded that gradation primarily affects the position of the critical state (particularly in the e–p plane) without altering its fundamental path-independence or the associated scaling laws between microscopic and energetic variables and mean effective stress. With increasing fine content, the critical void ratio decreases and the energy storage capacity enhances; however, these effects display a saturation trend and eventually stabilize toward a limiting critical microstructure.
5. Conclusions
Discrete element simulations were performed to investigate granular assemblies with idealized fractal gradations under constant stress ratio loading–turning paths, while maintaining identical solid volume and initial relative density. The effects of stress paths and gradation on mechanical behavior and critical state characteristics were examined from macroscopic, microscopic and energy perspectives. The main conclusions are as follows:
- For a given gradation, both the peak strength envelope and the critical state line exhibit high consistency and are effectively independent of the different stress paths examined. Furthermore, key microscopic and energetic variables at the critical state consistently follow power–law relationships with the mean effective stress, reinforcing the concept of path-independent critical state under the examined stress paths.
- For specimens with different gradations, the critical stress ratio is nearly insensitive to gradation, whereas the peak strength increases with increasing fractal dimension. Although the critical state points align closely in the q–p plane, the critical state line in the e–p plane shifts downward with increasing D, indicating a lower achievable critical void ratio for broader gradations.
- The influence of gradation on critical state microstructure and stored elastic energy appears to saturate at higher D values, as evidenced by converging trends. In contrast, the mechanical coordination number and incremental plastic energy at the critical state remain relatively insensitive to gradation changes.
- Within the framework of the adopted model, fractal gradation primarily governs the position of the critical state in the e–p space without altering its fundamental path-independent nature or the associated power-laws between microscopic and energetic variables and mean effective stress. The revealed relative trends provide fundamental insights into how gradation controls the critical state.
While this study is based on idealized fractal gap-graded granular assemblies, the underlying mechanical behaviors observed, particularly the unique evolution of fabric anisotropy and the shift in critical state lines, offer valuable insights for real-world materials. In natural soils or crushed rockfills, particle size distributions often exhibit non-idealized fractal features or contain fines. Our findings suggest that for such materials, the ‘effective’ fractal dimension may serve as a key index for calibrating constitutive models. Furthermore, the clear correlation we established between particle breakage and anisotropic fabric evolution implies that even in complex mineralogical compositions, breakage-induced fabric changes follow quantifiable trends. Future extensions of this work could involve introducing irregular particle shapes or varying mineral hardness to bridge the gap between idealized simulations and engineering applications.
Author Contributions
Conceptualization, Y.W. and Y.R.; methodology, Y.W. and Y.T.; software, Y.W. and K.F.; validation, K.F. and S.W.; formal analysis, Y.W.; investigation, Y.W. and Y.T.; resources, K.F. and Y.R.; data curation, Y.W. and Y.T.; writing—original draft preparation, Y.W. and Y.T.; writing—review and editing, Y.R. and S.W.; visualization, Y.W.; supervision, K.F. and Y.R.; project administration, K.F. and Y.R.; funding acquisition, K.F. and Y.R. All authors have read and agreed to the published version of the manuscript.
Funding
This research was funded by the National Key R&D Program of China, grant number 2023YFC3009400, the National Natural Science Foundation of China, grant number 52308349 and the Fundamental Research Funds for the Central Universities, grant number B250201023.
Data Availability Statement
The original contributions presented in this study are included in the article.
Conflicts of Interest
Author Shengtao Wang was employed by the company China Railway No. 4 Engineering Group Co., Ltd. The remaining authors declare that the research was conducted in the absence of any commercial or financial relationships that could be construed as a potential conflict of interest.
Abbreviation
The following abbreviations are used in this manuscript:
| DEM | Discrete element method |
References
- Kuhn, M.R. Heterogeneity and patterning in the quasi-static behavior of granular materials. Granul. Matter 2003, 4, 155–166. [Google Scholar] [CrossRef] [Scilit]
- Liu, J.; Bosco, E.; Suiker, A. Multi-scale modelling of granular materials: Numerical framework and study on micro-structural features. Comput. Mech. 2019, 63, 409–427. [Google Scholar] [CrossRef] [Scilit]
- Zheng, Y.; Li, J.; Zheng, X.; Guo, N.; Yang, G. Pre-and post-failure behaviour of a dike after rapid drawdown of river level based on material point method. Comput. Geotech. 2024, 170, 106269. [Google Scholar] [CrossRef] [Scilit]
- Liang, L.; Cheng, Y.P.; Fan, X.; Ding, Z.; Xu, C. Multi-Scale Research on the Mechanisms of Soil Arching Development and Degradation in Granular Materials with Different Relative Density. Fractal Fract. 2024, 8, 247. [Google Scholar] [CrossRef] [Scilit]
- Zheng, Y.; Baudet, B.A.; Coop, M.R.; Pereira, J.M.; Delage, P. A study of pore properties in reconstituted Lucera clay at states of the critical state framework. Géotechnique 2025, 1–13. [Google Scholar] [CrossRef] [Scilit]
- Tang, C.A.; Liu, H.Y.; Zhu, W.C.; Yang, T.H.; Li, W.H.; Song, L.; Lin, P. Numerical approach to particle breakage under different loading conditions. Powder Technol. 2004, 143, 130–143. [Google Scholar] [CrossRef] [Scilit]
- Zheng, G.; Zhao, J.; Yu, X.; Zhou, H. Probabilistic Stability Frameworks of Stone Column–Supported Embankments Considering Failure Mechanisms. Int. J. Geomech. 2026, 26, 04025309. [Google Scholar] [CrossRef] [Scilit]
- Sadeghian, M.H.; Sadeghi, M.; Fakhimi, A. Particle breakage, deformation and shear strength of conglomerate rockfill material: A case study of Masjed Soleyman Dam cracking and settlement. Bull. Eng. Geol. Environ. 2024, 83, 506. [Google Scholar] [CrossRef] [Scilit]
- Xu, Q.; Xia, Z.; Du, S.; Fan, Y.; Huang, G.; Chen, S.; Zhang, Z.; Liu, Y. Fractal and CT Analysis of Water-Bearing Coal–Rock Composites Under True Triaxial Loading–Unloading. Fractal Fract. 2025, 9, 782. [Google Scholar] [CrossRef] [Scilit]
- Wang, J.; Liu, S.; Yu, X.; Gu, H.; Liu, H.; Liu, C. Characteristics of Overlying Rock Breakage and Fissure Evolution in the Mining of Extra-Thick Coal Seams in Anticline Structural Area. Appl. Sci. 2025, 15, 8812. [Google Scholar] [CrossRef] [Scilit]
- Fan, K.; Zheng, Y.; Baudet, B.A.; Cheng, Y.P. Investigation of the ultimate particle size distribution of a carbonate sand. Soils Found. 2021, 61, 1708–1717. [Google Scholar] [CrossRef] [Scilit]
- Feng, J.T.; Tao, Y.Z.; Shen, Y.; Qi, W.C.; Cai, H.; Fan, K.W. Numerical investigation of electrokinetic geosynthetics-assisted vacuum preloading combined with electroosmosis for consolidation and remediation of dredged sediments. Transp. Geotech. 2026, 58, 101930. [Google Scholar] [CrossRef] [Scilit]
- Shakibaeinia, A.; Jin, Y.C. A mesh-free particle model for simulation of mobile-bed dam break. Adv. Water Resour. 2011, 34, 794–807. [Google Scholar] [CrossRef] [Scilit]
- Deluzarche, R.; Cambou, B. Discrete numerical modelling of rockfill dams. Int. J. Numer. Anal. Methods Geomech. 2006, 30, 1075–1096. [Google Scholar] [CrossRef] [Scilit]
- Magin, R.L.; Royston, T.J. Fractional-order elastic models of cartilage: A multi-scale approach. Commun. Nonlinear Sci. Numer. Simul. 2010, 15, 657–664. [Google Scholar] [CrossRef] [Scilit]
- Rathinaraj, J.D.; McKinley, G.H.; Keshavarz, B. Incorporating rheological nonlinearity into fractional calculus descriptions of fractal matter and multi-scale complex fluids. Fractal Fract. 2021, 5, 174. [Google Scholar] [CrossRef] [Scilit]
- Choi, D.; Park, S.; Han, J.; Ahn, M.Y.; Lee, Y.; Park, Y.H.; Cho, S.; Sohn, D. A DEM-CFD study of the effects of size distributions and packing fractions of pebbles on purge gas flow through pebble beds. Fusion Eng. Des. 2019, 143, 24–34. [Google Scholar] [CrossRef] [Scilit]
- Jiménez-Herrera, N.; Barrios, G.K.; Tavares, L.M. Comparison of breakage models in DEM in simulating impact on particle beds. Adv. Powder Technol. 2018, 29, 692–706. [Google Scholar] [CrossRef] [Scilit]
- Wang, Y.; Nie, J.Y.; Zhao, S.; Wang, H. A coupled FEM-DEM study on mechanical behaviors of granular soils considering particle breakage. Comput. Geotech. 2023, 160, 105529. [Google Scholar] [CrossRef] [Scilit]
- Shen, C.; Fan, K.; Liu, S.; Wang, L.; Lai, Z.; Yuan, W. A simple unified stress-strain model for geotextile-wrapped soils. Geotext. Geomembr. 2021, 49, 697–706. [Google Scholar] [CrossRef] [Scilit]
- Wu, Y.; Cui, J.; Huang, J.; Zhang, W.; Yoshimoto, N.; Wen, L. Correlation of critical state strength properties with particle shape and surface fractal dimension of clinker ash. Int. J. Geomech. 2021, 21, 04021071. [Google Scholar] [CrossRef] [Scilit]
- Tavares, L.M.; Rodriguez, V.A.; Sousani, M.; Padros, C.B.; Ooi, J.Y. An effective sphere-based model for breakage simulation in DEM. Powder Technol. 2021, 392, 473–488. [Google Scholar] [CrossRef] [Scilit]
- Bandini, V.; Coop, M.R. The influence of particle breakage on the location of the critical state line of sands. Soils Found. 2011, 51, 591–600. [Google Scholar] [CrossRef] [Scilit]
- Luzzani, L.; Coop, M.R. On the relationship between particle breakage and the critical state of sands. Soils Found. 2002, 42, 71–82. [Google Scholar] [CrossRef] [Scilit]
- Cambou, B.; Jean, M.; Radjaï, F. Micromechanics of Granular Materials; Wiley: Hoboken, NJ, USA, 2009. [Google Scholar]
- Liu, S.; He, W.; Sun, Y.; Shen, C.; Wang, L. Analysis of the behavior of a high earth-core rockfill dam considering particle breakage. Comput. Geotech. 2023, 157, 105320. [Google Scholar] [CrossRef] [Scilit]
- Alidadi, S.; Alipour, R.; Shakeri, M. Influence of rockfill particle breakage on long-term settlement of embankment dams. Proc. Inst. Civ. Eng. Geotech. Eng. 2023, 176, 315–325. [Google Scholar] [CrossRef] [Scilit]
- Einav, I. Breakage mechanics—Part I: Theory. J. Mech. Phys. Solids 2007, 55, 1274–1297. [Google Scholar] [CrossRef] [Scilit]
- De Frias Lopez, R.; Silfwerbrand, J.; Jelagin, D.; Birgisson, B. Force transmission and soil fabric of binary granular mixtures. Géotechnique 2016, 66, 578–583. [Google Scholar] [CrossRef] [Scilit]
- Minh, N.H.; Cheng, Y.P. A DEM investigation of the effect of particle-size distribution on one-dimensional compression. Géotechnique 2013, 63, 44–53. [Google Scholar] [CrossRef] [Scilit]
- Guo, Y.; Liu, S.; Feng, S.; Shen, C. Advanced DEM parameter calibration and multiscale analysis of granular materials based on synergistic BBD-NSGA-II framework. Comput. Part. Mech. 2025, 12, 3769–3787. [Google Scholar] [CrossRef] [Scilit]
- Guo, N.; Zhao, J. The signature of shear-induced anisotropy in granular media. Comput. Geotech. 2013, 47, 1–15. [Google Scholar] [CrossRef] [Scilit]
- Liu, J.; Zhou, W.; Ma, G.; Yang, S.; Chang, X. Strong contacts, connectivity and fabric anisotropy in granular materials: A 3D perspective. Powder Technol. 2020, 366, 747–760. [Google Scholar] [CrossRef] [Scilit]
- Oda, M. Fabric tensor for discontinuous geological materials. J. Jpn. Soc. Soil Mech. Found. Eng. 1982, 22, 96–108. [Google Scholar] [CrossRef] [Scilit] [PubMed]
- Zhao, J.; Guo, N. Unique critical state characteristics in granular media considering fabric anisotropy. Géotechnique 2013, 63, 695–704. [Google Scholar] [CrossRef] [Scilit]
- Hanley, K.; Huang, X.; O’Sullivan, C. Energy dissipation in soil samples during drained triaxial shearing. Géotechnique 2018, 68, 421–433. [Google Scholar] [CrossRef] [Scilit]
- Li, X.; Dafalias, Y.; Wang, Z. State-dependant dilatancy in critical-state constitutive modelling of sand. Can. Geotech. J. 1999, 36, 599–611. [Google Scholar] [CrossRef]

Disclaimer/Publisher’s Note: The statements, opinions and data contained in all publications are solely those of the individual author(s) and contributor(s) and not of MDPI and/or the editor(s). MDPI and/or the editor(s) disclaim responsibility for any injury to people or property resulting from any ideas, methods, instructions or products referred to in the content. |
© 2026 by the authors. Licensee MDPI, Basel, Switzerland. This article is an open access article distributed under the terms and conditions of the Creative Commons Attribution (CC BY) license.