


Abstract
Background: Fractal dimension (FD) analysis has been widely applied to medical and dental images to quantify trabecular bone complexity. Panoramic radiographs are routinely used in dental practice; however, the capability of two-dimensional panoramic imaging combined with FD analysis to detect subtle mandibular trabecular alterations associated with systemic diseases such as type 2 diabetes mellitus (T2DM) remains uncertain. Methodology: This retrospective cross-sectional study included 106 individuals, comprising 53 patients diagnosed with T2DM and 53 non-diabetic controls. Fractal dimension values were calculated using a standardized box-counting algorithm from four anatomically defined mandibular regions of interest (anterior, premolar, molar, and condylar) on panoramic radiographs. Intergroup comparisons of FD values were performed to evaluate the sensitivity of panoramic radiograph-based FD analysis in detecting diabetes-related trabecular differences. Results: No statistically significant differences in fractal dimension values were observed between the T2DM and control groups across all evaluated mandibular regions (p > 0.05). These findings highlight methodological limitations related to image dimensionality, projection geometry, and regional trabecular heterogeneity. Conclusions: Fractal analysis remains a valuable quantitative tool; however, its application to panoramic radiographs should be interpreted cautiously when used to assess systemic bone alterations.
1. Introduction
Fractal geometry provides a mathematical framework for describing complex, self-similar structures that cannot be adequately characterized by conventional Euclidean measures. In biomedical imaging, fractal dimension (FD) has been increasingly used as a quantitative descriptor of structural complexity, particularly for trabecular bone, which exhibits irregular and heterogeneous spatial patterns across multiple scales [1,2]. As a result, FD analysis has been applied to various imaging modalities to assess bone microarchitecture in both physiological and pathological conditions [3,4,5]. In dental and maxillofacial research, panoramic radiography remains one of the most commonly utilized imaging techniques due to its wide availability, low radiation dose, and cost-effectiveness. Several studies have employed FD analysis on panoramic radiographs to investigate trabecular bone alterations associated with osteoporosis, metabolic disorders, and systemic diseases [6,7,8]. However, panoramic imaging is inherently two-dimensional and subject to projection-related distortions, superimposition, and variable magnification, which may influence the reliability and sensitivity of fractal-based measurements. Recent advances in radiographic image analysis have also incorporated machine learning-based approaches, particularly in medical X-ray interpretation, where preprocessing and image enhancement steps play a critical role in feature extraction. Although methodologically distinct from fractal analysis, such studies highlight the importance of standardized image processing pipelines in radiographic texture-based assessments [9].
Type 2 diabetes mellitus (T2DM) is a systemic metabolic disease known to affect bone quality through complex mechanisms involving impaired bone remodeling, accumulation of advanced glycation end products, and altered microvascular function [10,11,12]. While these changes have been documented in various skeletal sites, their detectability using two-dimensional dental imaging combined with fractal analysis remains controversial. Previous studies assessing mandibular-bone changes in diabetic patients using FD analysis have reported inconsistent findings, suggesting that methodological factors may play a critical role in outcome variability [6,13]. The sensitivity of fractal dimension measurements in fractal analysis is affected by more than just biological differences; it is also strongly determined by image dimensionality, spatial resolution, the chosen region of interest, and the details of the algorithmic approach [5,14]. In panoramic radiographs, the reduction in three-dimensional trabecular structures into a two-dimensional projection may obscure subtle architectural differences, potentially limiting the discriminative power of FD analysis for systemic bone conditions [15]. Therefore, the aim of the present study was to evaluate the ability and limitations of panoramic radiograph-based fractal dimension analysis to detect mandibular trabecular changes associated with type 2 diabetes mellitus. The study was designed to highlight the methodological shortcomings of fractal analysis applied to two-dimensional panoramic images in the context of whole-body bone evaluation, based on a comparison of FD values from standardized mandibular sites in diabetic versus non-diabetic participants.
2. Materials and Methods
2.1. Patient Selection and Radiographic Evaluation
This retrospective cross-sectional study was conducted in accordance with the Declaration of Helsinki and approved by Izmir Katip Celebi University Health Research Ethics Committee with the 2023/0181 approval number. Informed consent was waived because the data was anonymized and retrospective. Panoramic radiographs, acquired between January 2019 and December 2022, were retrospectively selected from the digital archive of the Department of Oral and Maxillofacial Surgery and the Department of Oral and Maxillofacial Radiology, Faculty of Dentistry Images, acquired as part of routine dental examination and treatment planning. Radiographs were obtained using Orthopantomograph OP 300 (Instrumentarium, Helsinki, Finland) by trained dental operators with the following parameters: 66 kVp, 10 mA, and 16 s exposure time. Panoramic radiographs were subsequently scanned at 24-bit depth with a resolution of 600 DPI, and the resulting images were stored in the .jpeg format. A total of 106 individuals were included in the study, consisting of 53 patients diagnosed with type 2 diabetes mellitus (T2DM) and 53 non-diabetic control subjects. The diagnosis of T2DM was confirmed based on medical records. All patients in the study group were selected from patients who had been diagnosed with T2DM more than 5 years ago. Exclusion criteria included a history of metabolic bone disease other than diabetes, use of medications known to affect bone metabolism (e.g., bisphosphonates, corticosteroids), systemic conditions influencing bone structure, previous mandibular surgery, pathological lesions affecting the mandible, and radiographs of insufficient image quality. The control group was selected from the same radiographic archive and study period using identical inclusion and exclusion criteria, without individual age- or sex-matching.
2.2. Fractal Dimension Analysis
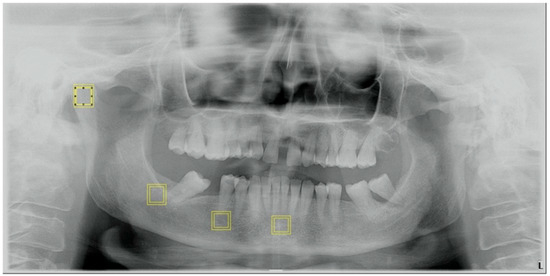
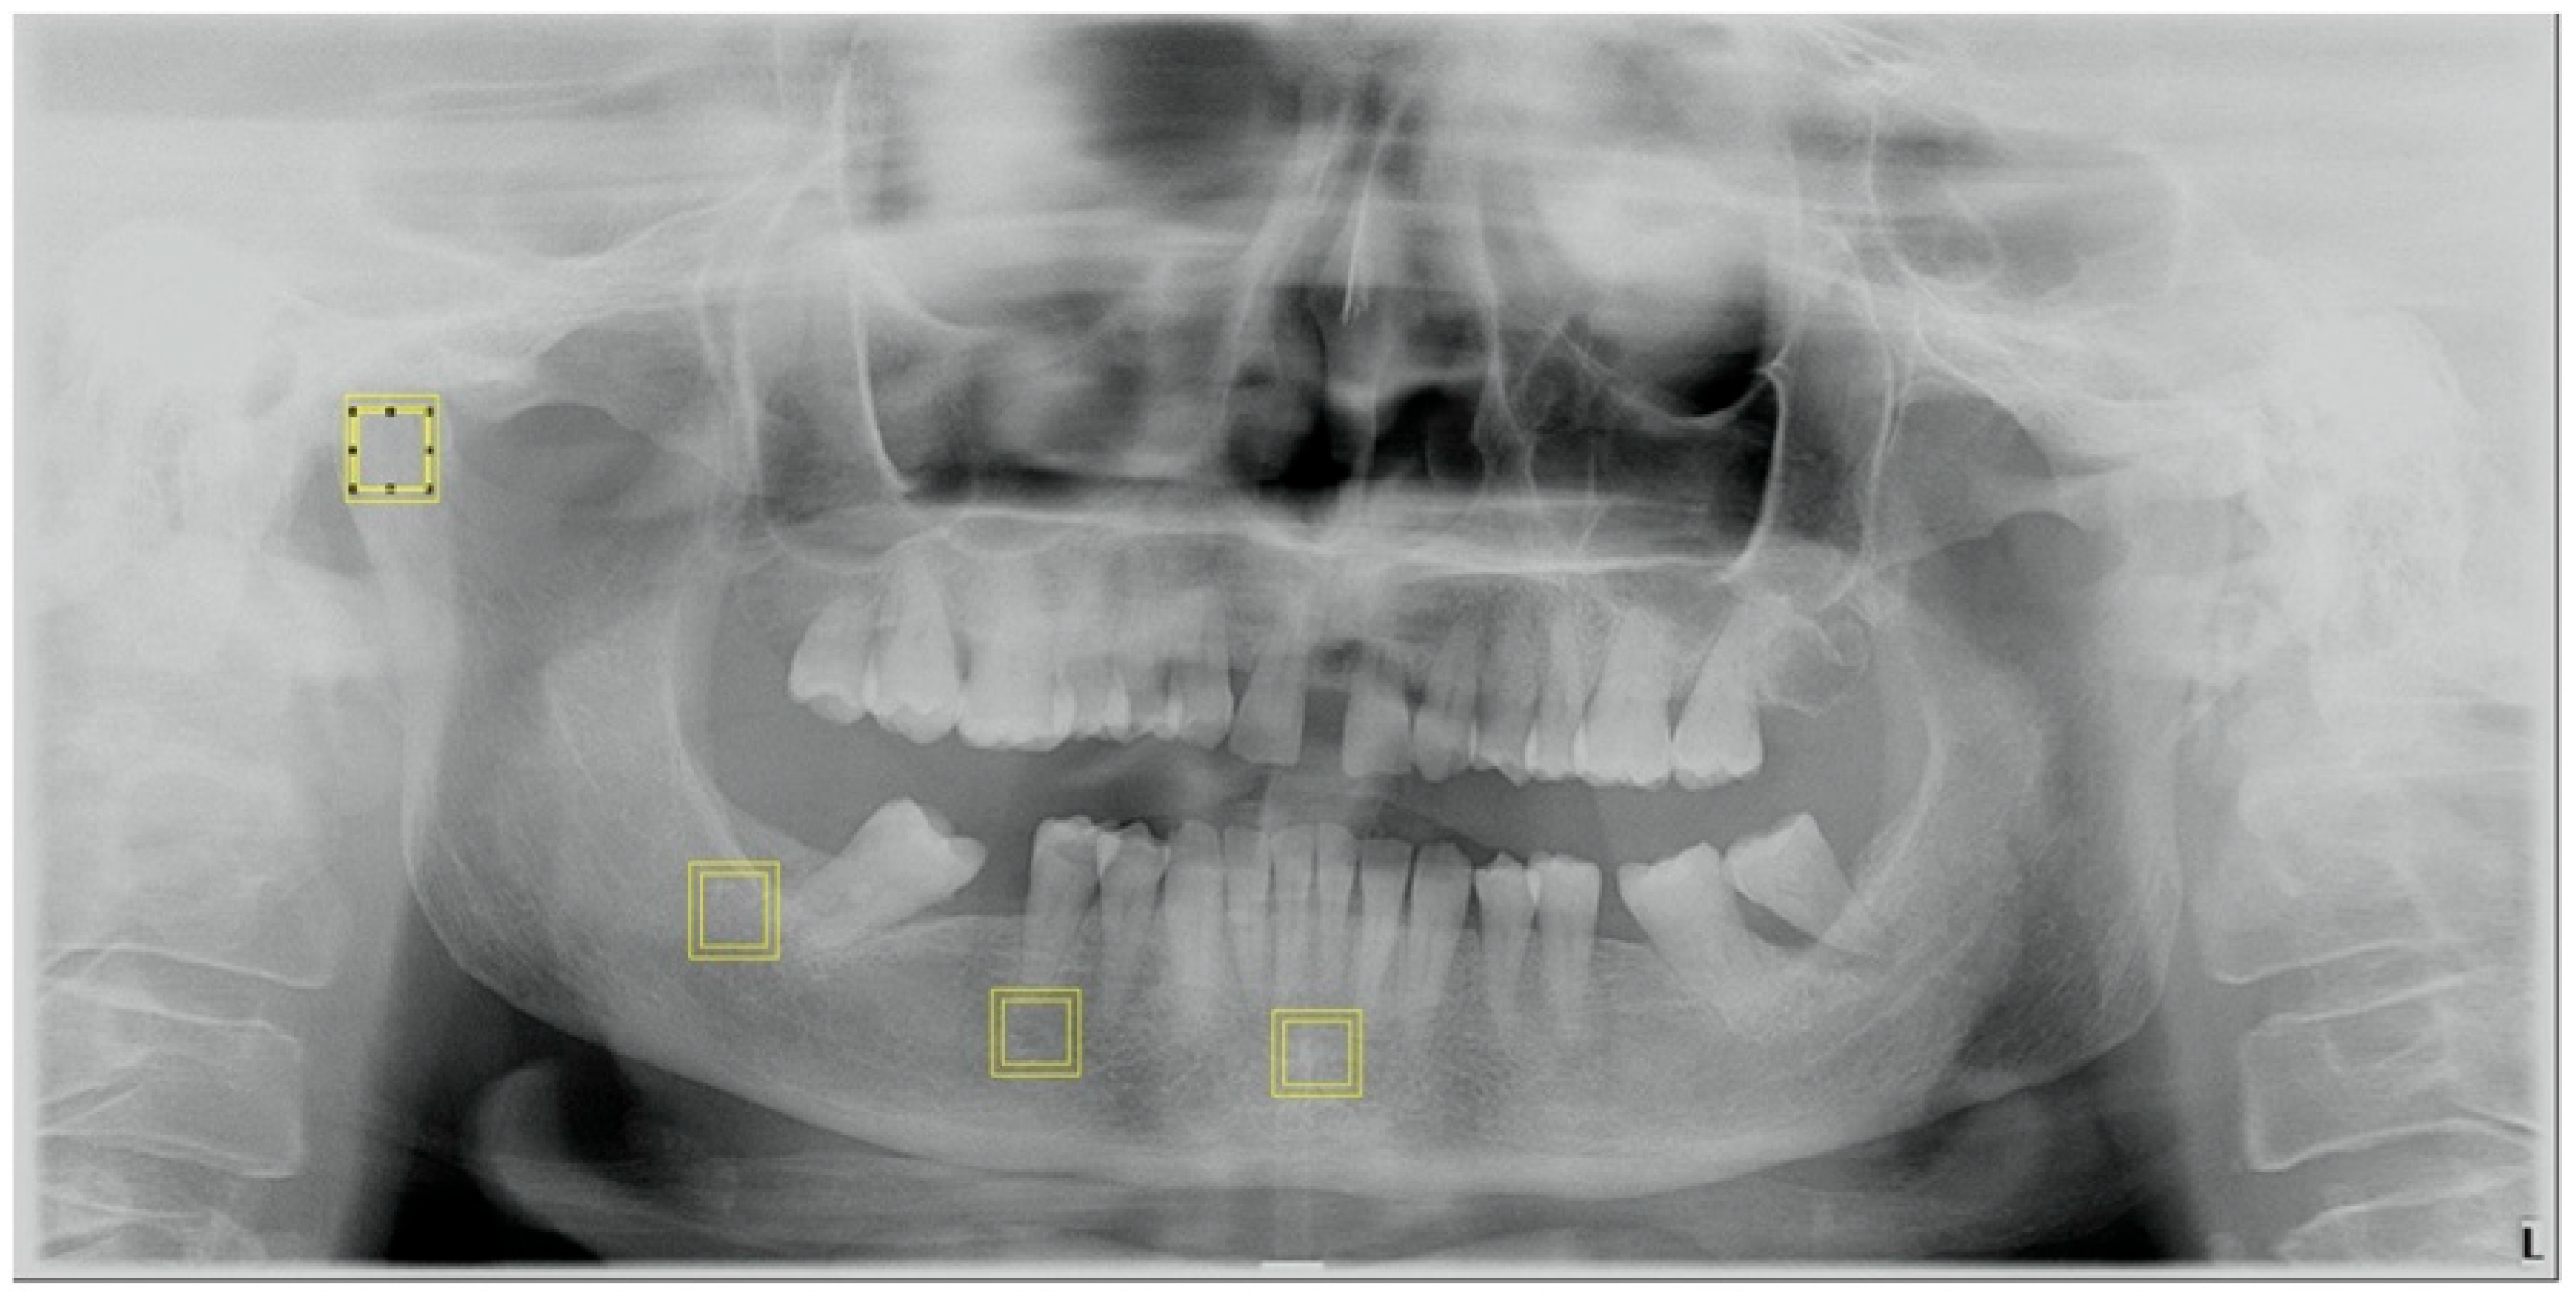
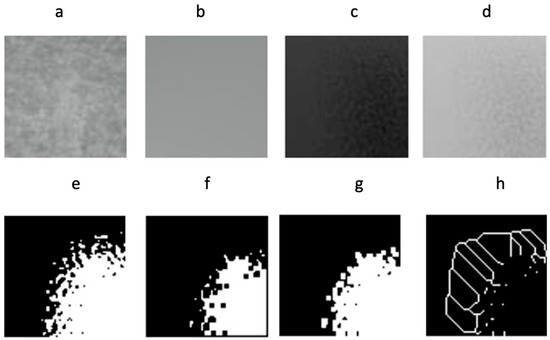
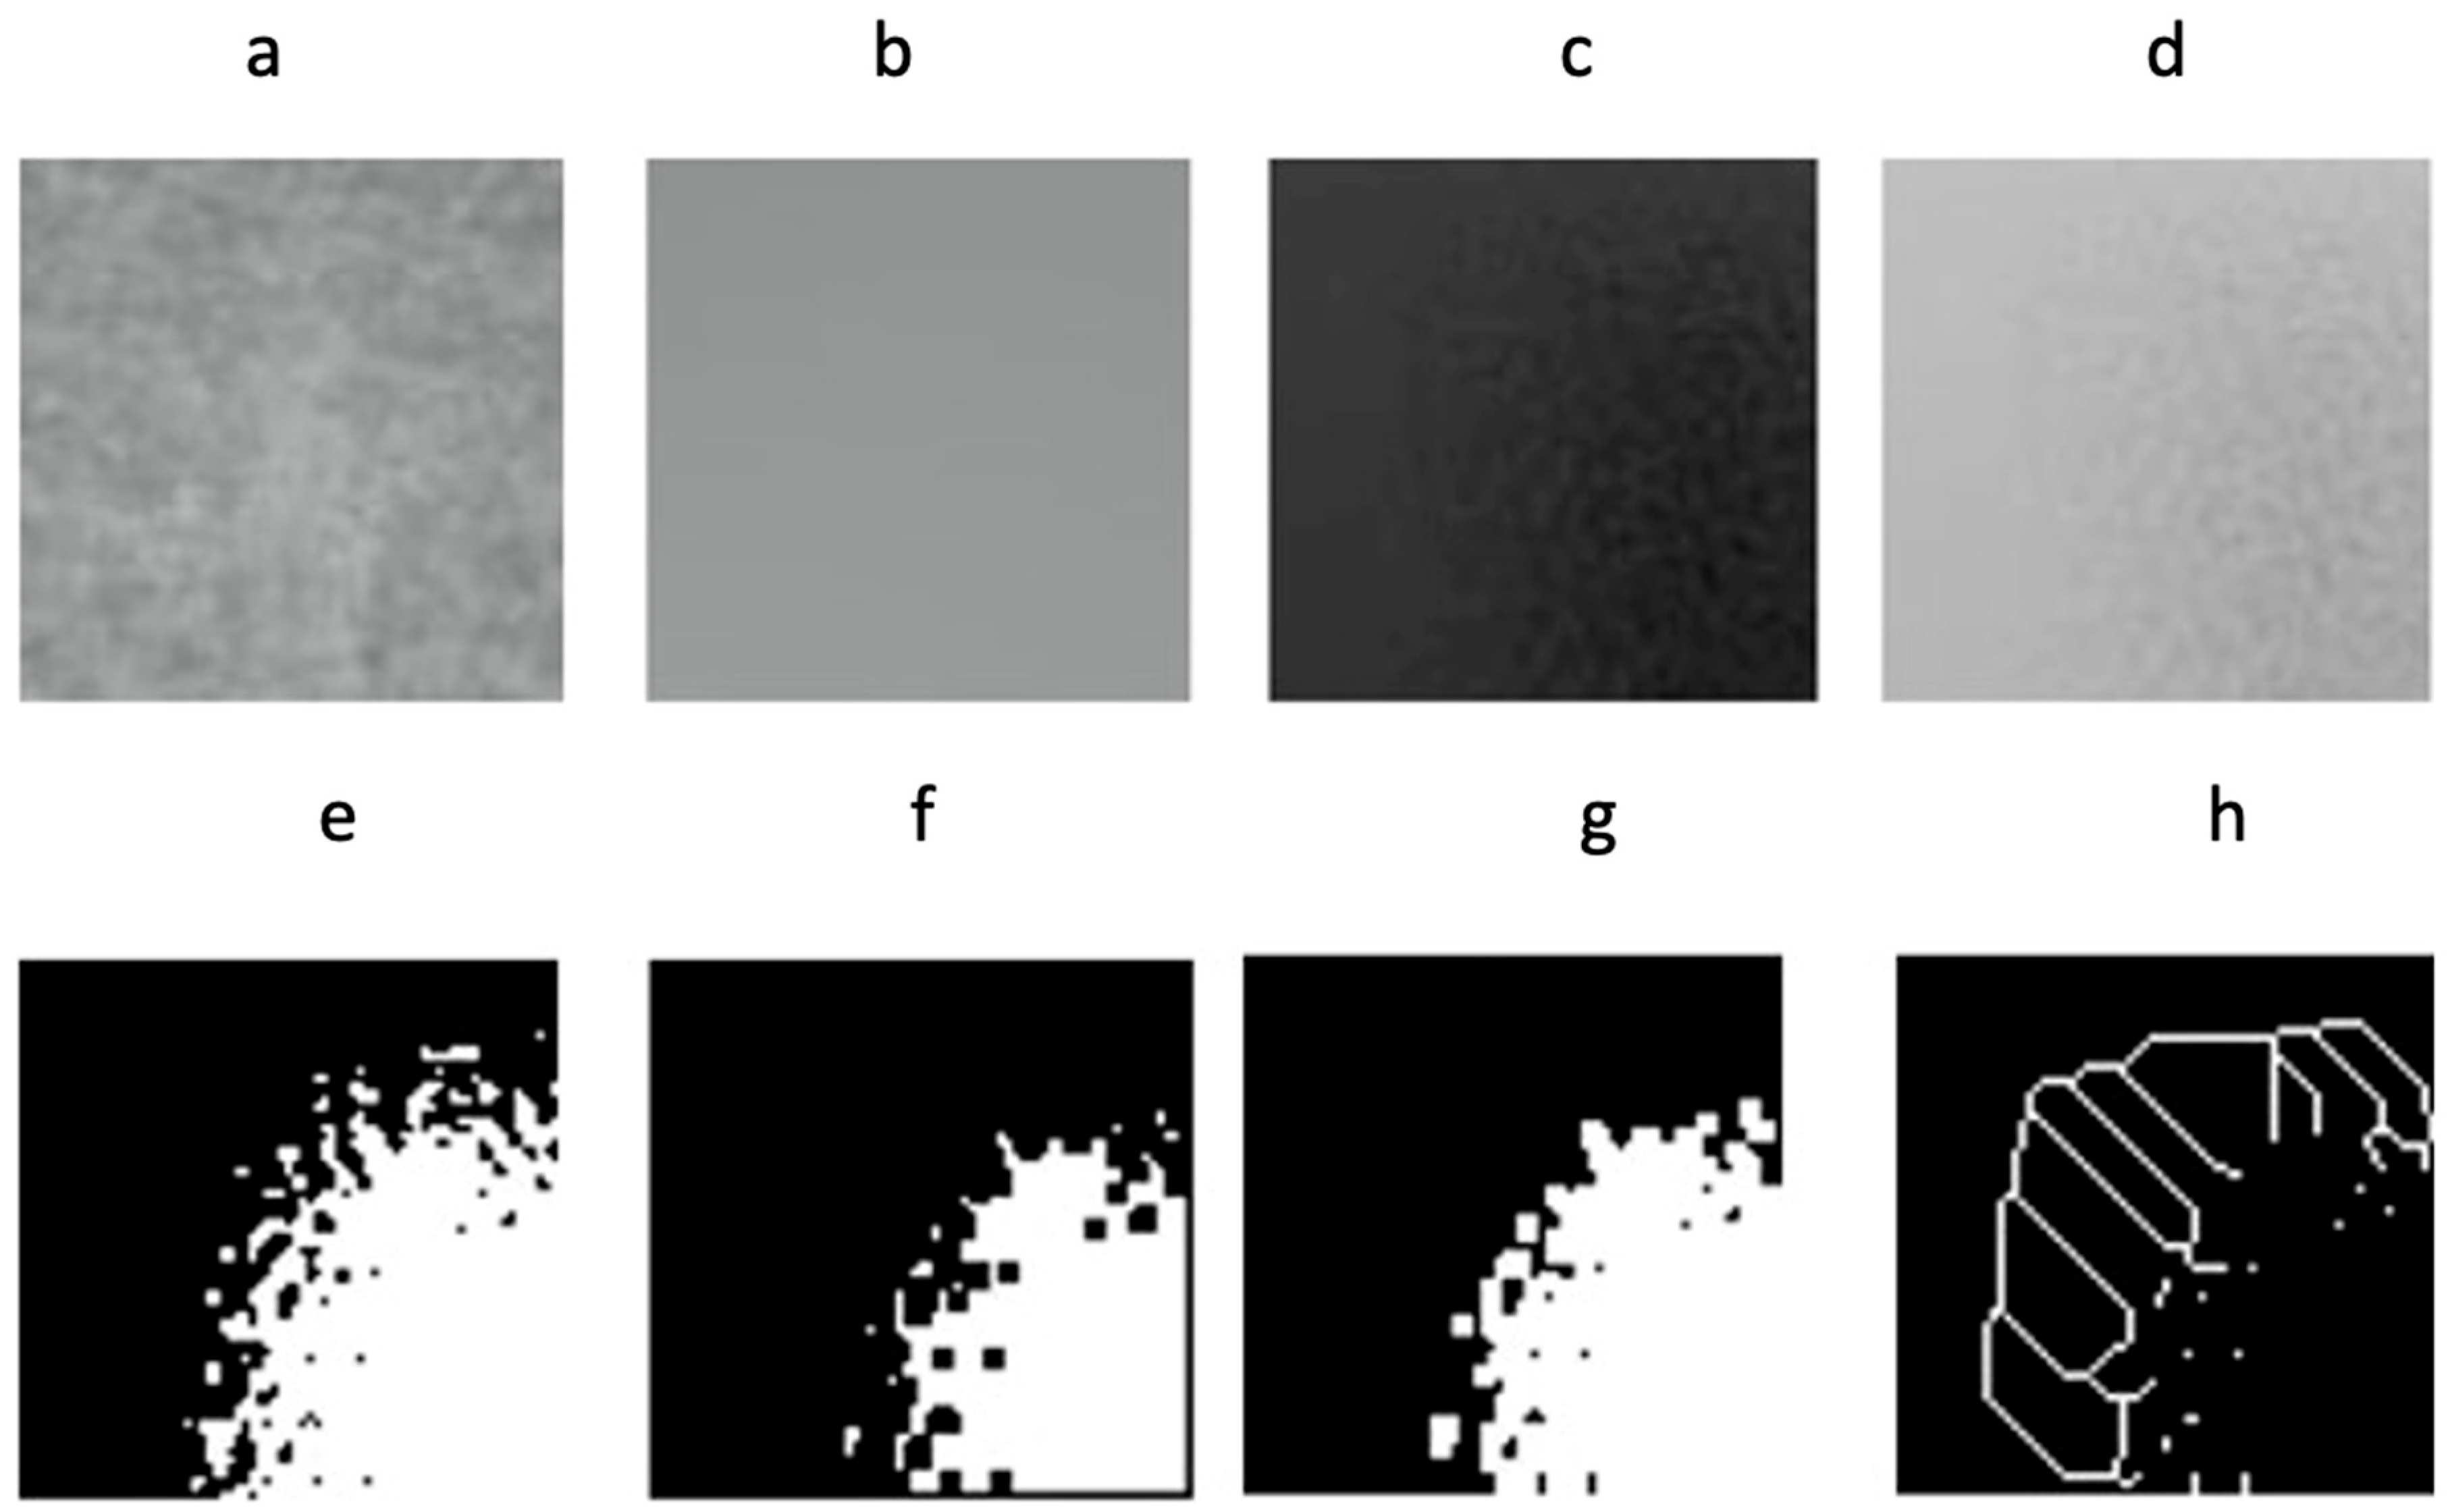
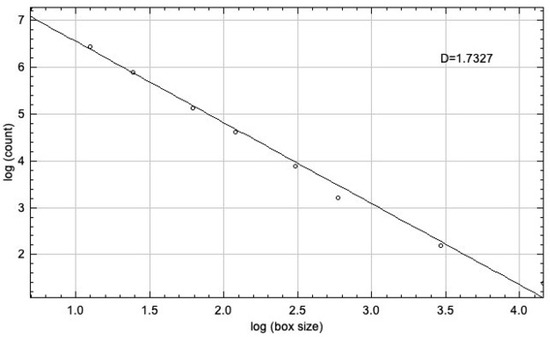
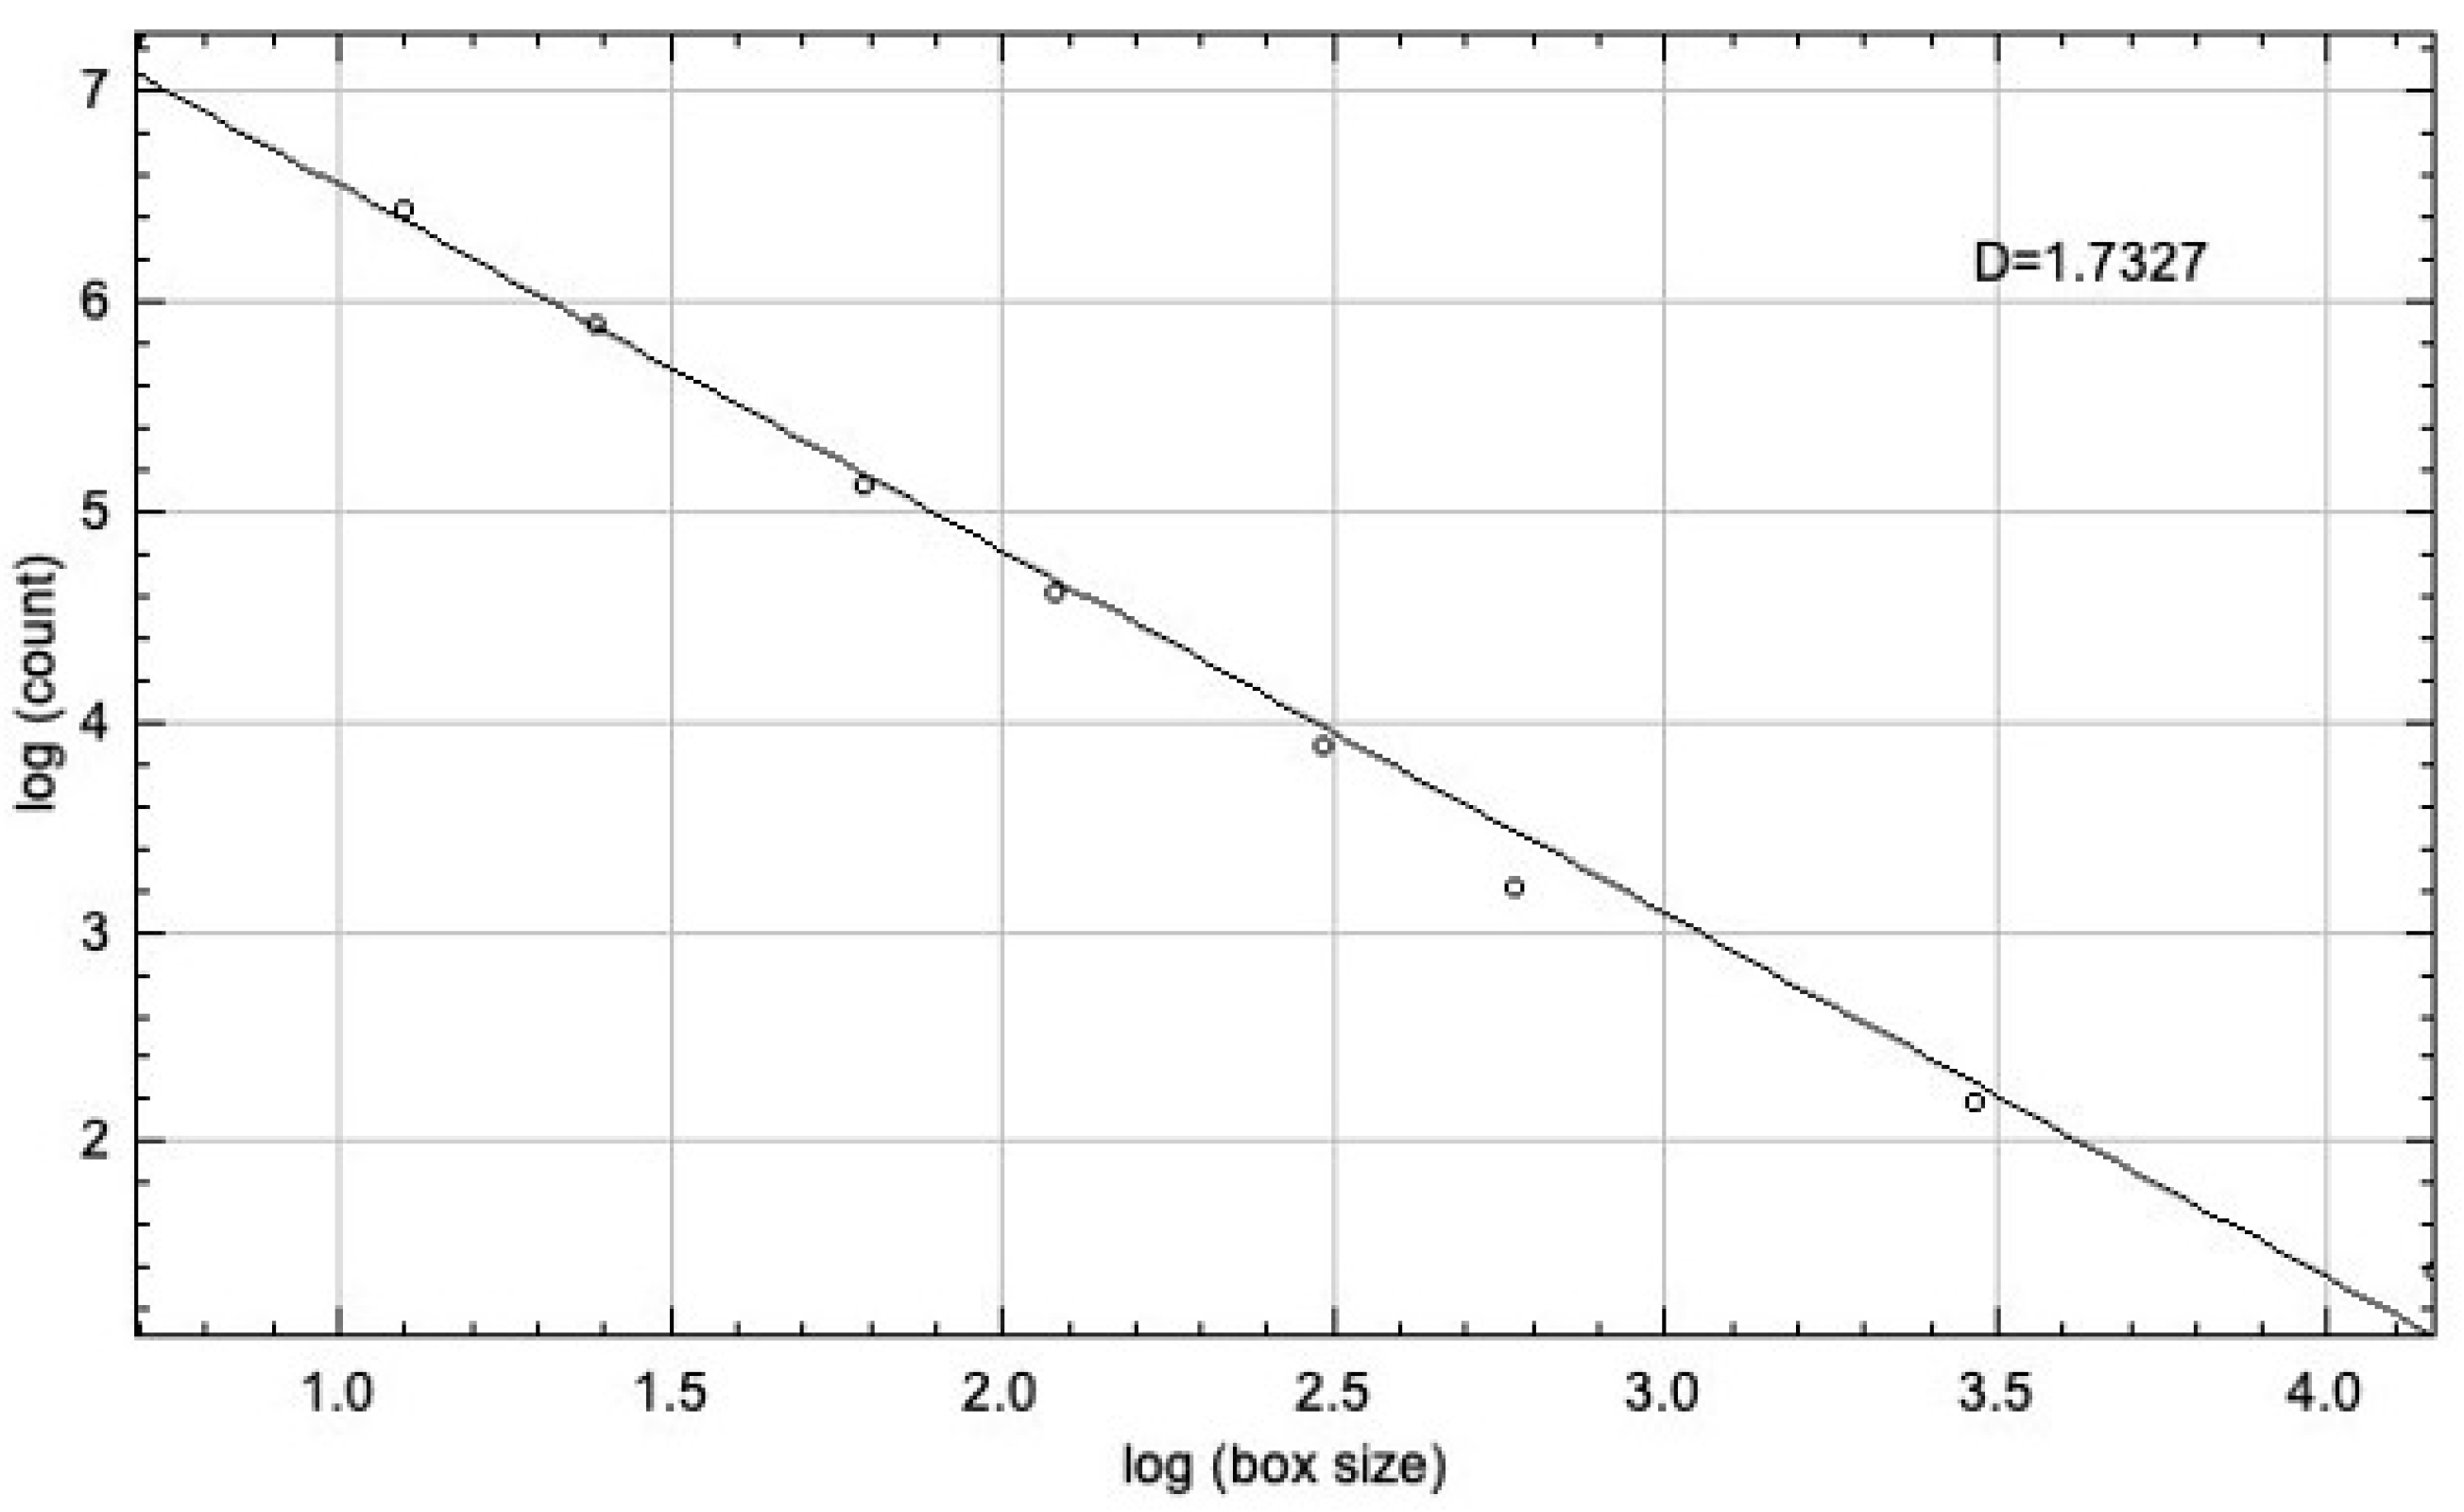
Fractal dimension analysis was performed on four anatomically defined mandibular regions of interest (ROIs): anterior, premolar, molar, and condylar regions. ROIs were selected bilaterally where applicable and standardized in size and shape to reduce geometric variability. Care was taken to avoid areas containing cortical bone, anatomical overlaps, tooth roots, or radiographic artifacts, ensuring that only trabecular bone structures were included in the analysis. FD analysis was conducted by the supervisor who had practice with the widely used free and open-source ImageJ (version 1.53t, National Institutes of Health, Bethesda, MD, USA). ROI selection was made by the same experienced oral and maxillofacial surgeon in the Department of Oral and Maxillofacial Surgery. The four ROIs in square form with 90 × 90 pixels were selected on the anterior, premolar, molar, and condylar regions of the mandible (Figure 1). Every ROI underwent a standardized preprocessing workflow prior to FD calculation as suggested by White and Rudolph [16]. Briefly, the original grayscale image was duplicated (Figure 2a) and subjected to Gaussian blurring to remove large-scale brightness variations (Figure 2b). The blurred image was subtracted from the original to enhance local trabecular patterns (Figure 2c). 128 gray value was applied to each pixel location (Figure 2d). The resulting image was then binarized using a fixed thresholding approach, followed by morphological operations to isolate trabecular structures (Figure 2e). Erosion and dilation were applied sequentially to reduce noise and refine the trabecular pattern (Figure 2f). The image was then inverted (Figure 2g). Skeletonization was applied to reduce the trabecular pattern to a one-pixel-wide representation suitable for fractal analysis (Figure 2h). The box-counting algorithm was then applied by overlaying grids of decreasing box sizes onto the skeletonized image and counting the number of boxes containing part of the structure. The fractal dimension was calculated as the slope of the linear regression line fitted to the log–log plot of box size versus box count, representing the complexity of the trabecular pattern. The fractal dimension (D) was calculated as the slope of the linear regression fitted to the log (box size) versus log (box count) plot generated by the box-counting algorithm. The obtained D values were analyzed statistically (Figure 3). Intra-observer reproducibility was assessed by repeating the fractal dimension analysis by another experienced oral and maxillofacial surgeon on a randomly selected subset of 26 panoramic radiographs (25%) two weeks after the original evaluation.
Figure 1.
Schematic illustration of the four rectangular regions of interest (ROIs; 90 × 90 pixels) selected in the anterior, premolar, molar, and condylar regions of the mandible for fractal dimension analysis.
Figure 2.
Image preprocessing steps for fractal dimension analysis. (a) Original grayscale ROI image. (b) Gaussian-blurred image used to eliminate large-scale brightness variations. (c) Subtraction of the blurred image from the original image to enhance local trabecular patterns. (d) Application of a uniform gray value of 128 to normalize image intensity. (e) Binarization of the image using a fixed thresholding approach to isolate trabecular structures. (f) Morphological operations (erosion followed by dilation) applied for noise removal. (g) Inversion of the processed image. (h) Skeletonized image representing the trabecular pattern as a one-pixel-wide structure for fractal dimension calculation.
Figure 3.
Representative log–log plot obtained from box-counting fractal analysis of a mandibular trabecular region.
2.3. Statistical Analysis
In this study, the conformity of continuous variables to the normality distribution assumption was evaluated by the Kolmogorov–Smirnov test, and homogeneity was evaluated by the Levene test, and the power of the test was statistically calculated using power analysis. Power analysis (G*Power 3.1) for a medium effect size (0.5), α = 0.05, showed Power = 0.72 for n = 53/group, adequate for detecting differences. When examining the change in parameters for different groups, t-test in independent groups and chi-square tests were used to evaluate the frequency of occurrence of variables, considering the parametric test conditions. In statistical analysis tests, 95% confidence interval was applied; descriptive statistics and analyses were performed using R (version 3.2.3, R Foundation for Statistical Computing, Vienna, Austria). In statistical evaluations, results were considered significant for p < 0.05.
3. Results
Comparative analysis revealed no statistically significant differences in fractal dimension values between the T2DM and control groups in any of the evaluated mandibular regions (p > 0.05). The absence of significant intergroup differences was consistent across all regions of interest. Within-group analysis demonstrated regional variation in fractal dimension values in both the T2DM and control groups. Higher FD values were generally observed in the anterior and premolar regions compared to the molar and condylar regions; however, these regional patterns were similar in both groups and did not demonstrate disease-specific differentiation. No statistically significant interaction in terms of D values was observed between the groups in all ROIs (Table 1).
Table 1.
Fractal dimension values obtained from 90 × 90 pixel rectangular regions of interest (ROIs) located in the anterior, premolar, molar, and condylar regions of the mandible on panoramic radiographs.
4. Discussion
The present study evaluated the ability of panoramic radiograph-based fractal dimension analysis to detect mandibular trabecular changes associated with type 2 diabetes mellitus. The absence of statistically significant differences in FD values between diabetic and non-diabetic individuals across all evaluated mandibular regions suggests that two-dimensional panoramic imaging combined with FD analysis may have limited sensitivity for identifying subtle, disease-related trabecular alterations [17]. From a fractal analysis perspective, the detectability of structural differences depends not only on biological variation but also on image dimensionality and spatial resolution [18,19]. Mandibular trabecular bone is a three-dimensional structure characterized by complex branching patterns and heterogeneous spatial organization. When projected onto a two-dimensional panoramic image, a substantial amount of structural information is inevitably lost due to superimposition, projection geometry, and variable magnification. This dimensional reduction may obscure fine-scale trabecular differences that could otherwise be detectable using three-dimensional imaging modalities [17]. The selection of four regions of interest (ROIs)—anterior, premolar, molar, and condyle—was based on their clinical relevance in oral surgery and prior fractal analysis studies [6,19,20]. Although multiple ROIs were evaluated, no formal multiple comparison correction was applied. Given the absence of statistically significant findings, the application of conservative adjustments such as the Holm–Bonferroni method would not have changed the study conclusions; however, this remains a methodological consideration for future studies. However, manual ROI placement introduces inherent subjectivity, as slight variations in positioning can influence FD values due to local trabecular heterogeneity. We applied our inclusion criteria and repeated measurements to eliminate this flaw in the method. The selection of ROI size represents an important methodological consideration in fractal analysis. In the present study, a fixed 90 × 90 pixel ROI was used to balance trabecular detail capture with reproducible placement on panoramic radiographs. However, fractal dimension values are known to exhibit scale dependency, and different ROI dimensions may yield varying results. In the present study, mean FD values were slightly higher in the T2DM group across all regions (anterior: 1.800 vs. 1.795; premolar: 1.810 vs. 1.791; molar: 1.798 vs. 1.787; condyle: 1.795 vs. 1.784), though these differences did not reach statistical significance (p > 0.05). This trend aligns with prior reports suggesting that T2DM patients may exhibit denser trabecular patterns due to obesity-related mechanical loading and hyperinsulinemia, which stimulate osteoblast activity and increase bone formation despite impaired quality [12,13]. Although no statistically significant differences were observed, fractal dimension values tended to be higher in patients with type 2 diabetes mellitus compared to controls. This directional increase is consistent with previous studies reporting elevated fractal dimension values in diabetic populations, including those observed in T1DM [21]. Such findings suggest that diabetes-related metabolic alterations may influence trabecular bone organization toward increased structural complexity. The absence of statistical significance in the present study may be attributed to the inherent limitations of two-dimensional panoramic imaging, heterogeneity in T2DM pathophysiology, and the lack of detailed clinical stratification [17]. Nevertheless, the observed trend supports the notion that fractal analysis may capture subtle diabetes-related trabecular changes, even when these changes do not reach statistical significance under constrained methodological conditions. The box-counting method used in this study quantifies the global complexity of a structure across multiple scales; however, it is inherently insensitive to localized microstructural changes when applied to two-dimensional projections. In the context of panoramic radiographs, regional trabecular heterogeneity and overlapping anatomical structures may further reduce the discriminatory power of FD measurements. Additionally, image resolution and compression have been shown to influence fractal measurements, as demonstrated by Toghyani et al. [18]. Although standardized acquisition parameters were used to reduce inter-image variability, the potential confounding effects of ROI scale and image resolution cannot be fully excluded. While the present study employed a single fractal dimension derived from box-counting, this approach provides a global measure of structural complexity and may not fully capture local heterogeneity within trabecular bone. Multifractal analysis has the potential to describe spatial variations in scaling behavior and may therefore offer greater sensitivity to subtle, disease-related microarchitectural changes [22]. Future studies integrating multifractal metrics, particularly when applied to three-dimensional imaging data, may help reveal diabetes-related trabecular alterations that remain undetected using single-value fractal descriptors. Regional variations in FD values were observed within both study groups, with higher complexity generally noted in the anterior and premolar regions of the mandible. In line with previous radiographic studies evaluating trabecular complexity, the present findings support the notion that systemic metabolic alterations may influence mandibular bone microarchitecture. While some studies have reported significant changes in fractal dimension values [21,23], others have demonstrated subtle or non-significant differences [6], emphasizing the impact of disease type, duration, and imaging methodology. These findings are consistent with previous studies reporting site-specific differences in mandibular trabecular architecture related to functional loading and anatomical characteristics [13,21]. In the present study, no statistically significant differences in fractal dimension were observed in the condylar regions between groups, despite the analysis being restricted to trabecular bone. This finding may be attributed to the distinct biomechanical environment of the mandibular condyle, which is subject to continuous functional loading and adaptive remodeling [21]. Previous experimental and clinical studies have demonstrated that mechanical loading plays a critical role in maintaining cancellous bone density, stiffness, and structural integrity in the condylar region, whereas reduced mechanical stimulation is associated with trabecular deterioration [24]. Conversely, sustained masticatory forces may promote local bone formation and preserve trabecular organization, potentially attenuating the impact of systemic metabolic disturbances. The alveolar and basal trabecular bone in these regions is more closely linked to systemic bone metabolism and may therefore be more vulnerable to diabetes-related alterations, such as impaired bone turnover, microvascular compromise, and changes in collagen quality. Consequently, subtle alterations in trabecular organization may be more readily detectable in these regions using fractal analysis, even when differences do not reach statistical significance. This regional variability highlights the importance of anatomical site selection when interpreting radiographic fractal dimension measurements in systemic metabolic diseases [5,21,25]. The findings of this study have important implications for the application of fractal analysis in dental and medical imaging. While FD remains a valuable quantitative descriptor of structural complexity, its application to two-dimensional panoramic radiographs should be approached with caution when the objective is to detect subtle systemic bone changes. The results suggest that panoramic FD analysis may be more suitable for assessing gross structural differences or localized conditions rather than for evaluating systemic metabolic effects on bone microarchitecture [5,26,27]. Several limitations should be acknowledged for this study. The retrospective design and reliance on two-dimensional imaging inherently restrict the level of structural detail available for analysis. Detailed glycemic control data, including HbA1c levels, were not available due to the retrospective design and reliance on routine dental records. Compared to gold-standard methods, FD on panoramic radiographs offers a non-invasive, low-cost screening tool but lacks the 3D precision of cone-beam computed tomography (CBCT) or the systemic accuracy of dual-energy X-ray absorptiometry (DEXA) [28]. Additionally, fractal dimension provides a single global measure of complexity and does not capture directional or anisotropic properties of trabecular bone. Future studies incorporating three-dimensional imaging modalities, such as cone-beam computed tomography, and advanced fractal or multifractal approaches may offer improved sensitivity for detecting diabetes-related trabecular changes.
5. Conclusions
The findings of this study indicate that fractal dimension analysis applied to two-dimensional panoramic radiographs has limited sensitivity for detecting mandibular trabecular changes associated with type 2 diabetes mellitus. This limitation appears to be primarily related to image dimensionality, projection effects, and regional trabecular heterogeneity rather than the absence of underlying biological alterations. While fractal analysis remains a valuable quantitative tool, its application to panoramic radiographs should be interpreted cautiously when used for assessing systemic bone conditions. These results highlight the importance of aligning fractal analysis methods with appropriate imaging modalities when evaluating subtle structural changes.
Author Contributions
Conceptualization, N.L. and O.T.; methodology, N.L.; software, O.T.; validation, N.L., O.T. and F.C.; formal analysis, O.T.; investigation, F.C.; resources, N.L.; data curation, O.T.; writing—original draft preparation, O.T.; writing—review and editing, O.T.; visualization, O.T.; supervision, N.L. All authors have read and agreed to the published version of the manuscript.
Funding
This research received no external funding.
Data Availability Statement
The datasets used and/or analyzed during the current study are available from the corresponding author on reasonable request.
Acknowledgments
The authors thank the Department of Oral and Maxillofacial Radiology for facilitating access to anonymized radiographic records.
Conflicts of Interest
The authors declare no conflicts of interest.
Abbreviations
The following abbreviations are used in this manuscript:
| FD | Fractal Dimension |
| T2DM | Type 2 Diabetes Mellitus |
| T1DM | Type 1 Diabetes Mellitus |
References
- Sparrow, C.; Mandelbrot, B. The Fractal Geometry of Nature. J. R. Stat. Soc. Ser. A 1984, 147, 616–618. [Google Scholar] [CrossRef] [Scilit]
- Song, J.; Wang, B.; Jiang, Q.; Hao, X. Exploring the Role of Fractal Geometry in Engineering Image Processing Based on Similarity and Symmetry: A Review. Symmetry 2024, 16, 1658. [Google Scholar] [CrossRef] [Scilit]
- Chandrasekharan, S.; Jacob, J.E.; Cherian, A.; Iype, T. Exploring Recurrence Quantification Analysis and Fractal Dimension Algorithms for Diagnosis of Encephalopathy. Cogn. Neurodyn. 2024, 18, 133–146. [Google Scholar] [CrossRef] [Scilit]
- Jurczyszyn, K.; Kazubowska, K.; Kubasiewicz-Ross, P.; Ziółkowski, P.; Dominiak, M. Application of Fractal Dimension Analysis and Photodynamic Diagnosis in the Case of Differentiation between Lichen Planus and Leukoplakia: A Preliminary Study. Adv. Clin. Exp. Med. 2018, 27, 1729–1736. [Google Scholar] [CrossRef] [Scilit]
- Azhari; Epsilawati, L.; Wulansari, D.P.; Amiria Asykarie, I.N. Fractal Dimension Approach for Quantitative Analysis Radiograph in Periapical Inflammation: A Systematic Review. Acta Med. Philipp. 2025, 59, 125–130. [Google Scholar]
- Kurşun-Çakmak, E.Ş.; Bayrak, S. Comparison of Fractal Dimension Analysis and Panoramic-Based Radiomorphometric Indices in the Assessment of Mandibular Bone Changes in Patients with Type 1 and Type 2 Diabetes Mellitus. Oral Surg. Oral Med. Oral Pathol. Oral Radiol. 2018, 126, 184–191. [Google Scholar] [CrossRef] [Scilit]
- Meng, X.; Liu, S.; Wu, Z.; Guo, L. Application of Panoramic Radiographs in the Diagnosis of Temporomandibular Disorders. Medicine 2024, 103, e36469. [Google Scholar] [CrossRef] [Scilit]
- Palma, L.F.; Tateno, R.Y.; Remondes, C.M.; Marcucci, M.; Cortes, A.R.G. Impact of Radiotherapy on Mandibular Bone: A Retrospective Study of Digital Panoramic Radiographs. Imaging Sci. Dent. 2020, 50, 31–36. [Google Scholar] [CrossRef] [Scilit]
- Elhanashi, A.; Lowe, D.; Saponara, S.; Moshfeghi, Y. Deep Learning Techniques to Identify and Classify COVID-19 Abnormalities on Chest X-Ray Images. In Proceedings of the Real-Time Image Processing and Deep Learning 2022, Orlando, FL, USA, 27 May 2022. [Google Scholar]
- Yameny, A.A. Diabetes Mellitus Overview 2024. J. Biosci. Appl. Res. 2024, 10, 641–645. [Google Scholar] [CrossRef] [Scilit]
- Isaia, G.; Bodrato, L.; Carlevatto, V.; Mussetta, M.; Salamano, G.; Molinatti, G.M. Osteoporosis in Type II Diabetes. Acta Diabetol. Lat. 1987, 24, 305–310. [Google Scholar] [CrossRef] [Scilit] [PubMed]
- Schwartz, A.V. Diabetes Mellitus: Does It Affect Bone? Calcif. Tissue Int. 2003, 73, 515–519. [Google Scholar] [CrossRef] [Scilit] [PubMed]
- Dedeoğlu, N.; Eşer, G.; Çelik Özen, D.; Altun, O. Five-Year Change of Panoramic Radiomorphometric Indices and Fractal Dimension Values in Type 2 Diabetes Patients. Oral Radiol. 2024, 40, 49–57. [Google Scholar] [CrossRef] [Scilit]
- Prado, H.V.; Debossan, S.A.T.; Loayza, K.S.; Abreu, L.G.; Brasileiro, C.B.; Borges-Oliveira, A.C. Radiomorphometric Indices and Fractal Dimension of the Mandible in Individuals with Osteogenesis Imperfecta: A Matched Cross-Sectional Study. Oral Surg. Oral Med. Oral Pathol. Oral Radiol. 2023, 136, 102–111. [Google Scholar] [CrossRef] [Scilit]
- de Oliveira Loures, A.; de Abreu, M.; Devito, K.L.; Grisolia-Seifert, E.F.; Jähn-Rickert, K.; Rabelo, G.D. Fractal Analysis of the Mandible Cortical Bone: Correlation among Fractal Dimension Values Obtained by Two Processing Methods from Periapical Radiograph and Micro-Computed Tomography with Cone-Beam Computed Tomography. Radiat. Environ. Biophys. 2023, 62, 511–518. [Google Scholar] [CrossRef] [Scilit]
- White, S.C.; Rudolph, D.J. Alterations of the Trabecular Pattern of the Jaws in Patients with Osteoporosis. Oral Surg. Oral Med. Oral Pathol. Oral Radiol. Endod. 1999, 88, 628–635. [Google Scholar] [CrossRef] [Scilit]
- Yavuz, E.; Yardimci, S. Comparison of Periapical Radiography, Panoramic Radiography, and CBCT in the Evaluation of Trabecular Bone Structure Using Fractal Analysis. Oral Radiol. 2024, 40, 394–400. [Google Scholar] [CrossRef] [Scilit]
- Toghyani, S.; Nasseh, I.; Aoun, G.; Noujeim, M. Effect of Image Resolution and Compression on Fractal Analysis of the Periapical Bone. Acta Inform. Med. 2019, 27, 167–170. [Google Scholar] [CrossRef] [Scilit]
- Zhang, X.; Guo, E.; Liu, X.; Zhao, H.; Yang, J.; Li, W.; Wu, W.; Sun, W. Enhancing Furcation Involvement Classification on Panoramic Radiographs with Vision Transformers. BMC Oral Health 2025, 25, 153. [Google Scholar] [CrossRef] [Scilit]
- Demiralp, K.Ö.; Kurşun-Çakmak, E.Ş.; Bayrak, S.; Akbulut, N.; Atakan, C.; Orhan, K. Trabecular Structure Designation Using Fractal Analysis Technique on Panoramic Radiographs of Patients with Bisphosphonate Intake: A Preliminary Study. Oral Radiol. 2019, 35, 23–28. [Google Scholar] [CrossRef] [Scilit] [PubMed]
- Tassoker, M.; Balel, Y.; Erturk, M.; Sagtas, K. Automated Fractal Analysis for Mandibular Bone Evaluation in Type 1 Diabetes Mellitus Using a Novel Single Click Approach. Sci. Rep. 2025, 15, 30266. [Google Scholar] [CrossRef] [Scilit] [PubMed]
- Borowska, M.; Bębas, E.; Szarmach, J.; Oczeretko, E. Multifractal Characterization of Healing Process after Bone Loss. Biomed. Signal Process. Control 2019, 52, 179–186. [Google Scholar] [CrossRef] [Scilit]
- Celebi, E.; Gormez, O.; Dogru, A.; Aydogan, T.; Orhan, H. Fractal Analysis of Jawbone Structure in Patients with Rheumatoid Arthritis. Imaging Sci. Dent. 2024, 54, 345–353. [Google Scholar] [CrossRef] [Scilit]
- Giesen, E.B.W.; Ding, M.; Dalstra, M.; Van Eijden, T.M.G.J. Reduced Mechanical Load Decreases the Density, Stiffness, and Strength of Cancellous Bone of the Mandibular Condyle. Clin. Biomech. 2003, 18, 358–363. [Google Scholar] [CrossRef] [Scilit] [PubMed]
- Ruttimann, U.E.; Webber, R.L.; Hazelrig, J.B. Fractal dimension from radiographs of peridental alveolar bone. A possible diagnostic indicator of osteoporosis. Oral Surg. Oral Med. Oral Pathol. 1992, 74, 98–110. [Google Scholar] [CrossRef] [Scilit] [PubMed]
- Kaba, Y.N.; Öner, N.İ.; Amuk, M.; Bilge, S.; Soylu, E.; Demirbaş, A.E. Evaluation of Trabecular Bone Healing Using Fractal Dimension Analysis after Augmentation of Alveolar Crests with Autogenous Bone Grafts: A Preliminary Study. Oral Radiol. 2022, 38, 139–146. [Google Scholar] [CrossRef] [Scilit] [PubMed]
- Çolak, S.; Altan, A.; Bayrak, S.; Akbulut, N. Evaluation of Bony Changes Observed in Mandibular Osteotomy Lines and Mandibular Condyles Following Bilateral Sagittal Ramus Osteotomy by Fractal Analysis. Oral Maxillofac. Surg. 2023, 27, 519–526. [Google Scholar] [CrossRef] [Scilit]
- Ahmad, A.; Crawford, C.H.; Glassman, S.D.; Dimar, J.R.; Gum, J.L.; Carreon, L.Y. Correlation between Bone Density Measurements on CT or MRI versus DEXA Scan: A Systematic Review. N. Am. Spine Soc. J. 2023, 14, 100204. [Google Scholar] [CrossRef] [Scilit]

Disclaimer/Publisher’s Note: The statements, opinions and data contained in all publications are solely those of the individual author(s) and contributor(s) and not of MDPI and/or the editor(s). MDPI and/or the editor(s) disclaim responsibility for any injury to people or property resulting from any ideas, methods, instructions or products referred to in the content. |
© 2026 by the authors. Licensee MDPI, Basel, Switzerland. This article is an open access article distributed under the terms and conditions of the Creative Commons Attribution (CC BY) license.