


Abstract
Attention Deficit Hyperactivity Disorder (ADHD) diagnosis is often challenging due to subjective assessments and symptom variability, which can delay accurate detection and treatment. To address these limitations, this study introduces DETEC-ADHD, a web-based application that combines machine learning (ML) techniques with multi-source data to enhance diagnostic accuracy. Unlike traditional approaches, DETEC-ADHD primarily utilizes extensive personal, medical, and psychological information for its initial classification. DETEC-ADHD further refines diagnoses by identifying ADHD subtypes (inattentive, hyperactive, combined) through theta/beta wave ratio analysis from EEG data, offering neurophysiological insights that complement its classification process. Logistic Regression, selected for its validated accuracy and reliability, served as the ML model for the app. The case studies demonstrated DETEC-ADHD’s effectiveness, achieving 100% accuracy in children and 90% in adults. By integrating diverse data sources with real-time EEG analysis, DETEC-ADHD provides a scalable, cost-effective, and accessible solution for ADHD detection and subtype identification, addressing diagnostic challenges and supporting healthcare providers, particularly in resource-limited environments.
1. Introduction
In recent years, the number of children diagnosed with Attention Deficit Hyperactivity Disorder (ADHD) has shown a notable increase. Although ADHD has been studied for many years [1], current techniques such as clinical interviews and psychometric assessments are not sufficient for an accurate diagnosis. Subjectivity in evaluations, the non-specific nature of symptoms, comorbidities, and environmental factors complicate the diagnosis. In addition, access to a complete diagnosis is difficult due to the time and cost involved. Since detecting ADHD remains a challenge, it prevents individuals who are unaware of their condition from receiving the appropriate treatment, which can result in obstacles across various aspects of their lives, including social interactions, academic performance, and work productivity.
According to the World Health Organization (WHO), approximately 8.8% of the world’s population suffers from ADHD [2]. It is estimated that between 2 and 12% of the child population and between 2.5 and 5% of adults suffer from this disorder [3]. About half of children with ADHD continue to have symptoms into adulthood, reflected in emotional and interpersonal problems [3]. Early diagnosis and appropriate treatment can reduce the risks involved, such as child abuse, school rejection, social isolation, and substance abuse during adolescence [4].
The exact cause of ADHD is not yet fully understood. Factors such as a family history of ADHD, the use of unhealthy substances during gestation, or a deficiency in birth weight [5] are the most associated factors with ADHD. Advanced neuroimaging techniques, including Quantitative Electroencephalography (QEEG), Magnetoencephalography (MEG), and functional MRI (fMRI), have been explored for ADHD diagnosis due to their ability to detect specific neurophysiological markers associated with the disorder. For example, EEG-based methods have identified abnormal theta and beta wave patterns linked to attention and impulse control mechanisms [6]. Techniques such as entropy measures and frequency analysis have further refined the classification of ADHD subtypes and their distinct neural signatures, achieving high diagnostic accuracy [7]. However, neuroimaging methods like fMRI remain costly and resource-intensive, limiting their practicality for real-time or scalable use. In contrast, Electroencephalography (EEG) offers a cost-effective, portable, and non-invasive alternative that is particularly suited for resource-limited environments. EEG data combined with advanced ML algorithms have demonstrated the capability to distinguish ADHD subtypes, such as inattentive, hyperactive, and combined presentations, with high accuracy [8].
Despite the promise of EEG, traditional analysis techniques are limited by the dependence on manual interpretation, which can be subjective and inefficient. Integrating EEG with ML has resolved many of these limitations by automating the detection and analysis of ADHD-related patterns. For instance, entropy-based techniques and convolutional neural networks have achieved classification accuracies exceeding 96% [9]. Recent advancements also include interpretable ML models, which not only classify ADHD subtypes but also provide insights into the underlying neurophysiological markers of the disorder. For example, researchers have demonstrated the importance of integrating spatial and temporal EEG features to improve diagnostic accuracy and make these tools more applicable in clinical settings [10]. Additionally, recent developments in knowledge distillation techniques, such as those proposed by Jia et al. [11], have shown that transferring knowledge from large, complex models to smaller, resource-efficient models can maintain high diagnostic accuracy while enabling deployment in portable devices. These methods effectively utilize multi-level knowledge from sleep EEG signals, addressing challenges in scale differences and heterogeneous model compatibility. Furthermore, ML approaches have identified predictive biomarkers in specific brain regions, such as the frontal and central lobes, significantly enhancing diagnostic precision [12]. While these models have achieved high accuracies, integrating interpretability frameworks ensures that the decision-making process aligns with neurophysiological findings. Such advancements not only increase diagnostic reliability but also enhance clinical trust in ML-driven solutions.
Therefore, this manuscript presents DETEC-ADHD, a web-based application developed to support ADHD detection by integrating ML techniques with the real-time processing of personal, medical, and psychological data while incorporating EEG data specifically for subtype classification. Unlike offline approaches, which are often limited to controlled research settings, DETEC-ADHD operates as a web-based platform, enabling immediate data analysis and providing timely diagnostic insights. The contributions of this study include the following: (1) developing a diagnostic framework that integrates multiple data sources, where ML is applied to personal, medical, and psychological data, and EEG biomarkers are used to refine subtype identification; (2) implementing a real-time ML pipeline validated for reliability, with Logistic Regression achieving 90% accuracy in classification tasks. These features aim to address limitations in traditional ADHD detection methods and provide a practical tool for broader healthcare applications.
The remainder of this research is structured as follows: Section 2 discusses state-of-the-art work on ADHD, ML, and neurofeedback. Section 3 presents our proposed workflow for ADHD detection using the DETEC-ADHD web app. Section 4 presents the architecture of the web app. Section 5 details the Artificial Intelligence (AI) techniques employed and the datasets used to test and train the ML model in the web app. Section 6 introduces the case study where DETEC-ADHD is used for ADHD detection in children and adults. Section 7 presents the results from the case studies. Finally, Section 8 and Section 9 document our discussions and concluding remarks, respectively.
2. Related Work
2.1. ML Works
Bo Miao et al. [13] addressed the need for an accurate method to detect ADHD in children and adolescents. Using the Fractional Amplitude Altered Low-Frequency Fluctuation (FALFF), Relief algorithm, and Support Vector Machine (SVM), they achieved a classification of ADHD patients with a maximum accuracy of 98.04% based on neuroimaging data and ML. On the other hand, Bautista et al. [14] developed an app that uses the extension of the Dynamic Time Warping (DTW) method and classifiers such as GMM and APE to recognize ADHD behavioral patterns through gestures. The use of a Kinect© device significantly improved the accuracy of their approach compared to pure DTW techniques. Itani et al. [15] addressed the challenge of working with large heterogeneous datasets in the automatic detection of ADHD. Using white-box models, such as Decision Trees, they were able to detect disorders and classify the type of disorder in case of a positive diagnosis, providing transparent explanations on decision-making.
Khanna et al. [16] highlighted the importance of accessibility to ADHD diagnoses, especially in developing countries. The authors introduced pupil size dynamics as a promising biomarker and proposed a method based on automatic learning to analyze metric pupil variation with high accuracy, surpassing traditional clinical diagnostic rates. Uluyagmur-Ozturk et al. [17] focused on the classification of participants with ADHD and Autism Spectrum Disorder (ASD) using an emotion recognition experiment. Using algorithms such as AdaBoost and response time features, they achieved 90% accuracy when separating participants with ADHD, ASD, and control groups. Mengi et al. [18] highlighted the importance of automated diagnostics in the early stage of neurodevelopmental disorders. The study revealed that using data from multiple modalities improved the diagnostic accuracy but pointed at the paucity of standardized datasets as a key problem.
Slater et al. [19] conducted a review on EEG variation in patients diagnosed with ADHD. The review’s findings indicate that electrophysiological measures such as the resting state and task modulation of alpha, beta, and theta power and event-related N2 and P3 components for the discrimination of existing ADHD subtypes and symptomatology provide significant information on ADHD heterogeneity. On the other hand, Mohd et al. [20] proposed a machine learning algorithm to classify or detect ADHD cases. The algorithm was trained using the HYPERAKTIV dataset with information from 143 subjects and 29 characteristics, achieving an accuracy of 82%. The model was evaluated using cross-validation and the metrics of accuracy, Mathew correlation coefficient (MCC), root mean square error (RMSE), recall, F1 score, and precision. From another perspective, Alim et al. [9] developed an algorithm to identify children with ADHD from EEG waves. The algorithm was evaluated using an SVM-based Gaussian model using statistical, time-domain, and frequency-domain features of four sub bands of EEG signals, which was trained on data from 120 children. The model results show ~93% accuracy for cross-validation and holdout and 94% accuracy for holdout. Attallah [21] presented the ADHD-AID tool for ADHD identification based on multiresolution analysis techniques. ADHD-AID extracts 30 time- and time–frequency-domain features, such as nonlinear, band-power, entropy-based, and statistical features, from EEG data. The results indicate a specificity of 0.991, a sensitivity of 0.989, a specificity of 0.992, an F1 score of 0.989, and Mathew correlation coefficients of 0.982. Bakhtyari et al. [22] proposed a new approach for feature extraction for ADHD detection using dynamic connectivity tensor assessment between EEG channels. The approach uses a convolutional long-term memory neural network model (ConvLSTM) and evaluates the metrics of accuracy, precision, recall, and F1. The results were evaluated using the K-fold cross-validation method, and a mean accuracy of 99.34% was obtained with a dataset of 400 instances from 46 ADHD and 45 control children. Tor et al. [23] presented an automated support system for the classification of ADHD, CD (Conduct Disorder), and ADHD+DC. The system used data EEG from 123 children. It extracted eight nonlinear features for classification: (1) qualitative recurrence analysis, (2) activity, (3) fractal dimension, (4) entropies, (5) Hurst exponent, (6) Lempel–Ziv complexity, (7) most prominent Lyapunov exponent, and (8) Kolmogorov complexity. The best results were achieved using the K-NN classifier with an accuracy of 97.88%, a sensitivity of 96.68%, and a specificity and F1 score of 100% and 0.98, respectively. In another approach, Barua et al. [24] proposed a new model for classifying people with ADHD based on EEG data. The model, called TMP19, incorporated a new ternary motif pattern (TMP) to extract features from EEG signals. The model used neighborhood component analysis (NCA) and a k-nearest neighbor (kNN) classifier for feature selection and classification. The model was validated using the 10-fold CV and LOSO CV techniques, obtaining 95.57% and 77.93% classification accuracy, respectively. In their study, Vimalajeewa et al. [25] presented a method for detecting people with ADHD based on the self-similarity of pupil dynamics using wavelets of pupil diameter data in the wavelet domain. This method estimated the wavelet energies level-wise through the distance variance. The sensitivity, specificity, and correct classification accuracy metrics were used to evaluate the performance of the proposed method, obtaining an accuracy of more than 78%. Chen at al. [26] proposed a predictive model for the diagnosis of ADHD using a National Health Service mental health service dataset of 69 patients. The data included demographic data and data from validated self-reported screening questionnaires and clinical interviews. Ninety-four variables and the Decision Tree algorithm were used to design the model, which had an accuracy of 85.507%.
2.2. Neurofeedback
Kwon et al. [27] addressed the use of fMRI in neuropsychology to map brain activity during various cognitive tasks. The fMRI allowed the identification of the active brain areas with high spatial and temporal resolution, improving the understanding of mental processes and behaviors. Shojaei et al. [28] evaluated the effectiveness of neurofeedback on hyperactivity and attention deficit symptoms in elementary school students with ADHD. They used a randomized clinical trial with pre- and post-treatment measurements; 50 students were included in the experimental group and 50 in the control group. The results, analyzed with SPSS-25, showed the significant effectiveness of neurofeedback in reducing ADHD symptoms (p < 0.05). Popovova et al. [29] investigated the feasibility of improving attention by neurofeedback training with fMRI in the right anterior insular cortex (rAIC). Fifty-six healthy adults participated in two training sessions. Only the group with neurofeedback in the rAIC had increased activity in that area and showed increased attention-related alertness up to three months later. Ging-Jehli et al. [30] examined the cognitive effects of neurofeedback for ADHD as a secondary outcome of a randomized clinical trial. In a double-blind clinical trial, 133 children aged 7 to 10 years old with ADHD received 38 sessions of neurofeedback or control treatment. The results showed that before neurofeedback, children with ADHD had difficulty integrating stimulus information, resulting in less accurate and slower responses. The neurofeedback group showed a significant improvement in the integration of auditory information compared to the control group.
From another perspective, Rahmani et al. [31] presented a review of randomized controlled trials (RCTs) using the Conner’s Teacher Rating Scale (CTRS), the Conner’s Parent Rating Scale (CPRS), and the ADHD Rating Scale (ADHD-RS) as the primary outcome measures. The review’s results indicated that neurofeedback treatment is not an adequate clinical method for treating ADHD. Meanwhile, Arns et al. [32] addressed a quantitative review using APA guidelines to classify neurofeedback-based treatments for ADHD. Treatments were evaluated, considering the efficacy and effectiveness through effect size (ES) and remission, with special attention to long-term effects. The results indicate that neurofeedback treatments based on standard protocols are efficient for symptoms rated by parents and teachers with a medium effect size, as well as multicenter randomized controlled trials (RCTs) with medium–large effect sizes at the end of treatment or follow-up and remission rates of 32–47%. Similarly, Garcia Pimenta et al. [33] reviewed 11 RCTs and open-label studies for treating ADHD. This review aimed to (1) determine the effect size and remission rates at the end of treatment and during follow-up and (2) compare the effects of personalized and multimodal NF treatments (neurofeedback) with non-personalized NF monotreatments and baseline medication studies. Standard protocols with medium to large ES, remission rates of 32–47%, and sustained effects on follow-up are practical and specific. The long-term effects of personalized interventions are superior to non-personalized NF and similar to medication alone or with behavioral intervention. Šverko et al. [34] preprocessed data to define neurofeedback parameters for ADHD classification. The statistical characteristics included mean value, overall mean value, and their proportions. The results indicated an increase in the overall mean power values of theta/high beta ratios (TLBRs) at a Cz electrode in people with ADHD. On the other hand, Janssen et al. [35] analyzed the effects of NF theta/beta with methylphenidate (MPH) and long-term physical activity using the electroencephalogram (EEG) power spectra of 67 children. EEG data were collected during a naturalistic follow-up 6 months after completing a 10-week RCT and an immediate post-assessment. The results did not reflect a reduction in theta and alpha power in the neurofeedback group compared to the control groups. Himmelmeier et al. [36] analyzed the efficacy of personalized neurofeedback (pNFB) and its methodological quality in children with ADHD. The studies found were evaluated using Loney’s criteria. Studies were found based on (1) personalized theta/beta using individual alpha peak frequencies (iAPFs) and (2) methodological features such as feedback animations, self-monitoring instructions, the timing of feedback presentation, behavioral performance, individual prerecorded ERP components, and stimulant medication dosage. The use of iAPFs was concluded to be promising for NFB personalization. Vlachou et al. [37] reviewed the effects of neurofeedback for the treatment of ADHD. The main findings are that (1) the clinical effects of neurofeedback are stable between 6 and 12 months after treatment; (2) hyperactivity can decrease with age using NF; and (3) EEG measurements such as the theta/beta ratio are an indicator for the diagnosis of ADHD; it is necessary to consider other factors for a final decision.
3. DETEC-ADHD Detection Workflow
DETEC-ADHD is designed to integrate with a wide range of smart devices, enabling the collection and processing of diverse physiological data. In addition to EEG data, the app can obtain relevant biomarkers such as brain wave signals, oxygen saturation, and heart rate, among others. The data obtained are sent to an external server where one or more classifiers oversee the processing and interpretation operations and save the results for consultation and follow-up. The data collection and processing workflow is as follows:
- Preprocessing and synchronization: The user consents to obtaining biomarker measurements (brain wave signals, oxygen saturation, and heart rate) and physical activity measurements via a wearable device (we used the Muse Band S Gen 2) (see Figure 1). These biomarkers serve as parameters to detect the likelihood of ADHD using AI techniques.Figure 1. Data collection and synchronization process workflow.
- Classification: The biomarker data obtained via the headband are classified using ML techniques and a compatible development library to detect the presence of ADHD in the patient (see Figure 2). The result is ultimately displayed on the web app.Figure 2. ADHD classification process workflow.Each step of the classification process is described below:
- Upload information: Retrieve all useful patient information. Attention level measurements as obtained by EEG are uploaded by the wearable to the client device used.
- Set properties: Select and filter the data of relevance and group patient personal and medical information.
- Extract attributes: Process patient personal and medical data previously filtered.
- Execute ML model: A model stay is performed with the data (features included in the dataset) processed previously. This model performs the classification with ML techniques.
- Obtain classification: A previous detection is obtained depending on the classification result of the model.
- Validate the presence of ADHD: An exhaustive analysis of all the patient’s previous test results is performed. These results are compared and integrated to obtain a final diagnosis, which includes an ADHD probability percentage to indicate confidence in the diagnosis.
- Prognosis: Once the patient has completed several tests, an overall analysis of all the results is performed to obtain the final diagnosis and its corresponding probability: no ADHD; ADHD—inattentive; ADHD—hyperactive; or ADHD—mixed (see Figure 3).Figure 3. ADHD prognosis process workflow.
4. Architecture of DETEC–ADHD
DETEC–ADHD has a layered architecture to provide a scalable solution that organizes the ADHD detection module into several layers or tiers, each having a specific functionality. Each layer is built on top of the previous layer and provides services to the layer above it (see Figure 4).
Figure 4.
Architecture of DETEC–ADHD, detailing the workflow: (1) Web client manages tests and results; (2) Wearable data sent for processing; (3) Data sent to ML models; (4) ADHD classification performed; (5–7) Results stored and managed; (8) Monitoring ensures accuracy; (9) Results visualized; (10) Historical data displayed.
The following is a description of each of the layers that make up the DETEC-ADHD web app:
- Presentation Layer. Interacts with the end user. It allows them to visualize their patient information and medical profile and take cognitive tests that will help the app in its ADHD detection efforts.
- Integration Layer. Processes the requests of the Presentation Layer and sends them to the corresponding Service Layer. It also retrieves data from the Data Access Layer and sends them to the Presentation Layer. The Integration Layer contains three important modules. The Testing Module is where tests are performed on patients with the help of the wearable device. The Monitoring Module (also contained in this layer) is responsible for receiving the real-time data obtained by the device. This information is processed and interpreted by the Services Layer. Finally, the Results Module allows the results to be displayed clearly and concisely.
- Services Layer. It is an additional layer that exposes the functionality of the business logic layer through an API. The web Services Layer provides a standardized and secure way to access system services from any app or device with access to the internet. This layer uses communication protocols such as HTTP or HTTPS to receive requests and send responses in standard data exchange formats such as JSON or XML. This layer contains a Communication Module (connection with an API) and an Automatic Learning Model Module that contains different learning algorithms to perform data classification. These data are sent to the Data Access Module that connects with the Data Layer.
- Data/Storage Layer. Oversees storing and retrieving data from the system, either in a database or in another type of storage. This information is displayed in the Presentation Layer, ready for interpretation by the end user.
The process workflow of DETEC–ADHD can be outlined as follows:
- The web client allows end users (e.g., healthcare professionals) to access the system to manage tests and view results.
- Data obtained from the tests performed with the wearable device (e.g., headset) are sent to the Testing Module in the app for processing.
- The Communication Module receives the processed data and sends them to the ML models for analysis.
- The ML models process the data and perform classification to detect the presence of ADHD.
- The Data Access Module stores the classification results and allows their retrieval when needed.
- The classified results are stored in the storage system.
- The system stores all historical records and classified data.
- The Monitoring Module supervises the execution of the tests and ensures that all the data are processed correctly.
- The Results Module provides a clear visualization of the results through the web client.
- Finally, the web client displays the historical and classified results to the end users.
This structure ensures an efficient and accurate process workflow, facilitating the detection of ADHD through an accessible and well-organized platform.
The architecture of DETEC-ADHD is distinguished by its integration of wearable devices with machine learning models optimized for diagnosing ADHD. Unlike traditional approaches that rely primarily on clinical questionnaires, this system incorporates real-time objective data processed through advanced algorithms, enabling a more accurate and accessible diagnosis. The methodological design of DETEC-ADHD combines a layered architecture with cutting-edge technologies, integrating wearable devices for real-time data acquisition and machine learning models specifically tailored for ADHD diagnosis. This approach is innovative as it prioritizes objective data to complement subjective questionnaires, fostering a more comprehensive and reliable assessment.
Figure 5 illustrates the proposed methodological workflow for ADHD diagnosis. The DETEC-ADHD architecture processes input data and EEG signals in a structured and systematic pipeline. Input data, including medical history, test results, and expert medical opinions, are initially cleaned, normalized, and prepared for analysis. In parallel, EEG signals undergo independent preprocessing and analysis to extract relevant frequency patterns. These cleaned input data and EEG analysis results are subsequently processed through a machine learning model specifically designed for ADHD classification. The model applies attention-based rules to classify individuals into one of three ADHD subtypes: inattentive, hyperactive–impulsive, or combined. These classification rules, developed in collaboration with ADHD specialists, ensure accuracy and relevance to clinical contexts. The probability of belonging to a specific subtype is calculated as a weighted average of previous diagnostic outputs, incorporating all relevant features. Finally, the model’s results are combined with clinical observations to deliver a comprehensive and well-founded diagnosis. This approach enables DETEC-ADHD to integrate objective data with expert evaluations, fostering a reliable and nuanced diagnostic process.
Figure 5.
DETEC-ADHD methodological architecture for ADHD diagnosis. The workflow consists of three layers: the Input Layer, which collects medical history, test results, and expert opinions; the Processing Layer, where data and EEG analysis results are processed through a machine learning model; and the Output Layer, which integrates the results to provide a comprehensive final diagnosis.
5. ML Models for ADHD Detection
In this section, we examine various features and conduct feature selection to develop an ML model for ADHD detection. First, we provide an analysis of existing state-of-the-art datasets, identifying limitations in ADHD detection. Subsequently, we describe the preprocessing process applied to the selected dataset, followed by data partitioning and relevant feature extraction. Finally, we detail a rigorous validation process to ensure the effectiveness and accuracy of the proposed model.
5.1. Analysis of ADHD-Related Datasets
Well-established datasets for ADHD detection include the following:
- HYPERAKTIV [38]: It is a public dataset with data related to heart rate and movement from 51 adult patients without ADHD and 52 clinical patients with ADHD. HYPERACTIV includes health data (medication and substance use), attributes such as age and gender, and output data from various neuropsychological tests that inform the patient’s mental state. The HYPERAKTIV dataset has been used in other research [39] for the diagnosis of ADHD in adults using machine learning algorithms (MLAs).
- ADHD200 [40]: Provides a preprocessed dataset from the ADHD-200 World Competition and consists of 776 anatomical and resting-state fMRI datasets, including 285 from children and adolescents with ADHD. This dataset includes data on age, sex, diagnostic status, medication status, ADHD symptom dimension measures, scores on some of the most common ADHD screening questionnaires, and intelligence quotient (IQ). Researchers Zou et al. [41] relied on the ADHD200 dataset to develop a series of ADHD classification methods based on 3D convolutional neural networks (CNNs) and multi-channel [42] deep learning neural networks.
- EEG Data for ADHD [43]: This dataset contains information from 61 children with ADHD and 60 healthy patients. EEG recording was performed during visual attention tasks, and children were asked to count the number of characters in each picture. Each picture was displayed immediately after the child’s response. EEG recording was based on standard 19-channel EEG recordings (Fz, Cz, Pz, C3, T3, C4, T4, Fp1, Fp2, F3, F4, F7, F8, P3, P4, T5, T6, O1, O2) at a sampling rate of 128 Hz, and A1 and A2 electrodes were placed on the earlobes. The EEG Data for ADHD dataset has been used in other studies for the detection of ADHD from EEG features. For instance, Mohammadi et al. [44] classified nonlinear EEG features in children with and without ADHD as equivalent to attention using this dataset. The results confirmed the defect in the forebrain segment of children with ADHD. Similarly, Barua et al. [24] used EEG signals to propose a new manual classification model to differentiate individuals with ADHD. The proposed model used the Tunable Q Wavelet Transform (TQWT) to generate wavelet sub-bands and a new ternary motif pattern (TMP). The results obtained through cross-validations yielded 95.57% and 77.93% classification accuracy.
- EEG Data for ADHD/Control Children [45]: Consists of EEG recordings from 61 children with ADHD and 60 healthy controls, aged 7 to 12 years old. The ADHD children were diagnosed according to DSM-IV criteria, and some had been treated with Ritalin. EEG recordings were performed using standard 10–20 with 19 channels at a sampling rate of 128 Hz, using electrodes A1 and A2 as references on the earlobes. Moghaddari et al. [43] applied visual tasks during EEG recording that involved counting cartoon characters in pictures to stimulate visual attention. The model obtained an average accuracy of over 99%, suggesting an effective and non-invasive method to assist in the early diagnosis of ADHD in children.
Table 1 introduces a comparative summary of the ADHD datasets discussed above:
Table 1.
Comparison of datasets for ADHD detection.
The selection of the HYPERAKTIV dataset is based on its alignment with the objectives of the project, prioritizing the integration of complementary data and system accessibility. This dataset not only includes EEG records but also additional data such as heart rate, movement, and results from computerized neuropsychological tests, which enhance the analysis and allow for a more comprehensive evaluation of patterns associated with ADHD. In contrast, other EEG-based datasets, such as “EEG Data for ADHD” or “EEG Data for ADHD/Control Children,” are limited exclusively to EEG signals, and they do not incorporate these additional variables. This limitation could restrict the model’s ability to identify important correlations between physiological markers and behavioral patterns, potentially reducing diagnostic accuracy in real-world clinical scenarios. Furthermore, alternative datasets typically employ EEG configurations with 19 or more channels, requiring more expensive and specialized equipment, which contrasts with the accessible and portable approach of the DETEC-ADHD system, designed to operate with devices such as the Muse Band S (Gen 2). To date, HYPERAKTIV represents the only most suitable option to achieve a balance between diagnostic accuracy, data integration, and applicability in resource-constrained contexts, fully aligning with the project’s objectives of accessibility and scalability.
5.2. Experimental Settings and Model Evaluation
We used a stratified 80/20 split to divide the dataset into training and testing subsets, ensuring a balanced representation of ADHD and non-ADHD cases. Within the training set, five-fold cross-validation was employed to validate the robustness of the models and optimize hyperparameters. This combined approach provided insights into the models’ ability to generalize and prevented overfitting. The testing set was carried out exclusively to evaluate the final model’s performance. While multiple algorithms were evaluated, Logistic Regression demonstrated the best trade-off between accuracy and computational efficiency. Its mean training time of 3 s was significantly faster than models like XGBoost (15 s) and Random Forest (12 s). This computational efficiency, combined with its strong generalization metrics (mean accuracy of 90% in cross-validation), made Logistic Regression the most suitable choice for real-time ADHD detection. To ensure replicability, we configured Logistic Regression using C = 100, max_iter = 500, and the solver “saga” in Scikit-learn. These parameters were tuned to balance regularization and convergence efficiency. This combination of methodological rigor and computational optimization highlights the practical applicability of Logistic Regression in ADHD detection tasks.
5.3. ML Models
To determine the best model, we evaluated 10 ML classifiers on the HYPERAKTIV dataset: Logistic Regression, CatBoost, SVM, Gradient Boosting, AdaBoost, Random Forest, Decision Tree, LightGBM, XGBoost, and KNN. Each model was evaluated in terms of the accuracy, precision, completeness, F1 score, and area under the curve (ROC-AUC). Table 2 shows a comparison of the performance results obtained by each of these models on the HYPERAKTIV dataset.
Table 2.
Comparison of algorithm performance for ADHD detection.
To rigorously determine whether the observed performance differences among the models were statistically significant, the Kolmogorov–Smirnov Predictive Accuracy (KSPA) test was employed. This statistical approach, suitable for both parametric and non-parametric data distributions, is aligned with the methodology described by Hassani et al. [46]. The evaluation was performed on a test dataset comprising 20% of the total dataset. This ensures that the analysis reflects the models’ generalization capability to unseen data. The KSPA test was implemented in Python, utilizing the ks_2samp function from the scipy.stats library. This computational approach ensured methodological rigor and reproducibility, aligning with best practices for statistical analysis in data-driven research.
The KSPA test was performed pairwise across all ten models, and the results revealed no statistically significant differences in their error distributions, indicating comparable predictive accuracy across the evaluated methods. For example, the comparison between Logistic Regression and Gradient Boosting produced a Kolmogorov–Smirnov (KS) statistic of 0.0476 and a p-value of 0.9999, indicating no meaningful difference in their predictive accuracy. Similarly, comparisons such as Logistic Regression vs. Random Forest (KS statistic = 0.0952, p-value = 0.9999) and LightGBM vs. XGBoost (KS statistic = 0.0, p-value = 1.0) further supported the conclusion of statistical similarity. Both absolute and squared errors were analyzed to ensure comprehensive evaluation. Absolute errors focused on the magnitude of individual deviations, while squared errors penalized larger deviations more heavily. Notably, even when emphasizing larger errors through squared error analysis, the results remained consistent, as exemplified by the comparison between Logistic Regression and LightGBM (KS statistic = 0.1428, p-value = 0.9870). This uniformity underscores the robustness of all evaluated models in this context.
To supplement the statistical findings, cumulative distribution function (CDF) plots were generated (see Figure 6) for the absolute errors of all models. These visualizations offered additional insights into model behavior. Logistic Regression demonstrated the steepest rise in its CDF curve, indicating a higher proportion of small errors compared to other models. The KSPA test confirmed no significant statistical differences between their error distributions and those of the more advanced models.
Figure 6.
The ridgeline plot illustrates the distributions of absolute errors for predictive models, providing a comparative overview of their performance variability.
5.4. Validation Process
To verify the robustness of the models, we performed a five-fold cross-validation using the training set. This method allowed each model to be trained and validated five times, each time with different subsets of data, ensuring reliable evaluation. For consistency and reproducibility, the random seed (random_state) was fixed at 42 during this process. During the cross-validation phase, we optimized the hyperparameters for each model using GridSearchCV. The configurations explored included regularization strengths (C = [0.1, 1, 10,1 00]) and solvers (“liblinear” and “saga”) for Logistic Regression, penalty values (C = [0.1, 1, 10]) and kernels (“linear” and “rbf”) for SVM, and different numbers of estimators (n_estimators = [25, 47, 100, 200]) and tree depths (max_depth = [3, 5, 10]) for Random Forest and Gradient Boosting. For AdaBoost and LightGBM, variations in learning rates (learning_rate = [0.01, 0.1]) and estimators were tested, while KNN was evaluated using different numbers of neighbors (n_neighbors = [3, 5, 7]) and distance metrics (“euclidean” and “manhattan”). Decision Trees and XGBoost models underwent similar tuning processes to ensure a comprehensive evaluation.
The Logistic Regression model presented the highest accuracy scores at each fold, achieving fold-wise values of 0.8571, 0.857, 0.9047, 0.95, and 0.95, with a mean accuracy of 0.88. These scores indicated that Logistic Regression is reliable and generalizes well. Overall, Logistic Regression, CatBoost, and SVM achieved the best results in accuracy, precision, recall, F1 score, and ROC-AUC, as depicted in Figure 7. This comparative plot highlights their superior performance relative to other models. To select the final models for evaluation on the testing set, we used the configuration with the highest ROC-AUC score in cross-validation. For Logistic Regression, the optimal parameters were C = 100C = 100C = 100, max_iter = 500, and the “saga” solver. Probabilities were generated using the predict_proba method, allowing for the calculation of ROC-AUC values. Logistic Regression once again achieved the highest mean accuracy of 0.90, affirming its suitability for real-world applications.
Figure 7.
Comparative plot of key metrics of ML models trained with HYPERAKTIV dataset.
To provide deeper insights into the model’s performance, we have included convergence and ROC-AUC plots. The convergence plot for Logistic Regression in Figure 8 demonstrates how the model’s log loss decreases over iterations, stabilizing after approximately 400 iterations. This indicates that the model achieves consistent optimization without overfitting, aligning with its performance metrics.
Figure 8.
Convergence plot for Logistic Regression, showing the decrease in log loss over iterations.
The ROC curve in Figure 9 illustrates the performance of multiple models evaluated in this study, with Logistic Regression achieving an AUC of 0.92. This value highlights its ability to distinguish between ADHD and non-ADHD cases effectively. In comparison, other models such as CatBoost and SVM also perform well, with AUC values of 0.91 and 0.88, respectively, showcasing their potential in similar applications. These visualizations provide further evidence supporting the selection of Logistic Regression for its balance of accuracy and computational efficiency.
Figure 9.
ROC curves of the 10 models assessed on the HYPERAKTIV dataset.
To evaluate the individual contribution of features within the HYPERAKTIV dataset and identify the components that play a decisive role in ADHD classification, we conducted an ablation experiment. This analysis involved iteratively removing one feature at a time from the dataset to measure its impact on the model’s performance using the F1 score metric. The results of this experiment are visualized in Figure 10, where the impact of removing each feature is represented through a color gradient: darker colors indicate features with a significant reduction in the F1 score, while lighter colors represent features with minimal impact.
Figure 10.
Impact of feature removal on F1 score (ablation experiment).
Each feature in the dataset represents an important aspect of ADHD classification. For instance, SEX refers to the biological sex of the patient, which has been associated with varying ADHD symptomatology. AGE represents the patient’s chronological age, an important variable due to the developmental nature of ADHD symptoms. ADD corresponds to Attention Deficit Disorder scores derived from EEG data, which reflect dynamic brain activity and attention states. BIPOLAR and UNIPOLAR indicate the presence of bipolar or unipolar Depressive Disorders, respectively, as these comorbidities are common in ADHD cases. ANXIETY reflects the patient’s levels of anxiety, while SUBSTANCE accounts for any history of substance use, as both can influence ADHD symptoms or mimic their presentation. CT refers to cognitive test results, providing quantitative insight into the patient’s cognitive performance. MDQ_POS (Mood Disorder Questionnaire Positive) is a score indicating the likelihood of a mood disorder. WURS (Wender Utah Rating Scale) measures retrospective ADHD symptoms during childhood. ASRS (Adult ADHD Self-Report Scale) captures current ADHD symptoms in adult patients. MADRS (Montgomery–Åsberg Depression Rating Scale) evaluates depressive symptoms that may coexist with ADHD. Finally, HADS_A and HADS_D assess anxiety and depression severity, respectively, while MED records whether the patient is currently taking medication.
The results highlight that certain features, such as “SEX”, “ADD” (EEG-derived score), and “MADRS”, have a significant impact on model performance, as indicated by a noticeable reduction in the F1 score when removed. Specifically, the removal of “ADD”, the only feature derived from physiological data (EEG), resulted in a substantial decrease in performance, underscoring its critical role in ADHD classification. To further understand the combined effect of key features, we evaluated the model using only the subset SEX, ADD, BIPOLAR, and WURS. With these five features, the model achieved an accuracy of 0.870967, a precision of 0.8, a recall of 0.923076, an F1 score of 0.857142, and an ROC AUC of 0.9658. These findings demonstrate the potential of a reduced feature set to maintain high classification performance while simplifying the model, which could enhance its applicability in resource-constrained environments. The inclusion of the “ADD” feature enables the model to capture dynamic brain activity patterns, complementing the psychological scales (“MADRS” and “WURS”), which provide a static but critical assessment of ADHD symptoms. The high recall (0.923076) and ROC AUC (0.9658) achieved with this subset highlight the model’s ability to accurately identify ADHD cases while minimizing false negatives. Despite the strong performance of this reduced subset, we maintained the use of all features in the full model for several reasons. First, the full set of features provides redundancy, which enhances the model’s robustness to noise and missing data, especially in real-world applications where not all data points may be consistently available. Second, while some features individually show minimal impact when removed, their collective contribution may support finer distinctions in borderline cases. Finally, using the complete feature set allows the model to capture additional patterns and interactions that may not be evident in smaller subsets, potentially improving generalizability to diverse clinical populations.
6. Case Study: Detection of ADHD Among Children and Adults
This case study documents the development of DETEC-ADHD, a web app for ADHD detection. We used Python [47] technologies to develop the API that would contain the key app functionalities. The web app leverages the FastAPI framework [48] and the Scikit-learn library [49] (containing the ML modules). The user interface was built with TypeScript and the Angular framework, whereas MySQL served as the database management system. In this case study, DETEC-ADHD was utilized in a group of students to monitor brain activity using a non-invasive smart headset. As a proof of concept, brain activity was monitored during the performance of different cognitive and relaxation activities to obtain a preliminary diagnosis.
The validation of the activities was carried out considering both the professional expertise of specialists and the feedback obtained during preliminary tests. Key adjustments were made to the duration of activities, rest intervals, the environment designed for participants, and the order in which tasks were presented, aiming to minimize the impact of factors such as anxiety and restlessness, particularly in children diagnosed with ADHD. Additionally, the selected activities were carefully designed to address the cognitive and behavioral challenges typically faced by children and adults with ADHD. For children, activities focused on promoting relaxation and concentration through auditory stimuli and simple games. In contrast, for adults, more complex tasks, such as solving a Rubik’s cube, were included to evaluate their problem-solving abilities under pressure.
The selection of activities was based on prior research on ADHD diagnosis. CPTs served as a key reference, as they are widely used to assess sustained attention. CPTs objectively measure cognitive performance by monitoring responses to continuous stimuli, making them particularly useful for identifying patterns associated with ADHD:
- Theta wave activities: Auditory relaxation tasks and guided meditation were chosen for their ability to stimulate theta waves, which are frequently associated with states of calm and relaxation. These waves are often altered in individuals with ADHD, making them a key indicator for diagnosis.
- Beta wave activities: Problem-solving and interactive learning activities were selected due to their effectiveness in stimulating beta waves, which are associated with attention and cognitive processing. Previous research indicates that individuals with ADHD tend to exhibit suppression or inefficient regulation of these waves.
These activities, tailored for both children and adults, were designed to maximize the generation of brain wave patterns relevant to diagnosis while ensuring the safety and comfort of participants.
6.1. Test Design
Continuous Performance Tests (CPTs) [50] are recommended by neuropediatricians to evaluate sustained attention. CPTs comprise a series of cognitive and relaxation activities that allow for beta and theta waves to be measured and used as indicators of both concentration and relaxation levels. The Table 3 describes the main characteristics of these brain waves:
Table 3.
Main characteristics of target brain waves for ADHD detection.
To enrich the capability of our model for detecting ADHD, we used a combined approach to correlate patterns of brain activity with cognitive behaviors. On the one hand, we used the Fast Fourier Transform (FFT) [51] to analyze brain wave data because of its efficiency in decomposing EEG signals into frequency components, which are crucial for analyzing neurological states. The FFT’s speed and effectiveness in processing data enable the identification of specific frequency bands (delta, theta, alpha, beta) associated with ADHD. On the other hand, we administered cognitive tests (CPTs) to gather quantitative data on attention and distractibility, thus complementing EEG measurements.
After conducting extensive research, we resorted to the help of five psychologists with over 15 years of experience managing ADHD in children and adolescents to design two CPTs—one for the child group and one for the adult group. The results of the CPTs aimed at strengthening the validation of our neurophysiological findings and improving our model’s accuracy in ADHD detection. Significant differences in cognitive function among participants with and without ADHD were highlighted, ensuring the relevance and efficacy of this study. The characteristics of the activities comprising the child group CPT are listed in Table 4:
Table 4.
Characteristics of cognitive activities for ADHD detection in children.
The test administered to the children included one activity of each type. Auditory and guided meditation activities aimed at theta wave stimulation, whereas a jigsaw puzzle and a memory game were implemented to promote beta wave production. The activities were adjusted to a duration of five minutes each to reduce risks of restlessness or anxiety among the children (see Figure 11).
Figure 11.
A case study for ADHD detection in children.
The test administered to the adult group was similar to the children’s test in its design but was developed with increased complexity and a greater number of activities, thus making it longer to complete. The Table 5 lists the cognitive activities commonly used for ADHD detection in adult populations.
Table 5.
Characteristics of cognitive activities for ADHD detection in adults.
Similar to the children’s test, auditory and guided meditation activities were selected for theta wave stimulation; however, for beta wave stimulation, the adult test comprised three activities instead of two: solving a higher-piece-count jigsaw puzzle, solving a Rubik’s cube, and answering comprehension questions from an educational video (see Figure 12). During the case study, significant differences were observed in task performance between participants with and without an ADHD diagnosis. The performance in each activity was evaluated based on the time required for completion, the level of progress achieved, and the accuracy of responses. Additionally, direct observation methods were employed to classify levels of attention and impulsivity into three categories, low, medium, and high, as determined by the criteria of medical specialists. The integration of these observations with brain wave data enabled the correlation of neurophysiological patterns with the cognitive behavior of participants. This robust approach highlighted key differences in brain activity and cognitive performance, reinforcing the effectiveness of the DETEC-ADHD model for ADHD diagnosis.
Figure 12.
A case study for ADHD detection in adults.
6.2. EEG Data Collection
EGG data were obtained via the Muse S (Gen 2) smart headband [52] to identify the patient’s state of attention during the cognitive test. The Muse S (Gen 2) smart headband collects real-time data on brain activity. It is a smart device that offers advanced technical features with four high-quality EEG sensors (TP9, TP10, AF7, and AF8). The TP9 and TP10 channels are located near the posterior temporal regions of the brain, while the AF7 and AF8 channels are in the frontal region. The position of the sensors is important since the temporal and frontal regions of the brain are associated with cognitive and emotional functions, such as attention, memory, and emotional regulation. Some experts consider that the four sensor channels on the headband are sufficient to detect basic patterns of brain activity, while others argue that more channels are needed to obtain an accurate and reliable EEG. The Muse S (G2) smart headband is not classified as a medical device by the US Food and Drug Administration (FDA) or any other regulatory agency; therefore, it has not been validated for use in the diagnosis or treatment of any medical condition, including ADHD.
The EEG data collected were processed using a combined approach. The Muse S (Gen 2) smart headband provides basic onboard processing, including real-time EEG signal acquisition and the calculation of predefined metrics. However, additional algorithms were employed in this study to ensure data quality and extract more precise patterns. The processing steps included the following:
- Frequency filtering: A band-pass filter with a range of 0.5 to 40 Hz was applied to retain relevant EEG signals, including delta (0.5–4 Hz), theta (4–8 Hz), alpha (8–13 Hz), and beta (13–30 Hz) frequencies. This filter effectively removed noise from frequencies outside this range, such as high-frequency interference or very-low-frequency signals unrelated to brain activity.
- Artifact removal: Techniques were implemented to detect and mitigate artifacts caused by muscle movements, blinks, or body motion. These included interpolating contaminated segments and removing outlier signals.
- Fast Fourier Transform (FFT): This method decomposed the EEG signals into specific frequency components (delta, theta, alpha, beta) to analyze cognitive and relaxation states.
The reference electrodes (AF7 and AF8) were set up following the manufacturer’s guidelines, ensuring stable contact with the skin. Impedance levels were continuously monitored during testing to remain within acceptable ranges, and participants were instructed to minimize movement to reduce potential noise. These steps ensured the reliability of the signals collected. During specific activities, they were also asked to close their eyes to reduce interference. These precautions complemented the signal processing techniques to improve data accuracy.
While the Muse S (Gen 2) provides an accessible solution for EEG data collection, its non-medical nature introduces limitations in signal precision compared to multi-channel medical-grade devices. To address this limitation, additional analyses were conducted using complementary metrics, such as Continuous Performance Tests (CPTs), to enrich the assessment of attention and impulsivity. These metrics included hit rates, omission errors, commission errors, reaction times, and reaction time variability, all adjusted to the experimental context of this study.
6.3. Use of DETEC-ADHD for ADHD Detection
The ADHD classification results were stored in a persistence service as historical patient records. Figure 13 illustrates the main user interface (UI) screen of the DETEC-ADHD web app, which displays a menu on the left side. Healthcare specialists have access to several screens to manage the app as needed. The main app screens are the Home page, the Patient Profile (and their medical records) page, the Supported Devices management page, and the Logout option. On the Home screen, the app displays a historical graph of ADHD cases or their derivatives identified in the list of assigned patients. Also included is a generalized patient count and a list of recently added patients.
Figure 13.
DETEC–ADHD—main page.
The DETEC-ADHD web app is compatible not only with the Muse S (Gen 2) smart headband [52] but also with other wearable devices with EEG capabilities that share similar characteristics (presence of at least the TP9, TP10, AF7, and AF8 channels) and have a manufacturer API available to facilitate real-time data integration. Compatible devices that hold promising integration with our web app include the EPOC X [53], Mindwave Mobile 2 [54], g.NAUTILUS PRO [55], Focus Calm [56], and Mendi [57] (which although it is not a device with EEG capabilities, it provides feedback on the user’s attention state, making it a valuable tool in this context) (see Figure 14).
Figure 14.
DETEC–ADHD—example of real-time test performance.
Once a test has been completed, the information obtained by the headset is stored in the cloud in a CSV file, and the rest of the information is stored in the database to be later collected by the Classification Module of the web app.
6.4. Viewing the Results
After a test is completed, the patient is presented with a three-question survey to gather medical opinions and diagnoses from healthcare specialists. This information is also used to obtain an ADHD diagnosis. Upon submitting the survey, the web app directs the patient to the Profile page (see Figure 15), where they can view their Test History, with the most recent test report listed at the top. The Profile page also features a graph that provides visual tracking of both historical and upcoming tests. Additionally, from the same screen, users (patients) can have access to and complete multiple surveys based on the Diagnostic and Statistical Manual of Mental Disorders (DSM-5). The responses from these surveys are integrated with the EEG test results to complement the evaluation of brain wave activity, thereby enhancing the web app’s capability to detect ADHD.
Figure 15.
Patient Profile page (new test report added).
If the user clicks on any issued test report from the Test History section, the web app displays the corresponding information in a Test Report Screen (see Figure 16).
Figure 16.
Test Report Screen.
As depicted in Figure 17, the Get EEG Results button in the Test Report Screen displays the EEG data (attention states) analyzed by the web app during that particular test. The web app analyzes attention state data and hyperactivity level data to classify ADHD into different subtypes (see next figure), as supported by findings in neuroimaging studies that demonstrate the effectiveness of similar methodologies [58]. Currently, DETEC-ADHD does not support EEG data import from other devices due to the technological differences between devices in terms of how they receive, store, and share information.
Figure 17.
EEG results report page.
The results generated by the web app’s module are intended to provide informational support rather than definitive conclusions. These results are designed to assist healthcare professionals in their decision-making. For a more accurate prognosis of ADHD, conducting periodic evaluations is advised; however, no specific frequency is universally established. Typically, assessments are administered on a monthly basis, although the optimal frequency may vary depending on the DSM-5 guidelines and individual patient needs.
The approach of the DETEC-ADHD app provides accurate detection of ADHD and its further classification into different subtypes by utilizing smart wearables in conjunction with task-based cognitive activities designed to stimulate varying states of concentration and relaxation. The data collected through these activities provide valuable insights into the individual’s behavioral patterns, which can inform healthcare professionals about the presence and severity of ADHD symptoms. This information serves as a crucial input for subsequent clinical decision-making.
The child and adult datasets used to validate this case study are publicly available on Kaggle as the “EEG ADHD Children Dataset” and the “EEG ADHD Adults Dataset”. The data comprise EEG data in CSV format, collected using the Muse S (Gen 2) smart headband, and individual recordings from each participant. The datasets are distributed under the Creative Commons Attribution-NonCommercial-NoDerivatives 4.0 International (CC BY-NC-ND 4.0) license.
7. Results
DETEC-ADHD combines multiple sources of data to obtain a final ADHD result. In addition to EEG data, the system gathers extensive personal and medical information during patient registration. These data include medical history, such as previous diagnoses and treatments, family history of neurological or psychiatric conditions, and other relevant factors, including age, sex, comorbid disorders, medication use, and substance use. Psychological assessments based on the DSM-5 criteria are also administered to patients and analyzed by the web app, yielding additional scores that contribute to the performance of the LM model in the DETEC-ADHD app.
As discussed in Section 5.4, we evaluated the performance of ten ML models, with SVM, Logistic Regression, and CatBoost exhibiting the highest accuracy scores. We selected Logistic Regression for its 90% accuracy. This model combines personal, medical, and EEG data to perform the final classification of ADHD for the web app. EEG data complement the information as an indicator of attention states during testing and provide additional data to support the classification. The integration of these multiple types of data significantly improves the accuracy and reliability of the ADHD results provided by DETEC-ADHD.
The Logistic Regression model utilized in this study is designed to predict the overall presence or absence of ADHD in a binary manner. The identification of specific subtypes—namely inattentive, hyperactive, or combined—is accomplished through a set of classification rules established by a panel of specialists. These rules incorporate results from additional psychological assessments, including DSM-5-based questionnaires, clinical observations, physician expertise, and EEG data processed by the system. While the model provides valuable support in determining the presence of ADHD, the precise subtype classification is ultimately dependent on the medical professional’s interpretation, informed by their clinical experience and the integrated data.
The DETEC-ADHD web app showed remarkable accuracy, correctly classifying 90% of the adults and 100% of the children in this study. As far as the adult group is concerned, six out of nine correctly identified cases were diagnosed with ADHD: three with the inattentive subtype, one with the hyperactive subtype, and two with the combined subtype. The remaining cases were accurately identified as non-ADHD. In the child group, all ten correctly identified cases included five with ADHD: three with the inattentive subtype, one with the hyperactive subtype, and one with the combined subtype. These results highlight the accuracy and reliability of DETEC-ADHD in the detection of ADHD. The model provides an initial binary result (presence or absence of ADHD), which is complemented by a subtype identification process based on EEG wave ratio, medical criteria, and the patient’s clinical history. The F1 score metric, with a value close to 0.9, supports the effectiveness of the model in correctly classifying individuals with ADHD. Table 6 summarizes the results of the classification in the adult group.
Table 6.
Results of ADHD in adult patients.
The initial sample comprised ten adult participants—male and female, all within the age range of 22 to 33 years old—including six individuals diagnosed with ADHD or another related disorder and four control subjects. The data in each test were classified based on the results of the ADHD detection module in the web app. The classification was performed by averaging theta/beta ratio and taking into consideration the following pre-established values for ADHD detection [56] (see Table 7):
Table 7.
Reference values for ADHD detection.
Figure 18 presents a comparative analysis of EEG signal patterns between a child with ADHD and a typically developing child. The image illustrates differences in the signal profiles across each channel used for EEG filtering. These pattern differences support the conclusions derived from the analysis performed by the DETEC-ADHD web app.
Figure 18.
Comparison of EEG signal patterns—ADHD child vs. control child.
The results discussed in this section demonstrate that the DETEC-ADHD web app is an effective tool for supporting ADHD diagnosis decisions. The web app achieved a notable accuracy rate, correctly classifying 90% of adult participants and 100% of child participants in this study. This suggests that integrating EEG data with psychological assessments and personal information within an ML framework can substantially enhance the accuracy and reliability of ADHD detection. This approach offers a cost-effective and efficient solution for healthcare professionals.
8. Discussion
This paper introduces DETEC-ADHD, a web app for ADHD detection developed in TypeScript (Angular), Python (FastAPI), and MySQL. The web app analyzes clinical data using MLAs to detect ADHD and further classify ADHD results into subtypes. We trained and tested ten ML models on the HYPERAKTIV dataset to determine the best model for the web app. Logistic Regression exhibited the highest accuracy score (90.9%) and thus was selected.
The ADHD detection approach used in DETEC-ADHD demonstrated superior accuracy compared to previous studies due to several key factors. First, the use of Logistic Regression allowed for the effective handling of the EEG data variability, a crucial aspect given the real-time nature of the signals. Additionally, the careful preprocessing and feature selection from the HYPERAKTIV dataset contributed to minimizing noise and enhancing the signal quality, which directly impacted the performance of the model in the web app. Unlike other studies that may have used different populations or experimental designs, our approach focused on a well-defined population and consistent data collection methods, leading to more reliable results. These differences in methodology likely explain the higher accuracy achieved. In addition, the results obtained in controlled settings with children and adults highlight the effectiveness of the DETEC-ADHD web app in detecting ADHD. The 100% accuracy results in children and 90% in adults underline the robustness of the selected Logistic Regression model. These results are promising due to the high quality of the data and the methodology employed.
In the evolving landscape of ADHD diagnostics, DETEC-ADHD leverages real-time EEG data processing and machine learning to address key challenges in accessibility and practicality. Unlike traditional approaches relying on multi-channel EEG systems or neuroimaging data, DETEC-ADHD combines portable hardware with complementary clinical and behavioral inputs, such as heart rate and neuropsychological test results, ensuring broader applicability in clinical settings. For example, while Mohd et al. [20] achieved 82% accuracy using machine learning models focused on EEG features, their approach did not explore the integration of multimodal data that could enhance classification accuracy. Similarly, Alim et al. [9] achieved ~93–94% accuracy using Gaussian SVM models with time-domain and frequency-domain EEG features; however, their reliance on multi-channel EEG systems presents barriers to deployment in resource-constrained environments. In contrast, DETEC-ADHD emphasizes accessibility and practicality by integrating fewer EEG channels and leveraging complementary data, enhancing diagnostic robustness without increasing hardware complexity. Attallah et al. [21] demonstrated impressive results (specificity of 0.992, sensitivity of 0.989) using advanced multiresolution analysis techniques, and Bakhtyari et al. [22] achieved 99.34% accuracy with ConvLSTM models. However, these approaches depend on sophisticated equipment and computational resources, making their implementation in real-time clinical workflows challenging. By focusing on cost-effective, portable solutions that integrate diverse data types, DETEC-ADHD aligns with the demands of real-world clinical environments. Future efforts could refine feature extraction techniques and optimize adaptability to various clinical contexts, ensuring the system remains both practical and robust while bridging the gap between experimental research and practical application.
In their work, Ittaqillah et al. [58] emphasized the potential of multimodal data by combining EEG and ECG to predict concentration levels, achieving significant accuracy. While their innovative approach offers deep insights, DETEC-ADHD extends this by providing a user-friendly, scalable solution that can be integrated seamlessly into clinical workflows, enhancing both diagnostic accuracy and user engagement. By emphasizing the real-time processing of EEG data, DETEC-ADHD not only matches but, in many cases, surpasses traditional detection methods, providing a faster, more accurate, and clinically adaptable tool. Using Logistic Regression and cross-validation, our methodology demonstrated high accuracy and robustness across child and adult populations, enhancing the applicability of the DETEC-ADHD web app in detecting ADHD. Its real-time diagnostic capabilities and accessibility offer significant advantages over conventional methods, including reduced costs and improved ease of use. These advances underscore the relevance of integrating ML with EEG data to provide actionable insights, facilitating the advancement of ADHD diagnosis in both clinical and research settings.
The Muse S (Gen 2) headband provided high-quality EEG data, crucial for diagnostic reliability. Although variability in the EEG signal and artifacts can affect accuracy, additional data-cleaning methods can be implemented. This study is a pioneer in integrating ML with accessible EEG data in a publicly available application. The test design, validated by a group of specialists in psychology and neuropediatrics, ensured that the activities were suitable for measuring beta and theta waves, indicative of the level of concentration and relaxation. The CPTs and other cognitive activities used in this study provided a solid basis for correlating cognitive behaviors with patterns of brain activity. This approach strengthened the validation of neurophysiological findings and improved the accuracy of ADHD diagnosis.
The integration of different EEG technologies and other neuroimaging techniques, such as fNIRS and fMRI, could improve the accuracy and reliability of ADHD diagnosis. Furthermore, the implementation of deep learning models could offer additional benefits, extending the capabilities of the system for ADHD detection. Also, expanding the web app’s compatibility with other EEG measurement devices and biomarkers could enhance accessibility and diagnostic accuracy. The DETEC-ADHD web app has proven to be a promising support tool for ADHD diagnosis, integrating EEG data and advanced ML techniques. The results obtained in this research underline the importance of continuing to explore and improve AI-based detection technologies to offer accessible and effective solutions to healthcare professionals.
Therefore, this study highlights the development and validation of DETEC-ADHD, a web-based system designed to improve the detection and classification of ADHD using machine learning and EEG data. By integrating personal, medical, psychological, and neurophysiological information, the system offers a comprehensive approach that has demonstrated high accuracy in initial evaluations, particularly in resource-limited settings. The experimental results, including a 90% accuracy rate in adults and 100% in children, underscore the reliability of the methodology, which combines multi-source data analysis with EEG biomarkers. Additionally, detailed feature ablation experiments confirm the importance of EEG data in enhancing classification precision. These findings suggest that DETEC-ADHD is a promising tool for scalable, cost-effective ADHD diagnosis, complementing traditional clinical practices with objective, data-driven insights.
Limitations
This study involved only 20 participants (ten children and ten adults), which, although sufficient for an initial proof of concept, may limit the generalizability of the findings. This is consistent with other studies, such as those by Bo Miao et al. [13] and Ittaqillah et al. [58], which also used small samples but provided significant insights into ADHD diagnosis. Future studies will focus on expanding the dataset through multicenter collaborations to include larger and more diverse samples, thereby improving the robustness and applicability of the findings.
Currently, importing EEG data from other devices is limited by technology compatibility issues, a common challenge in the implementation of new medical technologies. We plan to expand the support for diverse EEG devices and technologies, such as fNIRS, to improve data integration and usability.
Another recognized challenge is the impact of EEG artifacts, such as those caused by muscle movements or external noise, on model accuracy. These artifacts, while not invalidating the findings, highlight the importance of developing advanced artifact removal techniques and robust preprocessing methods to ensure data reliability. Expanding the support for additional EEG devices and technologies, such as fNIRS, is also planned to enhance data integration and usability.
Addressing these limitations through targeted research and technological advancements is essential to enhance the DETEC-ADHD web app’s scalability and ensure its applicability across diverse clinical settings.
9. Conclusions
Information technologies are increasingly being integrated into the health field to improve the early detection of diseases. ADHD presents particular challenges in its detection because its symptoms often resemble typical behaviors. This research proposed an innovative solution by developing an AI module accessible through a wearable to monitor biomarkers and assess the prevalence level of ADHD. This research developed and evaluated DETEC-ADHD, a web app based on ML and EEG data for ADHD detection. The app detected ADHD with an accuracy of 100% in children and 90% in adults, demonstrating its efficacy. The main contribution of this work is the integration of advanced ML techniques with clinical and EEG data obtained from the Muse S (Gen 2) smart headband. This approach improved the accuracy and reliability of ADHD results, offering an accessible and efficient support solution for healthcare professionals. The results of this study highlight the potential of DETEC-ADHD as an innovative tool for the early detection of ADHD, with a significant impact on its management and treatment. The combination of personal, medical, and EEG data in an ML model proved to be an effective and promising strategy. In future research, it is recommended to explore the compatibility of the web app with FDA-approved EEG measurement devices and expand the study samples to further validate the effectiveness of the Logistic Regression model. In addition, the implementation of deep learning techniques could further improve detection accuracy.
Author Contributions
Conceptualization, I.S.-L. and G.A.-H.; data curation, I.S.-L.; formal analysis, I.S.-L.; investigation, I.S.-L.; methodology, I.S.-L. and G.A.-H.; supervision, M.B.-L., J.L.S.-C., L.N.S.-M., H.M.-V. and J.H.-C.; validation, M.B.-L., J.L.S.-C., L.N.S.-M. and J.H.-C.; visualization, I.S.-L.; writing—original draft, I.S.-L.; writing—review and editing, I.S.-L., M.B.-L., J.H.-C., H.M.-V. and G.A.-H.; resources, G.A.-H.; software, I.S.-L.; project administration, G.A.-H. All authors have read and agreed to the published version of the manuscript.
Funding
This work was funded by Mexico’s National Technological Institute (TecNM) under project 19292.24-P, “ADHD Detection and Classification using AI Techniques”, Mexico’s National Council of Humanities, Science, and Technology (CONAHCYT), and the Public Secretariat of Education (SEP) through the Sectorial Fund of Research for Education.
Institutional Review Board Statement
This study was conducted according to the Mexico’s National Technological Institute (TecNM) policies where ethics approval is not required for this type of study. The ethics policies can be found at https://www.tecnm.mx/dir_personal/cepci/documentos/Codigo_de_Conducta.pdf. (accessed on 23 November 2024).
Informed Consent Statement
All subjects gave their informed consent for inclusion before they participated in the study called “ADHD Detection and Classification using AI Techniques”. This study was conducted in accordance with the Declaration of Helsinki, and the protocol was ap-proved by the Ethics Committee of the Mexico’s National Technological Institute (TecNM) under the project 19292.24-P.
Data Availability Statement
Publicly available datasets were analyzed in this study. The data can be found at HYPERAKTIV (https://osf.io/3agwr/) (accessed on 23 December 2024); ADHD200 (https://data.world/nicholsn/adhd-200) (accessed on 23 November 2024); Working Memory and Reward in Children with and without ADHD (https://openneuro.org/datasets/ds002424/versions/1.1.1) (accessed on 23 November 2024); Working Memory and Reward in Adults (https://openneuro.org/datasets/ds002687/versions/1.2.0) (accessed on 23 November 2024); and EEG DATA FOR ADHD/CONTROL CHILDREN (https://ieee-dataport.org/open-access/eeg-data-adhd-control-children) (accessed on 23 November 2024).
Acknowledgments
This work was supported by Mexico’s National Technological Institute (TecNM) and sponsored by both Mexico’s National Council of Science and Technology (CONACYT) and the Secretariat of Public Education (SEP) through the PRODEP project (Programa para el Desarrollo Profesional Docente).
Conflicts of Interest
The authors declare no conflicts of interest.
References
- Rivera, F.B. La elevada prevalencia del TDAH: Posibles causas y repercusiones socioeducativas. Psicol. Educ. 2016, 22, 81–85. [Google Scholar] [CrossRef] [Scilit]
- WHO. World Mental Health Report: Transforming Mental Health for All; WHO: Geneva, Switzerland, 2022. [Google Scholar]
- Llanos Lizcano, L.J.; García Ruiz, D.J.; González Torres, H.J.; Puentes Rozo, P. Trastorno por déficit de atención e hiperactividad (TDAH) en niños escolarizados de 6 a 17 años. Pediatría Atención Primaria 2019, 21, 101–108. [Google Scholar]
- Asociación Americana de Psiquiatría (APA). Manual Diagnóstico y Estadístico de los Trastornos Mentales (DSM-5®), 5th ed.; Panamericana, M.E., Ed.; Editorial Médica Panamericana: Arlington, VA, USA, 2014; ISBN 978-84-9835-810-0. [Google Scholar]
- Abdalá, A.L. Trastorno por déficit de atención e hiperactividad (TDAH): Factores gestacionales y perinatales asociados. Evid. Méd. Investig. Salud 2014, 7, 178–181. [Google Scholar] [CrossRef]
- Kaur, S.; Singh, S.; Arun, P.; Kaur, D.; Bajaj, M. Phase Space Reconstruction of EEG Signals for Classification of ADHD and Control Adults. Clin. EEG Neurosci. 2020, 51, 102–113. [Google Scholar] [CrossRef] [Scilit] [PubMed]
- Maniruzzaman, M.; Al Mehedi Hasan, M.; Suzuki, T.; Shin, J. Identification of Children with ADHD from EEG Signals Based on Entropy Measures and Support Vector Machine. In Proceedings of the 2023 11th European Workshop on Visual Information Processing (EUVIP), Gjøvik, Norwa, 11–14 September 2023; pp. 1–6. [Google Scholar] [CrossRef] [Scilit]
- Stock, S.; Hausberg, J.; Armengol-Urpi, A.; Kaufmann, T.; Schinle, M.; Gerdes, M.; Stork, W. Towards EEG-based objective ADHD diagnosis support using convolutional neural networks. In Proceedings of the 2023 IEEE Conference on Computational Intelligence in Bioinformatics and Computational Biology (CIBCB), Eindhoven, The Netherlands, 29–31 August 2023; pp. 1–8. [Google Scholar] [CrossRef] [Scilit]
- Alim, A.; Imtiaz, M.H. Automatic Identification of Children with ADHD from EEG Brain Waves. Signals 2023, 4, 193–205. [Google Scholar] [CrossRef] [Scilit]
- Liang, H.; Liu, Y.; Wang, H.; Jia, Z. Teacher Assistant-Based Knowledge Distillation Extracting Multi-level Features on Single Channel Sleep EEG. IJCAI Int. Jt. Conf. Artif. Intell. 2023, 4, 3948–3956. [Google Scholar] [CrossRef] [Scilit]
- Jia, Z.; Liang, H.; Liu, Y.; Wang, H.; Jiang, T. DistillSleepNet: Heterogeneous Multi-Level Knowledge Distillation via Teacher Assistant for Sleep Staging. In IEEE Transactions on Big Data; IEEE: New York, NY, USA, 2024. [Google Scholar] [CrossRef] [Scilit]
- Ahire, N.; Awale, R.N.; Wagh, A. Electroencephalogram (EEG) based prediction of attention deficit hyperactivity disorder (ADHD) using machine learning. Appl. Neuropsychol. Adult 2023, 1–12. [Google Scholar] [CrossRef] [Scilit]
- Miao, B.; Zhang, Y. A Feature Selection Method for Classification of ADHD. In 4th International Conference on Information, Cybernetics and Computational Social Systems (ICCSS), 4th ed.; IEEE: New York, NY, USA, 2017; ISBN 9781538632574. [Google Scholar]
- Bautista, M.Á.; Hernández-Vela, A.; Escalera, S.; Igual, L.; Pujol, O.; Moya, J.; Violant, V.; Anguera, M.T. A Gesture Recognition System for Detecting Behavioral Patterns of ADHD. IEEE Trans. Cybern. 2014, 46, 136–147. [Google Scholar] [CrossRef] [Scilit] [PubMed]
- Itani, S.; Lecron, F.; Fortemps, P. A multi-level classification framework for multi-site medical data: Application to the ADHD-200 collection. Expert Syst. Appl. 2018, 91, 36–45. [Google Scholar] [CrossRef] [Scilit]
- Khanna, S.; Das, W. A Novel Application for the Efficient and Accessible Diagnosis of ADHD Using Machine Learning (Extended Abstract). In 2020 IEEE/ITU International Conference on Artificial Intelligence for Good, AI4G 2020; Institute of Electrical and Electronics Engineers Inc.: New York, NY, USA, 2020; pp. 51–54. [Google Scholar]
- Uluyagmur-Ozturk, M.; Arman, A.R.; Yilmaz, S.S.; Findik, O.T.P.; Genc, H.A.; Carkaxhiu-Bulut, G.; Yazgan, M.Y.; Teker, U.; Cataltepe, Z. ADHD and ASD Classification Based on Emotion Recognition Data. In 15th IEEE International Conference on Machine Learning and Applications (ICMLA); Institute of Electrical and Electronics Engineers (IEEE): New York, NY, USA, 2017; pp. 810–813. [Google Scholar]
- Mengi, M.; Malhotra, D. Artificial Intelligence Based Techniques for the Detection of Socio-Behavioral Disorders: A Systematic Review. Arch. Comput. Methods Eng. 2021, 29, 2811–2855. [Google Scholar] [CrossRef] [Scilit]
- Slater, J.; Joober, R.; Koborsy, B.L.; Mitchell, S.; Sahlas, E.; Palmer, C. Can electroencephalography (EEG) identify ADHD subtypes? A systematic review. Neurosci. Biobehav. Rev. 2022, 139, 104752. [Google Scholar] [CrossRef] [Scilit] [PubMed]
- Mohd, A.; Ali, A.M.; Halim, S.A. Detecting ADHD Subjects Using Machine Learning Algorithm. In 2022 IEEE International Conference on Computing (ICOCO); IEEE: New York, NY, USA, 2022; pp. 299–304. [Google Scholar]
- Attallah, O. ADHD-AID: Aiding Tool for Detecting Children’s Attention Deficit Hyperactivity Disorder via EEG-Based Multi-Resolution Analysis and Feature Selection. Biomimetics 2024, 9, 188. [Google Scholar] [CrossRef] [Scilit]
- Bakhtyari, M.; Mirzaei, S. ADHD detection using dynamic connectivity patterns of EEG data and ConvLSTM with attention framework. Biomed. Signal Process. Control 2022, 76, 103708. [Google Scholar] [CrossRef] [Scilit]
- Tor, H.T.; Ooi, C.P.; Lim-Ashworth, N.S.; Wei, J.K.E.; Jahmunah, V.; Oh, S.L.; Acharya, U.R.; Fung, D.S.S. Automated detection of conduct disorder and attention deficit hyperactivity disorder using decomposition and nonlinear techniques with EEG signals. Comput. Methods Progr. Biomed. 2021, 200, 105941. [Google Scholar] [CrossRef] [Scilit]
- Barua, P.D.; Dogan, S.; Baygin, M.; Tuncer, T.; Palmer, E.E.; Ciaccio, E.J.; Acharya, U.R. TMP19: A Novel Ternary Motif Pattern-Based ADHD Detection Model Using EEG Signals. Diagnostics 2022, 12, 2544. [Google Scholar] [CrossRef] [Scilit] [PubMed]
- Vimalajeewa, D.; McDonald, E.; Bruce, S.A.; Vidakovic, B. Wavelet-based approach for diagnosing attention deficit hyperactivity disorder (ADHD). Sci. Rep. 2022, 12, 21928. [Google Scholar] [CrossRef] [Scilit] [PubMed]
- Chen, T.; Antoniou, G.; Adamou, M.; Tachmazidis, I.; Su, P. Automatic Diagnosis of Attention Deficit Hyperactivity Disorder Using Machine Learning. Appl. Artif. Intell. 2021, 35, 657–669. [Google Scholar] [CrossRef] [Scilit]
- Kwon, S.Y.; Seo, G.; Jang, M.; Shin, H.; Choi, W.; Lim, Y.B.; Shin, M.-S.; Kim, B.-N. The Effect of Mobile Neurofeedback Training in Children with Attention Deficit Hyperactivity Disorder: A Randomized Controlled Trial. Clin. Psychopharmacol. Neurosci. 2024, 22, 67–78. [Google Scholar] [CrossRef] [Scilit]
- Shojaei, B.; Naeim, M.; Kazemi, Z.; Taheri, M.; Imannezhad, S.; Mohammadi, Y. Reducing symptoms of attention deficit/hyperactivity disorder (ADHD) in elementary students: The effectiveness of neurofeedback. Ann. Med. Surg. 2024, 86, 2651–2656. [Google Scholar] [CrossRef] [Scilit]
- Popovova, J.; Mazloum, R.; Macauda, G.; Stämpfli, P.; Vuilleumier, P.; Frühholz, S.; Scharnowski, F.; Menon, V.; Michels, L. Enhanced attention-related alertness following right anterior insular cortex neurofeedback training. iScience 2024, 27, 108915. [Google Scholar] [CrossRef] [Scilit]
- Ging-Jehli, N.R.; Painter, Q.A.; Kraemer, H.A.; Roley-Roberts, M.E.; Panchyshyn, C.; deBeus, R.; Arnold, L.E. A diffusion decision model analysis of the cognitive effects of neurofeedback for ADHD. Neuropsychology 2024, 38, 146–156. [Google Scholar] [CrossRef] [Scilit]
- Rahmani, E.; Mahvelati, A.; Alizadeh, A.; Mokhayeri, Y.; Rahmani, M.; Zarabi, H.; Hassanvandi, S. Is neurofeedback effective in children with ADHD? A systematic review and meta-analysis. Neurocase 2022, 28, 84–95. [Google Scholar] [CrossRef] [Scilit]
- Arns, M.; Clark, C.R.; Trullinger, M.; deBeus, R.; Mack, M.; Aniftos, M. Neurofeedback and Attention-Deficit/Hyperactivity-Disorder (ADHD) in Children: Rating the Evidence and Proposed Guidelines. Appl. Psychophysiol. Biofeedback 2020, 45, 39–48. [Google Scholar] [CrossRef] [Scilit] [PubMed]
- Garcia Pimenta, M.; Brown, T.; Arns, M.; Enriquez-Geppert, S. Treatment Efficacy and Clinical Effectiveness of EEG Neurofeedback as a Personalized and Multimodal Treatment in ADHD: A Critical Review. Neuropsychiatr. Dis. Treat. 2021, 17, 637–648. [Google Scholar] [CrossRef] [Scilit]
- Šverko, Z.; Markovinović, I.; Vrankić, M.; Vlahinić, S. EEG data processing in ADHD diagnosis and neurofeedback. Eng. Rev. 2020, 40, 116–123. [Google Scholar] [CrossRef] [Scilit]
- Janssen, T.W.P.; Geladé, K.; Bink, M.; van Mourik, R.; Twisk, J.W.R.; Maras, A.; Oosterlaan, J. Long-term effects of theta/beta neurofeedback on EEG power spectra in children with attention deficit hyperactivity disorder. Clin. Neurophysiol. 2020, 131, 1332–1341. [Google Scholar] [CrossRef] [Scilit] [PubMed]
- Himmelmeier, L.; Werheid, K. Neurofeedback Training in Children with ADHD: A Systematic Review of Personalization and Methodological Features Facilitating Training Conditions. Clin. EEG Neurosci. 2024, 55, 625–635. [Google Scholar] [CrossRef] [Scilit]
- Vlachou, J.A.; Polychroni, F.; Drigas, A.S.; Economou, A. Neurofeedback and ADHD. Int. J. Recent Contrib. Eng. Sci. IT 2022, 10, 47–56. [Google Scholar] [CrossRef] [Scilit]
- Hicks, S.A.; Stautland, A.; Fasmer, O.B.; Førland, W.; Hammer, H.L.; Halvorsen, P.; Mjeldheim, K.; Oedegaard, K.J.; Osnes, B.; Giæver Syrstad, V.E.; et al. HYPERAKTIV, Proceedings of the 12th ACM Multimedia Systems Conference, Istanbul, Turkey, 28 September–1 October 2021; ACM: New York, NY, USA, 2021; pp. 314–319. [Google Scholar]
- Kaur, A.; Kahlon, K.S. Accurate Identification of ADHD among Adults Using Real-Time Activity Data. Brain Sci. 2022, 12, 831. [Google Scholar] [CrossRef] [Scilit] [PubMed]
- Nichols, N. ADHD200. Available online: http://preprocessed-connectomes-project.org/adhd200/ (accessed on 14 February 2023).
- Zou, L.; Zheng, J.; Miao, C.; Mckeown, M.J.; Wang, Z.J. 3D CNN Based Automatic Diagnosis of Attention Deficit Hyperactivity Disorder Using Functional and Structural MRI. IEEE Access 2017, 5, 23626–23636. [Google Scholar] [CrossRef] [Scilit]
- Chen, M.; Li, H.; Wang, J.; Dillman, J.R.; Parikh, N.A.; He, L. A Multichannel Deep Neural Network Model Analyzing Multiscale Functional Brain Connectome Data for Attention Deficit Hyperactivity Disorder Detection. Radiol. Artif. Intell. 2019, 2, e190012. [Google Scholar] [CrossRef] [Scilit] [PubMed]
- Nasrabadi, A.M.; Allahverdy, A.; Samavati, M.; Reza Mohammadi, M. Eeg Data for ADHD/Control Children. Available online: https://ieee-dataport.org/open-access/eeg-data-adhd-control-children (accessed on 14 February 2023).
- Mohammadi, M.R.; Khaleghi, A.; Nasrabadi, A.M.; Rafieivand, S.; Begol, M.; Zarafshan, H. EEG classification of ADHD and normal children using non-linear features and neural network. Biomed. Eng. Lett. 2016, 6, 66–73. [Google Scholar] [CrossRef] [Scilit]
- Moghaddari, M.; Lighvan, M.Z.; Danishvar, S. Diagnose ADHD disorder in children using convolutional neural network based on continuous mental task EEG. Comput. Methods Programs Biomed. 2020, 197, 105738. [Google Scholar] [CrossRef] [Scilit]
- Hassani, H.; Silva, E.S. A Kolmogorov-Smirnov Based Test for Comparing the Predictive Accuracy of Two Sets of Forecasts. Econometrics 2015, 3, 590–609. [Google Scholar] [CrossRef] [Scilit]
- Python Software Foundation ¿Qué es Python? Available online: https://docs.python.org/es/3/faq/general.html#what-is-python (accessed on 23 November 2024).
- FastAPI. Available online: https://fastapi.tiangolo.com/ (accessed on 20 October 2023).
- Scikit-Learn. Available online: https://scikit-learn.org/stable/ (accessed on 19 October 2023).
- Shi, T.; Li, X.; Song, J.; Zhao, N.; Sun, C.; Xia, W.; Wu, L.; Tomoda, A. EEG characteristics and visual cognitive function of children with attention deficit hyperactivity disorder (ADHD). Brain Dev. 2012, 34, 806–811. [Google Scholar] [CrossRef] [Scilit] [PubMed]
- Kato, K.; Takahashi, K.; Mizuguchi, N.; Ushiba, J. Online detection of amplitude modulation of motor-related EEG desynchronization using a lock-in amplifier: Comparison with a fast Fourier transform, a continuous wavelet transform, and an autoregressive algorithm. J. Neurosci. Methods 2018, 293, 289–298. [Google Scholar] [CrossRef] [Scilit]
- Interaxon Inc. Muse Band. Available online: https://choosemuse.com/ (accessed on 29 October 2023).
- Emotiv. Available online: https://www.emotiv.com/ (accessed on 29 October 2023).
- NeroSky MindWave Mobile 2. Available online: https://neurosky.com/ (accessed on 23 November 2024).
- tec g.NAUTILUS PRO. Available online: https://www.gtec.at/ (accessed on 23 November 2024).
- Focus Calm. Available online: https://focuscalm.com/ (accessed on 23 November 2024).
- Mendi.io Mendi. Available online: https://www.mendi.io/ (accessed on 29 October 2023).
- Ittaqillah, S.I.; Sumanang, D.A.; Thifal, Q.; Harahap, A.F.; Rahmatillah, A.; Putra, A.P.; Rulaningtyas, R.; Rahma, O.N. Application of ANFIS-based Non-Linear Regression Modelling to Predict Concentration Level in Concentration Grid Test as Early Detection of ADHD in Children. Indones. Appl. Phys. Lett. 2023, 4, 29–37. [Google Scholar] [CrossRef] [Scilit]
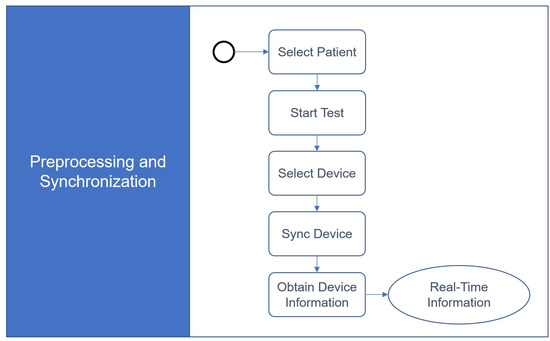
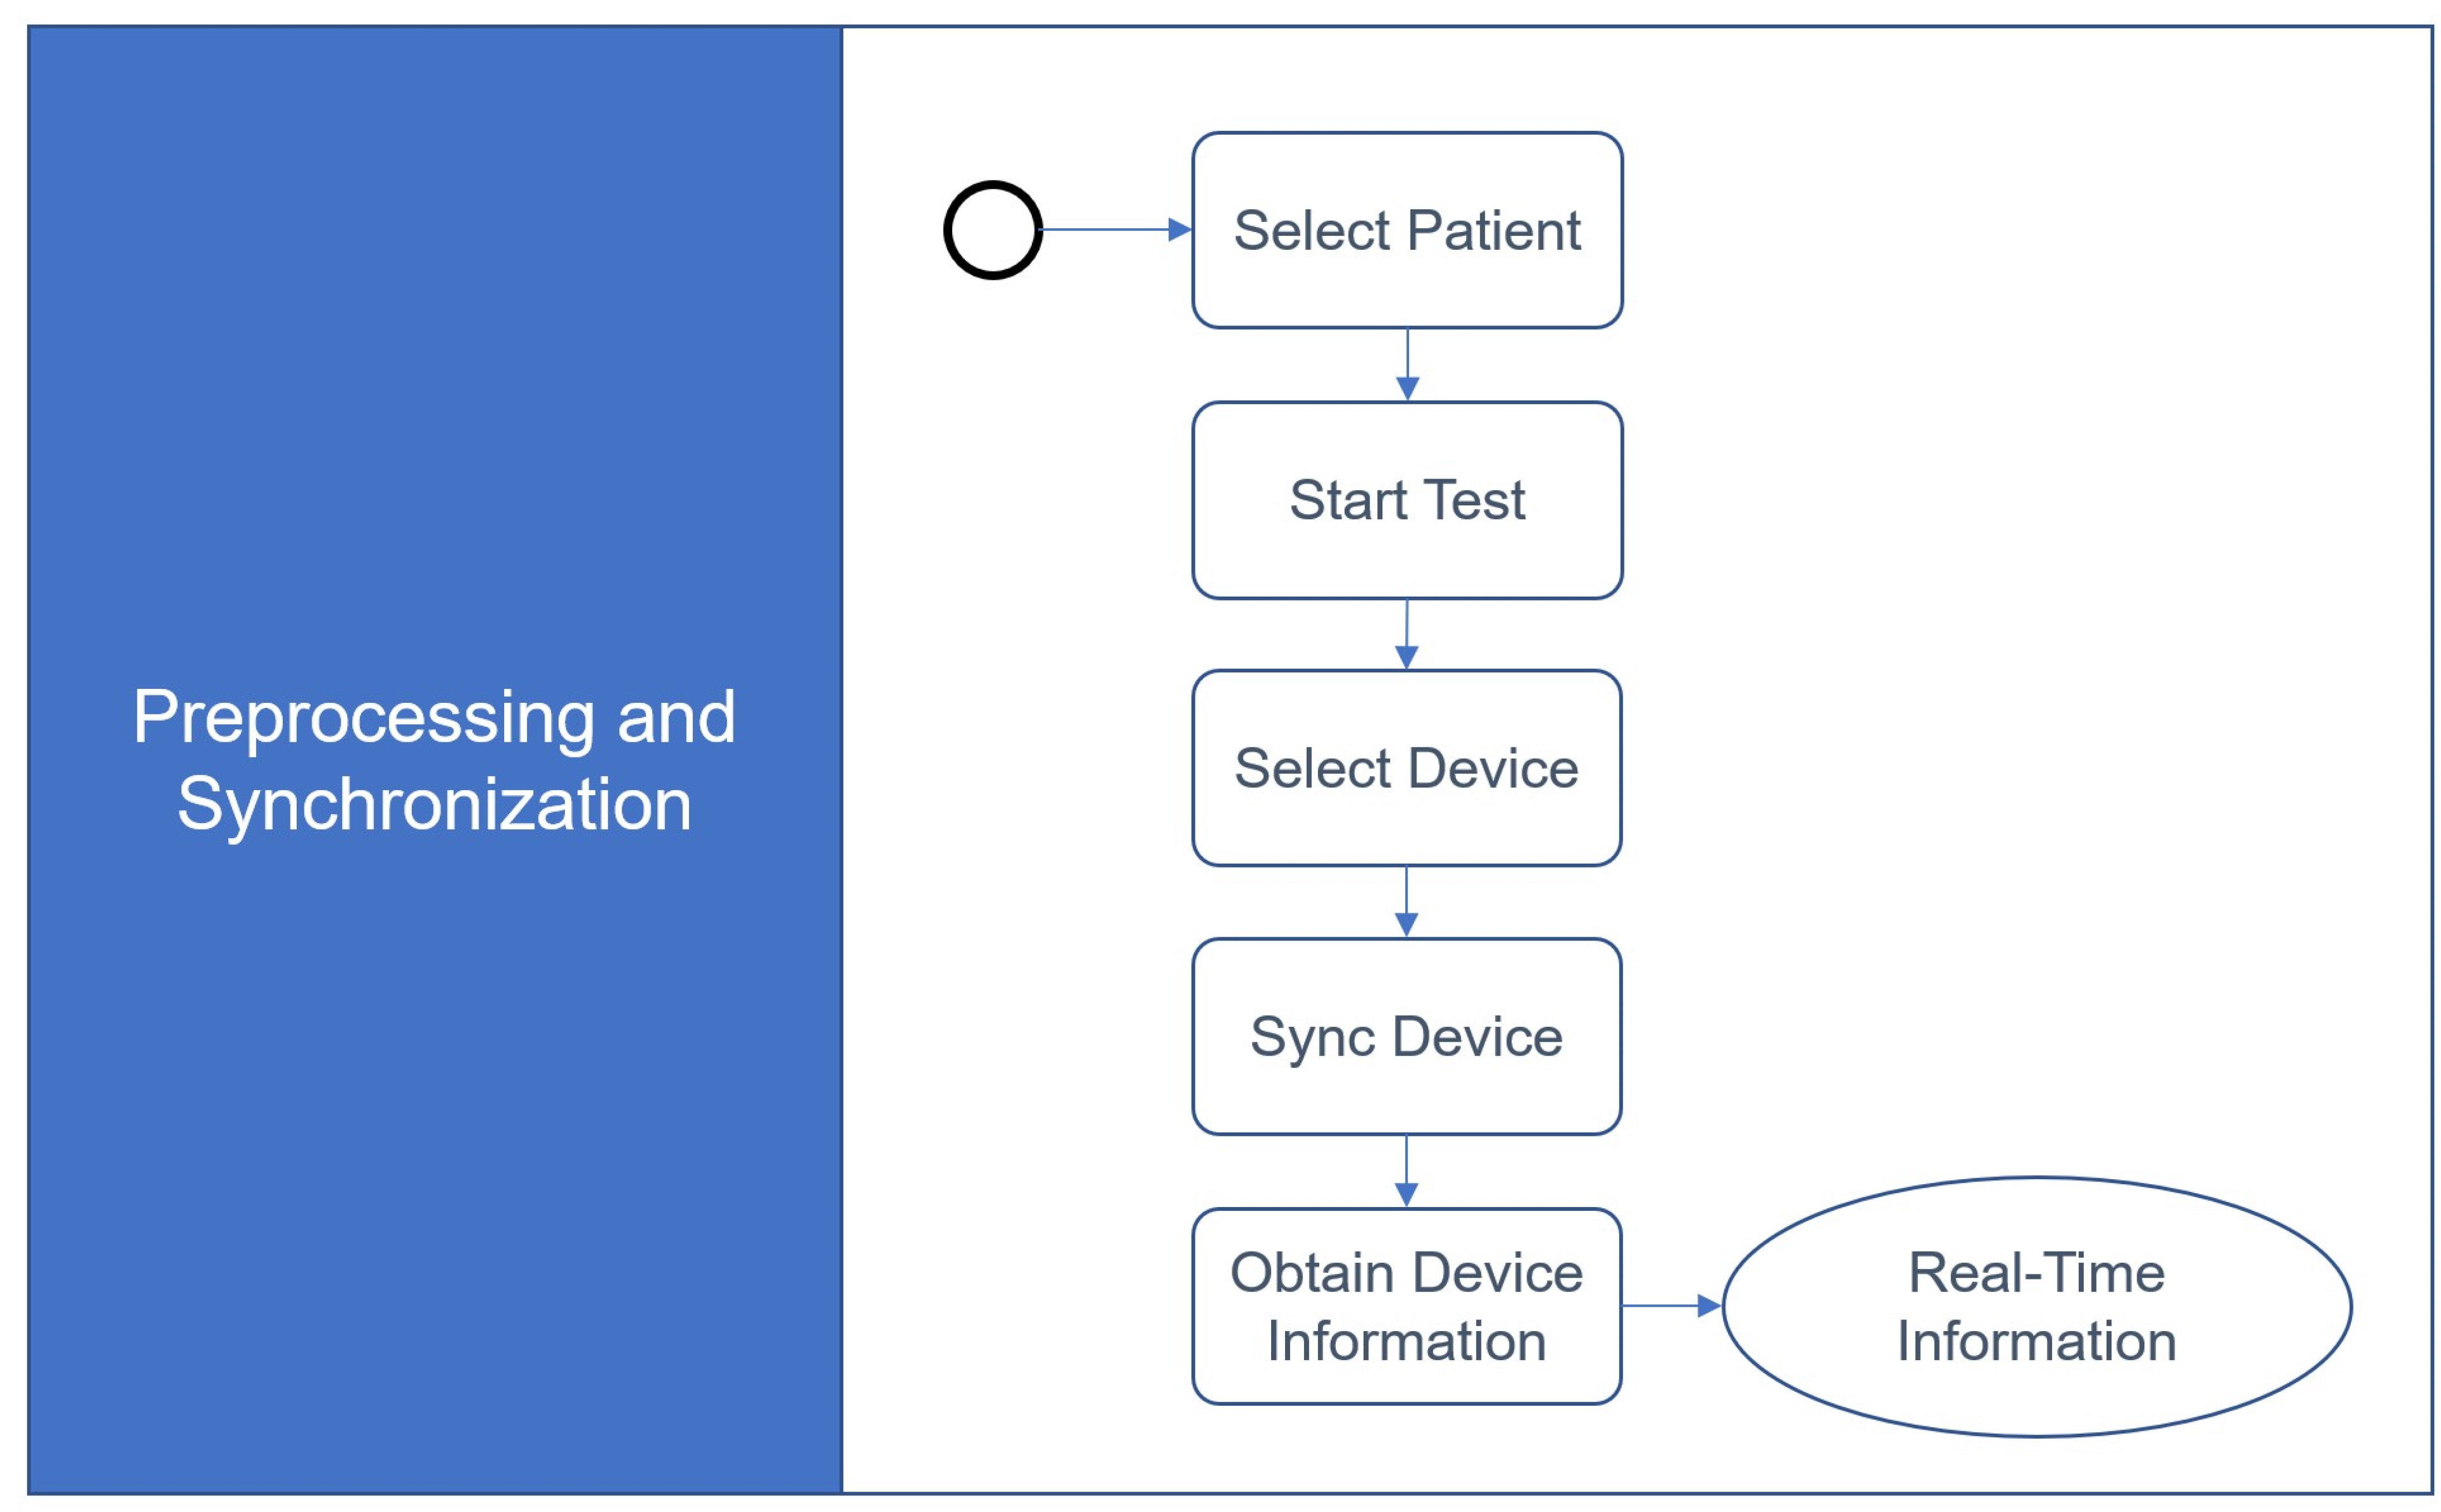

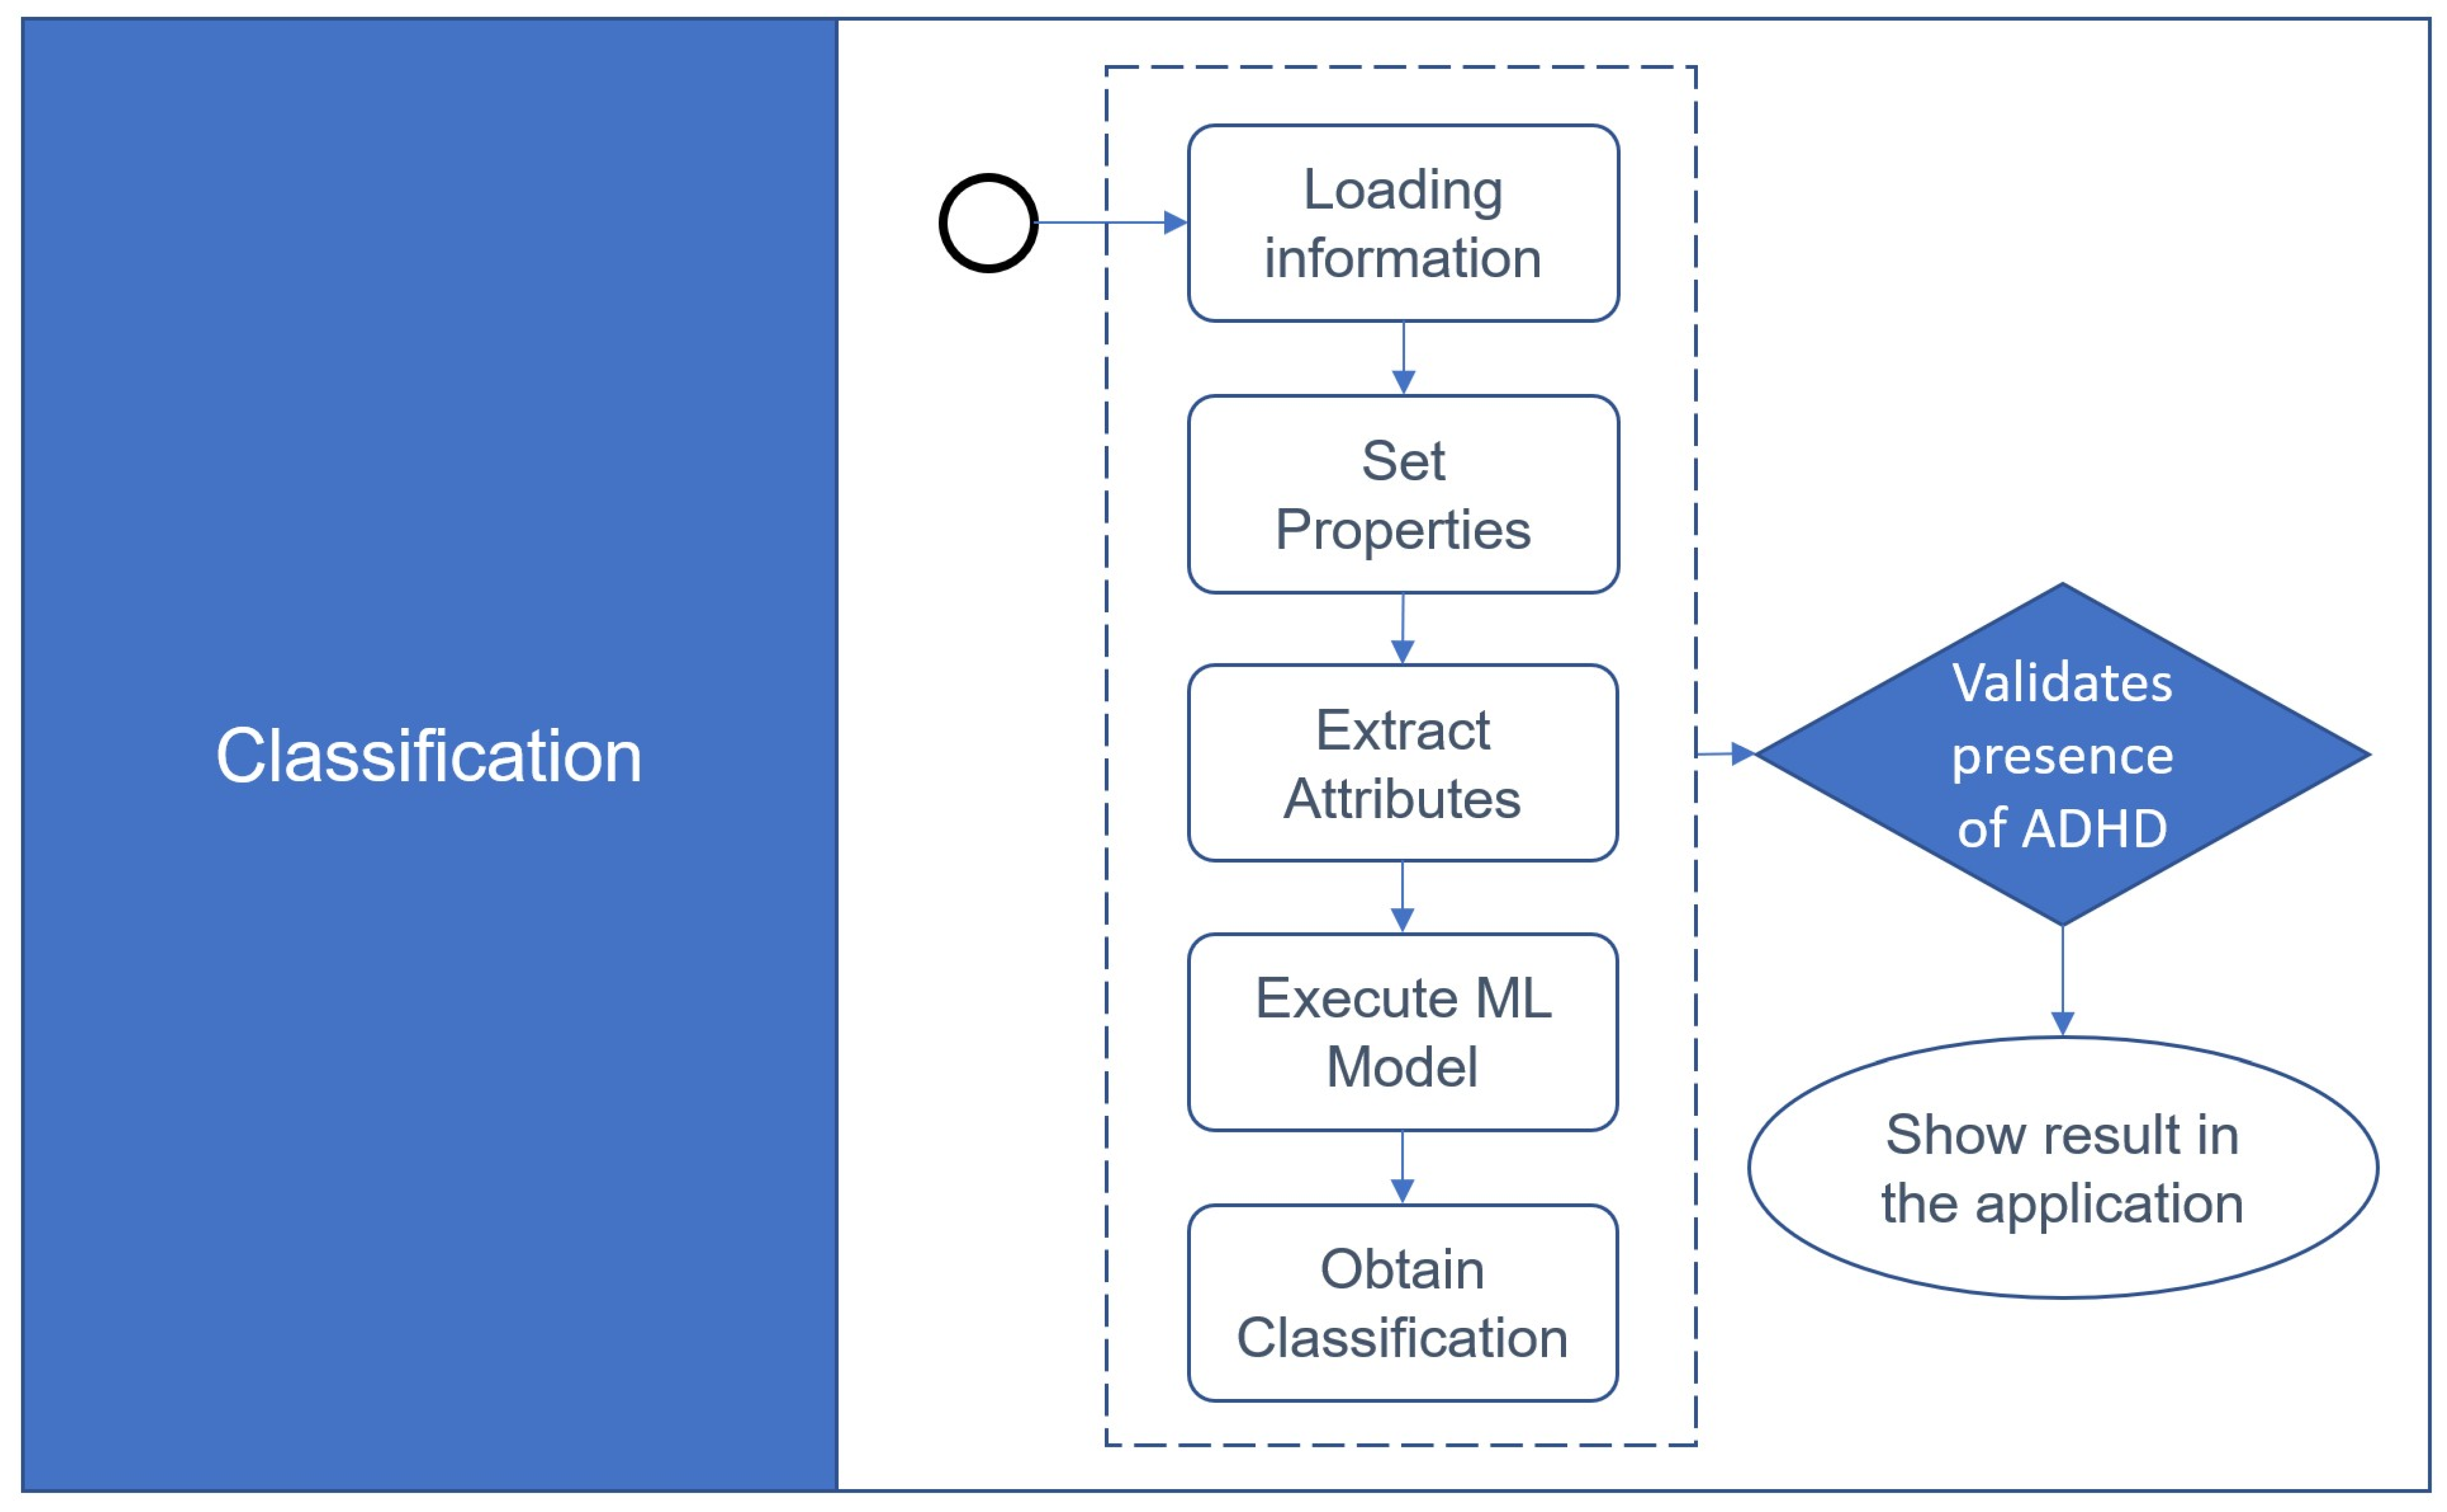
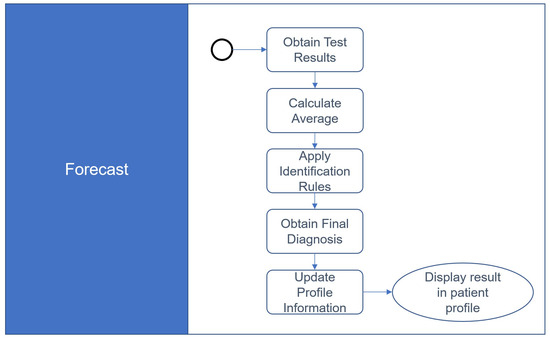
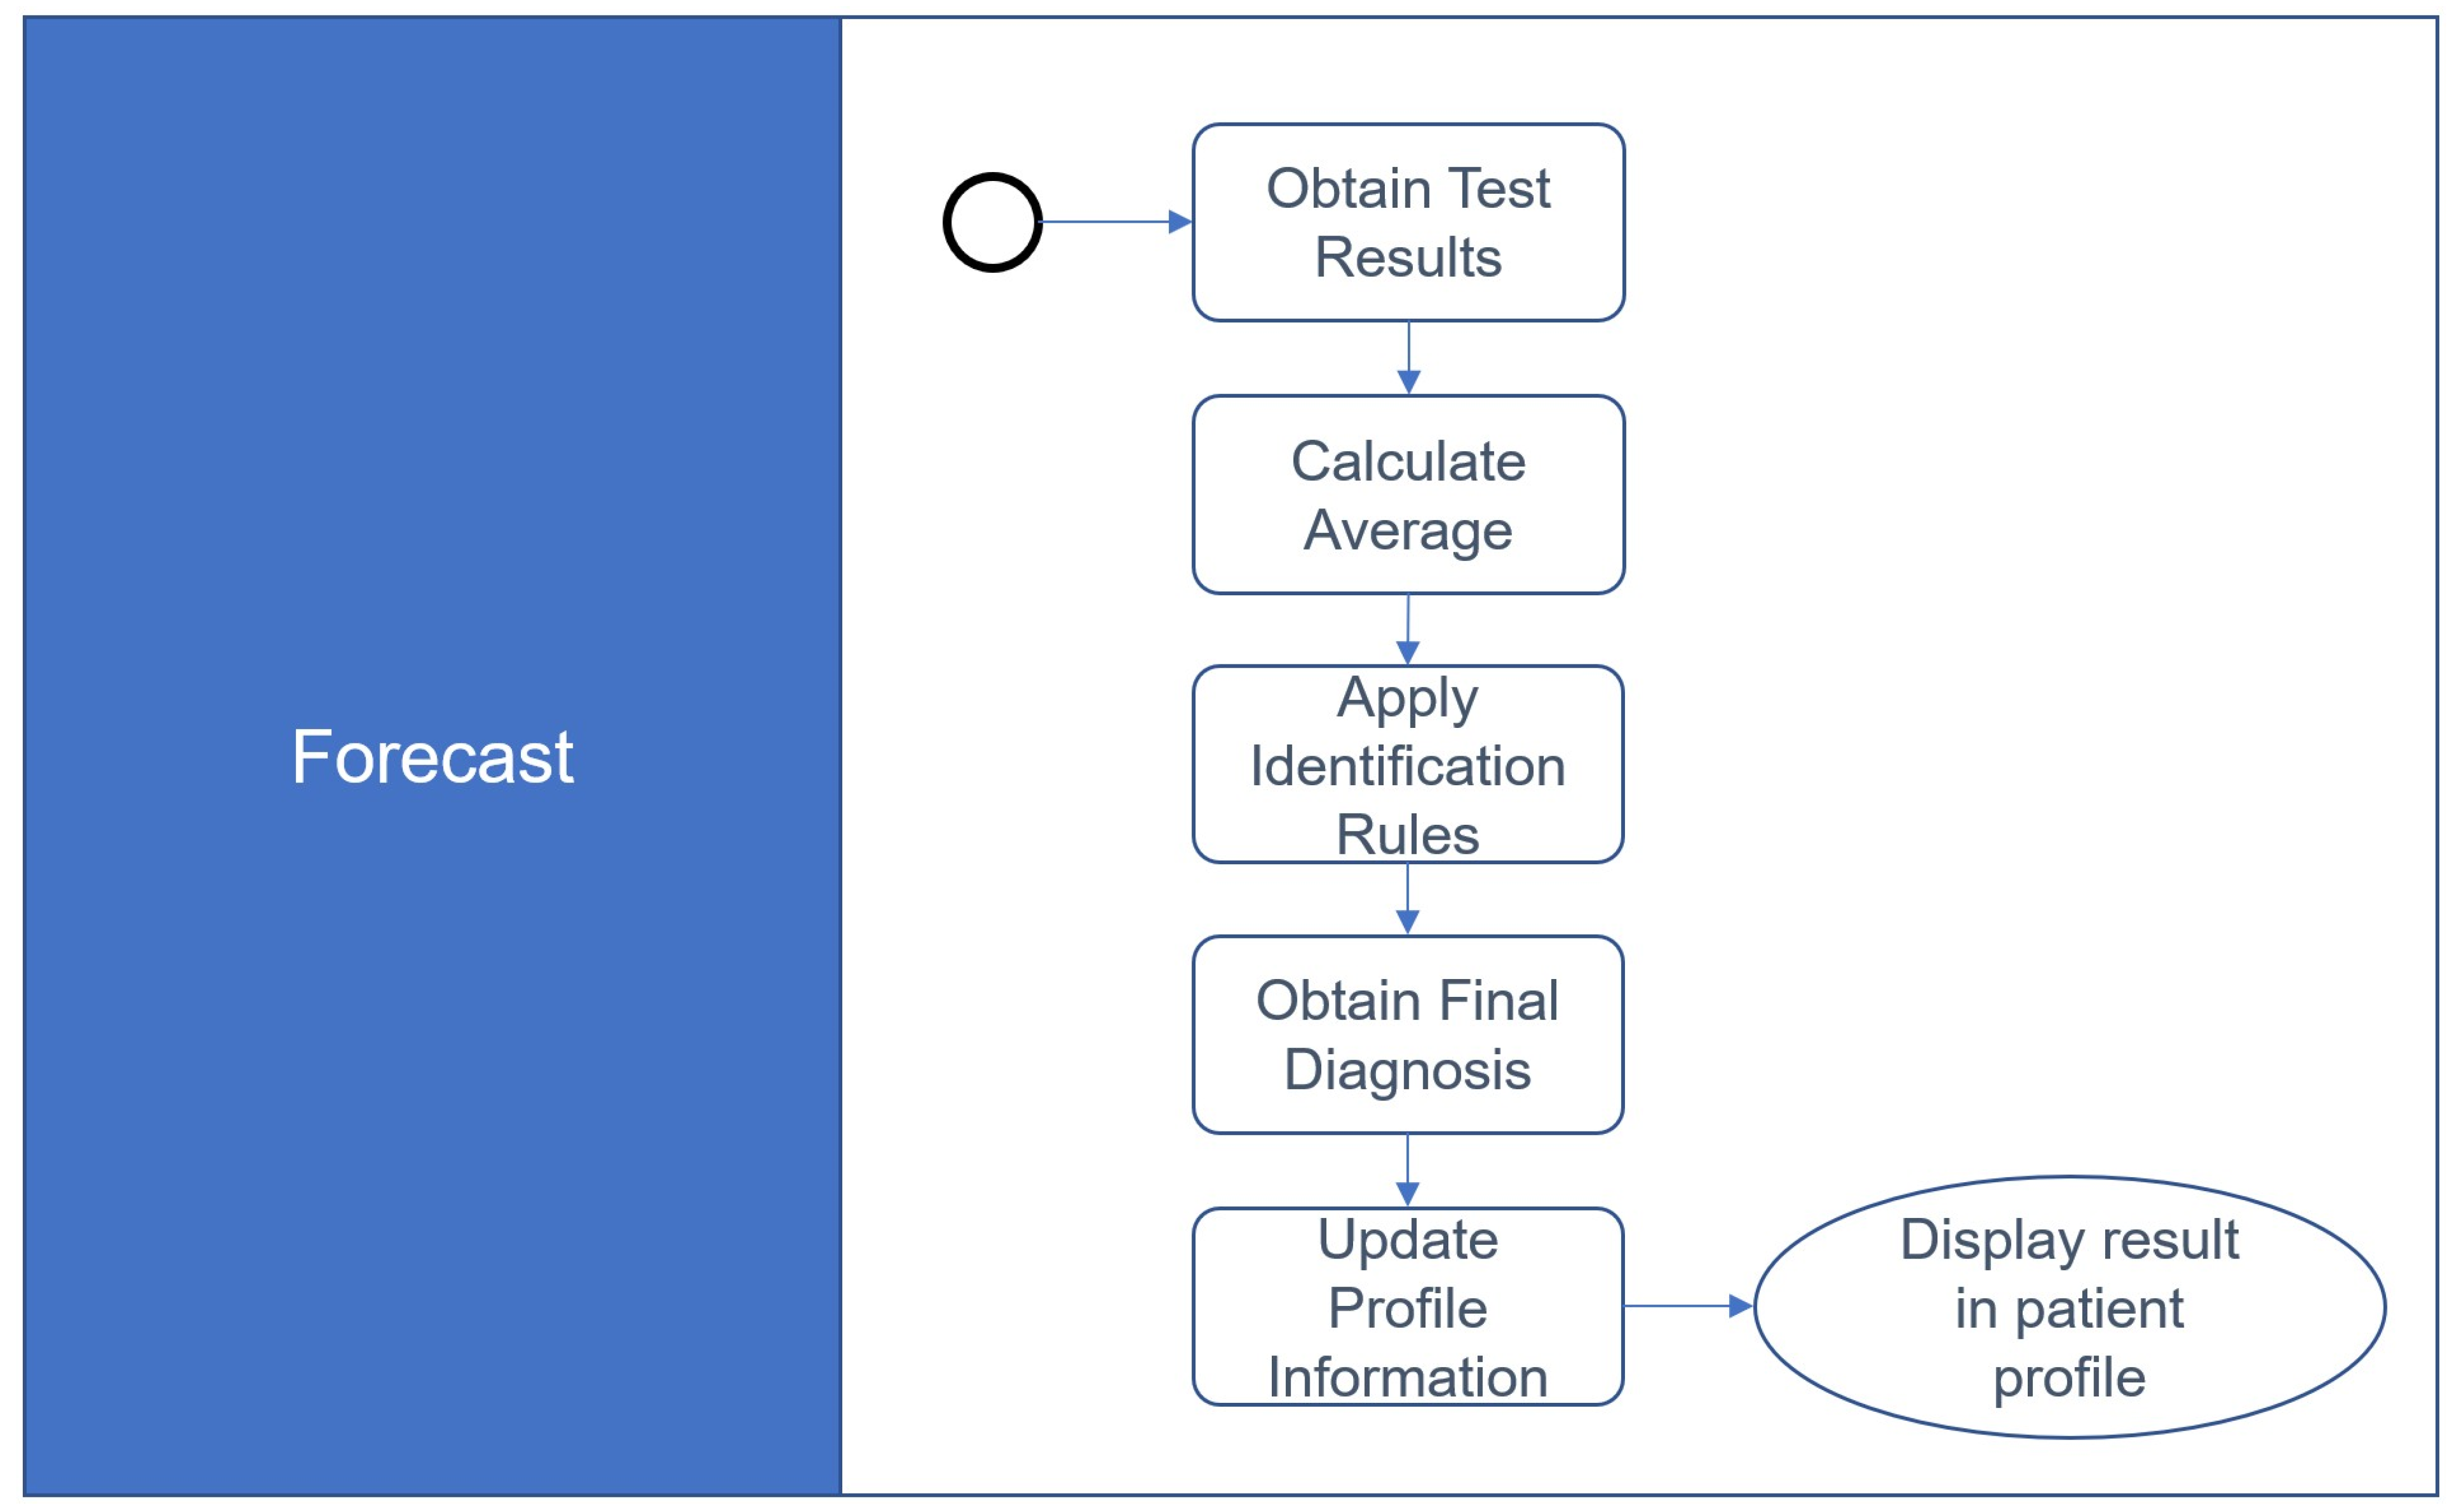
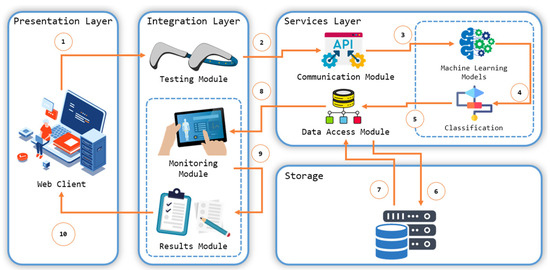
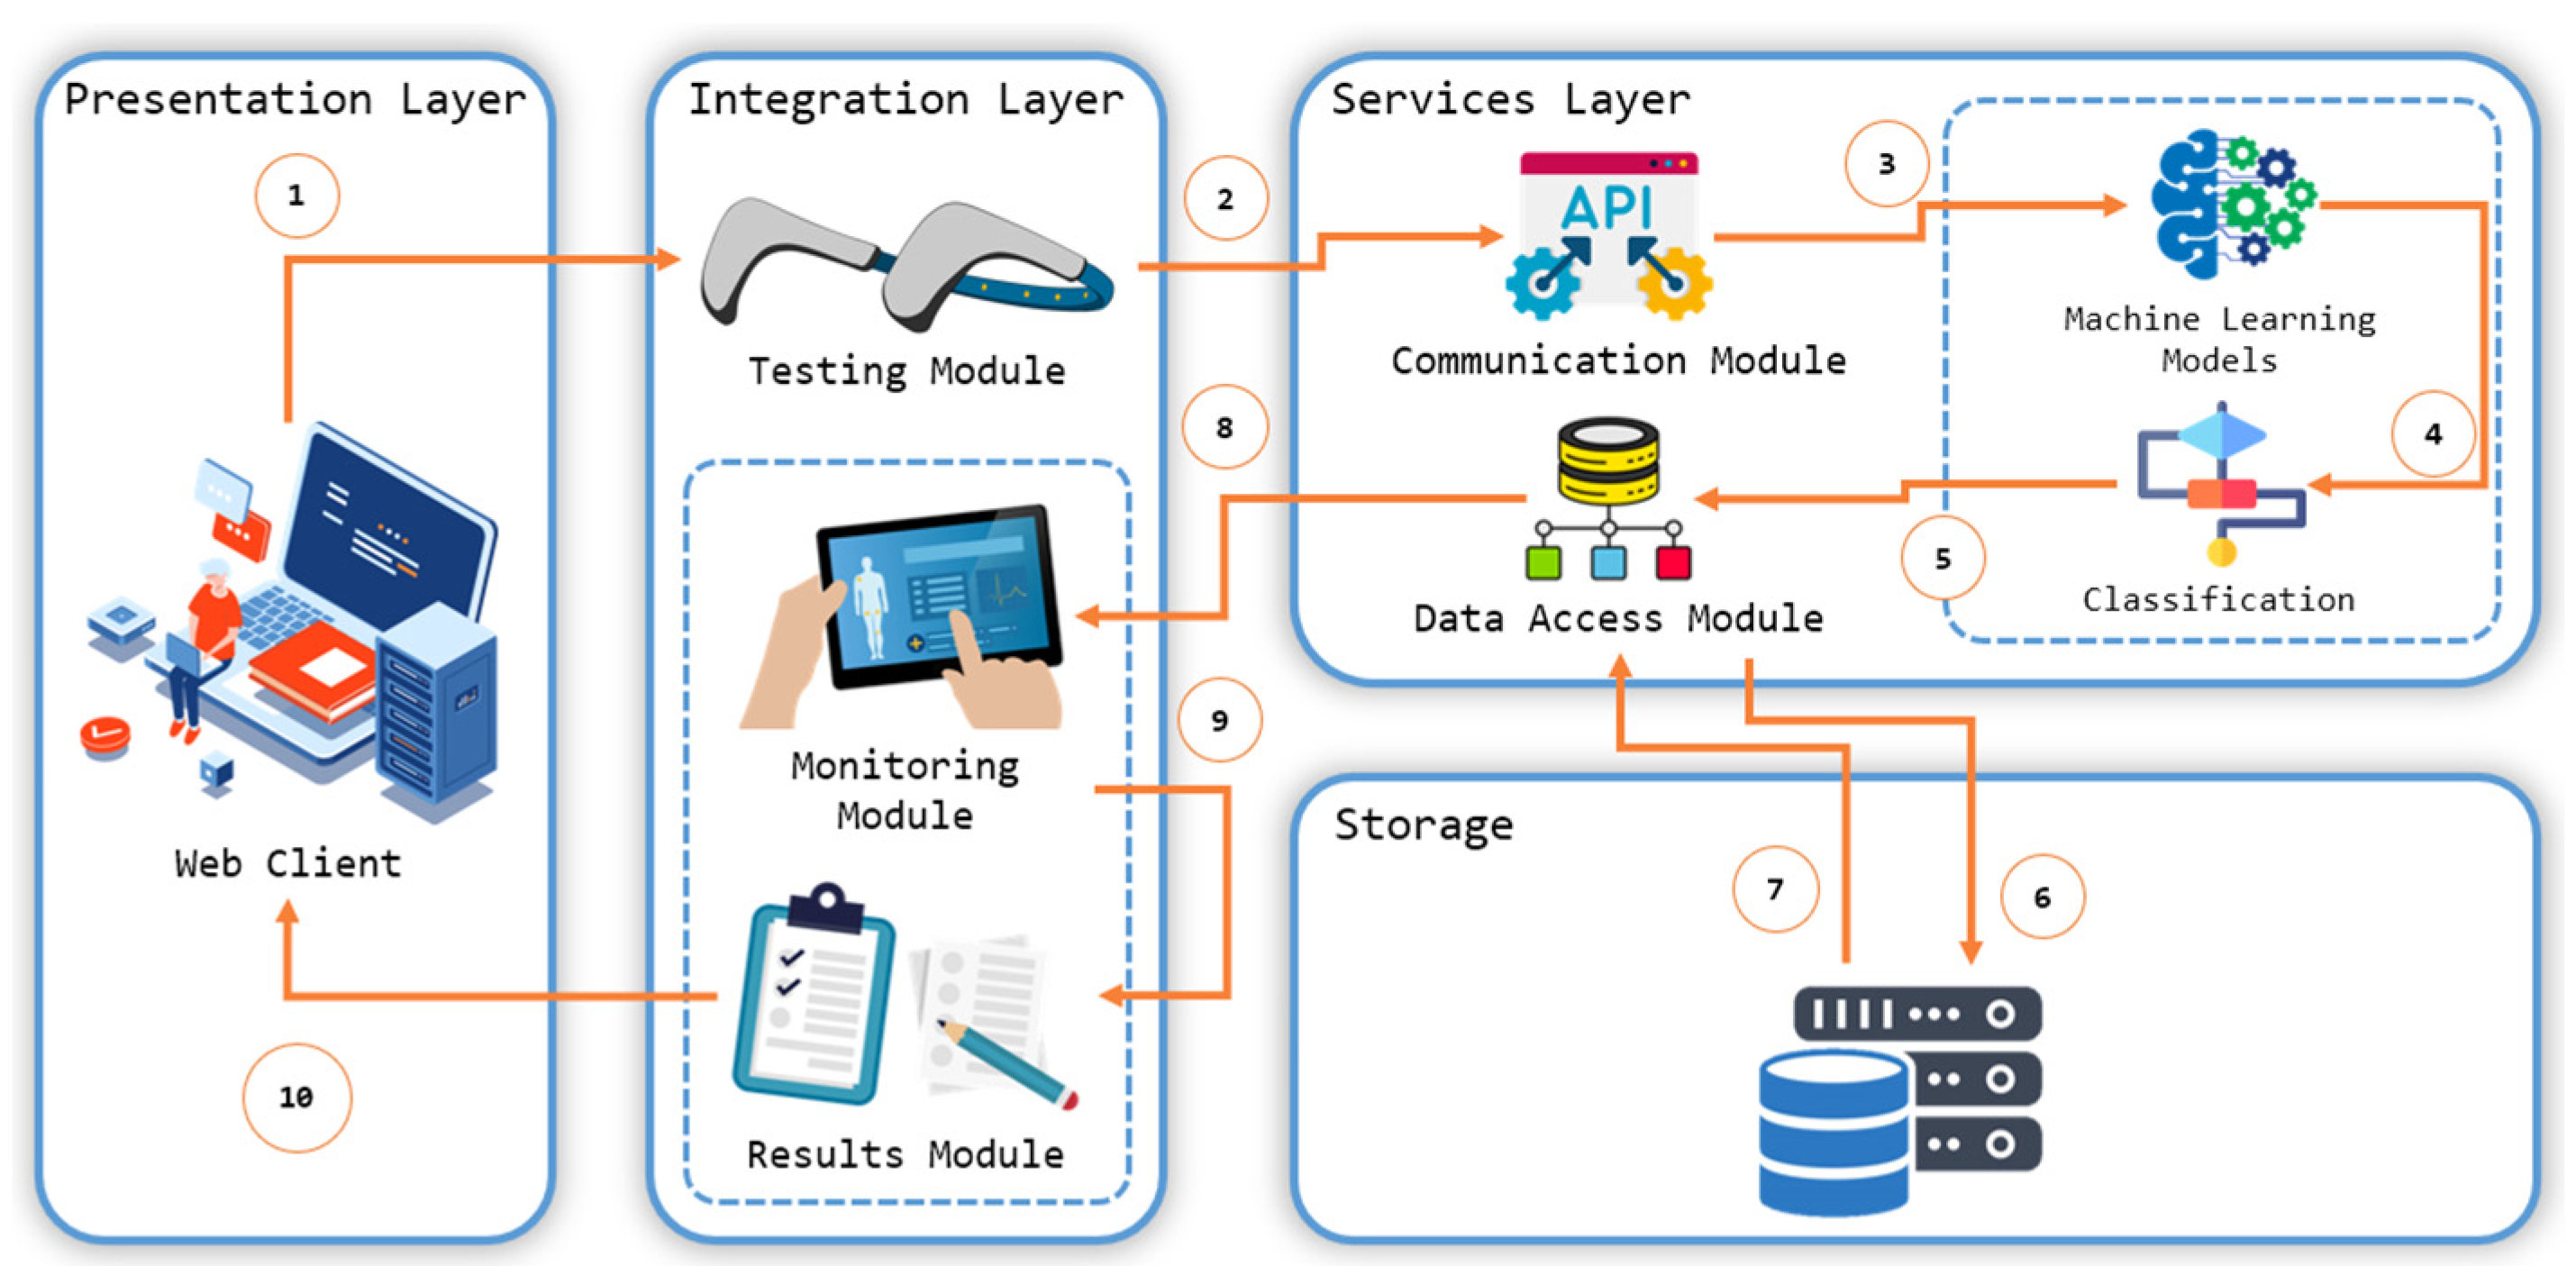
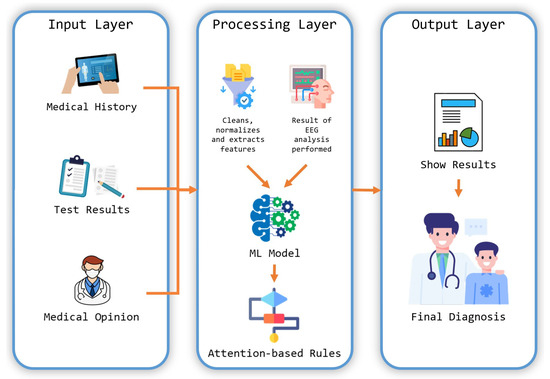
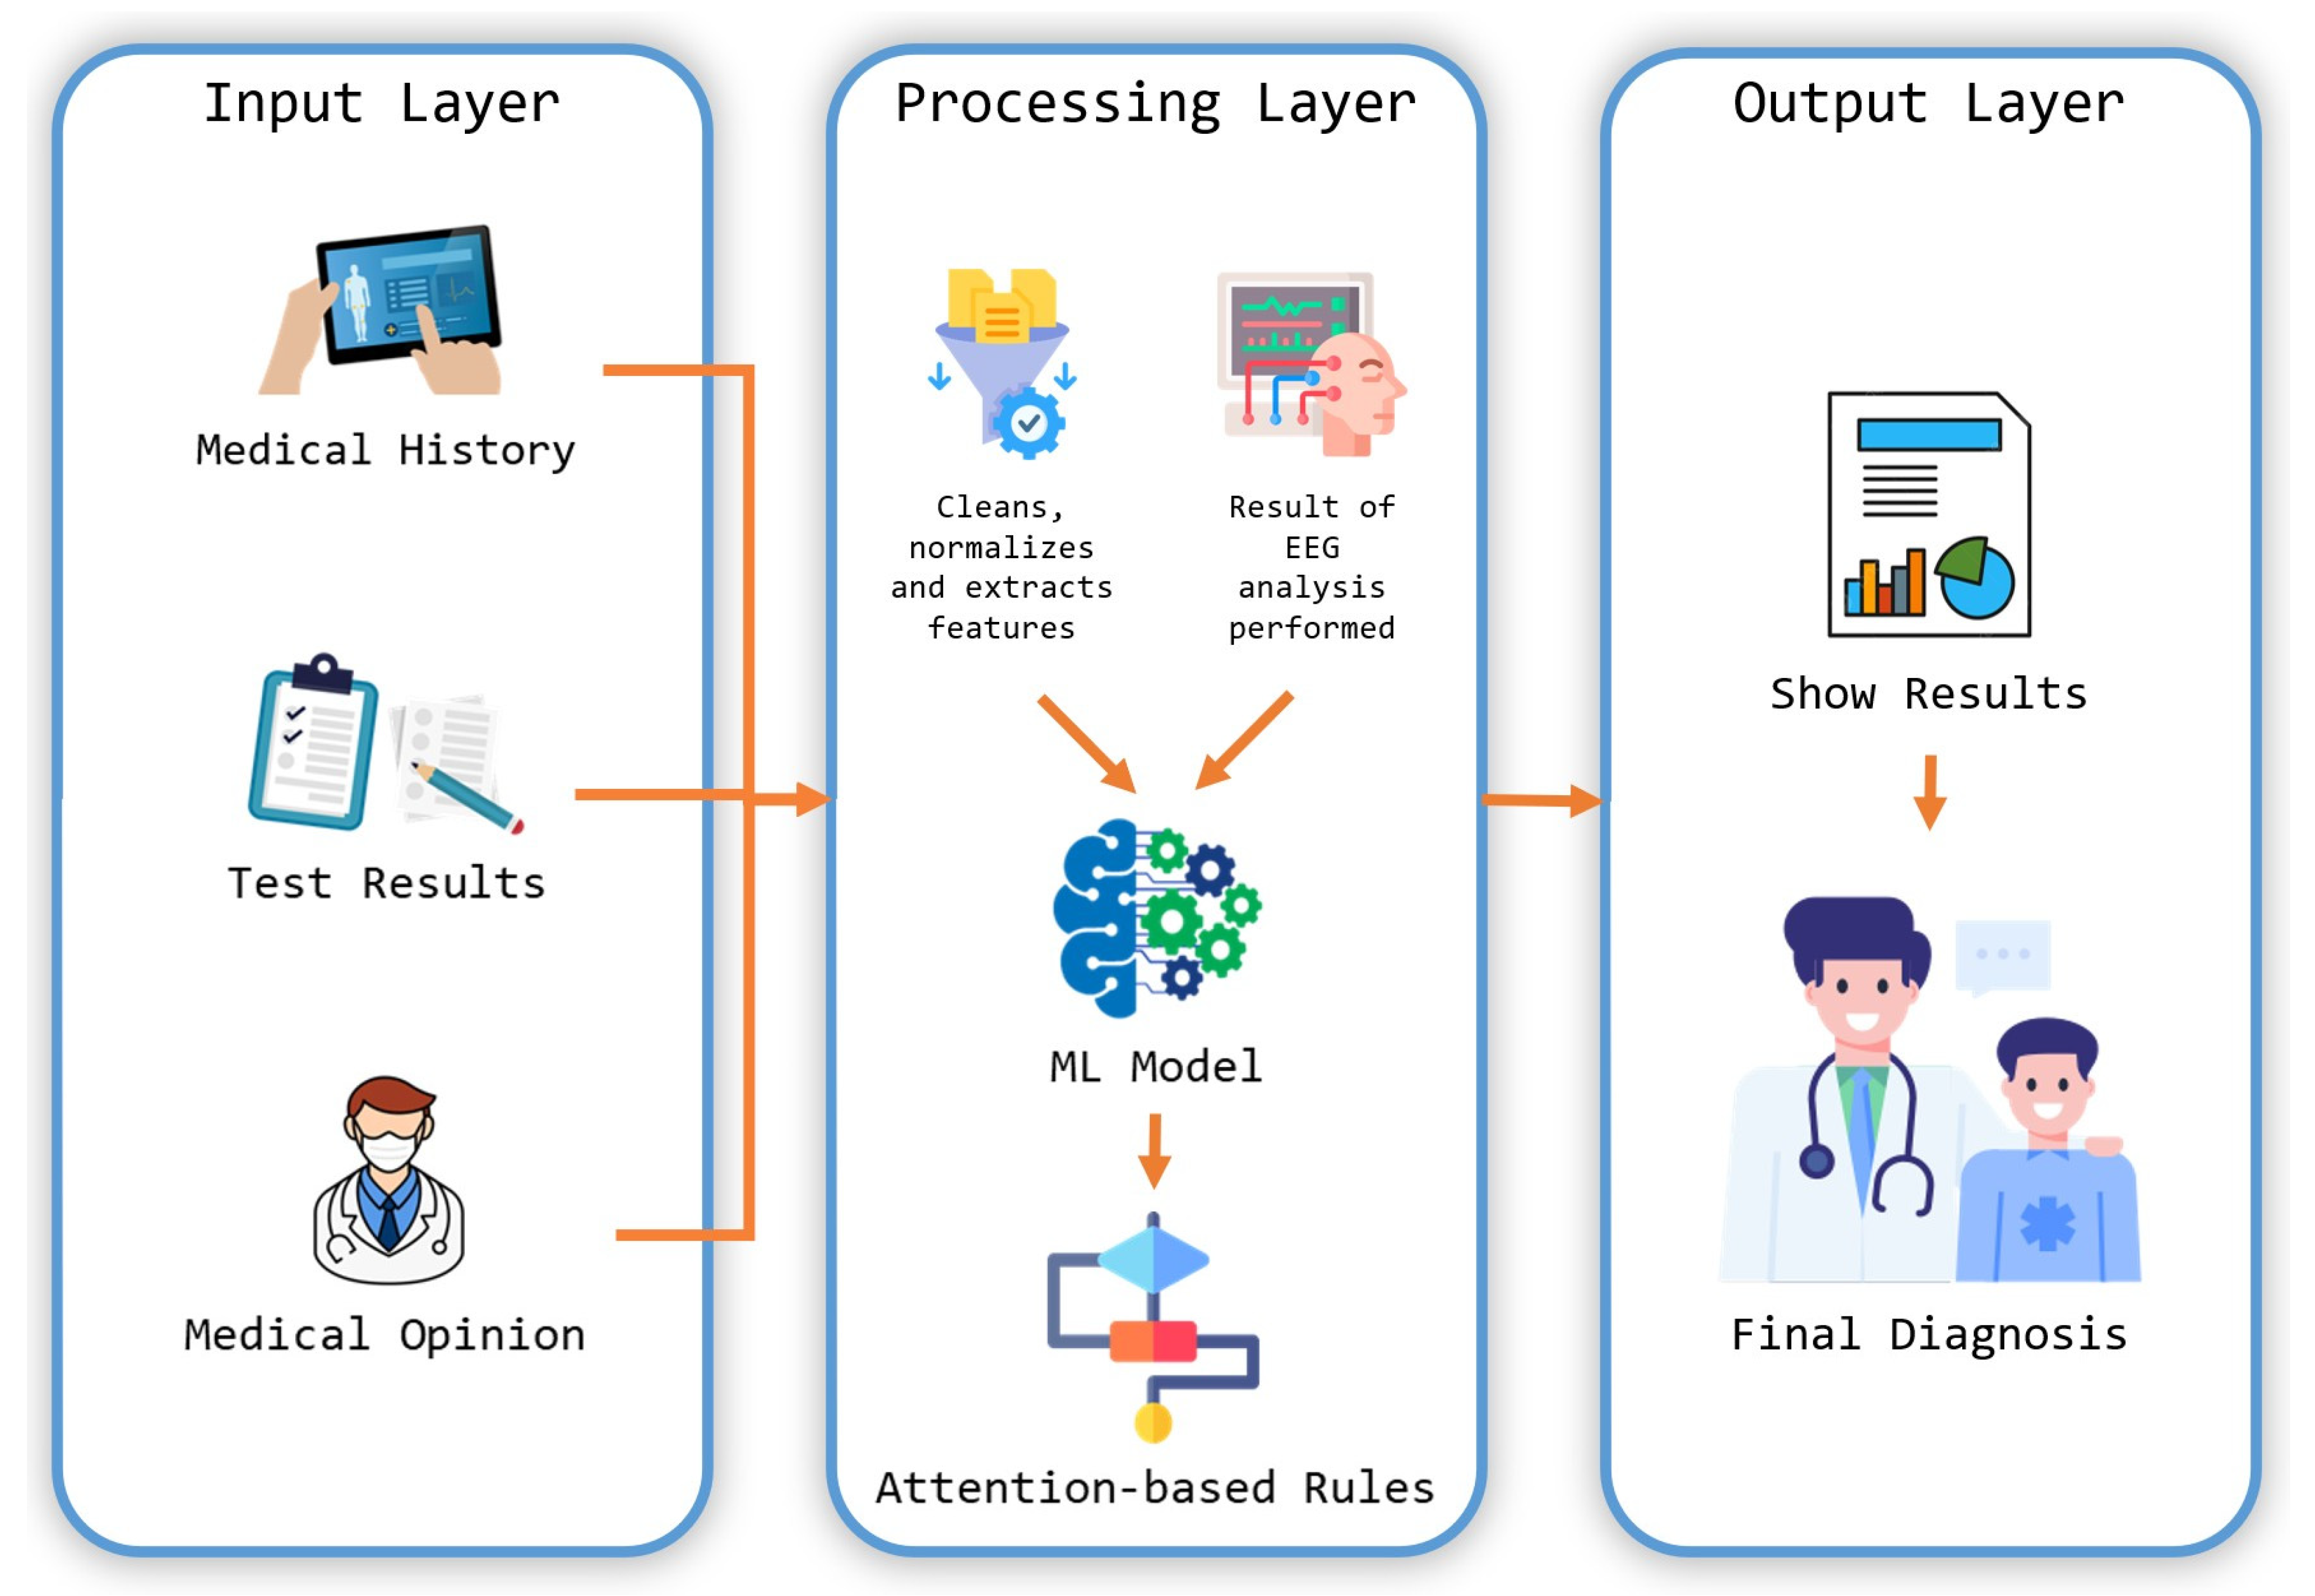
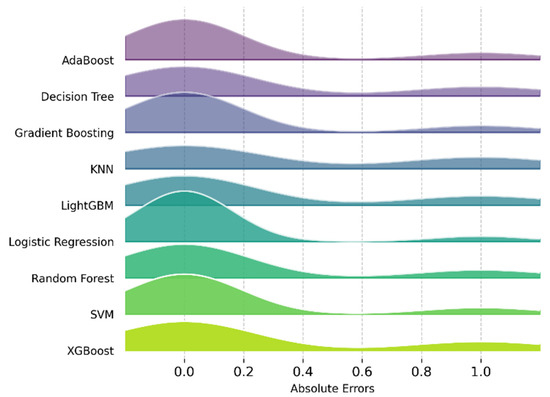
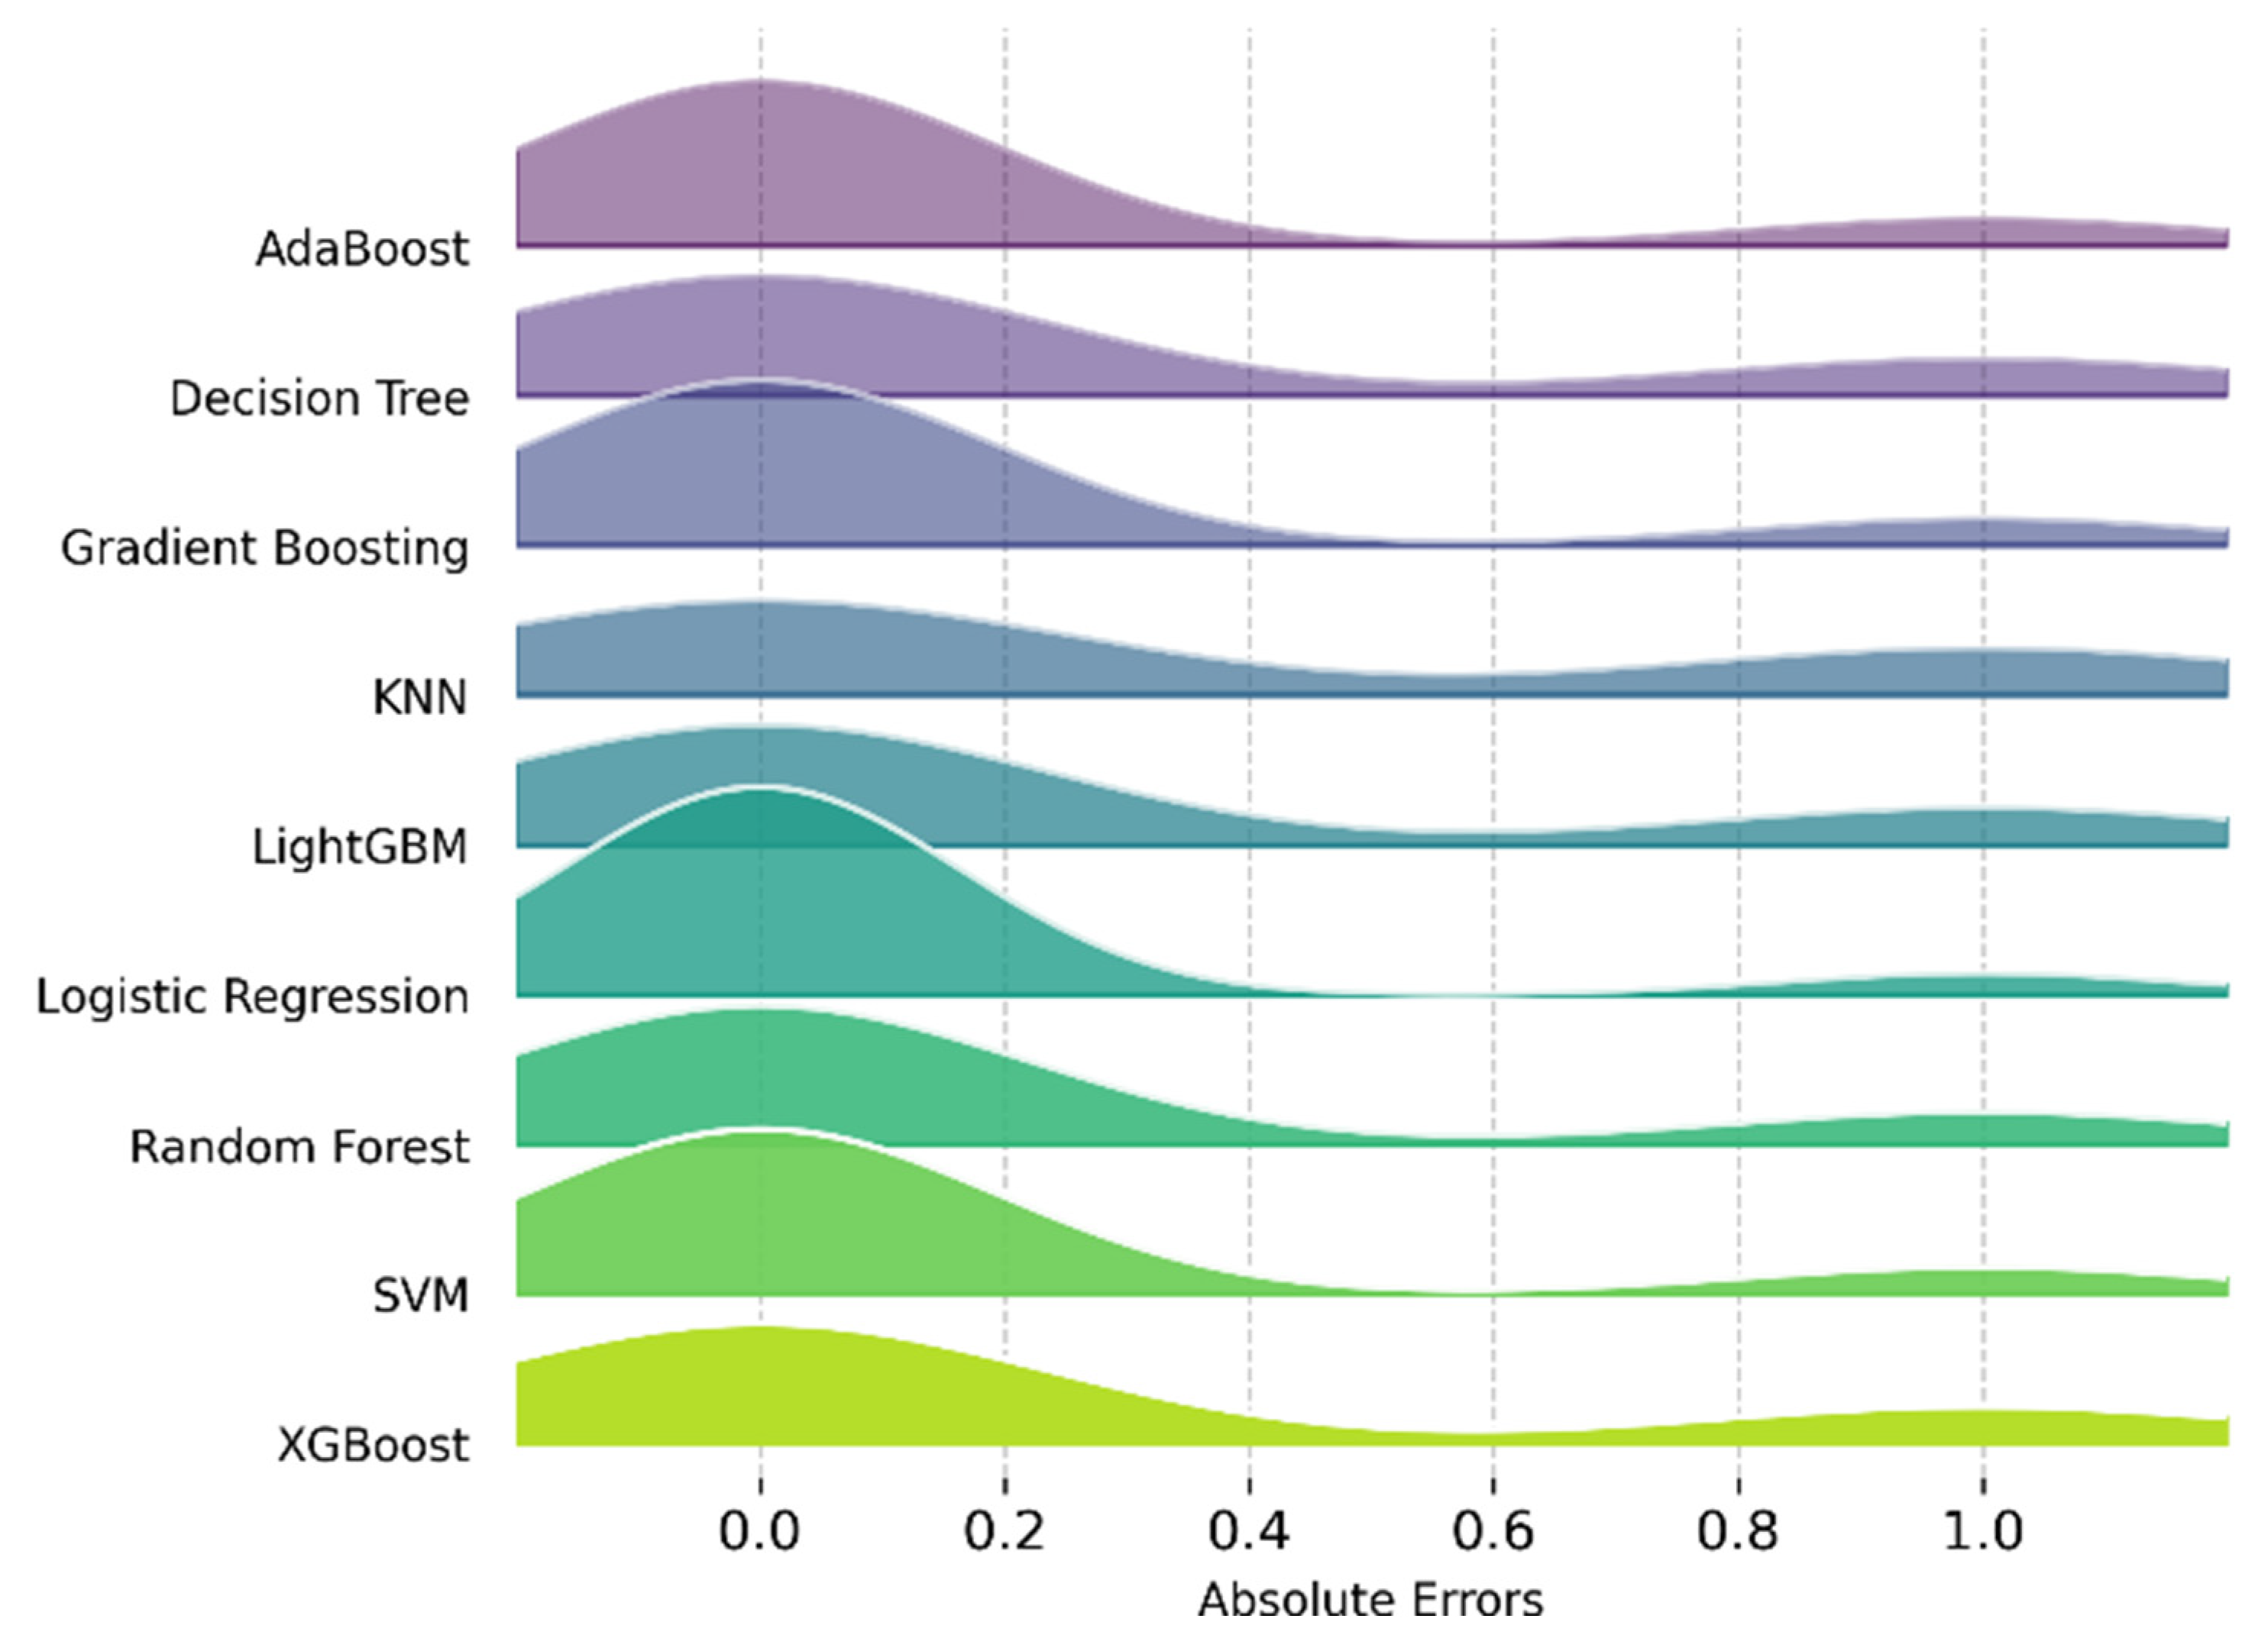
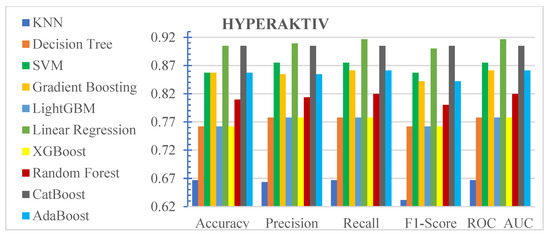
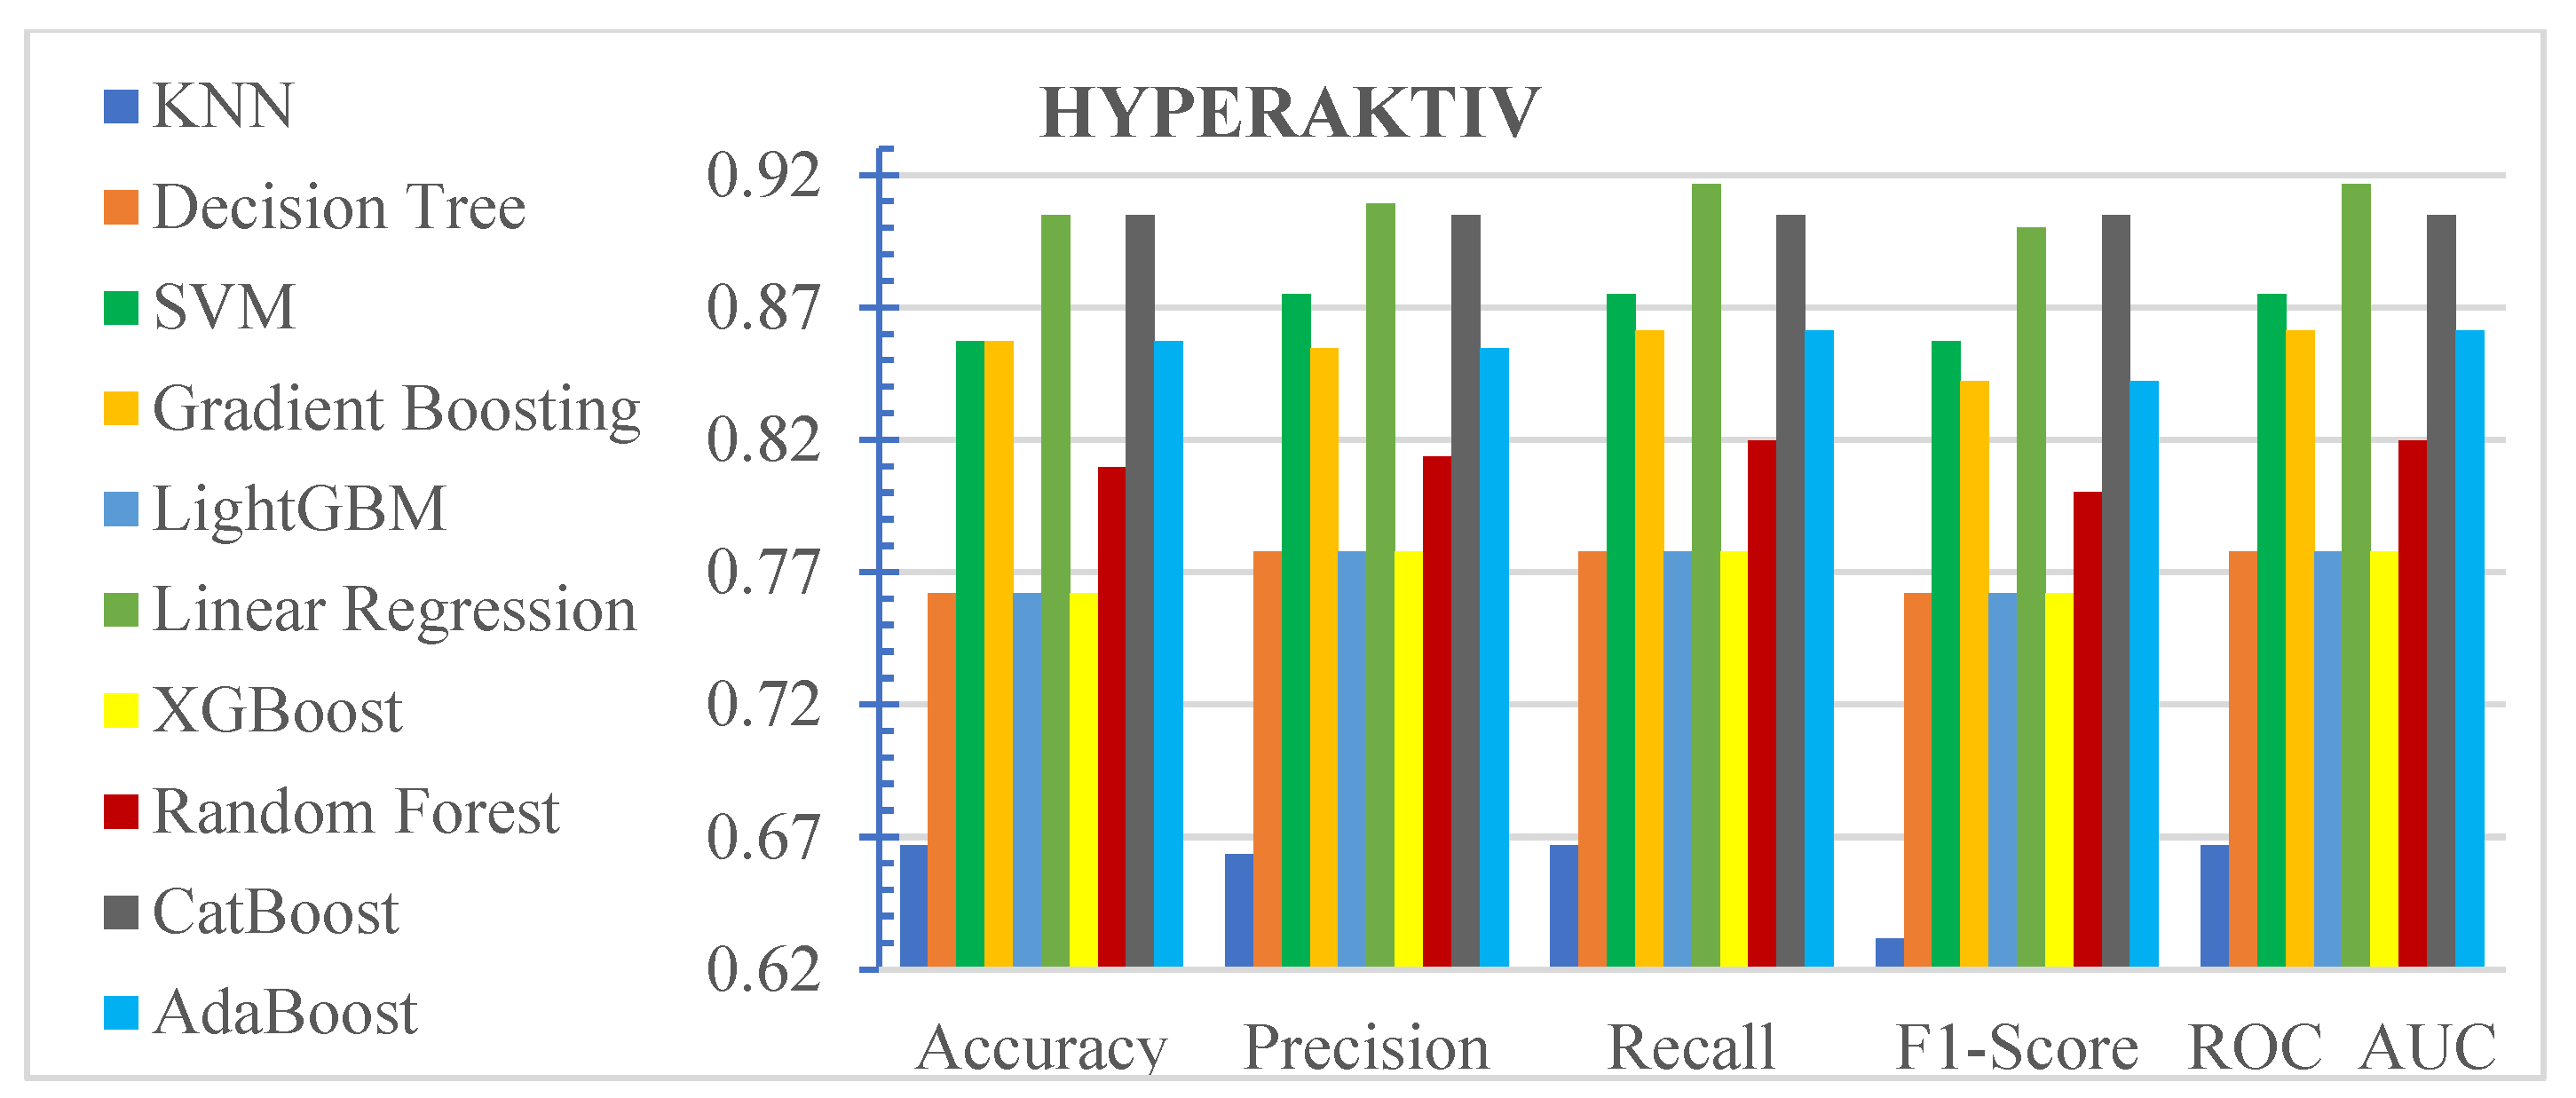
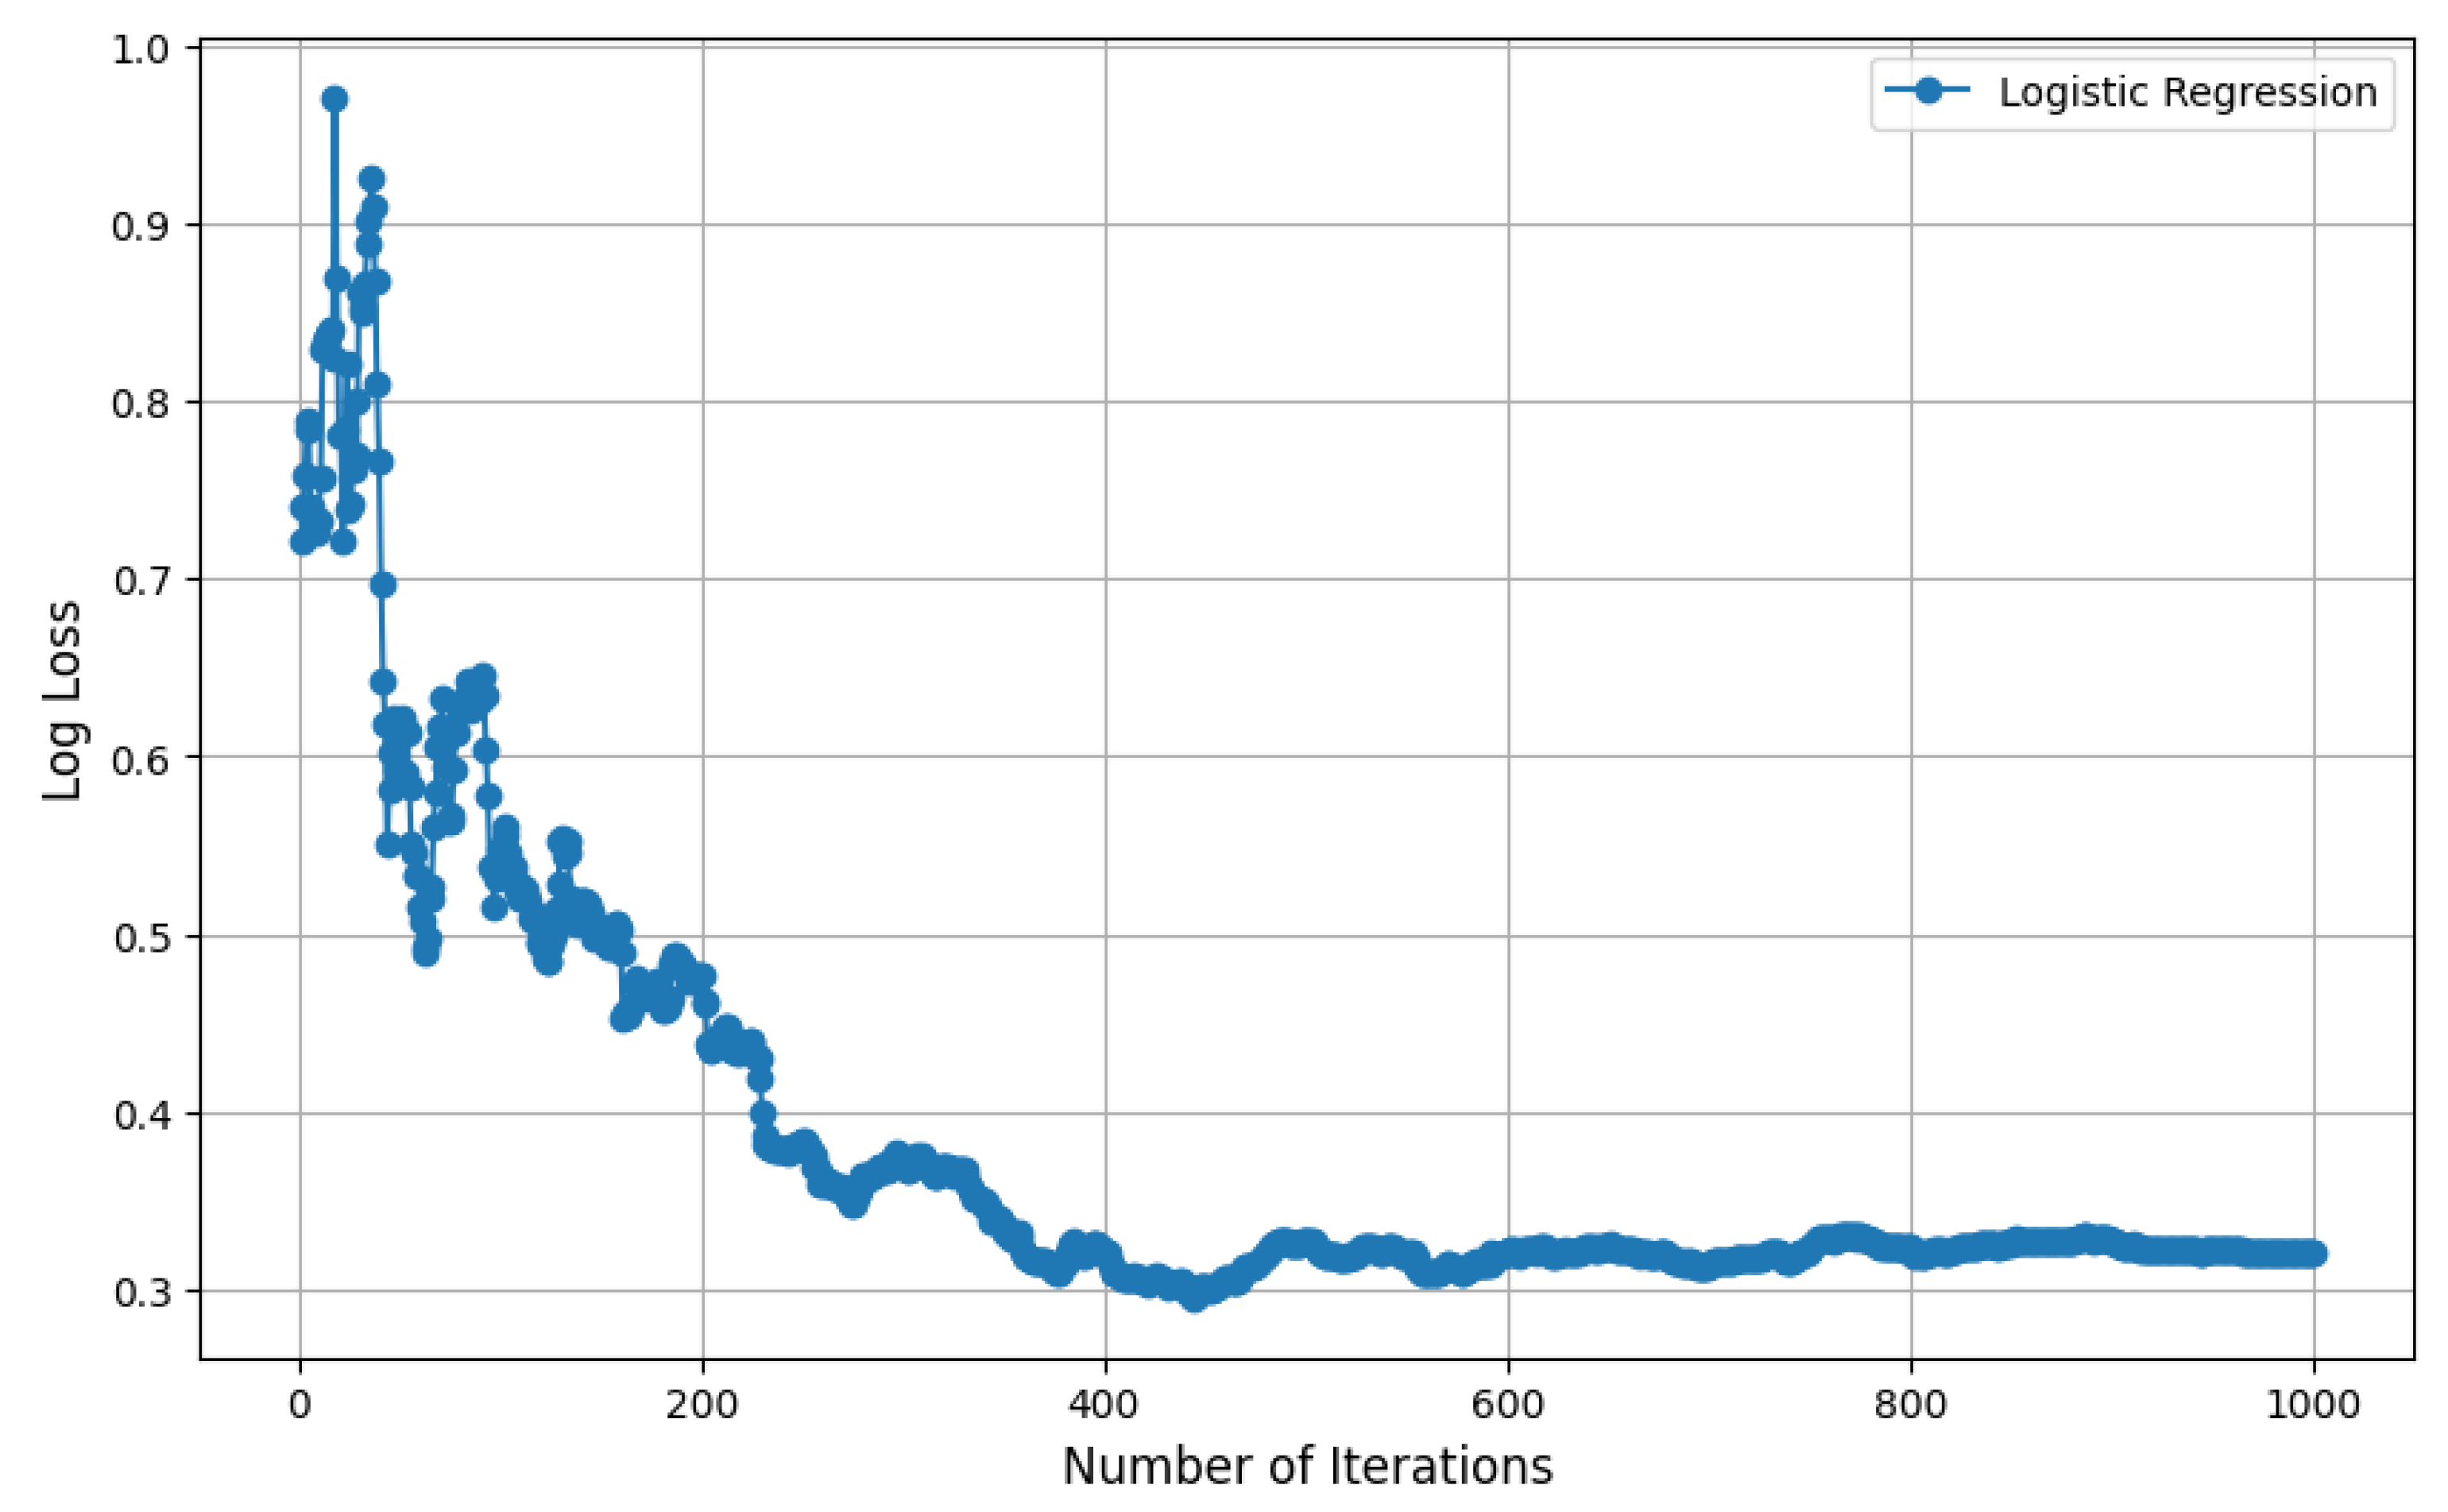
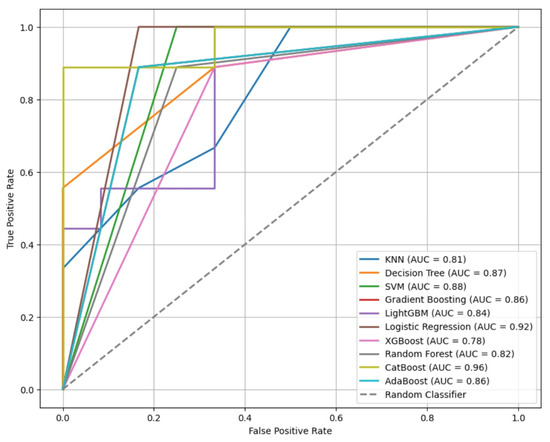
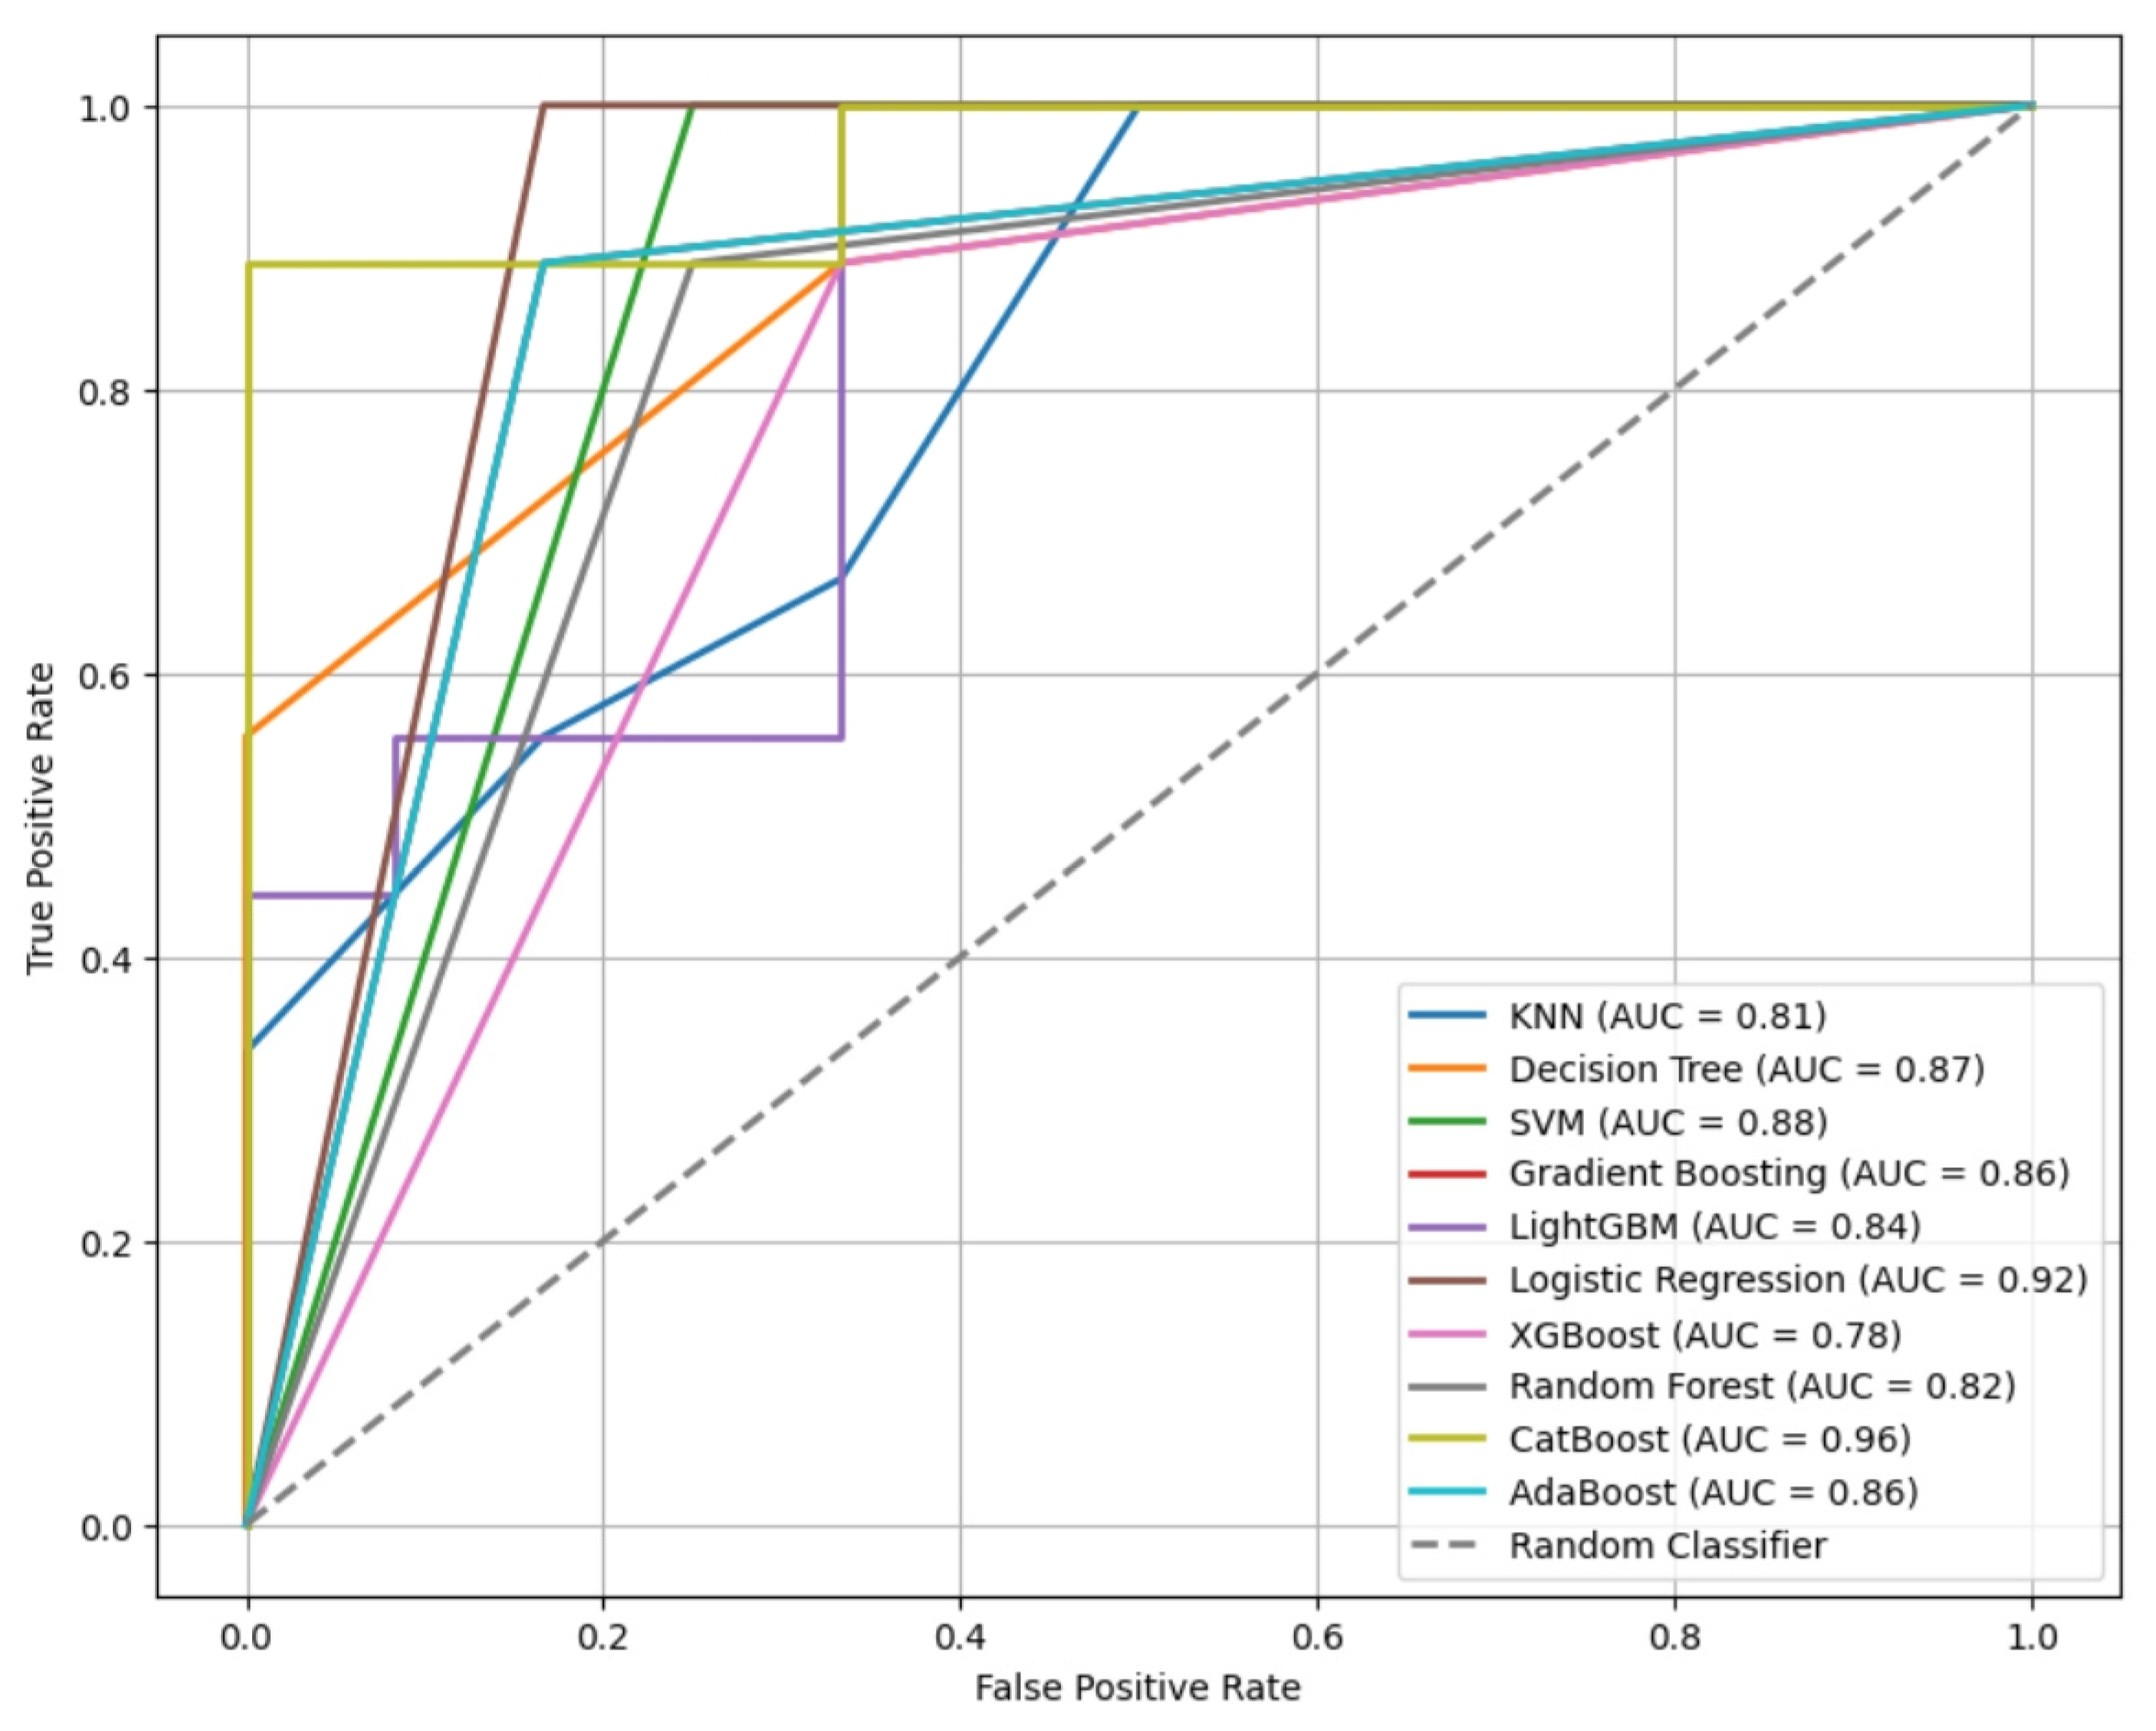
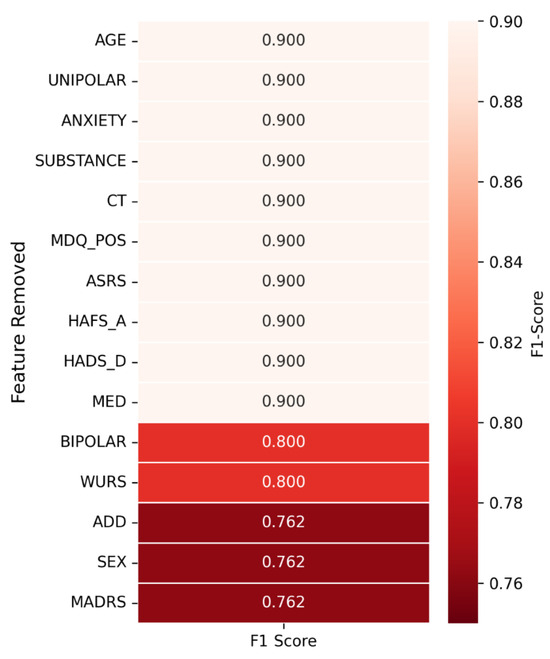
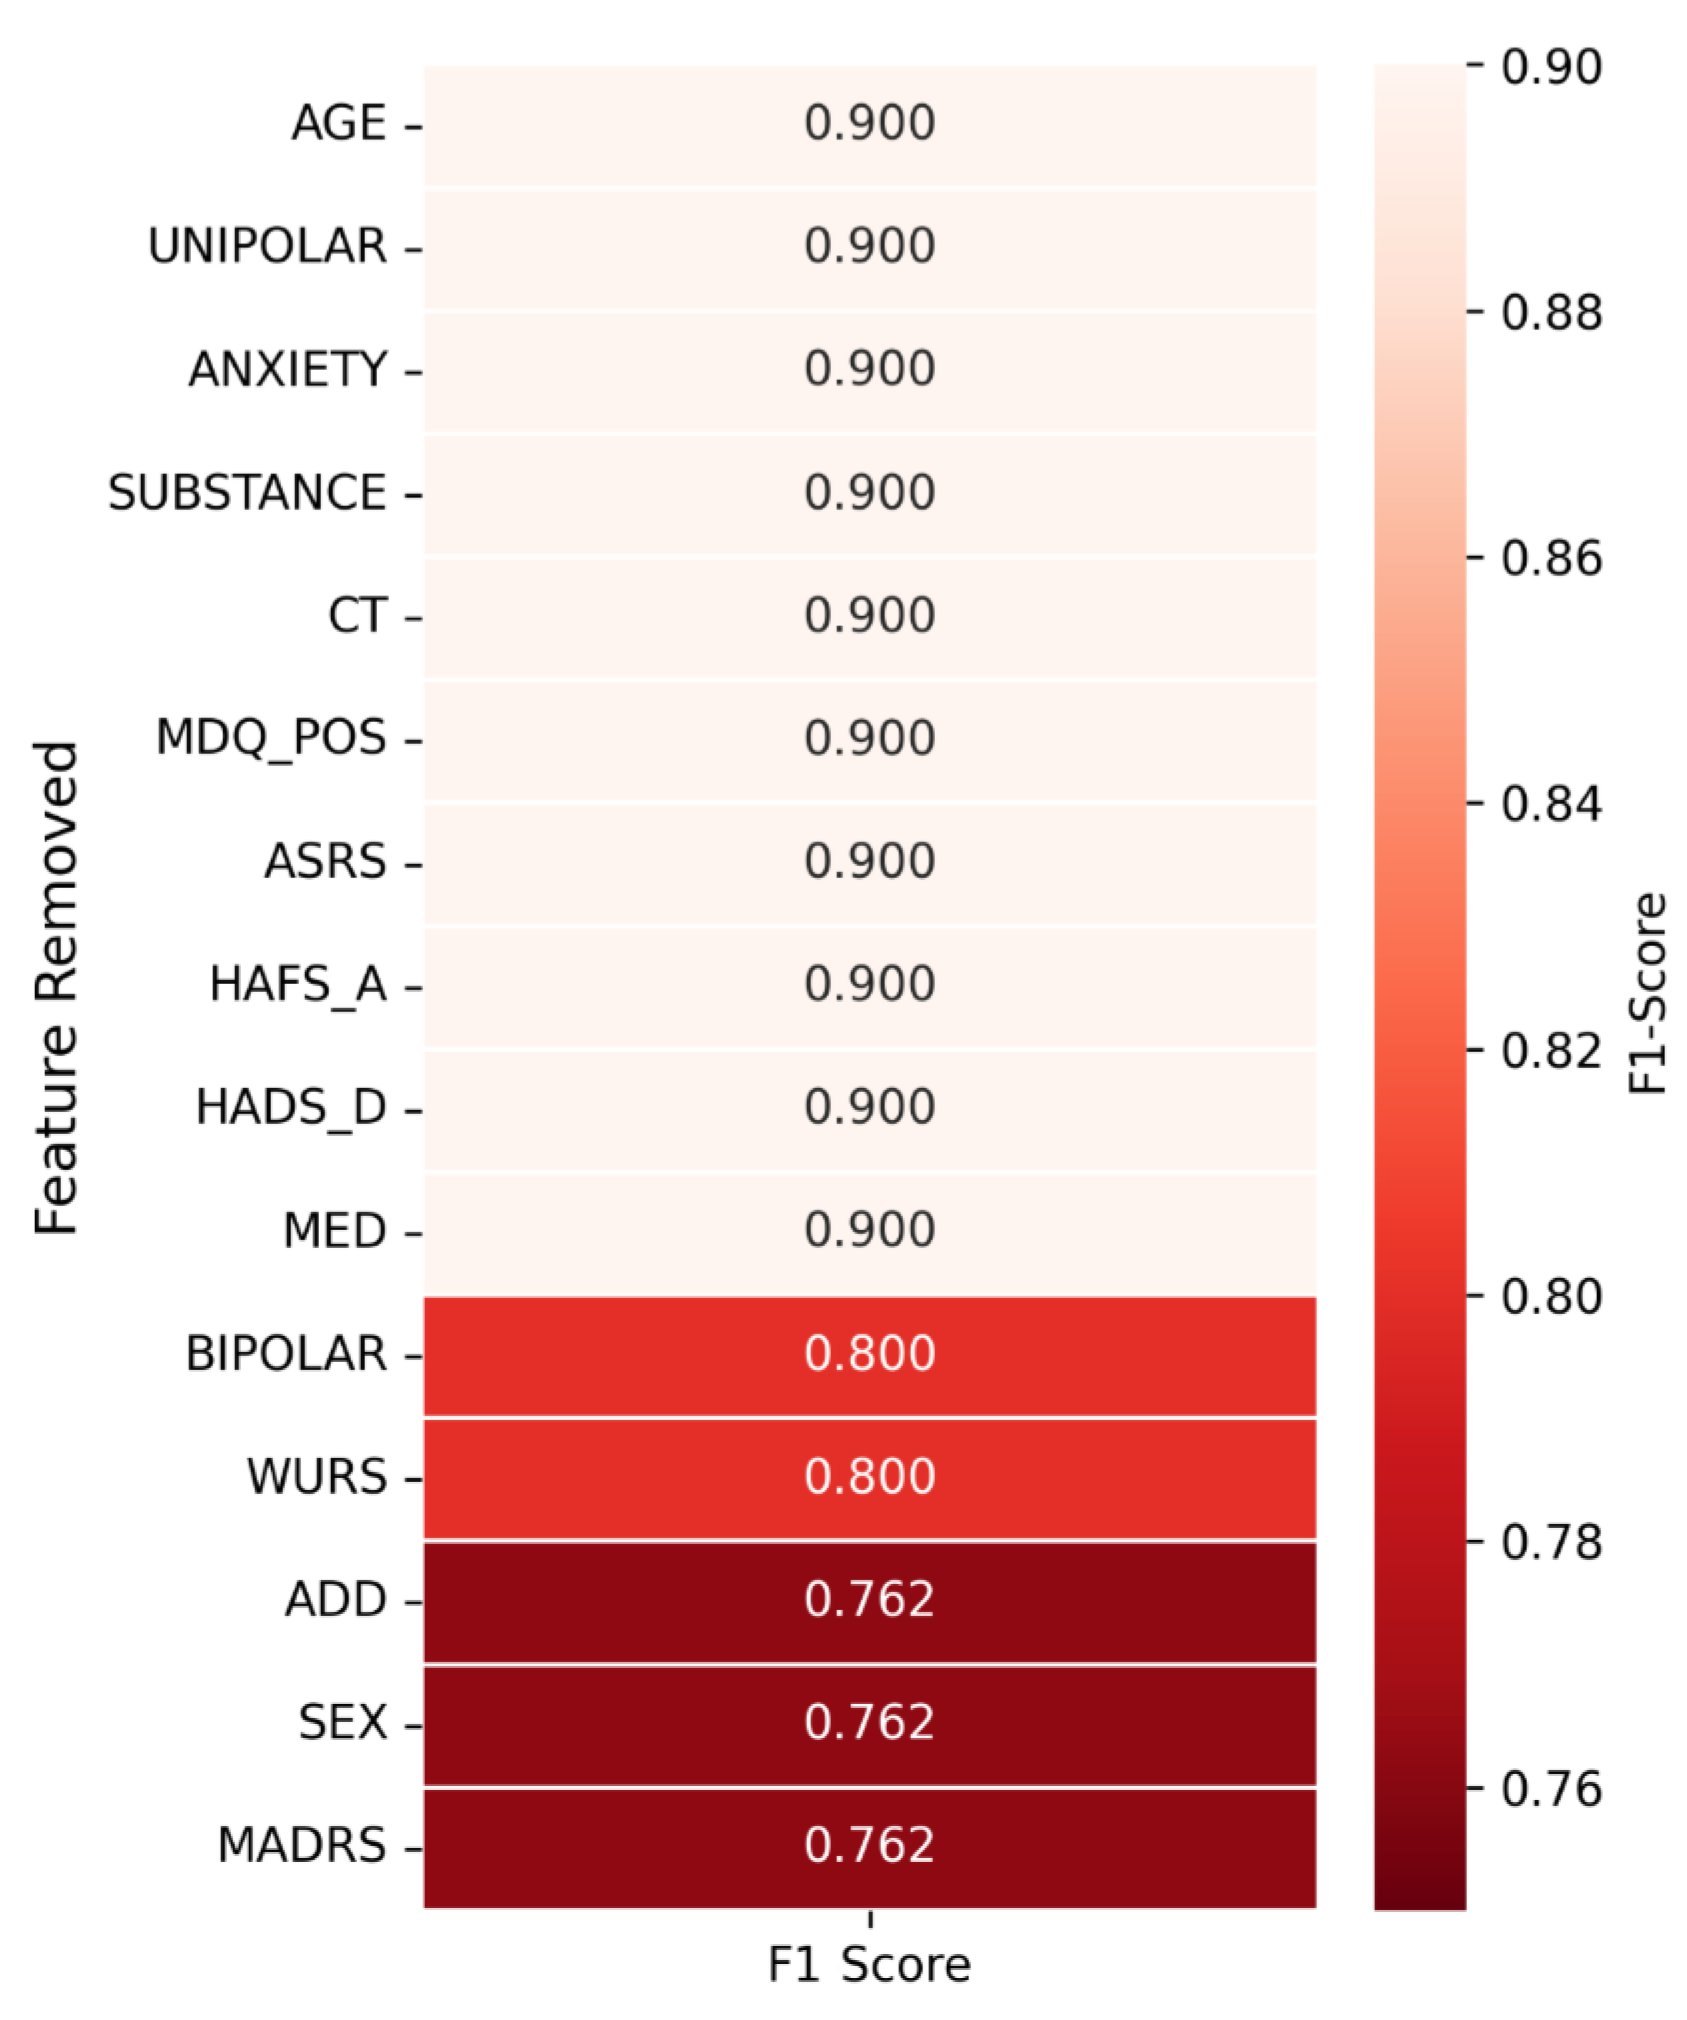
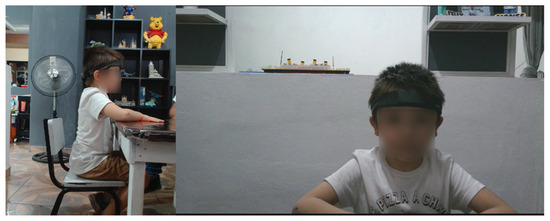
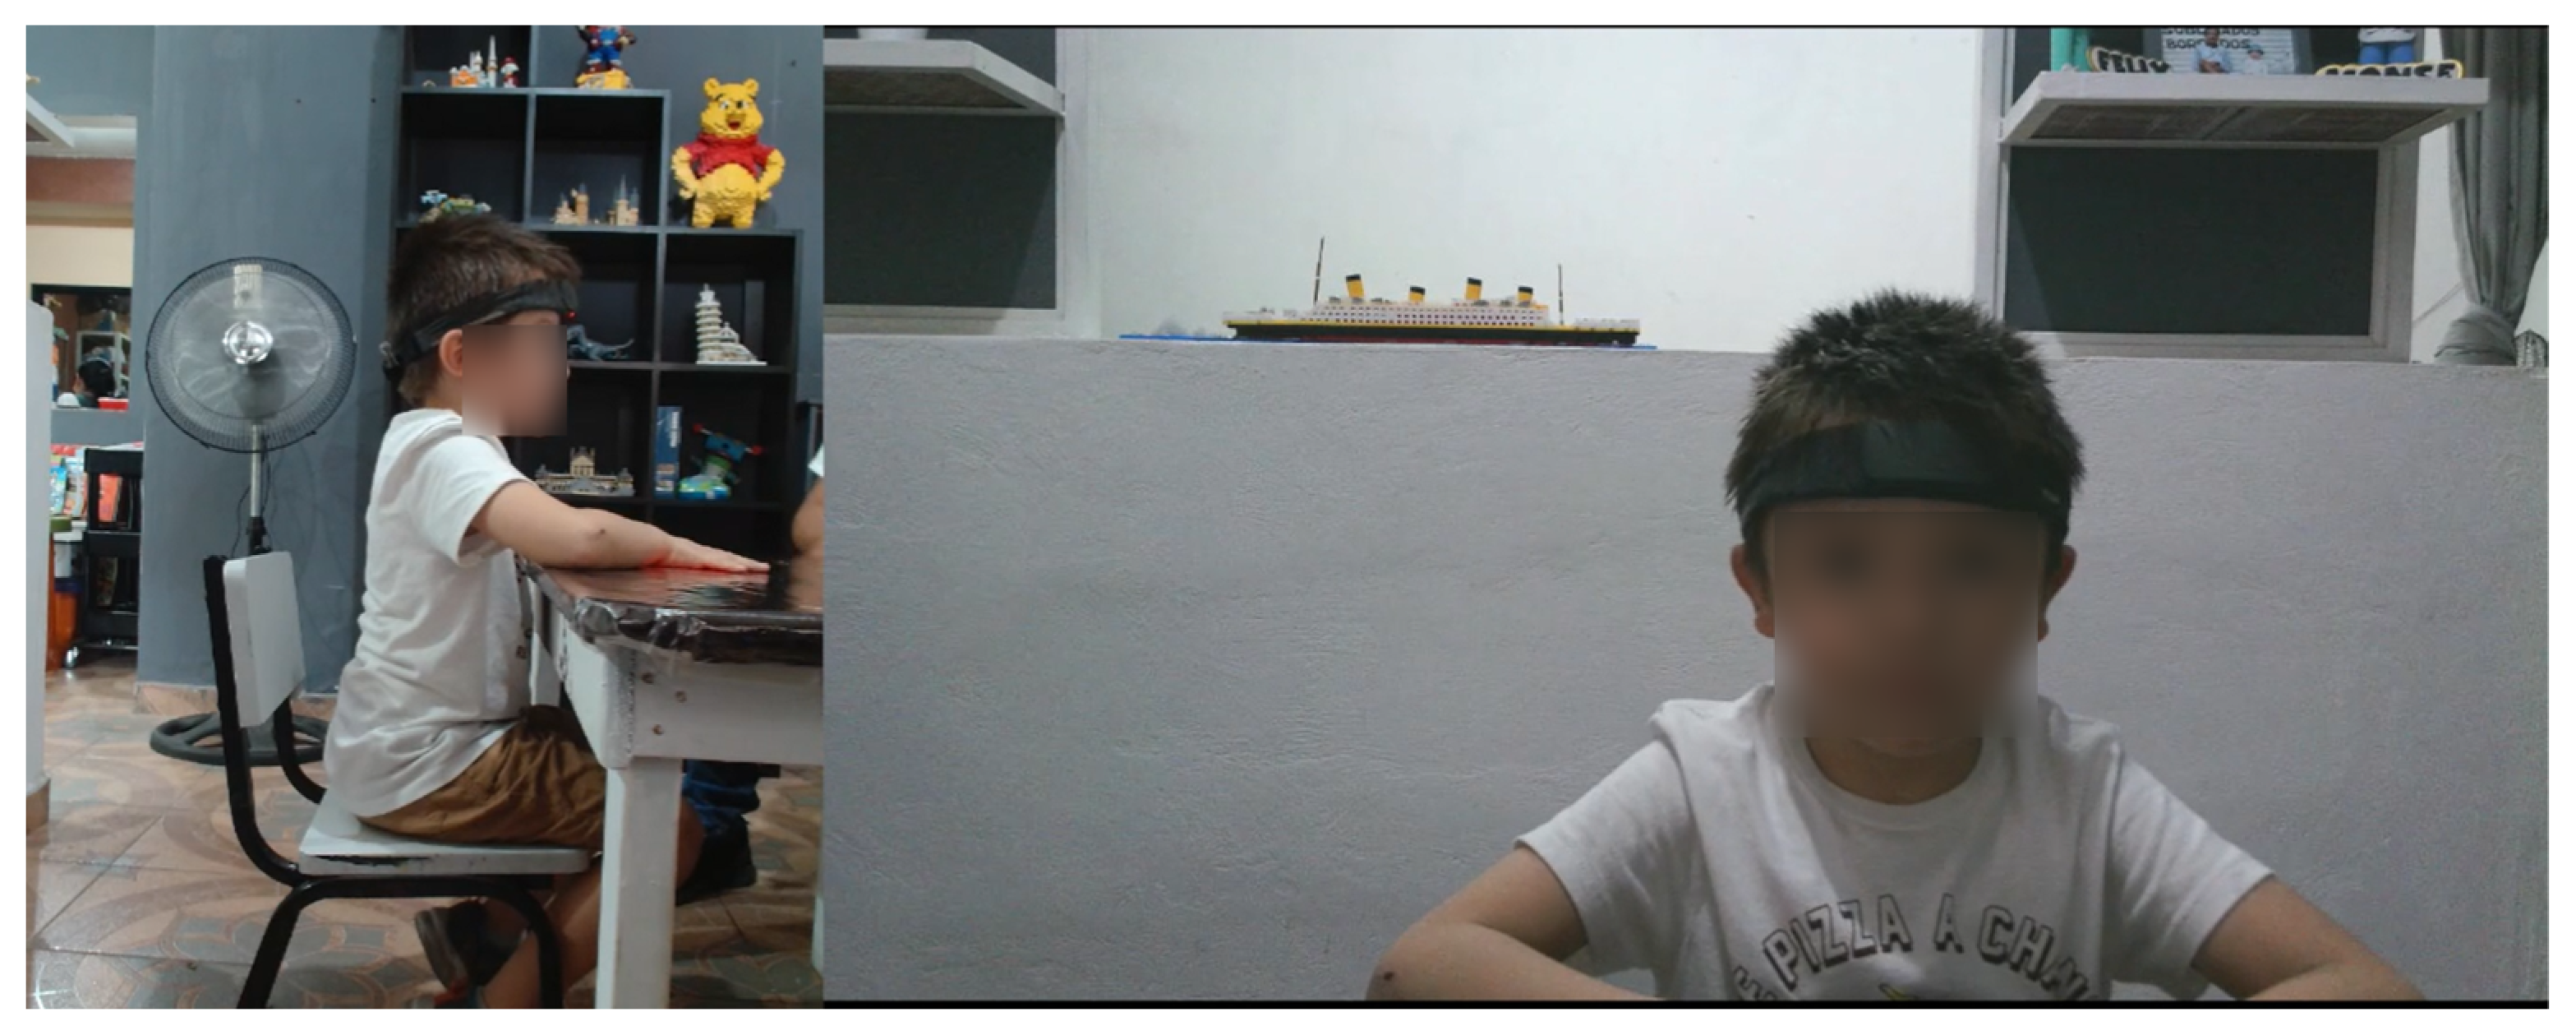
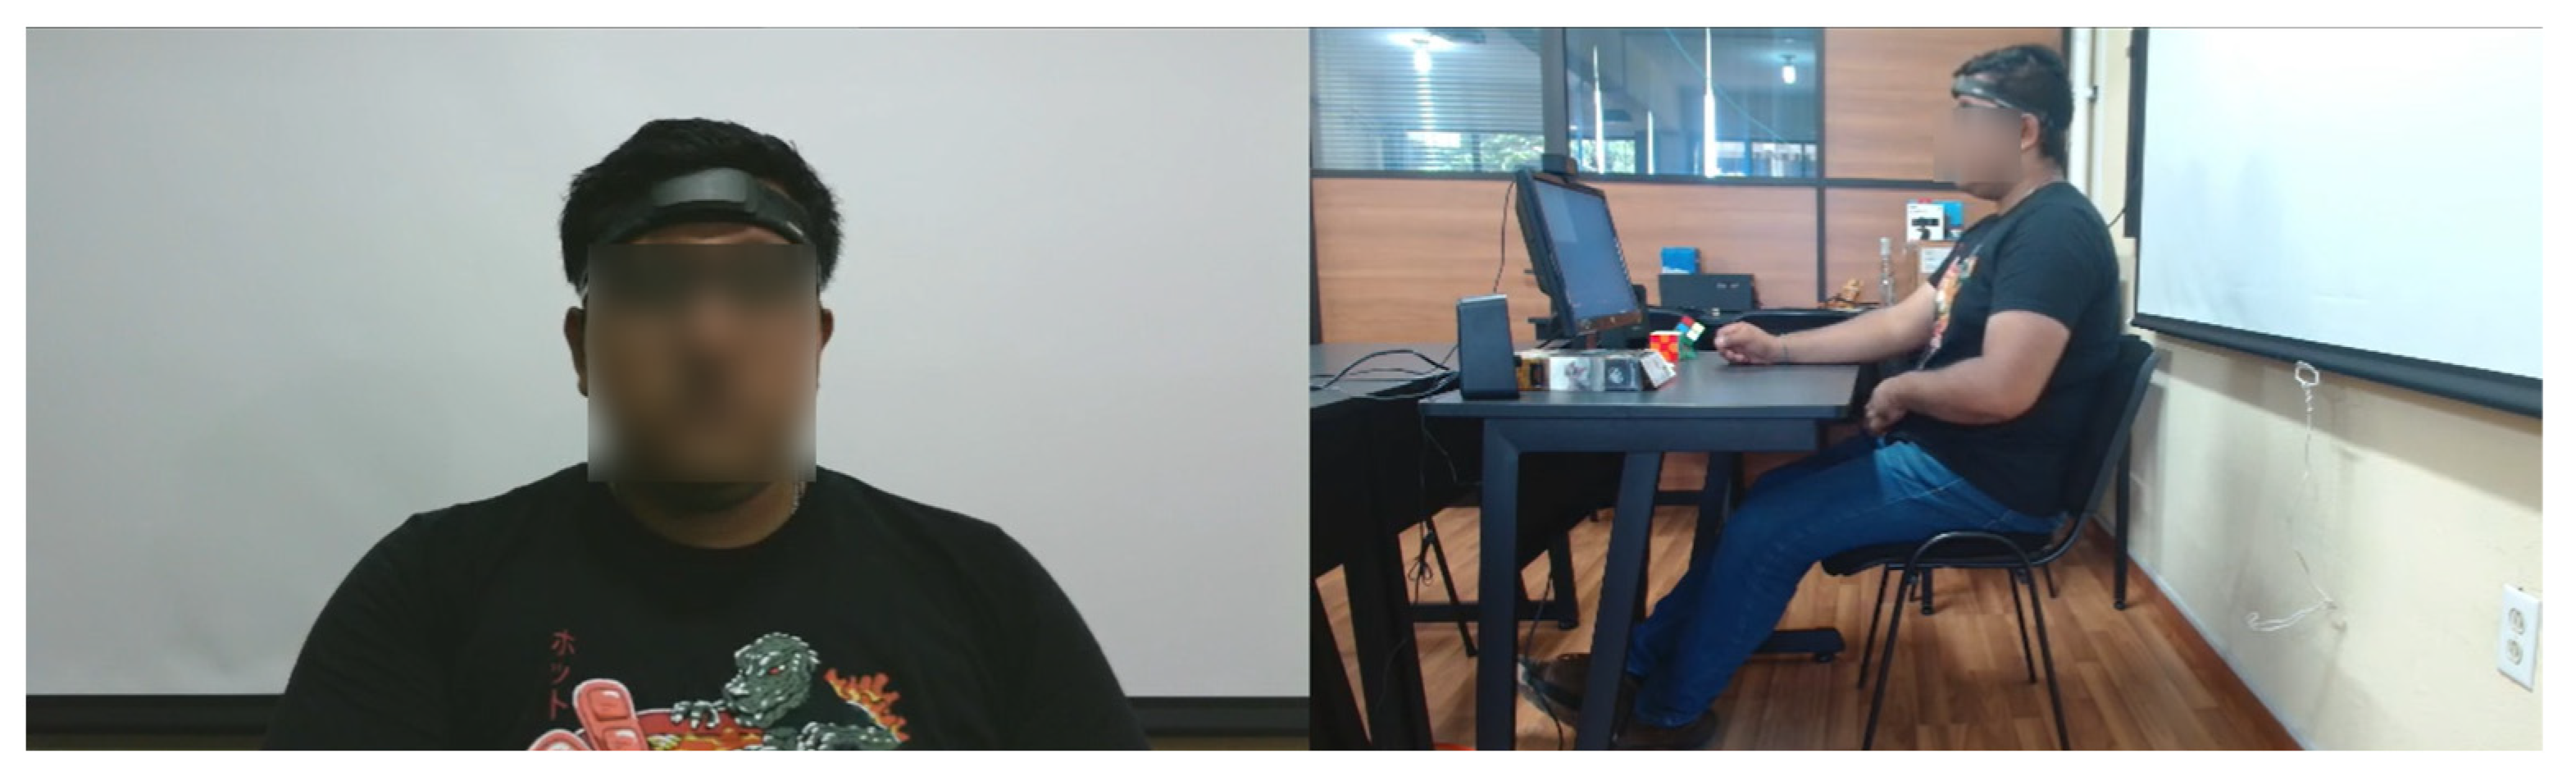
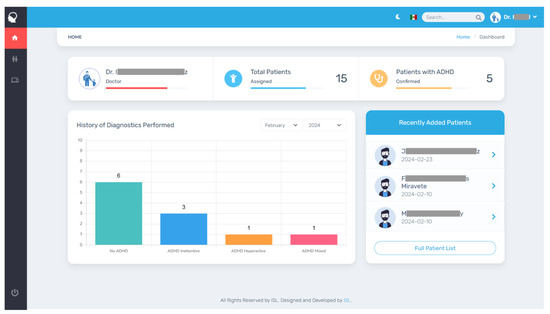
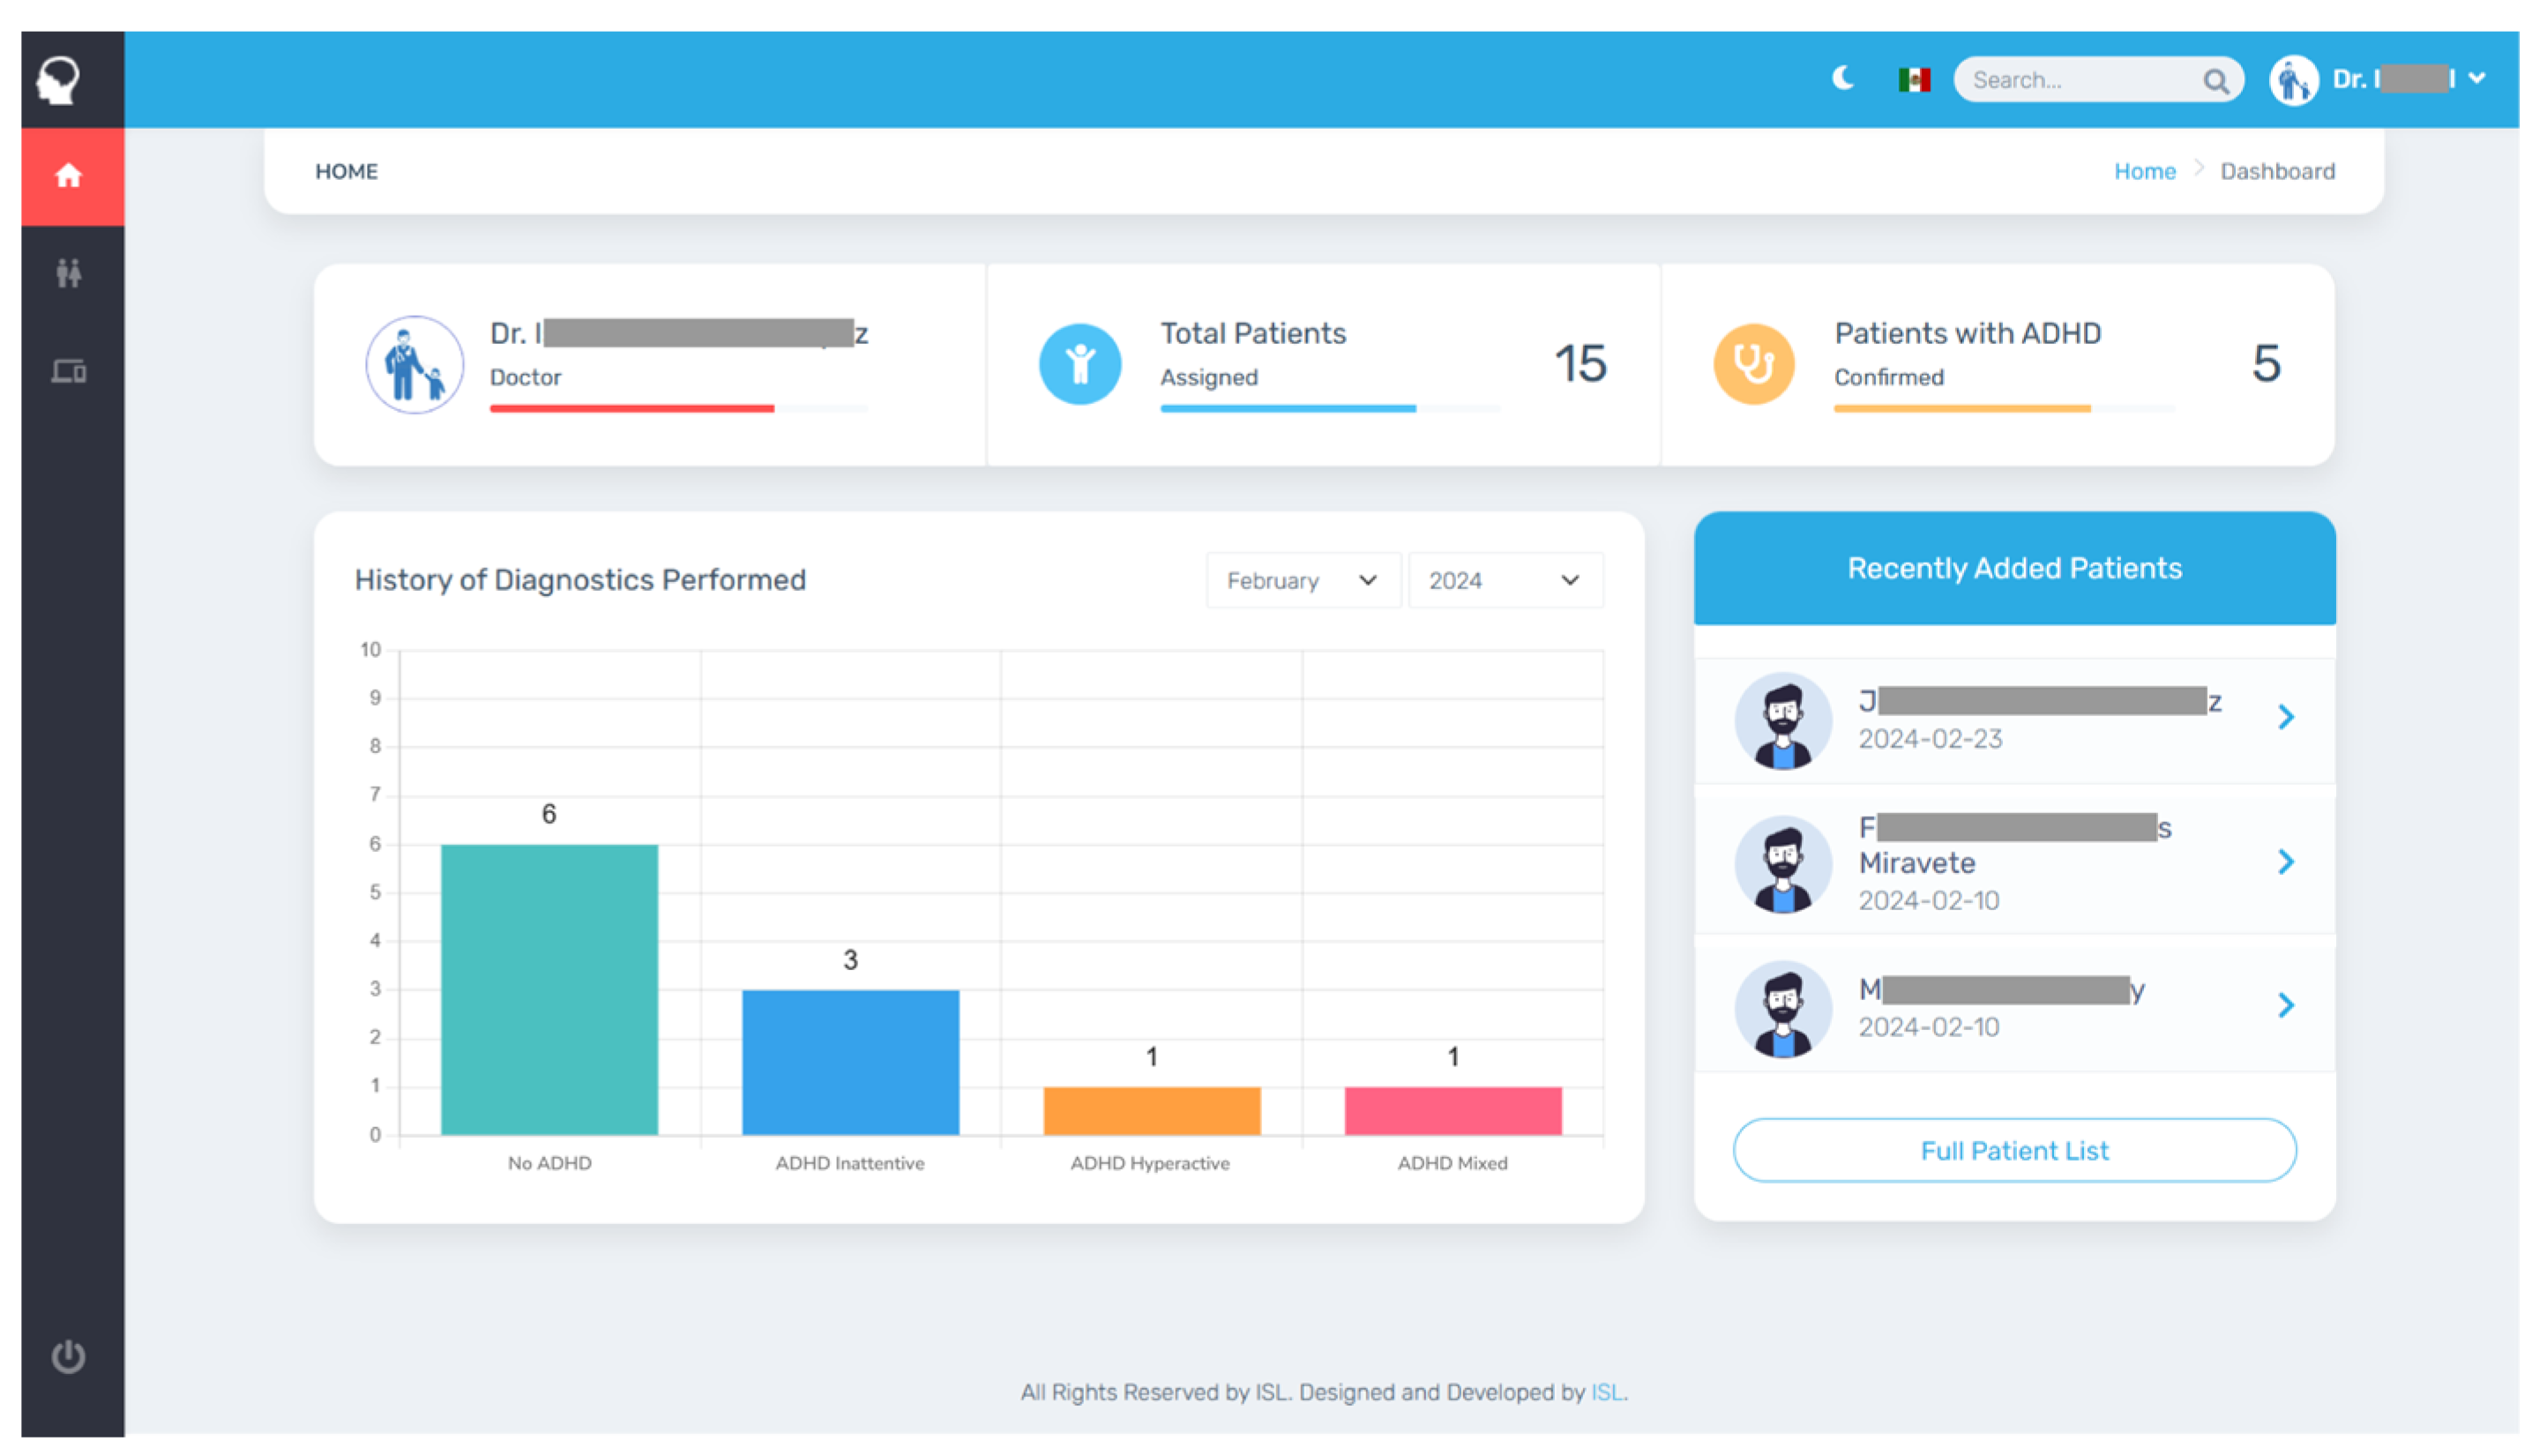
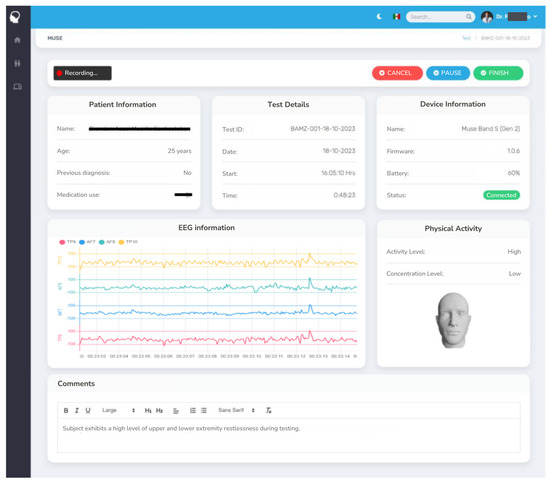
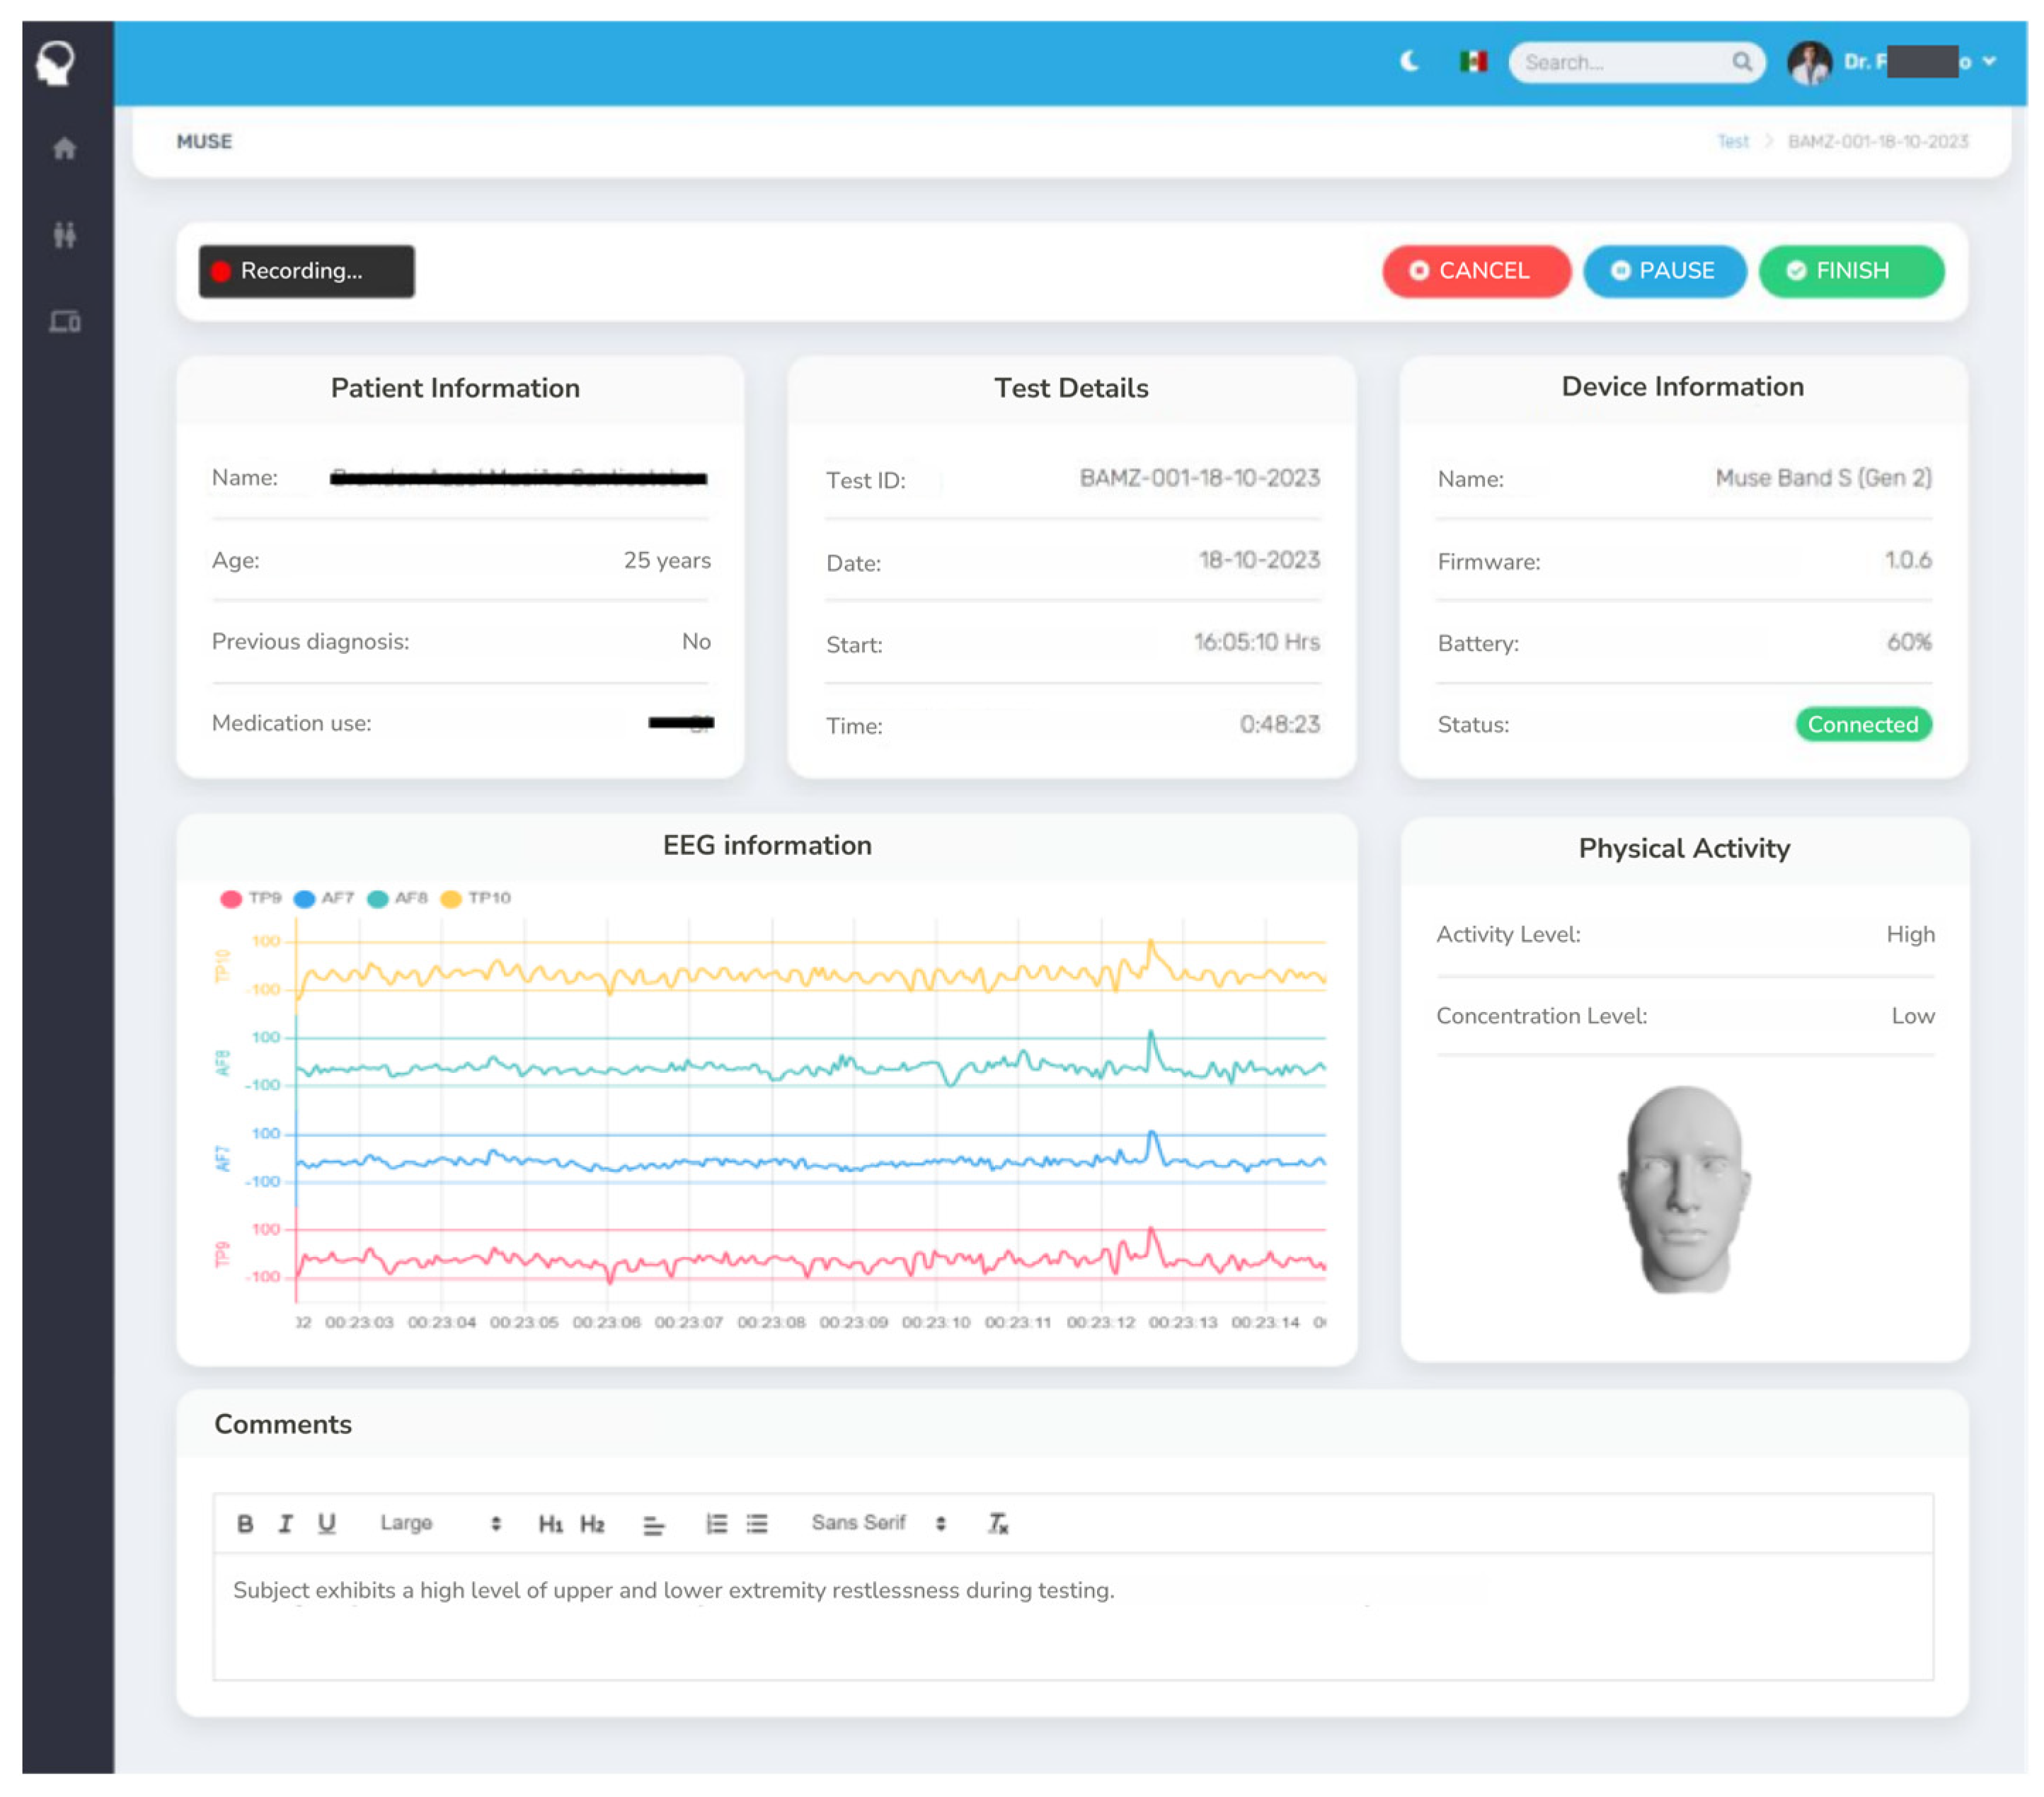
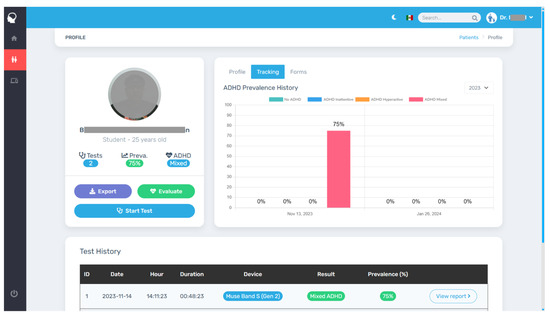
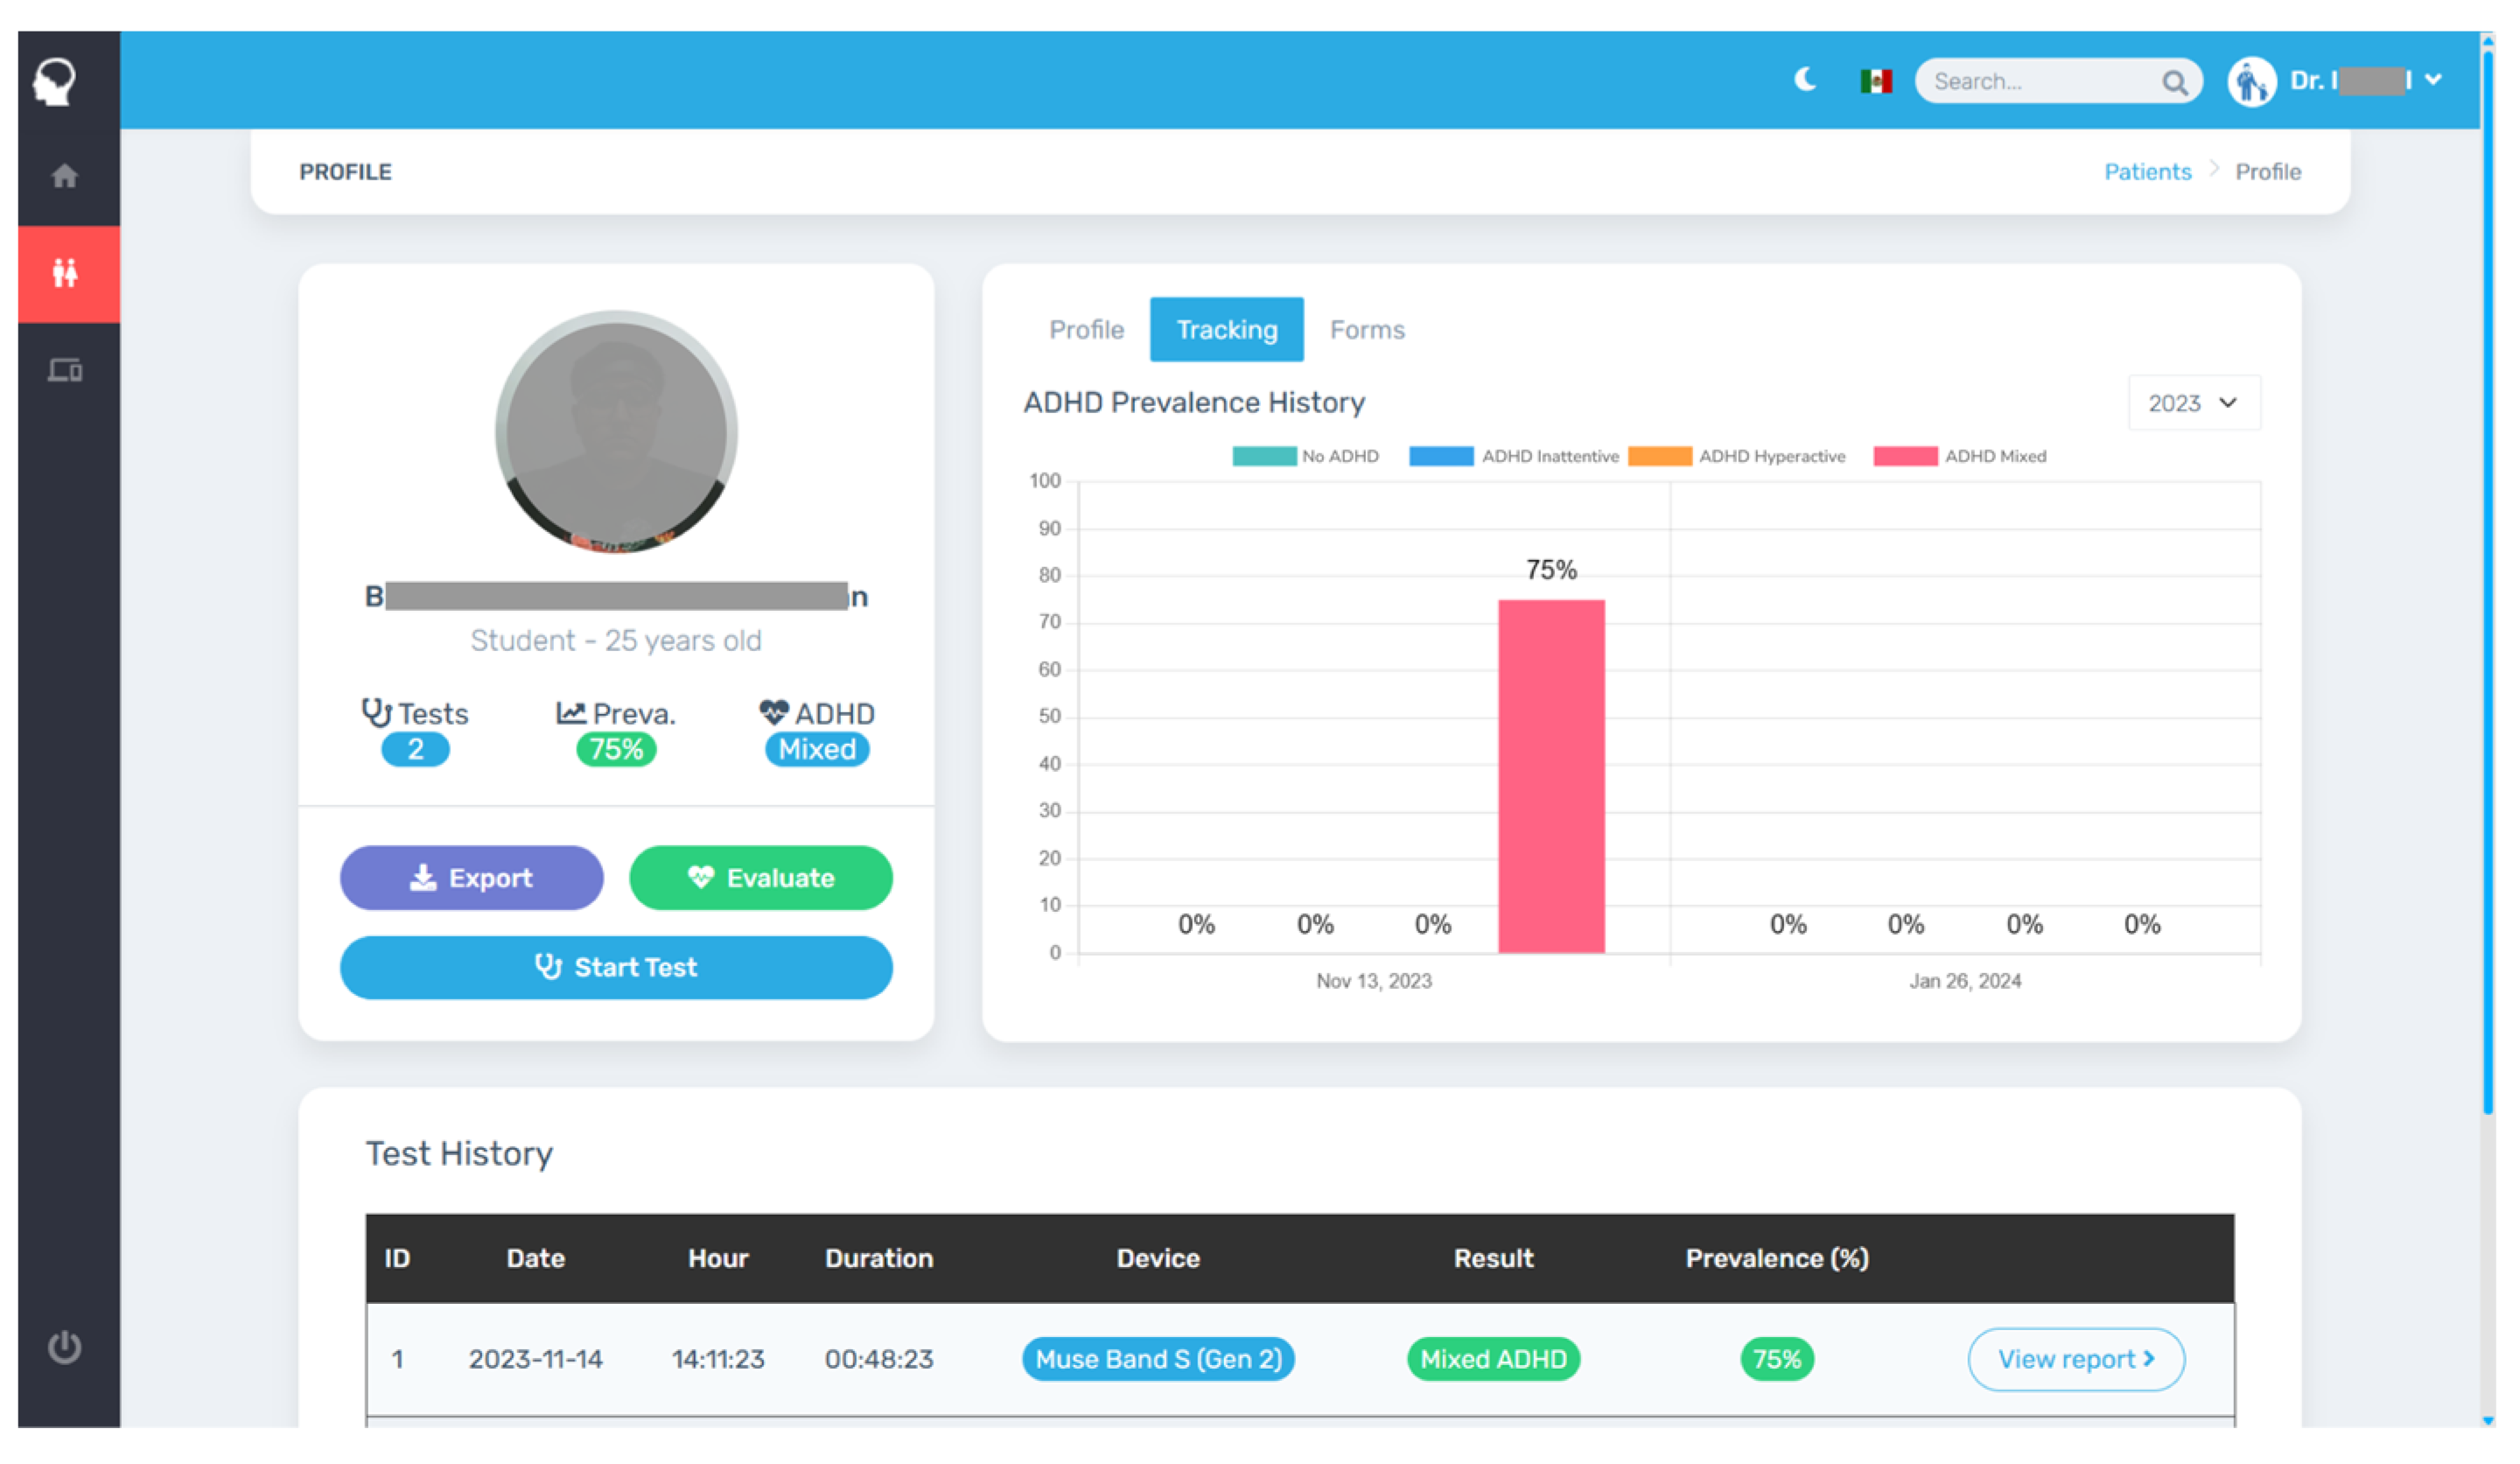
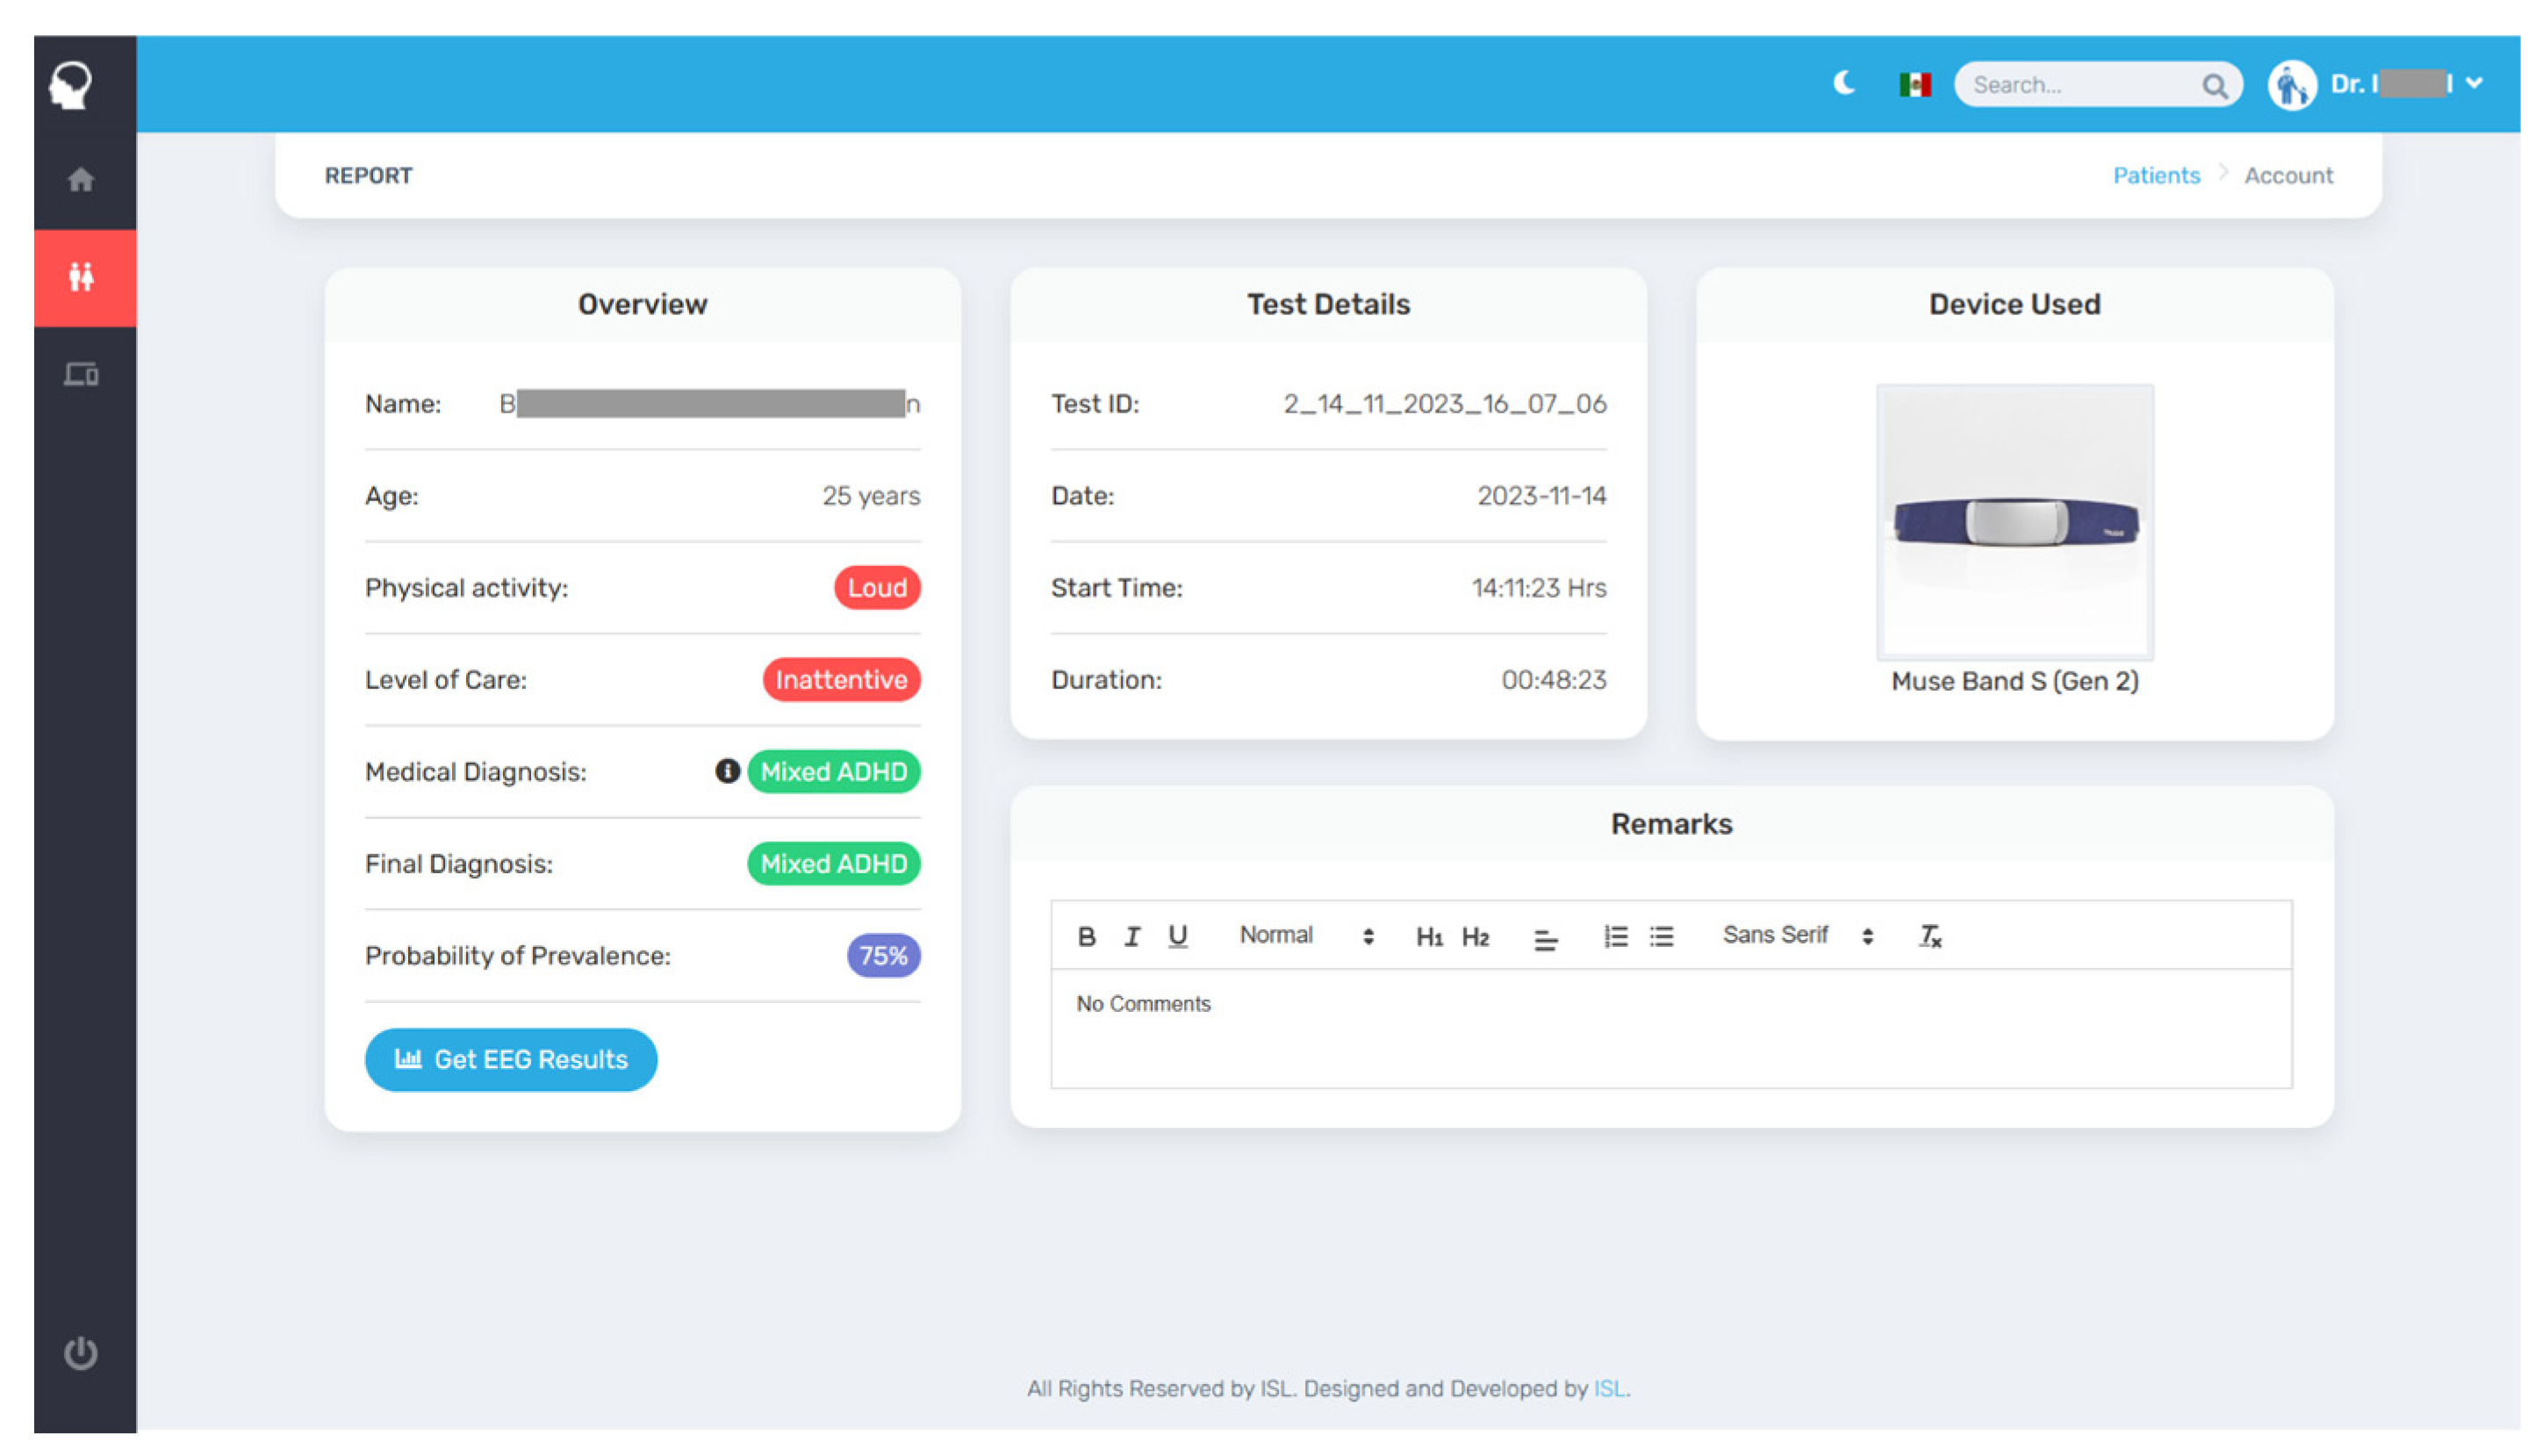
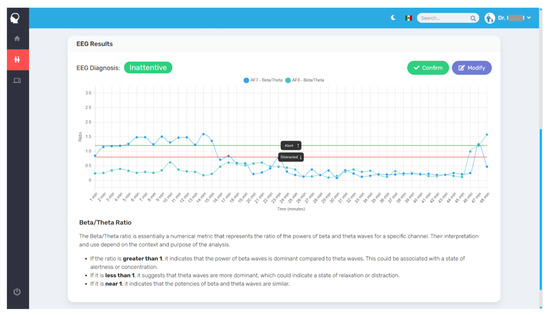
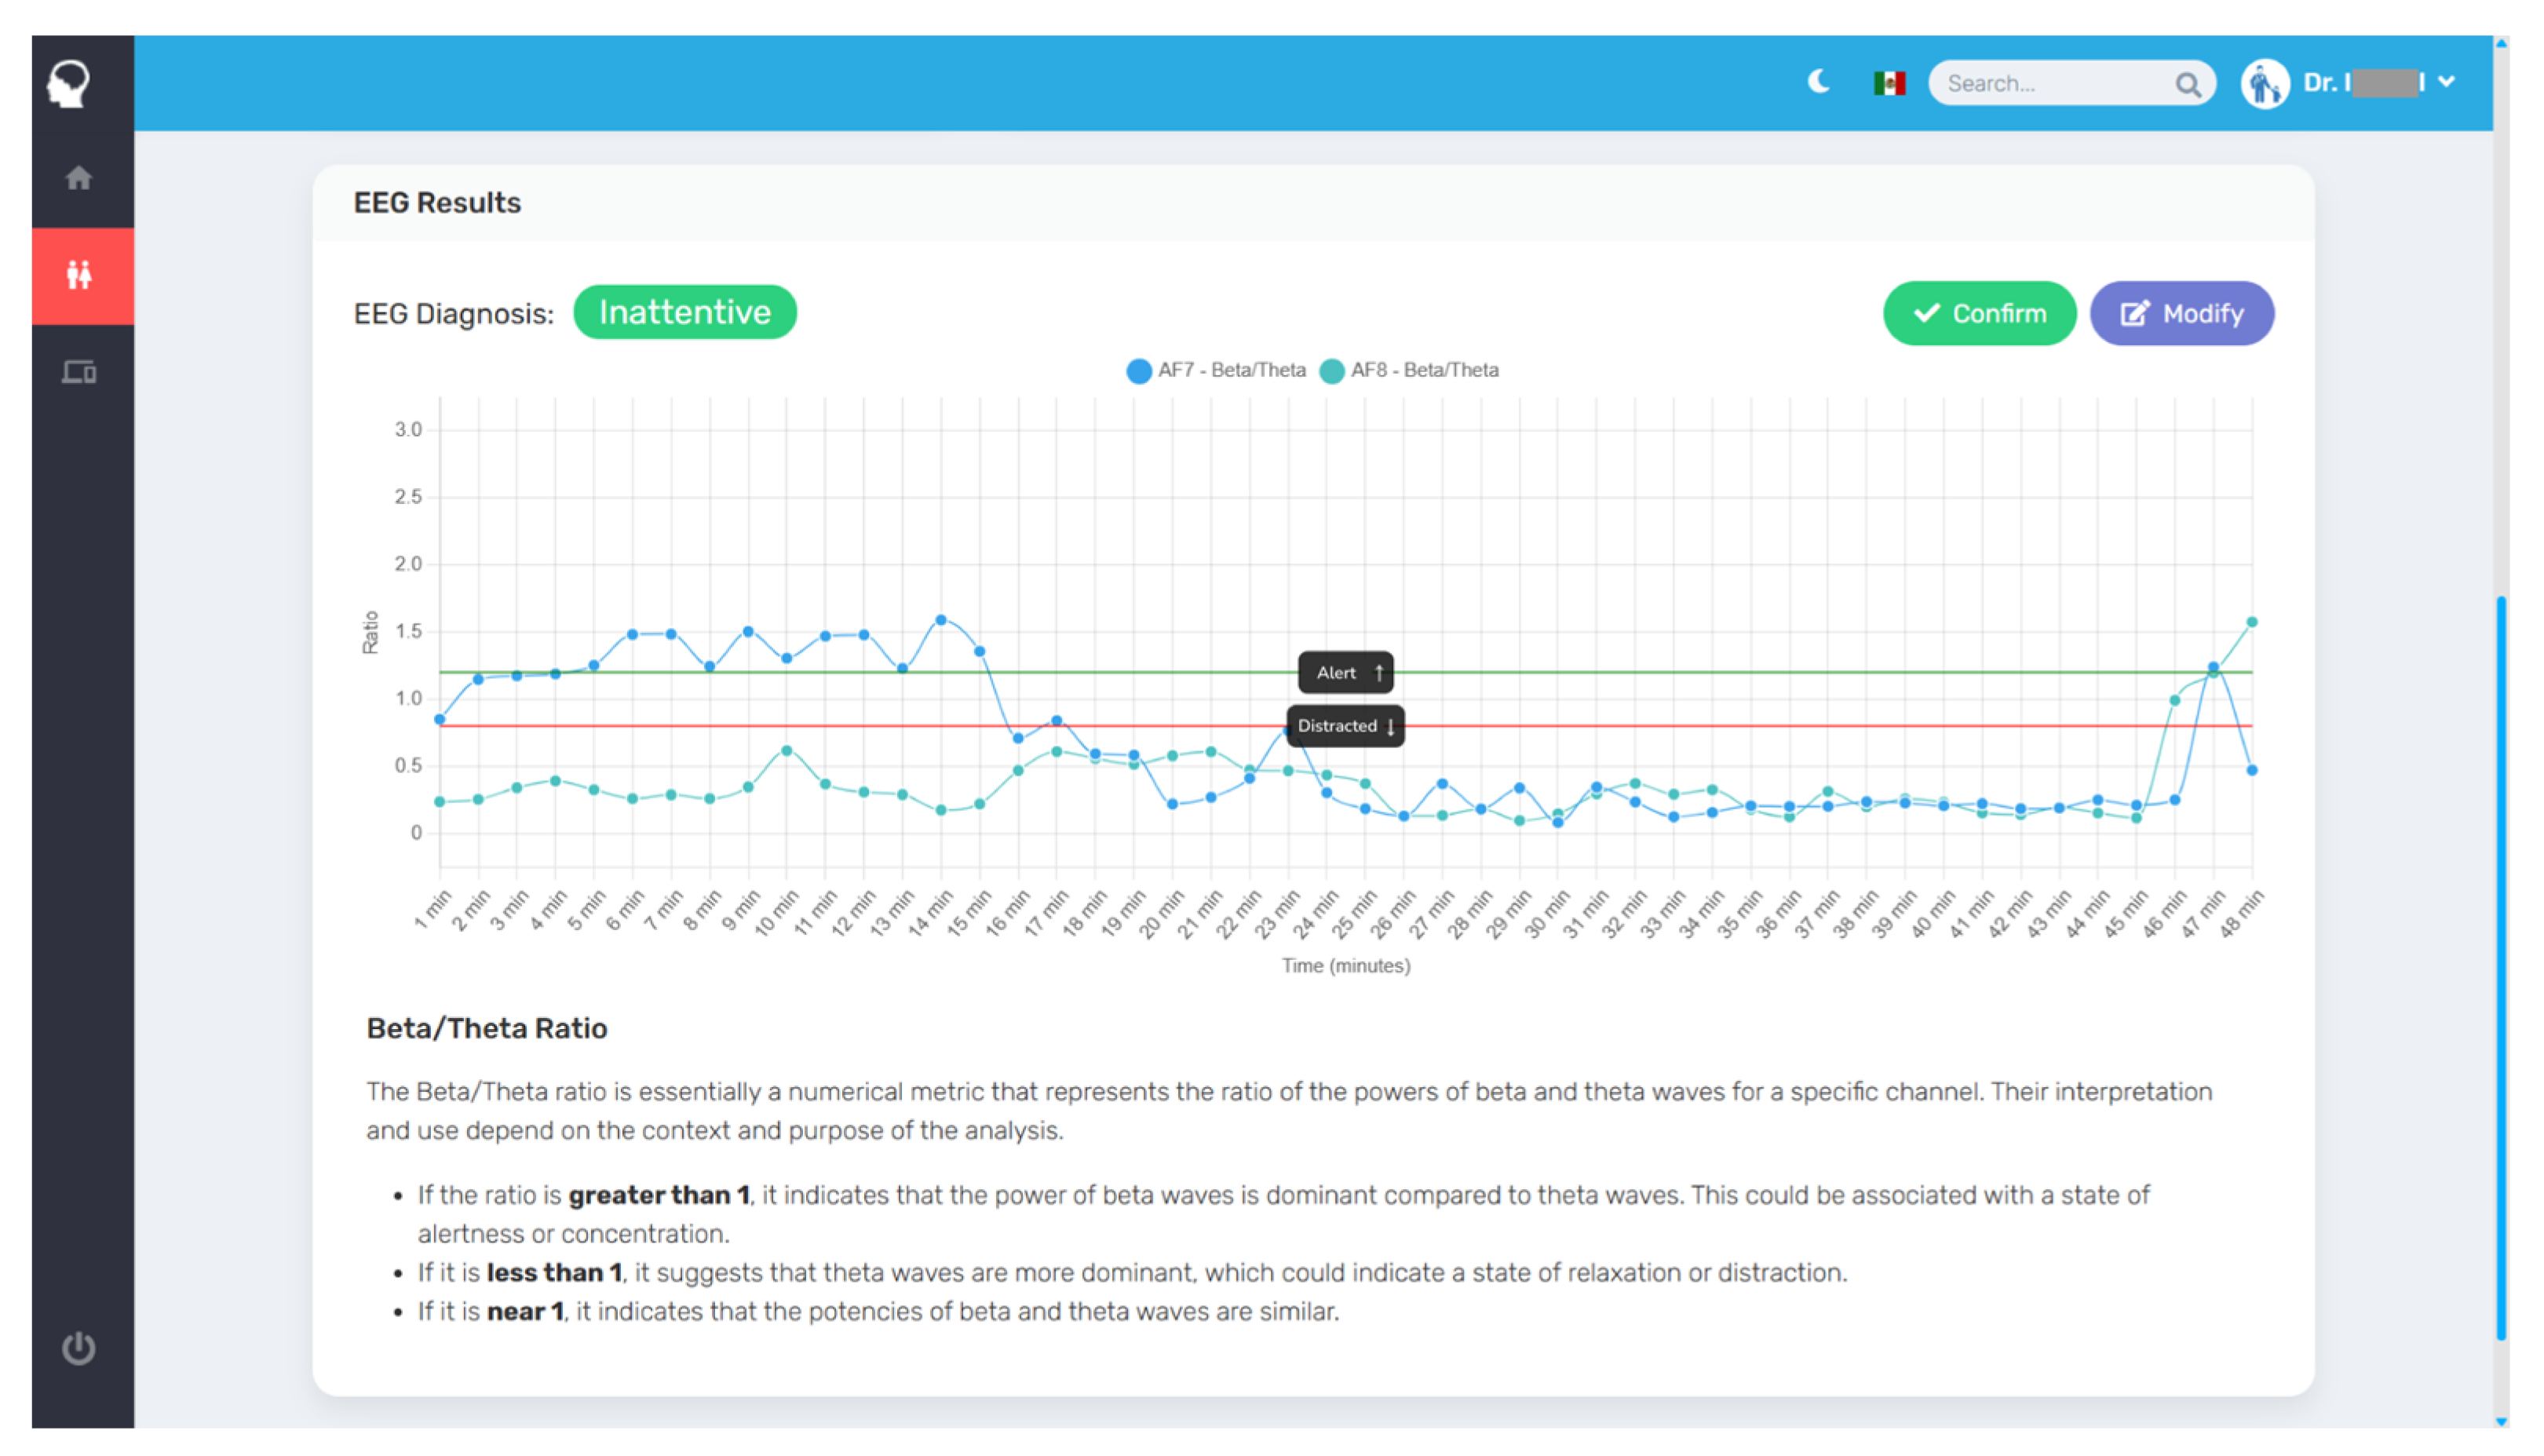
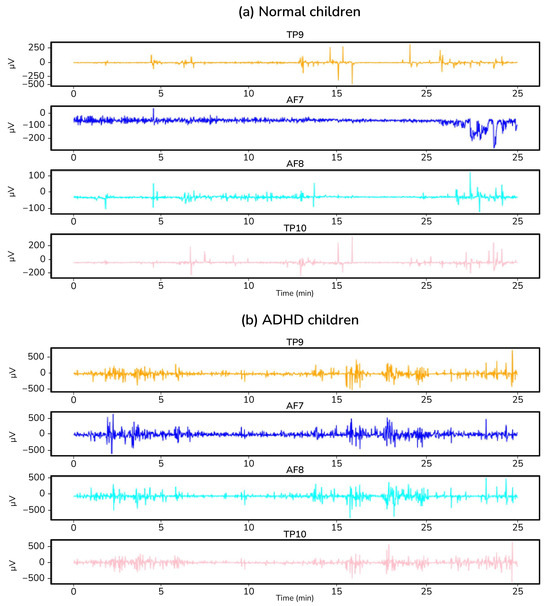
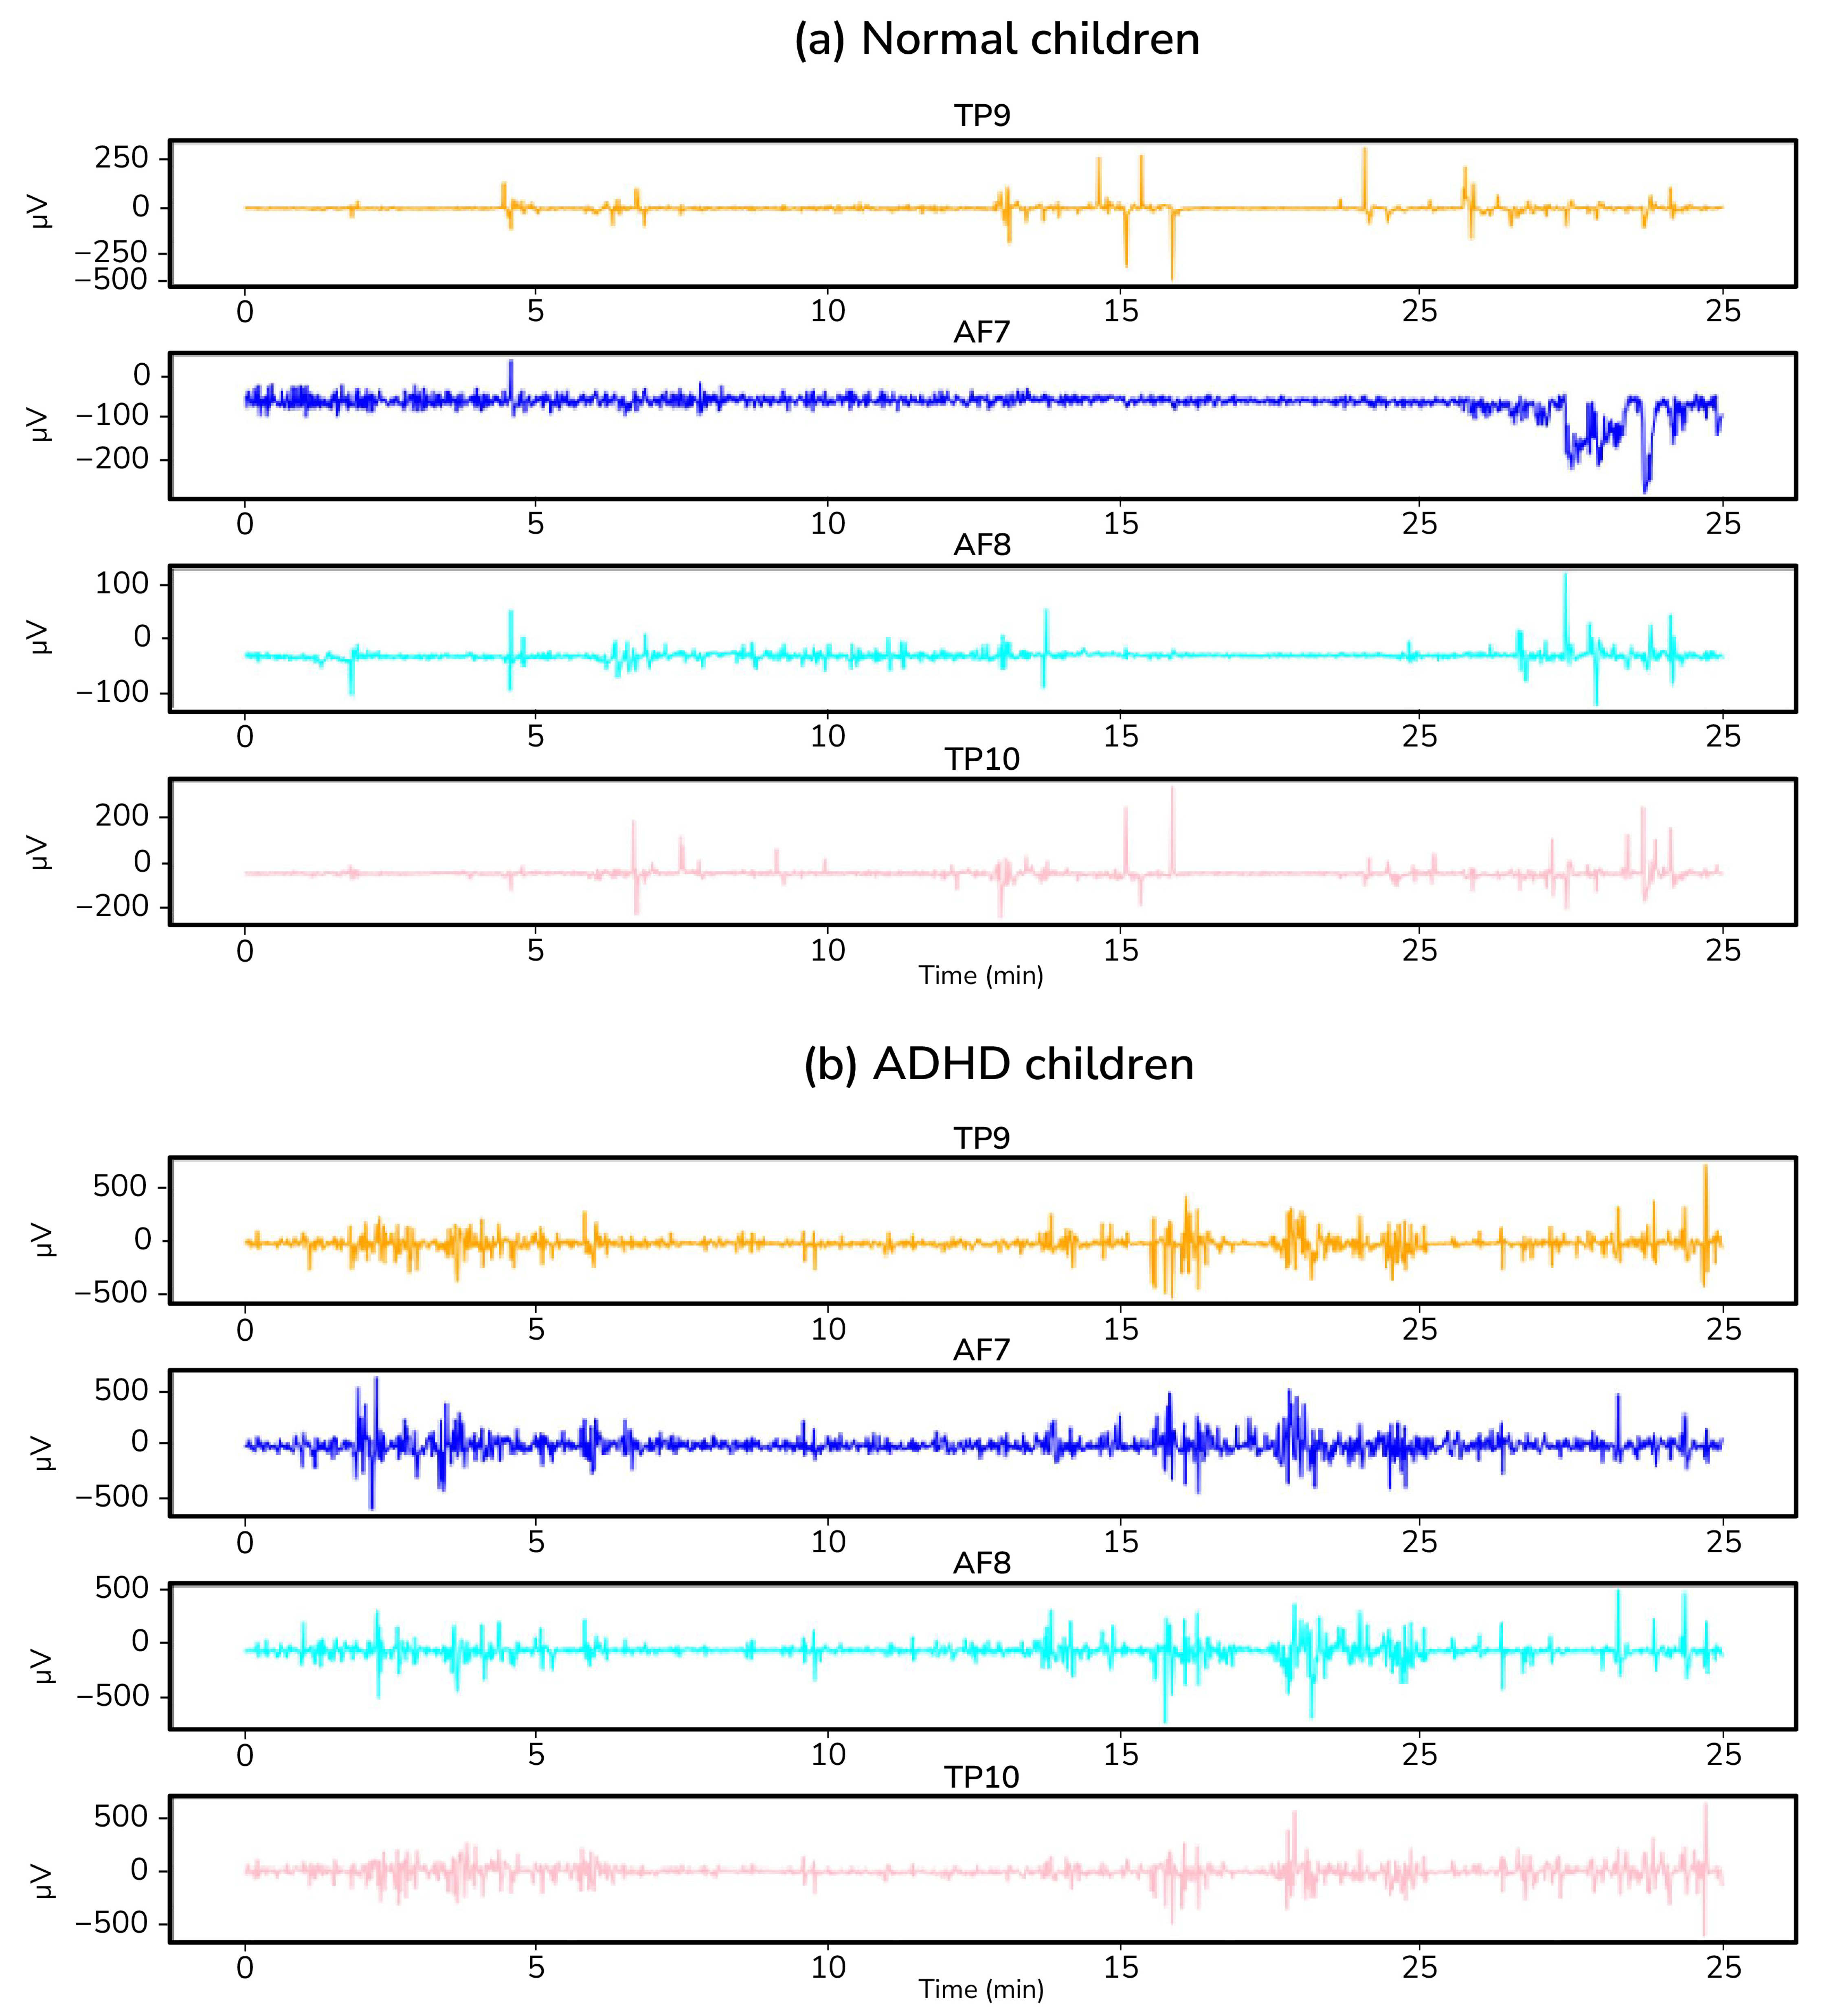

Disclaimer/Publisher’s Note: The statements, opinions and data contained in all publications are solely those of the individual author(s) and contributor(s) and not of MDPI and/or the editor(s). MDPI and/or the editor(s) disclaim responsibility for any injury to people or property resulting from any ideas, methods, instructions or products referred to in the content. |
© 2024 by the authors. Licensee MDPI, Basel, Switzerland. This article is an open access article distributed under the terms and conditions of the Creative Commons Attribution (CC BY) license (https://creativecommons.org/licenses/by/4.0/).