


Abstract
Ambient temperature has been associated with daily step counts, but evidence characterizing continuous, non-linear relationships in older adults remains limited, particularly in large cohorts with repeated daily measurements. This study examined the association between daily mean temperature and objectively measured daily step counts in the Kyotango Longevity Cohort, conducted in a region of Japan recognized for its high longevity. This cross-sectional analysis included 4344 person-days from 769 community-dwelling adults aged ≥65 years (mean age 74.0 years; 59.3% women). A generalized additive mixed model examined the non-linear association while accounting for repeated measurements and relevant covariates. A significant non-linear association was observed (effective degrees of freedom = 3.3; χ2 = 21.5; p < 0.001). Predicted step counts peaked at 14,941 steps/day (95% confidence interval, 14,567–15,350) at an estimated optimal temperature of 20.4 °C (95% confidence interval, 17.6–22.3) and declined toward colder and warmer conditions. Compared with the optimum, predicted step counts were 828 steps/day lower at −10 °C and 1448 steps/day lower at +10 °C. No significant asymmetry was observed. Daily mean temperature showed an inverted U-shaped association with daily step counts. These findings may inform climate-adaptive strategies to support physical activity and healthy longevity.
1. Introduction
Population aging is progressing rapidly worldwide, contributing to a growing burden of chronic disease and disability [1]. Preserving mobility in later life is essential for maintaining independence and supporting healthy longevity [2]. Daily step count is a practical and interpretable indicator of ambulatory behavior in epidemiological research [3]. Globally, higher daily step counts are consistently associated with favorable health outcomes [4]. Among older adults in Japan, higher daily step counts have also been associated with lower risks of disability and mortality and with fewer activity limitations and better self-assessed health [5,6].
Step counts primarily reflect walking activity and are frequently accumulated outdoors as part of routine daily activities, making them potentially sensitive to environmental conditions [7]. Recent large-scale longitudinal evidence has further demonstrated that changes in the built environment are associated with changes in daily physical activity, highlighting the importance of environmental context for ambulatory behavior [8]. Ambient temperature, a continuously varying environmental exposure, may also be associated with daily step accumulation, particularly in older adults who are vulnerable to thermal stress [9]. Age-related reductions in thermoregulatory capacity may increase physiological strain, while thermal discomfort may discourage outdoor activity under both cold and hot conditions, potentially contributing to a non-linear temperature–step count relationship.
Previous reviews have established that physical activity varies according to season and weather conditions [7,10], but studies focusing specifically on ambient temperature and daily step counts have yielded varying findings. A small study of older Japanese adults suggested a non-linear association between ambient temperature and daily step counts [11]. Similarly, a study across five major Chinese cities reported non-linear temperature–step count relationships that varied across cities and age groups [12]. In contrast, a recent study of community-dwelling older adults in Canada found no significant associations between weather variables and daily step counts [13]. These heterogeneous findings across geographic and climatic settings, together with the limited large-scale evidence in older adults, highlight the need for further investigation of the relationship between ambient temperature and daily step counts in older populations. Moreover, as global temperatures rise and extreme weather events become more frequent [14], understanding the relationship between temperature and step counts is of increasing public health importance.
Japan is among the most aged societies globally, providing a valuable setting for investigating factors that contribute to healthy longevity in older adults [15,16]. Kyotango City, located in Kyoto Prefecture, has a prevalence of centenarians that is approximately threefold higher than the national average. Examining the association between ambient temperature and daily step counts in this high-longevity region may provide insight into how temperature relates to ambulatory activity, an important component of healthy aging. The ongoing Kyotango Longevity Cohort Study, conducted in this region, was established to investigate multidimensional determinants of healthy aging [17]. Prior studies from this cohort have explored various biological and functional factors, including gut microbiota, oral function, visual function, physical activity, and 24-h movement behaviors [18,19,20,21,22,23]. More recently, an association between ambient temperature and 24-h movement behaviors was reported in this population [24]. However, how ambient temperature relates to daily step counts across the full temperature range remains unclear.
The present study aimed to characterize the potentially non-linear relationship between daily mean temperature and objectively measured daily step counts, estimate the temperature associated with the highest predicted step count, and quantify changes in step counts as temperatures deviated from this optimum among community-dwelling older adults. This study extends previous research by examining this relationship using repeated daily measurements from a large sample of participants in the distinctive Kyotango Longevity Cohort.
2. Materials and Methods
2.1. Study Design and Ethics
This study was a cross-sectional analysis of data from the Kyotango Longevity Cohort Study, an ongoing community-based cohort established by the Department of Longevity and Regional Epidemiology at Kyoto Prefectural University of Medicine (Kyoto, Japan). The study protocol was approved by the Ethics Review Board of Kyoto Prefectural University of Medicine (protocol code ERB-C-885; approved on 10 July 2017) before the commencement of data collection. All procedures were conducted in accordance with the Declaration of Helsinki. Written informed consent was obtained from all participants prior to enrollment. This study was reported in compliance with the Strengthening the Reporting of Observational Studies in Epidemiology guidelines [25].
2.2. Participants
Community-dwelling older adults aged ≥65 years who participated in the Kyotango Longevity Cohort Study between August 2017 and September 2025 were eligible for the present analysis. The same cohort was used in our previous study [24]. Participants underwent one or two assessment occasions during the study period. Participants were recruited from Kyotango City, Kyoto Prefecture, Japan, a coastal region facing the Sea of Japan with substantial seasonal variation in meteorological conditions, through the municipal longevity health check-up program. Recruitment was conducted via the official city website and community newsletters from Kyotango City Yasaka Hospital.
2.3. Data Collection
Demographic characteristics, health behaviors, socioeconomic factors, and medical history were collected using a self-administered questionnaire, including age, sex, smoking status, drinking status, marital status, educational attainment, and treatment for hypertension, diabetes, and dyslipidemia. Height and weight were measured, and body mass index (BMI) was calculated as weight in kilograms divided by height in meters squared. Assessment days corresponding to periods of coronavirus disease 2019 emergency declarations or priority preventive measures were identified.
Daily meteorological data were linked to each assessment date. Daily mean temperature, precipitation, sunshine duration, daylight duration, and mean wind speed were obtained from the Taiza Observatory, located within Kyotango City. All meteorological data were retrieved from the official website of the Japan Meteorological Agency, Ministry of Land, Infrastructure, Transport and Tourism [26]. Sunshine percentage (%) was calculated by dividing daily sunshine duration by total daylight duration and multiplying by 100.
2.4. Step Count Assessment
Daily step counts were objectively measured using triaxial accelerometers (ActiGraph wGT3X-BT; ActiGraph LLC, Pensacola, FL, USA). Participants were instructed to wear the device on an elastic belt positioned over the right hip for seven consecutive days, except during water-based activities such as bathing or swimming (Supplementary Figure S1). The accelerometers recorded data at a sampling frequency of 30 Hz and were returned by mail after the monitoring period. Accelerometer data were processed using ActiLife® software (version 6.13.4; ActiGraph LLC, Pensacola, FL, USA), with the low-frequency extension filter enabled [27,28]. Data were aggregated into 60-s epochs. Sleep periods were identified using participants’ sleep diaries; when diary data were unavailable, a standardized sleep window (23:00–06:00) was applied [29]. During waking time, non-wear time was defined as ≥90 consecutive minutes of zero counts [30]. A valid day required ≥10 h of wear time during waking hours, and participants with ≥4 valid days, including at least one weekend day, were included in the analysis [31,32,33]. Daily step counts were calculated as the total number of steps accumulated during valid waking wear time for each day.
2.5. Statistical Analyses
Participant characteristics were summarized as means with standard deviations (SDs) or as numbers with percentages, as appropriate. Daily mean temperature was specified as the primary exposure and daily step count as the outcome. The association between daily mean temperature and daily step counts was examined using a generalized additive mixed model with a negative binomial distribution and log link. The negative binomial distribution was selected to accommodate the over-dispersed count nature of the daily step data, and its fit was compared with that of a Gamma distribution using the Akaike information criterion. Daily mean temperature was modeled as a penalized spline with a basis dimension of k = 5, and smoothing parameters were estimated using restricted maximum likelihood. The estimated effective degrees of freedom were used to characterize the complexity of the temperature smooth, and the overall significance of the smooth term was assessed using an approximate chi-square test.
The model was adjusted for age, sex, BMI, daily waking wear time, day type (weekday or holiday), smoking status, drinking status, marital status, educational attainment, treatment for hypertension, diabetes, and dyslipidemia, and periods of coronavirus disease 2019 emergency declarations or priority preventive measures. To account for weather conditions other than temperature, precipitation, mean wind speed, and sunshine percentage were additionally included as meteorological covariates. Precipitation was modeled using two terms: an indicator of any precipitation and log-transformed precipitation amount, which was conditionally centered among days with precipitation and set to zero on days without precipitation. Random intercepts for participant, measurement occasion nested within participant, and calendar date were included to account for repeated observations within participants, clustering within measurement occasions, and meteorological exposures shared by participants assessed on the same date. All models were fitted using complete cases; participants with missing values for variables included in the adjusted models were excluded prior to analysis, and no imputation was performed.
Marginally standardized predicted daily step counts were estimated across the observed temperature range. For each temperature value, temperature was fixed at that value for all observations, predictions were obtained excluding the random effects, back-transformed to the response scale, and averaged across the analytic sample. The optimal temperature was defined as the temperature corresponding to the maximum contribution of the temperature smooth. Its 95% confidence interval (CI), as well as the 95% CI for the predicted step count at the optimal temperature, was estimated using 10,000 posterior simulations based on the estimated coefficients and their variance–covariance matrix.
Changes in predicted daily step counts were estimated at 5 °C and 10 °C below and above the optimal temperature. Potential asymmetry was evaluated by comparing the magnitude of the reductions between corresponding colder and warmer deviations, with 95% CIs and two-sided p values obtained using the same posterior simulation procedure.
Sensitivity analyses were conducted to assess the robustness of the findings. The primary model was refitted using only observations with available sleep records. Differences in the shape of the temperature–step count association according to sleep-record availability were additionally evaluated using a difference smooth within the full sample. In addition, the primary model was refitted after excluding person-days with daily step counts outside the 1st–99th percentile of the observed distribution, daily mean temperatures outside the 1st–99th percentile, and both.
All statistical analyses were conducted using R (version 4.6.1). Generalized additive mixed models were fitted using the mgcv package (version 1.9-4), and posterior simulations were conducted using the MASS package (version 7.3-65). All tests were two-sided, and statistical significance was defined as p < 0.05.
3. Results
Of the 1244 older adults who participated in the Kyotango Longevity Cohort Study during the study period, 424 were excluded because they did not undergo physical activity assessment, 13 because of insufficient valid days of physical activity data, 30 because of missing data on key variables, and 8 because of lower limb dysfunction. Consequently, 769 community-dwelling older adults were included in the final analysis. Of these, 667 contributed data from a single assessment, whereas 102 contributed data from two separate assessment occasions (Supplementary Figure S2).
Table 1 summarizes the characteristics of the study population. The mean age was 74.0 years (SD 5.5), 456 participants [59.3%] were women, and the mean BMI was 23.0 kg/m2 (SD 3.0). The mean daily step count was 15,264.2 steps/day (SD 5402.8). A total of 4344 person-days of valid step-count and meteorological data were included in the analysis, corresponding to a mean of 5.7 days per participant.
Table 1.
Characteristics of study participants (n = 769).
Across these observation days, meteorological characteristics were as follows: mean daily temperature was 17.3 °C (SD 7.6; range, −2.1–31.8 °C), mean daily precipitation was 5.0 mm (SD 10.5; range, 0–111 mm), mean sunshine percentage was 40.2% (SD 33.4; range, 0–95.7%), and mean wind speed was 3.1 m/s (SD 1.9; range, 0.8–13.3 m/s).
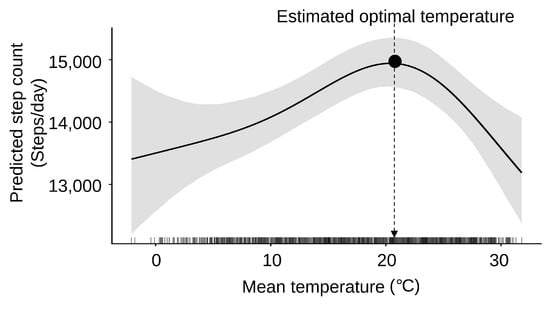
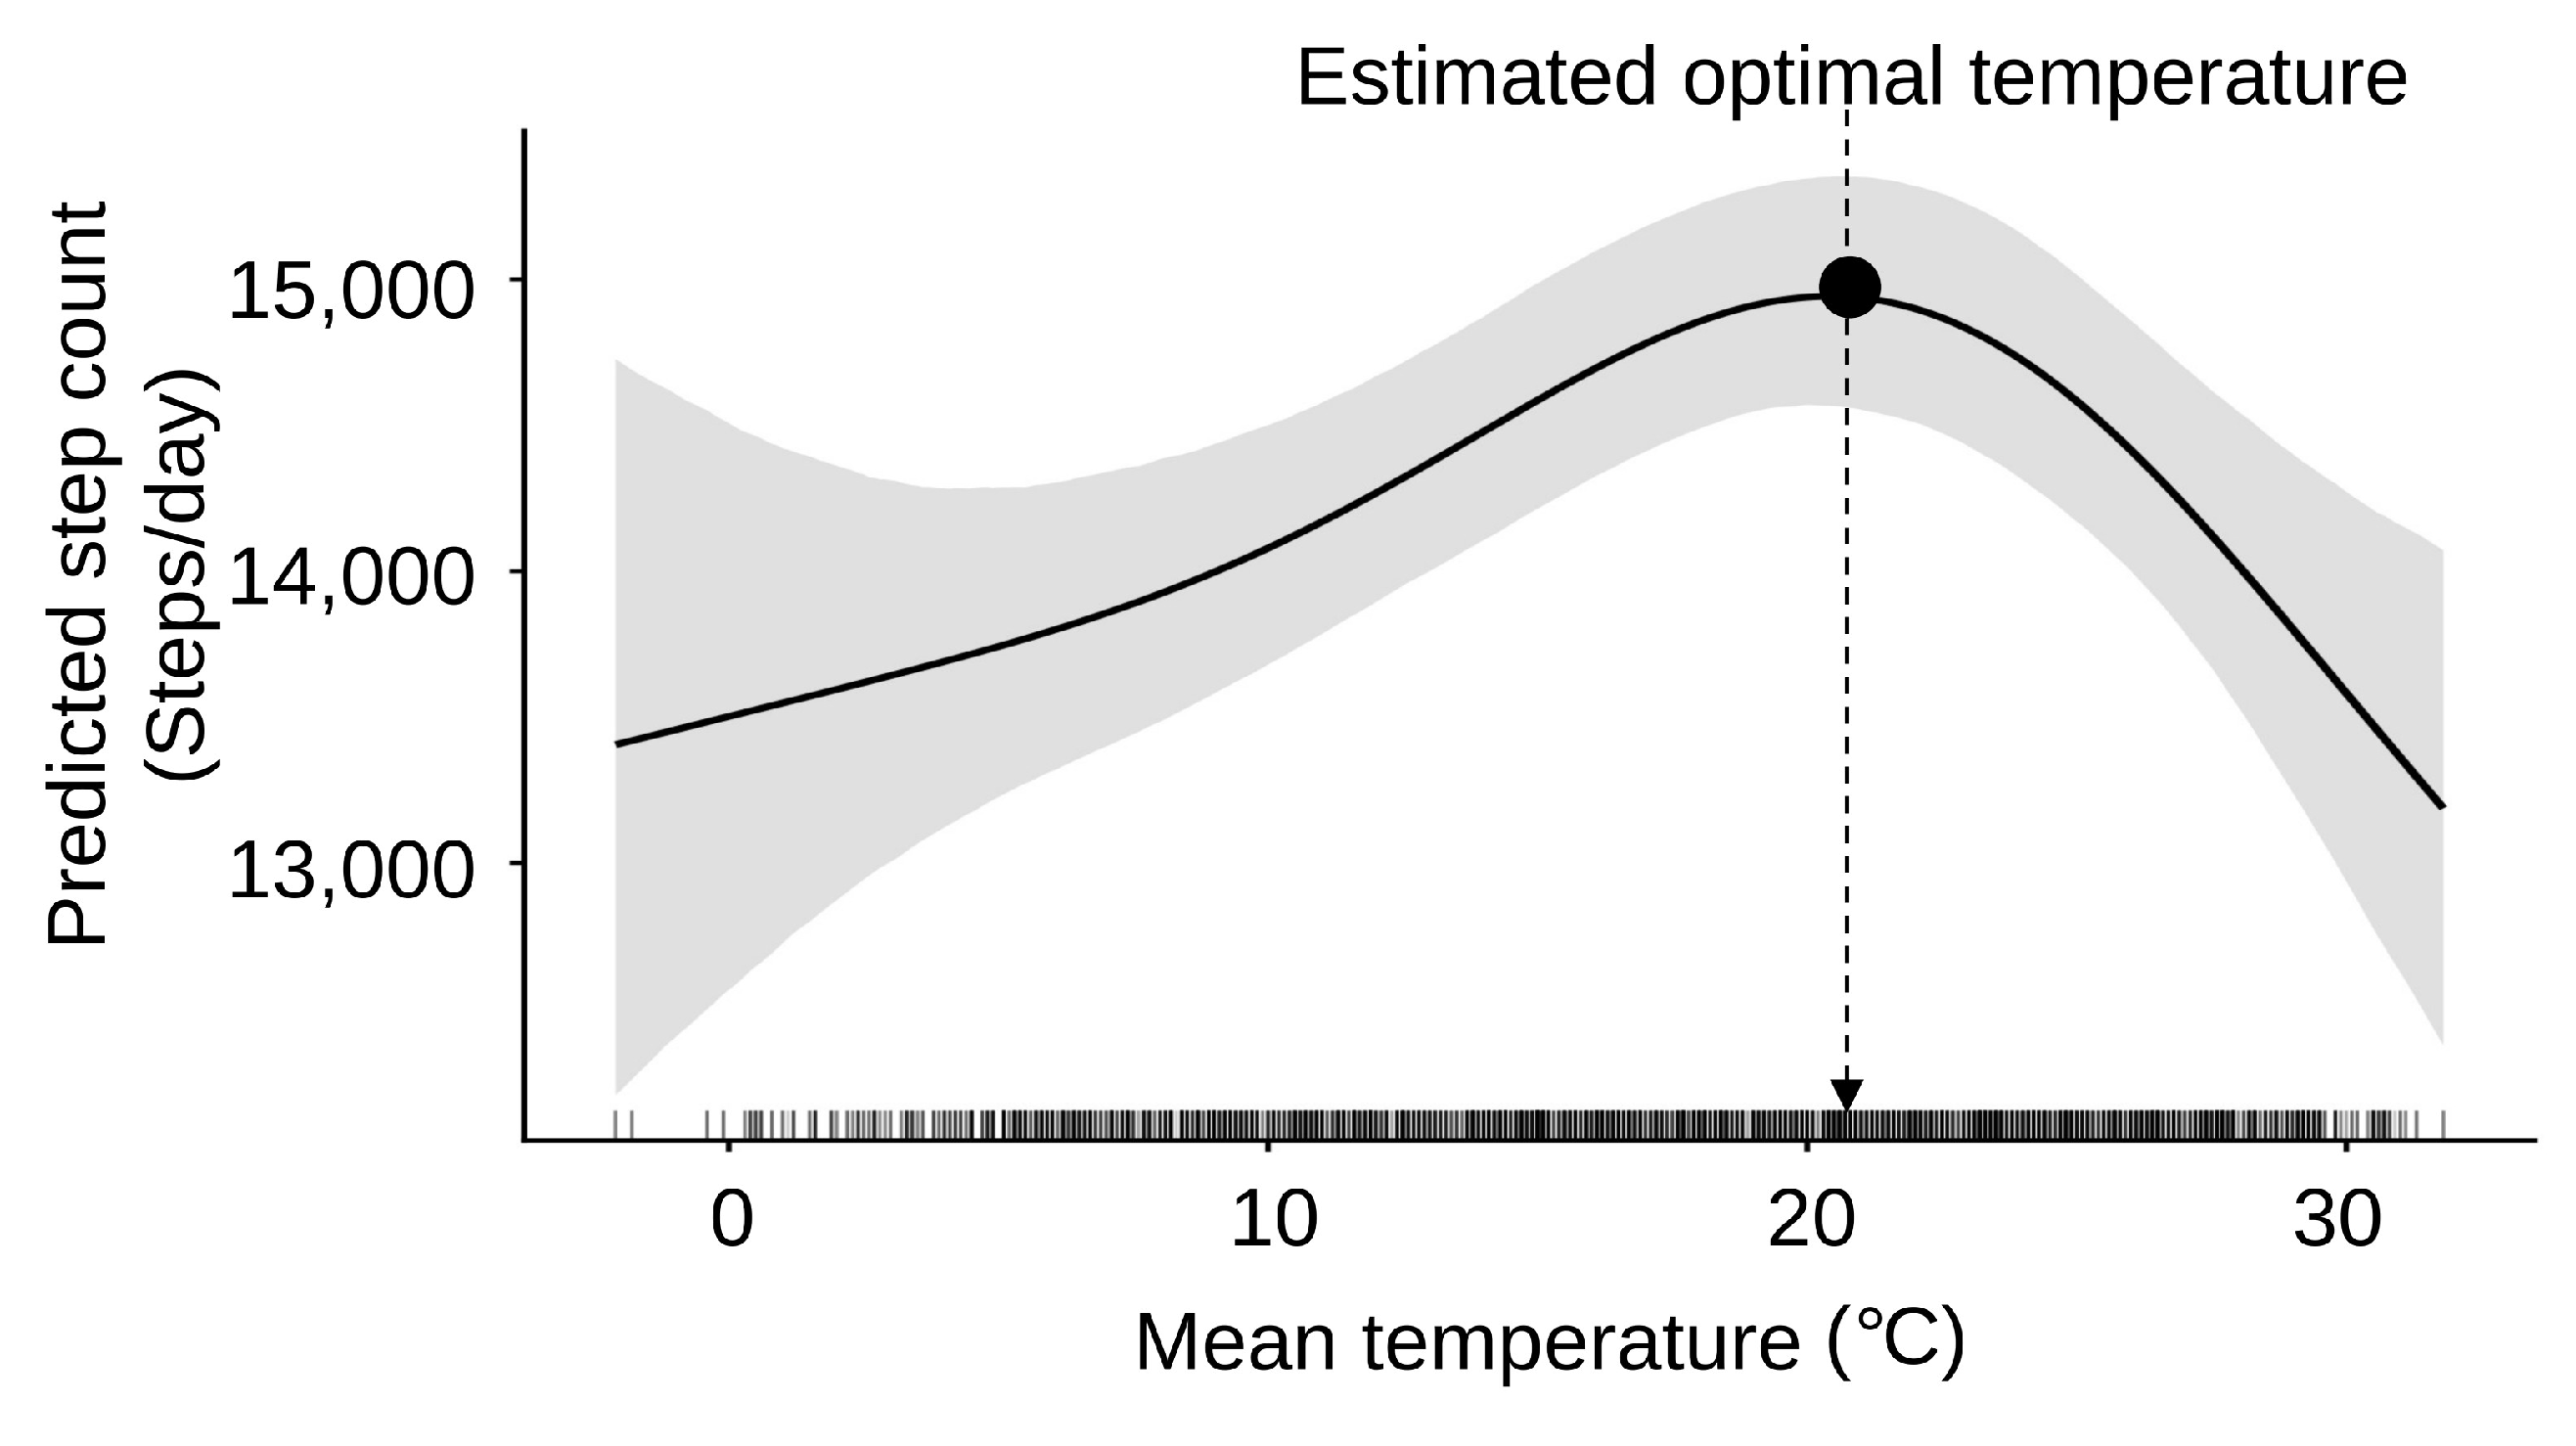
A significant non-linear association was observed between daily mean temperature and daily step counts (effective degrees of freedom = 3.3; χ2 = 21.5; p < 0.001). The negative binomial model showed a slightly better fit than the corresponding Gamma model (Akaike information criterion: 83,180.7 vs. 83,183.4). As shown in Figure 1, daily step counts increased with temperature up to an estimated optimal temperature of 20.4 °C (95% CI, 17.6–22.3) and declined thereafter, demonstrating an inverted U-shaped association. The marginally standardized predicted step count at the optimal temperature was 14,941 steps/day (95% CI, 14,567–15,350). In an analysis restricted to observations with available sleep records (709 participants [92.2%]; 3971 person-days), the estimated optimal temperature was similar at 20.6 °C (95% CI, 18.3–22.2), and no significant difference in the shape of the temperature–step count association was observed according to sleep-record availability (p = 0.178). The findings were also robust to the exclusion of extreme values of daily step counts and temperature. Across the three sensitivity analyses excluding extreme step counts, extreme temperatures, or both, the estimated optimal temperatures ranged from 20.1 °C to 20.3 °C, and the non-linear temperature–step count association remained statistically significant in all analyses (p ≤ 0.001) (Supplementary Table S1). Among the other meteorological variables included as covariates in the adjusted model, precipitation and higher mean wind speed were associated with fewer daily steps, whereas higher sunshine percentage was associated with more daily steps (Supplementary Table S2).
Figure 1.
Non-linear association between daily mean temperature and predicted daily step counts. Predicted daily step counts were estimated using a generalized additive mixed model with a negative binomial distribution and log link. The solid line represents marginally standardized predicted step counts, and the shaded area indicates the 95% confidence interval. The vertical dashed line denotes the estimated optimal temperature (20.4 °C), corresponding to the maximum of the estimated temperature smooth. Rug marks along the x-axis indicate the distribution of observed daily mean temperatures.
Table 2 illustrates changes in predicted daily step counts relative to the optimal temperature. Specifically, compared with the optimal temperature, step counts were 828 steps/day lower at 10 °C below the optimum (95% CI, 351–1309) and 314 steps/day lower at 5 °C below the optimum (95% CI, 5–624). Similarly, step counts were 423 steps/day lower at 5 °C above the optimum (95% CI, 113–732) and 1448 steps/day lower at 10 °C above the optimum (95% CI, 628–2220). Although the reductions were numerically greater on the warmer side, formal comparisons showed no significant asymmetry between the colder and warmer sides at either the 5 °C deviation (p = 0.666) or the 10 °C deviation (p = 0.125). However, the confidence interval was wider at 10 °C above the optimum than at 10 °C below the optimum, reflecting greater uncertainty in the warm-side estimate at the 10 °C deviation.
Table 2.
Changes in predicted daily step counts according to deviations from the optimal temperature.
4. Discussion
In the present study, a significant non-linear association between daily mean temperature and objectively measured daily step counts was identified. Step counts peaked at approximately 20 °C and declined as temperatures deviated from this optimal point toward both colder and warmer conditions, forming an inverted U-shaped exposure–response relationship. These findings highlight ambient temperature as an environmental factor associated with ambulatory activity in older adults.
The observed pattern is consistent with previous evidence demonstrating lower physical activity under temperature extremes [34]. More specifically, the Nakanojo Study reported that daily step counts among older Japanese adults increased with ambient temperature from −2 °C to 17 °C and decreased from 17 °C to 29 °C on days with precipitation < 1 mm [11]. Similarly, a study conducted across multiple Chinese cities reported significant inverse U-shaped associations between temperature and daily step counts, with estimated optimal temperatures ranging from 16.1 °C to 19.3 °C [12]. The optimal temperature estimated in the present study (20.4 °C) was slightly higher but broadly comparable to these previously reported values. The present study extends these findings by characterizing the temperature–step count relationship in a substantially larger cohort using repeated daily measurements and mixed-effects modeling. In the adjusted model, precipitation and higher wind speed were associated with fewer daily steps, whereas greater sunshine was associated with more daily steps. Importantly, the non-linear association between ambient temperature and daily step counts persisted after adjustment for these meteorological conditions and individual-level factors.
The present analysis also quantified changes in predicted step counts as temperatures deviated from this optimum. Several mechanisms may contribute to the reductions in step counts under colder and warmer conditions. Under colder conditions, thermal discomfort and adverse weather conditions, particularly precipitation, may discourage outdoor walking [11,35]. Under warmer conditions, age-related thermoregulatory vulnerability may increase physiological strain and discourage outdoor activity, potentially contributing to reductions in step counts [9]. Notably, the reductions in predicted step counts were numerically greater on the warmer side. Although formal comparisons did not demonstrate significant asymmetry between colder and warmer deviations from the optimum, the confidence interval at the 10 °C deviation was wider on the warmer than on the colder side, indicating greater uncertainty in the warm-side estimate. Therefore, the absence of statistically significant asymmetry should not be interpreted as evidence of a symmetric association. Rather, the present findings are insufficient to determine whether the temperature–step count relationship differs between colder and warmer conditions. Overall, daily step counts in later life appear to vary in association with deviations from an environmentally favorable temperature range.
Importantly, this study was conducted in a region recognized for its high longevity. Our previous study in this cohort reported high levels of objectively measured moderate-to-vigorous physical activity [21], substantially exceeding current global recommendations [36], suggesting that this was a relatively active cohort. Even within this relatively active population, daily step counts varied considerably across temperature conditions, suggesting that ambient temperature remains relevant to ambulatory activity. Although the clinical significance of the observed changes in daily step counts remains uncertain, meta-analytic evidence indicates that each additional 1000 steps/day is associated with a lower risk of all-cause mortality [37]. Accordingly, the larger reductions observed in the present study may be practically relevant, whereas the implications of smaller reductions remain uncertain. In the context of global climate change, these findings are particularly relevant. Both warmer and colder conditions relative to the estimated optimum were associated with lower daily step counts. Because regular physical activity, including walking, is strongly associated with a lower risk of mobility limitation and disability in older adults [38], understanding how daily step counts vary across environmental temperature conditions may contribute to broader efforts to support long-term mobility and healthy aging. Longitudinal evidence further suggests that declines in physical capacity may begin decades before older age and accelerate later in life [39], underscoring the importance of supporting mobility across the life course.
From a public health perspective, temperature-responsive strategies may be helpful for maintaining daily step counts across varying weather conditions. Given that large-scale evidence from Japan has also demonstrated substantial regional variation in daily step counts and associations with neighborhood walkability [40], strategies to support ambulatory activity may need to consider multiple dimensions of the surrounding environment. During hot periods, improving access to climate-controlled environments and encouraging activity during cooler times of day may facilitate safe physical activity. During colder periods, reducing environmental barriers to walking, such as unsafe pathways or limited indoor options, may help maintain activity levels. When outdoor walking is restricted, structured home-based exercise programs delivered through healthcare services or community-based health initiatives may provide a feasible alternative [41,42]. Such approaches may help support daily physical activity among older adults across varying temperature conditions.
The current study had several strengths, including objective step measurement using validated triaxial accelerometers, repeated daily observations, geographically aligned meteorological data, and flexible modeling of non-linear exposure–response relationships using mixed-effects approaches. The estimated optimal temperature remained broadly consistent in the analysis restricted to observations with available sleep records, supporting the robustness of the main findings.
However, several limitations should be acknowledged. First, applying a standardized sleep window when sleep-diary data were unavailable may have introduced some misclassification of waking wear time. However, the estimated optimal temperature and overall temperature–step count relationship were similar in the sensitivity analysis restricted to observations with available sleep records. Second, the observed mean daily step count substantially exceeded national survey averages for Japanese adults aged ≥65 years (5329 steps/day for men and 4419 steps/day for women) [43]. This discrepancy likely reflects a combination of factors, including potential selection bias toward relatively healthy older adults due to recruitment through a municipal health check-up program (i.e., a healthy volunteer effect) [44], recruitment from a high-longevity region, a potential Hawthorne effect [45], and methodological differences such as the use of the low-frequency extension filter, which may yield higher step-count estimates than the normal filter [46,47]. Therefore, the generalizability of our findings to less active older populations, including frailer individuals and those with mobility limitations, as well as to populations living in regions with different climatic or sociocultural characteristics, may be limited, particularly with respect to the identified optimal temperature and exposure–response pattern. Additionally, methodological differences may limit direct comparability with studies using different accelerometer settings. Third, the cross-sectional design precludes causal inference, and the observed associations should be interpreted as correlational. Fourth, meteorological exposure was assessed at the city level using data from a single observatory, which may not fully capture individual-level microclimatic variation or indoor environmental conditions. Moreover, humidity, which may modify perceived heat stress, and other unmeasured environmental factors, such as air quality, were not included in the analysis, and residual confounding cannot be excluded. Fifth, although repeated daily measurements were available, each assessment covered a relatively short period of approximately one week. Consequently, the within-participant range of temperature exposure was limited, and the estimated population-level temperature–step count relationship partly reflects differences in temperature exposure across participants and assessment periods. Sixth, the optimal temperature and exposure–response pattern estimated for the overall population may not apply uniformly across age groups. In exploratory analyses, the interaction between temperature and age was statistically significant (p = 0.033), suggesting that the temperature–step count relationship may vary with age. Age-stratified analyses further suggested greater temperature-related variation in predicted step counts among participants aged ≥75 years than among those aged 65–74 years (Supplementary Table S3). Finally, step counts reflect total ambulatory activity but do not distinguish between indoor and outdoor walking. Indoor climate control, including air conditioning and heating, may buffer the influence of outdoor temperature on ambulatory activity, potentially attenuating the observed association between outdoor temperature and total daily step counts. Despite these limitations, our findings provide insight into the association between ambient temperature and daily step counts in later life. Future multicentre longitudinal studies using longer-term repeated measurements across multiple seasons and individual-level assessments of indoor and outdoor environmental exposures are warranted to further clarify the temperature–step count relationship and its generalizability. Such studies should also examine whether these associations differ according to baseline mobility, habitual activity levels, and health status, and evaluate the effectiveness of climate-adaptive strategies for maintaining physical activity.
5. Conclusions
Daily mean temperature exhibited a clear inverted U-shaped association with objectively measured daily step counts among community-dwelling older adults. Step counts peaked at approximately 20 °C and declined as temperatures deviated from this optimum toward both colder and warmer conditions. Even among relatively active older adults living in a high-longevity region, ambient temperature was associated with substantial variation in daily step counts. These findings highlight the importance of considering environmental temperature in understanding daily ambulatory activity and may inform climate-adaptive strategies to support physical activity and healthy longevity. Future multicentre longitudinal studies across diverse older populations and environmental settings are needed to confirm the generalizability of these findings.
Supplementary Materials
The following supporting information can be downloaded at https://www.mdpi.com/article/10.3390/jgg74030031/s1. Figure S1: Schematic illustration of triaxial accelerometer placement; Figure S2: Flow diagram of participant selection; Table S1: Sensitivity analyses excluding extreme values of daily step counts and daily mean temperature; Table S2: Estimates for meteorological covariates in the adjusted model of daily step counts; Table S3: Age-stratified associations between daily mean temperature and daily step counts.
Author Contributions
Conceptualization, K.S.; methodology, K.S.; software, H.S.; validation, N.H.; formal analysis, H.S.; investigation, M.K., H.K. and A.Y.; data curation, K.S. and H.S.; writing—original draft preparation, K.S.; writing—review and editing, N.H., H.S. and Y.M.; visualization, K.S.; supervision, S.M.; project administration, S.O.; funding acquisition, Y.M. All authors have read and agreed to the published version of the manuscript.
Funding
This research was funded by the Japan Society for the Promotion of Science (JSPS) KAKENHI (Grant Numbers 19K11301, 22K11452, and 25K14460) and by the Japan Science and Technology Agency (JST) through the COI-NEXT Program (Grant Number JPMJPF2210).
Institutional Review Board Statement
The study was conducted in accordance with the Declaration of Helsinki and was initially approved by the Ethics Review Board of Kyoto Prefectural University of Medicine on 10 July 2017 (protocol code ERB-C-885). Subsequent amendments were approved by the Ethics Review Board, most recently on 23 October 2025 (protocol code ERB-C-885-9).
Informed Consent Statement
Written informed consent was obtained from all subjects involved in the study.
Data Availability Statement
The data presented in this study are not publicly available owing to privacy and ethical restrictions but are available from the corresponding author on reasonable request, subject to approval by the Ethics Review Board of Kyoto Prefectural University of Medicine.
Acknowledgments
The authors thank all participants in the Kyotango Longevity Cohort Study and the staff of Kyotango City Yasaka Hospital for their support with data collection and study coordination.
Conflicts of Interest
The authors declare no conflicts of interest. The funders had no role in the design of the study; in the collection, analyses, or interpretation of data; in the writing of the manuscript; or in the decision to publish the results.
Abbreviations
| BMI | body mass index |
| CI | confidence interval |
| SD | standard deviation |
References
- GBD 2019 Diseases and Injuries Collaborators. Global burden of 369 diseases and injuries in 204 countries and territories, 1990–2019. Lancet 2020, 396, 1204–1222. [Google Scholar] [CrossRef]
- Beard, J.R.; Officer, A.; de Carvalho, I.A.; Sadana, R.; Pot, A.M.; Michel, J.P.; Lloyd-Sherlock, P.; Epping-Jordan, J.E.; Peeters, G.M.E.E.G.; Mahanani, W.R.; et al. The World report on ageing and health: A policy framework for healthy ageing. Lancet 2016, 387, 2145–2154. [Google Scholar] [CrossRef] [Scilit]
- Paluch, A.E.; Bajpai, S.; Bassett, D.R.; Carnethon, M.R.; Ekelund, U.; Evenson, K.R.; Galuska, D.A.; Jefferis, B.J.; Kraus, W.E.; Lee, I.M.; et al. Daily steps and all-cause mortality: A meta-analysis of 15 international cohorts. Lancet Public Health 2022, 7, e219–e228. [Google Scholar] [CrossRef] [Scilit]
- Ding, D.; Nguyen, B.; Nau, T.; Luo, M.; Del Pozo Cruz, B.; Dempsey, P.C.; Munn, Z.; Jefferis, B.J.; Sherrington, C.; Calleja, E.A.; et al. Daily steps and health outcomes in adults: A systematic review and dose-response meta-analysis. Lancet Public Health 2025, 10, e668–e681. [Google Scholar] [CrossRef] [Scilit]
- Shimoda, T.; Tomida, K.; Nakajima, C.; Kawakami, A.; Shimada, H. Dose-response relationships of daily steps with disability incidence and all-cause mortality stratified by age and physical frailty. J. Am. Med. Dir. Assoc. 2025, 26, 105356. [Google Scholar] [CrossRef] [Scilit]
- Nishi, M.; Nagamitsu, R.; Matoba, S. Association between daily step counts and healthy life years: A national cross-sectional study in Japan. BMJ Health Care Inform. 2024, 31, e101051. [Google Scholar] [CrossRef] [Scilit]
- Tucker, P.; Gilliland, J. The effect of season and weather on physical activity: A systematic review. Public Health 2007, 121, 909–922. [Google Scholar] [CrossRef] [Scilit]
- Althoff, T.; Ivanovic, B.; King, A.C.; Hicks, J.L.; Delp, S.L.; Leskovec, J. Countrywide natural experiment links built environment to physical activity. Nature 2025, 645, 407–413. [Google Scholar] [CrossRef] [Scilit]
- Kenney, W.L.; Craighead, D.H.; Alexander, L.M. Heat waves, aging, and human cardiovascular health. Med. Sci. Sports Exerc. 2014, 46, 1891–1899. [Google Scholar] [CrossRef] [Scilit]
- Shephard, R.J.; Aoyagi, Y. Seasonal variations in physical activity and implications for human health. Eur. J. Appl. Physiol. 2009, 107, 251–271. [Google Scholar] [CrossRef] [Scilit]
- Togo, F.; Watanabe, E.; Park, H.; Shephard, R.J.; Aoyagi, Y. Meteorology and the physical activity of the elderly: The Nakanojo Study. Int. J. Biometeorol. 2005, 50, 83–89. [Google Scholar] [CrossRef] [Scilit]
- Ho, J.Y.; Goggins, W.B.; Mo, P.K.H.; Chan, E.Y.Y. The effect of temperature on physical activity: An aggregated timeseries analysis of smartphone users in five major Chinese cities. Int. J. Behav. Nutr. Phys. Act. 2022, 19, 68. [Google Scholar] [CrossRef] [Scilit]
- Crosby, K.M.; Adams, B.; Zambrano Garza, E.; Bourbonnais, M.L.; Fenton, M.; Hoppmann, C.; Jakobi, J.M. The effects of weather on physical activity and sedentary behaviour in older adults. Front. Sports Act. Living 2025, 6, 1468911. [Google Scholar] [CrossRef] [Scilit]
- IPCC. Climate Change 2023: Synthesis Report. Contribution of Working Groups I, II and III to the Sixth Assessment Report of the Intergovernmental Panel on Climate Change; Intergovernmental Panel on Climate Change: Geneva, Switzerland, 2023. [Google Scholar] [CrossRef] [Scilit]
- Arai, H.; Ouchi, Y.; Toba, K.; Endo, T.; Shimokado, K.; Tsubota, K.; Matsuo, S.; Mori, H.; Yumura, W.; Yokode, M.; et al. Japan as the front-runner of super-aged societies: Perspectives from medicine and medical care in Japan. Geriatr. Gerontol. Int. 2015, 15, 673–687. [Google Scholar] [CrossRef] [Scilit]
- Sakamoto, R. Aging in Southeast Asia and Japan: Challenges and opportunities. Geriatr. Gerontol. Int. 2025, 25, 837–854. [Google Scholar] [CrossRef] [Scilit]
- Kitani, T.; Matoba, S.; Naito, Y.; Horvath, S.; Yoshimori, T.; Chan, F.K.L.; Matsuda, T.; Bandini, S.; Nakagami, H.; Morishita, R.; et al. Towards global healthy longevity: Report from the 1st World Longevity Summit in Kyotango, Japan. npj Aging 2025, 11, 89. [Google Scholar] [CrossRef] [Scilit]
- Naito, Y.; Takagi, T.; Inoue, R.; Kashiwagi, S.; Mizushima, K.; Tsuchiya, S.; Itoh, Y.; Okuda, K.; Tsujimoto, Y.; Adachi, A.; et al. Gut microbiota differences in elderly subjects between rural city Kyotango and urban city Kyoto: An age-gender-matched study. J. Clin. Biochem. Nutr. 2019, 65, 125–131. [Google Scholar] [CrossRef] [Scilit]
- Yamamoto, Y.; Yamamoto, T.; Miyamoto, N.; Kinoshita, K.; Nishikawa, S.; Adachi, T.; Takizawa, S.; Inoue, R.; Matoba, S.; Kanamura, N. Oral function and the oral microbiome in the elderly in the Kyotango area. Dent. J. 2024, 12, 16. [Google Scholar] [CrossRef] [Scilit]
- Yasuda, T.; Takagi, T.; Naito, Y.; Inoue, R.; Mizushima, K.; Asaeda, K.; Hashimoto, H.; Kitae, H.; Uchiyama, K.; Ouchi, N.; et al. Sarcopenia-related gut microbiota in the elderly: Insights from the longevity region of Kyotango and its nutritional associations. Gut Microbes Rep. 2025, 2, 2591561. [Google Scholar] [CrossRef] [Scilit]
- Kubo, M.; Hishikawa, N.; Shinjo, H.; Ohashi, S.; Sawada, K.; Matoba, S.; Mikami, Y. Physical activity associations with physical function and body composition among community-dwelling older adults in Japan: The Kyotango Longevity Cohort Study. Geriatr. Gerontol. Int. 2025, 25, 1511–1517. [Google Scholar] [CrossRef] [Scilit]
- Yamashita, Y.; Kitazawa, K.; Okada, H.; Ushigome, E.; Fukuoka, H.; Yoshii, K.; Yamanaka, R.; Iwamoto, Y.; Takahara, S.; Fukui, M.; et al. Involvement of best-corrected visual acuity in sarcopenia: Findings from baseline analysis of the Kyotango longevity cohort study. Jpn. J. Ophthalmol. 2026, 70, 751–758. [Google Scholar] [CrossRef] [Scilit]
- Hishikawa, N.; Sawada, K.; Shinjo, H.; Kimura, H.; Yamanaka, A.; Sakurai, M.; Ohashi, S.; Matoba, S.; Mikami, Y. Associations between 24-h movement behavior composition and muscle health in community-dwelling older adults: The Kyotango Longevity Cohort Study. Healthcare 2026, 14, 2176. [Google Scholar] [CrossRef] [Scilit]
- Yamanaka, A.; Sawada, K.; Hishikawa, N.; Shinjo, H.; Kubo, M.; Kimura, H.; Ohashi, S.; Matoba, S.; Mikami, Y. Ambient temperature and 24-hour movement behaviors in community-dwelling older adults in Japan: The Kyotango Longevity Cohort Study. Ann. Geriatr. Med. Res. 2026; ahead of print. [CrossRef] [Scilit]
- von Elm, E.; Altman, D.G.; Egger, M.; Pocock, S.J.; Gøtzsche, P.C.; Vandenbroucke, J.P. The Strengthening the Reporting of Observational Studies in Epidemiology (STROBE) Statement: Guidelines for Reporting Observational Studies. PLoS Med. 2007, 4, e296. [Google Scholar] [CrossRef] [Scilit]
- Japan Meteorological Agency. Various Data and Materials. Available online: https://www.data.jma.go.jp/stats/etrn/index.php (accessed on 22 February 2026).
- Cain, K.L.; Conway, T.L.; Adams, M.A.; Husak, L.E.; Sallis, J.F. Comparison of older and newer generations of ActiGraph accelerometers with the normal filter and the low frequency extension. Int. J. Behav. Nutr. Phys. Act. 2013, 10, 51. [Google Scholar] [CrossRef] [Scilit]
- Korpan, S.M.; Schafer, J.L.; Wilson, K.C.; Webber, S.C. Effect of ActiGraph GT3X+ position and algorithm choice on step count accuracy in older adults. J. Aging Phys. Act. 2015, 23, 377–382. [Google Scholar] [CrossRef] [Scilit]
- Drake, E.; Ekblom, M.M.; Ekblom, Ö.; Kallings, L.V.; Blom, V. Cardiorespiratory fitness and device-measured sedentary behaviour are associated with sickness absence in office workers. Int. J. Environ. Res. Public Health 2020, 17, 628. [Google Scholar] [CrossRef] [Scilit]
- Choi, L.; Liu, Z.; Matthews, C.E.; Buchowski, M.S. Validation of accelerometer wear and nonwear time classification algorithm. Med. Sci. Sports Exerc. 2011, 43, 357–364. [Google Scholar] [CrossRef] [Scilit]
- Troiano, R.P.; Berrigan, D.; Dodd, K.W.; Mâsse, L.C.; Tilert, T.; McDowell, M. Physical activity in the United States measured by accelerometer. Med. Sci. Sports Exerc. 2008, 40, 181–188. [Google Scholar] [CrossRef] [Scilit]
- Hart, T.L.; Swartz, A.M.; Cashin, S.E.; Strath, S.J. How many days of monitoring predict physical activity and sedentary behaviour in older adults? Int. J. Behav. Nutr. Phys. Act. 2011, 8, 62. [Google Scholar] [CrossRef] [Scilit]
- Dooley, E.E.; Pompeii, L.A.; Palta, P.; Martinez-Amezcua, P.; Hornikel, B.; Evenson, K.R.; Schrack, J.A.; Pettee Gabriel, K. Daily and hourly patterns of physical activity and sedentary behavior of older adults: Atherosclerosis Risk in Communities (ARIC) study. Prev. Med. Rep. 2022, 28, 101859. [Google Scholar] [CrossRef] [Scilit]
- Obradovich, N.; Fowler, J.H. Climate change may alter human physical activity patterns. Nat. Hum. Behav. 2017, 1, 0097. [Google Scholar] [CrossRef] [Scilit]
- Jones, G.R.; Brandon, C.; Gill, D.P. Physical activity levels of community-dwelling older adults are influenced by winter weather variables. Arch. Gerontol. Geriatr. 2017, 71, 28–33. [Google Scholar] [CrossRef] [Scilit]
- Bull, F.C.; Al-Ansari, S.S.; Biddle, S.; Borodulin, K.; Buman, M.P.; Cardon, G.; Carty, C.; Chaput, J.-P.; Chastin, S.; Chou, R.; et al. World Health Organization 2020 guidelines on physical activity and sedentary behaviour. Br. J. Sports Med. 2020, 54, 1451–1462. [Google Scholar] [CrossRef] [Scilit]
- Jayedi, A.; Gohari, A.; Shab-Bidar, S. Daily step count and all-cause mortality: A dose-response meta-analysis of prospective cohort studies. Sports Med. 2022, 52, 89–99. [Google Scholar] [CrossRef] [Scilit]
- Paterson, D.H.; Warburton, D.E.R. Physical activity and functional limitations in older adults: A systematic review related to Canada’s Physical Activity Guidelines. Int. J. Behav. Nutr. Phys. Act. 2010, 7, 38. [Google Scholar] [CrossRef] [Scilit]
- Westerståhl, M.; Jörnåker, G.; Jansson, E.; Aasa, U.; Ingre, M.; Pourhamidi, K.; Ulfhake, B.; Gustafsson, T. Rise and fall of physical capacity in a general population: A 47-year longitudinal study. J. Cachexia Sarcopenia Muscle 2025, 16, e70134. [Google Scholar] [CrossRef] [Scilit]
- Arai, K.; Kamada, M.; Yoshida, T.; Yamada, I.; Ding, D.; Hino, K. Cross-level regional and socioeconomic inequalities in step counts: A descriptive epidemiological investigation of 1.5 million Japanese smartphone users. Lancet Reg. Health West. Pac. 2026, 72, 101901. [Google Scholar] [CrossRef] [Scilit]
- Thiebaud, R.S.; Funk, M.D.; Abe, T. Home-based resistance training for older adults: A systematic review. Geriatr. Gerontol. Int. 2014, 14, 750–757. [Google Scholar] [CrossRef] [Scilit]
- Solis-Navarro, L.; Gismero, A.; Fernández-Jané, C.; Torres-Castro, R.; Solá-Madurell, M.; Bergé, C.; Pérez, L.M.; Ars, J.; Martín-Borràs, C.; Vilaró, J.; et al. Effectiveness of home-based exercise delivered by digital health in older adults: A systematic review and meta-analysis. Age Ageing 2022, 51, afac243. [Google Scholar] [CrossRef] [Scilit]
- Ministry of Health; Labour and Welfare. National Health and Nutrition Survey Japan, 2023; Ministry of Health, Labour and Welfare: Tokyo, Japan, 2024. Available online: https://www.mhlw.go.jp/content/10900000/001338334.pdf (accessed on 23 February 2026).
- Lindsted, K.D.; Fraser, G.E.; Steinkohl, M.; Beeson, W.L. Healthy volunteer effect in a cohort study: Temporal resolution in the Adventist Health Study. J. Clin. Epidemiol. 1996, 49, 783–790. [Google Scholar] [CrossRef] [Scilit]
- McCambridge, J.; Witton, J.; Elbourne, D.R. Systematic review of the Hawthorne effect: New concepts are needed to study research participation effects. J. Clin. Epidemiol. 2014, 67, 267–277. [Google Scholar] [CrossRef] [Scilit]
- Feito, Y.; Hornbuckle, L.M.; Reid, L.A.; Crouter, S.E. Effect of ActiGraph’s low frequency extension for estimating steps and physical activity intensity. PLoS ONE 2017, 12, e0188242. [Google Scholar] [CrossRef] [Scilit]
- Hicks, H.; Laffer, A.; Meyer, K.; Watts, A. Estimates of physical activity in older adults using the ActiGraph low-frequency extension filter. J. Meas. Phys. Behav. 2021, 4, 118–125. [Google Scholar] [CrossRef] [Scilit]

Disclaimer/Publisher’s Note: The statements, opinions and data contained in all publications are solely those of the individual author(s) and contributor(s) and not of MDPI and/or the editor(s). MDPI and/or the editor(s) disclaim responsibility for any injury to people or property resulting from any ideas, methods, instructions or products referred to in the content. |
© 2026 by the authors. Published by MDPI on behalf of the Italian Society of Gerontology and Geriatrics (SIGG). Licensee MDPI, Basel, Switzerland. This article is an open access article distributed under the terms and conditions of the Creative Commons Attribution (CC BY) license.