


Abstract
Urban services increasingly depend on interconnected sensing, communication, computing, decision-support, and response functions, yet technical performance alone does not establish service effectiveness. This structured integrative review examines WSNs, WBANs, V2X systems, 5G-enabled edge–cloud infrastructures, and prospective 6G capabilities across health, mobility, environmental monitoring, energy, water, infrastructure safety, and climate resilience. A five-database search covering January 2018–March 2025 was supplemented by citation tracing and a documented gap-directed update with a final cutoff of 1 July 2026. The analytical corpus comprised 40 peer-reviewed studies, five deployment cases, and one scope-boundary case. An outcome-mediated perception–network–edge/cloud–decision–response framework enabled categorical comparison of heterogeneous evidence without pooling non-comparable measures. Attribution was classified as T1 (comparatively evaluated downstream outcome), T2 (technical or bounded operational outcome), or T3 (conceptual linkage): three studies were T1, 34 T2, and three T3. Ten studies supported target-level SDG alignment, whereas none reached indicator-level correspondence. Evidence remained concentrated at communication, processing, decision-support, and bounded operational endpoints, with limited assessment of response availability and disruption–recovery conditions. Among the deployment cases, only SFpark supported T1 interpretation. These findings characterize the selected corpus and identify a persistent gap between technical performance and comparative, longitudinal, and distributionally assessed urban-service outcomes.
1. Introduction
Urbanization is increasing pressure on infrastructure, natural resources, public services, and urban ecosystems. The United Nations projects that approximately 68% of the global population will live in urban areas by 2050 [1]. Digital infrastructures can support more responsive, efficient, and resilient urban services, but only when sensing, communication, computing, decision-making, and physical or organizational responses are connected within a clearly defined service boundary.
Urban services are cross-layer socio-technical systems. Environmental monitoring, connected mobility, digital health, adaptive buildings, water and energy management, infrastructure supervision, and emergency response depend on technical components as well as institutional workflows, maintenance, governance, and response capacity [2,3,4]. Improvements in sensing accuracy, latency, prediction, resource allocation, or energy efficiency therefore do not independently demonstrate improved service outcomes.
This review examines wireless sensor networks (WSNs), wireless body area networks (WBANs), vehicle-to-everything communication (V2X), 5G-enabled edge–cloud infrastructures, and prospective 6G capabilities. WSNs support distributed environmental and infrastructure observation; WBANs enable physiological sensing and clinical monitoring; V2X supports mobility-aware exchange and coordination; and 5G-enabled edge–cloud infrastructures provide wide-area connectivity, service differentiation, and distributed processing [5,6,7,8]. Prospective 6G capabilities are treated as extensions of this design space rather than as evidence equivalent to operational deployment [9].
The technologies are analyzed through a perception–network–edge/cloud–decision–response pipeline. This lens identifies the functions represented, the endpoint reached by each evaluation, and the technical, institutional, behavioral, or physical stages remaining outside its boundary. It also distinguishes monitoring-centric, coordination-centric, and closed-loop configurations without treating them as a hierarchy of technological sophistication.
The same outcome-mediated principle guides SDG interpretation. Target-specific relevance is assigned from the evaluated outcome and its service, spatial, temporal, population, asset, and comparison boundaries rather than from a technology or application label [10,11]. The classification protocol is defined in Section 2.6.3.
1.1. Positioning and Research Gap
Smart-city research has examined planning, governance, institutional capacity, stakeholder participation, indicators, and public-value creation [11,12,13,14,15,16,17]. Technology-oriented reviews have synthesized IoT and WSN architectures, WBANs, V2X, 5G/6G systems, edge computing, and digital twins [6,7,8,9,18,19]. These studies provide important insights, but usually adopt a technology family, architecture, application domain, or governance problem as the main unit of analysis.
This separation creates an evidence-boundary gap. Technical studies often report latency, packet delivery, prediction accuracy, energy efficiency, or resource utilization without establishing how far the evaluation extends through the service pathway. Decision and response availability, complete service deadlines, degraded operation, recovery, and appropriate comparators may remain unexamined. Conversely, governance and sustainability studies may discuss public or social value without specifying the technical dependencies, failure modes, and assessment boundaries of the supporting infrastructure.
Existing syntheses therefore rarely examine technology function, pipeline position, integration configuration, evaluation maturity, measured outcome stage, attribution strength, service-level reporting, institutional responsibility, and target-specific SDG relevance within one evidence-bounded framework [4,16,17,20]. They also seldom distinguish routine technical reliability from complete service reliability and resilience under disruption.
This review addresses that gap by adopting the integrated urban-service pipeline as its unit of analysis. It distinguishes demonstrated technical capability, bounded operational effects, and comparatively evaluated downstream outcomes while identifying the interoperability, resilience, lifecycle, governance, response-capacity, and distributional conditions required for sustained service delivery. The purpose is not to rank technologies, but to determine where evidence terminates, which claims it can support, and which implementation conditions remain unresolved.
1.2. Contributions
The review makes three contributions:
- It maps WSNs, WBANs, V2X systems, 5G-enabled edge–cloud infrastructures, and prospective 6G capabilities across perception, communication, processing, decision, and response functions, while distinguishing monitoring-centric, coordination-centric, and closed-loop configurations.
- It introduces an evidence-boundary framework that separates evaluation maturity, measured outcome stage, and attribution strength. It also applies diagnostic constructs for complete service-path delay, deadline-constrained completion, disruption–recovery reporting, and target-specific SDG classification.
- It derives cross-domain implementation conditions concerning interoperability, data quality, resilience, spatial coverage, lifecycle viability, response availability, institutional responsibility, governance, and distributional equity.
Figure 1 summarizes the analytical logic.
Figure 1.
Outcome-mediated interpretation of integrated wireless infrastructures. WSNs, WBANs, V2X systems, 5G-enabled edge–cloud infrastructures, and prospective 6G capabilities support successive urban-service functions. Target-specific SDG relevance is interpreted from the evaluated outcome and its service, spatial, temporal, population, asset, and comparison boundaries rather than from the technology label. The relationships are conceptual and do not represent source frequencies, causal effects, or official indicator-level correspondence.
2. Review Methodology
2.1. Review Design and Analytical Scope
A structured integrative review was conducted to synthesize heterogeneous evidence from communications engineering, computing, urban infrastructure, public-service research, and sustainability studies [21,22]. This design was selected because the evidence base includes conceptual architectures, simulations, laboratory experiments, prototypes, field studies, clinical evaluations, and operational deployments with heterogeneous evaluation settings, outcome measures, comparators, observation periods, and service boundaries. These designs were therefore not ranked through a single intervention-oriented hierarchy, and their raw performance measures were not assumed to be directly commensurable.
The principal unit of analysis was the urban-service pipeline: the sequence through which an observation is sensed, communicated, processed, interpreted, and translated into a decision, service action, or physical response. This unit enabled cross-technology comparison while preserving the distinction between component-level performance and urban-service effectiveness.
The analytical scope focused on five complementary technology families: WSNs, WBANs, V2X systems, 5G-enabled edge–cloud infrastructures, and prospective 6G capabilities. These families represent distinct but interacting functions within wireless urban-service pipelines. WSNs provide distributed environmental and infrastructure sensing; WBANs support body-centric sensing and health-monitoring pathways; V2X provides mobility-dependent communication and coordination; 5G-enabled edge–cloud infrastructures support wide-area connectivity, service differentiation, and distributed computation; and prospective 6G capabilities extend this design space through tighter integration of communication, sensing, localization, non-terrestrial connectivity, and distributed intelligence.
The selection is functional rather than exhaustive. Associated technologies, including LoRaWAN, IoT platforms, digital twins, artificial intelligence, satellite links, UAVs, cloud platforms, and application-specific sensing or control systems, were retained when they formed part of an eligible urban-service pipeline, but they were not treated as separate primary analytical strata. Accordingly, the review does not claim to represent the complete smart-city technology landscape, and technology-level conclusions are bounded to the selected wireless and edge–cloud families.
Three analytically distinct evidence streams were retained: (i) a peer-reviewed core corpus of 40 eligible studies used for source-level coding and descriptive synthesis; (ii) five documented urban-service deployments used for bounded case-level implementation analysis; and (iii) one technological scope-boundary case used to test the inclusion logic. Foundational, methodological, review, standards, governance, official, and deployment-documentation sources informed definitions and interpretation but were excluded from the core-study denominator because their units of analysis and evidentiary roles differed from those of the eligible peer-reviewed studies.
The review addressed five research questions:
- RQ1.
- How do the selected WSN, WBAN, V2X, 5G-enabled edge–cloud, and prospective 6G technology families contribute to urban-service pipelines?
- RQ2.
- Which monitoring-centric, coordination-centric, and closed-loop configurations are represented?
- RQ3.
- Which outcomes are evaluated, and where do the evaluations terminate within the service pipeline?
- RQ4.
- Which technical, spatial, organizational, institutional, and governance conditions affect the transition from prototypes and pilots to sustained urban services?
- RQ5.
- To what extent do the evaluated outcomes support conceptual relevance, target-level alignment, indicator-level correspondence, or no defensible relationship with specific SDG targets?
Peer-reviewed conceptual studies, simulations, laboratory experiments, prototypes, field studies, and operational evaluations were eligible for the core synthesis when they satisfied the criteria in Section 2.3. Reviews, standards, governance literature, municipal evaluations, and institutional documents supported methodological, contextual, and case-level interpretation only.
Review Workflow
Table 1 summarizes the progression from evidence identification through eligibility screening, source-role assignment, coding, and cross-domain synthesis.
Table 1.
Review workflow from evidence identification to cross-domain synthesis.
2.2. Literature Identification
2.2.1. Original Search and Citation Tracing
The principal literature search covered publications issued between January 2018 and 31 March 2025 in five databases: IEEE Xplore, Scopus, the Web of Science Core Collection, the ACM Digital Library, and ScienceDirect. January 2018 was selected as a pragmatic contemporary boundary for examining the increasing integration of established wireless sensing and vehicular-communication technologies with edge–cloud processing and emerging 5G-enabled urban-service architectures. The cutoff was not interpreted as the origin of WSNs, WBANs, V2X, the IoT, or smart-city research, nor as evidence that earlier studies were methodologically obsolete.
Backward and forward citation tracing complemented the date-bounded database search to reduce the risk of excluding earlier empirical evidence that remained directly relevant to the analytical scope. Three pre-2018 empirical studies were retained in the original core corpus because they satisfied the same substantive eligibility and coding requirements as later studies. Foundational concepts, standards, governance sources, and documented deployments identified through citation tracing were assigned their respective methodological, contextual, or case-level roles rather than being excluded solely on the basis of publication date.
The master search combined urban-context, technology, and service-domain terms:
(“smart city” OR “smart cities” OR “sustainable city” OR “urban infrastructure” OR “urban service” OR “urban resilience”)AND(“wireless sensor network” OR WSN OR IoT OR “wireless body area network” OR WBAN OR “wearable sensing” OR VANET OR “vehicle-to-everything” OR V2X OR “C-V2X” OR 5G OR 6G OR “edge computing” OR “fog computing” OR “multi-access edge computing” OR MEC OR “network slicing”)AND(health OR healthcare OR mobility OR transport OR traffic OR “environmental monitoring” OR “air quality” OR water OR energy OR building OR infrastructure OR “emergency response” OR “disaster management” OR “public service”).
The expression was adapted to the searchable fields, operators, indexing structure, and syntax supported by each database. Because the historical record did not preserve every exact database-specific executed string, the expression above reports the common conceptual structure rather than a verbatim reconstruction. Unavailable database-specific queries, retrieval counts, duplicate-removal counts, and screening totals were not reconstructed retrospectively.
Google Scholar was used for citation tracing and bibliographic verification but was not treated as a principal database. Targeted searches were also used to locate standards, governance frameworks, municipal evaluations, official implementation documents, and other sources used for methodological, contextual, or deployment-level interpretation.
2.2.2. Gap-Directed Supplementary Update
A gap-directed supplementary update was conducted in July 2026 after an audit of the original 25-study evidence map identified comparatively limited coverage of health and emergency responses, smart water services, infrastructure safety, climate resilience, geographically diverse urban monitoring, and field-evaluated connected mobility. The purpose of the update was to broaden the evidence base and increase representation of later service-pipeline stages. It was not designed to achieve a predetermined corpus size, domain quota, attribution distribution, SDG distribution, credibility profile, or desired direction of results.
Before execution of the supplementary searches, gap-specific concept blocks were defined for the underrepresented evidence areas. Potentially eligible records already present in the consolidated reference library were reassessed, and additional peer-reviewed studies were identified through the same five principal databases, targeted publisher searches, and backward and forward citation tracing. Records identified through these routes were evaluated using the same substantive eligibility, extraction, credibility, attribution, and SDG-coding rules applied to the original corpus. The six gap-specific concept blocks retained in the review documentation are reported in Table 2.
Table 2.
Gap-specific concept blocks used in the July 2026 supplementary search.
The final search and publication-eligibility cutoff was 1 July 2026. The update concluded after completion of the gap-directed searches and associated citation-tracing activities rather than after attainment of a target number of included studies. Eligibility decisions were made without considering the direction, statistical significance, or favorability of the reported results, or their eventual attribution tier, credibility appraisal, or SDG classification.
The July 2026 update was documented separately from the historical search. Its documentation boundary, including information preserved and execution-level fields unavailable in the retained archive, is reported in Section 2.2.3 and Supplementary Table S2.
The reassessment added 15 eligible peer-reviewed studies to the original 25-study corpus, producing a final analytical corpus of 40 studies. Every added study satisfied the same substantive eligibility and coding requirements as the original records. Reviews, standards, official documents, duplicate reports, context-only publications, and studies lacking either an identifiable urban-service function or a sufficiently interpretable evidence boundary were excluded from the core denominator or retained only in an appropriate methodological, contextual, or case-level role.
2.2.3. Available Search Records and Study-Selection Accounting
For the January 2018–March 2025 component, the five principal databases, common conceptual search structure, temporal boundary, citation-tracing procedure, and final historical core corpus are identifiable. Complete database-specific executed queries, reliable retrieval yields, duplicate-removal counts, and stage-specific screening totals were not preserved and were not reconstructed retrospectively. Supplementary Table S2 records the available search and study-selection information and marks unavailable fields as not preserved.
The July 2026 gap-directed update is treated as a distinct evidence-identification stream. Its final cutoff of 1 July 2026, six gap-specific concept blocks, search-source framework, eligibility procedure, and resulting corpus addition are documented in Supplementary Table S2.
Figure 2 summarizes the evidence assembly. The original search and citation-tracing process produced the 25-study historical core, and the July 2026 update added 15 eligible studies, yielding the final 40-study peer-reviewed analytical corpus. The five deployment cases and the one scope-boundary case were analyzed separately.
Figure 2.
Documented evidence-assembly and study-selection flow. The historical January 2018–March 2025 search and the July 2026 gap-directed update are shown separately. Unpreserved historical retrieval, deduplication, and screening counts are identified as unavailable and were not reconstructed. The 25-study historical core and 15-study supplementary addition yielded the final 40-study peer-reviewed analytical corpus. Deployment and scope-boundary cases were analyzed separately.
The study is a structured integrative review with a documented gap-directed update, rather than a systematic review with a fully reproducible search history for the entire publication period. The resulting counts and cross-domain contrasts characterize the selected analytical corpus and are not estimates of the wider smart-city literature or deployment population.
2.3. Eligibility and Source Roles
A source qualified for the core synthesis when it fulfilled the following:
- Addressed an identifiable urban, municipal-service, infrastructure, or urban-application problem;
- Examined a substantive function of at least one selected technology family;
- Defined an interpretable technical and service-pipeline boundary;
- Reported a technical, operational, or downstream outcome, or provided an explicit conceptual or architectural linkage to an identifiable urban-service pipeline.
Component-, network-, and processing-level studies were retained only when the source explicitly situated the evaluated function within an identifiable urban-service architecture or application and the evaluated boundary could be determined. A measured downstream outcome was not required because the review was designed to identify where evidence terminated. However, a generic smart-city label or prospective application claim without an explicit urban-service function was insufficient.
For health-related studies, the physical location of a hospital or clinical ward was not, by itself, treated as evidence of urban-service relevance. Eligibility required an explicit connection to an urban, community, public, or smart-city health-service pathway, or to source-defined wireless infrastructure supporting such a pathway. The source-based eligibility rationale for each retained health record was documented in the coding matrix.
The same conservative rule was applied to task offloading, resource allocation, spectrum efficiency, antenna and link performance, one-way delay, and radio-access load. Such studies were eligible only when the source-defined setting or architecture made the supported urban-service function explicit. They were assigned to the cross-domain enabling-infrastructure group when their measured endpoints remained at component, network, or processing stages.
Table 3 summarizes the eligibility rules and analytical source roles.
Table 3.
Eligibility criteria and analytical roles assigned to the reviewed sources.
Source-Role Accounting
The final core synthesis comprised 40 eligible peer-reviewed studies. Five documented deployments were examined separately at the case level, and one case was retained to clarify the technological scope boundary. Other references supported definitions, methodology, technology background, standards, governance interpretation, official SDG metadata, deployment documentation, and implementation analysis.
The core and deployment analyses used different units: the former coded individual peer-reviewed studies, whereas the latter examined complete documented service configurations. These streams were not treated as independent evidence when the same source informed both. In particular, Bons et al. contributed to source-level coding and to interpretation of the Flexpower deployment. Deployment descriptions without an independently assessable evaluation design were retained only for case-level interpretation.
2.4. Screening, Coding, and Internal Consistency
Screening and coding were conducted collaboratively by the author team. The retained internal audit record documents final consensus decisions and reconciled source-level classifications. Because the historical component does not preserve a complete record-by-record sequence of independent pre-consensus ratings, independently duplicated screening and retrospective inter-rater agreement cannot be claimed.
The July 2026 update was documented separately. Supplementary Table S2 distinguishes preserved documentation from unavailable execution-level search or screening fields; unavailable values were not reconstructed. Uncertain eligibility, attribution, and SDG classifications were discussed until a consensus was reached, and ambiguous cases received the lower defensible classification.
The operational definitions in Section 2.6.1, Section 2.6.2 and Section 2.6.3 were applied to every core record. The final consistency audit covered eligibility, technology-family and analytical-group assignment, pipeline functions, integration configuration, evaluation maturity, measured outcome stage, attribution tier, target-specific SDG interpretation, principal evidence boundary, and the service-level reporting elements described in Section 2.5.
Aggregate counts were recalculated from the final 40-record coding matrix and reconciled across the main-text aggregate tables, Supplementary Table S3, the Abstract, and the corresponding narrative. This procedure supports internal consistency but does not substitute for preserved independent screening or coding decisions.
Consequently, Cohen’s or another retrospective inter-rater agreement statistic was not calculated. Final consensus classifications were not retrospectively treated as independent pre-consensus ratings because such a calculation would provide a misleading measure of coding reproducibility. Source-level classifications are reported in Supplementary Table S3, study-level credibility dimensions in Supplementary Table S1, and available search and study-selection documentation in Supplementary Table S2.
The following conservative decision rules were applied:
- Ambiguous cases received the lower defensible attribution tier or SDG classification;
- Field implementation or operational use alone did not establish T1 attribution;
- Evaluation maturity, measured outcome stage, attribution strength, and credibility dimensions were coded separately;
- Missing information was recorded as not reported or not demonstrated, as appropriate, rather than interpreted as evidence that a function, condition, comparator, safeguard, or evaluation procedure was absent;
- Author-reported SDG associations were distinguished from classifications assigned by the review;
- Prospective 6G capabilities were not treated as evidence equivalent to operational deployment;
- Contextual and case-level evidence was excluded from aggregate source counts unless the underlying peer-reviewed study independently satisfied the core-corpus eligibility criteria;
- No study was retained solely to achieve a desired corpus size, domain quota, attribution profile, credibility profile, or SDG distribution.
2.5. Data Extraction and Credibility Appraisal
For each core study, the extracted information included the following:
- Bibliographic information, technology family, analytical group, and source-based urban-service eligibility rationale;
- Represented pipeline functions, processing location, and integration configuration;
- Evaluation setting, geographic context, service boundary, comparator, and measured outcome stage;
- Reported component, network, processing or decision-support, operational-response, and downstream urban-service outcomes;
- Implementation conditions related to interoperability, maintainability, resilience, affordability, privacy, governance, and equity;
- Evaluation maturity, attribution tier, target-specific SDG interpretation, and principal evidence boundary;
- Comparator suitability, representativeness, uncertainty reporting, technical reproducibility, and completeness of the declared service boundary;
- Coverage of sensing or observation, communication, processing, decision, and response stages; deadline, warning-lead-time, or tail-delay reporting; data-quality requirements; response availability; and, where relevant, disruption onset, reference service level, observation horizon, degraded-service behavior, and recovery criterion.
A conservative reporting audit assessed these elements across the 40 core studies as represented, partially represented, or not reported or outside the evaluated boundary. Representation required explicit inclusion and assessment within the declared evaluation boundary; partial representation indicated a subset, indirect proxy, or incomplete stage. The third category combined elements outside the declared boundary with cases in which reporting was insufficient to establish inclusion and therefore does not imply that the corresponding function was absent from the implemented system.
These classifications identified omitted service stages and incompatible spatial, temporal, operational, or accounting boundaries. They were not used to recalculate source results, construct a pooled performance index, estimate a common effect size, or imply quantitative comparability across heterogeneous studies. An evaluation was described as end-to-end only when the complete pathway to its declared response endpoint was represented. Resilience interpretation additionally required a defined disruption, reference service level, observation interval, degraded-service behavior, and recovery criterion.
Because part of the service-level audit was reconstructed from the final evidence map rather than from independently preserved original coding decisions, it is interpreted as a conservative retrospective recoding of reporting coverage.
Credibility appraisal was conducted separately from evaluation maturity, outcome stage, attribution tier, and SDG interpretation. Four dimensions were operationalized explicitly. Comparator suitability assessed whether the comparator, baseline, control condition, reference method, or counterfactual was appropriate to the claim and compatible with its evaluation boundary. Representativeness assessed whether the evaluated population, physical setting, spatial coverage, operating conditions, or validation design supported the scope of the claim. Uncertainty reporting assessed whether variability or uncertainty was characterized through repeated runs, interval estimates, sensitivity analysis, validation variability, or another design-appropriate procedure. Technical reproducibility assessed whether methods, system configuration, data or data provenance, algorithms, experimental conditions, and evaluation procedures were described sufficiently to permit independent reconstruction in principle.
Each applicable dimension was classified conservatively as adequate or limited/not sufficiently demonstrated. Not applicable was used only when a dimension was not meaningful for the design or claim. A narrow experimental setting was not classified as inadequate solely because of its scale when the interpretation was explicitly bounded to that setting, and the absence of a comparator was not treated as a deficiency for a genuinely non-comparative conceptual study unless a comparative-effectiveness claim was made.
Because these dimensions were made explicit after consolidation of the historical evidence map, the study-level appraisal is reported as a conservative retrospective credibility audit rather than as a preserved independent-coder dataset. Missing or ambiguous reporting received the lower defensible classification and was not interpreted as evidence that an unreported procedure had not been performed.
The resulting judgments for all 40 core studies are reported in Supplementary Table S1, while Supplementary Table S3 provides the complete source-level evidence map, including the principal evidence boundary used in the synthesis. These supplementary materials expose individual credibility dimensions and source-level classifications without converting heterogeneous study designs into a single quality ranking.
A single formal risk-of-bias instrument was not applied because no available intervention-oriented instrument provides comparable judgments across all design types represented in the review. Conceptual architectures, simulations, laboratory experiments, engineering prototypes, clinical comparisons, field pilots, and operational deployments were therefore interpreted within their respective evaluation boundaries rather than forced into a common intervention-specific risk-of-bias scale.
2.6. Classification Framework
Each core study was mapped to the perception–network–edge/cloud–decision–response chain and classified by integration configuration, evaluation maturity, measured outcome stage, attribution strength, and target-specific SDG interpretation. These dimensions were coded separately so that maturity, pipeline position, attribution strength, and sustainability relevance were not collapsed into a single ranking.
2.6.1. Integration Configuration
Three non-exclusive configurations were used:
- Monitoring-centric: observation, dashboarding, alerting, or condition assessment without a directly evaluated control action;
- Coordination-centric: routing, scheduling, prioritization, dispatch, resource allocation, or coordination among actors or system components;
- Closed-loop: connection of sensing and decision functions to an identifiable operational or physical response.
Combined codes were permitted. Closed-loop status was not inferred from a prediction, recommendation, or optimization model unless an operational or physical response was included within the evaluated boundary. The classification describes functional coupling and does not imply full automation, causal effectiveness, or stronger attribution.
2.6.2. Evaluation Maturity, Outcome Stage, and Attribution
Evaluation maturity and attribution strength were treated as distinct dimensions. Evaluation maturity describes the setting and degree of empirical implementation, whereas attribution describes the strongest claim supported by the evaluated endpoint and comparison design. Maturity was classified as conceptual or architectural (CA), analytical or simulation-based (A), laboratory or testbed-based (L), prototype or implemented framework (P), field study or pilot (FP), or operational deployment (O). Combined codes were assigned when a study contained more than one substantive evaluation setting.
Outcome position was mapped to component or sensing, network or communication, processing or decision-support, operational response, or downstream urban-service stages. When a study reported measured outcomes at several stages, all substantive stages were retained. For conceptual T3 records, a pipeline stage could also indicate the location of an explicitly proposed function within the service architecture; such structural mapping was not interpreted as evidence that an outcome at that stage had been empirically demonstrated.
Maturity and outcome position were coded independently. A field or operational deployment can therefore remain at a network, processing, or bounded operational endpoint, whereas a less technologically complex evaluation can provide stronger downstream evidence when it evaluates an appropriate service-level outcome against a defensible comparator.
Attribution strength was classified using three mutually exclusive tiers:
- T1: Comparatively evaluated downstream outcome. A downstream health, environmental, social, economic, safety, accessibility, resilience, resource-efficiency, or other urban-service outcome was evaluated against an explicit and fit-for-purpose comparator under a sufficiently documented intervention and assessment boundary.
- T2: Technical or bounded operational outcome. A substantive component, network, processing, decision-support, control, or bounded operational effect was quantitatively or empirically evaluated, but the evidence did not combine a downstream urban-service endpoint with the comparative basis required for T1.
- T3: Conceptual linkage. An operational or urban-service benefit was proposed through an architectural, conceptual, or prospective relationship, but the source did not provide a sufficiently evaluated technical, operational, or downstream outcome to support that linkage beyond the conceptual level.
The classification followed a decision sequence. A study was assigned T3 when no sufficiently evaluated outcome supported the proposed urban-service linkage. An evaluated technical, processing, decision, control, operational, or downstream outcome qualified the study for at least T2. Assignment to T1 additionally required a downstream urban-service outcome and an explicit comparator appropriate to that claim.
For T1, the comparator could be a concurrent or randomized control, conventional operation, or another explicitly defined reference condition, but it had to be aligned with the intervention, population or asset, outcome, and assessment boundary. A loosely specified historical reference, observational contrast, author-reported percentage improvement, or before–after difference was not automatically considered a sufficient counterfactual. Ambiguous comparison designs or intervention boundaries received the lower defensible tier.
T1 identifies comparatively evaluated downstream evidence within the declared intervention boundary; it does not by itself establish low risk of bias, high causal certainty, favorable effectiveness, or city-scale generalizability. Attribution was assigned to the evaluated intervention or program boundary, not automatically to each constituent technical, behavioral, institutional, or physical component. Field or operational use alone did not establish T1.
The direction of the result did not affect tier assignment. A null or unfavorable comparative result could satisfy T1 when the downstream endpoint and comparison design met the criteria, whereas a favorable technical improvement could remain T2 when the downstream service boundary or counterfactual was absent.
Representative boundary cases are summarized in Table 4. For the T1–T2 boundary, Wei and Calautit [23] reach T1 because a downstream electricity-cost outcome is evaluated against conventional control, whereas Ntafalias et al. [24] remain in T2 because their observational baseline does not provide a sufficiently defined counterfactual for stronger downstream attribution. For the T2–T3 boundary, Li et al. [25] reach T2 because task-offloading and resource-allocation outcomes are quantitatively evaluated, whereas Bostani et al. [26] remain in T3 because the claimed urban-service benefits of the LEO–5G/6G architecture remain prospective. Kant et al. [27] further show that a null result can satisfy T1 when both the downstream endpoint and comparison design meet the required criteria.
Table 4.
Representative cases at the T1–T2 and T2–T3 attribution boundaries. Tier assignment depends on the evaluated endpoint and comparison design rather than technological maturity or result direction.
The same conservative classification rules were applied across the complete 40-study coding matrix.
2.6.3. SDG Interpretation
SDG interpretation was assigned after identifying the service objective, evaluated outcome, affected population or asset, spatial and temporal assessment boundary, and comparator:
- C: Conceptual relevance. A plausible target relationship existed, but the target-relevant outcome was not evaluated.
- TL: Target-level alignment. The evaluated outcome fell within the substantive scope of the target but did not reproduce its official indicator.
- I: Indicator-level correspondence. The metric, unit, population or asset base, spatial boundary, and temporal aggregation matched the official indicator definition.
- N: No defensible alignment. No sufficiently specific outcome-mediated relationship could be established.
Indicator-level decisions were checked against official UN target wording and indicator metadata [10,28]. Technology presence, general sustainability motivation, or prospective benefit did not independently support target-level or indicator-level interpretation. Classifications were target-specific, and study-level SDG counts were consequently non-exclusive.
2.6.4. Worked Classification Examples
Attribution tier and SDG interpretation were assigned independently because they answer different evidentiary questions. Bainomugisha et al. [29], for example, provide multi-city operational evidence on urban air-quality monitoring and city-facing digital use. The study remains in T2 because it does not comparatively evaluate exposure reduction, population-health improvement, or another downstream urban-service outcome. Nevertheless, its measured air-quality endpoint supports target-level alignment with Target 11.6. Indicator-level correspondence was not assigned because the evaluated measures were not shown to reproduce the complete official indicator definition in metric, population or asset basis, spatial boundary, and temporal aggregation.
Bostani et al. [26] provide a contrasting boundary. Their LEO–5G/6G architecture connects terrestrial and non-terrestrial communication with the IoT and photovoltaic monitoring, but the expected urban energy and infrastructure benefits remain prospective. The study therefore belongs to T3 and supports conceptual relevance to Targets 7.2 and 9.1 rather than measured target-level alignment.
These examples illustrate why attribution strength and target-specific SDG correspondence were retained as separate dimensions.
2.7. Narrative Synthesis
The 40 core studies were organized into four urban-service domains and one cross-domain enabling-infrastructure group: health and emergency response; mobility and environmental exposure; energy, buildings, and electric mobility; water systems, infrastructure safety, and climate resilience; and cross-domain enabling infrastructure. Studies were compared by technology combination, pipeline configuration, processing location, evaluation maturity, outcome stage, comparator, attribution tier, target-specific SDG interpretation, credibility dimensions, and implementation conditions.
Cross-study normalization was categorical rather than metric. The common coding scaffold enabled comparison of where evidence was generated, where it terminated, and what interpretation it could support without assuming that source-specific measures such as latency, packet delivery, energy use, classification accuracy, clinical outcomes, traffic-control indicators, water-system outcomes, or building-energy measures were numerically interchangeable.
Source-level counts refer only to the 40 selected peer-reviewed studies. Categories permitting multiple assignments were reported as overlapping counts and were not expected to sum to 40, whereas attribution tiers and domain assignments were mutually exclusive. Counts characterize the selected corpus rather than publication, technology, market, deployment, or global-practice shares.
No statistical meta-analysis or common standardized effect size was calculated because the studies differed in architecture, scale, data, evaluation design, comparator, outcome definition, measurement unit, geographic context, and observation period. The synthesis instead emphasized recurring configurations, evidence boundaries, cross-domain contrasts, credibility dimensions, and the conditions under which technical effects could support defensible urban-service interpretations.
3. Technologies Enabling Integrated Urban Services
Wireless sensor networks (WSNs), wireless body area networks (WBANs), vehicle-to-everything (V2X) systems, and 5G-enabled edge–cloud infrastructures occupy complementary positions within urban-service pipelines. WSNs and WBANs extend observation and local preprocessing, V2X adds mobility-aware exchange and coordination, and 5G-enabled edge–cloud infrastructures connect distributed devices to processing, orchestration, and decision functions across wider spatial and organizational boundaries. Prospective 6G capabilities may extend this design space, but their urban-service relevance depends on the evaluated endpoint, comparator, and declared service boundary rather than on the technology label alone.
The following subsections summarize the principal pipeline roles, operational dependencies, and recurring evidence boundaries of each technology family.
3.1. Wireless Sensor Networks
WSNs support distributed observation of environmental conditions, water systems, hazards, and physical infrastructure through low-power sensing nodes connected to gateways, edge devices, or cloud platforms. Applications in the selected corpus include air-quality monitoring, smart parking, water-leak detection, flood early warning, and structural-health monitoring [29,30,31,32,33,34,35,36].
Their principal advantage is persistent, spatially distributed observation at finer temporal and geographic resolution than periodic manual inspection. This advantage depends on representative placement, calibration, sampling frequency, missing-data treatment, device lifetime, gateway availability, and maintenance capacity. Urban variation in land use, built form, terrain, drainage, vegetation, traffic, and population distribution can otherwise turn locally accurate measurements into a biased representation of the affected area, asset, or population.
Recent field studies broaden the operating contexts represented in the corpus. AirQo documents multi-city environmental sensing and city-facing digital platforms; Bakhtawar et al. evaluate hydrophone-based leak classification using multi-month data from operational water networks; Armijo and Zamora-Sánchez examine long-duration monitoring of an in-service railway bridge; and Tedla et al. integrate satellite, forecast, gauge, river-level, and citizen-science information for urban flood warning [29,33,35,36]. These studies strengthen field relevance, but their measured endpoints remain bounded: detection does not establish completed repair or reduced water loss; anomaly alerts do not establish avoided failure or maintained service; and warning performance does not establish receipt, protective action, avoided loss, or recovery.
Local aggregation, adaptive sampling, event-triggered transmission, and edge-based filtering can reduce energy use and backhaul demand [8,34,37]. Such mechanisms should preserve information needed for calibration, validation, provenance, uncertainty assessment, and audit. Sustained operation additionally requires replacement planning, secure data stewardship, assigned maintenance responsibility, and an authorized actor or system capable of initiating a response.
3.2. Wireless Body Area Networks
WBANs connect wearable or implantable devices that measure physiological and activity-related variables, including heart rate, temperature, respiration, glucose, movement, and sleep indicators. Typical architectures combine body-centric sensing, a smartphone or local gateway, edge or cloud processing, and communication with a healthcare platform. The selected corpus includes LoRaWAN–WBAN simulation, hospital-monitoring prototypes, smart-bed validation, automated early-warning systems, postoperative workflows, and comparative wearable-enabled clinical studies [5,6,27,38,39,40,41,42,43].
Measurements may be validated, preprocessed, or converted into alerts at a smartphone, bedside hub, or edge platform before reaching a healthcare service. Technical reliability therefore depends on measurement validity, device energy, body-channel variability, patient mobility, gateway availability, communication continuity, cybersecurity, and interoperability with clinical information systems.
The clinical evidence illustrates the distinction between technical validation and downstream service evaluation. Nunes et al. assess sensing, communication, interoperability, usability, and patient comfort, whereas Reichl et al. validate wearable-derived early-warning scores without using them to guide real-time clinical intervention [40,41]. Skraastad et al. add workflow and nursing-time evidence, while Boehmer et al. and Kant et al. evaluate downstream clinical or service outcomes against explicit comparators [27,42,43]. Their stronger downstream interpretation follows from the evaluated endpoints and comparison designs rather than from the direction of the results.
Service completion extends beyond measurement and transmission to professional review, escalation, intervention, and follow-up. Privacy, consent, clinical validity, affordability, digital literacy, staffing, and continuity of care therefore affect whether technically valid measurements support an accessible and sustained service. Measurement accuracy, classification performance, and alert generation remain distinct from completed care, service access, rehospitalization, safe discharge, and population-health outcomes.
3.3. Vehicle-to-Everything Communication
V2X enables information exchange among vehicles, roadside infrastructure, pedestrians, transport-management platforms, and other road users. Its functions include cooperative awareness, hazard dissemination, traffic coordination, parking guidance, incident management, adaptive signal control, and public-transport prioritization [44,45,46,47,48].
Unlike fixed sensing infrastructures, V2X operates under rapidly changing topology, and timeliness directly affects coordinated action. Performance is influenced by channel load, interference, mobility, handover, roadside coverage, positioning quality, participation rate, and security. Mean latency and packet-delivery ratios may conceal tail delays, correlated losses, localized congestion, and temporary coverage gaps. Evaluation should therefore represent road geometry, traffic demand, infrastructure distribution, fallback mechanisms, and the proportion of participating vehicles and road users.
Han et al. extend the evaluated boundary from network data to an operational traffic-control response by implementing a spillover-mitigation controller using connected-vehicle trajectories across a network of intersections [48]. The reported evidence supports the evaluated traffic-control indicators, but broader claims concerning accessibility, safety, emissions, or network-wide mobility require explicit comparators and compatible spatial and temporal boundaries.
Urban deployment also requires coordination among municipalities, road operators, transport agencies, emergency services, network operators, platform providers, and vehicle manufacturers. Proprietary interfaces and procurement choices may constrain legacy integration, fragment responsibility, or create long-term vendor dependence. Broader mobility claims therefore require measured safety, accessibility, travel-time reliability, exposure, emissions, public-transport performance, or emergency-response outcomes under a credible comparative design.
3.4. 5G-Enabled Edge–Cloud Infrastructure
5G-enabled infrastructures support heterogeneous urban applications through wide-area connectivity, service differentiation, massive machine-type communication, mobility support, and multi-access edge computing [49,50]. Devices and local gateways may perform validation, filtering, and aggregation; edge platforms can support time-sensitive inference and local coordination; and cloud platforms can provide long-term storage, model management, large-scale analytics, and cross-domain integration.
Within an urban-service pipeline, 5G-enabled edge–cloud infrastructure coordinates heterogeneous devices, workloads, mobility patterns, and service requirements across communication and processing stages. Its performance depends on radio-access capacity, backhaul availability, edge placement, virtualization, workload orchestration, cybersecurity, energy demand, interoperability, and institutional ownership.
The selected corpus includes empirical 5G evidence extending beyond conceptual architectures. Private 5G evaluation in an urban vehicular setting provides field evidence on bit rate and latency [50], while field measurements in real 5G environments examine one-way delay and multi-user radio-access behavior [51,52]. These evaluations provide deployment-relevant network evidence but remain primarily bounded to the communication layer, and therefore support T2 rather than comparatively evaluated downstream urban-service effectiveness.
Distributed mobility and handover-recovery mechanisms likewise strengthen network-level continuity [53], but improvements in handover, recovery time, throughput, or radio-access performance do not independently establish improved mobility, safety, accessibility, emergency response, or another downstream service outcome.
Spatial distribution of edge and radio-access resources can also produce unequal service quality across central, peripheral, and lower-connectivity areas. Private or local 5G infrastructures may provide greater operational control while transferring spectrum, financing, maintenance, cybersecurity, and continuity obligations to the operating organization. Vendor-specific platforms and interfaces may further constrain interoperability and create procurement or migration dependence.
Energy and carbon claims require accounting boundaries extending beyond device- or link-level efficiency to relevant radio-access, backhaul, edge, data-center, storage, cooling, utilization, hardware-production, replacement, and maintenance effects [54,55]. A lower communication-energy metric therefore does not automatically establish a lower lifecycle impact when computation, cooling, equipment replacement, shifted demand, or rebound effects remain outside the evaluation.
3.5. Prospective 6G
Prospective 6G research addresses capabilities expected to extend or combine functions that are only partially integrated in current infrastructures, including integrated sensing and communication, AI-supported orchestration, non-terrestrial networks, reconfigurable intelligent surfaces, sub-terahertz communication, distributed intelligence, and advanced localization [9,25,56,57].
For this review, prospective 6G was treated as a distinct evidence stratum rather than as deployment-equivalent evidence continuing directly from operational 5G. The selected 6G-associated evidence is predominantly conceptual, analytical, simulation-based, laboratory-based, or prototype-oriented. Examples include simulated task offloading and resource allocation [25], LEO–terrestrial 5G/6G integration [26], UAV-assisted spectrum optimization [58], and laboratory or analytical evaluation of advanced antenna and link performance [59].
These studies provide evidence on technical feasibility, architecture, resource allocation, propagation, spectrum use, and potential integration mechanisms, but they do not constitute evidence of sustained 6G urban-service deployment. No prospective 6G study in the selected corpus establishes a comparatively evaluated downstream urban-service outcome. Accordingly, this evidence was used to identify emerging capabilities, dependencies, evidence boundaries, and future evaluation requirements rather than demonstrated service effectiveness or deployment readiness.
A simulation-based 6G study can nevertheless qualify as T2 when a substantive technical or processing outcome is quantitatively evaluated, whereas an architectural proposal remains classified as T3 when its expected urban-service benefits are not measured. These attribution tiers describe the evaluated evidence and do not make prospective 6G equivalent to field-tested or operational 5G.
Translation of prospective 6G capabilities into sustainable urban services will depend on hardware and propagation constraints, standardization, interoperability, energy demand, affordability, maintainability, cybersecurity, legacy-system integration, territorial availability, institutional capacity, and equitable access. Comparative field evidence will ultimately be required to establish measurable advantages over existing 5G, edge–cloud, or other service architectures under realistic urban operating conditions.
3.6. Cross-Technology Comparison
The technology families are complementary rather than interchangeable. WSNs and WBANs extend distributed and body-centric sensing, V2X supports mobility-dependent communication and coordination, deployed 5G-enabled edge–cloud infrastructures provide wide-area communication and distributed processing, and prospective 6G explores tighter integration of communication, sensing, localization, non-terrestrial connectivity, and distributed intelligence.
These functional roles do not imply equivalent evidence maturity. The selected 5G evidence includes field network evaluations, whereas prospective 6G evidence remains predominantly conceptual, analytical, simulation-based, laboratory-based, or prototype-oriented. Table 5 consolidates the principal roles, dependencies, representative evidence, and recurring evidence boundaries.
Table 5.
Functional roles, representative evidence, operational dependencies, and recurring evidence boundaries of technologies used in urban-service pipelines. Deployed 5G and prospective 6G are shown separately because their evidence-maturity profiles are not equivalent.
Technological maturity does not automatically imply stronger downstream evidence. Field deployment can remain bounded to a technical endpoint, whereas a narrower evaluation can support T1 when it includes both an explicit comparator and a downstream service outcome; conversely, a quantitatively evaluated prospective 6G study can provide T2 technical evidence without constituting deployment evidence. The strongest defensible claim therefore depends on the measured endpoint, comparator, evaluation maturity, and declared service boundary.
4. Analytical Framework for Integrated Urban-Service Pipelines
4.1. Service Boundaries and Integration Configurations
An urban-service pipeline is interpreted according to the functions included between observation and response. Its analytical boundary identifies where an event is detected, which communication and processing stages are represented, where the outcome is measured, and which human, institutional, behavioral, or physical functions remain outside the evaluation. A received packet, validated alert, operator decision, completed service action, and downstream urban outcome are therefore successive but non-equivalent endpoints.
The monitoring-centric, coordination-centric, and closed-loop configurations defined in Section 2.6.1 differ primarily in decision–response coupling. Monitoring-centric pipelines terminate at observation, dashboarding, alerting, or condition assessment; coordination-centric pipelines use distributed information to allocate, prioritize, route, schedule, or dispatch resources; and closed-loop pipelines extend the evaluated boundary to an identifiable operational or physical response.
These configurations are non-exclusive and may represent different operating states of the same service. Closed-loop operation does not imply full automation because authorization, execution, escalation, and accountability may remain human-mediated or institutionally controlled. The classification therefore captures functional coupling rather than technological sophistication, causal effectiveness, or attribution strength.
The selected corpus reinforces this distinction: monitoring and coordination functions are widely represented, whereas completed response and downstream service outcomes are less common. Figure 3 summarizes the differences in decision–response coupling, timing, assurance requirements, and feedback intensity.
Figure 3.
Monitoring-centric, coordination-centric, and closed-loop urban-service pipelines. The configurations differ in decision–response coupling, timing, assurance requirements, and feedback intensity, and may coexist as operating states of the same service. Closed-loop classification indicates that an operational or physical response lies within the evaluated boundary; it does not imply full automation, causal effectiveness, or stronger attribution.
4.2. Evaluation Dimensions
Evaluation of an integrated urban service must extend beyond isolated component performance to the conditions under which a technically valid result remains timely, reliable, representative, maintainable, legitimate, equitable, and actionable. Five complementary dimensions were used as a qualitative appraisal framework to expose failure modes and evidence boundaries that a single performance metric may conceal (Table 6). They were not combined into a numerical quality score.
Table 6.
Evaluation dimensions for integrated urban-service pipelines.
4.2.1. Diagnostic Service-Level Reporting Constructs
The following constructs provide a common diagnostic vocabulary for examining complete service-path delay, deadline-constrained completion, and performance during disruption. They make the information required for a service-level claim explicit and distinguish a reported technical endpoint from a complete service boundary. They were used to assess reporting coverage in the 40-study corpus; they were not used to recompute source results, impute unreported quantities, estimate pooled effects, construct a composite quality index, or impose quantitative comparability across heterogeneous domains.
The observed service time is defined as the interval between the initial observation relevant to the service and completion of the declared response:
When the stages included within the declared service boundary are sequential and non-overlapping, this interval can be decomposed as
The terms denote sensing or observation, communication, processing, decision, and operational or physical response within the declared service boundary. Equation (2) is not assumed to be literally additive when stages overlap, execute in parallel, or follow asynchronous workflows. In such cases, it serves as a stage-coverage template indicating which temporal components are represented and which remain outside the evaluated boundary.
Accordingly, reporting or alone does not establish complete service-path timeliness when sensing, decision, or response time is unreported. The term end-to-end was therefore reserved for evaluations that represent the complete path to their declared response endpoint. For time-sensitive services, relevant reporting may additionally require deadline-miss rates, percentile or tail delay, warning lead time, or another application-appropriate measure of time-critical performance.
A deadline-constrained service-completion event can be represented as
with corresponding service reliability
Here, D is the service deadline; denotes the set of data-quality dimensions required for the declared service; is an adequacy measure oriented so that larger values indicate better performance; and is the minimum acceptable value for dimension j. denotes whether the human, institutional, or automated response function required by the declared service is available when needed.
Equations (3) and (4) make explicit that successful communication is only one condition of reliable service completion. A packet may satisfy a network-level delay target while the complete service fails because information is insufficiently accurate or fresh, the decision occurs too late, or the required response function is unavailable.
Equation (4) is quantitatively estimable only when the underlying study provides repeated service-completion observations or a sufficiently specified probabilistic model. When these data were unavailable, no numerical value was inferred; the components of Equation (3) were instead used to determine which service elements were represented within the source’s evaluation boundary.
For a disrupted service, normalized performance over a prespecified horizon can be represented as
where is the reference service level, is the delivered service level at time t, denotes disruption onset, and H is the observation horizon. Clipping constrains normalized service performance to , such that . Higher values indicate greater retention or restoration of the reference service level over the specified horizon.
The horizon H does not imply that recovery has been completed by . Interpretation additionally requires explicit definitions of the reference service level, disruption onset, minimum acceptable operating state, degraded-service behavior, recovery criterion, and observation horizon [60]. Routine reliability and resilience were therefore treated as distinct constructs.
Equation (5) was not evaluated numerically when a source lacked the required disruption and recovery information. Resilience was considered fully represented only when the source defined a disruption or perturbation, an interpretable reference service level, an observation interval, degraded-service behavior, and a recovery endpoint or criterion. Partial failure testing without a complete disruption–recovery boundary was coded as partial representation.
4.2.2. Illustrative Application
Grohmann et al. [51] report one-way delay in a real 5G field setting. Within Equation (2), this represents , but does not establish the sensing, processing, decision, or operational-response components required for complete . The data-quality and response-availability conditions in Equation (3) are also outside the evaluated boundary. Accordingly, the study represents network-level timing but does not establish complete service-path timing or service reliability .
Armijo and Zamora-Sánchez [35] report long-duration field monitoring and operational alerts for a railway-bridge digital twin. This represents several upstream pipeline stages and bounded operational monitoring. However, the evidence does not establish all elements required for a complete disruption–recovery assessment: disruption onset , reference service level , degraded-service trajectory, minimum acceptable service state, and recovery criterion. The study therefore provides resilience-relevant operational evidence without establishing complete service resilience.
Table 7 summarizes these two examples.
Table 7.
Application of the diagnostic service-level constructs to two source-level reporting examples.
The elements associated with Equations (1)–(5) were classified as represented, partially represented, or not reported or outside the evaluated boundary, according to the rules in Section 2.5.
Energy and carbon assessment likewise requires explicit accounting boundaries covering, as applicable, communication, processing, storage, cooling, equipment production and replacement, utilization, maintenance, decommissioning, and useful service outputs. A common intensity expression was not imposed because the reviewed studies use incompatible functional units, system boundaries, and observation periods.
4.3. Evidence Boundaries, Attribution, and SDG Interpretation
Evaluation maturity, attribution strength, and SDG interpretation were applied as distinct dimensions using the definitions in Section 2.6.2 and Section 2.6.3. Interpretation proceeded from the evaluated pipeline endpoint and service boundary to the evaluation setting and comparator, followed by attribution tier and target-specific SDG classification. Neither field deployment nor technological novelty therefore determined the strength of an urban-service claim.
For each source, interpretation followed four steps:
- Identify the evaluated pipeline endpoint and declared service boundary;
- Determine the evaluation setting, comparator, and maturity;
- Assign the T1–T3 tier from the measured outcome and evaluation design;
- Assess target-specific SDG relevance against the official target wording and, where applicable, indicator metadata.
Target-level alignment required a measured outcome within the substantive scope of a specific target. Indicator-level correspondence additionally required agreement in metric, unit, population or asset base, spatial boundary, and temporal aggregation [10,11,28]. Author-reported SDG associations were retained as source information but were not adopted without an outcome-mediated relationship supported by the evaluation. This procedure prevents sustainability language, technology presence, or deployment status from being treated as evidence of target achievement.
5. Cross-Domain Synthesis of Urban-Service Pipelines
The final core corpus comprises 40 peer-reviewed studies assigned to four urban-service domains and one cross-domain enabling-infrastructure group: health and emergency response (); mobility and environmental exposure (); energy, buildings, and electric mobility (); water systems, infrastructure safety, and climate resilience (); and cross-domain enabling infrastructure (). Studies in the final group were retained because their source-defined settings identified an urban-service function, although their evaluated endpoints remained predominantly at component, network, or processing stages.
Figure 4 summarizes the domain distribution, attribution profiles, typical evaluated endpoints, target-specific SDG interpretation, and principal evidence boundaries.
Figure 4.
Cross-domain synthesis of the 40 core peer-reviewed studies. Domain assignments and attribution tiers are mutually exclusive. Each panel reports the domain-specific T1–T3 profile, typical evaluated endpoints, target-specific SDG interpretation, and principal evidence boundary. TL denotes target-level alignment, C denotes conceptual relevance, and N denotes no defensible target-specific alignment. SDG classifications may overlap because they were assigned separately for each relevant target; no core study met the requirements for indicator-level correspondence.
5.1. Coded Evidence Profile
Each core study was coded for integration configuration, evaluation maturity, measured outcome stage, attribution tier, and target-specific SDG interpretation. Attribution tiers and domain assignments were mutually exclusive; the other dimensions could receive multiple assignments. Table 8 reports the resulting profile.
Table 8.
Coded profile of the 40 core peer-reviewed studies. Percentages use . Attribution tiers are mutually exclusive; categories in the other dimensions may overlap and are not expected to sum to 100%.
The SDG values are non-exclusive study-level counts because classifications were assigned separately for each relevant target.
5.2. Coverage of Service-Level Reporting Elements
The conservative audit described in Section 2.5 classified each diagnostic element as represented, partially represented, or not reported or outside the evaluated boundary. These categories describe reporting coverage rather than overall methodological quality. They need not match the outcome-stage counts in Table 8: outcome-stage coding locates measured outcomes, whereas the audit records whether a stage or condition appears within the declared evaluation boundary.
Processing was represented in 29 studies, communication in 23, decision in 20, and sensing or observation in 19, whereas only 11 explicitly represented an operational or physical response. No study separately evaluated the availability of the required human, institutional, or automated response function; only two explicitly assessed a deadline, warning lead time, tail-delay, or deadline-miss condition; and none fully evaluated a complete disruption–recovery boundary. The corpus therefore supports stronger claims about technical capability and bounded operation than about complete service reliability or resilience.
5.3. Urban Health and Emergency Response
The eight studies cover WBAN and LoRaWAN simulation, hospital-monitoring prototypes, wireless smart-bed validation, automated early-warning scores, postoperative monitoring workflows, sensor-guided heart-failure management, and wearable-supported discharge decisions [5,27,38,39,40,41,42,43].
Six studies provide T2 evidence because their evaluations terminate at communication, physiological measurement, agreement, usability, workflow, or bounded operational endpoints. Boehmer et al. and Kant et al. reach T1 because they combine explicit comparators with downstream health-service outcomes: rehospitalization and safe discharge, respectively. The null result reported by Kant et al. does not alter its T1 classification because the tier depends on endpoint and comparison design.
Target-level alignment was assigned only to these two comparative studies. Other relationships with Targets 3.4, 3.8, and 3.d remain conceptual because technical validity or monitoring availability alone does not establish treatment effectiveness, service access, or health-system preparedness.
5.4. Mobility and Environmental Exposure
The ten studies address urban air-quality sensing, smart parking, traffic-density estimation, VANET security and quality of service, edge-assisted mobility, private 5G, traffic-signal control, mobile crowd sensing, connected-vehicle trajectory control, and the multi-city AirQo platform [29,31,32,44,46,47,48,50,61,62].
All ten studies remain in T2. Han et al. extend the evaluated boundary to field-tested traffic-signal response at 13 intersections but do not establish a controlled traveler-level accessibility, safety, or network-wide mobility outcome. Sun et al. and AirQo support target-level alignment with Target 11.6 through evaluated air-quality monitoring functions; AirQo also broadens geographic representation through multi-city African deployment and city-facing digital tools. Nonetheless, neither study comparatively evaluates exposure reduction or population-health effects.
5.5. Energy, Buildings, and Electric Mobility
The nine studies connect communication infrastructure, meters, building sensors, legacy equipment, heating controllers, charging systems, distributed energy resources, and facility or utility platforms [23,24,54,55,63,64,65,66,67].
The group comprises one T1, seven T2, and one T3 study. Six studies support target-level alignment with at least one of Targets 7.2, 7.3, or 9.4, producing seven study–target TL assignments. Ntafalias et al. remain in T2 because their two-site field evidence relies on an observational baseline, whereas Wei and Calautit reach T1 by comparing IoT-based model-predictive heating control with conventional control using electricity-cost outcomes within a controlled-room boundary.
Interpretation remains sensitive to accounting and temporal boundaries: short-term changes in energy, cost, or demand do not automatically establish building-stock, distributional, or lifecycle outcomes when comfort, battery degradation, embodied impacts, equipment replacement, or rebound effects remain outside the evaluated boundary.
5.6. Water Systems, Infrastructure Safety, and Climate Resilience
The six studies cover smart-environment architectures, flood prediction, AIoT leak detection in operational water networks, massive-IoT water-distribution frameworks, railway-bridge digital twins, and community-based flood early warning [33,34,35,36,68,69].
Five studies provide T2 evidence and one provides T3 evidence; none reach T1. Field evidence includes seven months of water-network monitoring and new-site leak-classification validation, two years of monitoring on an in-service railway bridge, and a validated one-day flood-warning method using multiple data sources. These evaluations strengthen technical and bounded operational evidence but do not establish completed repair, reduced water loss, avoided failure, maintained transport service, warning receipt, protective action, avoided loss, or recovery. Relationships with Targets 6.4, 9.1, 11.5, 11.6, and 13.1 therefore remain conceptual.
5.7. Cross-Domain Enabling Infrastructure
Seven studies evaluate communication or computing functions explicitly situated within urban-service architectures [25,26,51,52,53,58,59]. Their evaluated functions include task offloading and resource allocation, LEO–terrestrial 5G/6G integration, spectrum efficiency, antenna and link performance, one-way delay, multi-user radio-access load, and distributed mobility management.
Deployed 5G and prospective 6G were treated as distinct evidence strata. The two Grohmann studies provide field measurements of one-way delay and multi-user RAN behavior in real 5G environments [51,52]; their evaluated boundaries remain at the network layer, so both remain in T2 despite their field maturity.
The 6G-associated studies are predominantly conceptual, analytical, simulation-based, laboratory-based, or prototype-oriented. Li et al., Alnakhli, and Griffiths et al. provide T2 technical evidence on, respectively, task offloading and resource allocation, multi-UAV spectrum efficiency, and antenna/link performance [25,58,59]. Bostani et al. illustrate the T2–T3 boundary by remaining in T3 because the expected urban-service benefits of their LEO–5G/6G IoT and photovoltaic-monitoring architecture are prospective [26]. The corresponding relationships with Targets 7.2 and 9.1 therefore remain conceptual.
Islam et al. provide a mixed-generation example in which 5G/6G mobility-management and handover-recovery mechanisms strengthen T2 evidence on network continuity without reaching a downstream mobility-service outcome [53]. Overall, six of the seven studies are classified as T2 and one as T3; none reach T1. Field 5G evidence therefore supports empirical claims about real-network behavior, whereas prospective 6G evidence supports technical feasibility, architectural capability, and future evaluation requirements rather than operational 6G deployment or downstream urban-service effectiveness.
5.8. Domain-Level Evidence Summary and Source-Level Traceability
The complete source-level evidence map of all 40 core peer-reviewed studies is provided in Supplementary Table S3, including integration configuration, evaluation maturity, outcome stage, attribution tier, target-specific SDG interpretation, and the principal evidence boundary.
Table 9 provides a complementary qualitative synthesis across seven urban-service themes—health, mobility, environmental monitoring, energy and buildings, water, infrastructure safety, and climate resilience—plus cross-domain enabling infrastructure. Because several formal analytical groups combine related service areas, these thematic rows are not new mutually exclusive study-level denominators.
Table 9.
Compact synthesis of represented evidence and principal remaining gaps across urban-service domains. Rows are qualitative themes and are not mutually exclusive study-level denominators.
Across these themes, the dominant limitation is incomplete progression from technical or bounded operational performance to a comparatively evaluated service outcome. Health and energy/building research contain the limited T1 evidence in the selected corpus, whereas the remaining service domains and cross-domain enabling studies more commonly terminate at monitoring, network, processing, control, or bounded operational stages.
5.9. Cross-Domain Findings
Five principal findings emerge from the final 40-study corpus.
First, evidence is substantially stronger for technical capability and bounded operational performance than for comparatively evaluated downstream urban-service outcomes. Only three studies combine an explicit comparator with a downstream outcome, confirming that evaluation maturity does not itself determine attribution strength.
Second, the downstream evidence boundary is domain-specific, as summarized in Table 9. The principal unresolved transitions are from monitoring or workflow to completed care in health; from connectivity and control to accessibility, safety, and network-wide outcomes in mobility; from measurement to exposure or health effects in environmental monitoring; from short-term operation to longitudinal and lifecycle effects in energy; and from detection, monitoring, or warning to completed response, avoided loss, continuity, or recovery in water, infrastructure safety, and climate resilience.
Third, ten studies support target-level alignment with at least one SDG target, whereas none reach indicator-level correspondence. Target-level alignment indicates that an evaluated outcome falls within the substantive scope of a target; it should not be interpreted as measured progress against an official indicator unless the metric, unit, population or asset base, spatial boundary, and temporal aggregation also correspond to the indicator definition.
Fourth, deployed 5G and prospective 6G constitute distinct evidence-maturity strata. Field 5G studies support empirical claims about network behavior, whereas prospective 6G studies predominantly support technical feasibility, architectural capability, and future evaluation requirements rather than operational deployment or demonstrated urban-service effectiveness.
Fifth, consistent with Table 10, reporting becomes less complete toward the downstream and resilience boundaries of the service pipeline. Communication and processing are represented more consistently than response-function availability, complete service deadlines, and disruption–recovery conditions. The evidence base is therefore stronger for routine technical and bounded operational performance than for complete service reliability, resilience, equity, and sustained public value.
Table 10.
Coverage of diagnostic service-level reporting elements across the 40 core peer-reviewed studies. Percentages use ; each row sums to 40 studies.
The July 2026 supplementary update broadened representation across clinical settings, African cities, operational water networks, an in-service railway bridge, connected intersections, and an urbanizing East African catchment, but this broader coverage does not establish statistical representativeness or transferability across different institutional, socioeconomic, climatic, fiscal, or infrastructure contexts.
Taken together, the synthesis supports an outcome-boundary interpretation rather than a ranking of technologies or domains. The strongest defensible claim depends on the measured endpoint, fit-for-purpose comparator, evaluation maturity, and declared service, spatial, temporal, population, institutional, and accounting boundaries.
6. Documented Deployments and Implementation Lessons
Five documented urban-service deployments were examined using the urban-service pipeline framework: SFpark, Flexpower Amsterdam, Breathe London, Singapore’s Smart Water Grid, and connected LED street lighting in Los Angeles. The cases were purposively selected as implementation exemplars rather than as a statistically representative sample. They complement the 40 peer-reviewed core studies by showing how technical functions, organizational arrangements, operational responses, and evidence boundaries interact in documented real-world service settings.
A deployment was retained for case-level analysis when the available documentation established the following: (i) an identifiable urban-service objective; (ii) an operational implementation beyond a purely conceptual architecture; (iii) an interpretable service pipeline linking technical infrastructure to a decision, operational action, or response function; (iv) at least one documented technical, operational, service, or implementation outcome; and (v) sufficient information to identify an evaluation, interoperability, maintenance, governance, response-capacity, or transferability boundary. Initiatives for which the urban-service objective, operational configuration, evaluated outcome, or service boundary could not be established with sufficient confidence were not retained as deployment cases.
The case set was not derived from an exhaustive international registry, and a complete candidate-level exclusion log was not preserved. The five retained cases should therefore not be interpreted as the most important, successful, or representative smart-city deployments. Other initiatives may fall outside the analytical case set when the available documentation does not establish an interpretable operational configuration, documented outcome, or traceable service boundary. SELENA+ is considered separately in Section 6.1 as a scope-boundary example because its digital-service relevance was clear, whereas its fit with the selected wireless-infrastructure scope was not.
Peer-reviewed evidence was preferred where available. Municipal, institutional, and other official implementation documents were used to establish deployment scale, operating context, service functions, institutional responsibility, maintenance arrangements, or governance conditions. Such documentation was interpreted within its stated reporting boundary and was not treated as equivalent to an independently controlled evaluation.
The deployment cases were analyzed separately from the 40-study peer-reviewed corpus because their source types, evaluation designs, units of analysis, and evidentiary roles differ. They were used to examine how technical infrastructure connects to an operational service function, which endpoints are documented, which organizational or institutional dependencies are visible, and where the available evidence boundary terminates.
All five cases are located in high-income settings with comparatively mature infrastructure and institutional capacity. The case set is therefore subject to geographic, documentation, continuation, and success-selection effects: well-resourced programs that remain operational and generate accessible documentation are more likely to be visible than suspended, unsuccessful, contested, informally operated, or resource-constrained deployments. Implementation lessons are consequently analytically transferable rather than statistically generalizable and require reassessment in cities with different fiscal, technical, institutional, regulatory, workforce, maintenance, and service-delivery conditions.
Table 11 compares each deployment’s service pipeline, documented endpoint, attribution tier, target-specific SDG interpretation, principal evidence boundary, and implementation lesson.
Table 11.
Documented urban-service deployments and their evidence boundaries.
Only SFpark supports T1 interpretation, and only at the integrated local-program boundary. The other four cases provide T2 monitoring or bounded operational evidence. Breathe London and the Los Angeles connected-lighting program support target-level alignment with at least one SDG target; the remaining mappings are conceptual, and none reach indicator-level correspondence. These differences illustrate why operational maturity, service-function completion, attribution strength, and SDG interpretation must remain distinct.
6.1. Scope-Boundary Example: SELENA+
SELENA+ was retained as a scope-boundary test and was not counted among the five deployment cases. Its documented workflow connects retinal-image acquisition and quality control to AI-assisted analysis, human review, referral, and clinical follow-up [74]. The program is relevant to digital health-service delivery, but the available documentation does not establish a substantive WSN, WBAN, V2X, 5G-enabled edge–cloud, or comparable wireless-infrastructure function of the type selected for the present technology synthesis.
Its treatment as a boundary case illustrates the technology-and-pipeline eligibility rule: digital-service importance alone was insufficient for inclusion when the substantive relationship to the selected wireless infrastructure families could not be established. The reported diagnostic and screening-process outcomes also do not establish disease management, treatment uptake, continuity of care, equitable access, or downstream population-health effects. Relationships with Targets 3.4 and 3.8 therefore remain conceptual within the evidence available to this review. SELENA+ consequently illustrates both a technological-scope boundary and an outcome boundary.
6.2. Cross-Case Implementation Lessons
Cross-case synthesis used structured qualitative comparison rather than numerical aggregation, direct performance ranking, or frequency counting. Each deployment was examined using the same implementation dimensions: service completion and intervention boundary; data quality and interoperability; institutional capacity and ownership; comparator adequacy and attribution; assurance, degraded operation, and recovery; distributional effects; and learning, adaptation, or exit arrangements.
A finding was classified as recurrent when the same implementation dependency or evidentiary boundary was identified in at least two of the five deployment cases. Conditions not demonstrated across multiple cases, but whose limited reporting constrained claims concerning resilience, equity, long-term operation, or transferability, were classified as transferability requirements rather than recurrent findings.
Because the cases differ in service objective, technical scope, scale, geographic and institutional context, and evaluation design, they were not treated as directly comparable in performance terms. The common unit of comparison was the relationship among the technical subsystem, operational service boundary, documented outcome, comparator or reference condition, and organizational capacity required to complete the service pipeline.
Four findings met the recurrent criterion. Service completion and intervention boundary were supported by SFpark, Flexpower, Singapore’s Smart Water Grid, and Los Angeles’s lighting, with Breathe London providing a monitoring-boundary contrast. Data quality and interoperability were supported by Breathe London and Singapore’s Smart Water Grid. Institutional and maintenance continuity was supported by SFpark, the Smart Water Grid, and Los Angeles’s lighting. Comparator and attribution boundaries were supported by SFpark, Flexpower, and Los Angeles’s LED lighting.
Table 12 summarizes the cross-case traceability of the recurrent implementation findings and transferability requirements.
Table 12.
Cross-case traceability of recurrent implementation findings and transferability requirements. Recurrent findings are supported by at least two deployment cases; other dimensions are retained as requirements when multi-case evidence is insufficient.
Assurance and recovery, equity and distributional effects, and explicit learning, adaptation, or exit rules did not meet the recurrent criterion. Their limited multi-case documentation restricts stronger claims concerning resilience, distributional performance, and long-term transferability.
Figure 5 groups the resulting findings and requirements into four themes: service completion, operational continuity, attribution and evaluation, and assurance and adaptation.
Figure 5.
Cross-case implementation framework derived from the five documented deployment cases. Recurrent findings are distinguished from transferability requirements identified through limitations in the available case evidence. The four themes concern service completion, operational continuity, attribution and evaluation, and assurance and adaptation. The figure does not represent case frequencies, comparative rankings, causal effects, or globally generalizable implementation requirements.
Cross-case synthesis therefore concerns recurring implementation dependencies and evidence boundaries rather than comparative performance. Transferability requires reassessment of fiscal and technical resources, procurement and vendor dependence, workforce capacity, legacy infrastructure, regulation, institutional authority, maintenance responsibility, service-response capacity, and distributional effects. Transfer to settings with constrained maintenance budgets, fragmented governance, weaker connectivity, limited institutional capacity, or substantial informal-service provision remains particularly uncertain because none of the five retained cases represent such a setting.
7. Discussion
The principal finding is an outcome-boundary gap rather than a lack of technical evidence. Across the 40-study corpus, most evaluations establish component, network, processing, decision-support, or bounded operational performance, whereas only three combine an explicit comparator with a downstream health-service or building-energy outcome. The deployment cases reinforce the same distinction: program-level evidence may support a downstream interpretation without isolating the contributions of individual technical, behavioral, physical, or institutional components.
7.1. From Technical Functions to Urban-Service Outcomes
Technology-oriented smart-city reviews commonly organize evidence by architecture, protocol, application, or enabling platform [2,9,45]. The present synthesis adds an outcome-boundary interpretation. Latency, packet delivery, prediction accuracy, sensing quality, and energy efficiency describe necessary technical functions, but service effectiveness additionally depends on the operational and institutional functions that convert information into an authorized, feasible, and completed response. A mature or field-tested system may therefore remain in T2 when its evaluation stops before a downstream service outcome.
The three T1 studies illustrate that downstream comparative evidence is not tied to a particular technology family. Boehmer et al. and Kant et al. compare wearable-enabled clinical strategies with control conditions and measure health-service outcomes [27,43], while Wei and Calautit compare IoT-enabled heating control with conventional control using a building-energy cost outcome [23]. T1 identifies a comparatively evaluated downstream endpoint within the declared intervention boundary; it does not independently establish low risk of bias, high causal certainty, favorable effectiveness, or city-scale generalizability.
The reporting audit further shows that the outcome-boundary gap is also a reporting-boundary gap. Processing was represented in 29 studies, communication in 23, decision in 20, and sensing or observation in 19, whereas only 11 explicitly represented an operational or physical response. No study separately evaluated response-function availability, and none fully specified the disruption–recovery boundary (Table 10). Routine technical reliability should therefore not be interpreted as complete service reliability or resilience.
This limitation is especially relevant in time-sensitive health, mobility, emergency, and infrastructure services. Service-complete evaluation should identify the relevant processing location, workload, territorial coverage, tail behavior, deadline or warning condition, fallback arrangement, and availability of the required human, institutional, or automated response [45,51,52]. Resilience additionally requires a defined reference service level, disruption onset, minimum acceptable operating state, observation interval, degraded-service behavior, and recovery criterion.
The distance from technical performance to downstream outcomes nevertheless varies by domain. Health contains two comparative service evaluations, while most WBAN evidence terminates at measurement, communication, warning, usability, or workflow. Energy and building studies more often reach target-relevant operational outcomes. Mobility, water, infrastructure, and climate-resilience studies increasingly include field-tested control, real-network monitoring, and warning systems [33,35,36,48], but generally stop before accessibility, safety, repaired leakage, avoided failure, protective action, service continuity, or recovery. Cross-domain enabling studies remain concentrated at offloading, spectrum, antenna, link, handover, delay, or radio-access endpoints.
Processing placement also introduces a service-dependent boundary. Local validation, aggregation, and inference can reduce delay, backhaul demand, and data disclosure, whereas remote platforms can support coordination, longitudinal analysis, model management, and cross-domain learning. Aggressive local filtering may, however, remove information needed for recalibration, bias detection, incident reconstruction, or audit. Edge–cloud allocation should therefore be justified against the consequences of delay, disconnection, erroneous inference, and data loss for the specific service.
The remaining evidentiary step is to connect technical or bounded operational performance to a comparatively evaluated downstream endpoint, such as completed clinical or emergency response, reduced exposure, improved accessibility, avoided loss, restored service, sustained resource efficiency, or verified public value. Such outcomes require compatible temporal, spatial, operational, population, and accounting boundaries so that persistence, context dependence, and distributional effects can be assessed.
7.2. Governance, Resilience, Equity, and Urban Scaling
Integrated urban services require both technical and institutional interoperability. Shared interfaces and platforms may enable data exchange, but they do not determine data validity, ownership, decision authority, maintenance responsibility, or accountability for service failure [2,62]. Sustained operation therefore requires explicit responsibility for calibration, data validation, software and model updates, alert review, incident management, equipment replacement, cybersecurity, and lifecycle financing.
Governance is embedded in design choices concerning sensing density, data retention, processing placement, access control, prioritization, pricing, and automation. These choices distribute authority, benefits, costs, surveillance exposure, and risk among agencies, providers, operators, and residents [4,75,76]. Procurement and contracting can further shape interoperability, data access, maintenance responsibility, service-level obligations, cybersecurity, audit rights, replacement duties, supplier-failure response, and exit options.
AI-supported services introduce additional assurance requirements. Data and model versioning, drift monitoring, threshold documentation, human oversight, fallback behavior, audit trails, and remediation become important when automated or semi-automated outputs influence service allocation or physical response [77,78,79]. Assurance should be proportionate to the consequences of delayed, erroneous, discriminatory, or unavailable decisions and should identify the authority responsible for overriding, suspending, correcting, or retiring the system.
Integration may improve routine coordination while increasing dependence on shared platforms, suppliers, communication links, power systems, and institutional workflows. Resilience must therefore be assessed across the complete socio-technical pathway rather than at the network layer alone. Safe states, local fallback, manual override, minimum-service operation, recovery, and correlated technical–organizational failures are particularly relevant where multiple functions depend on the same infrastructure or organizational resource.
Urban scaling also creates spatial and distributional risks. Citywide averages can conceal differences in connectivity, exposure, affordability, waiting time, monitoring coverage, and response capacity. Performance demonstrated in central or highly connected areas may not transfer to peripheral neighborhoods, informal settlements, or locations with limited maintenance and emergency resources. AirQo and the urban flood-warning study broaden geographic representation [29,36], but do not remove the broader concentration of evidence in comparatively well-documented and institutionally supported settings. Disaggregated evidence remains necessary when benefits, burdens, or service risks may be uneven [75,80,81].
Movement from pilot to sustained service additionally introduces maintenance, cybersecurity, workforce, procurement, replacement, incident-management, and data-stewardship requirements that short demonstrations rarely capture. A credible lifecycle boundary should therefore include installation, calibration, hardware and software replacement, edge/cloud operation, staff training, decommissioning, and embodied impacts. Digital infrastructure complements rather than replaces the physical assets, professional capacity, and institutional authority required to deliver the service.
7.3. Limitations of the Review
This review does not claim exhaustive or statistically representative coverage of the complete smart-city literature. The principal search covered January 2018–March 2025 and was supplemented by backward and forward citation tracing and a documented gap-directed update in July 2026. The update added 15 eligible studies and produced a final core corpus of 40 studies, but it was not a complete rerun of the original five-database search across the full publication period. Counts, percentages, and cross-domain contrasts therefore characterize the selected analytical corpus rather than publication prevalence, technology adoption, deployment frequency, or global smart-city practice.
The historical search record did not preserve every database-specific executed query, retrieval yield, duplicate-removal count, or stage-specific screening and exclusion total, and these values were not reconstructed retrospectively. The July 2026 update was documented separately; its retained record establishes the final cutoff, gap-specific concept blocks, search-source framework, eligibility procedure, and resulting corpus addition. Supplementary Table S2 distinguishes preserved information from execution-level fields unavailable in the retained archive. Complete independent pre-consensus screening and coding decisions were also unavailable for the full corpus; consequently, no retrospective inter-rater agreement statistic, including Cohen’s , was calculated.
The service-reporting and credibility appraisals should likewise be interpreted as conservative retrospective audits rather than independently preserved original coder datasets. Missing or ambiguous reporting was assigned conservatively and was not treated as proof that an unreported function, safeguard, or evaluation procedure was absent. Supplementary Table S1 reports the study-level credibility appraisal, Supplementary Table S3 the complete source-level evidence map, and the Data Availability Statement identifies the available supporting records.
The corpus combines conceptual architectures, simulations, laboratory experiments, prototypes, field pilots, clinical studies, and operational evaluations whose populations, scales, comparators, outcome definitions, measurement units, geographic contexts, and observation periods are not sufficiently homogeneous for direct metric normalization or statistical pooling. Cross-study comparison was therefore categorical rather than metric and does not provide a standardized quality score, common effect size, or pooled estimate of intervention effectiveness.
The five deployment cases were purposively selected from publicly documented programs and are concentrated in comparatively well-resourced and well-documented settings. Their implementation lessons may therefore be affected by geographic, documentation, continuation, and success-selection effects and cannot be transferred directly to cities with different infrastructure, fiscal resources, workforce capacity, institutional arrangements, procurement systems, or informal-service provision.
Finally, the analytical scope was intentionally restricted to WSNs, WBANs, V2X systems, 5G-enabled edge–cloud infrastructures, and prospective 6G capabilities. Associated technologies were considered when they formed part of an eligible urban-service pipeline but were not treated as separate primary strata. The resulting configurations, maturity categories, outcome stages, attribution tiers, service-reporting constructs, credibility dimensions, and SDG classifications are analytical devices for comparing heterogeneous evidence; they do not independently establish causality, deployment readiness, implementation effectiveness, or universal standards of urban-service performance.
7.4. Research Agenda
The evidence synthesized in this review indicates that future work should progress from component-level technical validation toward service-complete, longitudinal, resilient, and institutionally accountable evaluation. Five priorities follow from the recurring evidence boundaries.
- Comparative and longitudinal service evaluation. Future evaluations should define the complete service and accounting boundary, identify the affected population or assets, and prespecify a comparator appropriate to the claim. When the intended claim concerns an urban-service outcome, evaluation should extend beyond link quality, latency, classification performance, or local operational efficiency to outcomes such as completed clinical or emergency response, accessibility, exposure reduction, avoided infrastructure loss, restored service, or sustained energy or water savings. Observation periods should be sufficiently long to capture relevant seasonal, demand, mobility, sensor/model, equipment, software, behavioral, maintenance, supplier, and institutional changes, with compatible temporal, spatial, population, operational, and accounting boundaries.
- Transparent cross-layer reporting and response availability. Studies should report where the evaluated service pathway begins and ends, including sensing or observation, communication, processing location, decision, operational or physical response, and excluded stages required for service completion. Time-sensitive applications should additionally report relevant tail delay, deadline violations, warning lead time, processing and decision latency, data-quality requirements, and the availability of the required response function. Availability of the human, organizational, institutional, or automated response should be distinguished from availability of the digital infrastructure supplying information.
- Resilience, lifecycle effects, and accountable automation. Resilience evaluation should define disruption onset, reference service level, minimum acceptable operation, observation horizon, degraded-service behavior, fallback condition, recovery criterion, and restoration time, and should include correlated failures where relevant. Such failures may involve power, backhaul, cloud or edge infrastructure, sensors, communication congestion, positioning, suppliers, erroneous or malicious data, personnel, or shared organizational processes. Lifecycle assessment should account for hardware replacement, calibration, software maintenance, model retraining, migration, cybersecurity, staffing, procurement, energy use, decommissioning, and embodied impacts. AI-supported services should additionally document model and data versions, validation boundaries, drift detection, decision thresholds, uncertainty handling, fallback, audit trails, human oversight, and authority for intervention or retirement.
- Interoperability, maintainability, and institutional responsibility. Future studies should assess technical interoperability through interface and semantic compatibility, data portability, legacy integration, protocol conformance, and migration between platforms, while also identifying who owns data, validates measurements, maintains equipment, updates software or models, investigates incidents, finances operation, and authorizes service changes. Long-term evaluation should also consider proprietary interfaces, restricted data access, supplier-specific maintenance, licensing, cloud dependence, supplier failure, migration, and exit options.
- Geographically and distributionally broader evidence. Future research should expand beyond well-documented and comparatively well-resourced settings and report geographic coverage together with relevant neighborhood-, population-, or user-level differences in connectivity, exposure, affordability, accessibility, waiting time, sensing coverage, and response capacity. Evidence from lower-resource settings is particularly important for testing architectures that depend on dense connectivity, reliable power, continuous cloud access, specialized maintenance, or strong institutional capacity. Redesigned, suspended, unsuccessful, and contested deployments should also be reported to identify both conditions for scaling and circumstances in which systems should be modified, limited, or discontinued.
Together, these priorities shift evaluation from demonstrating that an integrated wireless system can technically function toward establishing whether it can deliver a durable, measurable, resilient, maintainable, accountable, and equitably distributed urban service.
8. Conclusions
This structured integrative review examined how selected complementary wireless and edge–cloud technology families—WSNs, WBANs, V2X systems, 5G-enabled edge–cloud infrastructures, and prospective 6G capabilities—contribute to urban-service pipelines. The perception–network–edge/cloud–decision–response framework distinguished technology function, integration configuration, evaluation maturity, outcome stage, attribution strength, service-level reporting, credibility, and target-specific SDG interpretation, enabling heterogeneous evidence to be compared categorically without treating incompatible performance measures as directly commensurable.
Among the 40 selected core peer-reviewed studies, three met the T1 criterion for a comparatively evaluated downstream outcome, 34 provided T2 technical or bounded operational evidence, and three provided T3 conceptual evidence. Ten studies supported target-level alignment with at least one SDG target, whereas none met the requirements for indicator-level correspondence. These distributions characterize the selected analytical corpus rather than the wider prevalence of technologies or outcomes. Target-level alignment indicates that an evaluated outcome falls within the substantive scope of an SDG target, but does not constitute measured progress against an official indicator unless the metric, unit, population or asset base, spatial boundary, and temporal aggregation also correspond to the indicator definition.
Across health, mobility, environmental monitoring, energy, water, infrastructure safety, and climate resilience, evidence remained concentrated at component, communication, processing, decision-support, and bounded operational stages. Only 11 studies explicitly represented an operational or physical response within the evaluated boundary; none separately evaluated the availability of the required human, institutional, or automated response function, and none established a complete disruption–degradation–recovery boundary. Among the five separately examined deployment cases, only SFpark supported T1 interpretation at the integrated local-program boundary; the remaining cases provided monitoring or bounded operational evidence.
Deployed 5G and prospective 6G represent distinct evidence-maturity strata. The selected 5G literature includes field evidence from private networks and real-network measurements of one-way delay and multi-user radio-access behavior. In contrast, the selected 6G evidence remains predominantly conceptual, analytical, simulation-based, laboratory-based, or prototype-oriented. It therefore supports claims concerning technical feasibility, architectural capability, and future evaluation requirements, but not operational 6G deployment, deployment readiness, or demonstrated urban-service effectiveness.
The principal finding is an evidence-boundary gap, rather than a ranking of technologies. Evidence is considerably stronger for technical capability and bounded operational performance than for complete service reliability, resilience, equity, and sustained public value. Stronger urban-service claims require a downstream endpoint, a fit-for-purpose comparator, a clearly defined service and accounting boundary, and evidence that the required human, institutional, or automated response can be delivered. Claims of resilience additionally require explicit disruption-onset, degraded-operation, fallback, and recovery evidence rather than routine technical availability alone.
Future work should connect technical performance more directly to comparative downstream outcomes, report response availability and uncertainty, and evaluate lifecycle, disruption–recovery, and distributional conditions across more diverse geographic, socioeconomic, infrastructure, and institutional settings. The central question is not only whether a technology performs well, but whether its capability translates into a measurable, maintainable, resilient, accountable, and equitably delivered urban-service outcome. The strongest defensible claim should therefore be determined by the measured endpoint, comparator, evaluation maturity, and declared service boundary, not by technological generation alone.
Supplementary Materials
The following supporting information can be downloaded at https://www.mdpi.com/article/10.3390/urbansci10090516/s1, Table S1: Study-level credibility appraisal of the 40 core peer-reviewed studies; Table S2: Available search and study-selection records for the historical January 2018–March 2025 search and the July 2026 gap-directed update; Table S3: Complete source-level evidence map of the 40 core peer-reviewed studies.
Author Contributions
Conceptualization, M.M., M.S. and M.I.M.; methodology, M.M., M.S. and M.I.M.; investigation, M.M., M.S., M.I.M., A.G. and D.B.N.; data curation, M.M., M.S., M.I.M., A.G. and D.B.N.; formal analysis, M.M., M.S. and M.I.M.; validation, M.S., M.I.M., A.G. and D.B.N.; visualization, M.M.; writing—original draft preparation, M.M. and M.S.; writing—review and editing, M.S., M.I.M., A.G. and D.B.N.; supervision, M.S. and M.I.M.; project administration, M.M. and M.I.M. All authors have read and agreed to the published version of the manuscript.
Funding
This study is supported via funding from Prince Sattam bin Abdulaziz University project number (PSAU/2026/R/1447).
Institutional Review Board Statement
Not Applicable.
Informed Consent Statement
Not Applicable.
Data Availability Statement
No new primary or experimental data were generated in this review. The supporting review records and coded data used in the synthesis are provided in Supplementary Tables S1–S3.
Acknowledgments
This study is supported via funding from Prince Sattam bin Abdulaziz University project number (PSAU/2026/R/1447).
Conflicts of Interest
The authors declare no conflicts of interest.
References
- United Nations, Department of Economic and Social Affairs, Population Division. World Urbanization Prospects: The 2018 Revision, Methodology; Technical Report; United Nations: New York, NY, USA, 2018. [Google Scholar]
- José, R.; Rodrigues, H. A Review on Key Innovation Challenges for Smart City Initiatives. Smart Cities 2024, 7, 141–162. [Google Scholar] [CrossRef] [Scilit]
- Al Nuaimi, E.; Al Neyadi, H.; Mohamed, N. Applications of Big Data to Smart Cities. J. Internet Serv. Appl. 2015, 6, 25. [Google Scholar] [CrossRef] [Scilit]
- Meijer, A.; Rodríguez-Bolívar, M.P. Governing the Smart City: A Review of the Literature on Smart Urban Governance. Int. Rev. Adm. Sci. 2016, 82, 392–408. [Google Scholar] [CrossRef] [Scilit]
- Bouazzi, I.; Zaidi, M.; Usman, M.; Shamim, M.Z.M.; Gunjan, V.K.; Singh, N. Future Trends for Healthcare Monitoring System in Smart Cities Using LoRaWAN-Based WBAN. Mob. Inf. Syst. 2022, 2022, 1526021. [Google Scholar] [CrossRef] [Scilit]
- Aski, V.J.; Dhaka, V.S.; Parashar, A.; Kumar, S.; Rida, I. Internet of Things in healthcare: A survey on protocol standards, enabling technologies, WBAN architectures and open issues. Phys. Commun. 2023, 60, 102103. [Google Scholar] [CrossRef] [Scilit]
- Shehab, M.J.; Kassem, I.; Kutty, A.A.; Kucukvar, M.; Onat, N.C.; Khattab, T.M.S. 5G Networks Towards Smart and Sustainable Cities: A Review of Recent Developments, Applications and Future Perspectives. IEEE Access 2022, 10, 2987–3006. [Google Scholar] [CrossRef] [Scilit]
- Zaman, M.; Puryear, N.; Abdelwahed, S.; Zohrabi, N. A Review of IoT-Based Smart City Development and Management. Smart Cities 2024, 7, 1462–1501. [Google Scholar] [CrossRef] [Scilit]
- Murroni, M.; Anedda, M.; Fadda, M.; Ruiu, P.; Popescu, V.; Zaharia, C.; Giusto, D. 6G—Enabling the New Smart City: A Survey. Sensors 2023, 23, 7528. [Google Scholar] [CrossRef] [Scilit] [PubMed]
- United Nations. Transforming Our World: The 2030 Agenda for Sustainable Development. Available online: https://sdgs.un.org/2030agenda (accessed on 20 January 2025).
- Huovila, A.; Bosch, P.; Airaksinen, M. Comparative Analysis of Standardized Indicators for Smart Sustainable Cities: What Indicators and Standards to Use and When? Cities 2019, 89, 141–153. [Google Scholar] [CrossRef] [Scilit]
- Caragliu, A.; Del Bo, C.; Nijkamp, P. Smart Cities in Europe. J. Urban Technol. 2011, 18, 65–82. [Google Scholar] [CrossRef] [Scilit]
- Albino, V.; Berardi, U.; Dangelico, R.M. Smart Cities: Definitions, Dimensions, Performance, and Initiatives. J. Urban Technol. 2015, 22, 3–21. [Google Scholar] [CrossRef] [Scilit]
- Neirotti, P.; De Marco, A.; Cagliano, A.C.; Mangano, G.; Scorrano, F. Current Trends in Smart City Initiatives: Some Stylised Facts. Cities 2014, 38, 25–36. [Google Scholar] [CrossRef] [Scilit]
- Angelidou, M. Smart City Policies: A Spatial Approach. Cities 2014, 41, S3–S11. [Google Scholar] [CrossRef] [Scilit]
- Axelsson, K.; Granath, M. Stakeholders’ stake and relation to smartness in smart city development. Gov. Inf. Q. 2018, 35, 693–702. [Google Scholar] [CrossRef] [Scilit]
- Almulhim, A.I.; Yigitcanlar, T. Understanding Smart Governance of Sustainable Cities: A Review and Multidimensional Framework. Smart Cities 2025, 8, 113. [Google Scholar] [CrossRef] [Scilit]
- Peralta Abadía, J.J.; Walther, C.; Osman, A.; Smarsly, K. A systematic survey of Internet of Things frameworks for smart city applications. Sustain. Cities Soc. 2022, 83, 103949. [Google Scholar] [CrossRef] [Scilit]
- Fuller, A.; Fan, Z.; Day, C.; Barlow, C. Digital Twin: Enabling Technologies, Challenges and Open Research. IEEE Access 2020, 8, 108952–108971. [Google Scholar] [CrossRef] [Scilit]
- Bibri, S.E.; Alahi, A.; Sharifi, A.; Krogstie, J. Environmentally Sustainable Smart Cities and Their Converging AI, IoT, and Big Data Technologies and Solutions: An Integrated Approach to an Extensive Literature Review. Energy Inform. 2023, 6, 9. [Google Scholar] [CrossRef] [Scilit] [PubMed]
- Snyder, H. Literature Review as a Research Methodology: An Overview and Guidelines. J. Bus. Res. 2019, 104, 333–339. [Google Scholar] [CrossRef] [Scilit]
- Torraco, R.J. Writing Integrative Literature Reviews: Guidelines and Examples. Hum. Resour. Dev. Rev. 2005, 4, 356–367. [Google Scholar] [CrossRef] [Scilit]
- Wei, Z.; Calautit, J.K. Field Experiment Testing of a Low-Cost Model Predictive Controller (MPC) for Building Heating Systems and Analysis of Phase Change Material (PCM) Integration. Appl. Energy 2024, 360, 122750. [Google Scholar] [CrossRef] [Scilit]
- Ntafalias, A.; Papadopoulos, P.; Ramallo-González, A.P.; Skarmeta-Gómez, A.F.; Sánchez-Valverde, J.; Vlachou, M.C.; Marín-Pérez, R.; Quesada-Sánchez, A.; Purcell, F.; Wright, S. Smart Buildings with Legacy Equipment: A Case Study on Energy Savings and Cost Reduction through an IoT Platform in Ireland and Greece. Results Eng. 2024, 22, 102095. [Google Scholar] [CrossRef] [Scilit]
- Li, W.; Chen, X.; Jiao, L.; Wang, Y. Deep Reinforcement Learning-Based Intelligent Task Offloading and Dynamic Resource Allocation in 6G Smart City. In Proceedings of the 2023 IEEE Symposium on Computers and Communications (ISCC); IEEE: New York, NY, USA, 2023; pp. 575–581. [Google Scholar] [CrossRef] [Scilit]
- Bostani, A.; Baniamerian, A.; Zaher, A.; Shammari, M.A. Smart City Connectivity: Integrating LEO Satellites with 5G/6G for IoT and PV Monitoring. In Proceedings of the 2024 IEEE Smart Cities Futures Summit (SCFC), Marrakech, Morocco, 29–31 May 2024; pp. 50–55. [Google Scholar] [CrossRef] [Scilit]
- Kant, N.; Garssen, S.H.; Vernooij, C.A.; Mauritz, G.J.; Koning, M.V.; Bosch, F.H.; Doggen, C.J.M. Continuous Monitoring by a Wearable Sensor Did Not Enhance Discharge Decision-Making in an Acute Admission Ward: Results of a Randomized Controlled Trial. Stud. Health Technol. Inform. 2024, 316, 1744–1745. [Google Scholar] [CrossRef] [Scilit] [PubMed]
- United Nations Statistics Division. SDG Indicators Metadata Repository. Available online: https://unstats.un.org/sdgs/metadata/ (accessed on 29 July 2026).
- Bainomugisha, E.; Adrine Warigo, P.; Busigu Daka, F.; Nshimye, A.; Birungi, M.; Okure, D. AI-driven environmental sensor networks and digital platforms for urban air pollution monitoring and modelling. Soc. Impacts 2024, 3, 100044. [Google Scholar] [CrossRef] [Scilit]
- Potdar, V.; Sharif, A.; Chang, E. Wireless Sensor Networks: A Survey. In Proceedings of the 2009 International Conference on Advanced Information Networking and Applications Workshops, Bradford, UK, 26–29 May 2009; pp. 636–641. [Google Scholar] [CrossRef] [Scilit]
- Sun, J.; Zhang, Z.; Shen, S.; Zou, Z. An Improved Air Quality Monitoring System Based on Wireless Sensor Networks. In Proceedings of the 2017 2nd International Conference on Communication and Information Systems, Wuhan, China, 7–9 November 2017; pp. 31–36. [Google Scholar] [CrossRef] [Scilit]
- Hilmani, A.; Maizate, A.; Hassouni, L. Designing and Managing a Smart Parking System Using Wireless Sensor Networks. J. Sens. Actuator Netw. 2018, 7, 24. [Google Scholar] [CrossRef] [Scilit]
- Bakhtawar, B.; Fares, A.; Zayed, T. AIoT-Driven Leak Detection in Real Water Networks Using Hydrophones. Water Resour. Manag. 2025, 39, 2551–2566. [Google Scholar] [CrossRef] [Scilit]
- Pagano, A.; Garlisi, D.; Giuliano, F.; Cattai, T.; Taloma, R.J.L.; Cuomo, F. Introducing and evaluating SWI-FEED: A smart water IoT framework designed for large-scale contexts. Comput. Commun. 2025, 237, 108146. [Google Scholar] [CrossRef] [Scilit]
- Armijo, A.; Zamora-Sánchez, D. Integration of Railway Bridge Structural Health Monitoring into the Internet of Things with a Digital Twin: A Case Study. Sensors 2024, 24, 2115. [Google Scholar] [CrossRef] [Scilit] [PubMed]
- Tedla, H.Z.; Bekele, T.W.; Nigussie, L.; Negash, E.D.; Walsh, C.L.; O’Donnell, G.; Haile, A.T. Threshold-based flood early warning in an urbanizing catchment through multi-source data integration: Satellite and citizen science contribution. J. Hydrol. 2024, 635, 131076. [Google Scholar] [CrossRef] [Scilit]
- Kaushik, C.; Vibhath, J.; Nagamani, L.; Reddy, P.A.; Reddy, P.B. Energy Optimization and Optimal Routing Protocol in Wireless Sensor Networks. In Proceedings of the 2022 4th International Conference on Inventive Research in Computing Applications (ICIRCA), Coimbatore, India, 21–23 September 2022; pp. 484–489. [Google Scholar] [CrossRef] [Scilit]
- Rezk, G.S.; Al Bacha, M.; Al Madhoun, D.S.; Saleh, S.S.; Gad, A.; Yaghi, M.; Hassan, T.; Yousaf, J.; Ghazal, M. Advancing Patient Care: A WBAN-Based Sustainable Health Monitoring System for Stress Assessment. In Proceedings of the 2024 11th International Conference on Future Internet of Things and Cloud (FiCloud), Vienna, Austria, 19–21 August 2024; pp. 229–234. [Google Scholar] [CrossRef] [Scilit]
- Abubeker, K.M.; Baskar, S. Wireless Sensor and Wireless Body Area Network Assisted Biosensor Network for Effective Monitoring and Prevention of Non-Ventilator Hospital-Acquired Pneumonia. Front. Sustain. Cities 2022, 4, 1063067. [Google Scholar] [CrossRef] [Scilit]
- Nunes, T.; Gaspar, L.; Faria, J.N.; Portugal, D.; Lopes, T.; Fernandes, P.; Tavakoli, M. Deployment and validation of a smart bed architecture for untethered patients with wireless biomonitoring stickers. Med. Biol. Eng. Comput. 2024, 62, 3815–3840. [Google Scholar] [CrossRef] [Scilit] [PubMed]
- Reichl, J.J.; Leifke, M.; Wehrli, S.; Kunz, D.; Geissmann, L.; Broisch, S.; Illien, M.; Wellauer, D.; von Dach, N.; Diener, S.; et al. Pilot study for the development of an automatically generated and wearable-based early warning system for the detection of deterioration of hospitalized patients of an acute care hospital. Arch. Public Health 2024, 82, 179. [Google Scholar] [CrossRef] [Scilit] [PubMed]
- Skraastad, E.J.; Borchgrevink, P.C.; Opøyen, L.A.; Ræder, J. Wireless patient monitoring and Efficacy Safety Score in postoperative treatment at the ward: Evaluation of time consumption and usability. J. Clin. Monit. Comput. 2024, 38, 157–164. [Google Scholar] [CrossRef] [Scilit] [PubMed]
- Boehmer, J.P.; Cremer, S.; Abo-Auda, W.S.; Stokes, D.R.; Hadi, A.; McCann, P.J.; Burch, A.E.; Bonderman, D. Impact of a Novel Wearable Sensor on Heart Failure Rehospitalization: An Open-Label Concurrent-Control Clinical Trial. JACC Heart Fail. 2024, 12, 2011–2022. [Google Scholar] [CrossRef] [Scilit] [PubMed]
- Garai, M.; Sliti, M.; Mrabet, M.; Boudriga, N.; Ben Ammar, L. Authentication in QoS-Aware VANET: An Approach Based on Enhanced Digital Certificates. IEEE Access 2024, 12, 124452–124477. [Google Scholar] [CrossRef] [Scilit]
- Gohar, A.; Nencioni, G. The Role of 5G Technologies in a Smart City: The Case for Intelligent Transportation System. Sustainability 2021, 13, 5188. [Google Scholar] [CrossRef] [Scilit]
- Sanguesa, J.A.; Barrachina, J.; Fogue, M.; Garrido, P.; Martinez, F.J.; Cano, J.C.; Calafate, C.T.; Manzoni, P. Sensing Traffic Density Combining V2V and V2I Wireless Communications. Sensors 2015, 15, 31794–31810. [Google Scholar] [CrossRef] [Scilit] [PubMed]
- Wang, M.; Mao, J.; Zhao, W.; Han, X.; Li, M.; Liao, C.; Sun, H.; Wang, K. Smart City Transportation: A VANET Edge Computing Model to Minimize Latency and Delay Utilizing 5G Network. J. Grid Comput. 2024, 22, 25. [Google Scholar] [CrossRef] [Scilit]
- Han, Y.; Han, Z.; Ding, F.; Li, F.; Wang, H.; Wang, X. Field-tested signal controller to mitigate spillover using trajectory data. Comput.-Aided Civ. Infrastruct. Eng. 2024, 39, 1354–1369. [Google Scholar] [CrossRef] [Scilit]
- Yang, C.; Liang, P.; Fu, L.; Cui, G.; Huang, F.; Teng, F.; Bangash, Y.A. Using 5G in Smart Cities: A Systematic Mapping Study. Intell. Syst. Appl. 2022, 14, 200065. [Google Scholar] [CrossRef] [Scilit]
- Razzaghpour, M.; Bockelmann, C.; Dekorsy, A.; Hensel, J.; Jochim, W.; Kus, M. Empirical Evaluation of Bit Rate and Latency in a Private 5G Cell for Slow-Speed Vehicles in an Urban Environment. In Proceedings of the 2024 IEEE Globecom Workshops (GC Wkshps), Cape Town, South Africa, 8–12 December 2024; pp. 1–7. [Google Scholar] [CrossRef] [Scilit]
- Grohmann, A.I.; Seidel, M.; Badia, L.; Suer, M.T.; Ramos-Cantor, O.D.; Itting, S.A.W.; Hofmann, F.; Fitzek, F.H.P. Measuring One-Way Delay in Real 5G Scenarios. In Proceedings of the 2025 IEEE Wireless Communications and Networking Conference (WCNC), Milan, Italy, 24–27 March 2025; pp. 1–6. [Google Scholar] [CrossRef] [Scilit]
- Grohmann, A.I.; Seidel, M.; Itting, S.A.W.; Cheng, R.G.; Reisslein, M.; Fitzek, F.H.P. Multi-UE 5G RAN Measurements: A Gamut of Architectural Options. IEEE Access 2025, 13, 1846–1866. [Google Scholar] [CrossRef] [Scilit]
- Islam, S.; Atallah, Z.A.; Budati, A.K.; Hasan, M.K.; Kolandaisamy, R.; Safie, N. Mobile Networks Toward 5G/6G: Network Architecture, Opportunities and Challenges in Smart City. IEEE Open J. Commun. Soc. 2025, 6, 3082–3093. [Google Scholar] [CrossRef] [Scilit]
- Ding, Y.; Duan, H.; Xie, M.; Mao, R.; Wang, J.; Zhang, W. Carbon Emissions and Mitigation Potentials of 5G Base Station in China. Resour. Conserv. Recycl. 2022, 182, 106339. [Google Scholar] [CrossRef] [Scilit]
- Gao, H.; Lu, Y.; Yang, S.; Tan, J.; Nie, L.; Qu, X. Energy Consumption Analysis for Continuous Phase Modulation in Smart-Grid Internet of Things of Beyond 5G. Sensors 2024, 24, 533. [Google Scholar] [CrossRef] [Scilit] [PubMed]
- Mishra, P.; Singh, G. 6G-IoT Framework for Sustainable Smart City: Vision and Challenges. IEEE Consum. Electron. Mag. 2024, 13, 93–103. [Google Scholar] [CrossRef] [Scilit]
- Sharma, S.; Popli, R.; Singh, S.; Chhabra, G.; Saini, G.S.; Singh, M.; Sandhu, A.; Sharma, A.; Kumar, R. The Role of 6G Technologies in Advancing Smart City Applications: Opportunities and Challenges. Sustainability 2024, 16, 7039. [Google Scholar] [CrossRef] [Scilit]
- Alnakhli, M. Exploiting Correlations for Enhanced Spectrum Efficiency in Smart City 6G with Multi-UAV Networks. In Proceedings of the 2024 IEEE Cloud Summit (Cloud Summit); IEEE: New York, NY, USA, 2024; pp. 123–127. [Google Scholar] [CrossRef] [Scilit]
- Griffiths, G.J.; Alkaraki, S.; Aslam, M.; Evans, A.; Jilani, S.F. High-Performance MIMO Antenna Array for 6G and Beyond Smart City Applications. In Proceedings of the 2024 IEEE International Symposium on Antennas and Propagation and INC/USNC-URSI Radio Science Meeting (AP-S/INC-USNC-URSI); IEEE: New York, NY, USA, 2024; pp. 2405–2406. [Google Scholar] [CrossRef] [Scilit]
- Bruneau, M.; Chang, S.E.; Eguchi, R.T.; Lee, G.C.; O’Rourke, T.D.; Reinhorn, A.M.; Shinozuka, M.; Tierney, K.; Wallace, W.A.; von Winterfeldt, D. A Framework to Quantitatively Assess and Enhance the Seismic Resilience of Communities. Earthq. Spectra 2003, 19, 733–752. [Google Scholar] [CrossRef] [Scilit]
- Balta, M.; Özcelik, I. Traffic Signaling Optimization for Intelligent and Green Transportation in Smart Cities. In Proceedings of the 2018 3rd International Conference on Computer Science and Engineering (UBMK), Sarajevo, Bosnia and Herzegovina, 20–23 September 2018; pp. 31–35. [Google Scholar] [CrossRef] [Scilit]
- Datta, S.K.; Ferreira da Costa, R.P.; Bonnet, C.; Härri, J. OneM2M Architecture-Based IoT Framework for Mobile Crowd Sensing in Smart Cities. In Proceedings of the 2016 European Conference on Networks and Communications (EuCNC), Athens, Greece, 27–30 June 2016; pp. 168–173. [Google Scholar] [CrossRef] [Scilit]
- A T, M.R.; B, B.; R R, S.A.P.; Naidu, R.C.; M, R.K.; Ramachandran, P.; Rajkumar, S.; Kumar, V.N.; Aggarwal, G.; Siddiqui, A.M. Intelligent Energy Management across Smart Grids Deploying 6G IoT, AI, and Blockchain in Sustainable Smart Cities. IoT 2024, 5, 560–591. [Google Scholar] [CrossRef] [Scilit]
- Agboola, O.P.; Baby, A. User-centred Smart Building Technologies for Climate-Resilient Urban Development: Evidence from Istanbul. Front. Sustain. Cities 2026, 8, 1772855. [Google Scholar] [CrossRef] [Scilit]
- Zhang, Y.; Chen, J.; You, T.; Zhang, Y.; Liu, Z.; Du, C. Energy-Aware Optimization of Connected and Automated Electric Vehicles Considering Vehicle–Traffic Nexus. IEEE Trans. Ind. Electron. 2024, 71, 282–293. [Google Scholar] [CrossRef] [Scilit]
- Bons, P.C.; Buatois, A.; Schuring, F.; Geerts, F.; van den Hoed, R. Flexible Charging of Electric Vehicles: Results of a Large-Scale Smart Charging Demonstration. World Electr. Veh. J. 2021, 12, 82. [Google Scholar] [CrossRef] [Scilit]
- Iqbal, S.; Alshammari, N.F.; Shouran, M.; Massoud, J. Smart and Sustainable Wireless Electric Vehicle Charging Strategy with Renewable Energy and Internet of Things Integration. Sustainability 2024, 16, 2487. [Google Scholar] [CrossRef] [Scilit]
- Agboola, O.P.; Moveh, S.; Yahya, K.; Attar, H.; Amer, A. The Role of Smart Environment Initiatives on Environmental Degradation: Consolidating the Resilient Built Landscape. In Proceedings of the 2022 International Engineering Conference on Electrical, Energy, and Artificial Intelligence (EICEEAI), Zarqa, Jordan, 6–8 December 2022; pp. 1–5. [Google Scholar] [CrossRef] [Scilit]
- Wajid, M.; Abid, M.K.; Raza, A.A.; Haroon, M.; Mudasar, A.Q. Flood Prediction System Using IoT & Artificial Neural Network. VFAST Trans. Softw. Eng. 2024, 12, 210–224. [Google Scholar] [CrossRef] [Scilit]
- San Francisco Municipal Transportation Agency. SFpark Pilot Project Evaluation Report. Available online: https://www.sfmta.com/reports/sfpark-pilot-project-evaluation-report (accessed on 25 July 2026).
- Breathe London. Breathe London Data Report—2021–2022. Available online: https://www.breathelondon-communities.org (accessed on 2 April 2025).
- Public Utilities Board Singapore. Managing the water distribution network with a Smart Water Grid. Smart Water 2016, 1, 4. [Google Scholar] [CrossRef] [Scilit]
- Los Angeles Bureau of Street Lighting. LED Program. Available online: https://lights.lacity.gov/connected-infrastructure/led_program (accessed on 2 April 2025).
- Ministry of Health Singapore. Efficacy of the SELENA+ System. Parliamentary Written Answer. Available online: https://www.moh.gov.sg/newsroom/efficacy-of-the-selena-system/ (accessed on 25 July 2026).
- Neuroni, A.C.; Haller, S.; van Winden, W.; Carabias-Hütter, V.; Yildirim, O. Public Value Creation in a Smart City Context: An Analysis Framework. In Setting Foundations for the Creation of Public Value in Smart Cities; Rodríguez Bolívar, M.P., Ed.; Public Administration and Information Technology; Springer: Cham, Switzerland, 2019; pp. 49–76. [Google Scholar] [CrossRef] [Scilit]
- OECD. Smart City Data Governance: Challenges and the Way Forward; Technical Report; OECD Publishing: Paris, France, 2023. [Google Scholar] [CrossRef] [Scilit]
- OECD. Recommendation of the Council on Artificial Intelligence; Technical Report, OECD Legal Instruments, 2019. OECD/LEGAL/0449 (Adopted 22 May 2019; Amended 3 May 2024); OECD: Paris, France, 2024. [Google Scholar]
- National Institute of Standards and Technology. Artificial Intelligence Risk Management Framework (AI RMF 1.0); Technical Report NIST AI 100-1; NIST: Gaithersburg, MD, USA, 2023.
- Barocas, S.; Hardt, M.; Narayanan, A. Fairness and Machine Learning: Limitations and Opportunities; MIT Press: Cambridge, MA, USA, 2023. [Google Scholar]
- Moore, M.H. Creating Public Value: Strategic Management in Government; Harvard University Press: Cambridge, MA, USA, 1995. [Google Scholar]
- van der Hoogen, W.; Scholtz, B.; Calitz, A.P. Using Theories to Design a Value Alignment Model for Smart City Initiatives. In Responsible Design, Implementation and Use of Information and Communication Technology; Hattingh, M., Matthee, M., Smuts, H., Pappas, I., Dwivedi, Y.K., Mäntymäki, M., Eds.; Lecture Notes in Computer Science; Springer: Cham, Switzerland, 2020; Volume 12066, pp. 55–66. [Google Scholar] [CrossRef] [Scilit]
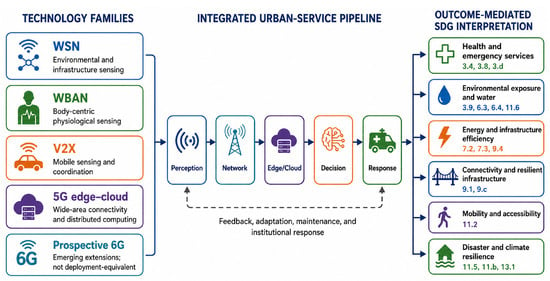
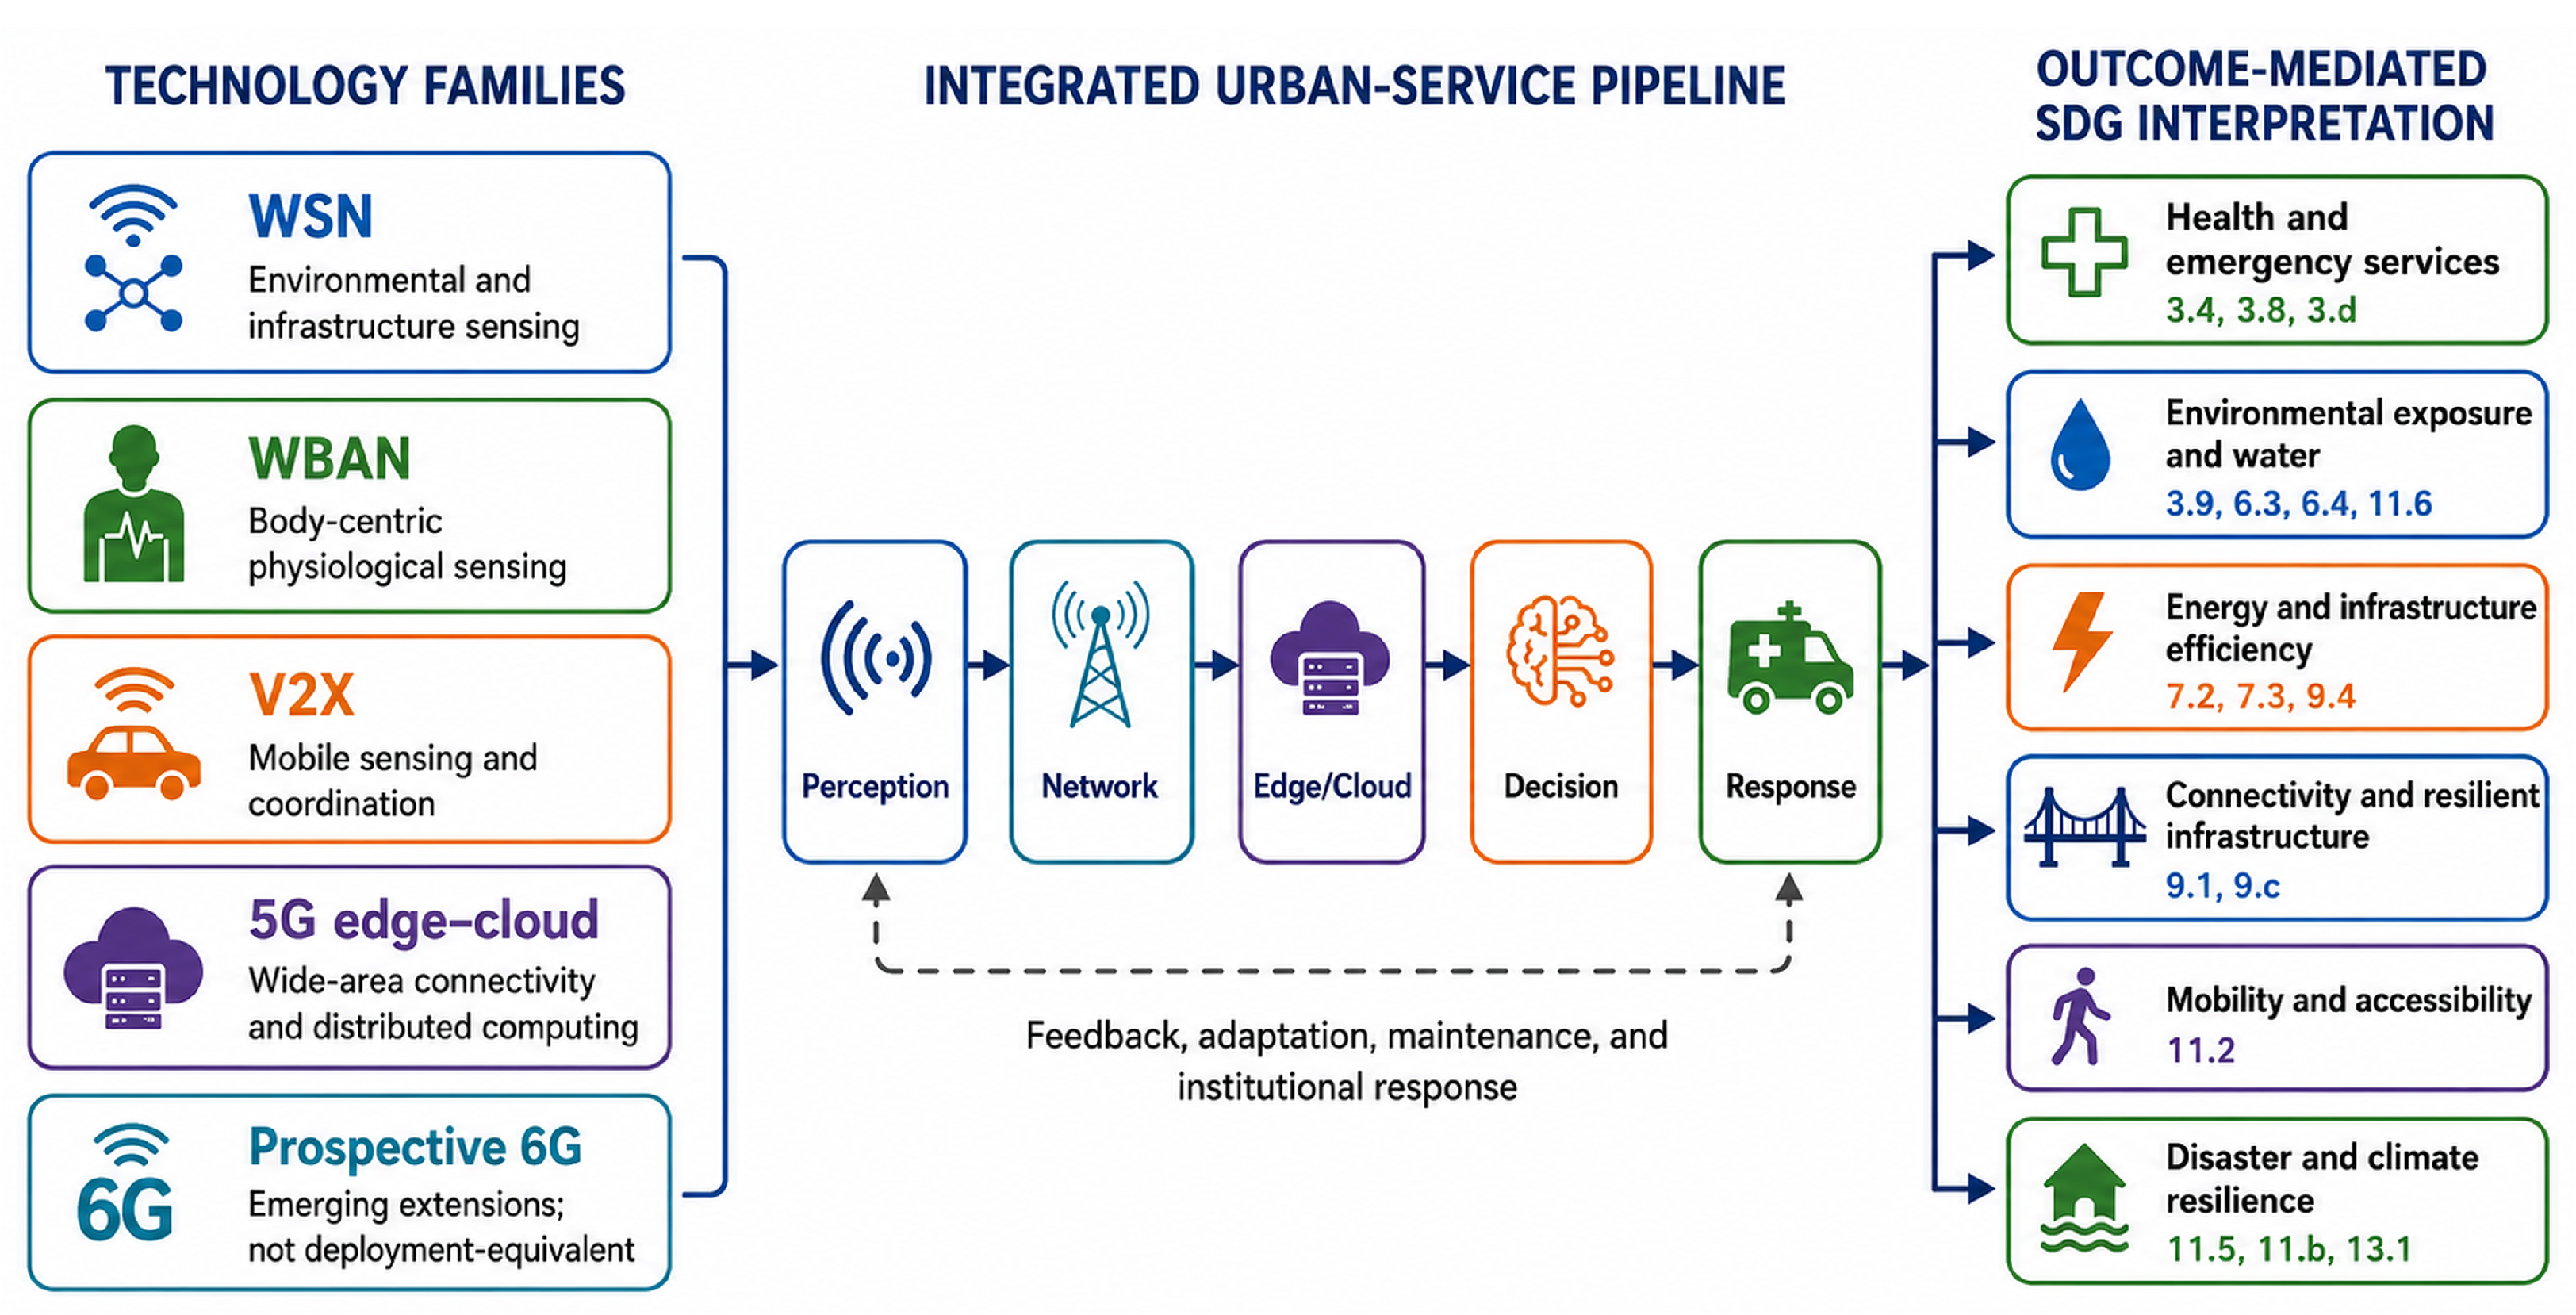
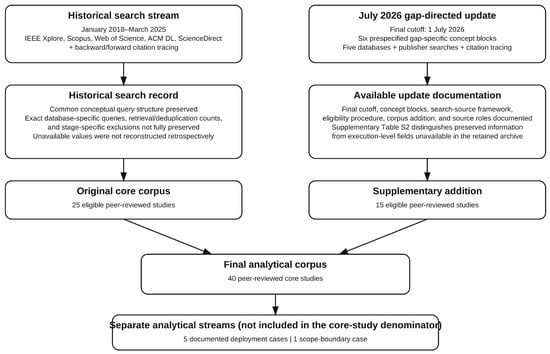
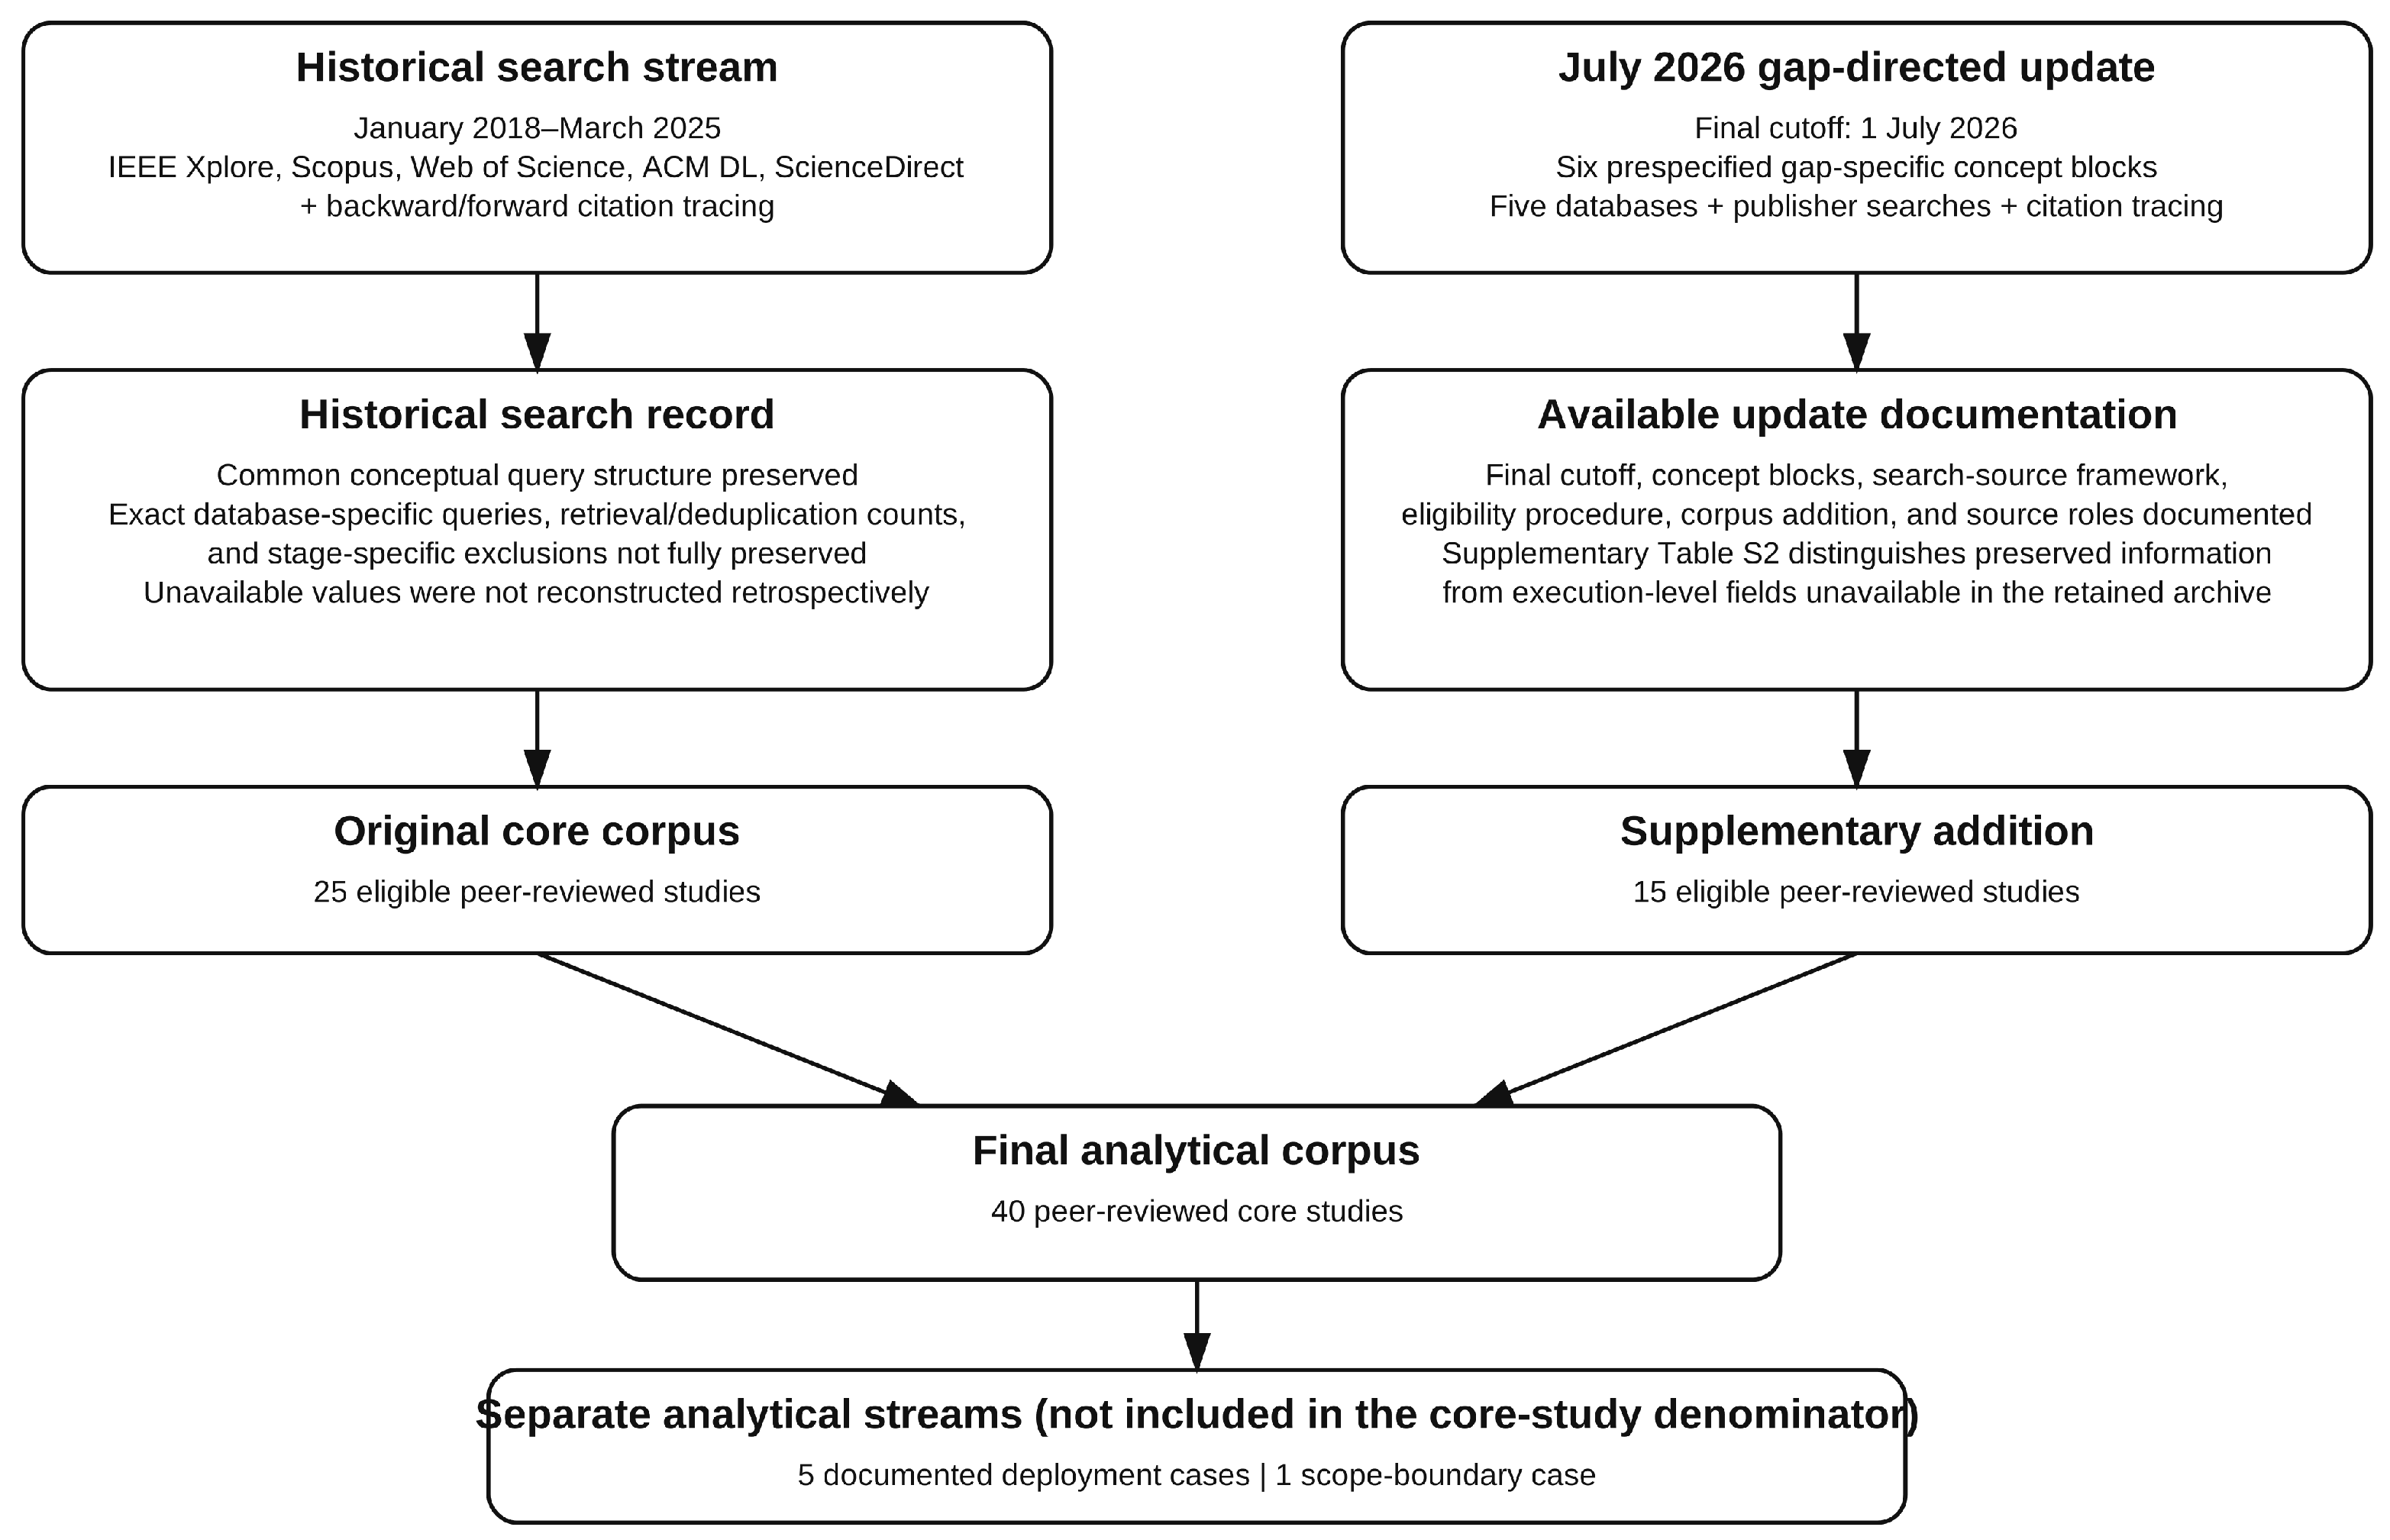
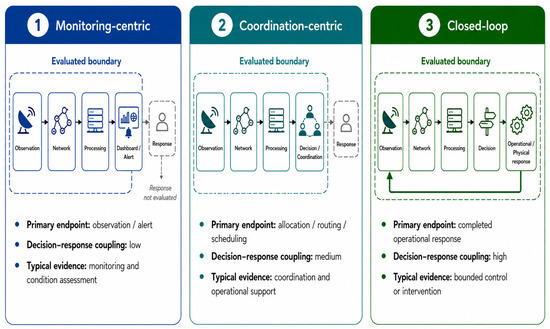
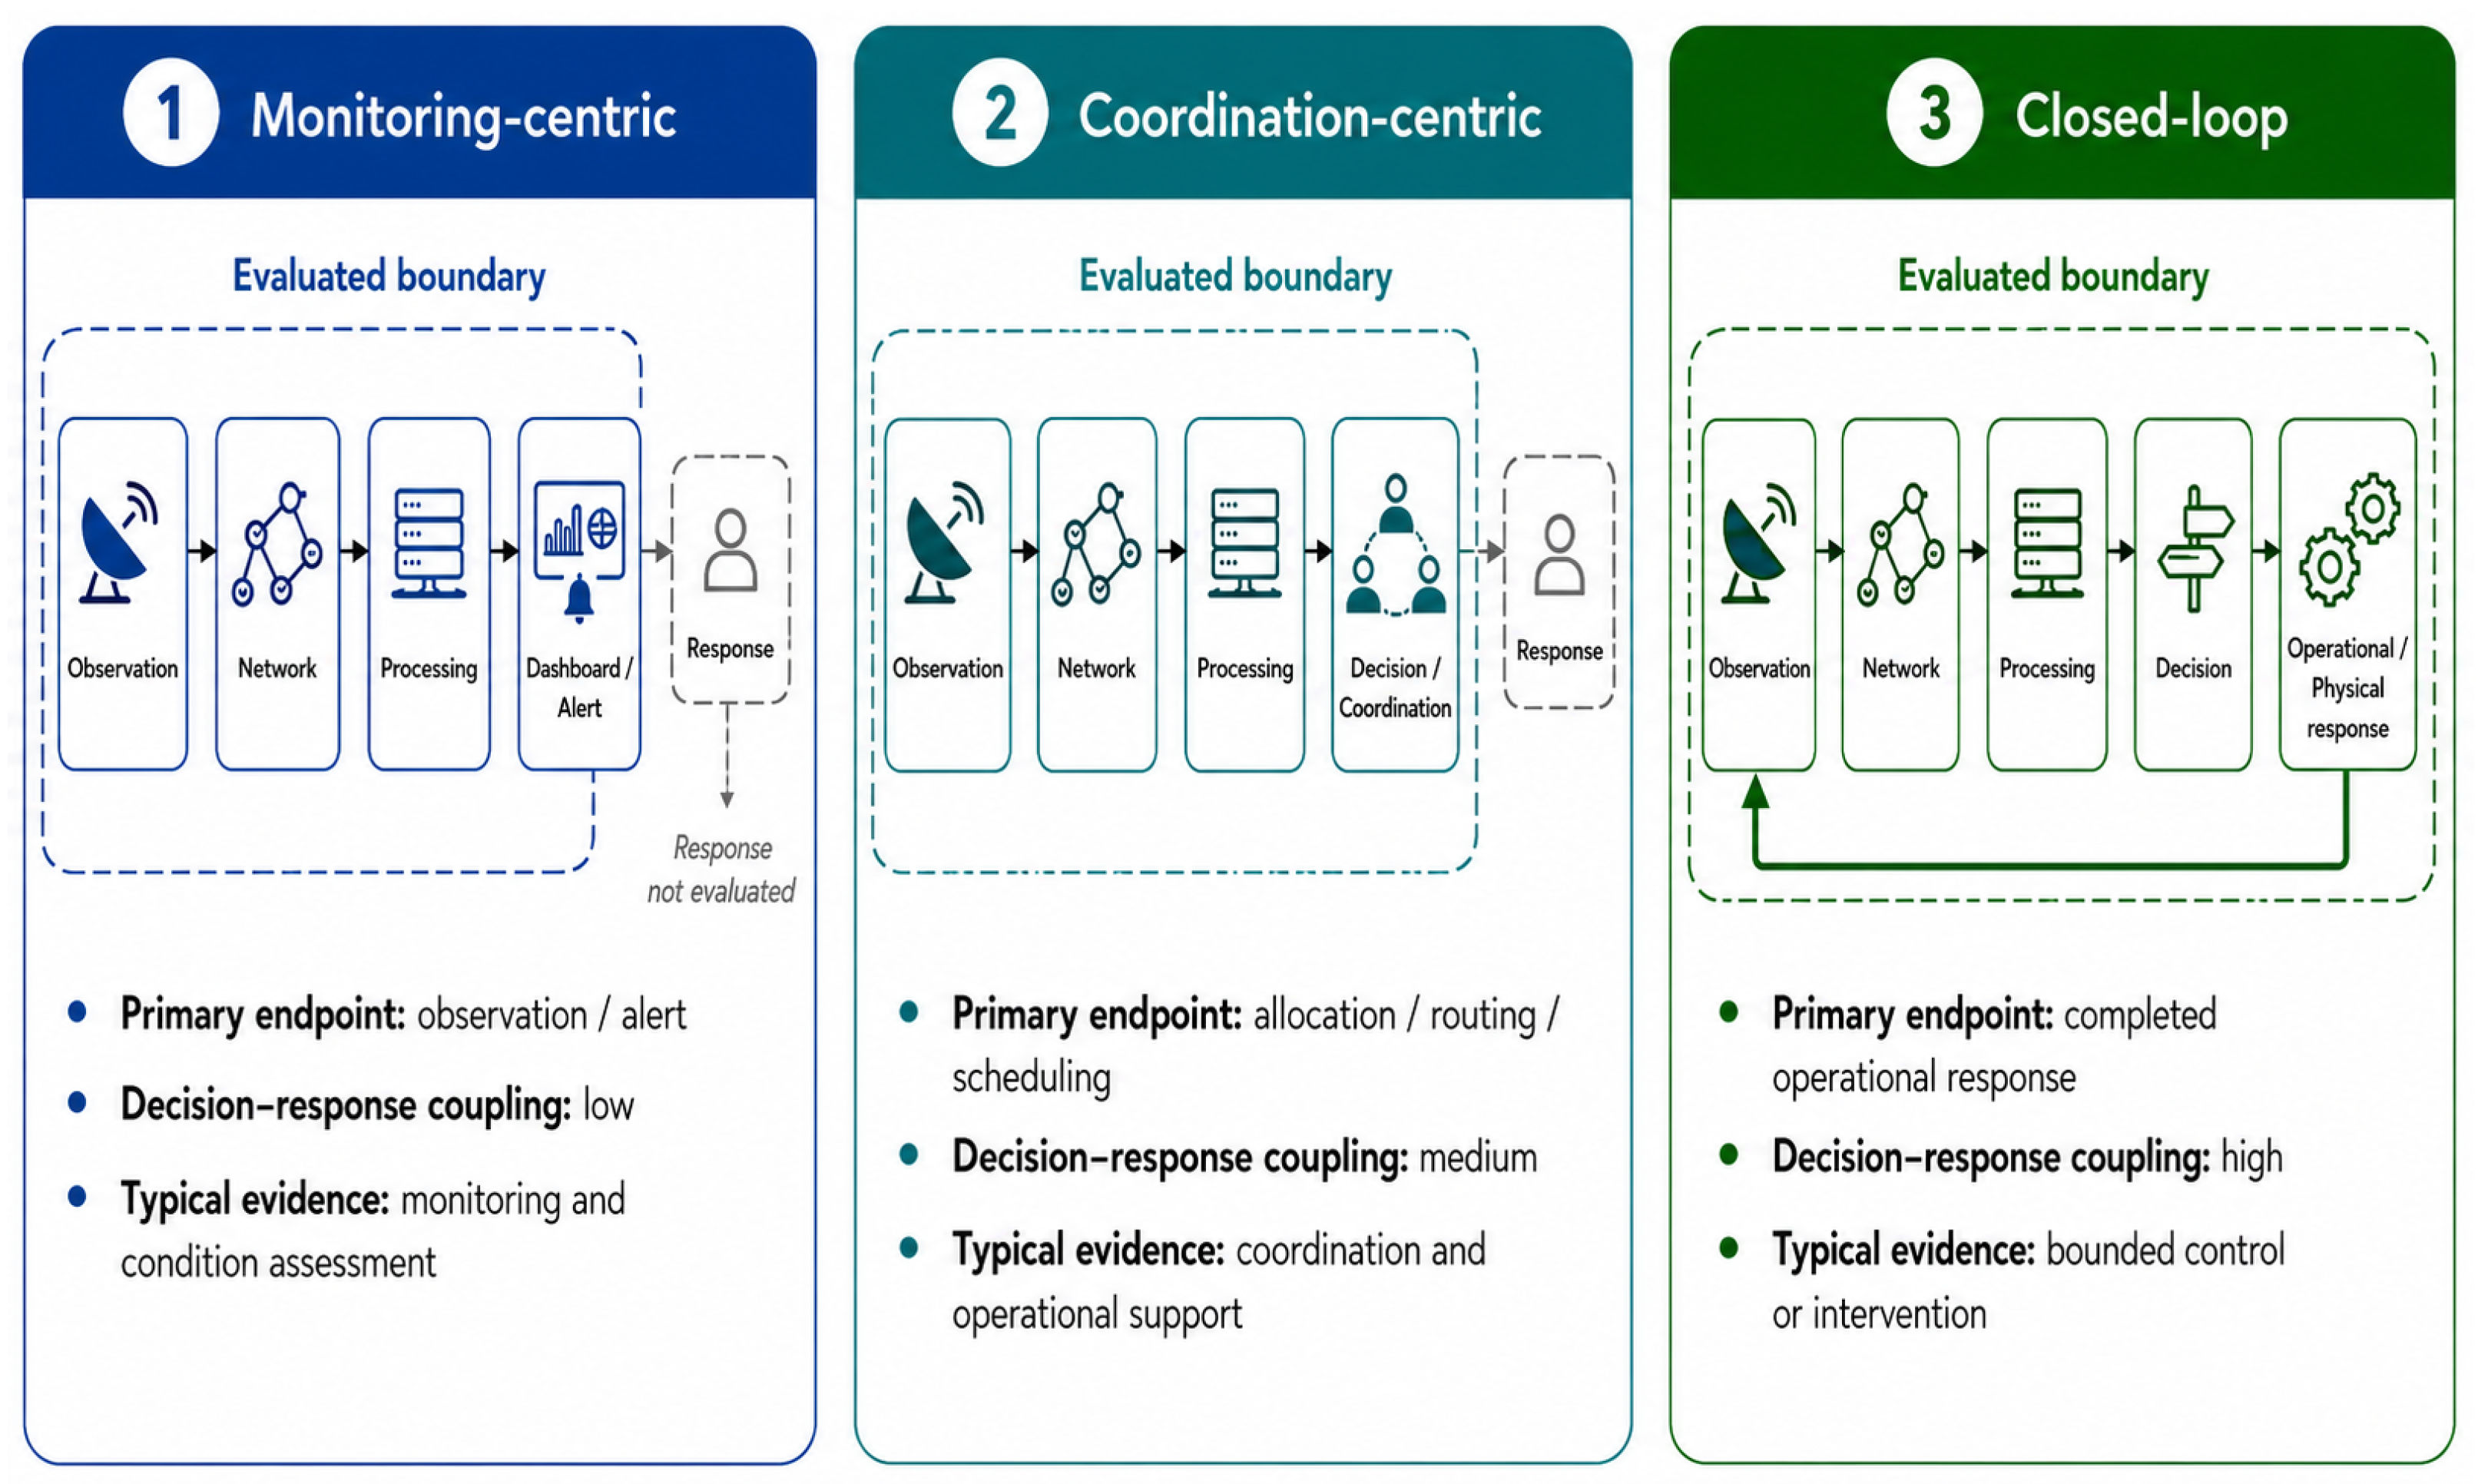
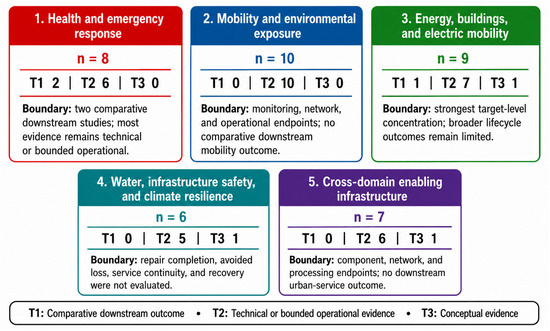
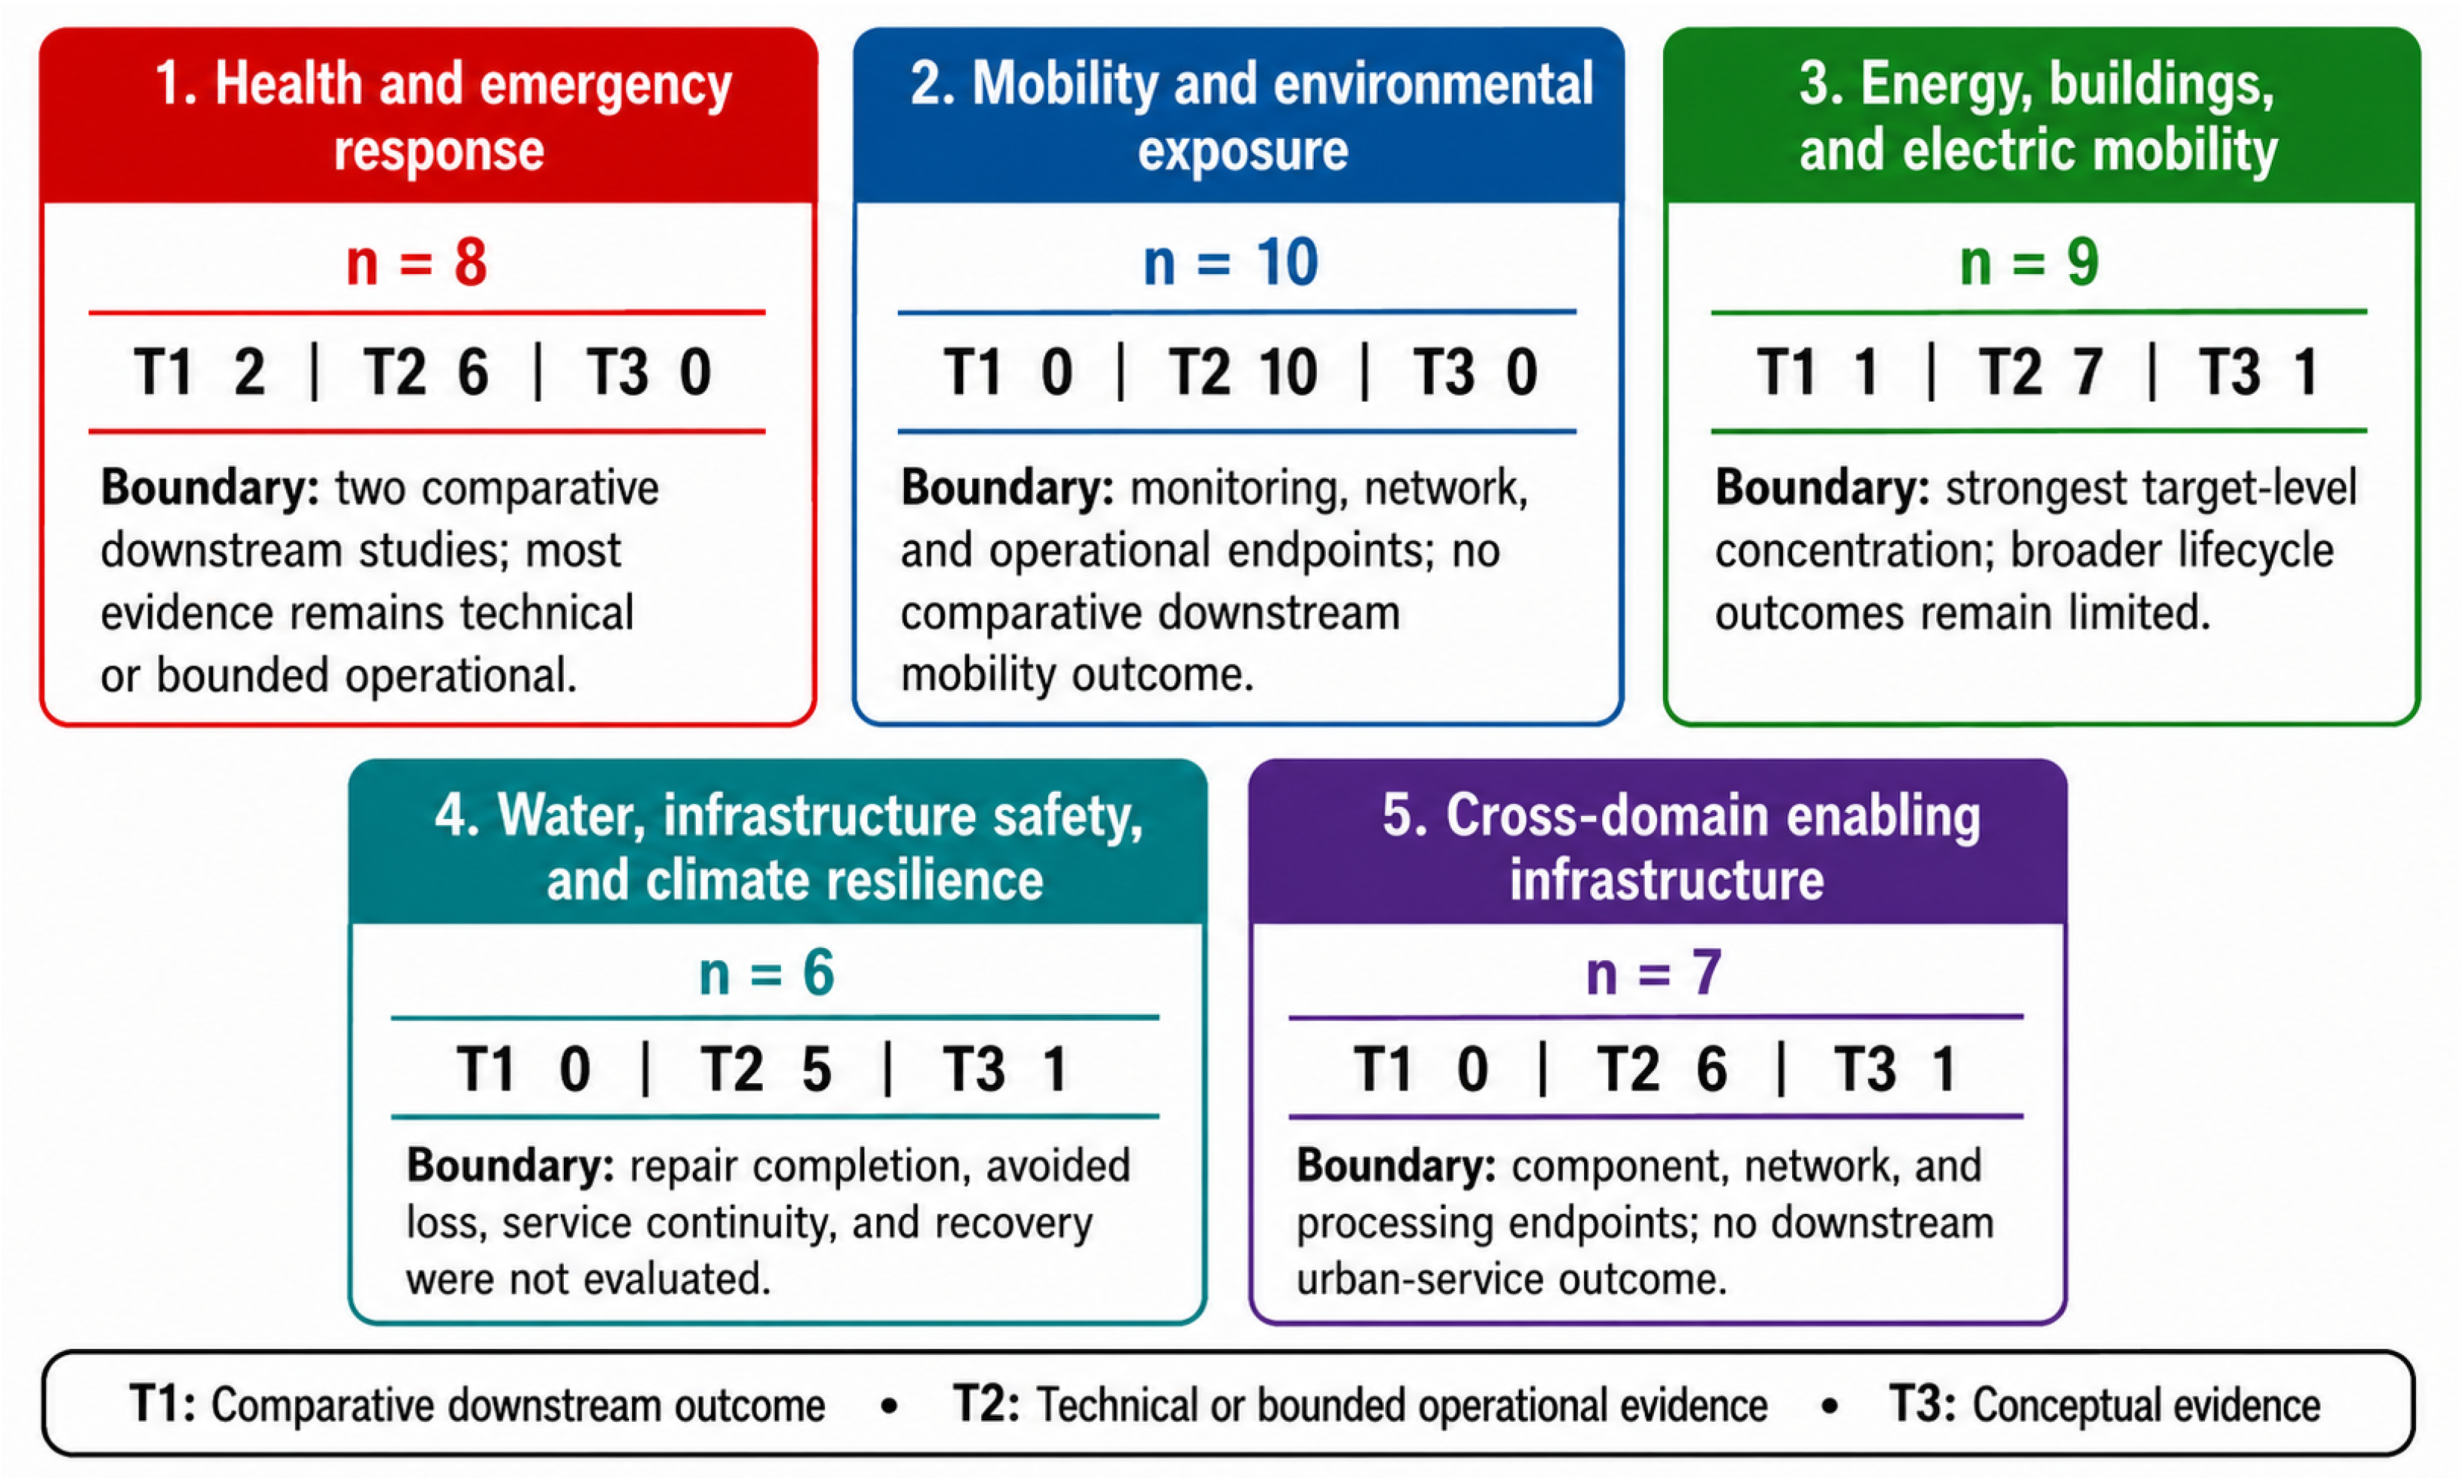
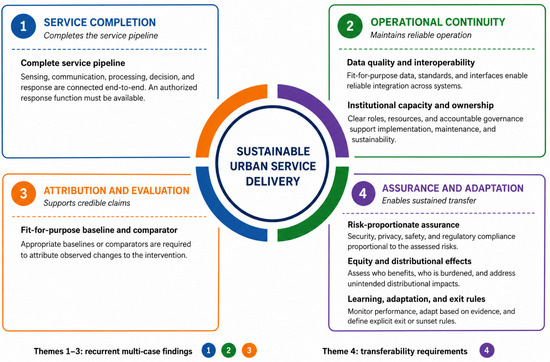
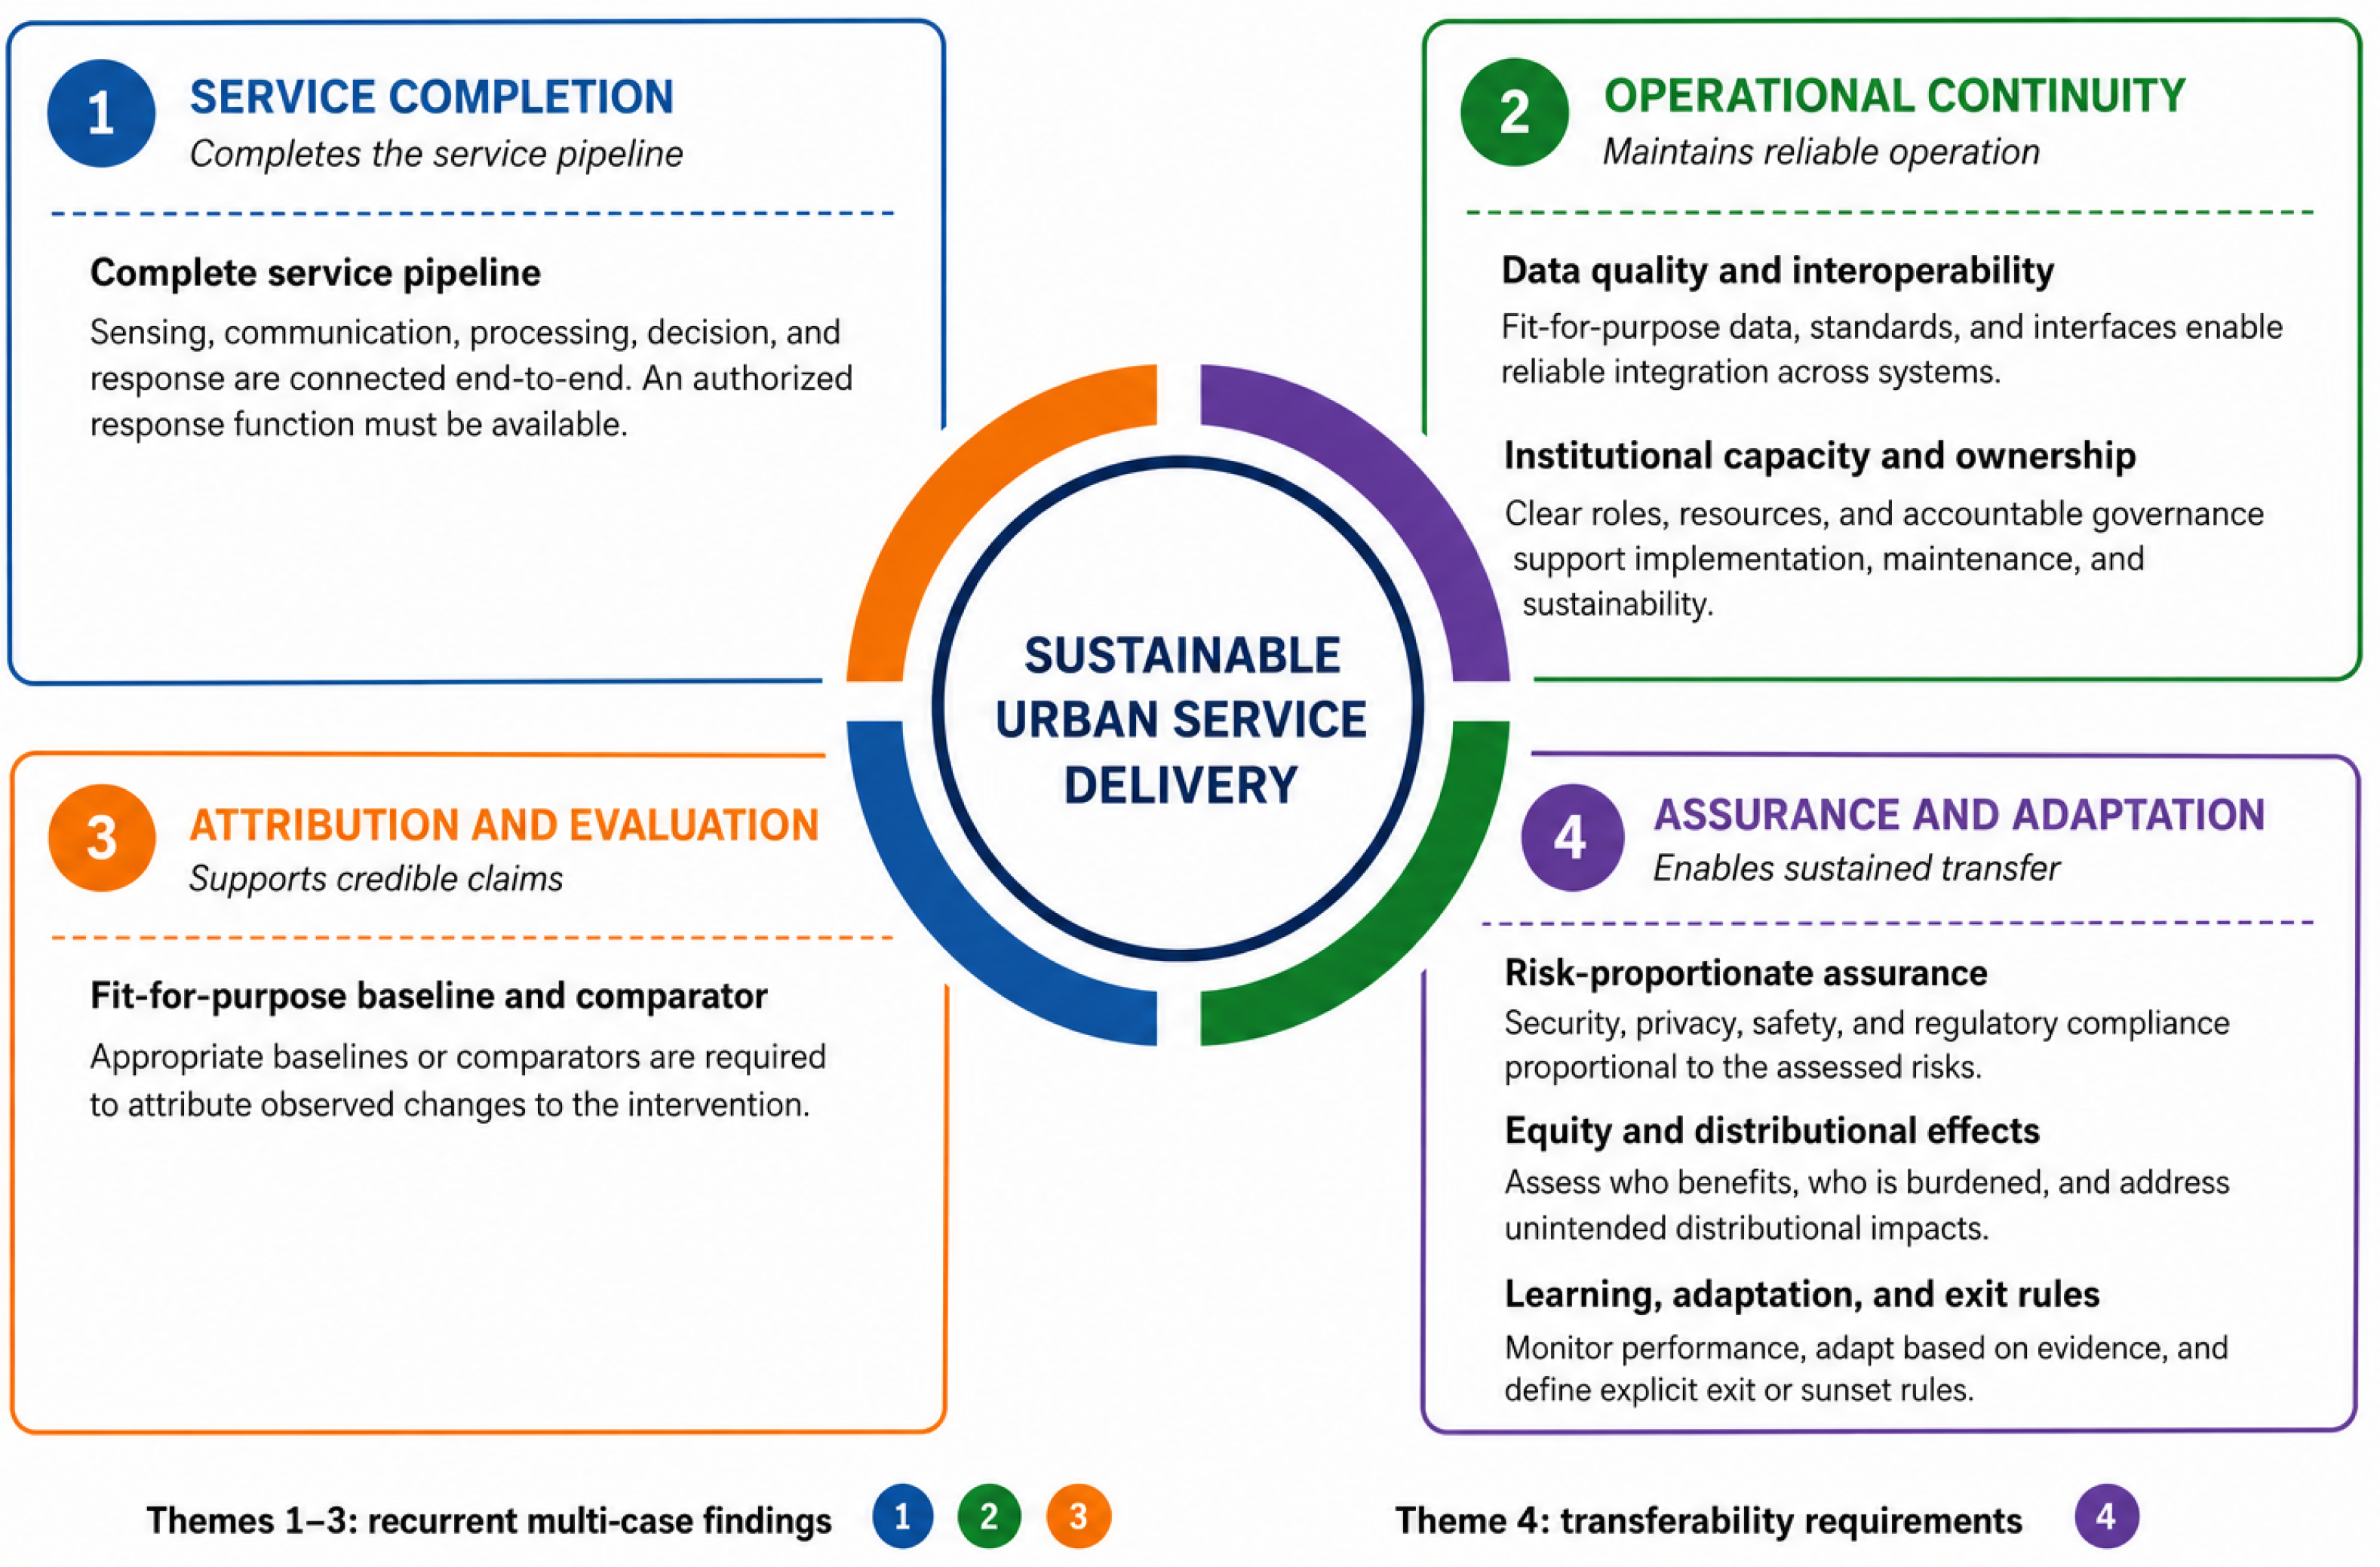

Disclaimer/Publisher’s Note: The statements, opinions and data contained in all publications are solely those of the individual author(s) and contributor(s) and not of MDPI and/or the editor(s). MDPI and/or the editor(s) disclaim responsibility for any injury to people or property resulting from any ideas, methods, instructions or products referred to in the content. |
© 2026 by the authors. Licensee MDPI, Basel, Switzerland. This article is an open access article distributed under the terms and conditions of the Creative Commons Attribution (CC BY) license.