


Abstract
This paper introduces an IIoT-based hybrid predictive maintenance system for industrial steam boilers, which responds to the increased demands for making intelligent and accurate decisions by leveraging data-driven analytics in complex industrial environments. The proposed approach presents comparative hybrid predictive monitoring frameworks based on Long Short-Term Memory (LSTM) and Gated Recurrent Unit (GRU) models integrated with Statistical Process Control (SPC) and Cumulative Sum (CUSUM) monitoring techniques for industrial boiler monitoring; it allows accurate system behavior prediction coupled with enhanced anomaly detection across interconnected subsystems. To ensure practicability, the framework is implemented in an integrated operation technology and information technology (OT–IT) architecture with one year of real operation data from an industrial steam boiler in an oil refinery. A two-phase validation strategy is employed to overcome the gap between offline model development and application. During the initial phase, predictive models are developed and tested based on multivariate time-series data to model both the time dependence of the processes and the mechanical variables. The second phase involves the online deployment of the predictive monitoring framework through a Hardware-in-the-Loop (HiL) implementation with Programmable Logic Controller (PLC)-based and Open Platform Communications Unified Architecture (OPC UA) communication to enhance realistic system validation under emulated boiler process conditions without disrupting live plant operations. The experimental results indicate that the GRU model outperforms the LSTM, achieving good R2 (0.8956) and mean absolute percentage error (MAPE, 0.6345%), demonstrating strong predictive accuracy across key operational variables. In addition, SPC is used to set up adaptive operational thresholds based on normal industrial process behavior, and then CUSUM is applied to the prediction residuals to improve the detection of the gradual degradation of the system. Real-time validation ensures system stability, low latency, and bidirectional data transfer between the OT and IT layers, enabling continuous monitoring and real-time decision-making. The proposed solution provides a practical and scalable predictive maintenance framework in an industrial context, particularly in oil and gas operations, that helps to transition to Industry 4.0 and intelligent asset management.
1. Introduction
Oil refineries and large-scale industrial plants have mission-critical assets, including industrial steam boilers, where consistency of operation and safety of operation are critical to maintain continuity of production and operational safety [1,2]. These systems are composed of tightly coupled subsystems such as combustion, steam–water and rotary equipment [3,4]. The failure of significant components such as forced draft (FD) fans or stationary process equipment may propagate throughout the overall system, leading to performance degradation, safety concerns, and unplanned shutdowns [5].
Such interdependent systems require standardized monitoring frameworks, which should be capable of detecting abnormal variances and differentiating between process information disturbance signals and mechanical degradation signals, to support predictive maintenance strategies [6,7,8]. Therefore, the newest digital technologies integrated as an Industrial Control Systems (ICSs) such as Distributed Control Systems (DCSs) and Programmable Logic Controllers (PLCs) have enhanced asset monitoring and functions by providing real-time data collection, process control, and system-wide monitoring, thereby facilitating the transition toward proactive and data-driven asset management [9,10].
The industrial system maintenance paradigms have evolved from reactive approaches to intelligent and predictive methods. The initial strategies were mainly reactive as the mechanisms of equipment failure, such as bearing wear, blade erosion, misalignment and lubricant contamination, were strongly investigated. However, most industrial systems still rely on traditional fixed threshold-based alarms, which only detect failures after they have occurred [11,12,13,14]. The preventive maintenance strategies developed in response to these limitations are based on the following principles: periodic servicing and scheduled inspections in an attempt to minimize the possibility of failure. Despite being effective in catastrophic failure mitigation, these strategies often resulted in unnecessary maintenance operations and did not take into account the actual equipment status [15].
Afterwards, condition-based maintenance (CBM) emerged, which integrates real-time maintenance techniques such as vibration sensors and process sensors in order to identify the health of machinery and the beginning of degradation. These techniques enhanced the efficiency of maintenance, as they allowed making data-driven decisions based on the real-world behavior of the system [5,16].
Recent studies have introduced data-driven frameworks for monitoring boiler performance using historical and real-time operational data. These frameworks identify correlations between key process variables and system efficiency, detect deviations from expected behavior, and support proactive decision-making to optimize fuel consumption, reduce emissions, and minimize unplanned downtime. Techniques such as Statistical Process Control, artificial neural networks, and digital twin models have been widely applied for the continuous assessment of boiler health [6,7,17,18].
Recent advances in machine learning and deep learning, combined with condition monitoring, have enabled the development of predictive maintenance (PdM) strategies. Historical and real-time data can be used to predict future system behavior and identify anomalies or estimate remaining useful life through techniques such as Support Vector Machine (SVM), Random Forests, CNN, LSTM, BiGRU, transformer models, and optimized ensemble learning approaches, which can help in proactive maintenance and minimize unplanned downtime [19,20,21,22,23].
Statistical control techniques such as Statistical Process Control (SPC) and Cumulative Sum (CUSUM) have been widely adopted to detect subtle variations in process variables and the behavior of the control system during the initial stages of degradation, enabling proactive intervention before critical failures occur [24,25]. These techniques have been further refined by adaptive thresholding and change-point detection approaches to enhance their sensitivity to gradual deviations and provide robust hybrid methods [26,27,28] integrated with statistical, data-driven and machine learning approaches, to improve the robustness of detection in complex and non-stationary industrial conditions have also been investigated in recent research [29].
Industry 4.0 and the Industry Internet of Things (IIoT) technologies have facilitated the formation of integrated monitoring frameworks at the system level. They integrate predictive models and real-time data collection in single cyber-physical frameworks [30,31]. Such approaches enable system-level continuous monitoring and advanced predictive analytics. Real-time forecasting based on deep learning-based surrogate models along with digital twins are being utilized, while simulation-driven digital twin platforms facilitate stress monitoring and safety assessment of boiler components with the aid of sensor feedback. Moreover, IIoT-based digital twin frameworks with combined physics-based models have been applied for fatigue life prediction of pressure vessels under cyclic loading [32,33,34].
Moreover, communication systems such as OPC UA enable data exchange between control and analytic systems in a secure and interoperable way for online monitoring and integration in embedded systems [35,36]. This communications capability is a crucial facilitator of Hardware-in-the-Loop (HiL) validation that enables the simulation of the behavior of an industrial system by connecting the control hardware with process model simulators, creating a safe environment to perform real-time testing of predictive models without interfering with real plant operation [37,38,39].
Although these are crucial developments, there is still a challenge of translating the predictive maintenance methods into realistic industrial applications especially in oil refinery settings. An investigation of the relevant and latest published works reveals some limitations as summarized below:
- A significant amount of research has been done on offline models based on historical data or laboratory testbeds, but extending these approaches toward real-time (online) deployment remains an important step for enabling continuous monitoring and timely decision-making in industrial environments [37,39,40].
- Moreover, the absence of realistic validation environments is also a significant problem, and most research does not take into account integration with the OT infrastructure, the industrial communication protocols, and the real-time operational constraints [31,36].
- The current methods are mostly focused on process variables and mechanical condition monitoring separately, whereas industrial systems such as steam boilers require an integrated analysis due to strong subsystem interdependencies [5,7,8].
- In spite of the strong predictive capabilities of the data-driven models, their reliance on purely learning data-driven approaches may lead to unstable predictions under noisy industrial conditions, highlighting the need to integrate complementary statistical monitoring techniques to enhance detection reliability [29,41].
In terms of industry, all these issues are not just hypothetical but are the real-life limitations in the actual infrastructure of critical industries. The current research seeks to fill these gaps by establishing a proposed IIoT-based hybrid predictive maintenance framework for industrial steam boilers by fulfilling the following objectives:
- Develop and compare hybrid predictive monitoring frameworks based on deep learning models, such as LSTM or GRU, combined with statistical monitoring methods (SPC and CUSUM), to enhance the accuracy of prediction and the reliability of detection.
- Establish an OPC UA-based Hardware-in-the-Loop (HiL) testing environment for industrial boiler equipment to simulate the operation of industrial boilers for OT–IT integration between the control layer, the edge layer, and the cloud layer.
- Validate the proposed framework with one year of historical operation data from an actual refinery boiler and HiL testing on the OPC UA to show an improved prediction performance and an improved monitoring stability.
The novelty of the proposed framework lies in integrating GRU/LSTM-based multivariate time-series forecasting, Bayesian optimization, SPC/CUSUM residual monitoring, OPC UA communication, OT–IT interoperability, edge analytics, and Hardware-in-the-Loop (HiL) validation within a deployment-oriented IIoT predictive monitoring architecture for industrial steam boiler systems. Each of the components meets a complementary requirement for monitoring in the industry within the proposed framework. The deep learning models offer the ability to predict the behavior of the industrial process on a time horizon; the SPC allows for adaptive statistical monitoring thresholds, and the CUSUM gives more sensitivity towards progressive and persistent operational deviations. Furthermore, the OPC UA communication and the HiL architecture facilitate the interoperability of the OT and the IT and facilitate realistic real-time industrial use. The proposed framework differs from many previous studies by focusing on system-level integration within a unified, deployment-oriented predictive monitoring framework, rather than evaluating only isolated AI models or small-scale implementations. The results are relevant to the enhancement of practical, deployment-oriented Industry 4.0 integration and industrial predictive monitoring in existing refinery infrastructures. The organization of the rest of this paper is as follows: Section 2 discusses the industrial architecture and the data acquisition process. Section 3 provides a description of the proposed predictive monitoring methodology; Section 4 discusses the experimental results and the monitoring analysis; and Section 5 concludes the paper.
2. Industrial System Description
This Section introduces a physical description for the industrial steam boiler system operating in the Al-Daura Oil Refinery, supported by real operational data. It outlines the main subsystems, the key process and mechanical variables, and the data acquisition structure, providing a foundation for the development and validation of the proposed predictive monitoring framework.
2.1. Boiler System Overview
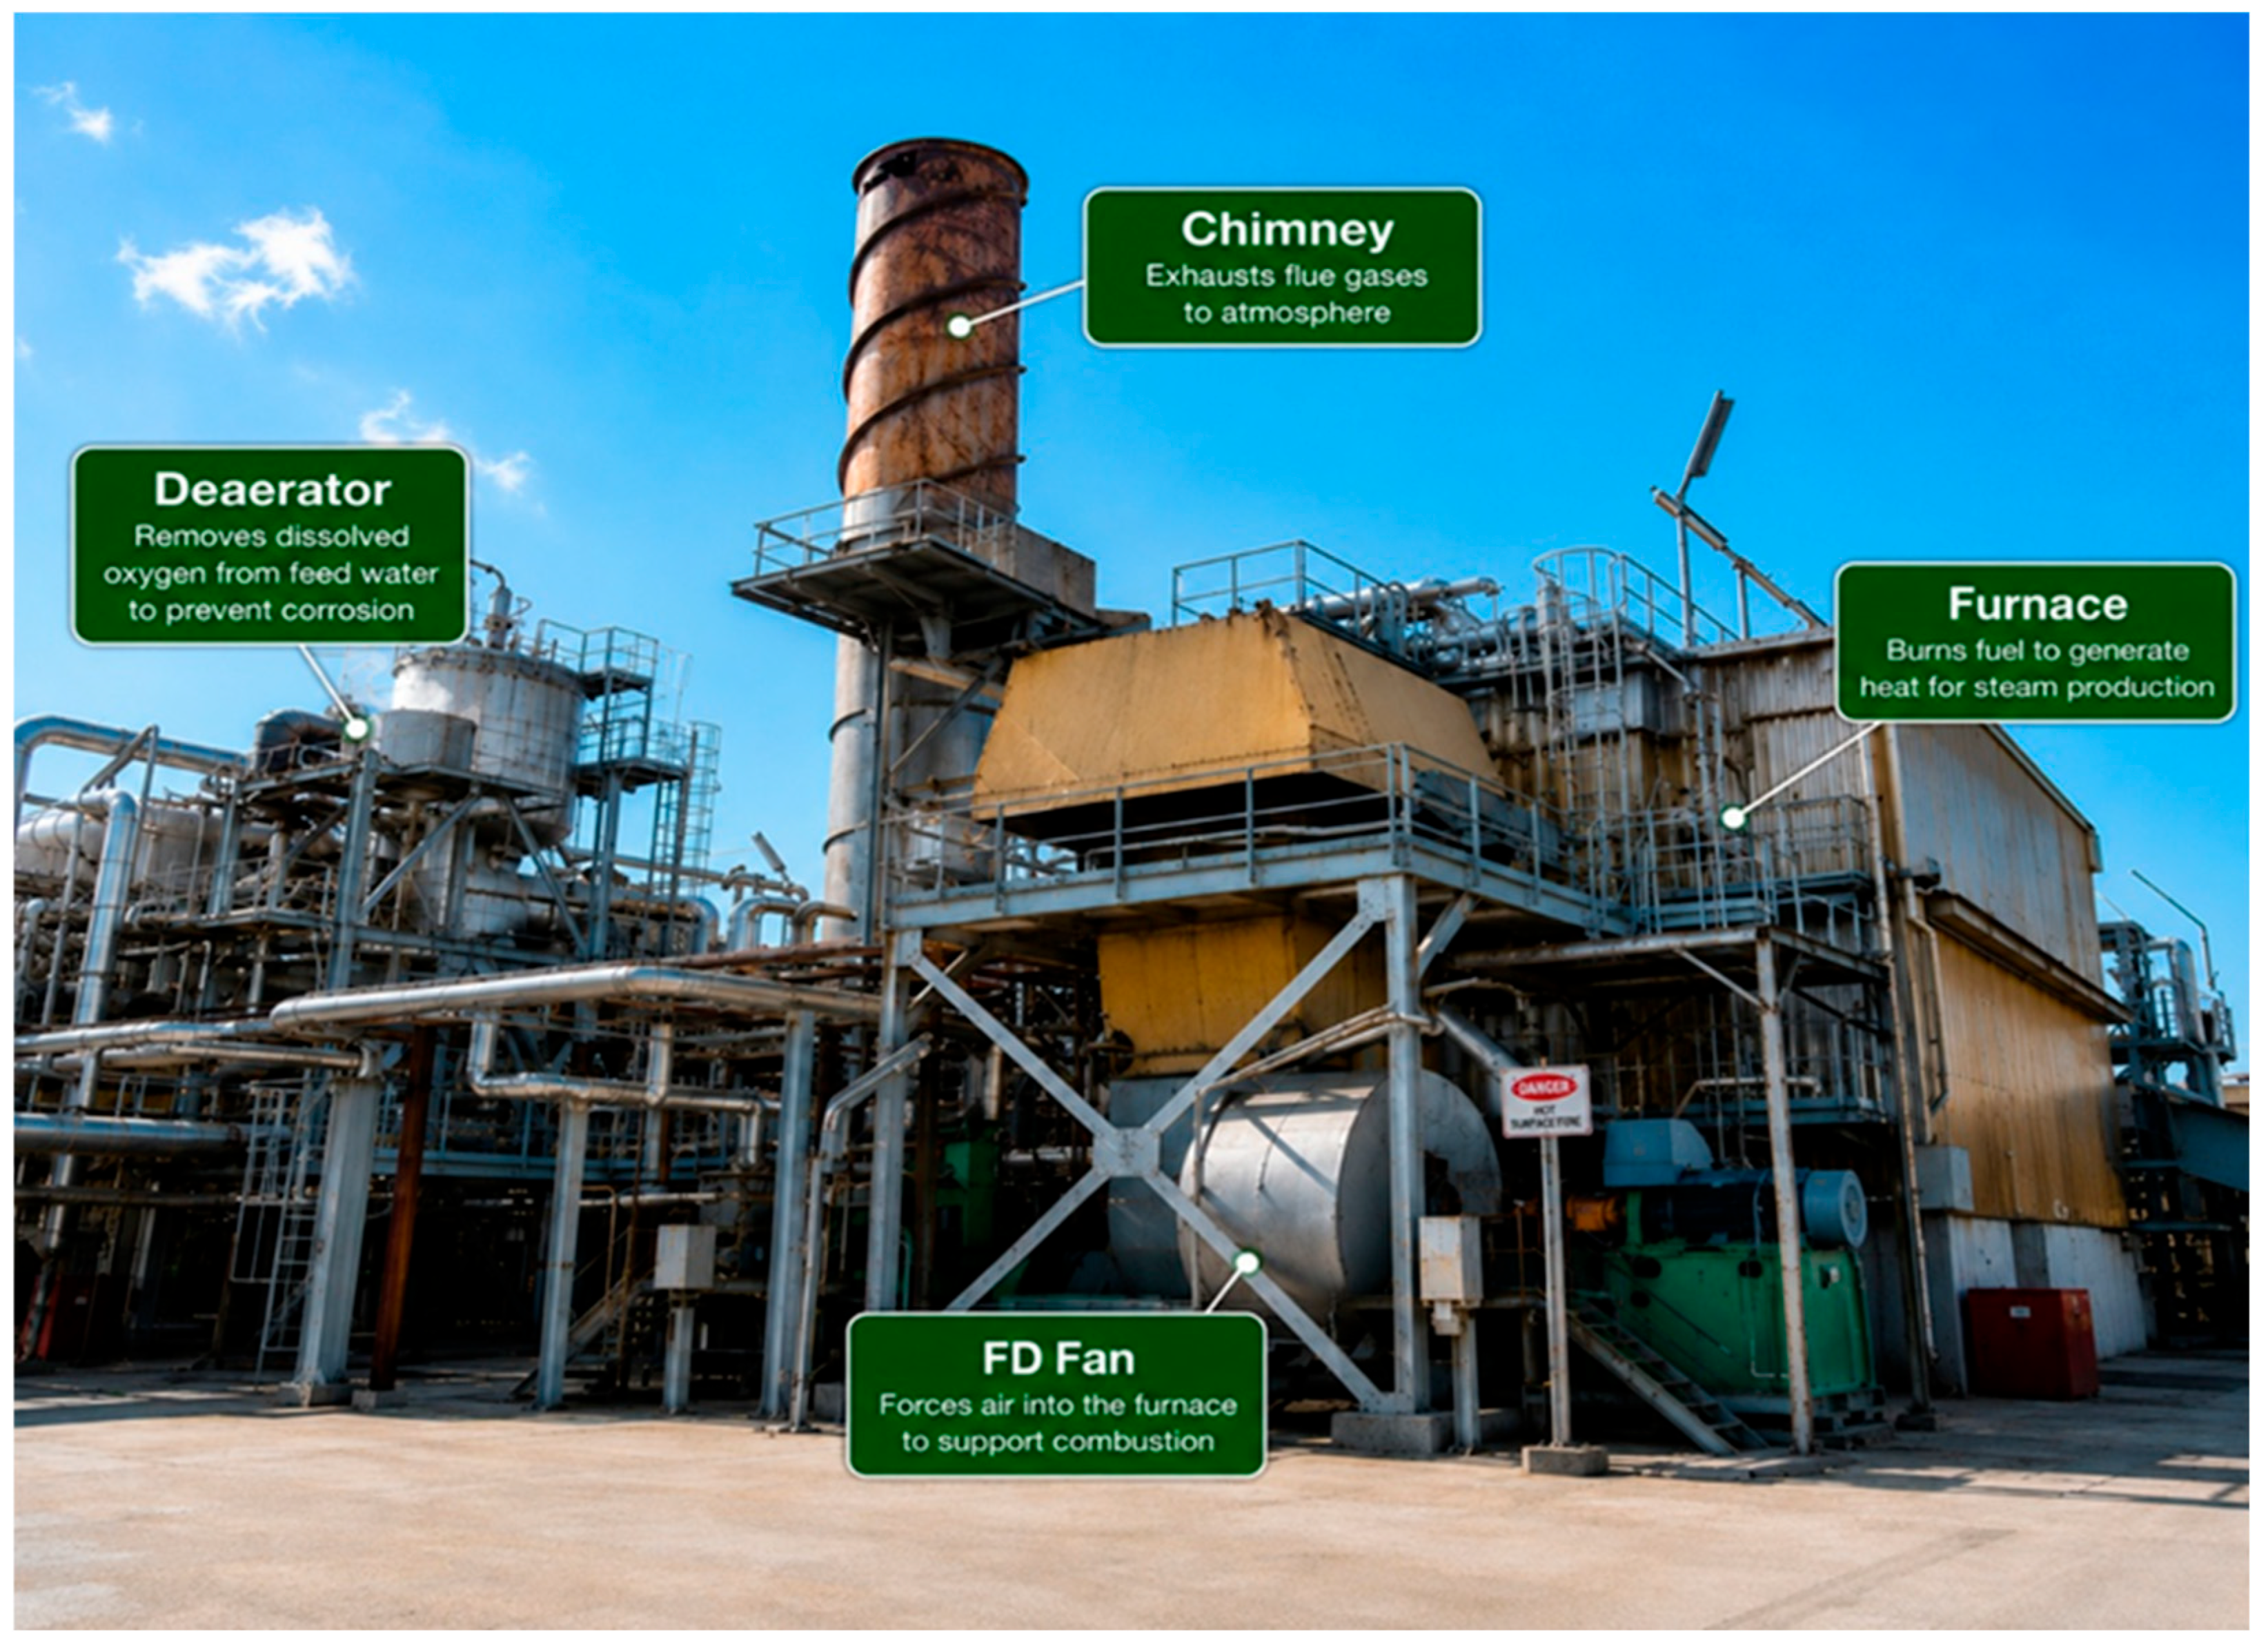
A real case study represented by the industrial steam boiler as a utility unit in an oil refinery is illustrated in Figure 1. It consists of three main subsystems: the combustion subsystem, the steam–water subsystem, and the mechanical drive subsystem. The combustion subsystem includes forced draft (FD) fans and burners responsible for maintaining stable air–fuel mixing. The steam–water subsystem is centered on the steam drum, where heat transfer and steam–water phase separation occur. The rotating components of the mechanical subsystem comprise turbines, motors, pumps and fans that support continuous operation. These subsystems are tightly coupled, and a malfunction in any component, such as FD fan degradation, can propagate throughout the system overall, affecting combustion efficiency, steam generation, and operational stability.
Figure 1.
Industrial boiler plant.
2.2. Data Acquisition and System Architecture
A high-availability industrial automation architecture is used to monitor and control the boiler system. A redundant Siemens, Germany S7-400H PLC is the main control unit that acquires the data from field sensors (flow, level, temperature, and pressure) as well as implements real-time control logic strategies. The control signals are transmitted to actuator devices such as control valves and motors for process manipulation. Moreover, the PLC is linked with a Citect SCADA v7.20 system to provide visualization, operator interface management, alarm handling, and historical data logging. The data acquisition system adopts a three-layer industrial architecture consisting of (i) a field layer with sensors and actuators for measuring process and mechanical variables, (ii) a control layer with redundant PLC units for real-time processing, and (iii) a supervisory layer where monitoring and long-term data archiving are supported by a SCADA system.
The operational data consist of multivariate time-series measurements of key process and mechanical variables. These data are stored and preprocessed to ensure their quality and their suitability for further analysis. The architecture provides a flexible foundation for future integration with IIoT frameworks through continuous data flow between control systems, monitoring platforms, predictive models and advanced control technologies. It also facilitates advanced monitoring and validation strategies, including potential deployment in Hardware-in-the-Loop (HiL) environments.
2.3. Key Features and Dataset Description
The data for this study were obtained from the industrial steam boiler system of the Al-Daura Oil Refinery over a continuous period of one year in actual production conditions. The data represent normal operating conditions, load changes, process deviations, transient operating conditions, and progressive degradation patterns of combustion, as well as steam–water and mechanical subsystems. However, catastrophic failure events were not available because of the operational safety and preventive maintenance system, but the data did record the operational deviations that occurred during actual refinery operation, including the deviations in the behavior of the FD fans, which were confirmed through a maintenance inspection. The final dataset included about 7825 h of data, excluding scheduled shutdowns and incomplete records.
The nature of the boiler operation can be described as a group of interconnected process and mechanical variables, and these form the foundation of the dataset obtained. Accordingly, a set of representative operational variables was selected for predictive modeling based on engineering relevance and data availability (Table 1). These features included combustion behavior, steam–water dynamics and mechanical condition indicators, which allow an integrated system-level monitoring.
Table 1.
Selected features grouped by subsystem.
3. Integrated IIoT Predictive Monitoring Framework
This Section illustrates the overall approach applied within this study, which is the combination of data preprocessing, predictive modeling and system-level deployment. This design idea involves the use of multivariate time-series data from an industrial boiler plant to build predictive monitoring models for industrial operational behavior. Further, the framework incorporates an IIoT architecture, providing data communication, edge analytics, OT–IT interoperability and integration with industrial control systems.
3.1. Two-Phase Predictive Monitoring and Deployment Strategy
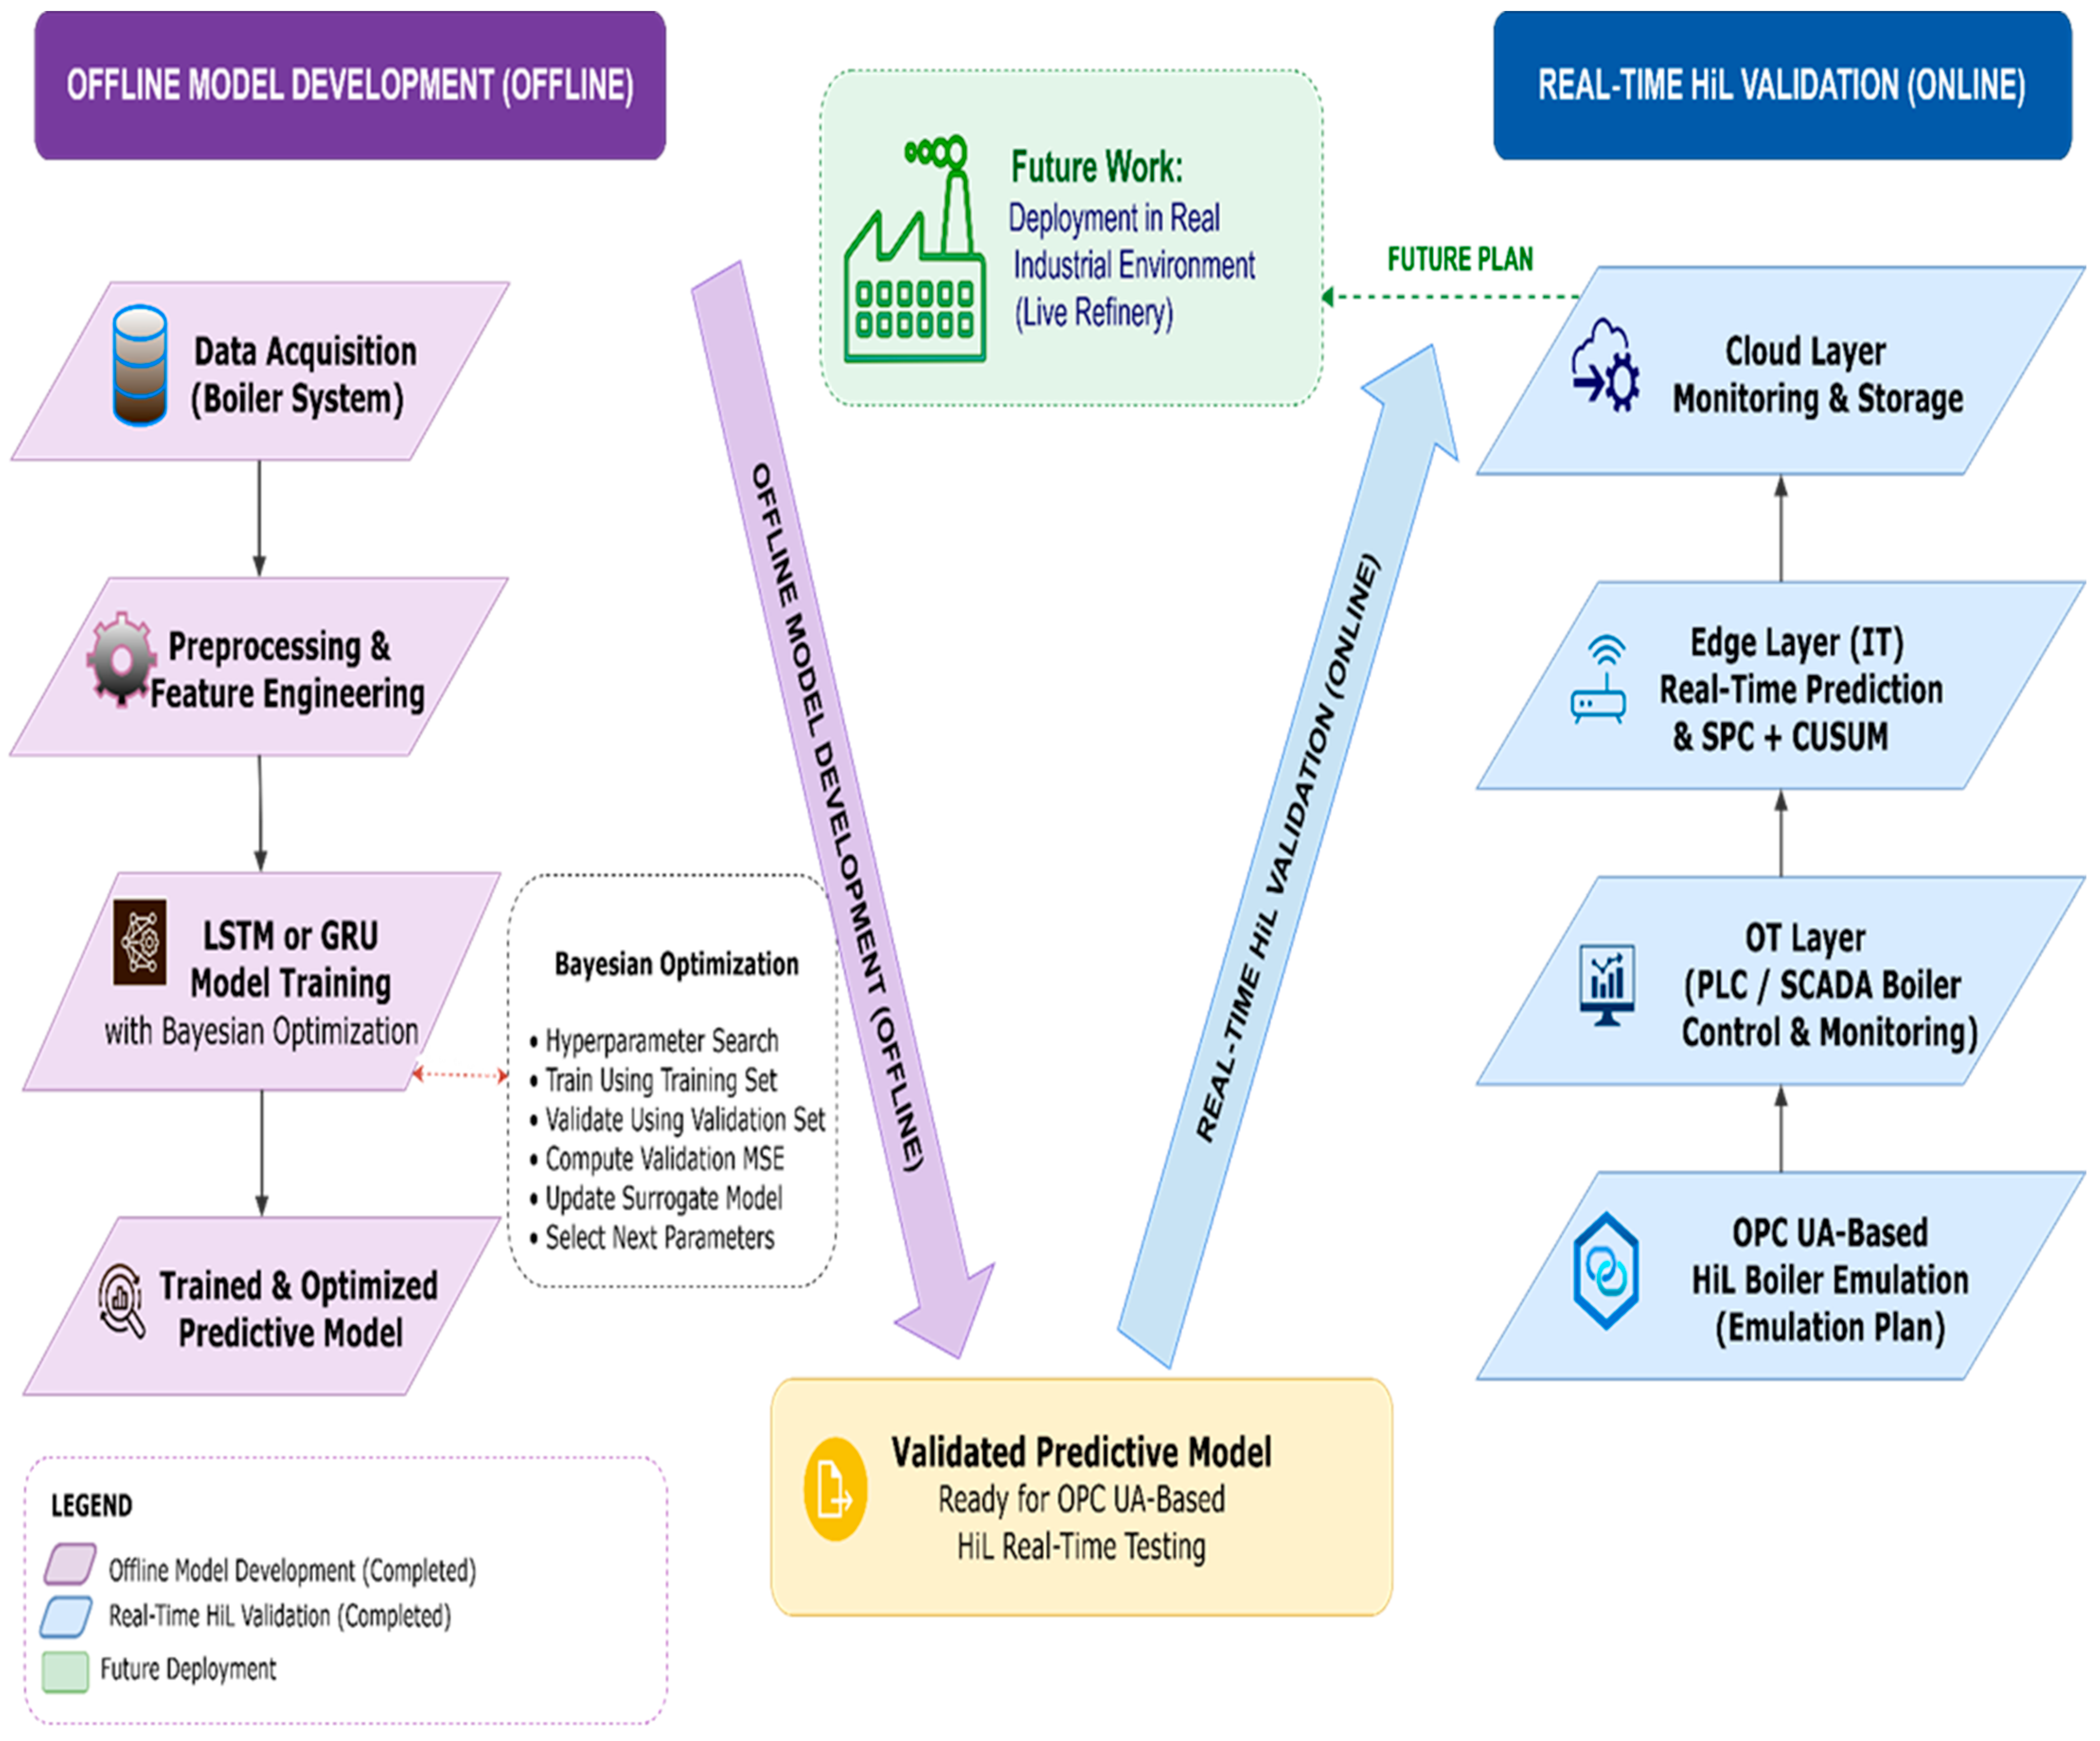
A practical two-phase predictive monitoring and deployment strategy is proposed, as illustrated in Figure 2. The developed solution has a V-shaped development and validation methodology, connecting offline model development and real-time integration in industry. In the proposed structure, each component is focused on a complementary industrial monitoring need. The deep learning models are characterized by their multivariate predictive power of nonlinear industrial behavior, the SPC sets the adaptive statistical thresholds, and the CUSUM improves the sensitivity to gradual and persistent deviations in industrial operations. At the deployment phase, the SPC/CUSUM monitoring layer is used to monitor the prediction residuals for real-time anomaly detection, as outlined in Section 3.3.
Figure 2.
Model-based design and real-time emulation workflow based on the v-model architecture.
- Phase I (Offline Phase—MiL): Phase 1 includes the development and the validation of the models based on historical industrial data within a Model-in-the-Loop (MiL) environment to guarantee the predictive reliability before deployment.
- Phase II (Online Phase—HiL): This phase involves the deployment of the validated models within an IIoT-enabled architecture and an OPC UA-based Hardware-in-the-Loop (HiL) framework using replayed historical refinery operational data to emulate realistic industrial operating conditions for system-level validation and OT–IT integration testing under safe conditions. Future live deployment in the actual boiler plant represents a subsequent implementation stage beyond the scope of the current study.
3.2. Phase I: Predictive Model Development
This Phase focuses on the developed GRU and LSTM models performing multivariate time-series forecasting using historical sequences of industrial process and sensor measurements. The models forecast multiple operational variables one hour ahead, and the forecast residuals from the models are then evaluated by applying SPC and CUSUM tools for anomaly detection.
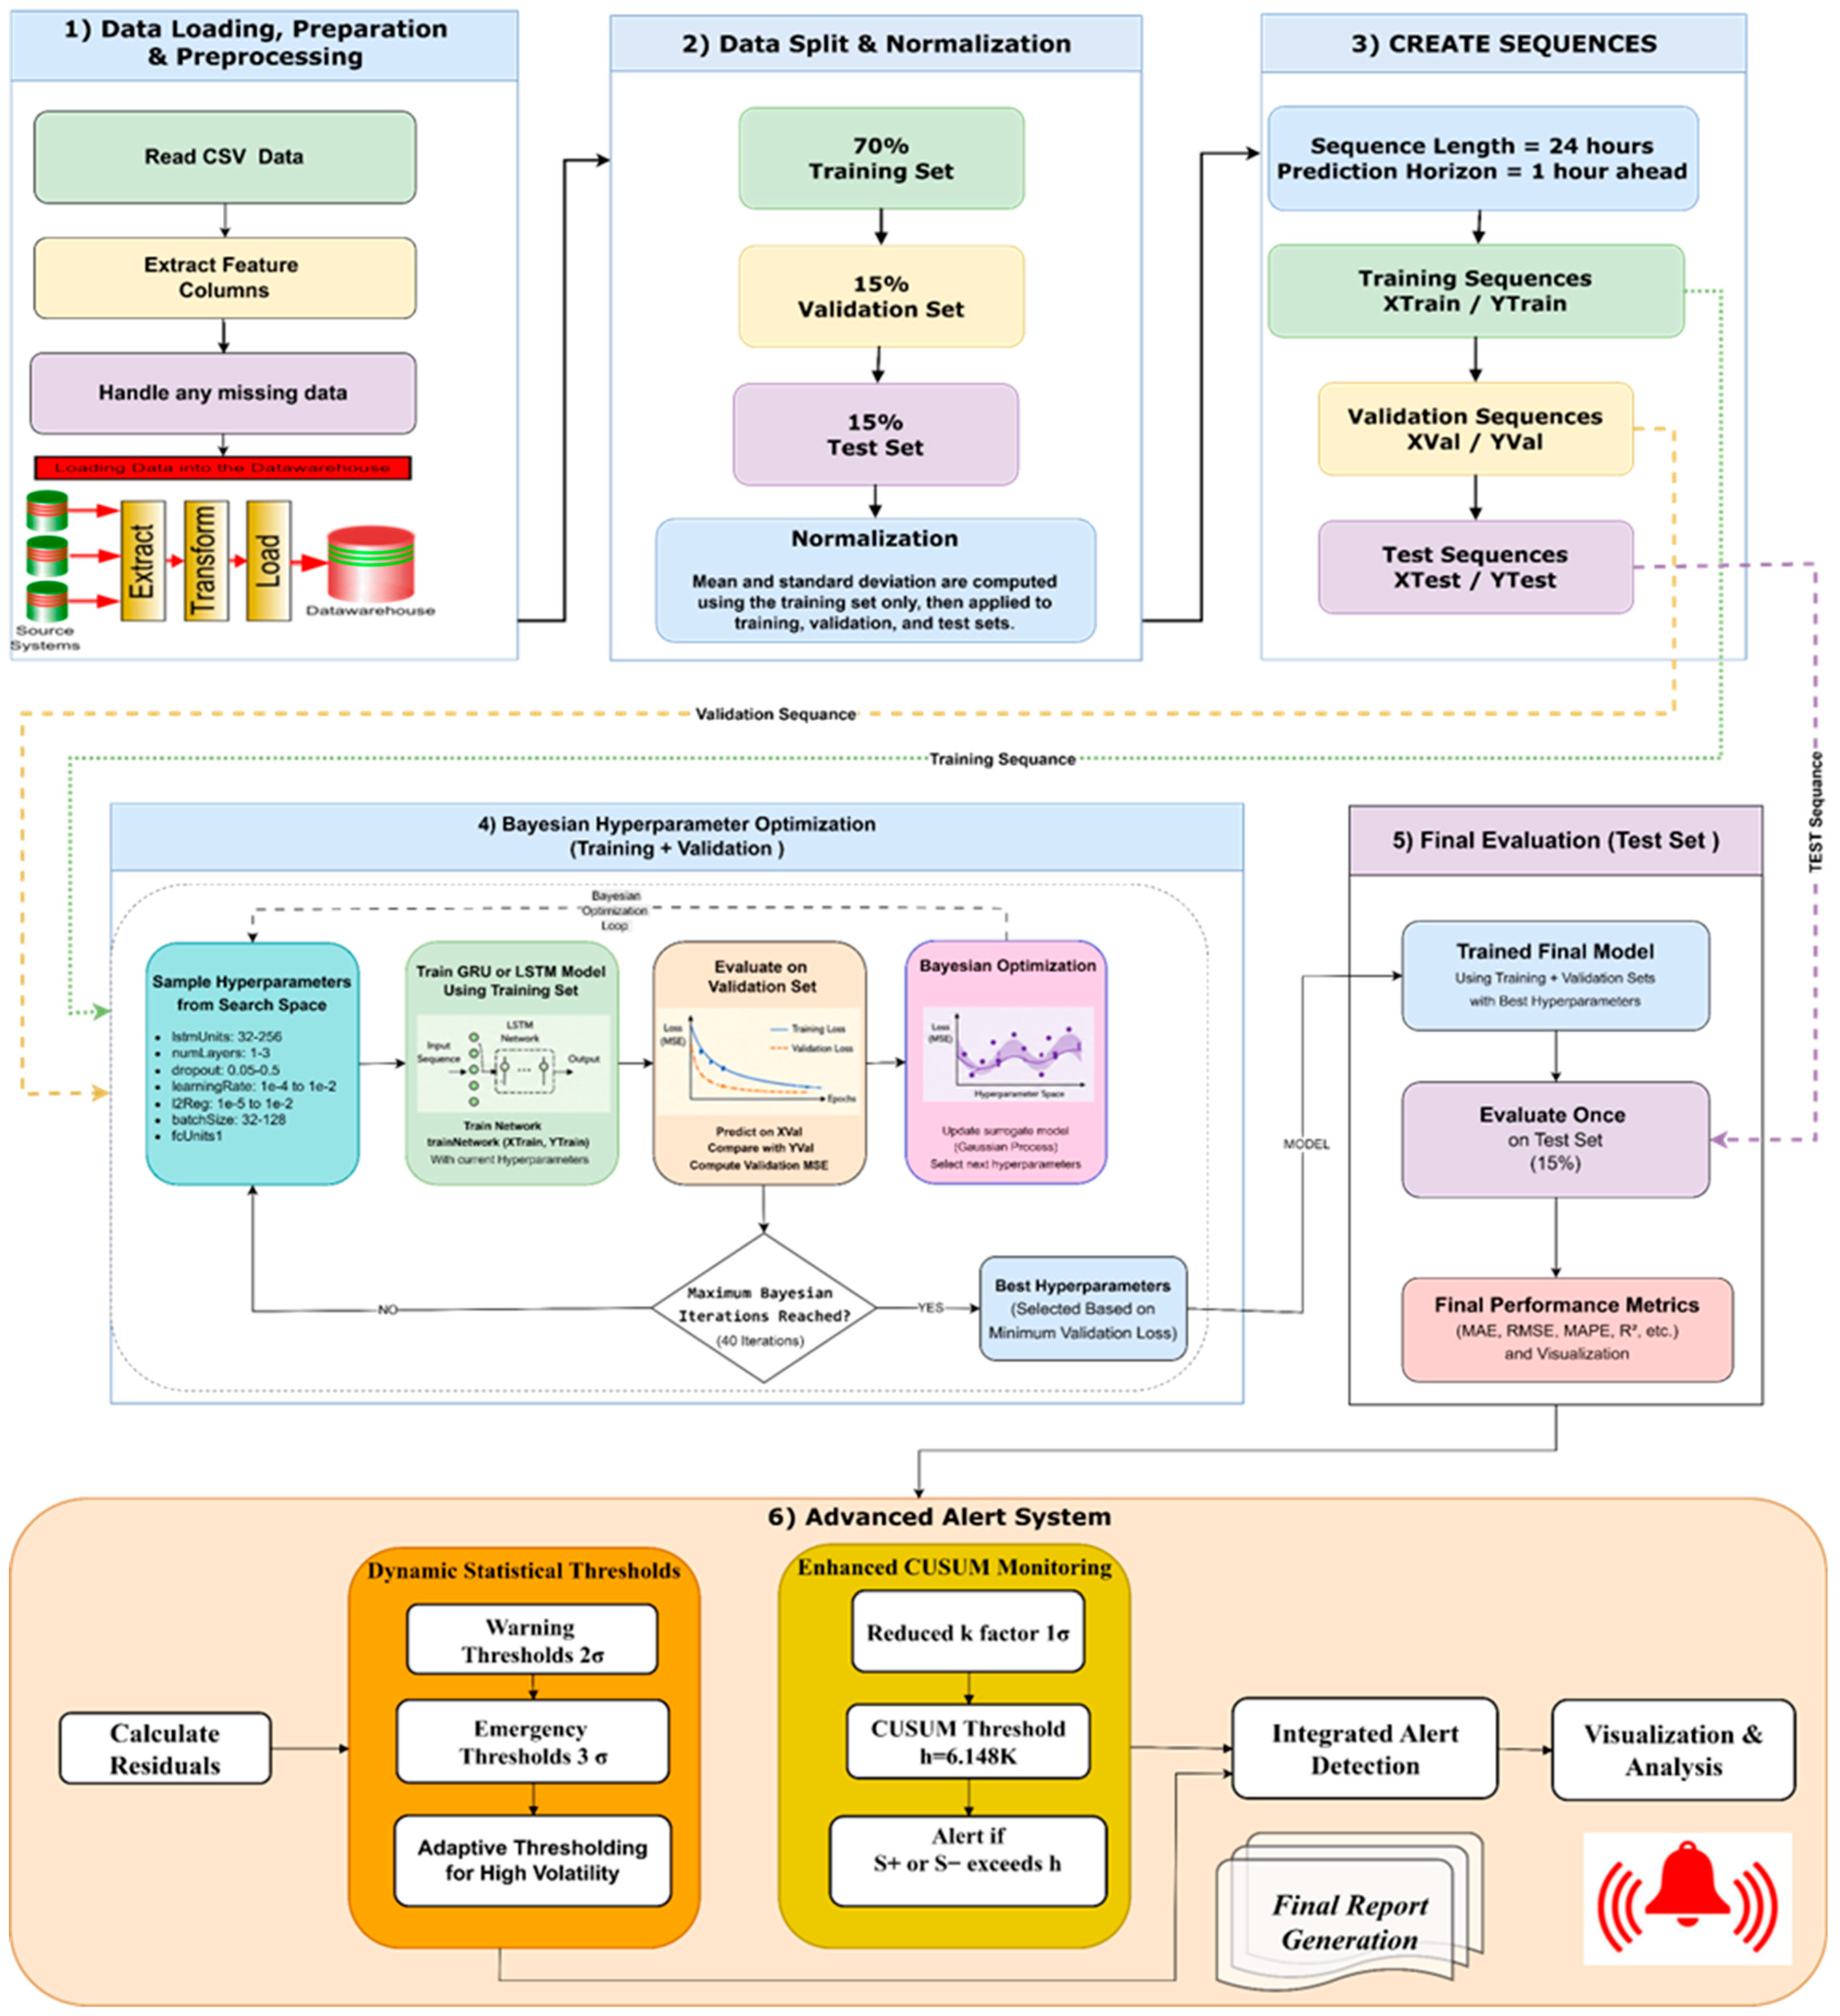
As illustrated in Figure 3, the process follows an end-to-end workflow starting with data acquisition and feature extraction, as described in Section 2, through a series of processing stages, as detailed in the following sections, ultimately leading to the development of an integrated predictive model combined with a hybrid statistical early alert system. The result of this Phase is an offline predictive framework that has been validated in a Model-in-the-Loop (MiL) environment and is ready for subsequent online deployment.
Figure 3.
End-to-end system flow chart of the proposed predictive modeling system.
3.2.1. Data Preprocessing and Time-Series Construction
The preprocessing of the operational data through one year of data collection guaranteed the data quality and the reliability of the model. The dataset was split into training (70%), validation (15%), and testing (15%) parts. Then, the variables were normalized. A sliding window strategy was implemented, with 24 h of past data used to predict the next one-hour system state, which facilitated the successful temporal learning of the multivariate industrial signals.
3.2.2. Time-Series Modeling Approach
Time-series prediction plays a central role in industrial data analytics by enabling the forecasting of future system behavior based on sequential historical observations {x1, x2, …, xt} [42,43]. In industrial boiler systems, predictive maintenance is aided by accurate forecasting, enabling the early identification of abnormal operating conditions and minimizing unexpected downtime.
However, industrial time-series data are highly time-dependent, have multivariate interactions, and display non-stationary behavior, which limit the effectiveness of traditional statistical models such as Autoregressive Integrated Moving Average (ARIMA), exponential smoothing, and vector autoregression [44,45]. To address these challenges, deep learning approaches based on recurrent neural network (RNN) architectures have been widely adopted [46].
3.2.3. Deep Learning Model Development (LSTM and GRU)
Long Short-Term Memory (LSTM) and Gated Recurrent Unit (GRU) are two common types of neural networks used in predictive modeling. Initially developed by Hochreiter and Schmidhuber (1997), LSTM networks are tailored to address long-term temporal information dependencies using gated memory, which is appropriate to model nonlinear processes in industry. The GRU is a simplified form of the LSTM that integrates the gating mechanisms into a simpler form, with fewer parameters and with faster training while maintaining comparable predictive performance [46,47]. Both the architectures have been broadly used for time-series forecasting in industrial applications [41]. Both the architectures are applied within a multivariate time-series framework using a Multi-Input Multi-Output (MIMO) formulation. Let
denote the input sequence of length for the -th sample, where represents the vector of process variables at time . The objective is to predict the future system state at a prediction horizon using a Multi-Input Multi-Output (MIMO) formulation. The LSTM model processes the input sequence to produce the hidden representation:
This is mapped to the predicted output:
Similarly, the GRU-based model is defined as follows:
Both the models are trained by minimizing the mean squared error (MSE):
where the main symbols and abbreviations used in the proposed framework are summarized in the Nomenclature section.
3.2.4. Optimization of the Model Hyperparameters
Several deep learning architectures were evaluated during the model development phase to identify suitable configurations for the system-level predictive monitoring of an industrial boiler. Among the methodologies that were tested, LSTM and GRU were chosen because they have an excellent ability to capture the nonlinear temporal dynamics of multivariate industry data. Both the models also exhibited predictive performance that was reliable, and each architecture exhibited strengths based on the dynamic behavior of particular signals. To make the models more accurate and robust, important hyperparameters such as the number of hidden units, the learning rate, the dropout rate, and the sequence length were optimized with the help of a Bayesian optimization method. This is an essential step, as hyperparameter selection can significantly impact the model performance. The learning rate was identified as one of the most influential factors affecting prediction accuracy [48].
The optimization process follows a sequential model-based strategy, where a Gaussian process surrogate model is used to approximate the objective function (validation loss). At each iteration, the Expected Improvement (EI) acquisition function selects the next candidate configuration by balancing the exploration of uncertain regions and the exploitation of promising solutions.
Table 2 describes the hyperparameter search space for the Bayesian optimization together with the final optimized hyperparameters for the LSTM and GRU models. The model that produced the lowest validation loss was chosen as the optimal configuration. The dataset was divided into training, validation and test sets, in chronological order, to minimize the risk of overfitting and to ensure good generalization of the model in industrial operating conditions. The test set was completely isolated from the training procedure and eventually applied to evaluate the model performance. Furthermore, dropout layers, L2 regularization and validation-based Bayesian optimization were implemented to guarantee the stability of the training process and to reduce the risk of overfitting.
Table 2.
Optimized LSTM and GRU configurations and Bayesian optimization search space.
It is important to mention that the optimized hyperparameters are dependent on the boiler configuration, the operational dynamics and the properties of the dataset used. Thus, the exact value of the hyperparameters is potentially different for different industrial systems. However, the proposed Bayesian optimization methodology can still be applied to similar predictive monitoring applications.
3.3. Hybrid Statistical Fault Detection Framework
The early identification of abnormal trends is very important in industrial systems to avoid failures, unplanned shutdowns, and financial loss, especially in safety-critical boiler components.
While AI predictive maintenance-based approaches have been proven to accurately predict at the system level [49], reliable statistical monitoring approaches are still required to provide strong early warnings over different operating conditions [27].
To improve early anomaly detection and monitoring robustness, a hybrid SPC–CUSUM residual monitoring framework is integrated with the predictive models.
3.3.1. Dynamic Statistical Thresholds
In order to overcome the drawbacks of fixed alarm limits in standard control systems, dynamic statistical thresholds were calculated based on normal operating behavior:
Such a solution complies with the present Statistical Process Control (SPC) approaches, where dynamic thresholding is used to improve the identification of anomalies when operating conditions vary. In contrast to the static thresholds, the dynamic thresholds based on the distributions in the historical data decrease the false alarms and increase the early warning ability without the need to have labeled data [50,51].
This approach enables adaptive thresholding under varying industrial operating conditions while reducing false alarms.
At the time of implementation, the prediction residuals were continuously monitored against statistical thresholds derived from the training residuals.
A warning alert was issued when:
while an emergency alert was triggered when:
The selected limits provide a practical balance between sensitivity to abnormal deviations and reduction of false alarms under varying industrial conditions.
3.3.2. CUSUM-Based Residual Monitoring
To complement the threshold-based detection, a CUSUM algorithm is applied to monitor the residual errors between the predicted and measured values. The residual at time t is defined as .
The recursive CUSUM statistics were computed as follows:
The initial values were . The sensitivity parameter k was chosen as the standard deviation of the residuals (k = σ), which allowed identification of shifts at the scale of the standard deviation. The decision interval h was selected within the recommended ranges [52,53] and was defined as h = k.
This configuration improves the robustness of the CUSUM monitoring scheme and reduces false alarms while preserving the sensitivity to sustained deviations of practical significance.
During the execution, a positive shift alarm was triggered when , while a negative shift alarm was generated when , indicating sustained deviations between the predicted and measured values. An alarm was triggered when > h or < −h, indicating sustained deviations. This formulation is more sensitive to detect gradual faults and is resilient to false alarms, even in non-normal industrial data distributions [54].
3.3.3. Integrated Alarm Decision Logic
SPC and CUSUM monitoring are jointly applied to support the detection of both abrupt and gradual operational deviations. The alarm state is determined as following the logic described below.
- No Alert:
- ○
- All predicted values remain within limits, and
- ○
- CUSUM statistics remain within .
- Warning Alert:
- ○
- Any predicted value exceeds , or
- ○
- CUSUM statistics exceed .
- Emergency Alert:
- ○
- Any predicted value exceeds .
3.4. Phase II: Real-Time Deployment and OT–IT Integration
This Phase deploys the predictive monitoring framework for online validation by utilizing a Hardware-in-the-Loop (HiL) configuration that combines the OT and IT layers based on the OPC UA communication platform. The objective is to emulate a realistic industrial environment while enabling the safe and controlled validation of the predictive models without affecting the live plant operations. Table 3 and Table 4, respectively, summarize the hardware and software components that support the proposed solution, including the industrial control hardware, the communication infrastructure, and the analytics platforms needed to support the real-time implementation and the HiL validation.
Table 3.
Hardware components of the proposed HiL-based OT–IT system.
Table 4.
Software components supporting predictive monitoring and deployment.
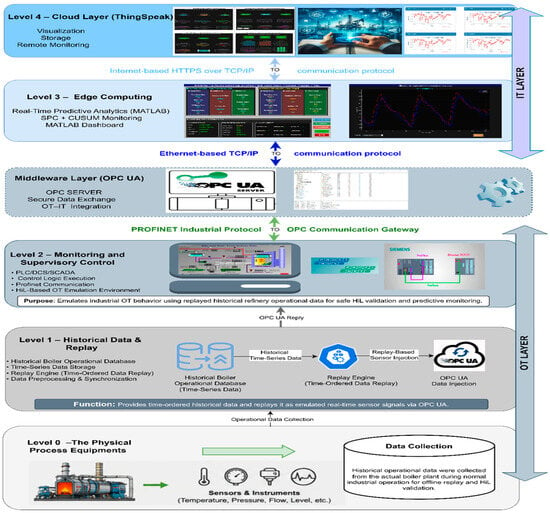
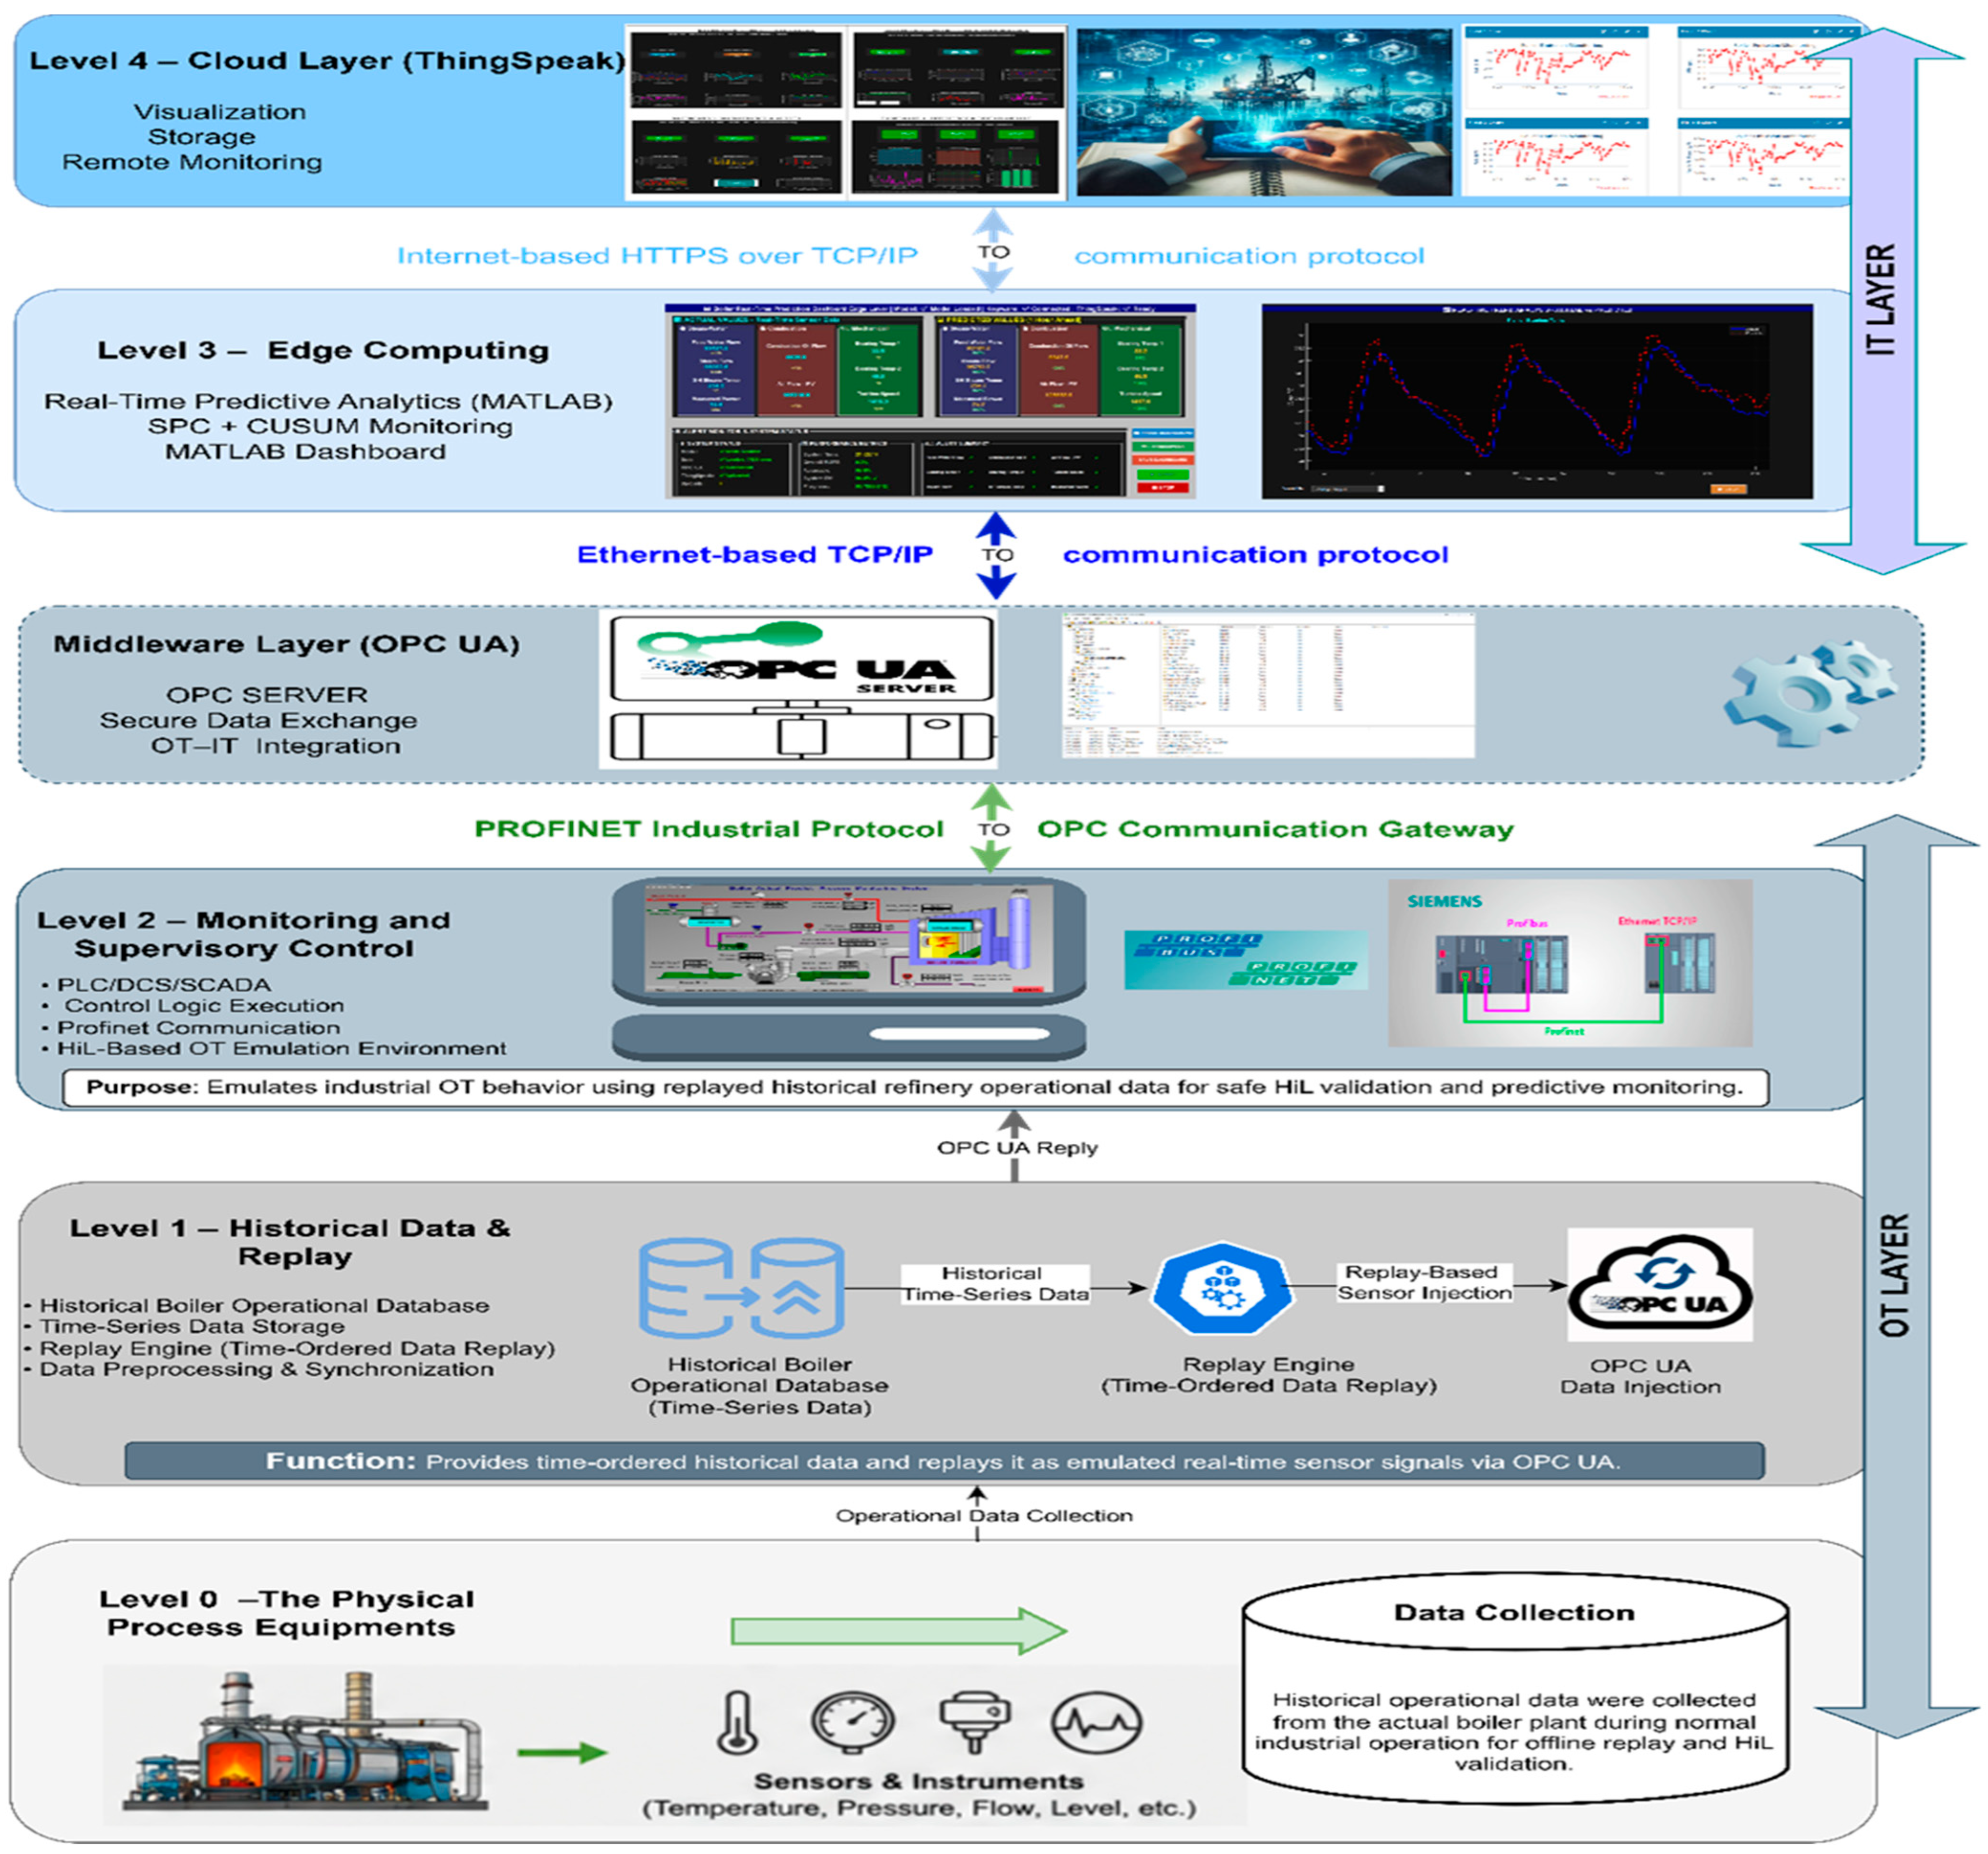
As illustrated in Figure 4, the proposed system follows a layered OT–IT architecture spanning from the physical process layer to cloud-based monitoring services. At the field level, the historical boiler data are replayed and injected as emulated sensor signals, enabling the realistic representation of plant behavior without requiring a live industrial system. These signals are processed by the PLC at the OT layer, which operates as an emulated boiler control system.
Figure 4.
Layered OT–IT architecture of the proposed IIoT-based predictive monitoring system.
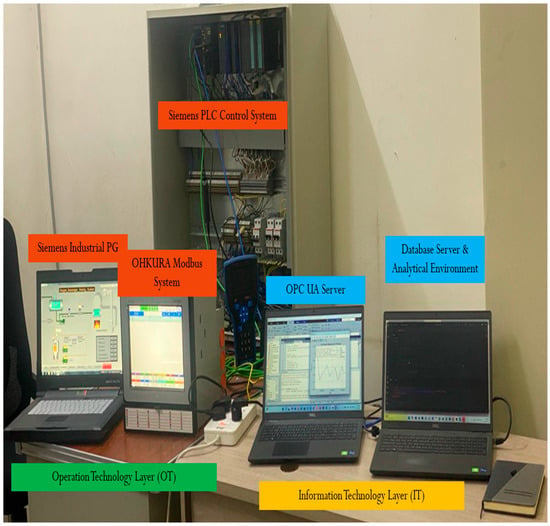
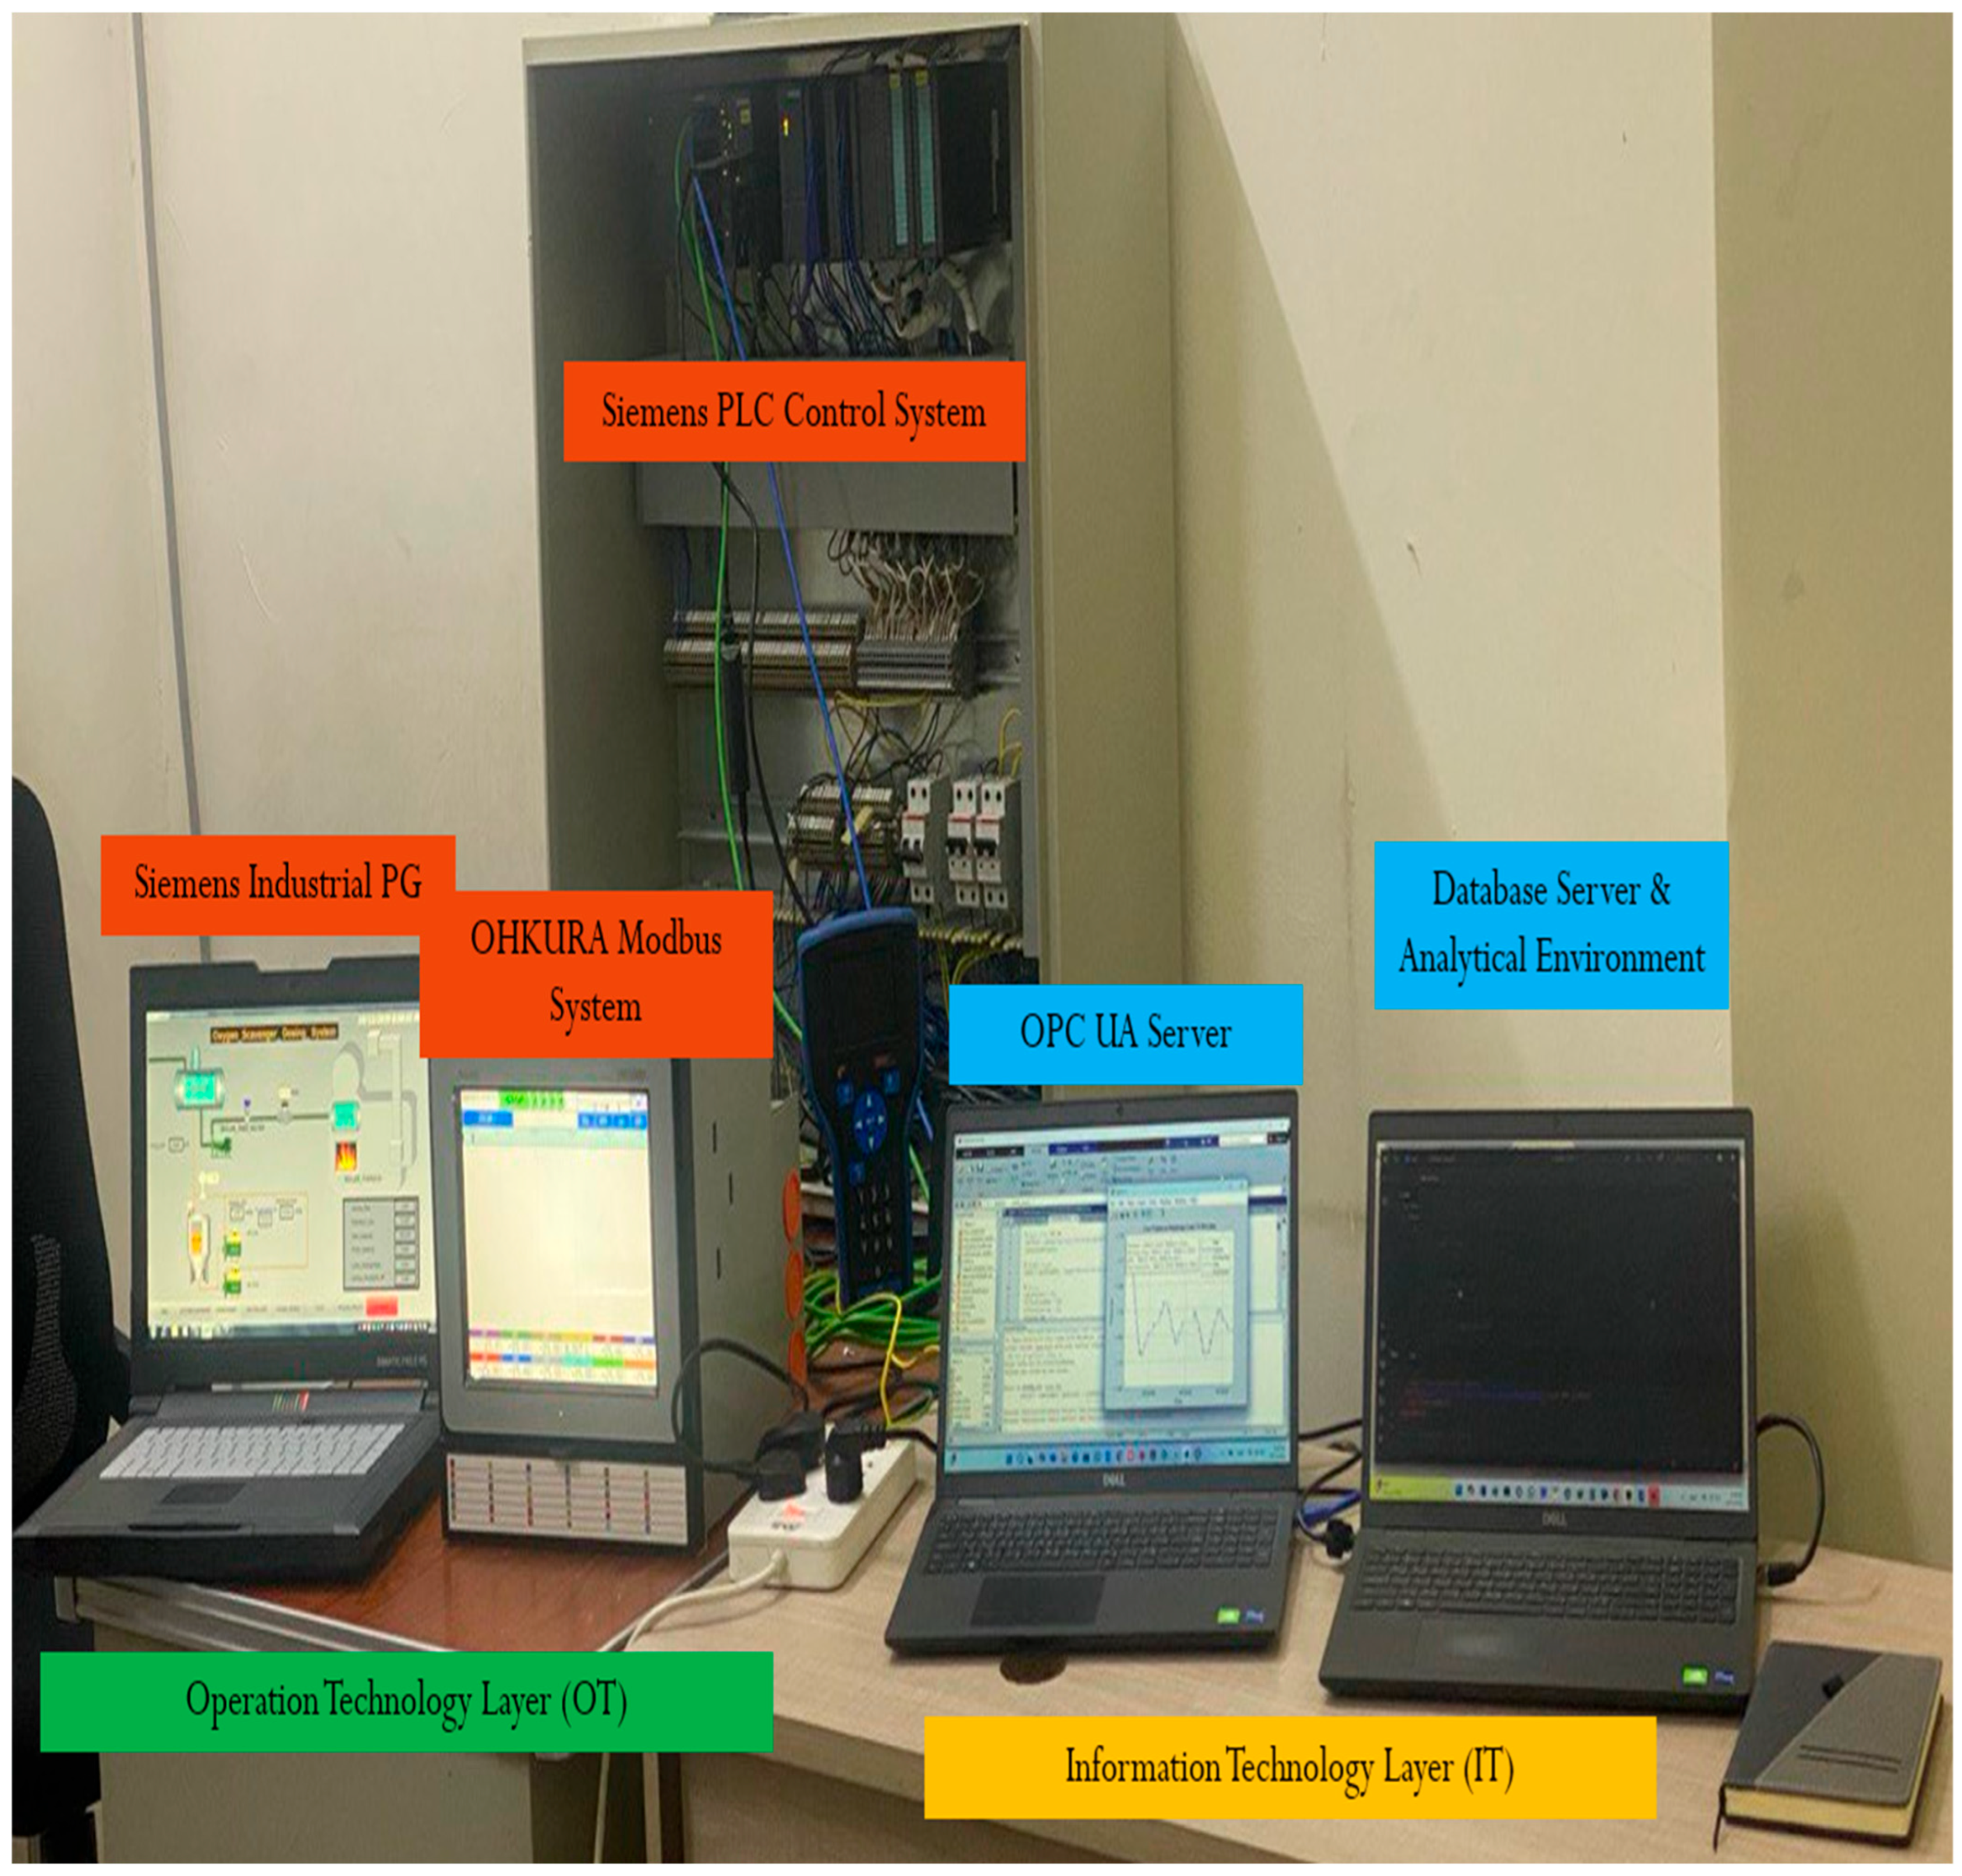
The processed data are transferred through the OPC UA middleware layer that provides a secure and standardized connection between the OT and IT domains. At the edge layer, trained deep learning models (LSTM or GRU) are used to perform the real-time predictive analytics, whereas the hybrid SPC–CUSUM framework is used to perform the residual-based monitoring and the anomaly detection. The real experimental design of the proposed system of the HiL is presented in Figure 5, in which the Siemens PLC control system, the OPC UA server, the industrial communication interfaces, and the IT-layer analytical environment are physically integrated to replicate real industrial conditions.
Figure 5.
Experimental HiL setup showing PLC control, OPC UA communication, and IT-based analytics.
Eventually, the analyzed data are forwarded to the cloud layer, where visualization, storage, and remote monitoring are implemented. Concurrently, the chosen prediction outputs and alarm signals are sent back to the PLC, establishing a feedback loop that enables closed-loop monitoring and enhances system responsiveness within the HiL environment.
3.4.1. OT Layer: PLC-Based Boiler Emulation
In the OT layer, a virtual boiler system is implemented using a Siemens S7-300 PLC programmed in the TIA Portal environment. The historical operational data are replayed into the PLC as simulated field signals, enabling the realistic emulation of combustion, steam–water, and mechanical subsystem behavior. The replay mechanism is based on a constant sampling period, which enables the PLC to take incoming signals as real sensor readings. The visualization of the process variables, the system states and the alarm conditions is provided using a WinCC SCADA interface; this simulation mimics a typical industrial boiler control environment.
3.4.2. Middleware Layer: OPC UA Communication
The exchange of data between the OT and IT is performed based on OPC UA middleware server, which is deployed on the Kepware platform. The PLC variables are mapped to the OPC UA tags that allow the standardized and secure connection to the external applications. This layer guarantees the interoperability of the heterogeneous systems and the synchronization of real-time control operations and analytics.
3.4.3. Edge Layer: Real-Time Predictive Analytics
The real-time process data are accessed at the edge layer on the OPC UA server and fed into deployed deep learning models. The models operate in online inference mode to generate predictions, residuals, and alarm indicators. This layer performs the hybrid SPC–CUSUM monitoring framework to examine the residual signals and indicate unusual behavior in the system. The interactive monitoring dashboard is used to show the real-time visualization of the measured values, predictions, and alerts. Two-way communication between the edge and OT layers allows the system to send the prediction outputs and alarm signals to the PLC to visualize the SCADA-level data and enables simultaneous edge-cloud communication to monitor and visualize the data remotely.
3.4.4. Cloud Layer: Remote Monitoring and Visualization
The process data and the prediction results are then sent to a ThingSpeak Cloud Platform (MathWorks) to be remotely monitored and stored. The dashboards are cloud-based, so they can be easily used to monitor the performance of systems, allowing them to be analyzed over the long-term, plan maintenance, and make decisions based on the data. This makes up the end-to-end field-to-cloud workflow of the suggested IIoT-based predictive monitoring framework.
4. Experimental Validation and Results
In this Section, the proposed IIoT-based predictive monitoring framework is experimentally validated through Hardware-in-the-Loop (HiL) deployment. The analysis is supplemented by two complementary stages: offline validation of the predictive accuracy by historical data and online deployment within the HiL environment to evaluate real-time performance, system integration, and operational reliability. This dual-phase methodology allows a comprehensive assessment under both controlled and quasi-real industrial conditions, providing insight into both model generalization and feasibility for actual deployment.
4.1. Offline Model Validation
The performance of the developed models was tested using a test set (1149 sequences, 15% of the data) to assess their prediction performance. The LSTM and GRU models were set up with the best possible architectures and training conditions for a fair comparison. The performance of the models was assessed using the coefficient of determination (R2), the mean absolute percentage error (MAPE), the test accuracy (%), and the a20 index. Test accuracy (%) is defined as 100% − MAPE, where higher values indicate lower average prediction error and better predictive performance. In addition, the a20 index measures the percentage of predictions where the relative error does not exceed [55,56], and it defined as follows:
where is the indicator function that equals 1 when the relative prediction error is within ±20%, and 0 otherwise. The overall predictive performance of the LSTM and GRU models is presented in Table 5.
Table 5.
Overall predictive performance of LSTM and GRU models.
The GRU model consistently outperformed the LSTM model in terms of the average R2 (0.8956) and the MAPE (0.6345%), compared to 0.8240 and 0.7919% for the LSTM model, respectively. The models have a MAPE below 0.8%, which is about 25 times lower than the 20% tolerance limit, and reached an a20 index of 100%, thus verifying that all the predictions within one hour of the forecast are within the error margin.
This improvement can be attributed to the simplified gating mechanism of the GRU architecture. While the LSTM uses three gates (input, forget, and output) and a separate cell state, the GRU only has two gates, update and reset, and it shares the hidden state representation. This architectural simplification greatly decreases the number of trainable parameters and the computational complexity. The decreased model complexity can provide better generalizability and avoid overfitting phenomena in noisy industrial time-series applications, where stable performance from the training and validation stages are observed. Table 6 presents the per-feature performance results.
Table 6.
Per-feature prediction performance comparison (GRU vs. LSTM).
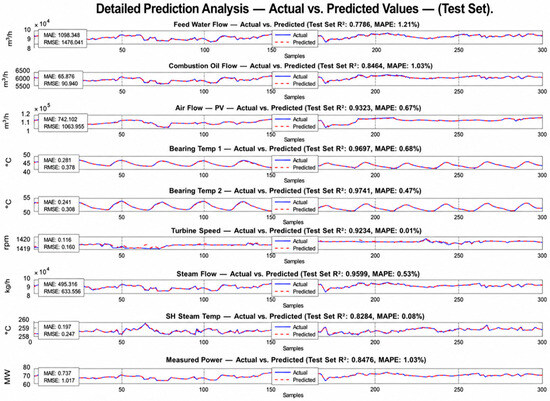
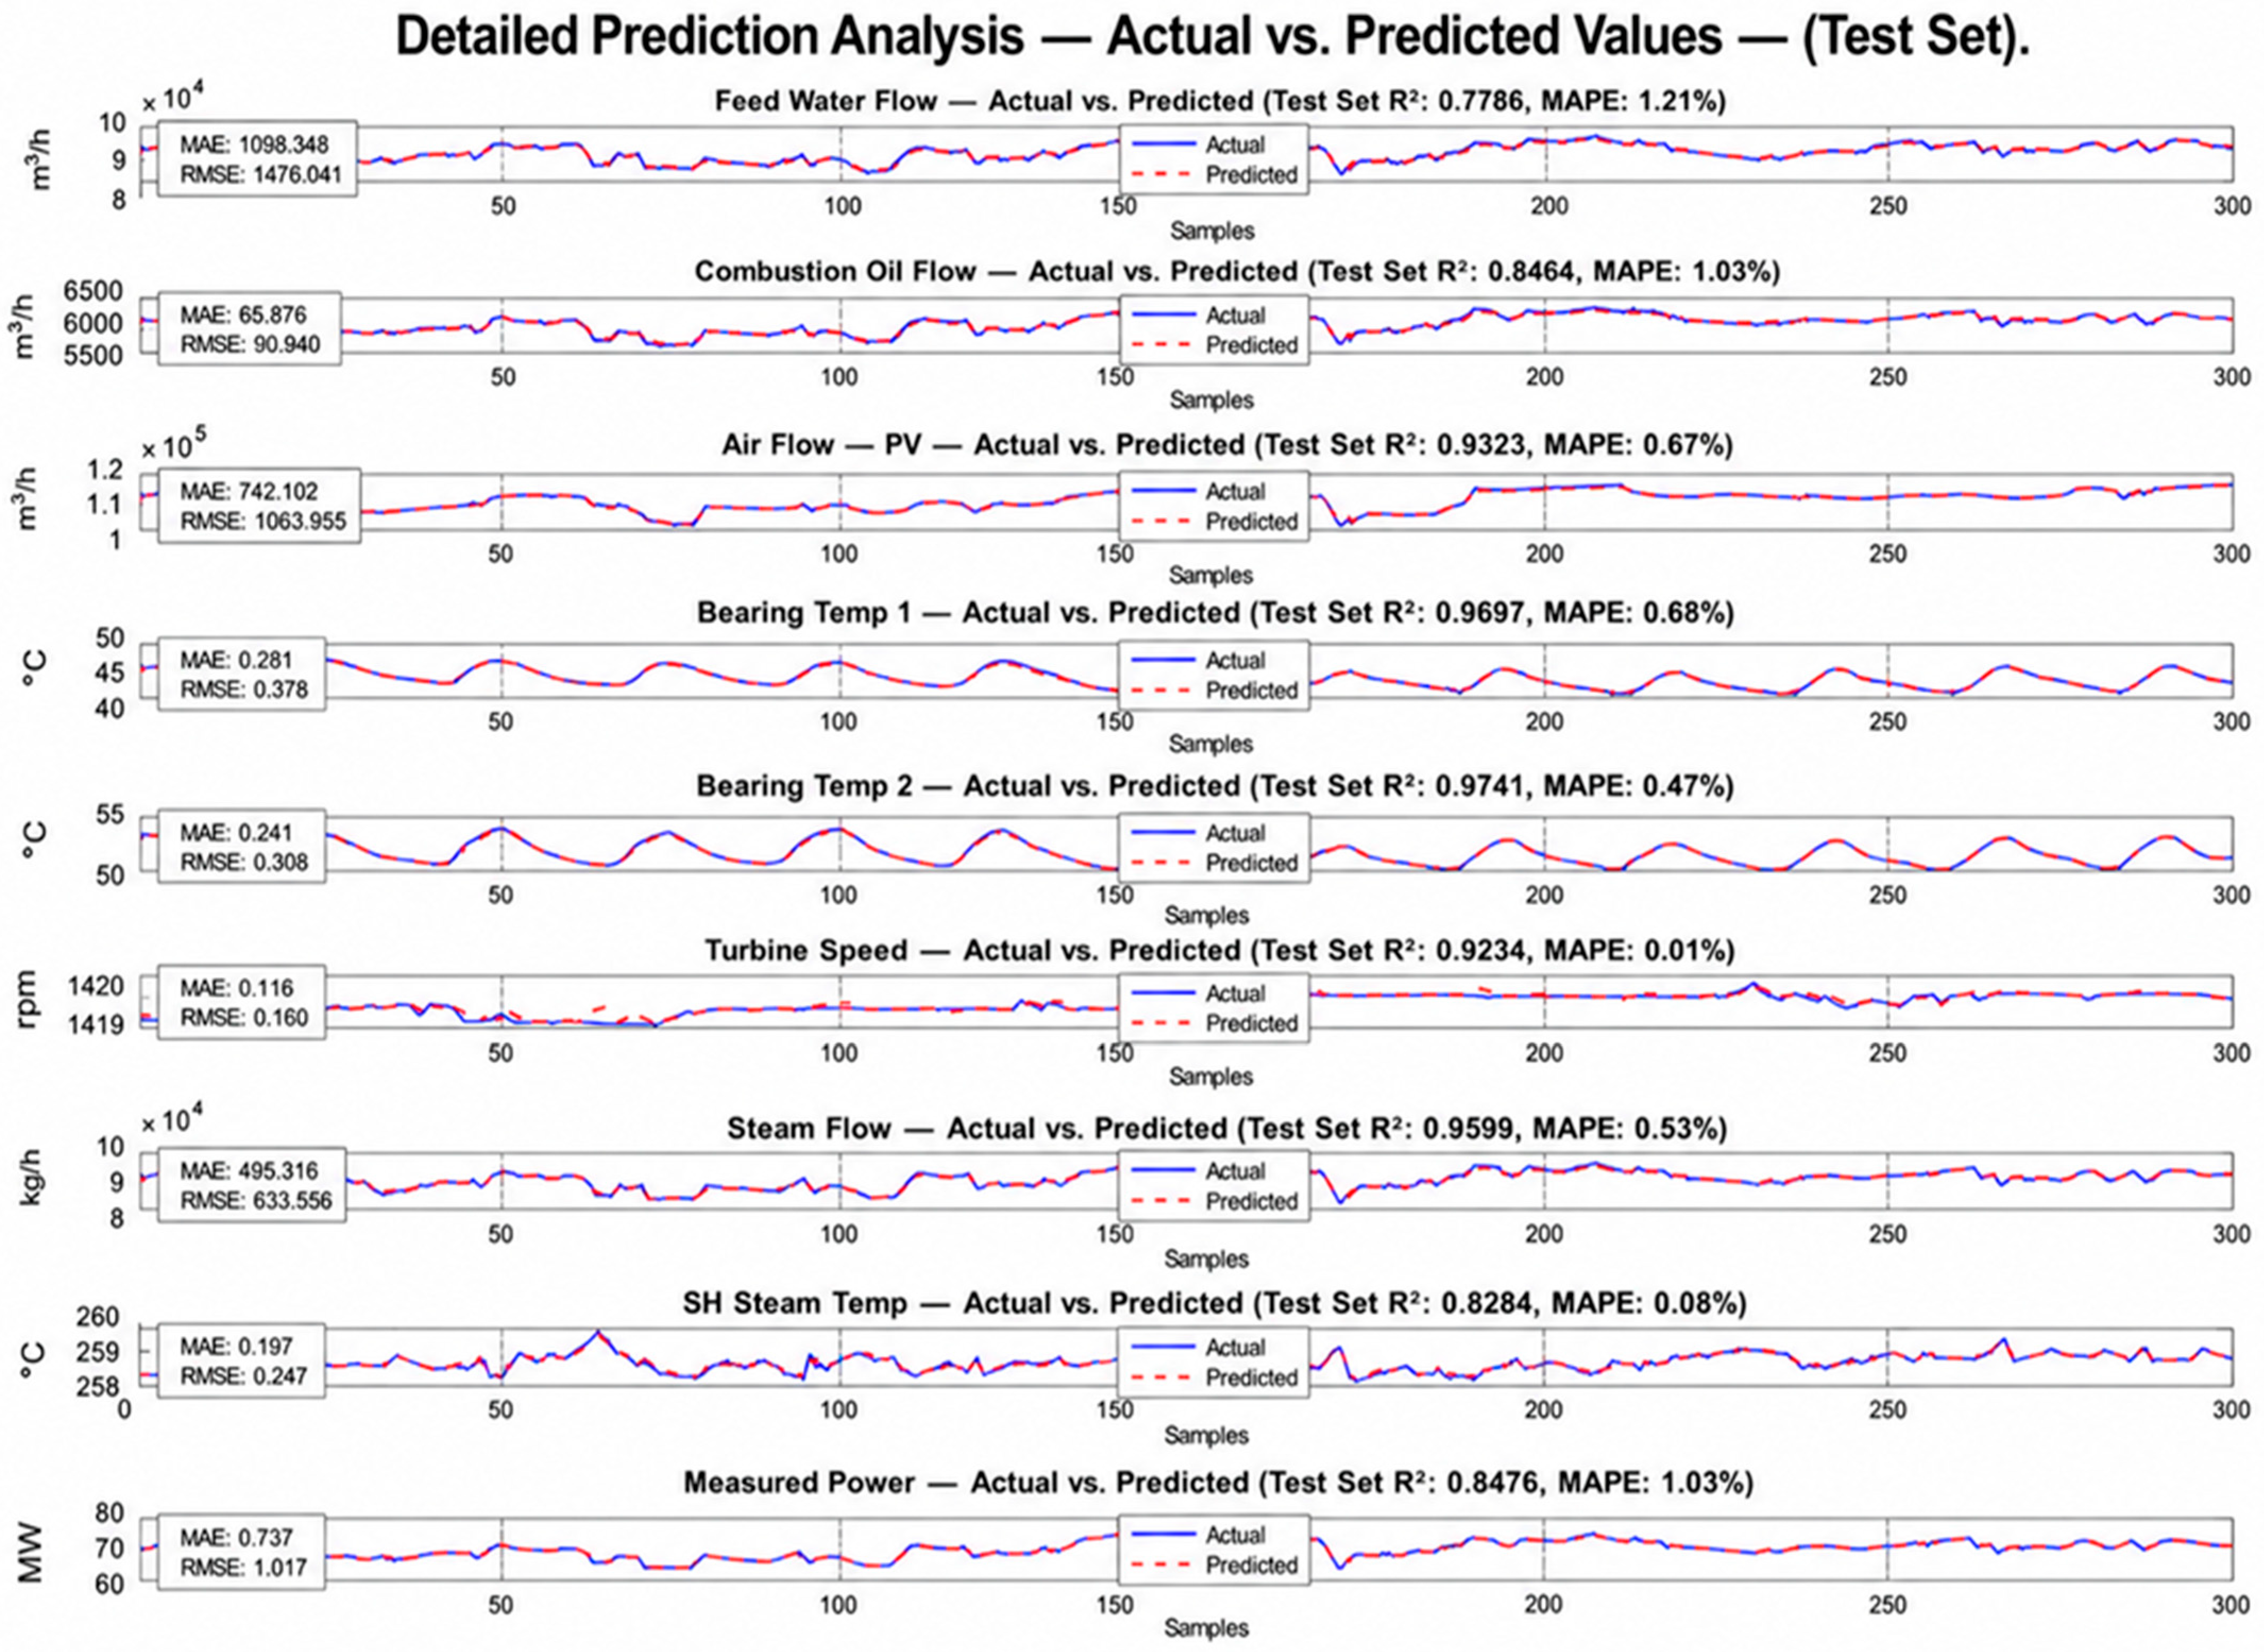
As can be seen from the table, the GRU performed significantly better than the LSTM not only on average over all the features but also on the individual scale for each single feature. In other words, all nine features provided a higher R2 and a lower MAPE when applying the GRU compared to the LSTM, with notable improvements in air flow PV, turbine speed, and SH steam temperature, and most notably in bearing temperatures and turbine speed; they yielded a higher R2 (>0.90), as they have smooth temporal dynamics that are strongly correlated with the underlying physical processes. As illustrated in Figure 6, the offline test results demonstrate a solid correlation between the actual and predicted values throughout all the assessed variables, validating that the trained algorithms are able to predict and converge towards the actual outputs when considering unseen data.
Figure 6.
Comparison between actual and predicted values for key boiler variables using the GRU model.
4.2. Alert System Evaluation (SPC + CUSUM)
The hybrid monitoring framework was applied to assess its effectiveness in providing reliable monitoring outcomes with a reduced number of generated alerts. The alerting mechanism combines statistical thresholds (2σ for warning and 3σ for emergency) and a CUSUM-based residual monitoring for the detection of sudden and gradual deviations. The alert statistics generated were compared between the two models, as shown in Table 7.
Table 7.
Alert generation comparison using SPC and CUSUM monitoring.
Moreover, the alert analysis indicates that the GRU model decreased the number of alerts by 46.2% compared to the LSTM, reflecting improved noise filtering and more stable monitoring behavior. This is particularly useful in industrial environments, where excessive alarms can lead to operator desensitization and reduced system trust. Despite the reduction in total alerts, the GRU maintained higher sensitivity to persistent faults, as evidenced by the increased CUSUM detections. The high CUSUM alerts in Bearing Temperature 1 indicate thermal variations related to mechanical wear on the turbine side. Coupling wear was confirmed as the root cause by a field inspection, confirming the practical effectiveness of the proposed monitoring approach. High warning and CUSUM alert counts were observed for the air flow PV, indicating unstable airflow due to mechanical imbalance. These findings indicate that the hybrid SPC–CUSUM framework achieves a better balance between monitoring sensitivity and robustness that enables successful anomaly detection without alarm fatigue.
4.3. Comparative Evaluation of Baseline and Bayesian-Optimized Models
Two methods, Baseline and Bayesian algorithms, were applied to improve the performance of the LSTM and GRU models, and the overall performance is shown in Table A1. The overall performance was conducted in terms of MAPE, R, and test accuracy (%). The comparison for the per-feature prediction performance is depicted in Table A2. As illustrated in Table A1, the Bayesian optimization (BO) markedly enhanced the predictive accuracy of the LSTM and GRU models. The test MAPE reduced from 0.8922% to 0.7919% (11.2%), and the R2 improved from 0.7768 to 0.8240% for the LSTM. A further significant improvement was achieved with the GRU model, with the MAPE reduced from 0.8122% to 0.6345% (21.9%), and the R2 increased from 0.8655 to 0.8956. The results obtained prove that the systematic optimization of the hyperparameters via the Bayesian optimization method is very effective, especially for the GRU architecture, which has a simpler gating mechanism and fewer hyperparameters. Similarly, the Bayesian outperformed the Baseline in optimizing the GRU and LSTM algorithms, and the optimized GRU was superior to the optimized LSTM, as depicted in Table A2, in terms of the recorded MAPE and the R2 for all nine features and for the average. Furthermore, an ablation study was carried out for the Baseline and Bayesian-optimized models for both the LSTM and GRA algorithms and the performances were evaluated based on the obtained test MAPE, test R2, and warning and emergency (2σ and 3σ) for the SPC, the CUSUM, and the total alerts, as shown in Table A3 and Table A4. In these tables, the results of each algorithm are classified into to four configurations, namely model only, model + SPC, model + CUSUM, and model + SPC + CUSUM. The key findings of the ablation study are shown in Table A5.
4.4. Online Deployment and System Performance Evaluation
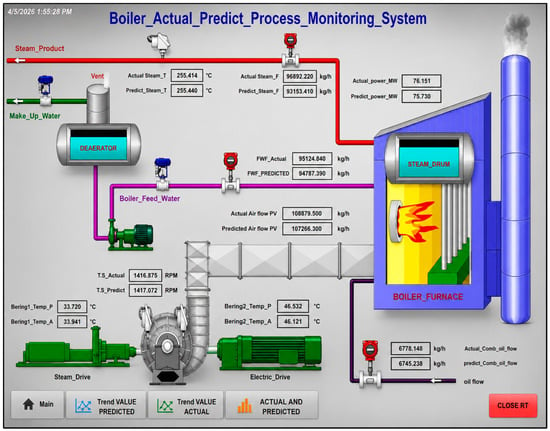
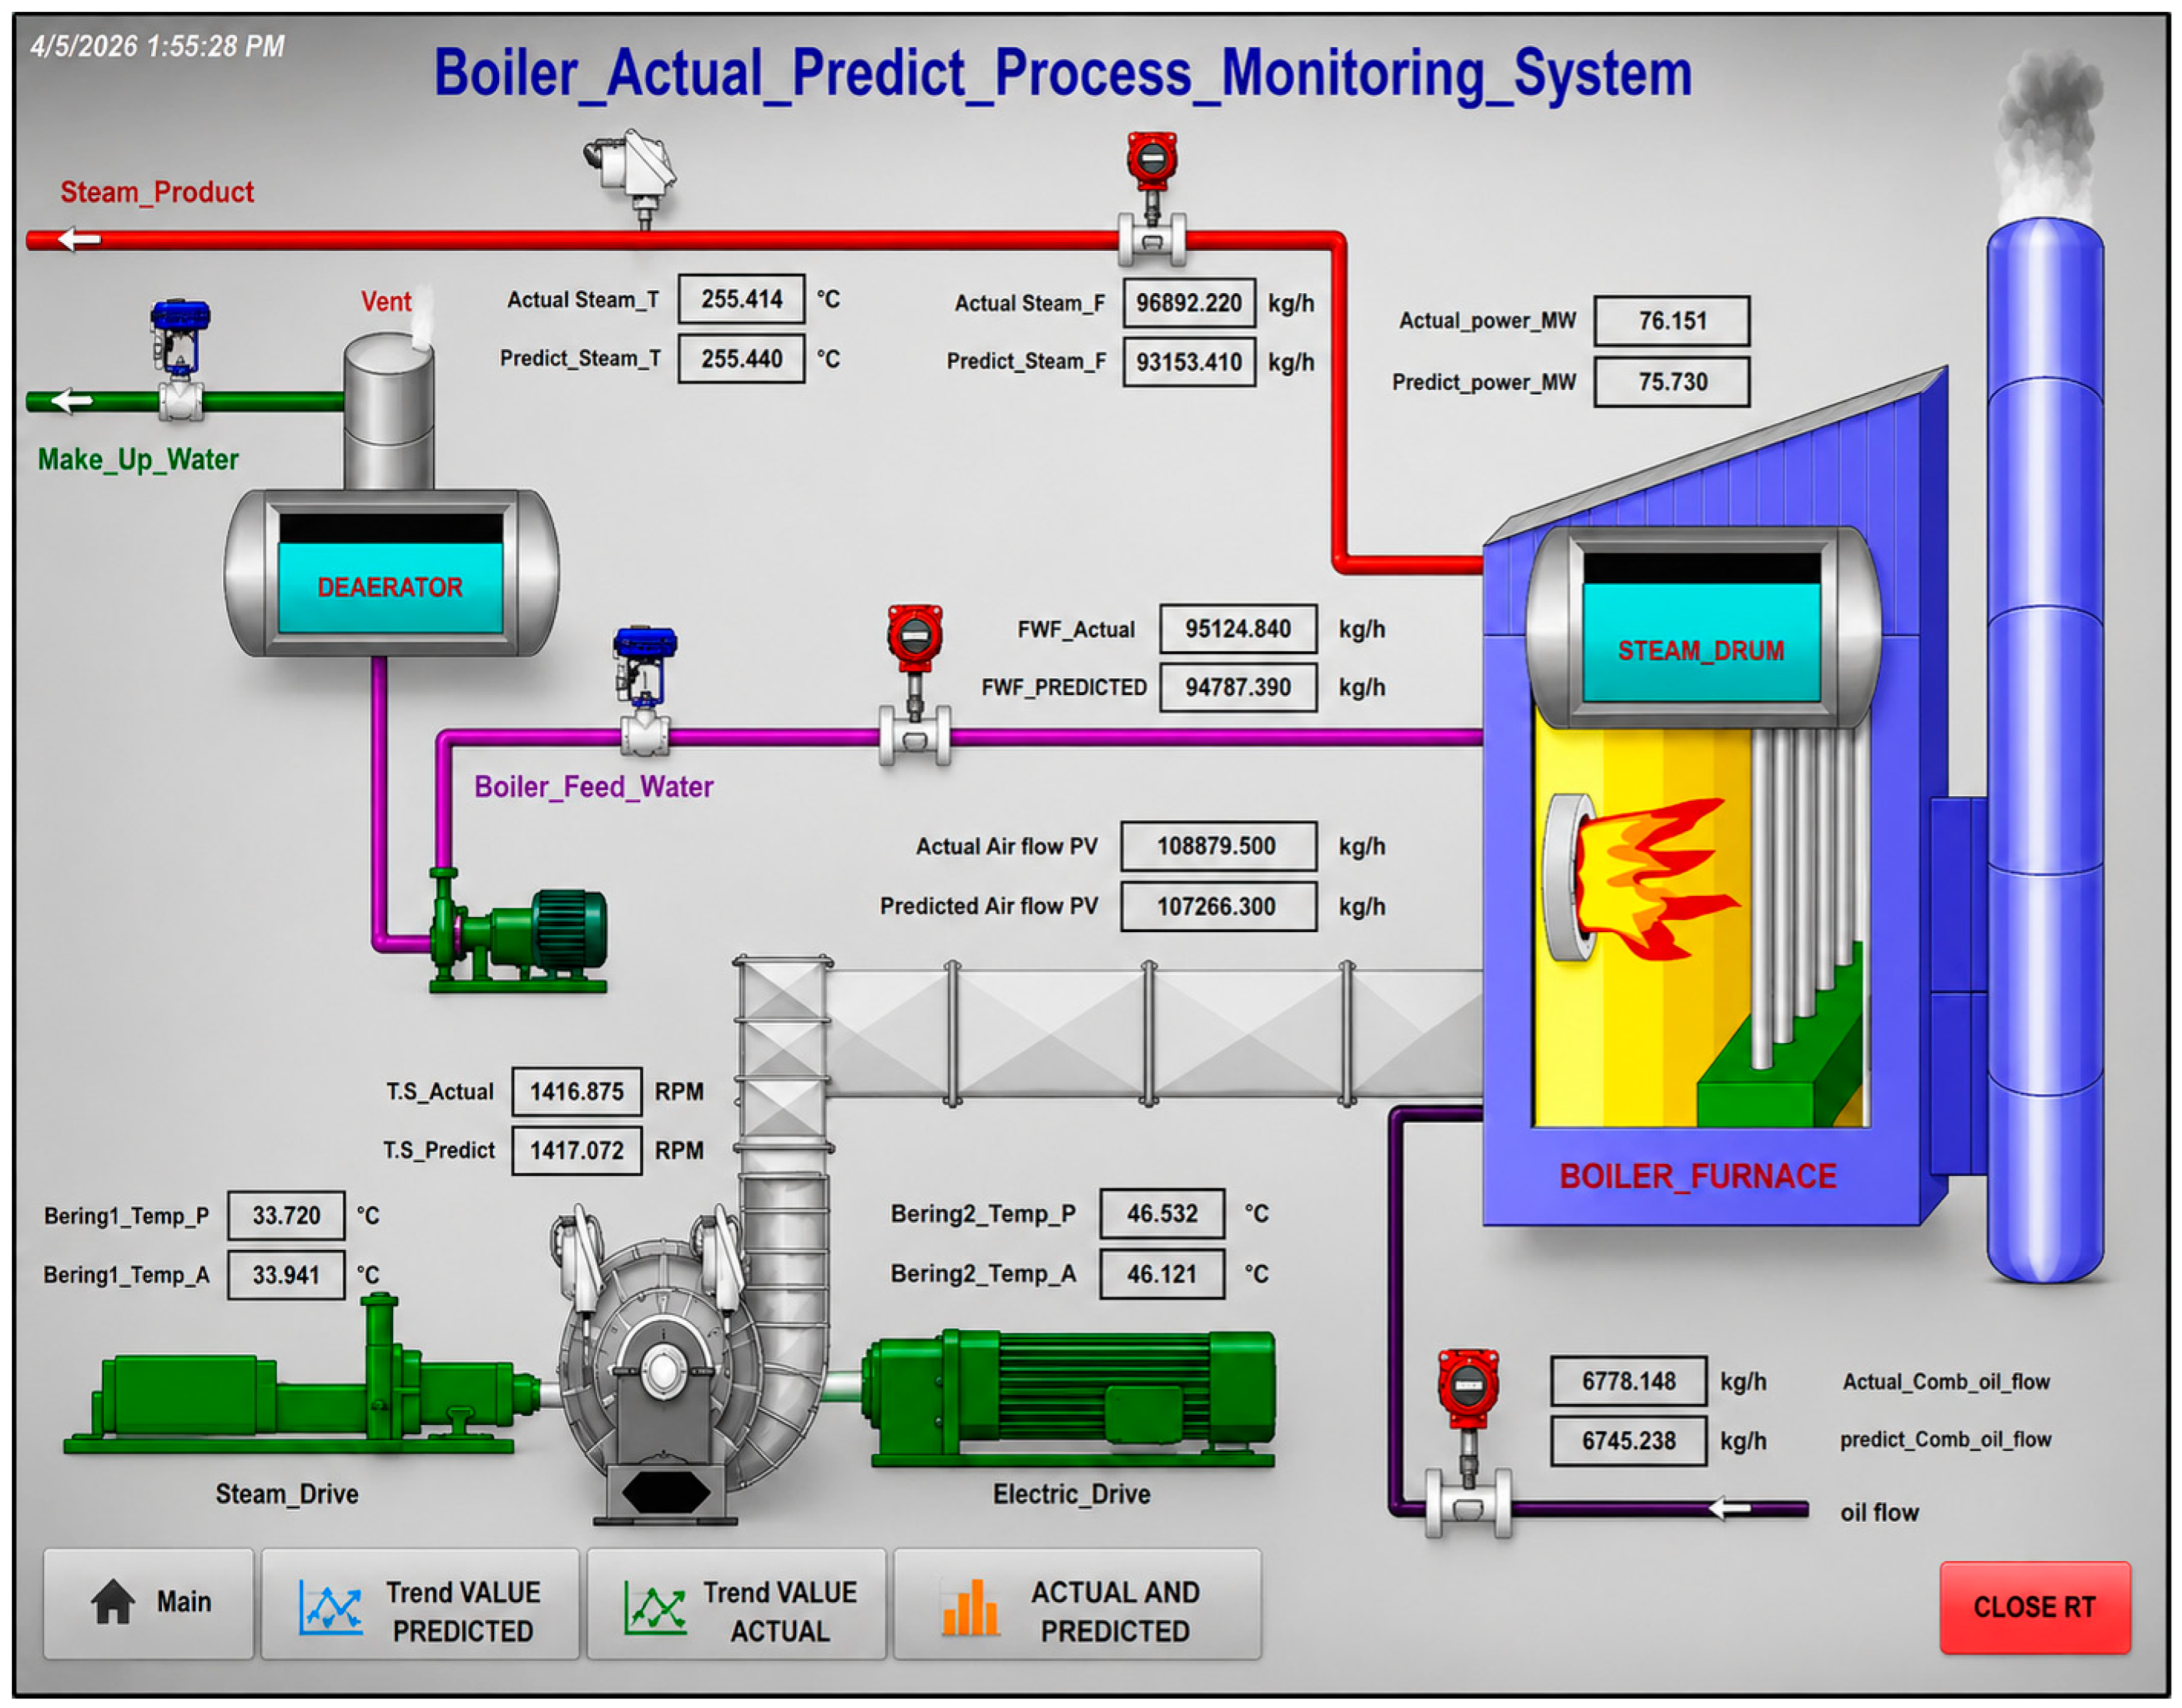
This framework was deployed and validated in a Hardware-in-the-Loop (HiL) environment (Section 3.4), using an experimental platform that emulates realistic industrial boiler operating conditions. The integrated architecture combined PLC-based control, OPC UA communication, edge analytics, and cloud monitoring, enabling real-time bidirectional data exchange across OT–IT layers. The emulated plant signals were transferred to the PLC for SCADA-based visualization, while the operational data were forwarded to the edge layer at a 1 s sampling rate for high-resolution monitoring and predictive modeling. The values predicted from the edge layer were written back into the PLC database, enabling the measured variables and the forecasted variables to be monitored holistically in SCADA (Figure 7), within a closed-loop control environment.
Figure 7.
SCADA interface showing real-time measured and predicted values with alarm indicators in OT layer.
In the edge layer, the GRU-based predictive model was executed in real-time inference mode, achieving strong agreement between actual and predicted values. The deviations were below 1%, as illustrated in Figure A1, confirming high prediction accuracy under real-time conditions. The hybrid SPC–CUSUM monitoring system was deployed online and integrated into the dashboard for real-time anomaly visualization. The system operated with a data acquisition interval of 1 s, where all the processing tasks were completed within each cycle. The mean processing latency was about 153.36 ms per loop, approximately 15 percent of the 1 s sampling period, during which all the activities, such as data acquisition by the PLC through the OPC server, sequence setup, model inference, detection of anomalies, activation of alerts and updating of dashboard, were taken within a single cycle. This indicates that the model execution was efficient, with a reasonable margin to execute the current operation and coordinate the interaction between the OT data stream and the edge analytics layer. In terms of computational efficiency, the average CPU utilization was approximately 13%, with a peak of 21%, indicating minimal computational overhead. Overall, the results demonstrate that the system achieves low-latency, resource-efficient, and stable real-time performance suitable for continuous deployment in industrial boiler environments.
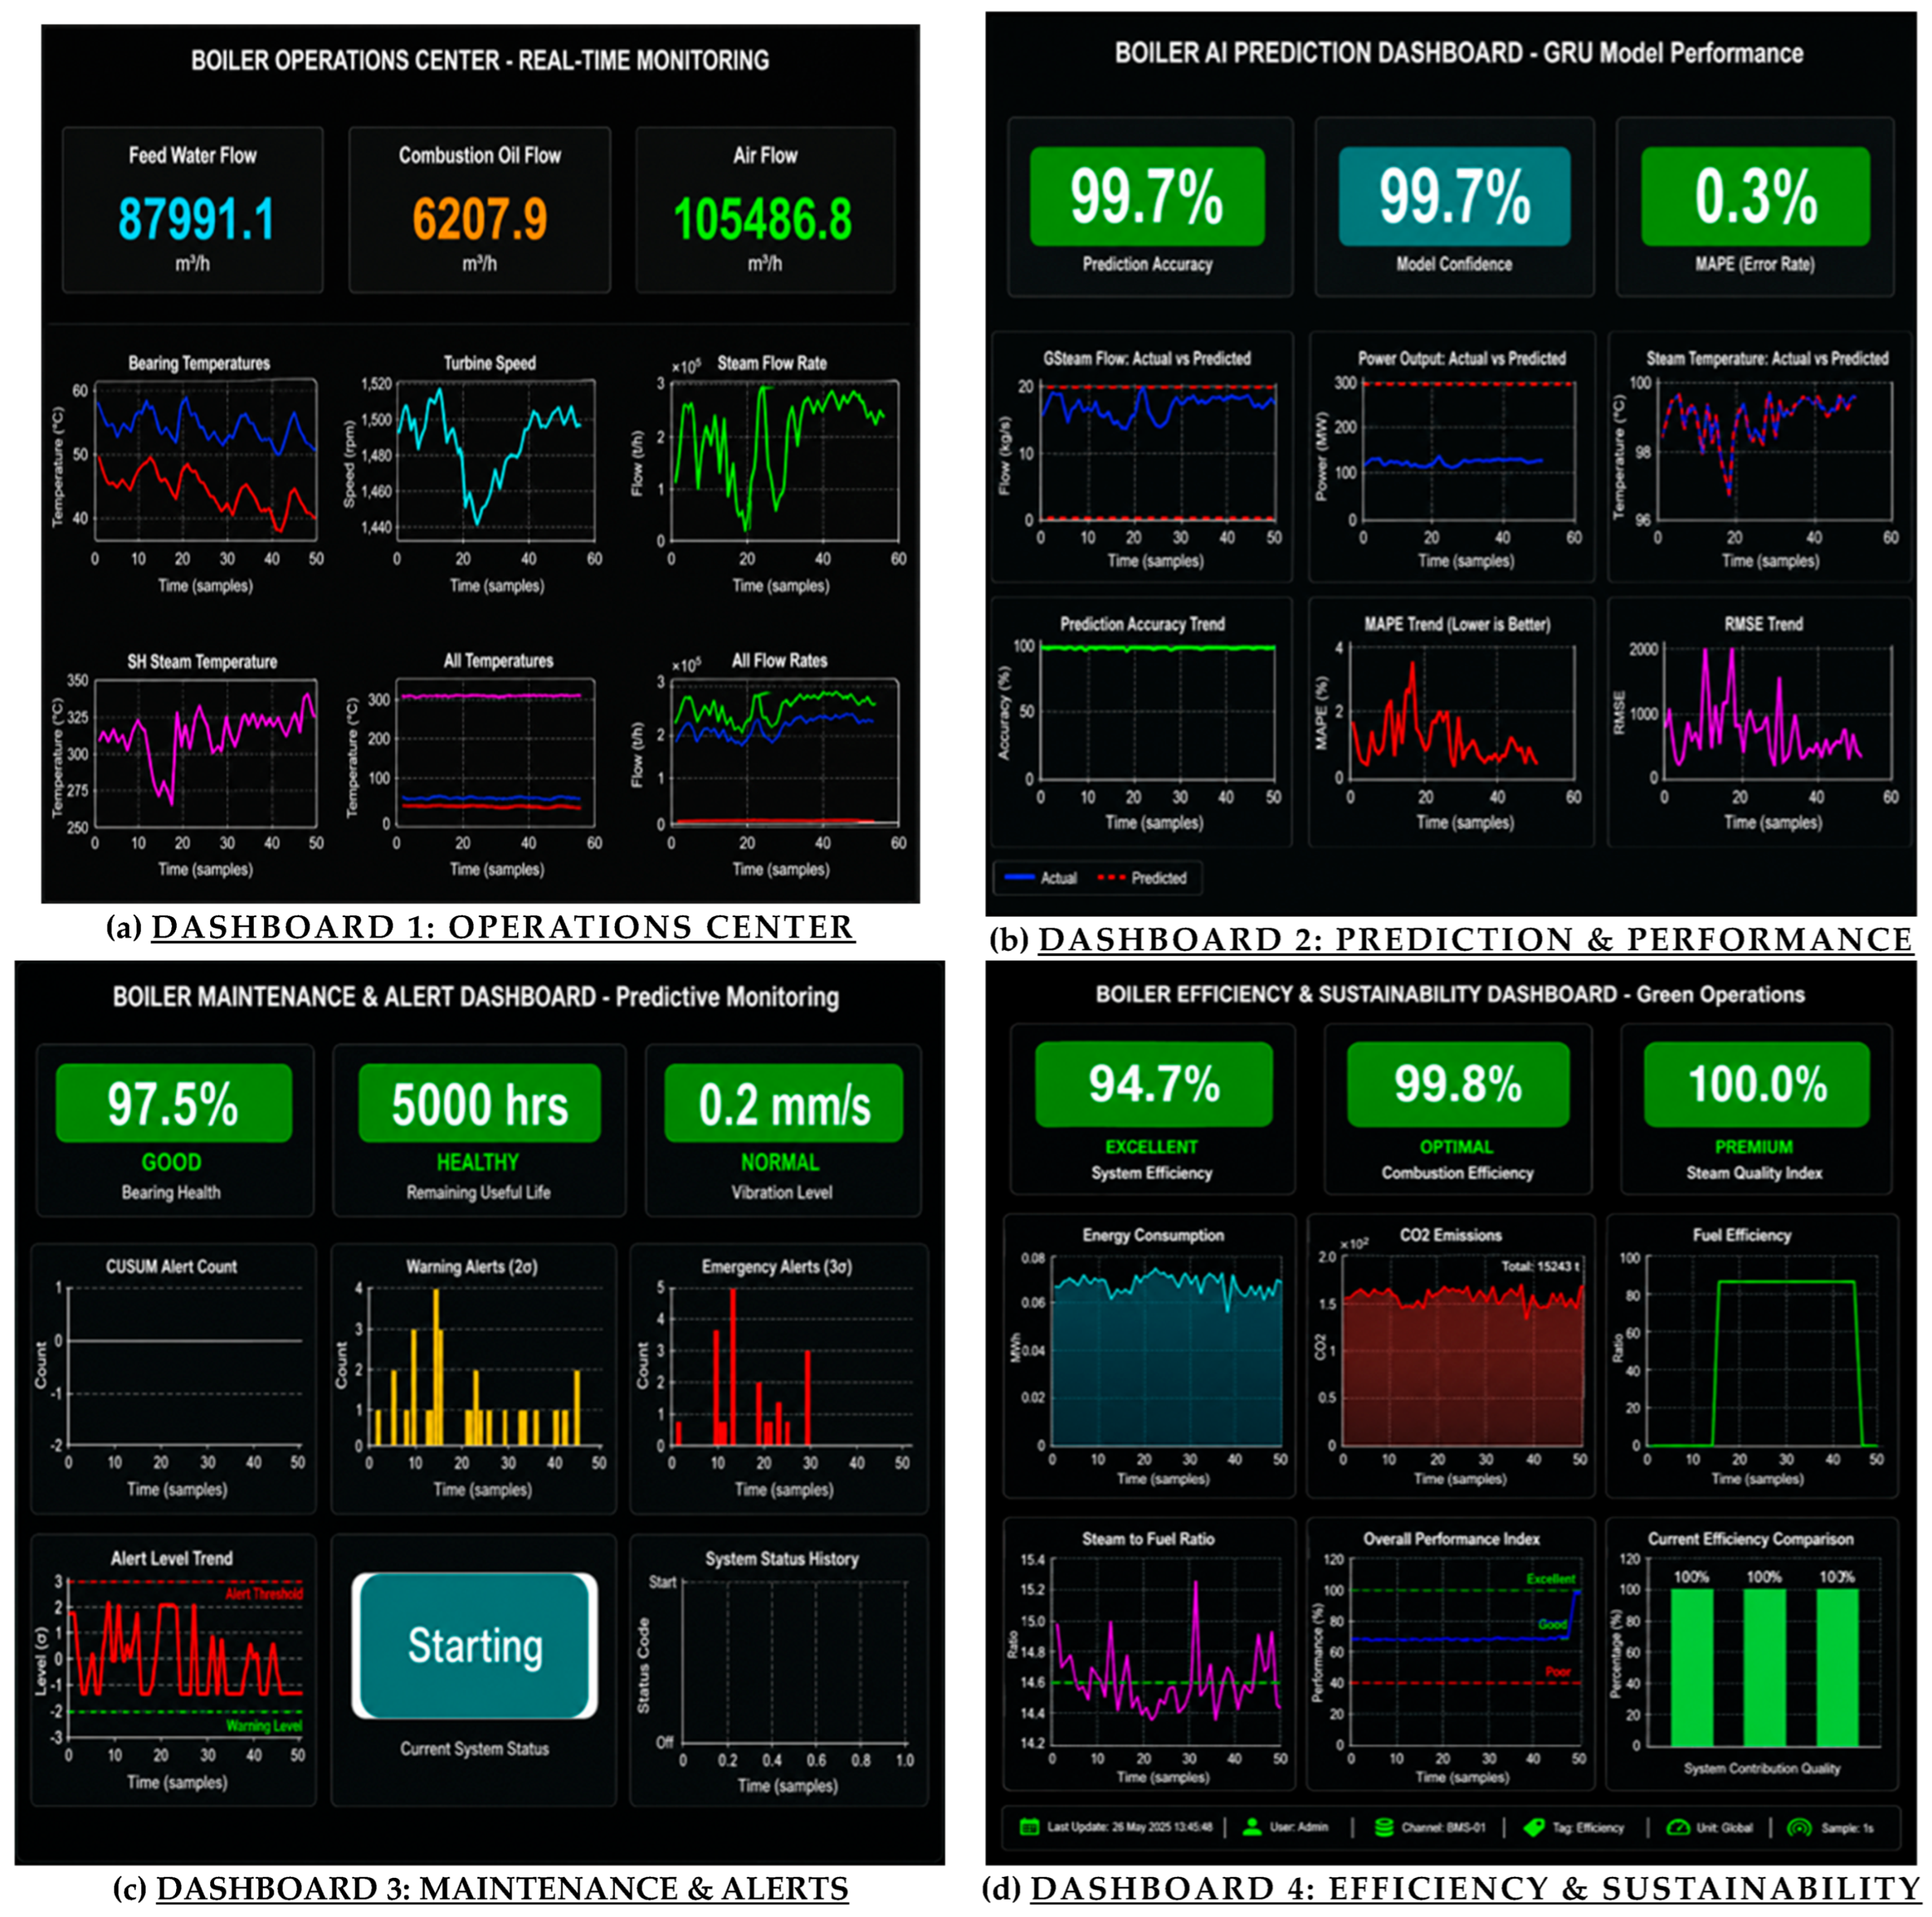
Besides the real-time OT–edge interaction, the system also provides cloud integration with higher-level monitoring and analysis. The data processed in the edge layer were transmitted to the ThingSpeak cloud platform at a 60 s update interval, optimizing communication efficiency while preserving essential system information. The cloud dashboards, as shown in Figure A2 in Appendix B, provide visualization of operational data, prediction performance, and maintenance indicators, enabling remote monitoring and long-term performance evaluation.
Thus, these results confirm the capability of the proposed framework (at the system level) to connect offline model development and online deployment in an industrial context. The HiL methodology setup enables safe and realistic validation, where the data flow remains consistent, the predictions are accurate, and anomaly detection is reliable. The combination of OT systems, edge intelligence, and cloud services creates a scalable, deployment-focused predictive maintenance architecture. This architecture is well aligned to the functional features for many legacy industrial applications transitioning to digital technologies. This architecture simplifies and defines an incremental approach towards deploying Industry 4.0 in oil refineries.
Table 8 summarizes the system’s operational value, indicating its potential use by control room operators, maintenance engineers, and management teams, among other organizational positions.
Table 8.
Operational value of the proposed system across organizational roles.
5. Conclusions
This paper has introduced an IIoT-based predictive monitoring system for industrial steam boilers, incorporating deep learning models, statistical monitoring, and a layered OT–IT deployment architecture. The proposed solution allows proper forecasting of multivariate process variables, and it facilitates good anomaly detection in real-time working conditions.
The GRU and LSTM Bayesian models developed showed high predictive behavior, with the GRU model showing better results, having an average R2 of 0.8956 and an average MAPE of 0.6345, compared to the LSTM model (R2 of 0.8240 and MAPE 0.79). These findings support the enhanced generalizability and stability of the GRU model in industrial operating conditions.
The combination of the SPC and CUSUM methods also improved the monitoring capability by facilitating the early identification of sudden faults and gradual deterioration, and ensuring stability in operation when deployed to the edge in real time. Moreover, the GRU-based alert system minimized the number of unnecessary alerts (up to 46 percent) by enhancing the reliability of operations and reducing alarm fatigue.
One of the main contributions of this work is the adoption of the Hardware-in-the-Loop (HiL) validation environment that can close the gap between the development of an offline model and the actual deployment of the system into industry.
The proposed system seamlessly integrates PLC-based control, OPC UA communication, edge-level analytics, and cloud monitoring, achieving real-time operation with a 1 s sampling interval, an average latency of 153.36 ms (≈15%), and low CPU utilization (13% average, 21% peak), while enabling real-time dashboard visualization at the edge and supporting remote monitoring through cloud updates at 60 s intervals.
The validation results demonstrate the applicability of the proposed framework for industrial boiler systems and support its feasibility for predictive maintenance and digital transformation of industrial legacy systems. The framework improves operational monitoring by reducing generated alerts, enhancing system availability, and providing actionable operational insights through real-time monitoring.
The proposed framework was validated using one year of real refinery boiler operational data, together with OPC UA-based Hardware-in-the-Loop (HiL) testing. The developed GRU and LSTM predictive frameworks were comparatively evaluated for one-hour-ahead multivariate forecasting of industrial process variables, while the SPC and the CUSUM were applied for residual-based anomaly detection and early operational monitoring. Although the framework is primarily intended for early predictive monitoring of abnormal operational behavior rather than catastrophic failure prediction, the dataset included abnormal refinery operational trends, including FD fan behavioral deviations later confirmed through maintenance inspection.
Overall, the findings provide a practical pathway toward Industry 4.0 readiness for oil refinery boiler systems through intelligent data-driven monitoring and IIoT-enabled industrial automation technologies.
Author Contributions
Author Contributions: Conceptualization, A.S.H.; methodology, A.S.H. and S.A.-Z.; software, A.S.H.; hardware, A.S.H.; validation, A.S.H. and S.A.-Z.; formal analysis, A.S.H. and S.A.-Z.; investigation, A.S.H.; data collection, A.S.H.; writing—original draft preparation, A.S.H.; writing—review and editing, M.F.M. and S.A.-Z.; supervision, M.F.M. and S.A.-Z. All authors have read and agreed to the published version of the manuscript.
Funding
This research received no external funding.
Data Availability Statement
The data presented in this study are not publicly available due to industrial confidentiality and institutional restrictions associated with the participating refinery. The hardware and software components used in the proposed framework are commercially available; however, the industrial operational dataset cannot be shared because it contains proprietary process information. Reasonable requests for additional methodological details may be considered by the corresponding author, subject to the approval of the data owner.
Acknowledgments
The authors would like to express their sincere appreciation to the engineers and operational staff involved in the boiler system, instrumentation, and control department for their support in data collection, system integration, and experimental validation. Their expertise and collaboration were instrumental in the successful completion of this work.
Conflicts of Interest
The authors declare no conflict of interest.
Nomenclature
Nomenclature and Abbreviations Used in the Proposed Framework
| Symbol/Abbreviation | Description |
| SPC | Statistical Process Control |
| CUSUM | Cumulative Sum Control Chart |
| GRU | Gated Recurrent Unit |
| LSTM | Long Short-Term Memory |
| IIoT | Industrial Internet of Things |
| OPC UA | Open Platform Communications Unified Architecture |
| HiL | Hardware-in-the-Loop |
| OT | Operational technology |
| IT | Information technology |
| PLC | Programmable Logic Controller |
| SCADA | Supervisory Control and Data Acquisition |
| CBM | Condition-based maintenance |
| PdM | Predictive maintenance |
| MiL | Model-in-the-Loop |
| RMSE | Root mean square error |
| MAE | Mean absolute error |
| MAPE | Mean absolute percentage error |
| Coefficient of determination | |
| Mean value of the training data | |
| Standard deviation of the training data | |
| Input sequence at time step | |
| Predicted output vector at time step | |
| Actual measured value at time step | |
| Predicted value at time step | |
| Positive Cumulative Sum statistic | |
| Negative Cumulative Sum statistic | |
| CUSUM sensitivity parameter | |
| CUSUM decision interval |
Appendix A. Baseline and Bayesian-Optimized Model Comparison and Ablation Analysis
Table A1.
Overall performance summary: Baseline vs. Bayesian optimization.
Table A2.
Per-feature prediction performance comparison (Baseline vs. Bayesian).
Table A3.
Overall performance comparison across ablation experiments (Baseline models).
Table A4.
Overall performance comparison across ablation experiments (Bayesian optimized models).
Table A5.
Key findings from ablation analysis.
Appendix B. Edge and Cloud Dashboard Implementation
Figure A1.
Edge-level dashboard for real-time predictions and alerts.
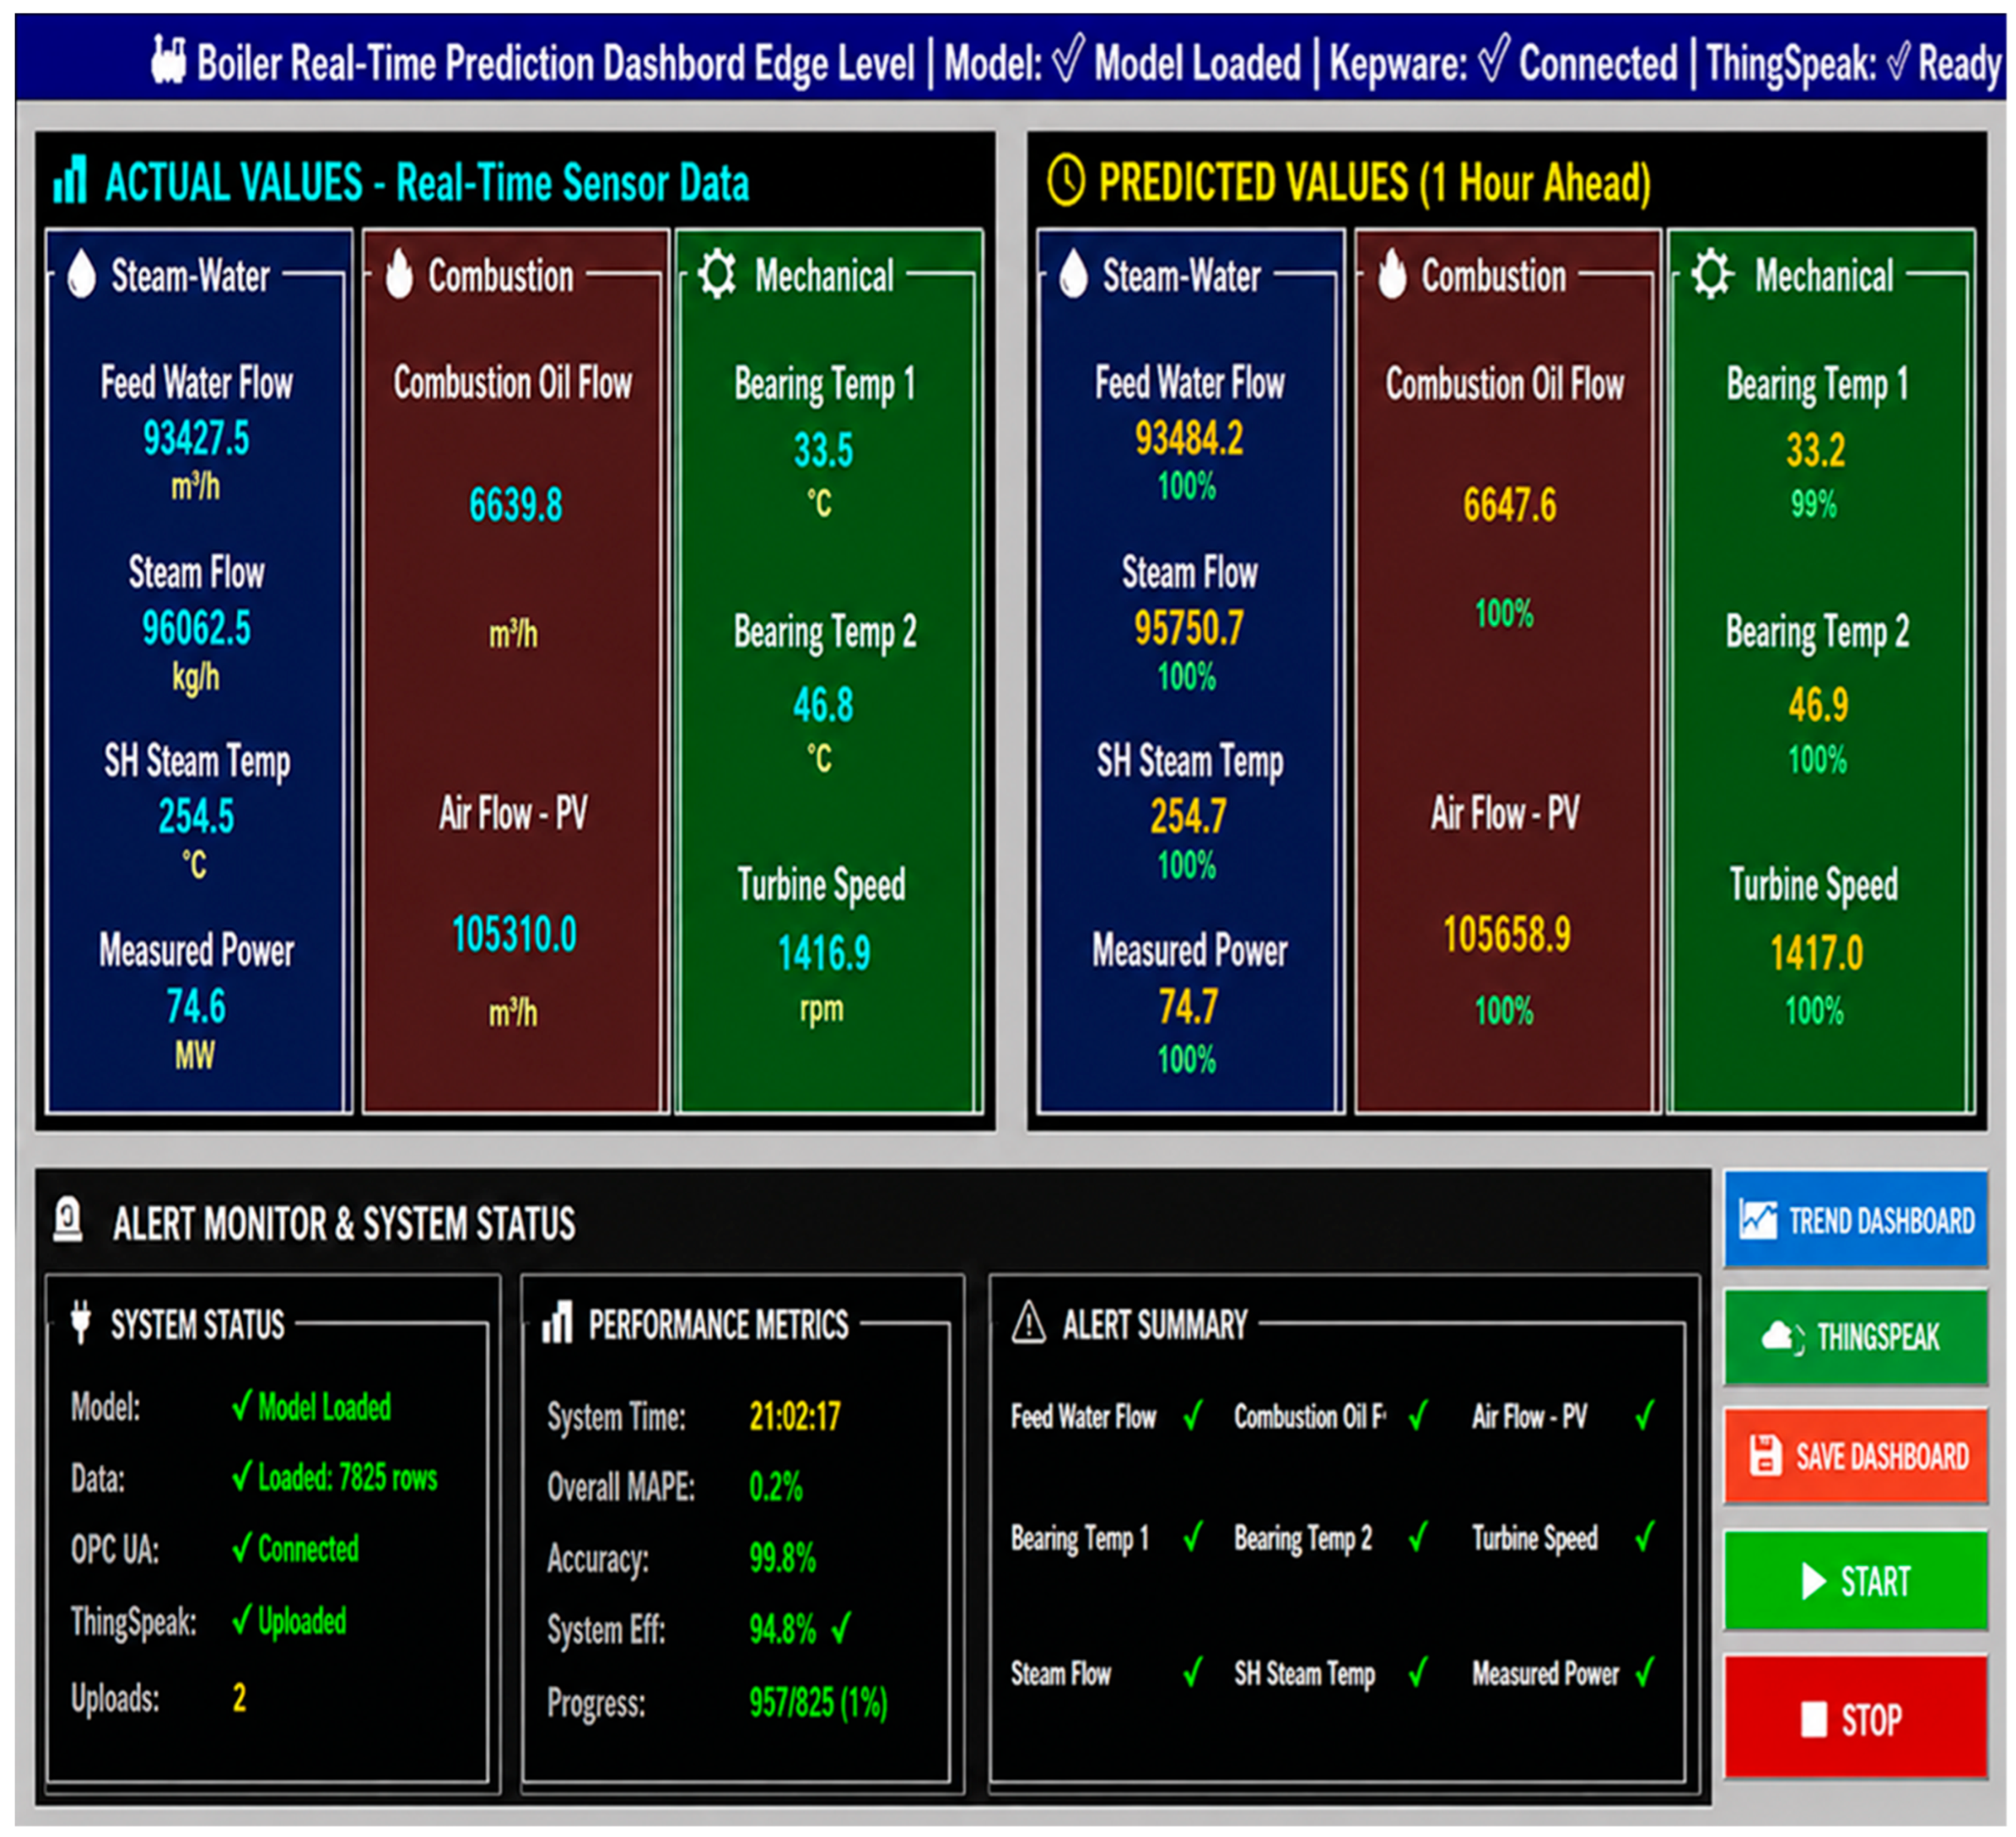
Figure A2.
ThingSpeak cloud dashboards.
References
- Karpenko, R.; Bondarenko, Y. Control of boiler equipments during starting and stopping periods and methods of optimizing these processes through the use of a decision support system with a machine vision subsystem. Technol. Audit Prod. Reserv. 2024, 6, 41–49. [Google Scholar] [CrossRef] [Scilit]
- Myshkina, L.; Elizaveta, N. Improving the Reliability of Steam Boiler House Power Supply. In Proceedings of the 2025 International Ural Conference on Electrical Power Engineering (UralCon), Magnitogorsk, Russia, 25–28 September 2025; pp. 439–443. [Google Scholar] [CrossRef] [Scilit]
- Vakkilainen, E. Steam–Water Circulation Design; Elsevier: Amsterdam, The Netherlands, 2017; pp. 87–114. [Google Scholar] [CrossRef] [Scilit]
- Ganapathy, V. Industrial Boilers and Heat Recovery Steam Generators; CRC Press: Boca Raton, FL, USA, 2002. [Google Scholar] [CrossRef] [Scilit]
- Dhamande, L.S. Condition Monitoring of Forced-Draft Fan Using Vibration Analysis: A Case Study. Eng. Proc. 2025, 93, 9. [Google Scholar] [CrossRef] [Scilit]
- Baldi, S.; Quang, T.L.; Holub, O.; Endel, P. Real-time monitoring energy efficiency and performance degradation of condensing boilers. Energy Convers. Manag. 2017, 136, 329–339. [Google Scholar] [CrossRef] [Scilit]
- Nikula, R.-P.; Ruusunen, M.; Leiviskä, K. Data-driven framework for boiler performance monitoring. Appl. Energy 2016, 183, 1374–1388. [Google Scholar] [CrossRef] [Scilit]
- Salawu, E.Y.; Akerekan, O.E.; Afolalu, S.A.; Kayode, J.F.; Ongbali, S.O.; Edun, B.M.; Airewa, I.; Awoyemi, O.O. Condition monitoring and reliability assessment, an essential tool for Boiler Plant Maintenance—A review. E3S Web Conf. 2023, 430, 01228. [Google Scholar] [CrossRef] [Scilit]
- Enemosah, A.; Chukwunweike, J. Next-Generation SCADA Architectures for Enhanced Field Automation and Real-Time Remote Control in Oil and Gas Fields. Int. J. Comput. Appl. Technol. Res. 2025, 11, 514–529. [Google Scholar] [CrossRef] [Scilit]
- Sverko, M.; Grbac, T.G.; Mikuc, M. SCADA Systems with Focus on Continuous Manufacturing and Steel Industry: A Survey on Architectures, Standards, Challenges and Industry 5.0. IEEE Access 2022, 10, 109395–109430. [Google Scholar] [CrossRef] [Scilit]
- Pratama, E.R.; Mukhammad, A.F.H. Bearing Failure Analysis on Gearbox Forced Draft Fan at LNG Plant. Indones. J. Sci. Technol. 2018, 3, 124. [Google Scholar] [CrossRef] [Scilit]
- Nurbanasari, M.; Kristyadi, T.; Purwanto, T.S.; Maulana, A.; Fadilah, R.R. Damage analysis of the forced draft fan blade in coal fired power plant. Case Stud. Eng. Fail. Anal. 2017, 8, 49–56. [Google Scholar] [CrossRef] [Scilit]
- Susetyo, J.; Parwati, C.I.; Fortuna, I.N. Analysis of Overall Equipment Effectiveness and Failure Mode of Boiler at PT. Indo Acidatama. Am. J. Eng. Res. 2023, 12, 37–42. Available online: https://www.ajer.org/papers/Vol-12-issue-2/D12023742.pdf (accessed on 1 April 2026).
- Rahmania, W.S.; Prasetya, H.E.G.; Sholihah, F.H. Maintenance Analysis of Boiler Feed Pump Turbine Using Failure Mode Effect Analysis (FMEA) Methods. In Proceedings of the 2020 International Electronics Symposium (IES), Surabaya, Indonesia; IEEE: New York, NY, USA, 2020; pp. 54–59. [Google Scholar] [CrossRef] [Scilit]
- Iwarue, J. Impact of Preventive Maintenance Practices on Productivity. Br. J. Manag. Mark. Stud. 2025, 8, 118–137. [Google Scholar] [CrossRef] [Scilit]
- Iskandar, N.; Febriyanto, K.; Aziz, A.; Sulardjaka. Identifying Unbalance in Forced Draft Fan Using Vibration Measurement Methods. Int. Res. J. Innov. Eng. Technol. 2024, 8, 1–5. [Google Scholar] [CrossRef] [Scilit]
- Xu, L.; Yuan, J. Online identification of the lower heating value of the coal entering the furnace based on the boiler-side whole process models. Fuel 2015, 161, 68–77. [Google Scholar] [CrossRef] [Scilit]
- Strušnik, D.; Golob, M.; Avsec, J. Artificial neural networking model for the prediction of high efficiency boiler steam generation and distribution. Simul. Model. Pract. Theory 2015, 57, 58–70. [Google Scholar] [CrossRef] [Scilit]
- Xie, T.; Zhang, Q.; Chen, H.; He, N.; Zhang, H.; Zhu, H. Automatic monitoring of induced draft fans of coal-fired units based on a PCLA model. Meas. Sci. Technol. 2025, 36, 106213. [Google Scholar] [CrossRef] [Scilit]
- Stepanić, P.; Dučić, N.; Vidaković, J.; Baralić, J.; Popović, M. Implementation and Evaluation of Machine Learning Algorithms in Ball Bearing Fault Detection. Meas. Sci. Rev. 2025, 25, 22–29. [Google Scholar] [CrossRef] [Scilit]
- Solichin, M.; Hendrowati, W.; Yuniarto, M.N.; Yoojeong, N.; Kim, N.H.; Guntur, H.L.; Prayoga, E.Y.; Alhadi, K.H. Remaining Useful Life Prediction on Rolling Bearing Using Optimum Feature Extraction Integrated to Transformer Network. In Proceedings of the 7th International Symposium on Computer, Consumer and Control (IS3C), Taichung, Taiwan, 27–30 June 2025. [Google Scholar] [CrossRef] [Scilit]
- Ali, A.R.; Kamal, H. Enhanced Rotating Machinery Fault Diagnosis Using Hybrid RBSO–MRFO Adaptive Transformer-LSTM for Binary and Multi-Class Classification. Machines 2026, 14, 208. [Google Scholar] [CrossRef] [Scilit]
- Bardhan, A.; Kardani, N. An Efficient Meta-Ensemble Paradigm for Modelling Poisson’s Ratio and Maximum Horizontal Stress in Casing Collapse Hazard. Bull. Comput. Intell. 2026, 2, 146–163. [Google Scholar] [CrossRef] [Scilit]
- Peach, N.; Basseville, M.; Nikiforov, I.V. Detection of Abrupt Changes: Theory and Applications. J. R. Stat. Soc. Ser. A Stat. Soc. 1995, 158, 185. [Google Scholar] [CrossRef] [Scilit]
- Montgomery, D.C. Statistical Quality Control, 7th ed.; Wiley: Hoboken, NJ, USA, 2012. [Google Scholar]
- Li, T.; Jiang, W.; Sang, J. A multi-window CUSUM method with adaptive threshold and variable-length window for non-intrusive load monitoring. Meas. Sci. Technol. 2025, 36, 046108. [Google Scholar] [CrossRef] [Scilit]
- Ding, F.; Zhao, Y.; Li, Z.; Tang, H.; Liu, Y.; Guo, D. Adaptive Dynamic Thresholds for Unsupervised Joint Anomaly Detection and Trend Prediction. Sensors 2025, 26, 257. [Google Scholar] [CrossRef] [Scilit] [PubMed]
- Wang, T.; Lu, G.-L.; Liu, J.; Yan, P. Adaptive Change Detection for Long-Term Machinery Monitoring Using Incremental Sliding-Window. Chin. J. Mech. Eng. 2017, 30, 1338–1346. [Google Scholar] [CrossRef] [Scilit]
- Wang, F.; Jiang, Y.; Zhang, R.; Wei, A.; Xie, J.; Pang, X. A Survey of Deep Anomaly Detection in Multivariate Time Series: Taxonomy, Applications, and Directions. Sensors 2025, 25, 190. [Google Scholar] [CrossRef] [Scilit] [PubMed]
- Lee, J.; Bagheri, B.; Kao, H.-A. A Cyber-Physical Systems architecture for Industry 4.0-based manufacturing systems. Manuf. Lett. 2015, 3, 18–23. [Google Scholar] [CrossRef] [Scilit]
- Mourtzis, D.; Vlachou, E.; Milas, N. Industrial Big Data as a Result of IoT Adoption in Manufacturing. Procedia CIRP 2016, 55, 290–295. [Google Scholar] [CrossRef] [Scilit]
- Zeb, A.; Linnosmaa, J.; Seppi, M.; Saarela, O. Developing deep learning surrogate models for digital twins in mineral processing—A case study on data-driven multivariate multistep forecasting. Miner. Eng. 2024, 216, 108867. [Google Scholar] [CrossRef] [Scilit]
- Liu, B.; Liu, W.; Xing, K.; Zhang, H.; Han, F.; An, K. Research on stress monitoring technology for pressure bearing components of power plant boilers based on digital twin platform. In Proceedings of the 6th International Conference on Structural Health Monitoring and Integrity Management, Zhengzhou, China, 8–10 November 2025. [Google Scholar] [CrossRef] [Scilit] [PubMed]
- Bennebach, M.; Khaled, I.; Iwaniack, J. A digital twin to optimize monitoring and maintenance of pressure vessels. Procedia Struct. Integr. 2026, 80, 136–145. [Google Scholar] [CrossRef] [Scilit]
- Lee, C.; Nguyen, N.-D.; Lee, D.; Lee, Y.I. Evaluation of Hardware-in-the-Loop-based Converter/Inverter Digital Twins for Microgrids Using the OPC Unified Architecture Platform. In Proceedings of the 2024 24th International Conference on Control, Automation and Systems (ICCAS), Jeju, Republic of Korea, 29 October–1 November 2024; pp. 360–364. [Google Scholar] [CrossRef] [Scilit]
- Bauer, H.; Höppner, S.; Iatrou, C.; Charania, Z.; Hartmann, S.; Rehman, S.U.; Dixius, A.; Ellguth, G.; Walter, D.; Uhlig, J.; et al. Hardware Implementation of an OPC UA Server for Industrial Field Devices. IEEE Trans. Very Large Scale Integr. VLSI Syst. 2021, 29, 1998–2002. [Google Scholar] [CrossRef] [Scilit]
- Ahmed, A.; Comert, M.; Ahmed, H. A Hardware-in-the-Loop Framework for Remote Monitoring of Safety Critical Systems. In Proceedings of the 14th International Conference on the Internet of Things, Oulu, Finland; ACM: New York, NY, USA, 2024; pp. 279–284. [Google Scholar] [CrossRef] [Scilit]
- Nissimagoudar, P.C.; Mane, V.; Iyer, N.C. Hardware-in-the-loop (HIL) Simulation Technique for an Automotive Electronics Course. Procedia Comput. Sci. 2020, 172, 1047–1052. [Google Scholar] [CrossRef] [Scilit]
- Mihalič, F.; Truntič, M.; Hren, A. Hardware-in-the-Loop Simulations: A Historical Overview of Engineering Challenges. Electronics 2022, 11, 2462. [Google Scholar] [CrossRef] [Scilit]
- Oks, S.J.; Jalowski, M.; Lechner, M.; Mirschberger, S.; Merklein, M.; Vogel-Heuser, B.; Möslein, K.M. Cyber-Physical Systems in the Context of Industry 4.0: A Review, Categorization and Outlook. Inf. Syst. Front. 2024, 26, 1731–1772. [Google Scholar] [CrossRef] [Scilit]
- Mateus, B.C.; Mendes, M.; Farinha, J.T.; Martins, A. Hybrid Deep Learning for Predictive Maintenance: LSTM, GRU, CNN, and Dense Models Applied to Transformer Failure Forecasting. Energies 2025, 18, 5634. [Google Scholar] [CrossRef] [Scilit]
- Zhao, J.; Wang, W.; Sheng, C. Industrial Time Series Prediction. In Data-Driven Prediction for Industrial Processes and Their Applications; Zhao, J., Wang, W., Sheng, C., Eds.; Springer International Publishing: Cham, Switzerland, 2018; pp. 53–119. [Google Scholar] [CrossRef] [Scilit]
- Liu, P.; Wu, B.; Hu, Y.; Li, N.; Dai, T.; Bao, J.; Xia, S.T. TimeBridge: Non-Stationarity Matters for Long-term Time Series Forecasting. arXiv 2025, arXiv:2410.04442. [Google Scholar] [CrossRef] [Scilit]
- Vignesh, A.; Vijayalakshmi, N. Enhanced time series forecasting using hybrid ARIMA and machine learning models. Indones. J. Electr. Eng. Comput. Sci. 2025, 38, 1970. [Google Scholar] [CrossRef] [Scilit]
- Kontopoulou, V.I.; Panagopoulos, A.D.; Kakkos, I.; Matsopoulos, G.K. A Review of ARIMA vs. Machine Learning Approaches for Time Series Forecasting in Data Driven Networks. Future Internet 2023, 15, 255. [Google Scholar] [CrossRef] [Scilit]
- Yunita, A.; Pratama, M.I.; Almuzakki, M.Z.; Ramadhan, H.; Akhir, E.A.P.; Mansur, A.B.F.; Basori, A.H. Performance analysis of neural network architectures for time series forecasting: A comparative study of RNN, LSTM, GRU, and hybrid models. MethodsX 2025, 15, 103462. [Google Scholar] [CrossRef] [Scilit] [PubMed]
- Waqas, M.; Humphries, U.W. A critical review of RNN and LSTM variants in hydrological time series predictions. MethodsX 2024, 13, 102946. [Google Scholar] [CrossRef] [Scilit] [PubMed]
- El-Meehy, A.O.; El-Kharbotly, A.K.; El-Beheiry, M.M. Systematic hyperparameter analysis of GRU and LSTM across demand pattern types: A demand-characteristic-driven meta-learning framework for rapid optimization. Sci. Rep. 2025, 15, 44657. [Google Scholar] [CrossRef] [Scilit] [PubMed]
- Ahmed, Y.S.; Abubakar, A.A.; Arif, A.F.M.; Al-Badour, F.A. Advances in fault detection techniques for automated manufacturing systems in industry 4.0. Front. Mech. Eng. 2025, 11, 1564846. [Google Scholar] [CrossRef] [Scilit]
- Li, M.A.; Gautam, A. Segmented Confidence Sequences and Multi-Scale Adaptive Confidence Segments for Anomaly Detection in Nonstationary Time Series. arXiv 2025, arXiv:2508.06638. [Google Scholar] [CrossRef] [Scilit]
- Cai, L.; Huang, D.; Qin, N.; Zhang, Y.; Zhang, X. Adaptive dynamic threshold-based fault detection with a dual monitoring strategy. Comput. Chem. Eng. 2026, 212, 109695. [Google Scholar] [CrossRef] [Scilit]
- Woodall, W.H.; Faltin, F.W. Rethinking control chart design and evaluation. Qual. Eng. 2019, 31, 596–605. [Google Scholar] [CrossRef] [Scilit]
- Stoumbos, Z.G.; Reynolds, M.R. The Robustness and Performance of CUSUM Control Charts Based on the Double-Exponential and Normal Distributions. In Frontiers in Statistical Quality Control 7; Lenz, H.-J., Wilrich, P.-T., Eds.; Physica-Verlag HD: Heidelberg, Germany, 2004; pp. 79–100. [Google Scholar] [CrossRef] [Scilit]
- Mesnil, B.; Petitgas, P. Detection of changes in time-series of indicators using CUSUM control charts. Aquat. Living Resour. 2009, 22, 187–192. [Google Scholar] [CrossRef] [Scilit]
- Asteris, P.G.; Sivenas, T.; Gkantou, M.; Formisano, A.; Le, T.-T. Estimation of axial load-carrying capacity of elliptical concrete filled steel tubular columns using computational intelligence. J. Build. Eng. 2025, 112, 113738. [Google Scholar] [CrossRef] [Scilit]
- Bendriss, F.; Harichane, Z.; Skentou, A.D.; Rebouh, R.; Ghrici, A.A.; Asteris, P.G. Advanced machine learning models for estimating seismic bearing capacity of shallow strip footings considering P- and S-wave effects. Soil Dyn. Earthq. Eng. 2026, 200, 109853. [Google Scholar] [CrossRef] [Scilit]

Disclaimer/Publisher’s Note: The statements, opinions and data contained in all publications are solely those of the individual author(s) and contributor(s) and not of MDPI and/or the editor(s). MDPI and/or the editor(s) disclaim responsibility for any injury to people or property resulting from any ideas, methods, instructions or products referred to in the content. |
© 2026 by the authors. Licensee MDPI, Basel, Switzerland. This article is an open access article distributed under the terms and conditions of the Creative Commons Attribution (CC BY) license.