


Abstract
This article proposes a hybrid method for constructing composite indices in the context of decision-making through the integration of Uniform Manifold Approximation and Projection (UMAP) and the Random Forest algorithm. Unlike Principal Component Analysis (PCA) and the Analytic Hierarchy Process (AHP), the proposed method derives fully data-driven weights from nonlinear structure in the data, rather than relying on linear covariance or expert judgment. The method is an operations research model within the framework of multicriteria decision analysis, applied to the evaluation of energy performance in OECD countries using a multidimensional set of environmental, technological, and economic indicators. UMAP is used to detect hidden patterns in the data, while Random Forest is used to derive the importance of features and generate the weighting scheme; the final aggregation of standardized indicators into the index itself is linear. The results show that per capita CO2 emissions and investment in clean energy R&D consistently emerge as the two most influential indicators. Because the UMAP embedding and the resulting weights vary with the algorithm’s pseudo-random initialization, the reported weights and ranking are the mean of an ensemble of 20 independent runs rather than a single realization, together with a systematic robustness analysis of the framework’s hyperparameters, embedding dimensionality, and sample composition. A non-compensatory aggregation alternative produces an almost identical ranking (Spearman ρ = 0.987), indicating the linear aggregation step is not a fragile choice. Compared to traditional approaches based on linear assumptions or subjective judgments, the presented approach derives weights endogenously from the data structure, providing a transparent and empirically validated framework for constructing synthetic indices for decision-making in complex systems.
1. Introduction
The use of composite indices has become established as a significant tool, within the framework of OR, particularly in the context of multicriteria decision analysis, to support decision-making in highly complex systems with multiple interacting components, especially in the analysis of the energy performance of different nations. In relation to the nations classified as members of the Organisation for Economic Co-operation and Development (OECD), the factors that affect the performance of the energy system are the interplay of different factors, such as environmental, technological, and economic factors, among others, that are dynamically changing through heterogeneous policy and technology evolution paths [1,2]. The complexity associated with the measurement of performance for an energy system implies that, rather than focusing on the use of different indices, there is a need to focus on the use of aggregation methods that allow for the integration of different information while maintaining interrelations among different variables [3,4].
Generally, the traditional approaches for building composite indexes rely on linear statistical methods or expert-based methods. The most widely used method is the Principal Component Analysis (PCA) approach. The PCA approach is a variance-maximization technique commonly used for dimensionality reduction. However, the linear nature of this approach may not be appropriate for dealing with complex relationships and nonlinear dependencies, as is often the case with energy systems, as argued in Mazziotta & Pareto [5] and Tu & Wu [6]. The second widely used approach is the Analytic Hierarchy Process (AHP) approach, which relies on expert judgment for the calculation of the required weights. The major problem with this approach is that a level of subjectivity is included, as argued in Chen et al. [7] and Yang et al. [8].
However, recent studies have been more centered on the importance of flexible and data-driven methodologies for identifying hidden patterns in data sets. In this regard, nonlinear dimensionality reduction techniques have been more prominent for maintaining local and global relationships in high-dimensional data sets. In this category, the Uniform Manifold Approximation and Projection method has been more promising for identifying hidden patterns and data geometry in environmental system and energy data analysis, respectively [9,10,11,12,13]. Unlike other linear dimensionality reduction techniques, the UMAP method can identify curvilinear data sets, which are often missed in other techniques.
Simultaneously, machine learning techniques have been utilized for providing better interpretability and robustness for multidimensional analysis. Random Forest has been reported to show potential for modeling nonlinear relationships, handling issues of collinearity, and assessing feature importance for multidimensional analysis [14,15]. Its application for solving different energy-related issues has reported promising results for solving issues like characterization of renewable resources, optimization, prediction, etc. [16,17,18,19]. Most importantly, feature importance measures can be utilized for providing a data-driven approach for solving issues of feature importance, avoiding subjective approaches often followed for expert-based approaches.
Nevertheless, despite these advances, the application of nonlinear dimensionality reduction techniques and machine learning (ML) in the development and construction of composite indices is still in its infancy in the energy literature, with most studies using ML and nonlinear dimensionality reduction techniques separately, either for pattern identification or predictive modeling, without fully exploring the potential benefits that could be achieved through the combined application of these techniques. In particular, current approaches do not systematically integrate nonlinear dimensionality reduction with data-based weight estimation for synthetic index construction.
In response to this research gap, this study proposes a hybrid approach to index development, combining two approaches, namely, UMAP and Random Forest, for developing a synthetic index for measuring energy performance. This approach first uses the UMAP algorithm to extract the underlying nonlinear structure in the data and then uses a series of random forest models to estimate the contribution of each variable to this structure, thereby developing a weighting scheme. The approach has been implemented for a cross-sectional dataset of 38 OECD countries for 2022 using a range of environmental, technical, economic, and regulatory indicators commonly used in the literature to assess energy systems [20,21].
The novelty of the approach lies in its ability to incorporate nonlinear representation learning and weighting through machine learning, which makes it a powerful approach compared to traditional linear and subjective approaches. Aside from its use in energy performance evaluation, this approach also contributes to the development of composite index research in terms of its ability to create a powerful approach in analyzing complex systems with high dimensionality and nonlinearity. In this sense, the main contribution of this study lies in an OR approach, specifically within multicriteria decision analysis, that integrates nonlinear dimensionality reduction and data-based weight estimation.
This study addresses three research questions: (RQ1) Can a hybrid UMAP–Random Forest framework produce a data-driven composite energy-performance index without relying on linear assumptions or expert-elicited weights? (RQ2) How sensitive are the resulting indicator weights and country ranking to the framework’s hyperparameters, embedding dimensionality, random initialization, and sample composition? (RQ3) Does the resulting index diverge meaningfully from conventional linear and subjective weighting schemes in a way that demonstrates added value rather than only methodological novelty?
2. Literature Review
The comparative assessment of energy performance of countries has increasingly leaned towards multidimensional metrics that integrate technical, economic, environmental, and regulatory elements within one analytical framework. This approach is pursued to understand the complexity and interdependency of energy systems and help avert incomplete assessments, or erroneous interpretation of results and thus policy formulation [22,23]. Composite indices play a role in such context in gathering different information for comparison, recognizing performance profile patterns and comparing to other nations. They are more relevant in environments where plenty of information can be obtained but their heterogeneity makes it difficult to analyze directly [24,25].
Examining these indices in the context of the OECD is especially useful because it categorizes economies with sound institutions and robust regulatory environments, but there is substantial heterogeneity in terms of energy mix, emissions intensity, technological innovation and climate commitments’ ability to adapt [26,27]. The proportion of renewable energy consumption, energy intensity, per capita CO2 emissions; investment in clean energy R&D; and installed renewable capacity plus the quality of energy policies are among the key parameters used to assess progress along the path toward sustainable energy systems [28,29]. However, even so, how to measure these indicators for representativeness, comparability and robustness remains a significant dilemma.
Standard weighting techniques consist of Principal Component Analysis (PCA) and the Analytic Hierarchy Process (AHP). The former focuses on the maximization of explained variance, which has its merits for dimensionality reduction but does not ensure that the most significant factors are truly relevant from the perspective of energy policy [30,31]. The latter, by paired comparisons, includes expert judgment which also provides context to the analysis, but also subjectivity, which limits the reproducibility of findings [32,33]. These limits have led to the search for methods that do not rely on strictly linear assumptions and reduce the need for human interpretation and more carefully model the intricate interplay between variables [34,35].
More specifically, PCA-based indices assume linear covariance structures, so when indicators are highly collinear or interact nonlinearly, the resulting principal-component loadings can be counter-intuitive and are sample-dependent: adding, removing, or updating the set of countries changes the covariance matrix and therefore the weights, undermining temporal comparability. AHP-based indices depend on expert elicitation, which introduces panel-selection bias, limits reproducibility across studies, and is subject to well-documented rank-reversal problems [6]. A broader methodological literature has examined how weighting, aggregation, and robustness choices affect composite indices in general [36,37], underscoring the need for systematic sensitivity analysis of any composite-index construction method—a need this study addresses directly in Section Hyperparameter, Random-Seed, and Dimensionality Sensitivity and Section 5.1.
Nonlinear dimensionality reduction techniques have emerged as popular approaches in this regard. In this regard, it can be stated that the Uniform Manifold Approximation and Projection method is recognized as one of the most productive approaches for modeling high-dimensional data with global topology and local relationships simultaneously [11,12]. Unlike other approaches, UMAP method can identify hidden trends that cannot be seen in linear projection and can be effective for solving a problem with high complexity and cross-correlations [13]. Its application in energy studies has been highly effective for segmenting consumption patterns, detecting anomalies in smart grids, and classifying regions according to technological adaptation capacity [9,38].
More than anything, however, the use of UMAP with machine learning models, especially Random Forest, has opened new avenues for developing a synthetic index that is more representative. Pal [14] and Palmikar et al. [15] observe how, due to their ability to handle nonlinear relationships, high levels of multicollinearity, and mixed variable types, estimating the relative importance of each predictor variable is extremely robust. Other researchers, such as Du et al. [16] and Trozzi et al. [17], also indicate how, when combined with UMAP, the accuracy of the prediction carried out by a random forest model is enhanced and the weights obtained are free from any biases and are entirely data-driven in nature. Furthermore, similar approaches for wind speed prediction, renewable resource characterization, and optimization of energy grids have also been successfully implemented, as evident from studies such as those by Rezazadeh et al. [18] and Taghizadeh-Mehrjardi et al. [19]. However, such studies and research contributions have been more focused on prediction and pattern identification than developing a synthetic index. This gap emphasizes the need to develop methodological approaches that are simultaneously capable of capturing the latent structures and deriving the objective weights from the data in a unified manner.
3. Research Methods
We present a synthetic energy performance index for OECD countries by combining nonlinear dimensionality reduction with machine learning. The underlying complexity of energy systems is captured by the tool design as the underlying data cannot be captured by static approaches owing to the need to encapsulate nonlinear relationships, latent patterns, and multidimensional structures that conventional frameworks tend to ignore. We choose UMAP and Random Forest primarily due to their comparative advantages over the linear techniques (i.e., PCA) and subjective methods (i.e., AHP), which do not consistently represent the real topology of the data or adequately model the interaction between heterogeneous variables. Unlike PCA-based approaches, which are based on linearity, and AHP-based approaches, which are based on judgment, the proposed approach can handle nonlinear relationships and can derive weights in a data-driven manner, which can provide more consistency in the construction of the composite index.
3.1. Selection and Standardization of Energy Indicators
The analysis started with the identification of seven widely used indicators employed to characterize energy performance on a national scale: renewable energy share in the energy mix, energy intensity, per capita CO2 emissions from the energy sector, investment in clean energy R&D, per capita installed renewable capacity, industrial electricity tariffs, and the World Energy Trilemma Index (energy policy index). Technical, environmental, and economic variables are included based on the multidimensional framework proposed by the OECD to assess advanced energy systems. Data for the 38 OECD countries were obtained from official and internationally recognized sources, including the International Energy Agency (IEA), the World Bank, and OECD Statistics, and correspond to the year 2022, ensuring temporal consistency and comparability across countries. As shown in Table 1, seven indicators were initially considered.
Table 1.
Indicators, Data Sources, Definitions, and Units.
The World Energy Trilemma Index was subsequently excluded from the final model. Unlike the other six indicators, which are single, directly measured variables, the Trilemma Index is itself a composite indicator constructed by the World Energy Council using a fixed, expert-assigned weighting scheme across its energy security, energy equity, and environmental sustainability dimensions [39]. Retaining a pre-aggregated, subjectively weighted index alongside primary indicators within a framework designed to derive weights endogenously from the data would introduce redundancy and undermine the fully data-driven premise of the proposed method. The final analysis therefore relies on the remaining six primary indicators. For the three indicators where a lower value denotes better performance (energy intensity, per capita CO2 emissions, and industrial electricity tariffs), values were first inverted using a max-transformation , so that higher values consistently indicate better energy performance across all six indicators.
As a post hoc robustness check (Section 5.1), we correlated the proposed index against the excluded Trilemma score: Spearman ρ = 0.12 (p = 0.47, n = 38), not statistically significant. We interpret this cautiously rather than as either a success or a failure of the index: the weak correlation is consistent with the Trilemma Index capturing energy security, equity, and institutional/governance quality—a construct distinct from the technical, environmental, and economic focus of the six retained indicators—which supports treating it as a separate construct rather than as external validation criterion for the present index.
Because the indicators are measured in different units, all values were then standardized by Z-score transformation (mean zero and standard deviation one). This method allows for comparability, eradicating false dominance of variables with larger scales, and ensuring that the subsequent methods work under a numerically balanced space.
3.2. Dimensionality Reduction Using Umap
Following standardization, UMAP (Uniform Manifold Approximation and Projection) was performed to reduce the six standardized indicators into two latent components (UMAP1 and UMAP2), using the umap package (version 0.2.10.0) in R (version 4.6.1; R Foundation for Statistical Computing, Vienna, Austria) [40] with default hyperparameters (n_neighbors = 15, min_dist = 0.1, Euclidean distance metric). In contrast to PCA, which assumes that the data projects have linear dependencies, UMAP preserves the local relationships as well as the general structure of the multidimensional space. This is crucial for energy systems where interactions between variables (efficiency, emissions, innovation, regulation, etc.) often exhibit curvilinear, discontinuous, or hierarchical phenomena.
Moreover, UMAP provides stability, visual interpretability, and the ability to model highly complex spaces without requiring large volumes of data, making it a promising methodological choice for comparison studies between countries for energy. The parameters for UMAP were selected to preserve neighborhood relationships and data topology, thus providing a meaningful representation of nonlinear relationships among energy indicators.
UMAP was preferred over t-SNE and Kernel PCA for three reasons. First, t-SNE optimizes primarily the preservation of local neighborhoods and does not guarantee preservation of global structure, and it lacks a well-defined out-of-sample transformation. Second, Kernel PCA still maximizes variance in a transformed feature space, inheriting some of the interpretability limitations of linear PCA once a kernel is chosen. Third, UMAP is grounded in a topological framework that preserves both local and global structure simultaneously and has been shown to produce more stable embeddings for small-to-moderate sample sizes such as the 38 countries analyzed here.
Hyperparameter, Random-Seed, and Dimensionality Sensitivity
Because UMAP’s embedding depends on a pseudo-random initialization and on the n_neighbors and min_dist hyperparameters, we assessed the framework’s sensitivity along three axes before adopting a final result. First, a grid of 110 (n_neighbors, min_dist) configurations was evaluated; the resulting country ranking correlates with the (15, 0.1) configuration at a mean Spearman ρ of 0.67 (SD = 0.13) and with a single reproducible run at ρ = 0.73 on average. Second, holding n_neighbors = 15 and min_dist = 0.1 fixed and varying only the UMAP random seed across 20 independent runs produced a comparable dispersion (mean ρ = 0.70, SD = 0.09), indicating that random initialization contributes to ranking variability on a similar order of magnitude to the choice of hyperparameters. Third, varying the number of UMAP dimensions (2, 3, 4) produced rankings correlated with the 2-dimensional baseline at ρ = 0.82 and ρ = 0.91, respectively, and the choice between OOB-R2-based and equal weighting of the two UMAP dimensions changed the resulting indicator weights negligibly (Spearman ρ = 0.996, cosine similarity = 0.999). Given that random-seed variability alone produces non-trivial dispersion in the ranking, we adopted a seed-ensemble approach (Section Seed-Ensemble Averaging) rather than reporting a single run, so that the results reported in Section 4.2, Section 4.3 and Section 4.4 do not depend on the specific numerical realization of a single UMAP fit.
3.3. Nonlinear Modeling with Random Forest Regressor
From the two dimensions built from UMAP, two separate Random Forest Regressor models were trained—one per latent component (UMAP1 and UMAP2)—to predict each component from the six standardized indicators, using the ranger package (version 0.18.0) in R [41], with 500 trees, permutation-based variable importance, and a fixed random seed (123); remaining hyperparameters (mtry, minimum node size, splitting rule) were left at package defaults. Model fit was assessed using the out-of-bag (OOB) R2, an internal validation estimate provided by the random forest algorithm rather than a separately held-out test set. Because each tree in the forest is trained on a bootstrap sample of the data, on average ~36.8% of observations are left out of each tree’s training set (“out-of-bag”); predictions for each country are obtained by averaging only the trees that did not use it for training, providing an internal, cross-validation-like estimate of predictive performance without requiring a separate held-out test set—an important consideration given the sample size of 38 countries. The second step in this process is selecting which variables most affect the structure projected by UMAP. Random Forest was chosen for three main reasons:
- ➢
- It can grasp nonlinear relationships and interaction effects, as opposed to linear regressions.
- ➢
- Robustness to collinearity, a common situation in national energy indicators.
- ➢
- Reliable calculation of feature importances, which, as a result, enables us to extract weights irrespective of subjectivity.
We opted to apply Random Forest instead of Gradient Boosting, SVM, or neural networks on the grounds that the choice will be interpretable, accurate, and robust. More especially, the feature importance, derived by permutation, are used to derive weights that in their own right provide insight into the contribution of the indicators to the structural behavior of the energy system and, therefore, that the data represents the meaningful contribution made by each one of the indicators to that energy system structure. This choice is motivated by the need to balance the predictive ability and robustness of the model with regard to overfitting and the ability to interpret the results and derive the weights in a consistent manner, especially with the use of permutation-based feature importance [42].
3.4. Derivation of Weights Using Feature Importances
The permutation importance of the six indicators was extracted separately from each of the two Random Forest models and normalized within each model so that importances summed to one. Negative importance values—which can occur under permutation importance when a variable contributes no genuine predictive signal—were rectified to zero prior to normalization. The two OOB R2 values were used to weight the relative contribution of each latent dimension to the final index:
The final weight for each indicator j was then computed as a weighted combination of its normalized, rectified importance in each model. This ensures that the weighting approach reflects both the relative importance of each indicator within each dimension and the relative explanatory strength of each dimension, providing a more stable and representative measure of each variable’s contribution to the overall nonlinear structure. This process results in a weighting system entirely based on data and without subjective interventions, which is consistent with the current methodological trend toward the construction of nonlinear synthetic indices.
Formally, the final weight of indicator j is w_j = W1·Î_{j,1} + W2·Î_{j,2}, where Î_{j,k} is the rectified, within-model-normalized permutation importance of indicator j for UMAP dimension k (Σ_j Î_{j,k} = 1), and W1, W2 are the OOB-R2-based weights defined above.
Seed-Ensemble Averaging
Because Section Hyperparameter, Random-Seed, and Dimensionality Sensitivity shows that a single UMAP–Random Forest run is sensitive to the pseudo-random seed to a degree comparable to hyperparameter choice, the weights, OOB R2 values, and country ranking reported in Section 4.2, Section 4.3 and Section 4.4 are not taken from a single run. Instead, the full pipeline (UMAP embedding, Random Forest importance estimation, and weight derivation) was repeated for 20 independent UMAP random seeds, with n_neighbors = 15, min_dist = 0.1, and the Random Forest configuration held fixed. The mean weight for each indicator across the 20 runs, renormalized to sum to one, is reported as the final weighting scheme, together with its standard deviation across runs as a direct, empirical measure of estimation uncertainty. The final synthetic index is then computed once from these ensemble-mean weights (Section 3.5), rather than by averaging 20 separate rankings, so that the index remains a single, well-defined linear combination of the standardized indicators. This ensembling approach is standard practice for stabilizing estimates from stochastic algorithms and requires no additional modeling assumptions beyond those already used for a single run.
3.5. Construction of the Synthetic Energy Performance Index
Finally, the synthetic index was calculated as the weighted sum of the standardized indicators using the obtained ensemble-mean weights: Index_i = Σ_j w_j · Z_{ij}, where Z_{ij} is the standardized, polarity-adjusted value of indicator j for country i, and Σ_j w_j = 1. The index combines environmental, technological, and economic dimensions into a single measure. It is important to state this precisely: the derivation of the weights is nonlinear—obtained via UMAP and Random Forest, which can capture nonlinear relationships among indicators—but the final aggregation step itself is a linear, compensatory combination of the standardized indicators. As a robustness check (Section 5.1), we compared this linear index against a non-compensatory aggregation alternative that penalizes an uneven indicator profile rather than allowing full compensation between indicators; the two rankings correlate at Spearman ρ = 0.987, indicating that the choice between linear and non-compensatory aggregation has little practical effect on the results reported here, even though the two are conceptually distinct.
4. Results
We then integrated UMAP and Random Forest in order to detect structural relationships between the energy performance of OECD countries, which linear analysis in its conventional form could not show. This section outlines the process as it emerges from the data: first the internal layout of the energy space, then the weight of each indicator, and finally the construction of the resulting synthetic ranking.
4.1. Latent Structure of Energy Performance (Umap)
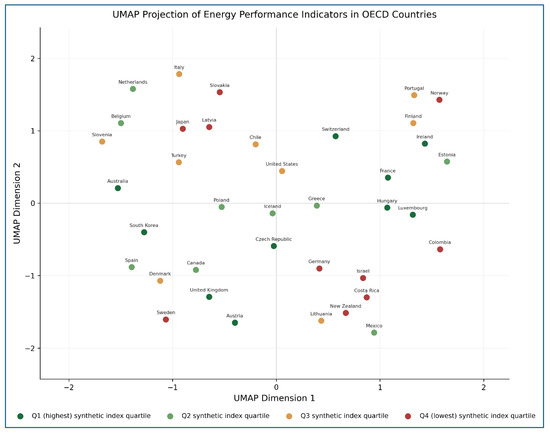
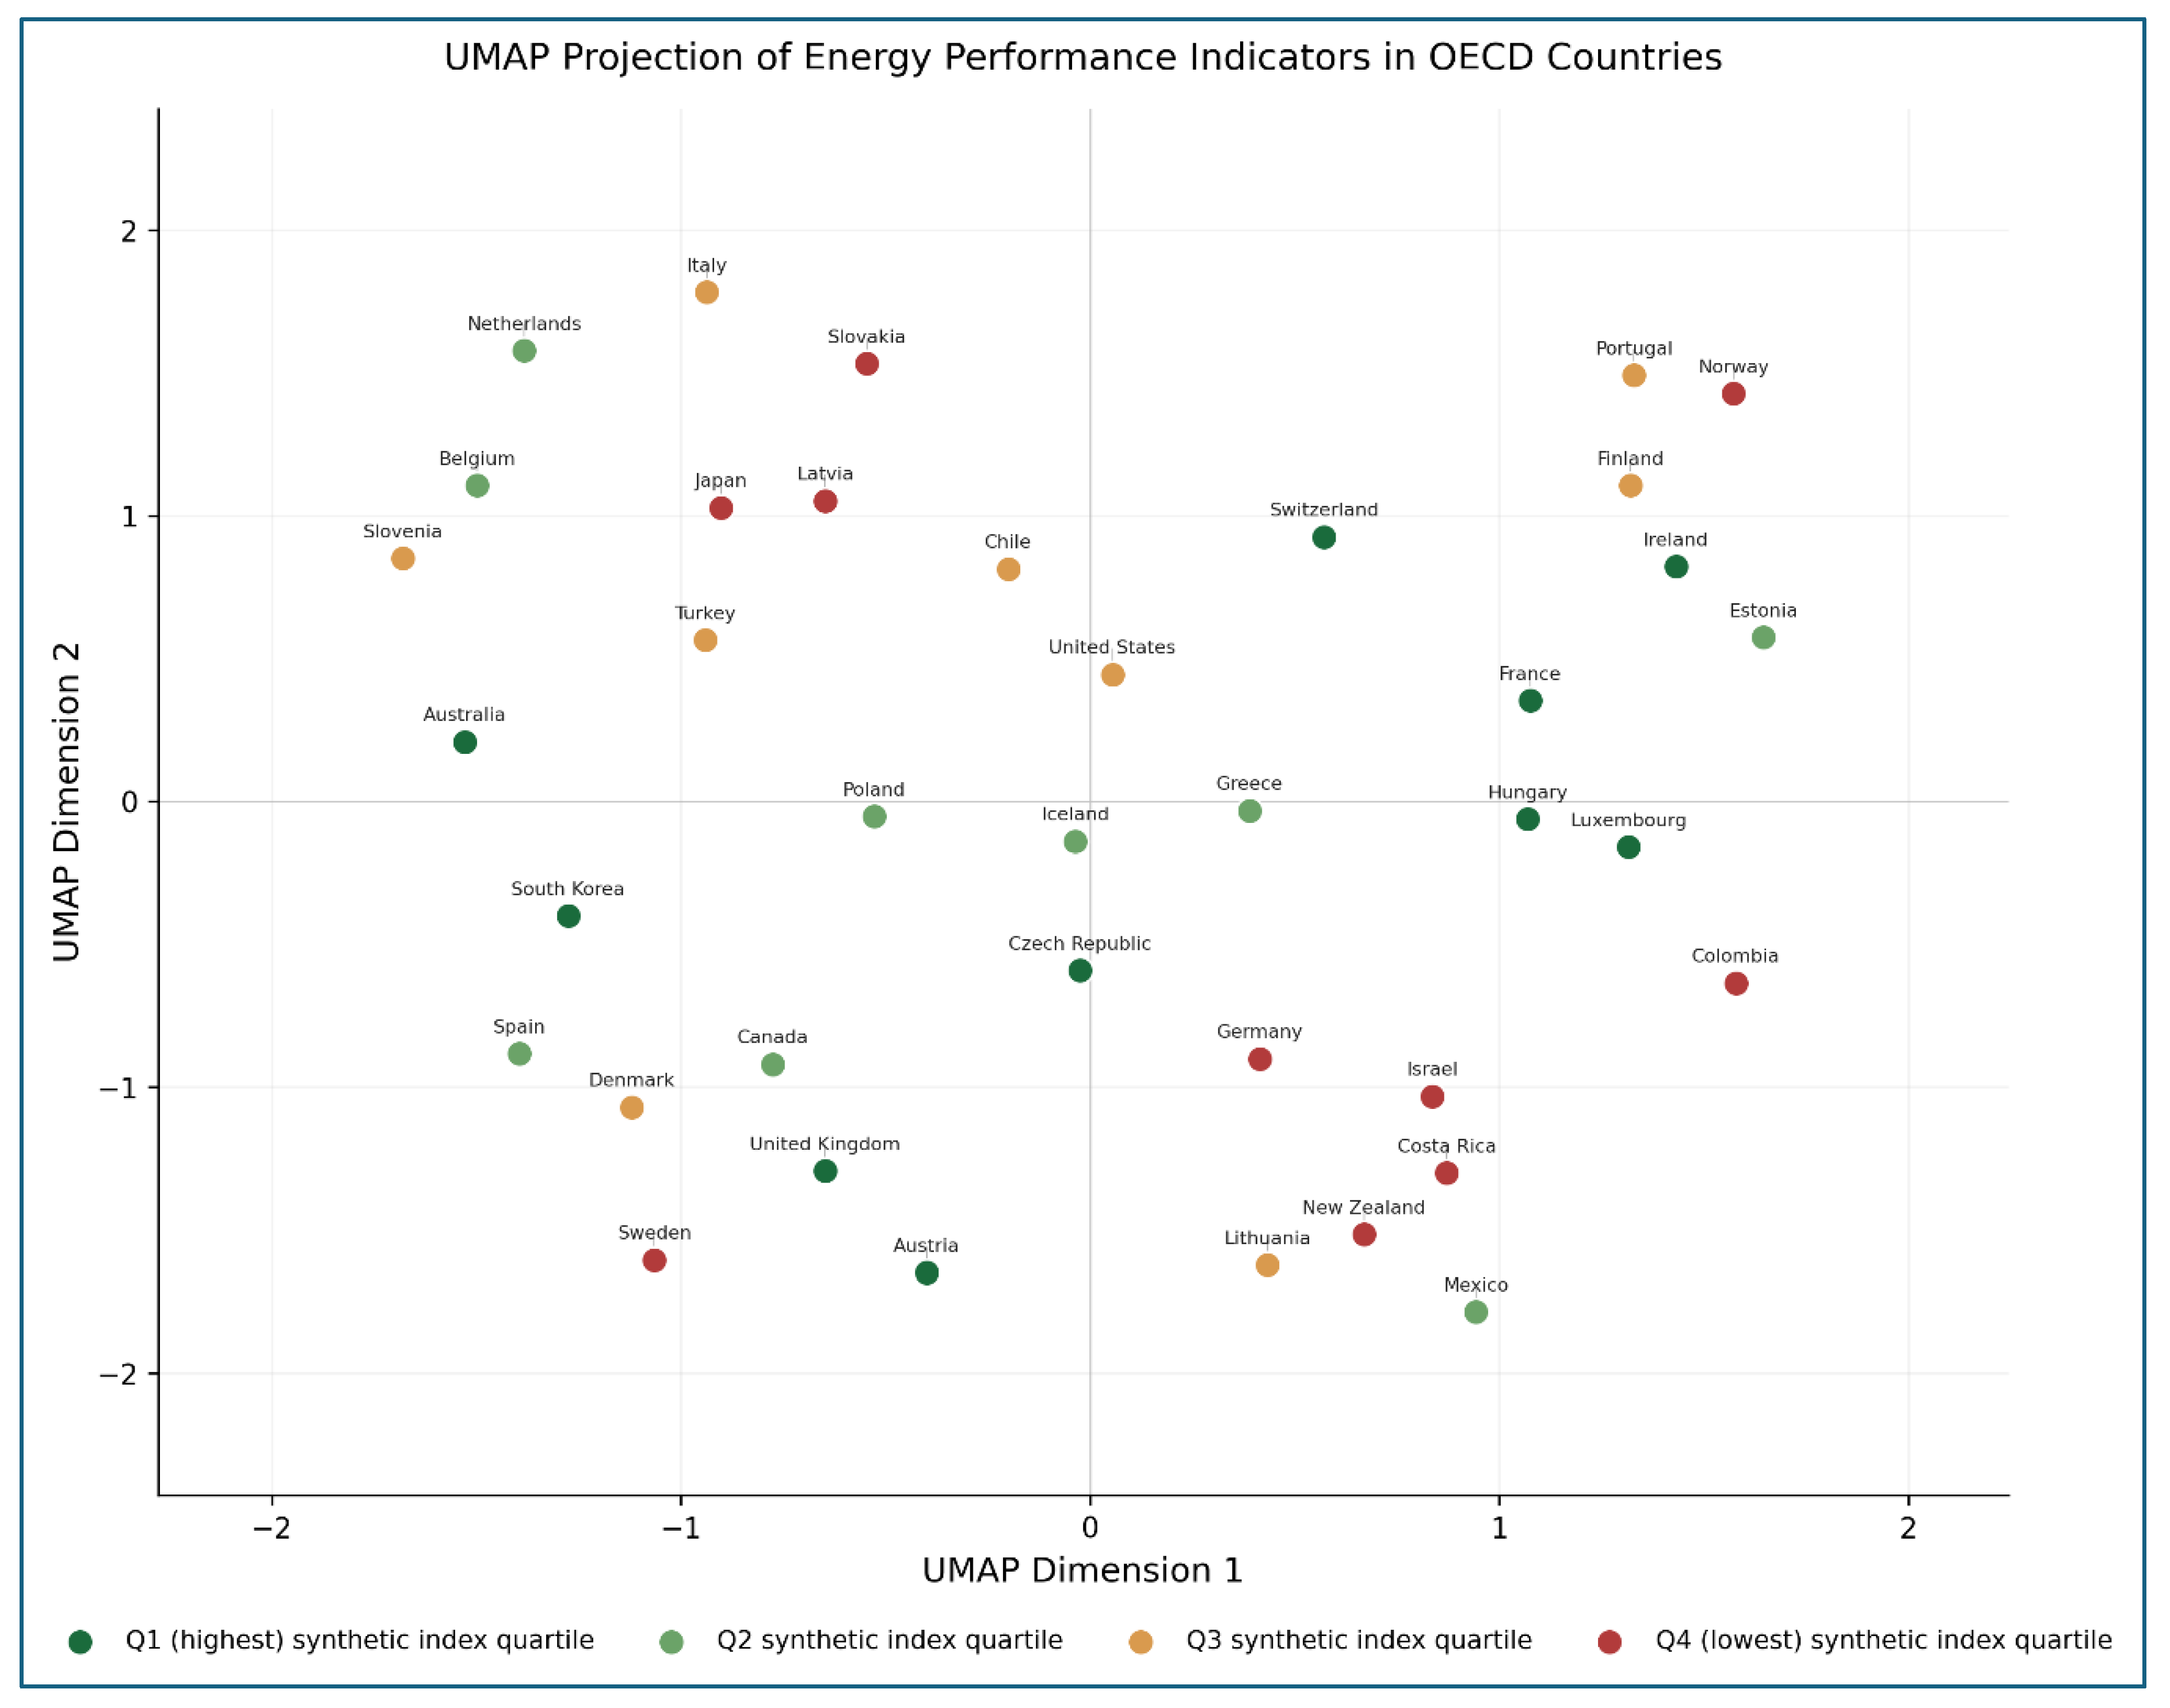
The analysis began by reducing the six energy variables to two nonlinear components called UMAP1 and UMAP2. These dimensions represent the underlying geometry of the connections between energy intensity, emissions, renewables, electricity costs, and R&D investment. Projecting the countries onto this two-dimensional space showed configurations that may suggest groupings tied to (though no formal clustering algorithm was applied to test for statistically distinct clusters) energy policy profiles, emissions intensity, and technological innovation levels. This can be seen in Figure 1.
Figure 1.
UMAP of Energy Performance in OECD Countries.
UMAP of the six standardized energy performance indicators for the 38 OECD countries analyzed. Each point represents a country positioned according to its coordinates on the two nonlinear latent dimensions (UMAP Dimension 1 and UMAP Dimension 2) extracted via Uniform Manifold Approximation and Projection (n_neighbors = 15, min_dist = 0.1, Euclidean metric, seed = 42). Proximity between points reflects similarity in the overall multidimensional structure of energy performance rather than similarity in any single indicator. Point color denotes the quartile of each country’s synthetic energy performance index (see Section 4.4) (dark green = top quartile, light green = second quartile, orange = third quartile, red = bottom quartile).
4.2. Explanatory Power and Quality of the Random Forest Models
The Random Forest models show predictive capacity in capturing the nonlinear structure identified by UMAP for both latent dimensions. The predictive performance of the two Random Forest models was assessed using the out-of-bag (OOB R2). The OOB R2 values indicate a substantial relationship between the six original standardized indicators and the nonlinear representation derived from UMAP. Model performance results are presented in Table 2.
Table 2.
Predictive Performance of the Random Forest Models.
The results show mean OOB R2 values of approximately 0.62 and 0.64 across the 20-seed ensemble (SD = 0.06 and 0.05, respectively), indicating a moderate-to-substantial relationship between the six original standardized indicators and the two UMAP dimensions. These values measure how well the six indicators reconstruct the nonlinear manifold identified by UMAP; they are an internal diagnostic for the Random Forest reconstruction step, not a measure of explanatory power for energy performance itself, nor an external validation of the resulting index or its country ranking. Section 5.1 reports additional robustness diagnostics precisely because OOB R2 alone cannot serve as evidence for those broader claims.
4.3. Importance of Energy Variables
The next step was to evaluate the relative contribution of individual variables to the energy structure. Table 3 presents the final weighting scheme, where the relative importance of each variable reflects its contribution to the latent nonlinear structure identified by UMAP. These weights reflect the contribution of each variable to the latent nonlinear structure identified by UMAP, rather than relying on simple linear correlations, providing a more realistic representation of the energy system.
Table 3.
Relative weight of each variable.
The results show an interesting trend, which is summarized as follows:
- ➢
- Per capita CO2 emissions and investment in clean energy R&D consistently receive the two highest ensemble-mean weights (0.243 and 0.220, respectively), and are also the two indicators whose relative ranking is most stable across the 20 seeds.
- ➢
- Installed renewable capacity per capita and industrial electricity tariff receive higher ensemble weights (0.187 and 0.144) than a single realization of the pipeline would suggest, indicating these two indicators’ contributions are more consistent across random initializations than their single-run values imply.
- ➢
- Energy intensity and the renewable energy share both carry lower ensemble-mean weights (0.138 and 0.069) and also the largest standard deviations relative to their means—for the renewable share, the standard deviation (0.076) is nearly as large as the mean itself (0.069), indicating this indicator’s precise contribution to the index cannot be estimated with confidence from this framework and sample size, and should not be over-interpreted.
- ➢
- Overall, the ensemble-mean ranking of indicators by weight is: CO2 emissions, R&D investment, installed renewable capacity, industrial tariff, energy intensity, and renewable energy share. Notably, the two top-ranked indicators (CO2 emissions and R&D investment) match the two top-ranked indicators in the single-run weights reported by earlier revisions of this analysis, indicating this part of the result is not an artifact of the ensembling procedure.
- ➢
- The weighting scheme is derived via a fully data-driven approach from Random Forest, so the synthetic index prioritizes indicators according to their empirically estimated, rather than assumed, contribution to the latent structure identified by UMAP. Reporting the weights as an ensemble mean with standard deviation, rather than as a single point estimate, makes this data-driven derivation auditable: readers can see not only which indicators matter most, but how confidently the framework can say so.
4.4. Building Synthetic Index and Energy Performance Ranking
Once the ensemble-mean weights were obtained, a synthetic score was calculated for each of the 38 OECD countries. This synthetic index integrates environmental, technological, and economic factors into a unified measure. The scores obtained allow each country to be placed on a continuous scale of energy performance. Table 4 shows the ranking with the ensemble-mean scores for each country. Because the underlying UMAP–Random Forest pipeline is sensitive to random initialization (Section Hyperparameter, Random-Seed, and Dimensionality Sensitivity), we also computed each country’s rank under each of the 20 individual seed runs: the typical country’s rank varies by about ±5 positions across seeds (mean SD = 4.81), but this varies sharply by country—France (rank 1) and Latvia (rank 38) are essentially unanimous across all 20 seeds (SD < 0.5), while several mid-table countries (e.g., Czech Republic, Italy, Spain) span 25–31 rank positions depending on the seed. The ensemble mean reported in Table 4 is therefore more reliable for the countries at the extremes of the ranking than for those in the middle, a distinction we return to in Section 5.
Table 4.
Country ranking.
The proposed synthetic index derives its weights nonlinearly (via UMAP and Random Forest) but aggregates them linearly (Section 3.5); a non-compensatory aggregation alternative produces an almost identical ranking (ρ = 0.987, Section 5.1). Among advanced economies, this ranking still illustrates large differences; it is a reminder to not consider the indicators as isolated measures but rather as inter-related dimensions. In brief, the constructed index integrates information from UMAP and Random Forest, so it is possible to identify not only the position of each country relative to another, but also to analyze specifically the dimensions that explain the strengths and limitations in energy across the range.
5. Discussion
5.1. Robustness Checks: Baseline Comparisons, Non-Compensatory Aggregation, and Sample-Composition Sensitivity
To assess whether the UMAP–Random Forest framework adds value beyond simpler alternatives, the ensemble-mean ranking (Section Seed-Ensemble Averaging) was compared against three conventional weighting schemes applied to the same six standardized indicators: equal weighting, PCA-based weighting (using the first principal component’s loadings), and entropy weighting. Spearman correlations with the ensemble-mean ranking were 0.86 [95% CI: 0.70, 0.95] for equal weighting, 0.81 [0.62, 0.92] for PCA weighting, and 0.93 [0.85, 0.97] for entropy weighting (bootstrap confidence intervals, 2000 resamples); all three overlap substantially and are not clearly distinguishable from one another at this sample size. The PCA correlation in particular is higher against the ensemble-mean ranking than an earlier single-run comparison suggested, indicating that part of the divergence from PCA reported in preliminary analysis reflected single-run variability rather than a stable property of the method; we report this revised, more conservative comparison rather than the more favorable single-run figure. The clearest remaining divergences from the linear benchmarks are Austria (ensemble rank 9th vs. 12th–23rd under the three benchmarks), Spain (17th vs. 27th–31st), the Czech Republic (8th vs. 7th–19th), and Norway (28th vs. 12th–18th); Top-10 overlap with the ensemble ranking is 6/10 (equal), 7/10 (PCA), and 8/10 (entropy). Taken together, these results indicate a meaningful but moderate divergence from linear alternatives—not the dramatic divergence a single, unrepeated run can suggest—which we regard as a more defensible basis for claiming added value than a single comparison would provide.
We also tested a non-compensatory aggregation alternative, following the logic of the Adjusted Mazziotta–Pareto Index [43] and the broader compensability literature [44], which penalizes countries with an uneven indicator profile rather than allowing full compensation between a strong and a weak indicator: MPI_i = M_i—S_i·(S_i/M_i), where M_i and S_i are the weighted mean and weighted standard deviation of country i’s re-based indicators. This alternative ranking correlates with the linear index at ρ = 0.987 (largest single change: Finland, rank 17 → 23), supporting the linear-aggregation choice empirically, in addition to the conceptual justification given in Section 3.5.
Finally, we tested the pipeline’s sensitivity to sample composition by repeatedly refitting the full pipeline (UMAP embedding, Random Forest, weight derivation) on random subsamples of 30 of the 38 countries (without replacement, 200 iterations, hyperparameters held fixed). The resulting country rankings, restricted to the 30 retained countries and compared against their ranking in the full sample, correlate at a mean Spearman ρ of 0.63 (SD = 0.14, 95% range: 0.37–0.87); the underlying indicator weight vectors are less stable under this metric (mean cosine similarity 0.76, but mean Spearman correlation near zero, reflecting the low statistical resolution of Spearman’s correlation on a 6-element vector rather than a genuinely different result—see Section 5 for discussion). We interpret this as a moderate, not strong, level of ranking robustness at this sample size, consistent with the RQ2 question posed in the Introduction, and report it transparently as a limitation rather than omitting it (Section 5.1).
From an OR perspective, particularly in the context of multicriteria decision analysis, the resulting findings help illustrate how differences in the energy performance of OECD countries are structured when analyzed with a data-driven, nonlinear weighting scheme. The UMAP-based representation revealed patterns that are consistent with previous work, such as the discrepancy between economies with high technological innovation and those whose energy matrix remains dependent on fossil fuels. This result is associated with the observation that, even within economies with relatively strong institutional settings, the energy transition is not moving uniformly. These findings also suggest that the proposed UMAP–Random Forest framework captures structure that would remain partially hidden under linear approaches, which we verified empirically in Section 5.1 rather than only asserting conceptually.
Furthermore, the estimation of importance through Random Forest showed that per capita CO2 emissions and R&D investment consistently receive the highest weight in the energy ecosystem represented here. This reflects each indicator’s contribution to reconstructing the latent manifold identified by UMAP, not a causal effect on energy performance; permutation importance is associational by construction. With that caveat, the results are consistent with innovation and decarbonization-related indicators being important contributors to the differences captured by this index. The hybrid approach reproduces well-documented patterns while adding a quantitative, per-indicator decomposition of each country’s score (illustrated below for three countries whose ranking is not fully explained by renewable energy share alone).
The results suggest that differences in energy performance are not due to isolated factors but rather to the different structural configurations of each system. In some cases, when there is greater penetration of low-carbon technologies and lower emission levels, countries rank higher. Countries like France stand out for their high performance, largely explained by an energy structure based on nuclear power [45,46,47].
Performance does not depend solely on the composition of the energy mix; other factors associated with technological innovation and public policy design also play a role. This is observed in economies such as Switzerland, Luxembourg, South Korea, and Ireland, where the combination of regulatory frameworks, technological investment, and the use of renewable sources is associated with more favorable positions in the index [48,49,50,51,52,53]. The interpretations offered in this paragraph and the two that follow are a post hoc reading, informed by the country-level energy-policy literature cited, rather than a claim directly tested by the model itself; the model’s own evidence is the indicator-weight decomposition below.
In contrast, in other economies, the energy transition has been much more complex, and the indicator-level decomposition of the ensemble-mean weights gives a quantitative account of why. For Norway (rank 28 of 38), the highest renewable energy share in the sample (Z = +1.45) is more than offset by low investment in clean-energy R&D as a share of GDP (Z = −1.61, weighted contribution −0.35) and low per-capita CO2 emissions of the energy sector after polarity adjustment (Z = −1.45, weighted contribution −0.35)—consistent with emissions tied to Norway’s oil and gas extraction sector rather than its largely hydro-based electricity generation, and with R&D investment being diluted by the size of its hydrocarbon-based economy [54,55]. For Sweden (rank 32), energy intensity is the dominant negative contributor (Z = −1.53, weighted contribution −0.21), consistent with energy-intensive heavy industry and cold-climate heating demand [56,57,58,59], only partly offset by above-average R&D investment (weighted contribution +0.17). For Germany (rank 35), R&D investment (weighted contribution −0.25) and energy intensity (−0.16) are the two largest negative contributors—more than twice the (still negative) contribution of per-capita CO2 emissions (−0.10)—a more specific attribution than the renewable energy share alone would suggest.
Finally, some Latin American economies present particular structural configurations characterized by lower levels of energy demand, along with a greater share of renewable sources, which is associated with their relative position in the index, although these characteristics more plausibly reflect structural conditions than deliberate energy-transition policy [60,61].
When comparing with recent studies, there are clear benefits that this research methodology brings. For example, Abdullah et al. [24] employed linear multivariate techniques in the explanation of structural determinants of the energy transition, and Casati et al. [62] use PCA and hierarchical analysis to identify patterns in countries; still, these methods are limited by their inability to capture nonlinear relationships. Similarly, Güler et al. [63] build multidimensional assessments from linear aggregations, whereas Li et al. [64] assess the renewable energy drivers of OECD countries through conventional econometric models. However, while reliable, these methods are based on linear assumptions and lack methods for dealing with complex relations within indicators. The combination of UMAP and Random Forest used in this study enables the identification of latent structures and weights identified directly from the data for a better capture of modern energy complexity than the methods used in the past. Despite these strengths, the results obtained would depend on the choice of the indicators as well as the parameters of the model, which in turn could affect the stability of the weight obtained as well as the ranking obtained. Beyond the specific case of OECD countries, this framework can be extended to other domains characterized by multidimensional and nonlinear relationships, supporting broader applications in sustainability and policy analysis.
5.2. Limitations
Three limitations should be considered when interpreting these results. First, sample-size constraints: the subsampling analysis in Section 5.1 shows that the derived indicator weights, and to a lesser extent the country ranking, are sensitive to which 30 of the 38 countries are included, indicating that 38 observations is a modest sample for a two-stage nonlinear pipeline followed by a feature-importance step; results should be interpreted as describing this specific sample of OECD countries in 2022 rather than as universally stable indicator valuations. Second, indicator-dependence constraints: adding or removing input indicators changes the manifold structure UMAP identifies and therefore all resulting weights, so the current weights should not be read as context-free statements about which aspects of energy performance matter most in general. Third, the analysis is cross-sectional (a single year, 2022); it cannot capture how energy transitions evolve over time, and extending the framework to panel data is a natural direction for future work if comparable multi-year indicator data become available. We report these limitations directly alongside the robustness checks in Section 5.1 that motivated identifying them, rather than presenting only the more favorable diagnostics.
6. Conclusions
The findings of this study indicate that in order to properly evaluate energy performance of OECD countries, approaches capable of capturing the inherent complexity of contemporary energy systems should be established. By using the UMAP and Random Forest framework, this research provides new insight into nonlinear patterns not visible in traditional methods (e.g., PCA and subjective weighting schemes). This approach demonstrates that emissions, efficiency, clean technologies, and energy policy are jointly structured within a complex nonlinear energy system, revealing clear differences between economies with more stable and coherent decarbonization trajectories. From the perspective of multicriteria decision analysis, this study contributes by integrating nonlinear dimensionality reduction with data-driven weighting into a unified framework for synthetic index construction.
The results show that structural factors, such as investment and R&D, energy intensity, and the design of public policies, are associated with the energy performance of countries in this index.
The proposed approach allows for the identification of structure not visible to linear methods during weight derivation and the generation of data-based weighting schemes, thereby reducing dependence on linear assumptions and subjective judgments at that step. The linear aggregation of those weights, together with a non-compensatory alternative, was itself tested for robustness (Section 5.1) and found to produce a near-identical ranking. Taken together with the hyperparameter, seed, dimensionality, and sample-composition sensitivity analyses in Sections Hyperparameter, Random-Seed, and Dimensionality Sensitivity and 5.1, the UMAP–Random Forest framework shows moderate-to-strong, but not unconditional, robustness for composite index construction in complex systems; we report the favorable and unfavorable robustness results together so that this qualification is explicit rather than implied.
Future research could extend the framework by incorporating additional dimensions such as energy justice, institutional quality, digitalization, and climate resilience. It can further generalize to other parts of the world. Variants of models based on other types of deep learning approaches or additional explanatory features to understand further what motivates or reduces the energy transition would also provide a more informative insight. At a larger level, the findings of this study show the potential of hybrid, data-driven methods for significantly enhancing energy performance analysis, presenting a more meaningful interpretation to provide a more robust basis for sustainable public policy design.
Author Contributions
Writing—review and editing, writing—original draft, validation, and conceptualization: A.M.-M., D.V.-C. and D.M.-C. Methodology: A.M.-M. and D.V.-C. Formal analysis: A.M.-M. and D.V.-C. Resources: A.M.-M. and D.M.-C. Data curation: A.M.-M. and D.M.-C. Software: D.M.-C. and D.V.-C. All authors have read and agreed to the published version of the manuscript.
Funding
This research received no external funding.
Data Availability Statement
The data that support the findings of this study are available on request from the corresponding author.
Conflicts of Interest
The authors declare no conflicts of interest.
References
- Kabeyi, M.J.B.; Olanrewaju, O.A. Sustainable energy transition for renewable and low carbon grid electricity generation and supply. Front. Energy Res. 2022, 9, 743114. [Google Scholar] [CrossRef] [Scilit]
- Airò Farulla, G.; Tumminia, G.; Sergi, F.; Aloisio, D.; Cellura, M.; Antonucci, V.; Ferraro, M. A review of key performance indicators for building flexibility quantification to support the clean energy transition. Energies 2021, 14, 5676. [Google Scholar] [CrossRef] [Scilit]
- Wu, L.; Hussain, S. Navigating the energy transition: Interplay of geopolitics, economic complexity, and environmental governance in OECD countries. Energy Strategy Rev. 2025, 57, 101624. [Google Scholar] [CrossRef] [Scilit]
- Wu, L.; Adebayo, T.S.; Yue, X.G.; Umut, A. The role of renewable energy consumption and financial development in environmental sustainability: Implications for the Nordic Countries. Int. J. Sustain. Dev. World Ecol. 2023, 30, 21–36. [Google Scholar] [CrossRef] [Scilit]
- Mazziotta, M.; Pareto, A. Principal component analysis for constructing socio-economic composite indicators: Theoretical and empirical considerations. SN Soc. Sci. 2024, 4, 114. [Google Scholar] [CrossRef] [Scilit]
- Tu, J.; Wu, Z. Analytic hierarchy process rank reversals: Causes and solutions. Ann. Oper. Res. 2025, 346, 1785–1809. [Google Scholar] [CrossRef] [Scilit]
- Chen, Z.; Wu, Z.; Wei, L.; Yang, L.; Yuan, B.; Zhou, M. Understanding the synergy of energy storage and renewables in decarbonization via random forest-based explainable AI. Appl. Energy 2025, 390, 125891. [Google Scholar] [CrossRef] [Scilit]
- Yang, Y.; Sun, H.; Zhang, Y.; Zhang, T.; Gong, J.; Wei, Y.; Duan, Y.-G.; Shu, M.; Yang, Y.; Wu, D.; et al. Dimensionality reduction by UMAP reinforces sample heterogeneity analysis in bulk transcriptomic data. Cell Rep. 2021, 36, 109442. [Google Scholar] [CrossRef] [Scilit]
- Khan, W.; Walker, S.; Zeiler, W. A bottom-up framework for analysing city-scale energy data using high dimension reduction techniques. Sustain. Cities Soc. 2023, 89, 104323. [Google Scholar] [CrossRef] [Scilit]
- Leon-Gomez, E.A.; Álvarez-Meza, A.M.; Castellanos-Dominguez, G. Cross-Dataset Data Augmentation Using UMAP for Deep Learning-Based Wind Speed Prediction. Computers 2025, 14, 123. [Google Scholar] [CrossRef] [Scilit]
- McInnes, L.; Healy, J.; Melville, J. Umap: Uniform manifold approximation and projection for dimension reduction. arXiv 2018, arXiv:1802.03426. [Google Scholar] [CrossRef] [Scilit]
- Becht, E.; McInnes, L.; Healy, J.; Dutertre, C.A.; Kwok, I.W.; Ng, L.G.; Ginhoux, F.; Newell, E.W. Dimensionality reduction for visualizing single-cell data using UMAP. Nat. Biotechnol. 2019, 37, 38–44. [Google Scholar] [CrossRef] [Scilit]
- Gayoso, A.; Steier, Z.; Lopez, R.; Regier, J.; Nazor, K.L.; Streets, A.; Yosef, N. Joint probabilistic modeling of single-cell multi-omic data with totalVI. Nat. Methods 2021, 18, 272–282. [Google Scholar] [CrossRef] [Scilit]
- Pal, M. Random Forest classifier for remote sensing classification. Int. J. Remote Sens. 2005, 26, 217–222. [Google Scholar] [CrossRef] [Scilit]
- Palimkar, P.; Shaw, R.N.; Ghosh, A. Machine learning technique to prognosis diabetes disease: Random Forest classifier approach. In Advanced Computing and Intelligent Technologies: Proceedings of ICACIT 2021; Springer: Singapore, 2021; pp. 219–244. [Google Scholar] [CrossRef] [Scilit]
- Du, X.; Cheng, C.; Wang, Y.; Han, Z. Research on network attack traffic detection Hybrid Algorithm based on UMAP-RF. Algorithms 2022, 15, 238. [Google Scholar] [CrossRef] [Scilit]
- Trozzi, F.; Wang, X.; Tao, P. UMAP as a dimensionality reduction tool for molecular dynamics simulations of biomacromolecules: A comparison study. J. Phys. Chem. B 2021, 125, 5022–5034. [Google Scholar] [CrossRef] [Scilit]
- Rezazadeh, N.; Annaz, F.; Jabbar, W.A.; Vieira Filho, J.; De Oliveira, M. A transfer learning approach for mitigating temperature effects on wind turbine blades damage diagnosis. Struct. Health Monit. 2025, 25, 1761–1783. [Google Scholar] [CrossRef] [Scilit]
- Taghizadeh-Mehrjardi, R.; Nabiollahi, K.; Kebonye, N.M.; Kakhani, N.; Ghebleh-Goydaragh, M.; Heung, B.; Amirian-Chakan, A.; Hossaini, S.M.T.; Scholten, T. High-performance soil class delineation via UMAP coupled with machine learning in Kurdistan Province, Iran. Geoderma Reg. 2024, 36, e00754. [Google Scholar] [CrossRef] [Scilit]
- Qazi, A. Exploring interconnected indicators of energy transition: A global perspective. Energy Geosci. 2025, 6, 100445. [Google Scholar] [CrossRef] [Scilit]
- Bakhsh, S.; Zhang, W.; Ali, K.; Anas, M. Energy transition and environmental stability prospects for OECD economies: The prominence role of environmental governance, and economic complexity: Does the geopolitical risk matter? J. Environ. Manag. 2024, 354, 120358. [Google Scholar] [CrossRef] [Scilit]
- Wang, Q.; Wang, X.; Li, R. Geopolitical risks and energy transition: The impact of environmental regulation and green innovation. Humanit. Soc. Sci. Commun. 2024, 11, 1272. [Google Scholar] [CrossRef] [Scilit]
- Fang, D.; Shi, S.; Yu, Q. Evaluation of sustainable energy security and an empirical analysis of China. Sustainability 2018, 10, 1685. [Google Scholar] [CrossRef] [Scilit]
- Abdullah, F.B.; Iqbal, R.; Ahmad, S.; El-Affendi, M.A.; Kumar, P. Optimization of multidimensional energy security: An index-based assessment. Energies 2022, 15, 3929. [Google Scholar] [CrossRef] [Scilit]
- Moner-Girona, M.; Bender, A.; Becker, W.; Bódis, K.; Szabó, S.; Kararach, A.G.; Anadon, L.D. A multidimensional high-resolution assessment approach to boost decentralised energy investments in Sub-Saharan Africa. Renew. Sustain. Energy Rev. 2021, 148, 111282. [Google Scholar] [CrossRef] [Scilit]
- Madaleno, M.; Nogueira, M.C. How renewable energy and CO2 emissions contribute to economic growth, and sustainability-an extensive analysis. Sustainability 2023, 15, 4089. [Google Scholar] [CrossRef] [Scilit]
- Balsalobre-Lorente, D.; Shahbaz, M.; Roubaud, D.; Farhani, S. How economic growth, renewable electricity and natural resources contribute to CO2 emissions? Energy Policy 2018, 113, 356–367. [Google Scholar] [CrossRef] [Scilit]
- Roinioti, A.; Koroneos, C. Integrated life cycle sustainability assessment of the Greek interconnected electricity system. Sustain. Energy Technol. Assess. 2019, 32, 29–46. [Google Scholar] [CrossRef] [Scilit]
- Güney, T. Renewable energy consumption and sustainable development: A panel cointegration approach. J. Knowl. Econ. 2024, 15, 1286–1301. [Google Scholar] [CrossRef] [Scilit]
- Rizal, R.N.; Hartono, D.; Dartanto, T.; Gultom, Y.M. Multidimensional energy poverty: A study of its measurement, decomposition, and determinants in Indonesia. Heliyon 2024, 10, e24135. [Google Scholar] [CrossRef] [Scilit]
- Dabkiene, V.; Balezentis, T.; Streimikiene, D. Development of agri-environmental footprint indicator using the FADN data: Tracking development of sustainable agricultural development in Eastern Europe. Sustain. Prod. Consum. 2021, 27, 2121–2133. [Google Scholar] [CrossRef] [Scilit]
- Sahin, M. A comprehensive analysis of weighting and multicriteria methods in the context of sustainable energy. Int. J. Environ. Sci. Technol. 2021, 18, 1591–1616. [Google Scholar] [CrossRef] [Scilit]
- Xue, B.; Lu, F.; Guo, J.; Wang, Z.; Zhang, Z.; Lu, Y. Research on energy efficiency evaluation model of substation building based on AHP and fuzzy comprehensive theory. Sustainability 2023, 15, 14493. [Google Scholar] [CrossRef] [Scilit]
- Charles, V.; Emrouznejad, A. DEA-based index systems for addressing the United Nations’ SDGs. Environ. Sci. Policy 2024, 162, 103950. [Google Scholar] [CrossRef] [Scilit]
- Bhattarai, U.; Maraseni, T.; Devkota, L.; Apan, A. A composite indicator-based method to assess the energy security of Nepal and prospects of cross-border electricity sharing in South Asia. Environ. Dev. 2024, 51, 101002. [Google Scholar] [CrossRef] [Scilit]
- OECD/European Union/EC-JRC. Handbook on Constructing Composite Indicators: Methodology and User Guide; OECD Publishing: Paris, France, 2008. [Google Scholar] [CrossRef] [Scilit]
- Greco, S.; Ishizaka, A.; Tasiou, M.; Torrisi, G. On the methodological framework of composite indices: A review of the issues of weighting, aggregation, and robustness. Soc. Indic. Res. 2019, 141, 61–94. [Google Scholar] [CrossRef] [Scilit]
- Bao, H.; Guo, S.; Mo, J.; Zhao, Z.; Wang, Z.; Chen, Z.; Liang, J. An analysis method for residential electricity consumption behavior based on UMAP-CRITIC feature optimization and SSA-assisted clustering. Energy Rep. 2023, 9, 245–254. [Google Scholar] [CrossRef] [Scilit]
- World Energy Council. World Energy Trilemma Index: Evolving with Resilience and Justice World Energy Council, in Partnership with Oliver Wyman. 2024. Available online: https://trilemma.worldenergy.org (accessed on 10 November 2025).
- Konopka, T. umap: Uniform Manifold Approximation and Projection, Version 0.2.10.0; The R Foundation: Vienna, Austria, 2018. Available online: https://CRAN.R-project.org/package=umap (accessed on 1 February 2020).
- Wright, M.N.; Ziegler, A. Ranger: A Fast Implementation of Random Forests for High Dimensional Data in C++ and R. J. Stat. Softw. 2017, 77, 1–17. [Google Scholar] [CrossRef] [Scilit]
- Altmann, A.; Tolosi, L.; Sander, O.; Lengauer, T. Permutation importance: A corrected feature importance measure. Bioinformatics 2010, 26, 1340–1347. [Google Scholar] [CrossRef] [Scilit]
- Mazziotta, M.; Pareto, A. Measuring well-being over time: The Adjusted Mazziotta-Pareto Index versus other non-compensatory indices. Soc. Indic. Res. 2018, 136, 967–976. [Google Scholar] [CrossRef] [Scilit]
- Munda, G.; Nardo, M. Noncompensatory/nonlinear composite indicators for ranking countries: A defensible setting. Appl. Econ. 2009, 41, 1513–1523. [Google Scholar] [CrossRef] [Scilit]
- Le-Boulch, D.; Morisset, V.; Jobard, Z.; Burguburu, A.; Czyrnek-Delêtre, M.M. Life cycle assessment of nuclear power in France: EDF case study. EPJ Nucl. Sci. Technol. 2024, 10, 8. [Google Scholar] [CrossRef] [Scilit]
- Zimmermann, F.; Keles, D. State or market: Investments in new nuclear power plants in France and their domestic and cross-border effects. Energy Policy 2023, 173, 113403. [Google Scholar] [CrossRef] [Scilit]
- Callonnec, G.; Gouëdard, H.; Hamdi-Cherif, M.; Landa, G.; Malliet, P.; Reynès, F.; Saussay, A. Macroeconomic effects of achieving Carbon Neutrality in France. Energy Clim. Chang. 2025, 6, 100174. [Google Scholar] [CrossRef] [Scilit]
- Weiss, O.; Pareschi, G.; Georges, G.; Boulouchos, K. The Swiss energy transition: Policies to address the Energy Trilemma. Energy Policy 2021, 148, 111926. [Google Scholar] [CrossRef] [Scilit]
- Arabzadeh, V.; Frank, R. Creating a renewable energy-powered energy system: Extreme scenarios and novel solutions for large-scale renewable power integration. Appl. Energy 2024, 374, 124088. [Google Scholar] [CrossRef] [Scilit]
- Mengxuan, T.; Khan, K.; Cifuentes-Faura, J.; Sukumaran, S. Technological innovation and energy efficiency in central Eastern European countries. Util. Policy 2024, 88, 101761. [Google Scholar] [CrossRef] [Scilit]
- Kim, J.; Jin, T.; Lee, T.E.; Kim, D. Evaluation of decarbonization cost transfer: From transport to power sector in South Korea. Renew. Sustain. Energy Rev. 2024, 199, 114527. [Google Scholar] [CrossRef] [Scilit]
- Chen, K.T.; Jou, S.C. Institutional frameworks for renewable energy certificates: Insights from Japan and South Korea. Energy Rep. 2025, 13, 5792–5801. [Google Scholar] [CrossRef] [Scilit]
- Mc Guire, J.; Rogan, F.; Balyk, O.; Mac Uidhir, T.; Gaur, A.; Daly, H. Developing decarbonisation pathways in changing TIMES for Irish homes. Energy Strat. Rev. 2023, 47, 101086. [Google Scholar] [CrossRef] [Scilit]
- Cho, I.H. To escape or embrace reactors? the politics of nuclear phase-out in Germany and South Korea. Pac. Rev. 2022, 35, 32–58. [Google Scholar] [CrossRef] [Scilit]
- Selje, T. Comparing the German exit of nuclear and coal: Assessing historical pathways and energy phase-out dimensions. Energy Res. Soc. Sci. 2022, 94, 102883. [Google Scholar] [CrossRef] [Scilit]
- Heinonen, J.; Olson, S.; Czepkiewicz, M.; Árnadóttir, Á.; Ottelin, J. Too much consumption or too high emissions intensities? Explaining the high consumption-based carbon footprints in the Nordic countries. Environ. Res. Commun. 2022, 4, 125007. [Google Scholar] [CrossRef] [Scilit]
- Elberry, A.M.; Thakur, J.; Veysey, J. Seasonal hydrogen storage for sustainable renewable energy integration in the electricity sector: A case study of Finland. J. Energy Storage 2021, 44, 103474. [Google Scholar] [CrossRef] [Scilit]
- Wu, T.H.; Huang, S.W.; Lin, M.C.; Wang, H.H. Energy security performance evaluation revisited: From the perspective of the energy supply chain. Renew. Sustain. Energy Rev. 2023, 182, 113375. [Google Scholar] [CrossRef] [Scilit]
- Kirkerud, J.G.; Nagel, N.O.; Bolkesjø, T.F. The role of demand response in the future renewable northern European energy system. Energy 2021, 235, 121336. [Google Scholar] [CrossRef] [Scilit]
- Stringer, T.; Ramírez-Melgarejo, M. Decarbonization pathways in Latin America: Assessing the economic and policy implications of transitioning to renewable energy sources. Next Energy 2024, 5, 100157. [Google Scholar] [CrossRef] [Scilit]
- Giraldo, J.A.B.; Galeano, D.; Morales, D.; Trespalacios, A. Economic and policy assessment on nuclear energy for Latin America’s energy transition. Energy Policy 2025, 206, 114771. [Google Scholar] [CrossRef] [Scilit]
- Casati, P.; Moner-Girona, M.; Khaleel, S.I.; Szabo, S.; Nhamo, G. Clean energy access as an enabler for social development: A multidimensional analysis for Sub-Saharan Africa. Energy Sustain. Dev. 2023, 72, 114–126. [Google Scholar] [CrossRef] [Scilit]
- Guler, E.; Yerel Kandemir, S.; Acikkalp, E.; Ahmadi, M.H. Evaluation of sustainable energy performance for OECD countries. Energy Sources Part B Econ. Plan. Policy 2021, 16, 491–514. [Google Scholar] [CrossRef] [Scilit]
- Li, Z.; Niu, S.; Wang, J.; Tan, Y.; Wang, Z. Multidimensional assessment of energy transition and policy implications. Renew. Energy 2025, 238, 121870. [Google Scholar] [CrossRef] [Scilit]

Disclaimer/Publisher’s Note: The statements, opinions and data contained in all publications are solely those of the individual author(s) and contributor(s) and not of MDPI and/or the editor(s). MDPI and/or the editor(s) disclaim responsibility for any injury to people or property resulting from any ideas, methods, instructions or products referred to in the content. |
© 2026 by the authors. Licensee MDPI, Basel, Switzerland. This article is an open access article distributed under the terms and conditions of the Creative Commons Attribution (CC BY) license.