


Abstract
Cast-in-place ground-supported concrete slabs (GSCSs) are used as floors in many facilities such as factories, workshops, garages, and airports (i.e., rigid pavements). These slabs may be subjected to repeated impact loads caused by vehicle loads, the dropping of heavy loads, and aircraft landing loads on runways. This research presents an experimental and numerical study to investigate the behavior of these slabs under impact loads. The experimental program consists of 18 concrete slabs with dimensions of 400 mm × 400 mm × 100 mm. Some variables were studied experimentally, such as the reinforcement ratio of these slabs and the amount of the impact force (represented by the drop height). Unreinforced slabs and slabs reinforced with steel reinforcement or a geogrid mesh made of knitted polyester ribs were tested. ABAQUS software was employed to study the failure mode and crack distribution of these slabs numerically. The accuracy of the proposed numerical model was verified by modeling the tested slabs and comparing the numerical results with the experimental results. From the study results, it is clear that the reinforcement significantly improves the impact performance of GSCSs, transforming their failure behavior from brittle to more ductile and tough. The combined use of impact strength and ductility factors provides an integrated measure of slab performance, offering valuable guidance for the design of protective structures, pavements, and industrial flooring under impact loading.
Keywords:
concrete slab; drop-weight; geogrid; impact loading; reinforcement ratio; strength; ductility 1. Introduction
A ground-supported concrete slab (GSCS) is a type of concrete slab that rests directly on the ground. They may be either unreinforced or reinforced and may serve as a rigid pavement. These slabs are characterized by their ease of implementation, their ability to withstand high loads, and their long service life. They are more durable than other types of paving, such as flexible paving, and are therefore used in factory floors, garages, parking lots, and runways. These slabs may be subjected to impact loads, which may be caused by the dropping of heavy loads or aircraft landing on the runway. The behavior of GSCSs has been experimentally studied under the effect of static concentrated loads. These slabs were either unreinforced concrete, reinforced with fabric steel mesh, or reinforced with steel bars and synthetic fiber reinforcement. These studies have been conducted by a number of researchers [1,2,3,4].
Øverli [3] presented an experimental and analytical study to investigate the behavior of GSCSs. In this study, the slabs were subjected to static concentrated loads at different locations, either at the center, at the edge, or at the corner. By comparing the results of the analytical and experimental studies, it was found that there was a good agreement. The slabs that were loaded at the center failed in punching shear, while the slabs that were loaded at the edge failed in a mixed failure mode of punching shear and bending. Finally, the slabs that were loaded at the corner failed in a mixed failure mode of anchoring and punching shear.
Sucharda et al. [5] conducted an experimental and numerical study on the punching shear behavior of GSCSs reinforced with steel bars. The slabs had dimensions of 1.95 m × 2.00 m and a thickness of 120 mm. It was found that the failure surface was located at an average distance of 1.7d from the column perimeter (i.e., where d is the effective depth of the slab). The failure shape was irregular and oval. The numerical and experimental results agreed with only a small difference.
Tang et al. [4] carried out an experimental study on the behavior of GSCSs reinforced with a geogrid mesh. The study found that the use of a geogrid mesh allows for the development of a secondary crack after the first crack and increases the punching shear capacity of the slab. Cajka et al. [6] did an experimental and numerical study on the behavior of GSCSs reinforced with fibers and with dimensions of 2.0 m × 2.0 m × 0.15 m. The fracture-plastic model was used to simulate the behavior of concrete. The study found that GSCSs reinforced with fibers remained intact as a single piece after failure, unlike the unreinforced slabs. The extent of damage to GSCSs with fibers depended on the fiber content in the mixture.
The behavior of GSCSs under impact loads has been studied by many researchers. Said and Mouwainea [7] performed an experimental study on the dynamic behavior of reinforced concrete (RC) slabs using drop hammer tests. The effect of varying the reinforcement ratio and concrete compressive strength was studied, and it was found that the reinforcement ratio had a more pronounced effect on damage extent compared with concrete strength. Othman and Marzouk [8] found that slabs with higher reinforcement ratios had greater resistance to damage. They also found that slab thickness and support conditions had a significant effect on the dynamic behavior of the tested slabs.
The dynamic behavior of fiber-reinforced concrete (FRC) slabs has been extensively examined by researchers [9,10,11], as has the behavior of high-performance concrete (HPC) slabs in previous studies [12,13,14,15,16,17]. The results of these studies confirm that the use of FRC or HPC improves the dynamic capacity of RC slabs.
Sadraie et al. [18] undertook an experimental study using drop hammer tests to compare the behavior of concrete slabs reinforced with glass fiber-reinforced polymer (GFRP) bars and steel bars. The study found that GFRP-reinforced slabs had more cracks, a larger damaged area, and a larger maximum displacement than steel-reinforced slabs.
Mousavi and Shafei [19] conducted a numerical study on the dynamic behavior of concrete slabs reinforced with hybrid FRP-steel. They found that by using the appropriate ratio of FRP and steel reinforcement, the dynamic behavior of the tested slabs could be improved. Furthermore, Emara et al. [20] carried out a numerical study on the behavior of one-way and two-way RC slabs strengthened with external carbon fiber-reinforced polymer (CFRP) strips under impact loads. Several variables were studied, including the type of slabs, the aspect ratio of slabs, the width of the CFRP strip, and the CFRP reinforcement configuration. The study found that the dynamic capacity of the two-way slabs was improved when CFRP was used in a diagonal direction, while the behavior of the one-way slabs was improved when it was used in the direction of the short length of the slab.
Although it is well established that increasing reinforcement enhances the strength of concrete slabs, limited research has addressed the behavior of GSCSs under repeated impact loading, particularly in terms of crack evolution, failure mechanisms, and post-cracking performance. Moreover, the combined influence of reinforcement type, reinforcement ratio, and impact energy has not been systematically investigated. This study aims to address this gap by experimentally and numerically evaluating the response of slabs reinforced with steel bars and geogrids under repeated drop-weight impacts. In addition, two performance indicators, the impact strength factor (ISF) and ductility factor (DF), are adopted to provide a more comprehensive assessment of impact resistance and deformation capacity, offering deeper insight into structural behavior beyond conventional strength-based observations.
Based on previous studies, there is a lack of studies on the dynamic behavior of GSCSs, whether for unreinforced slabs, steel-reinforced slabs, or geogrid-reinforced slabs. Therefore, this research presents an experimental study based on drop hammer tests of 18 GSCSs. The study investigated a number of variables, such as the type of internal reinforcement (unreinforced, steel-reinforced, or geogrid-reinforced), the reinforcement ratio, and the impact load. The research also established a numerical model that was verified by comparing its results with the experimental results. Further, a parametric study was carried out to investigate the effect of slab thickness and the influence of support stiffness on slab behavior.
2. Study Objectives and Overview
Concrete slabs resting directly on the ground are subject to sudden-onset or repeated impacting forces from heavy machines, moving vehicles, or accidental falls. These repeated strikes can initiate crack formation, propagate the cracks progressively, and weaken the slabs to the ultimate point of failure. Though such phenomena are common in practice, little detailed research has been undertaken on how different reinforcement levels or varying impact energies affect the behavior of the slabs under such loads. The current study aims to fill this gap in knowledge by investigating the dynamic responses of reinforced and unreinforced slabs to drop-weight impacts under controlled conditions. The study tracked crack initiation and propagation mechanisms, how reinforcements modified them, and how damage progression varied with drop height. In order to measure the impact resistance of the slabs and their deformation capacity before collapse, two simple but effective parameters, ISF and DF, were established. Using the findings of these parameters together aims to guide design engineers in designing concrete slabs that are safer, tougher, and more resilient when subjected to impact loading.
3. Experimental Methodology
3.1. Materials
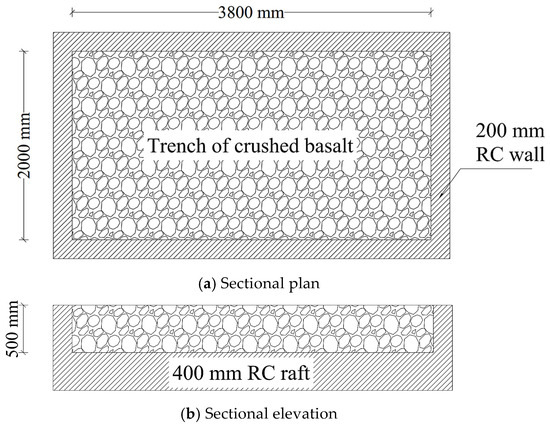
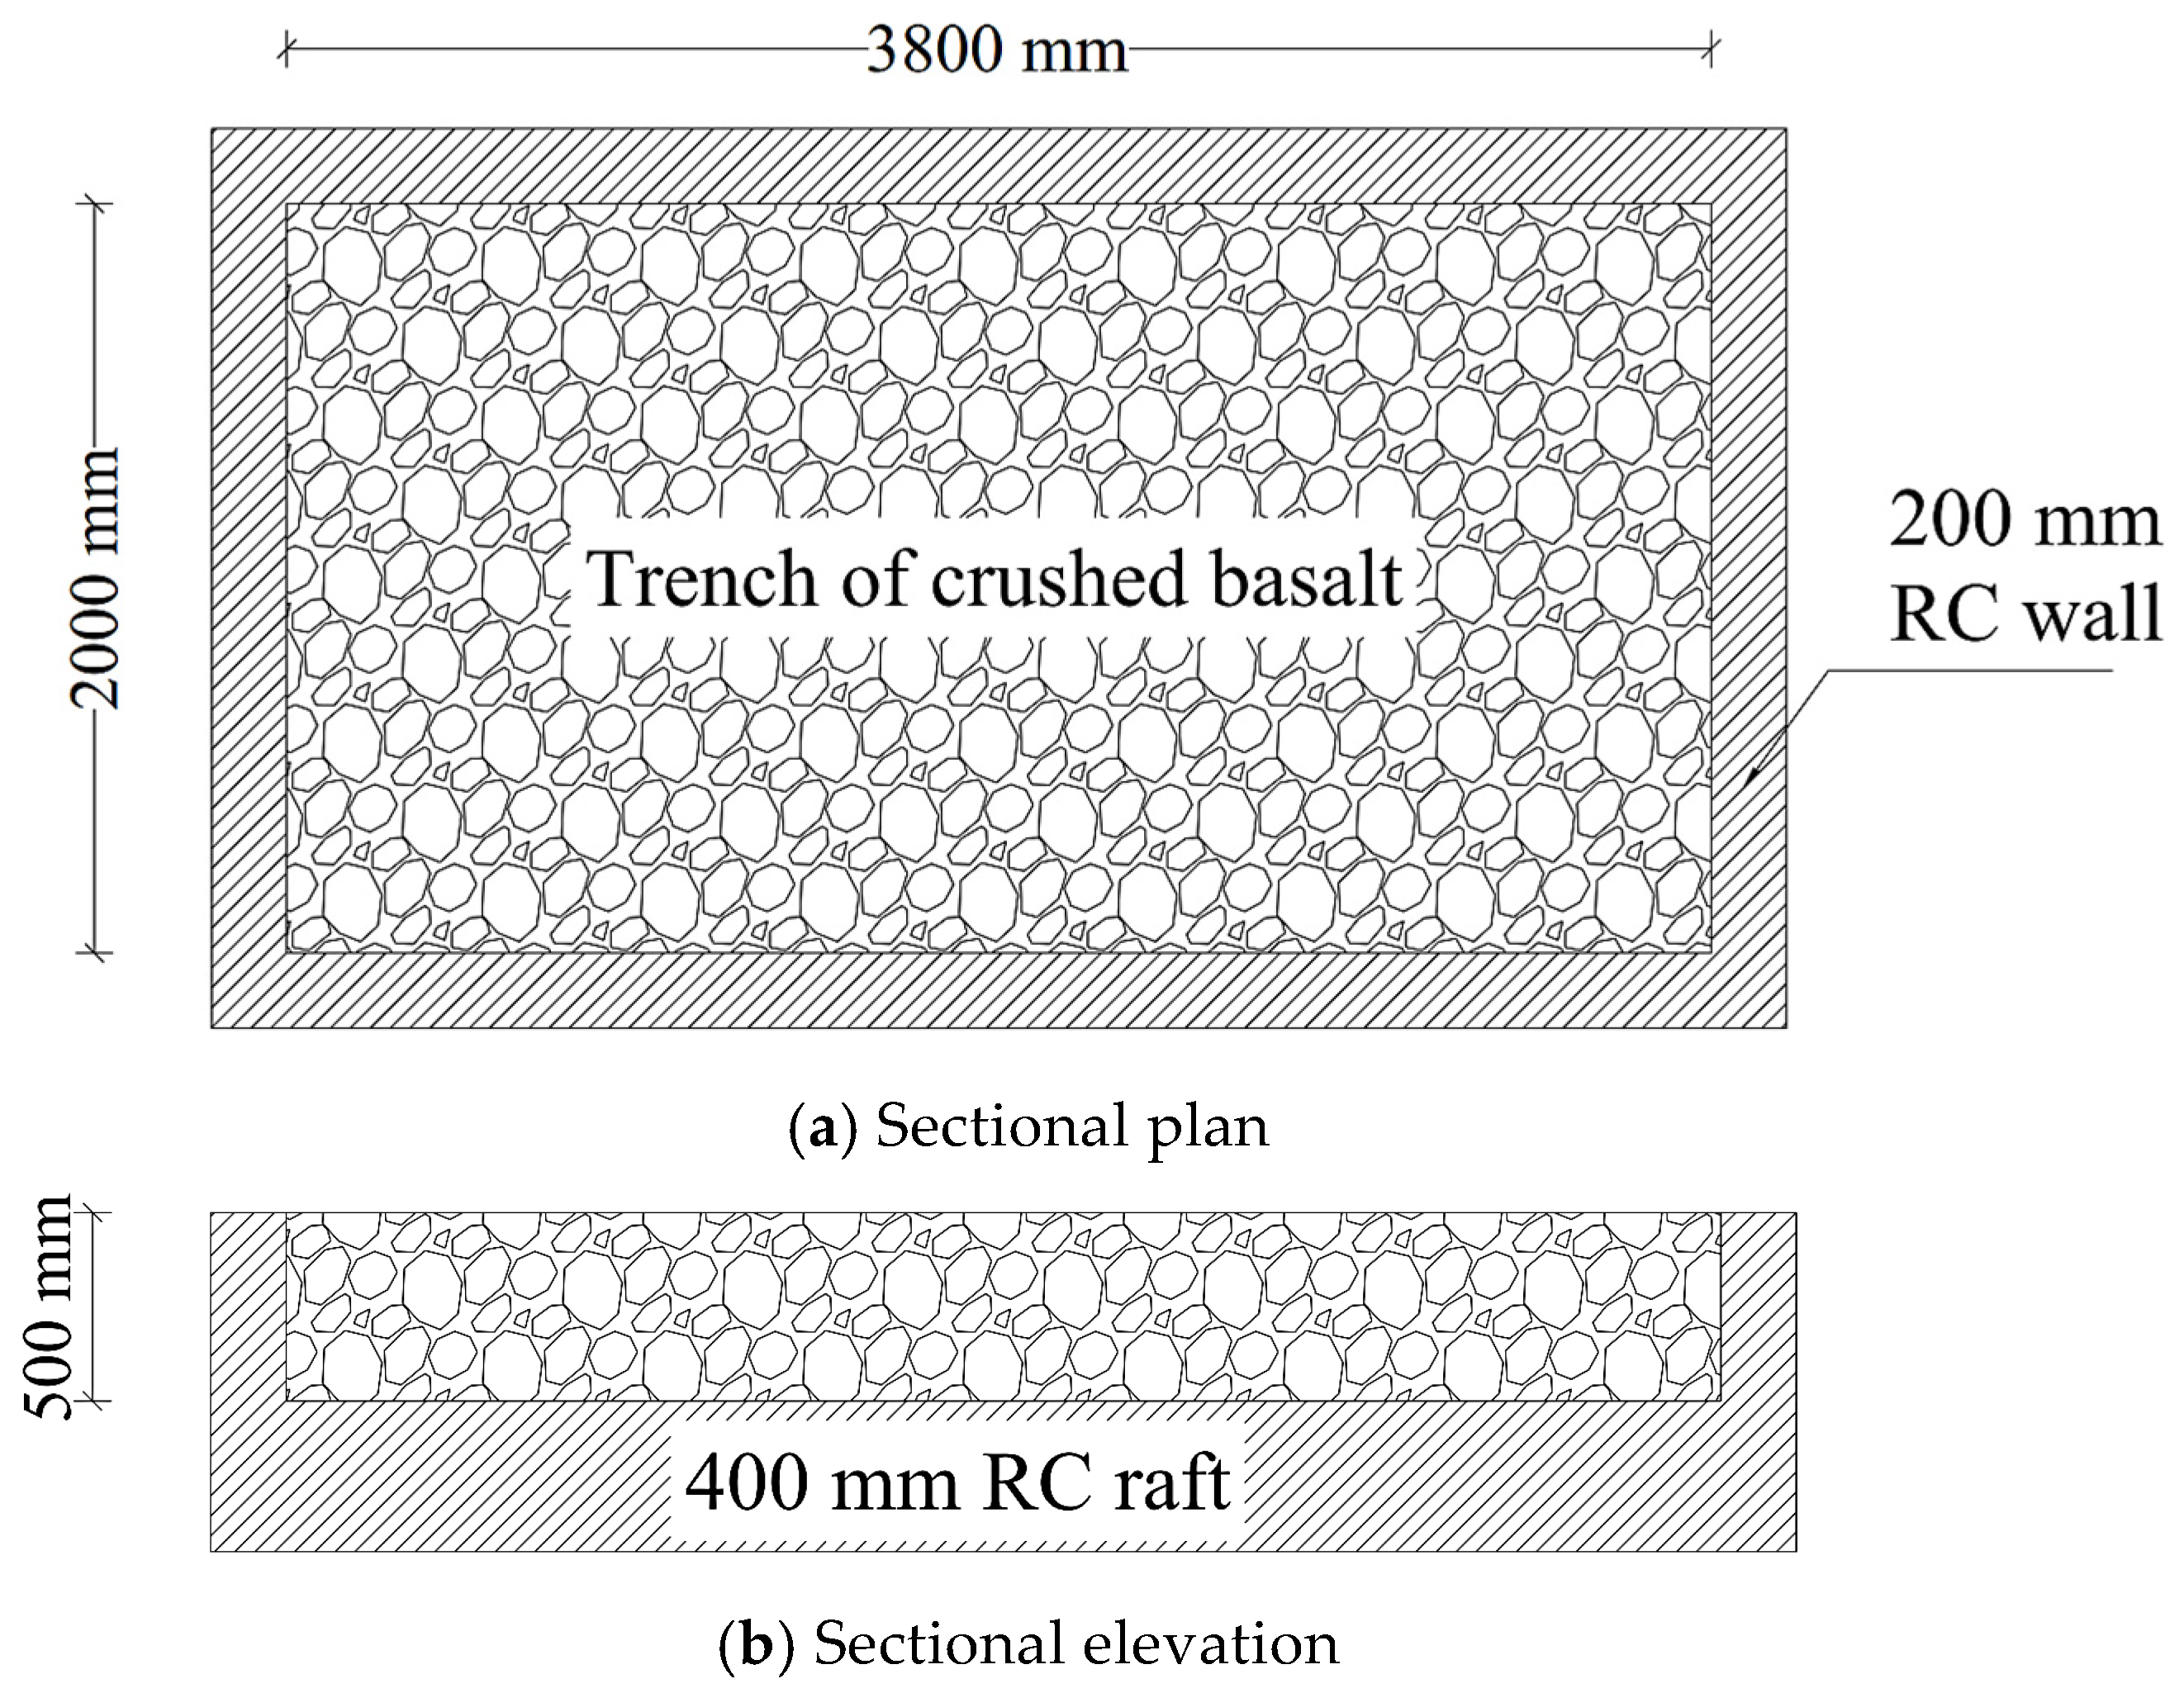
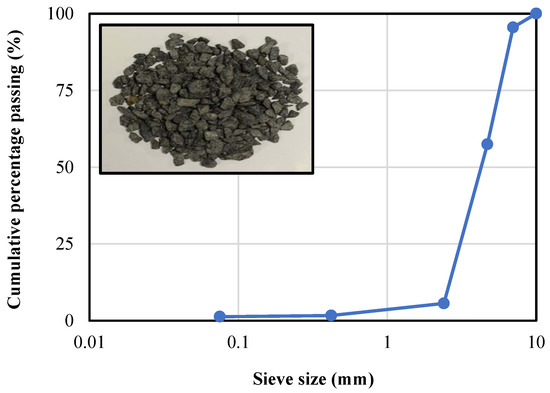
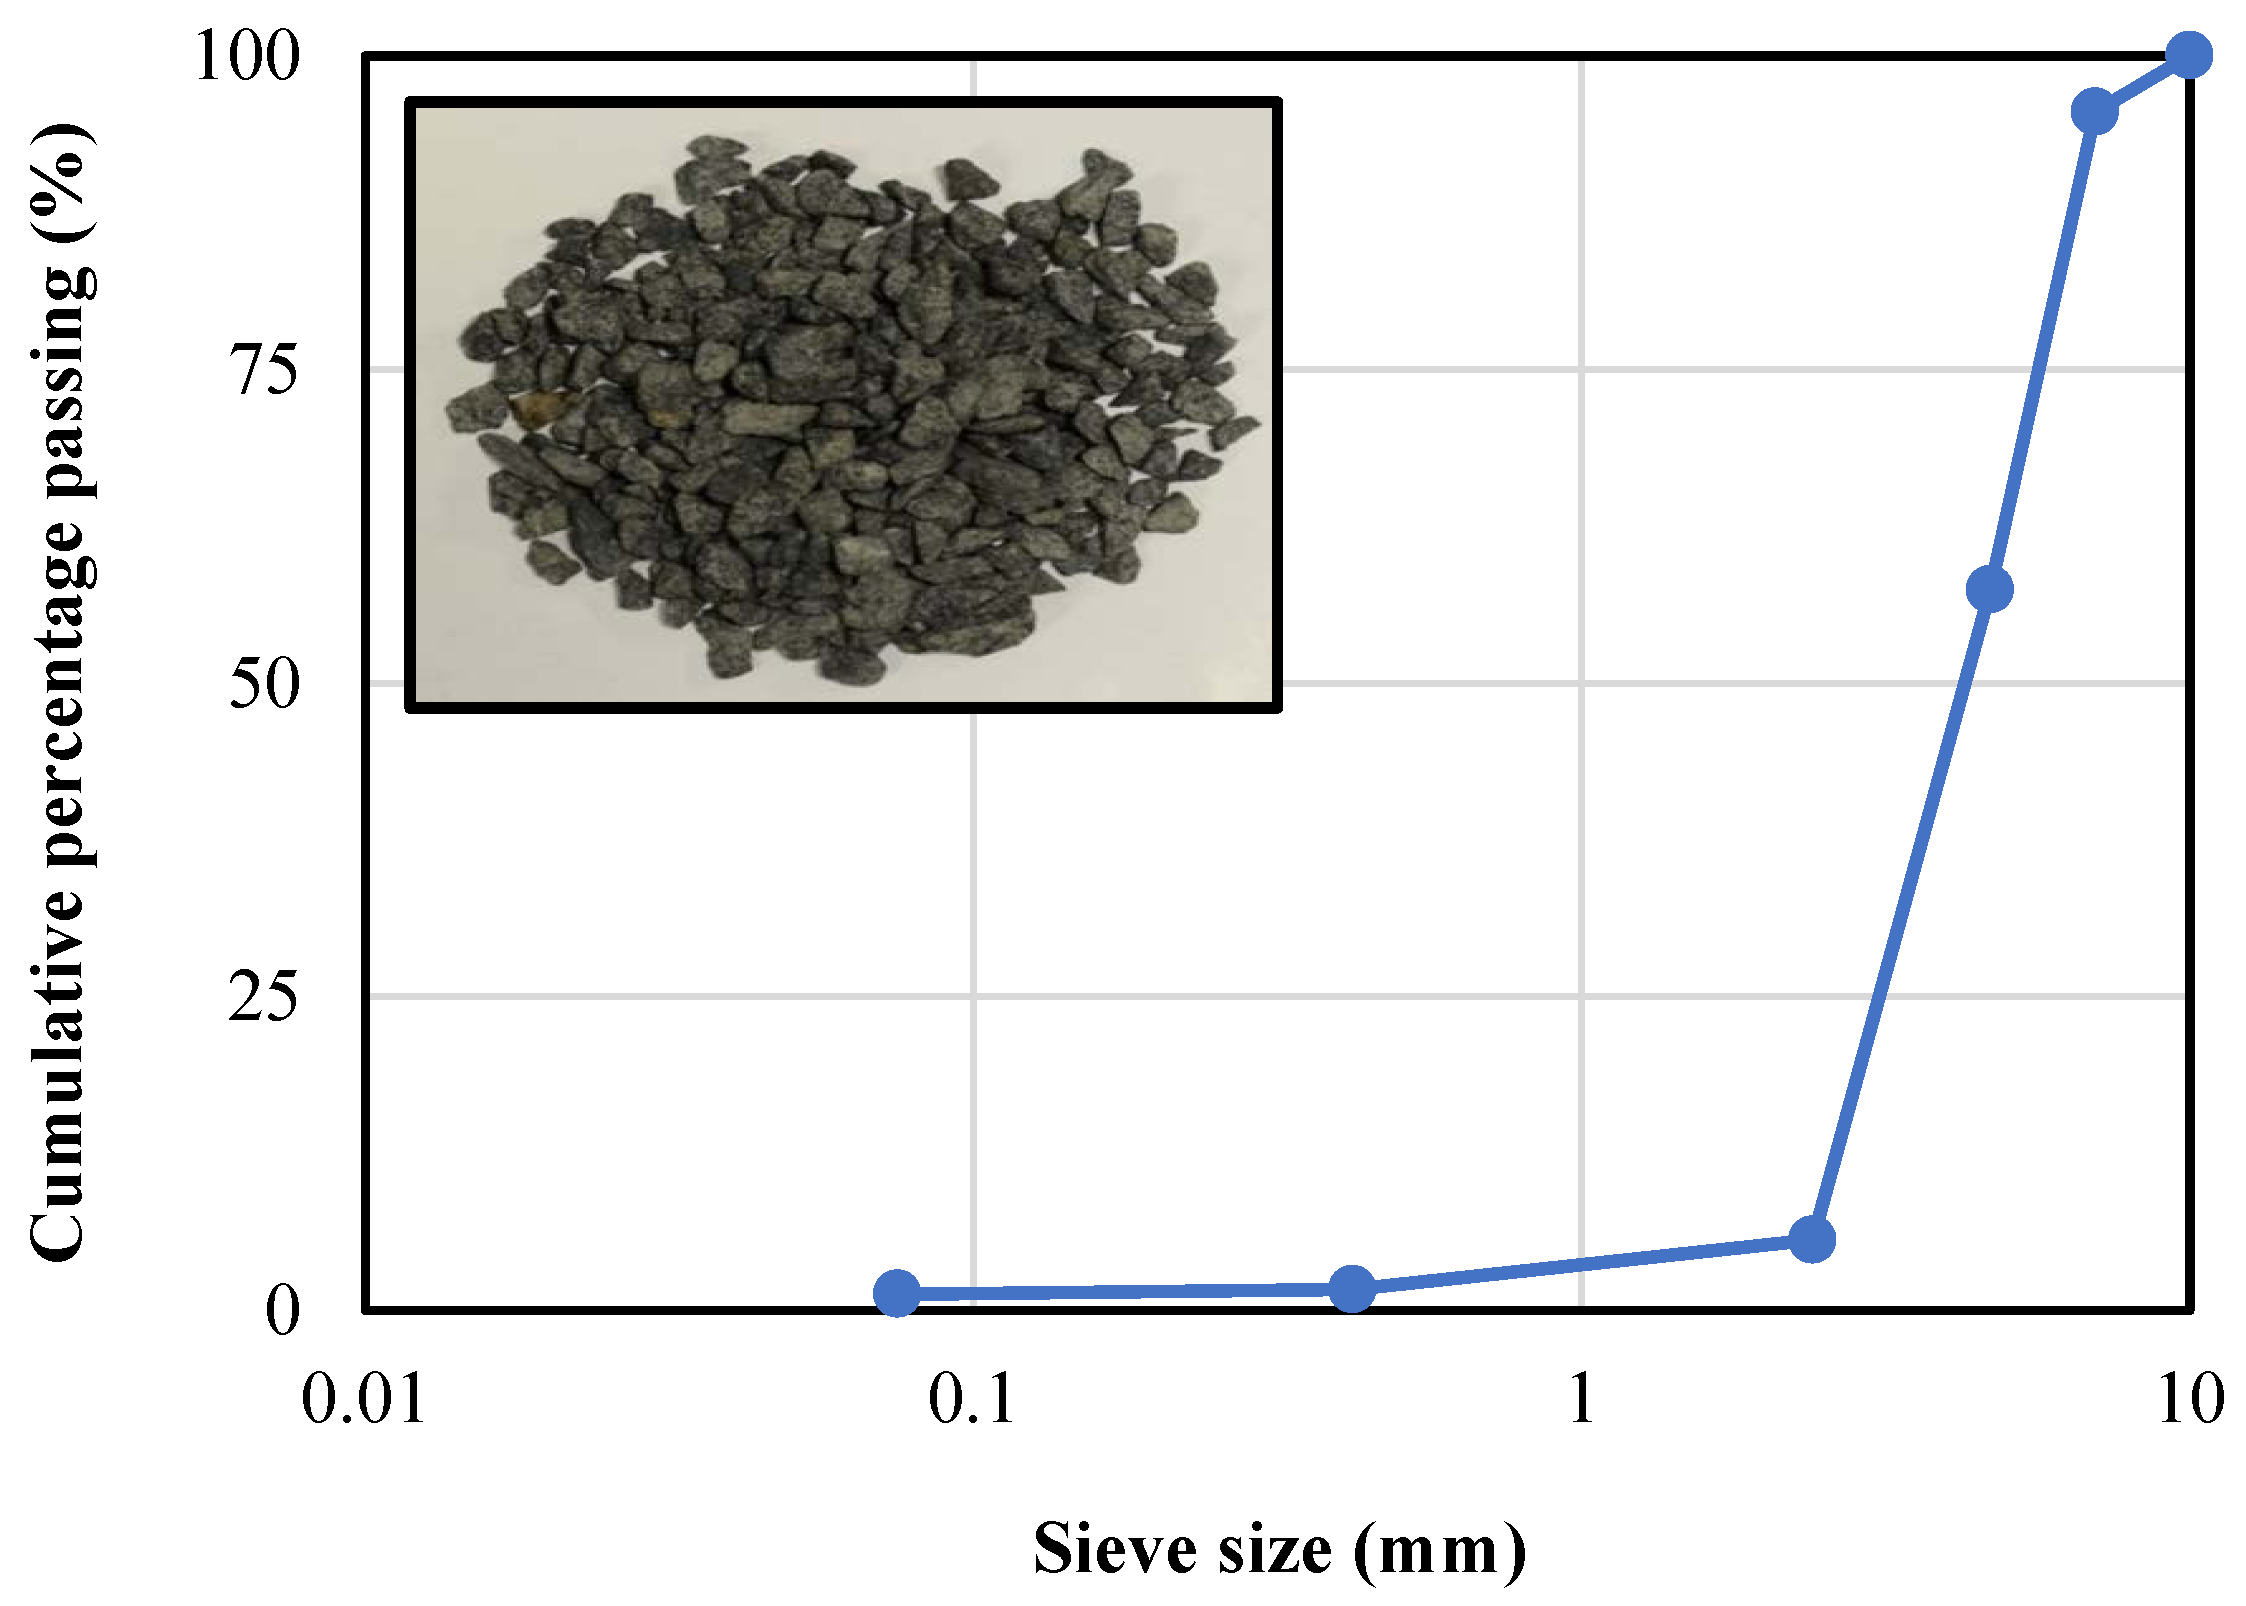
To study the dynamic behavior of GSCSs under the influence of impact loads experimentally, a trench with net dimensions of 2000 × 3800 mm and a depth of 500 mm was dug. The trench had rigid walls and a floor made of an RC raft with thicknesses of 200 mm and 400 mm, respectively. The trench details and dimensions are displayed in Figure 1. Basalt aggregate was delivered from a nearby quarry to be used as a base layer on which the slabs would rest. A sieve analysis test was conducted on aggregate, and it was found that the maximum nominal size was 7 mm. The grain size distribution curve is shown in Figure 2. The elastic modulus, wet strength, dry strength, compressive strength, absorption, and density were also determined and are presented in Table 1.
Figure 1.
Dimensions of trench made for experimental study.
Figure 2.
Grain size distribution curve of basalt aggregate used as a base layer.
Table 1.
Mechanical properties of basalt aggregate sample used under slabs.
The trench was filled with basalt aggregate in two layers, each layer with a thickness of 250 mm. The aggregate was compacted well using a vibrating hammer with an optimal moisture content. The average compaction ratio was calculated at 10 points over the entire area of the trench for each layer and was found to be 96.4% and 95.6%, respectively, for the first and second layers.
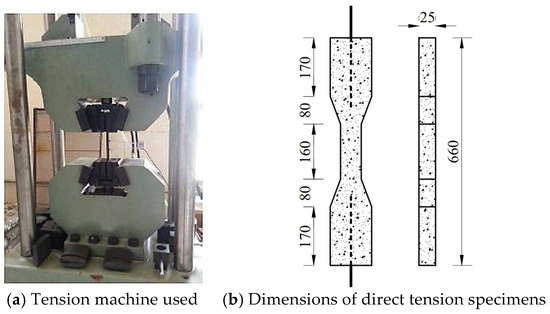
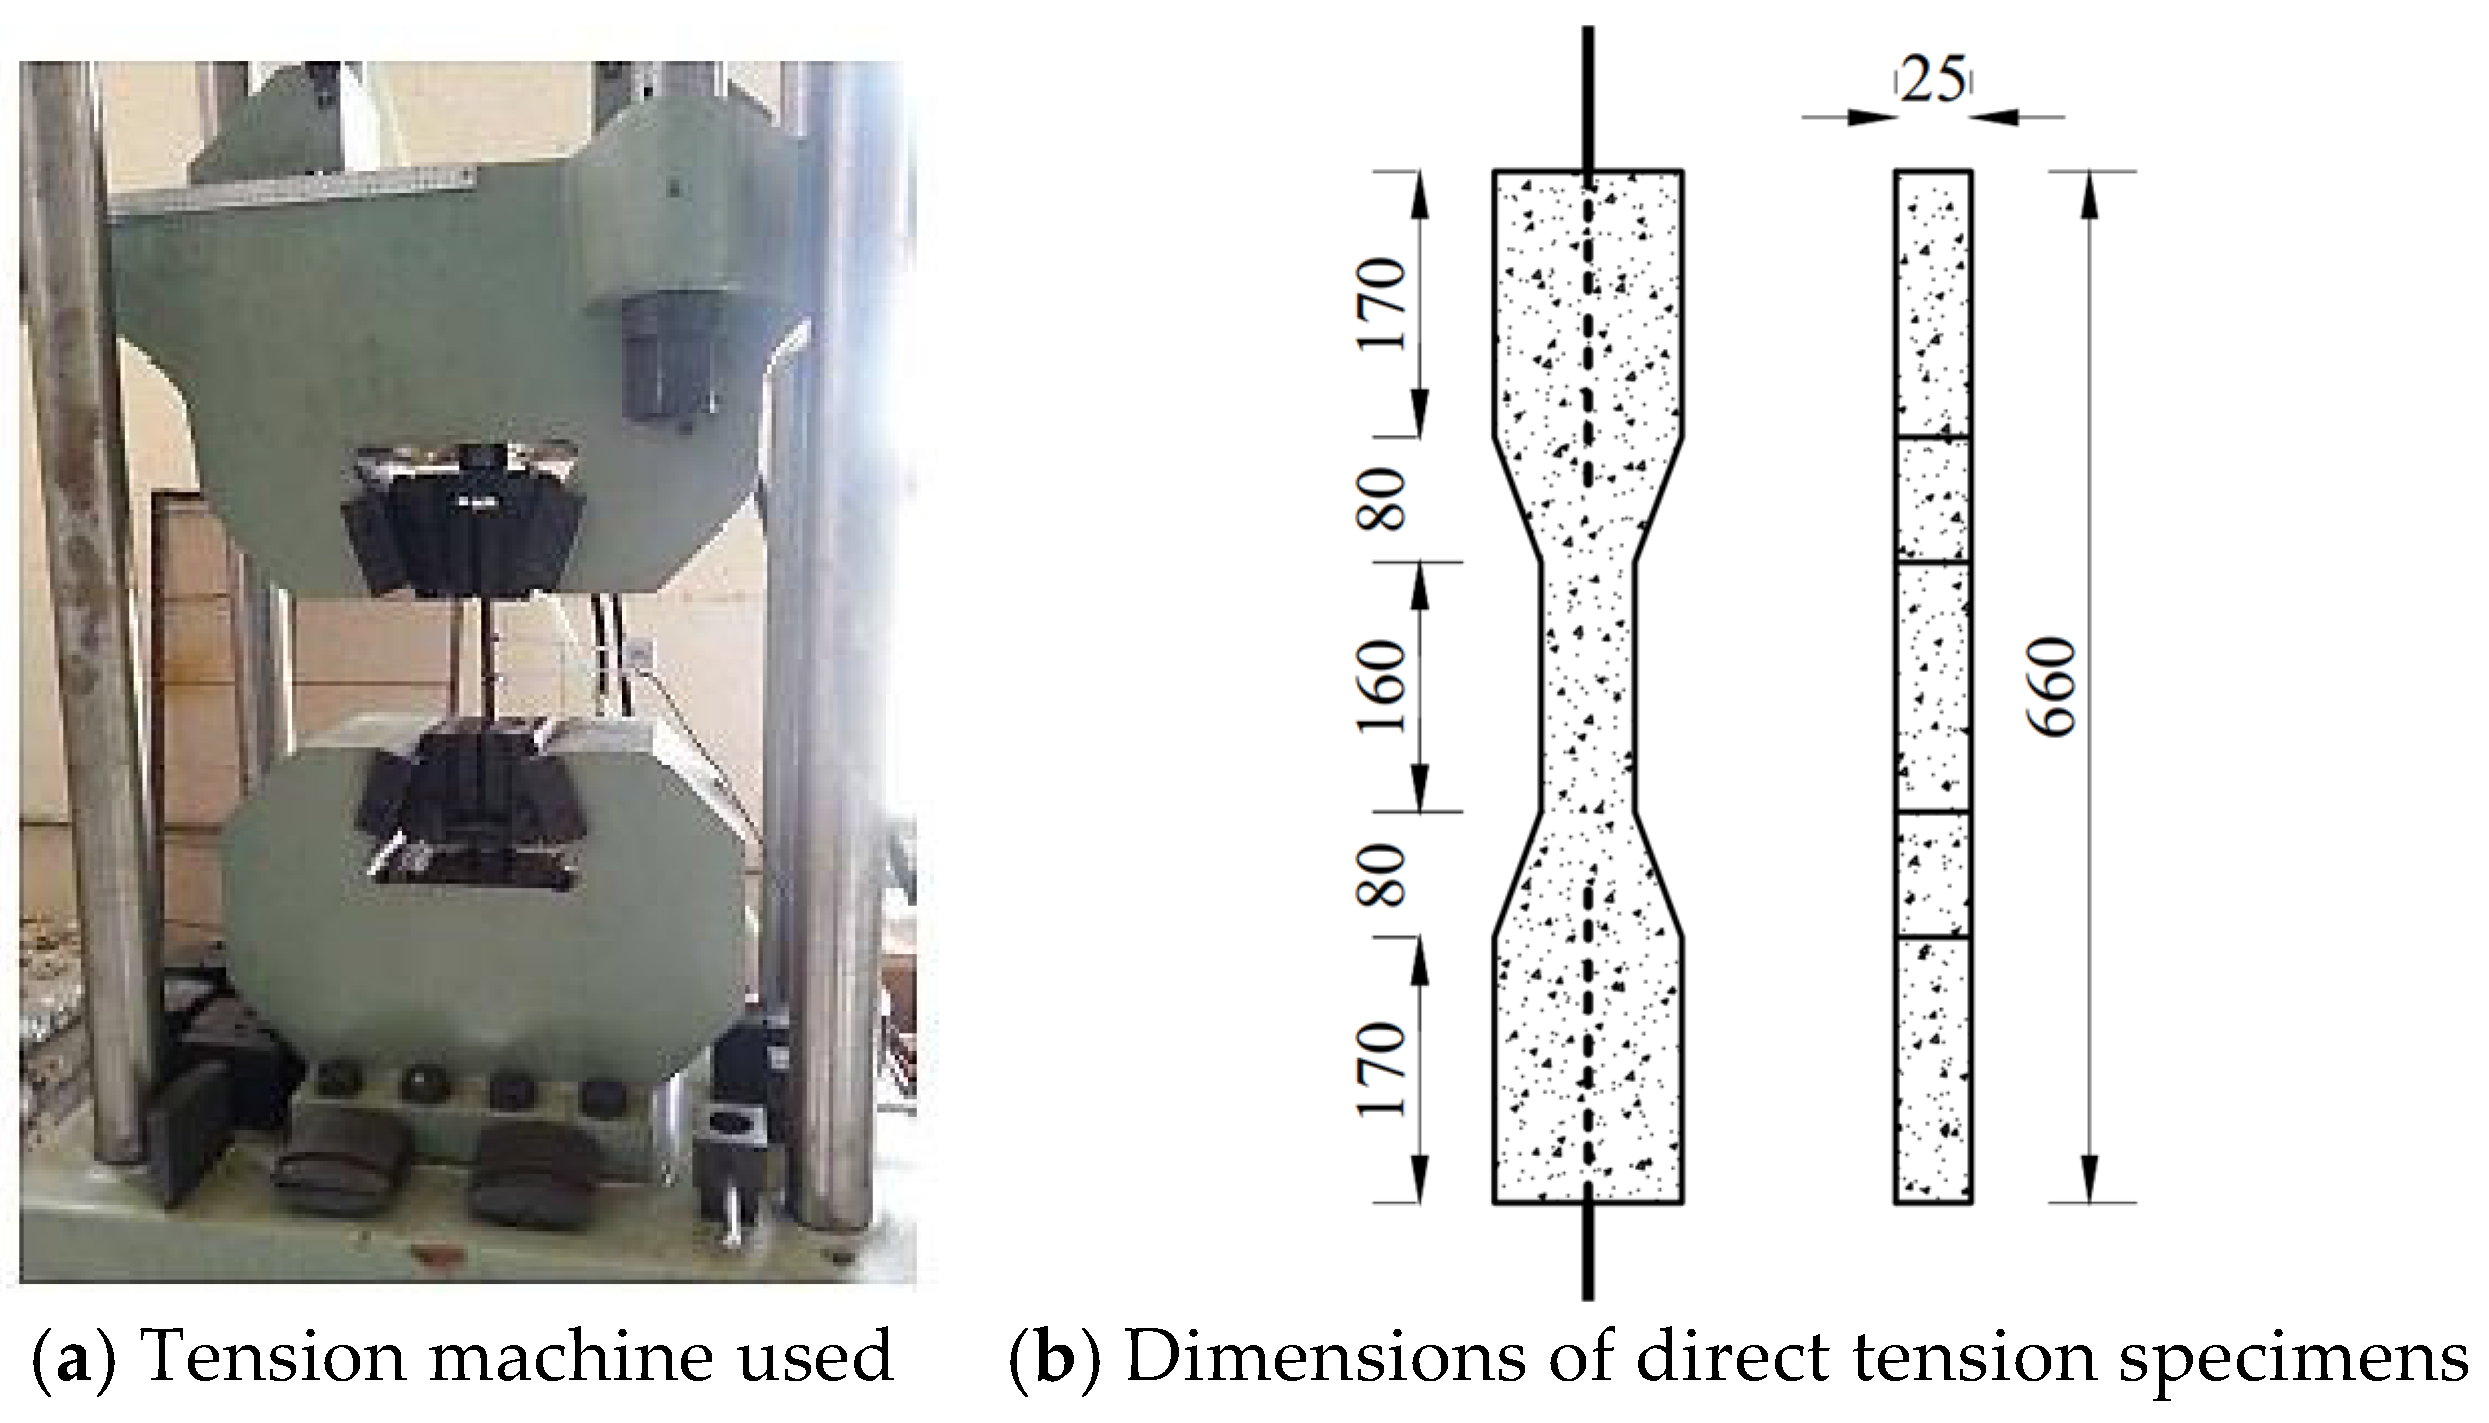
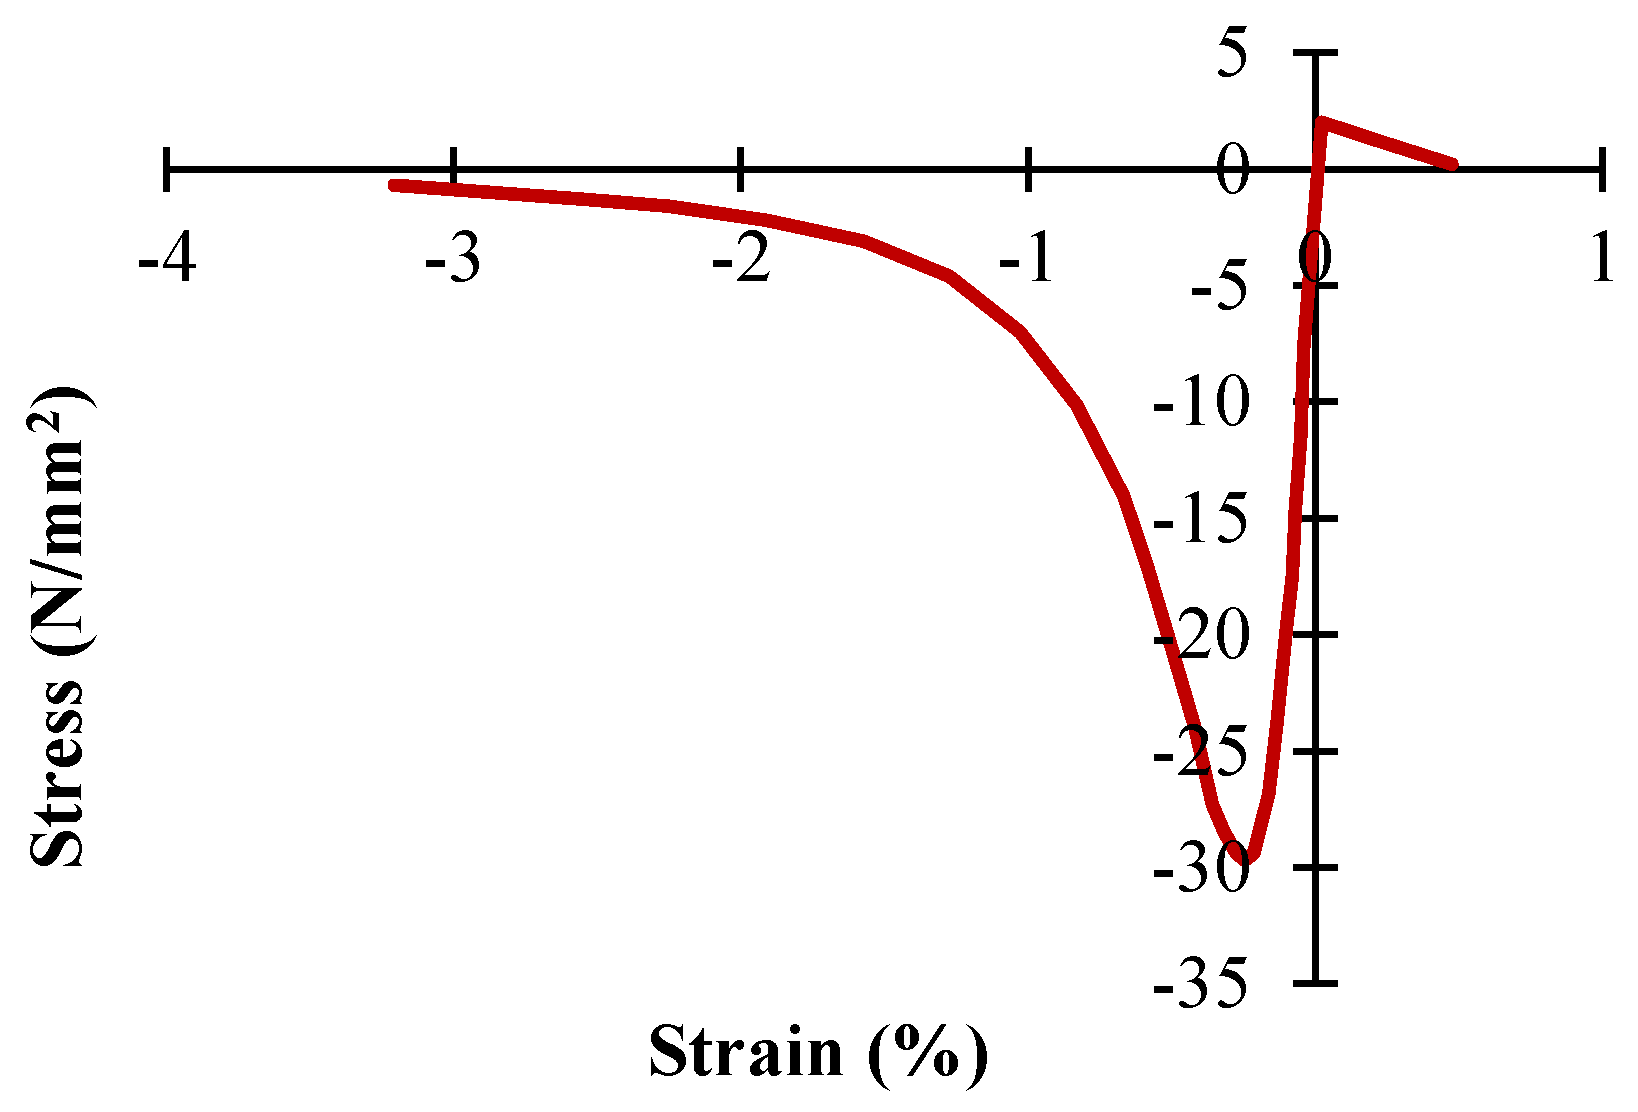
To cast the RC slabs under study designation, a normal concrete mix was designed according to ACI standards [21], targeting a compressive strength of 30 MPa. The mix consisted of ordinary Portland cement type 1, coarse aggregate of basalt with a maximum size of 10 mm, fine aggregate of silica sand, and clean mixing water. Table 2 lists the weights of each component (kg) required to produce one cubic meter of the concrete mix used. At the same time as casting the slabs, six standard cylinders of size 150 mm in diameter × 300 mm in length were cast for compression testing, in addition to casting six specimens of dog-bone-shaped concrete with the dimensions indicated in Figure 3 for direct tension testing [22,23,24]. Compression and direct tension tests were conducted in parallel with the beginning of the slab tests. The results of compression and direct tension tests are presented in Table 3. The average compressive and tensile strengths obtained during tests were 29.7 and 1.89 MPa, respectively. The stress–strain curves in tension and compression for the designed and prepared concrete mix used in this study are illustrated in Figure 4.
Table 2.
Quantities (kg) required to produce 1 m3 of concrete.
Figure 3.
Applied direct tensile test (dimensions are in mm).
Table 3.
Results of compression and direct tension tests.
Figure 4.
Stress–strain curves in tension and compression for concrete.
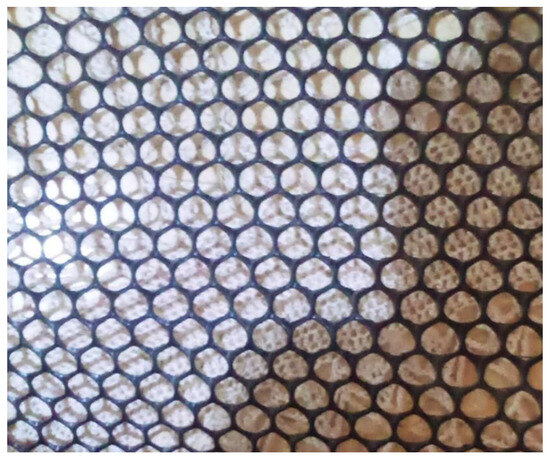
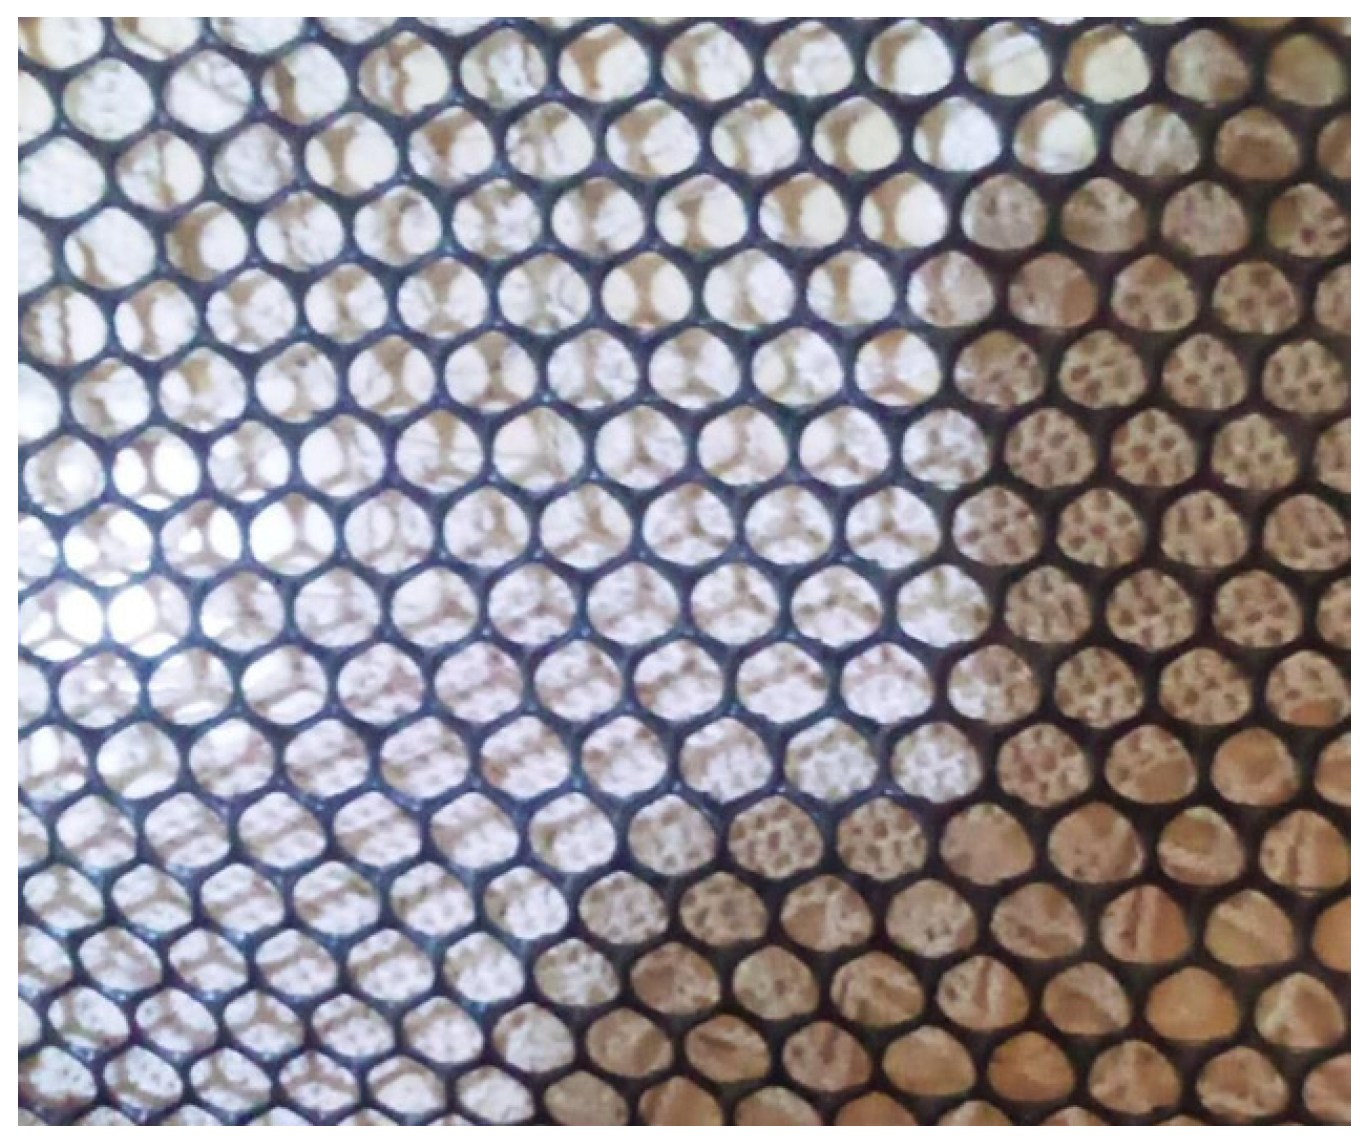
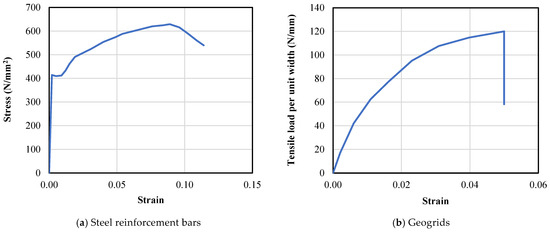
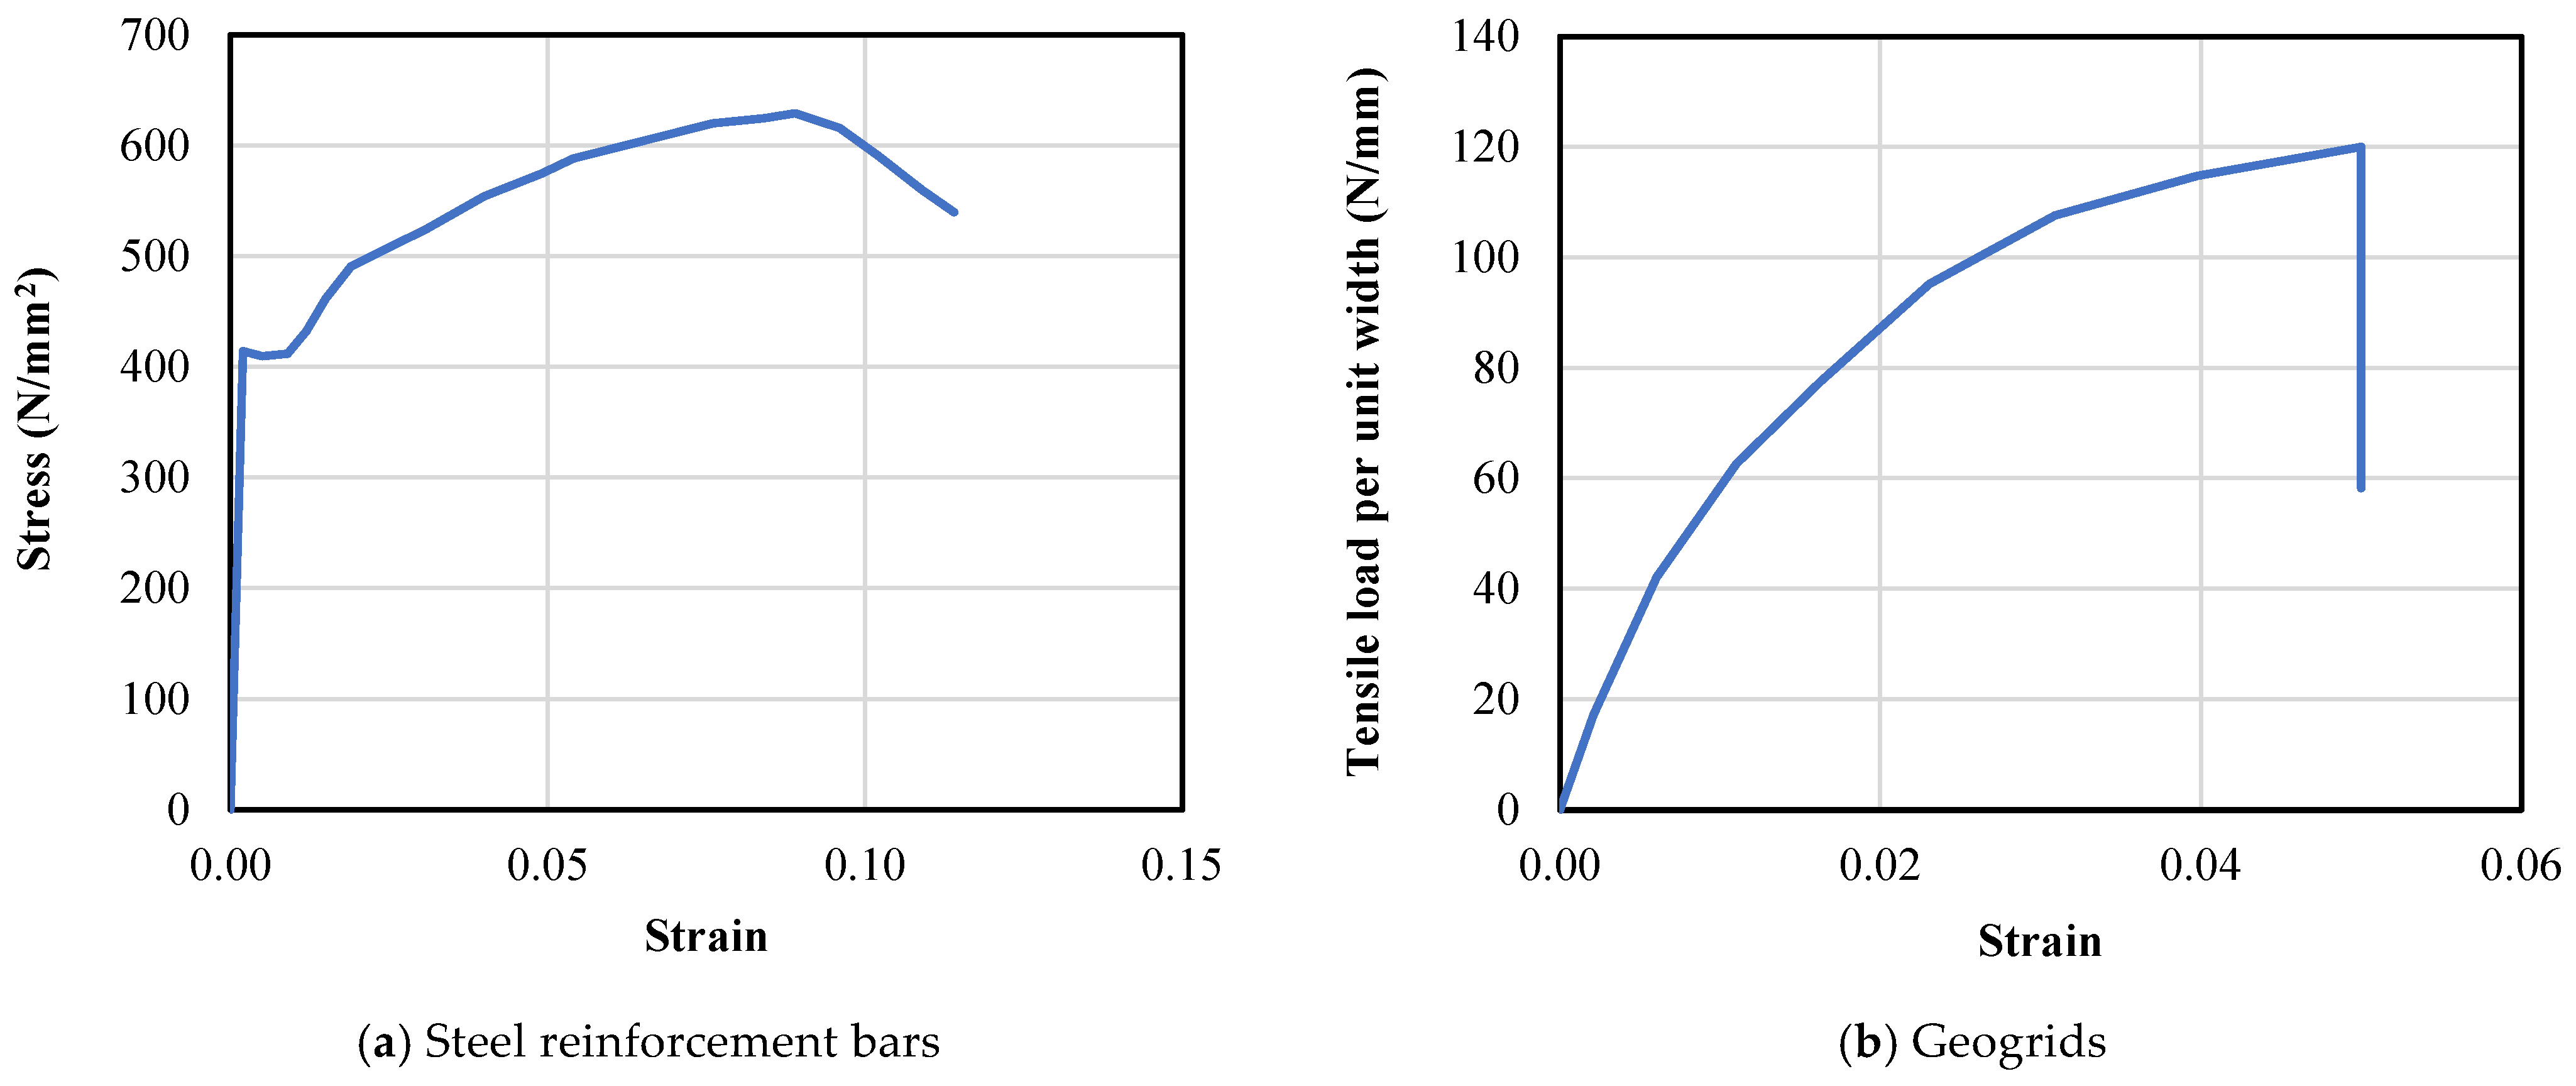
For testing steel bars used as a slab reinforcement, direct tension tests were conducted on three specimens of the steel reinforcement, and then the average yield strength and ultimate strength were recorded and were found to be 413 MPa and 620 MPa, respectively, with a maximum tensile strain of 0.09. The bi-directional geogrid utilized as reinforcement for the slab in this study was made of knitted polyester ribs with a hexagonal shape, as displayed in Figure 5. The factory-specific details are provided in Table 4. The stress–strain curves for both the steel reinforcement bars and the geogrids are demonstrated in Figure 6.
Figure 5.
Bi-directional geogrid.
Table 4.
Mechanical properties of geogrid according to factory data sheet.
Figure 6.
Stress–strain curves for steel reinforcement bars and geogrids.
3.2. Designation of Test Specimens
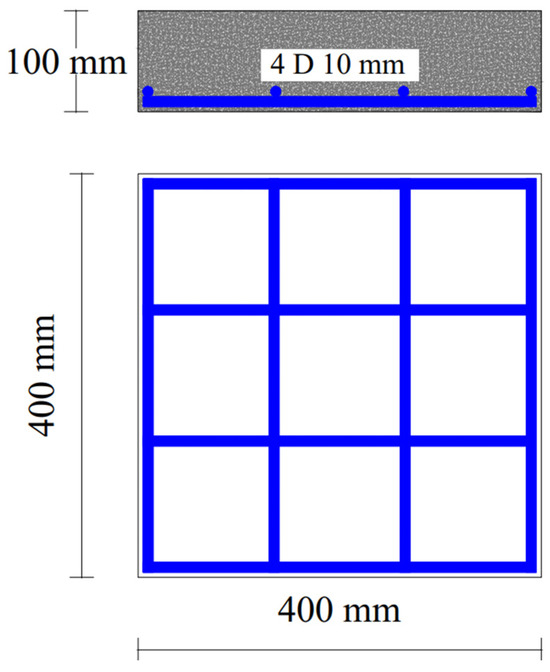
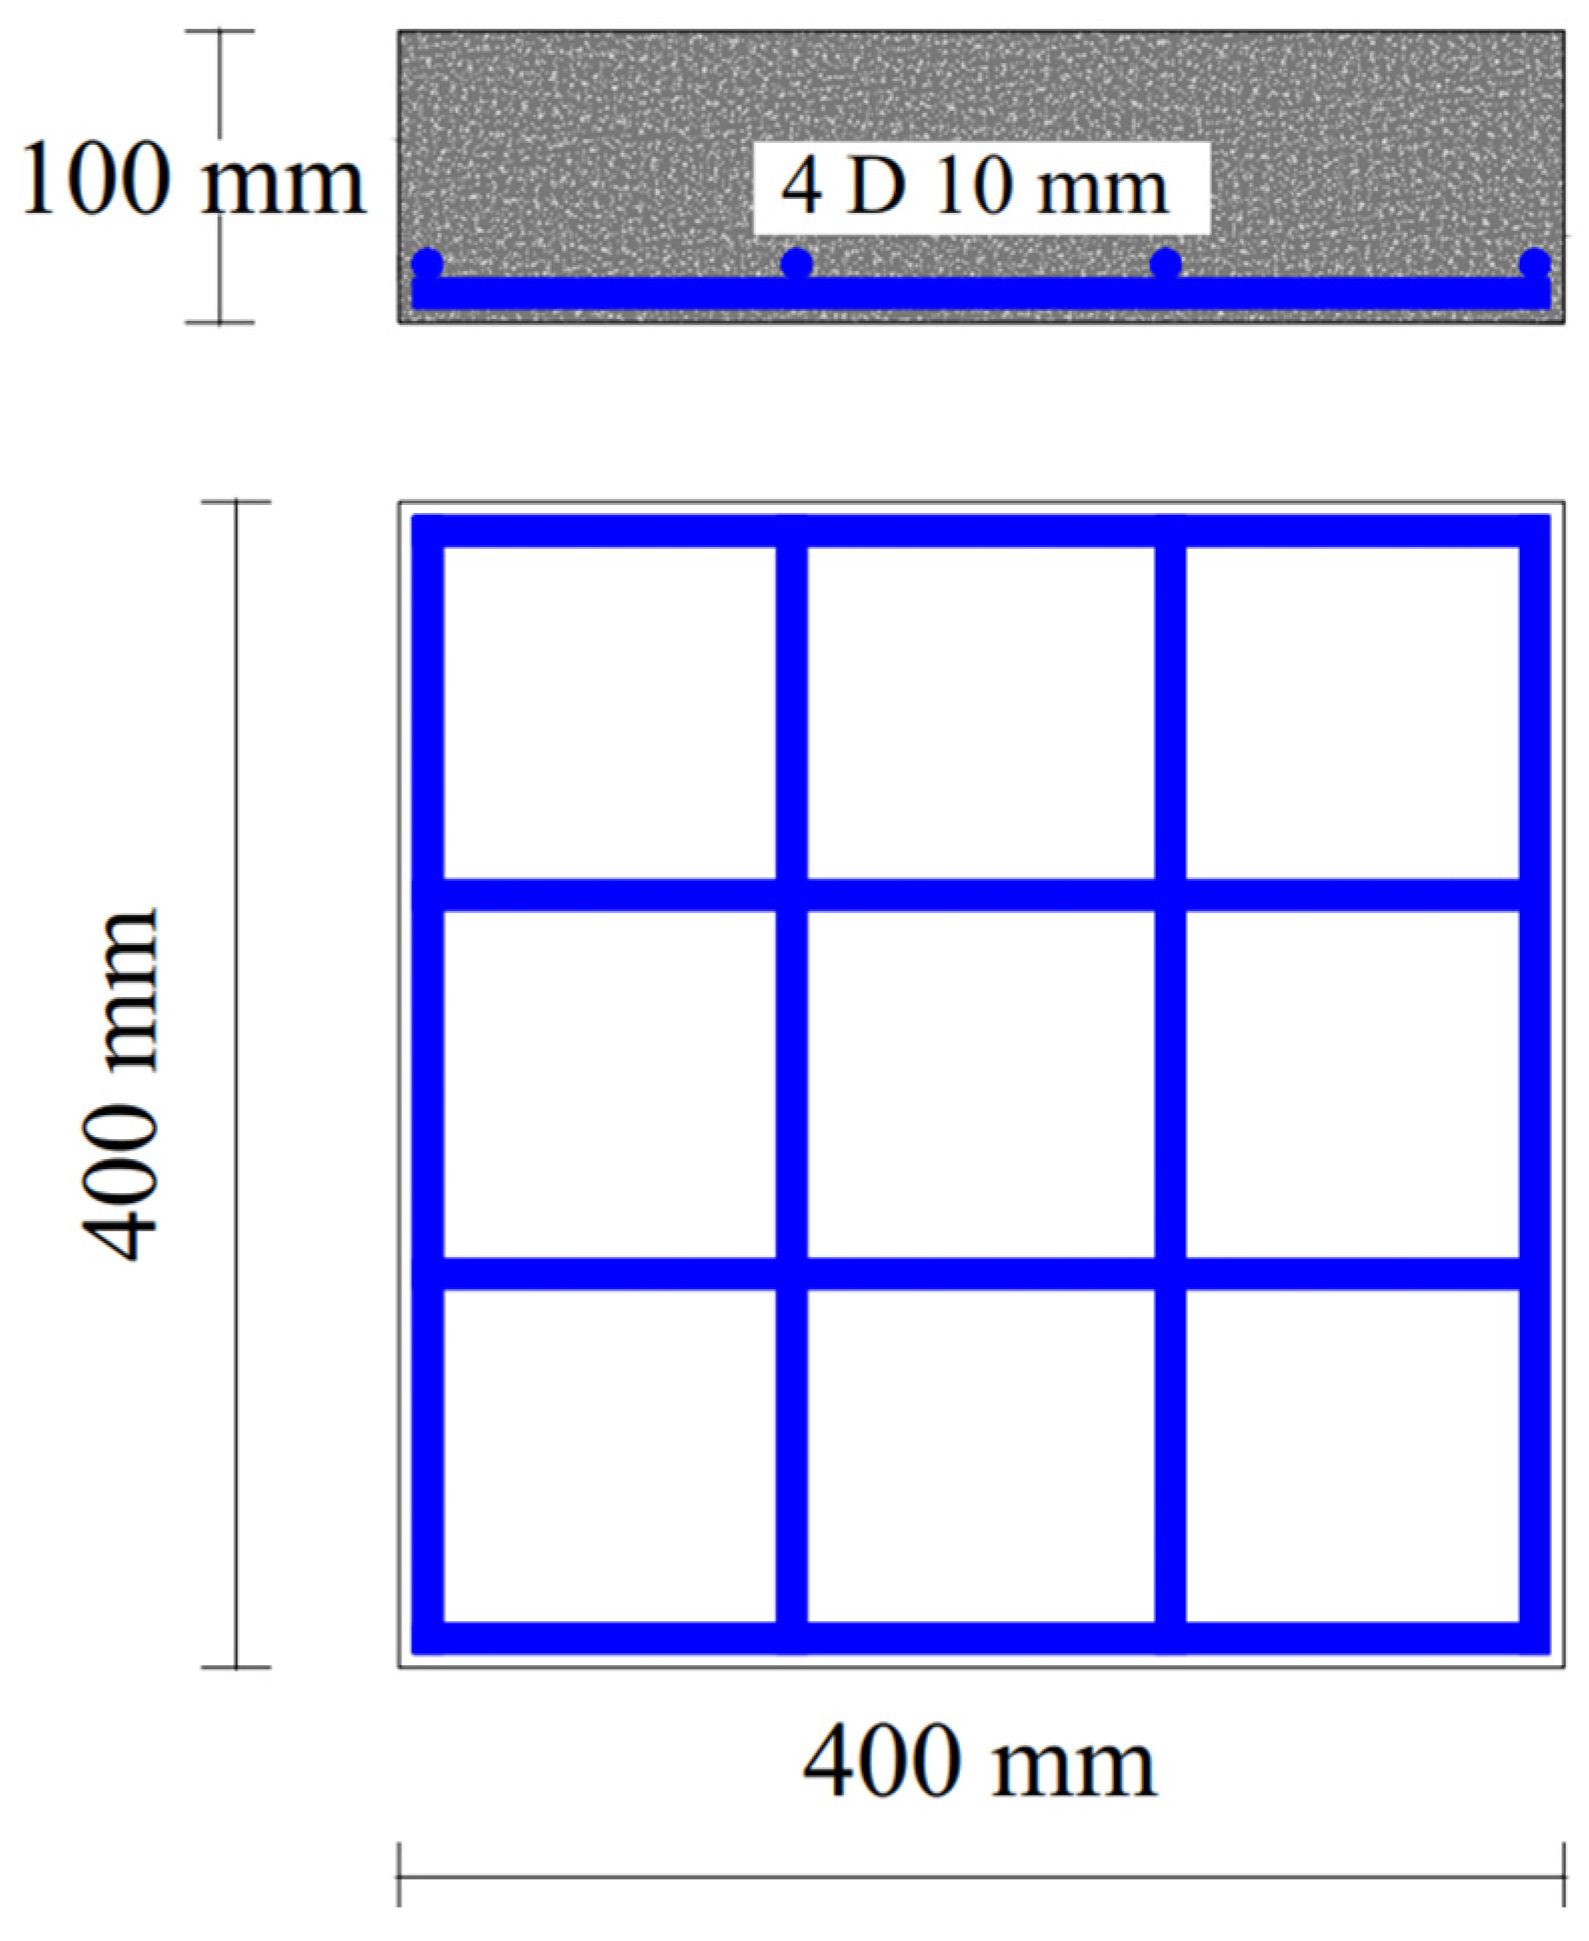
To investigate the behavior of GSCSs under different impact loads, a total of 18 slabs measuring 400 mm × 400 mm with a depth of 100 mm were prepared. The slabs were categorized into six groups: Group 1 was unreinforced; Groups 2 to 5 were reinforced with four bottom steel bars in each direction, with diameters of 6 mm, 8 mm, 10 mm, and 12 mm, respectively; and Group 6 was reinforced with a geogrid, as previously described. Each group was subjected to three different impact loads (applied at three different heights: 1 m, 1.5 m, and 1.75 m), with the details of a representative tested slab illustrated in Figure 7, and the specimen names and group specifications summarized in Table 5.
Figure 7.
Details of one of tested slabs with a 10 mm bar diameter.
Table 5.
Details of tested slabs.
The selected reinforcement diameters (6, 8, 10, and 12 mm) were chosen to represent a practical range commonly used in GSCS applications. These diameters provide a systematic variation in reinforcement ratio, enabling the investigation of structural response across lightly to moderately reinforced conditions. The adopted range was intended to capture the progressive influence of reinforcement on impact resistance, crack development, and failure behavior while maintaining realistic reinforcement ratios consistent with typical engineering practice.
For steel-reinforced slabs (Groups II–V), the reinforcement ratio (ρ) was calculated using the expression ρ = As/(b·d), where As is the total cross-sectional area of steel reinforcement in one direction, b is the slab width (400 mm), and d is the effective depth. The effective depth was determined as d = h − c − (ϕ/2), where h is the slab thickness (100 mm), c is the concrete cover (10 mm), and ϕ is the bar diameter. Accordingly, the effective depth varies slightly depending on the bar diameter used (6, 8, 10, and 12 mm), and this variation was considered in calculating the corresponding reinforcement ratios.
For the geogrid-reinforced slabs (Group VI), the parameter G* represents the areal mass of the geogrid (kg/m2) rather than a conventional reinforcement ratio. Due to the distributed nature of geogrid reinforcement, which does not have a discrete cross-sectional area comparable to steel bars, a direct equivalence with the steel reinforcement ratio (ρ) is not applicable. Therefore, G* is reported as an independent parameter, and comparisons between steel and geogrid reinforcement are based on their observed structural performance rather than equivalent reinforcement ratios.
3.3. Preparation of Test Slabs
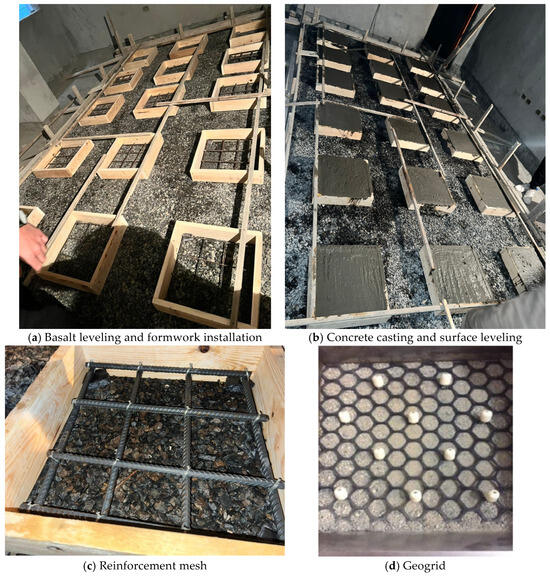
To prepare the GSCS specimens, first, the surface of the crushed basalt in the trench was leveled to ensure that it was completely horizontal. Then, the wooden formwork was placed on the leveled basalt; thereafter, the prepared reinforcement mesh and geogrid were placed inside it, leaving a concrete cover of 10 mm. Following that, the surface of the crushed basalt and the wooden formwork were sprayed with water, and then the concrete was poured. Curing was carried out by spraying water on the slabs for 28 days. Figure 8 shows the wooden formwork with the reinforcement mesh and geogrid inside it and the casting work.
Figure 8.
Placement of reinforcement mesh and geogrid within wooden formwork and slab casting.
3.4. Test Setup and Design
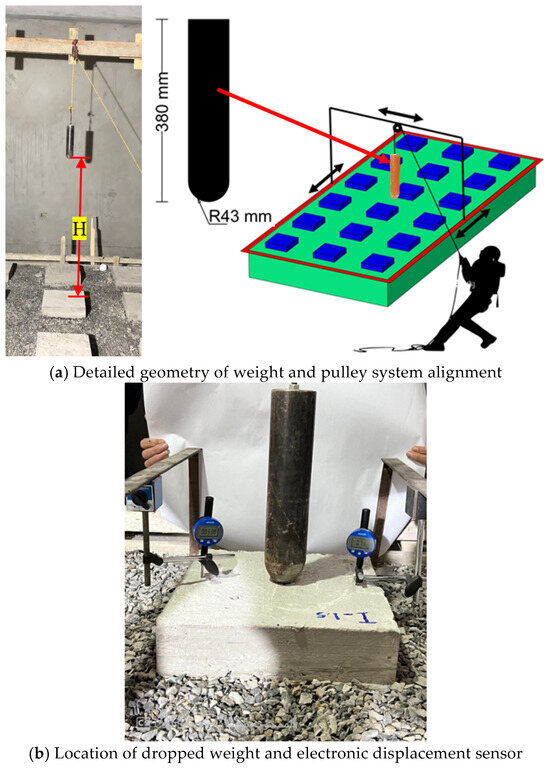
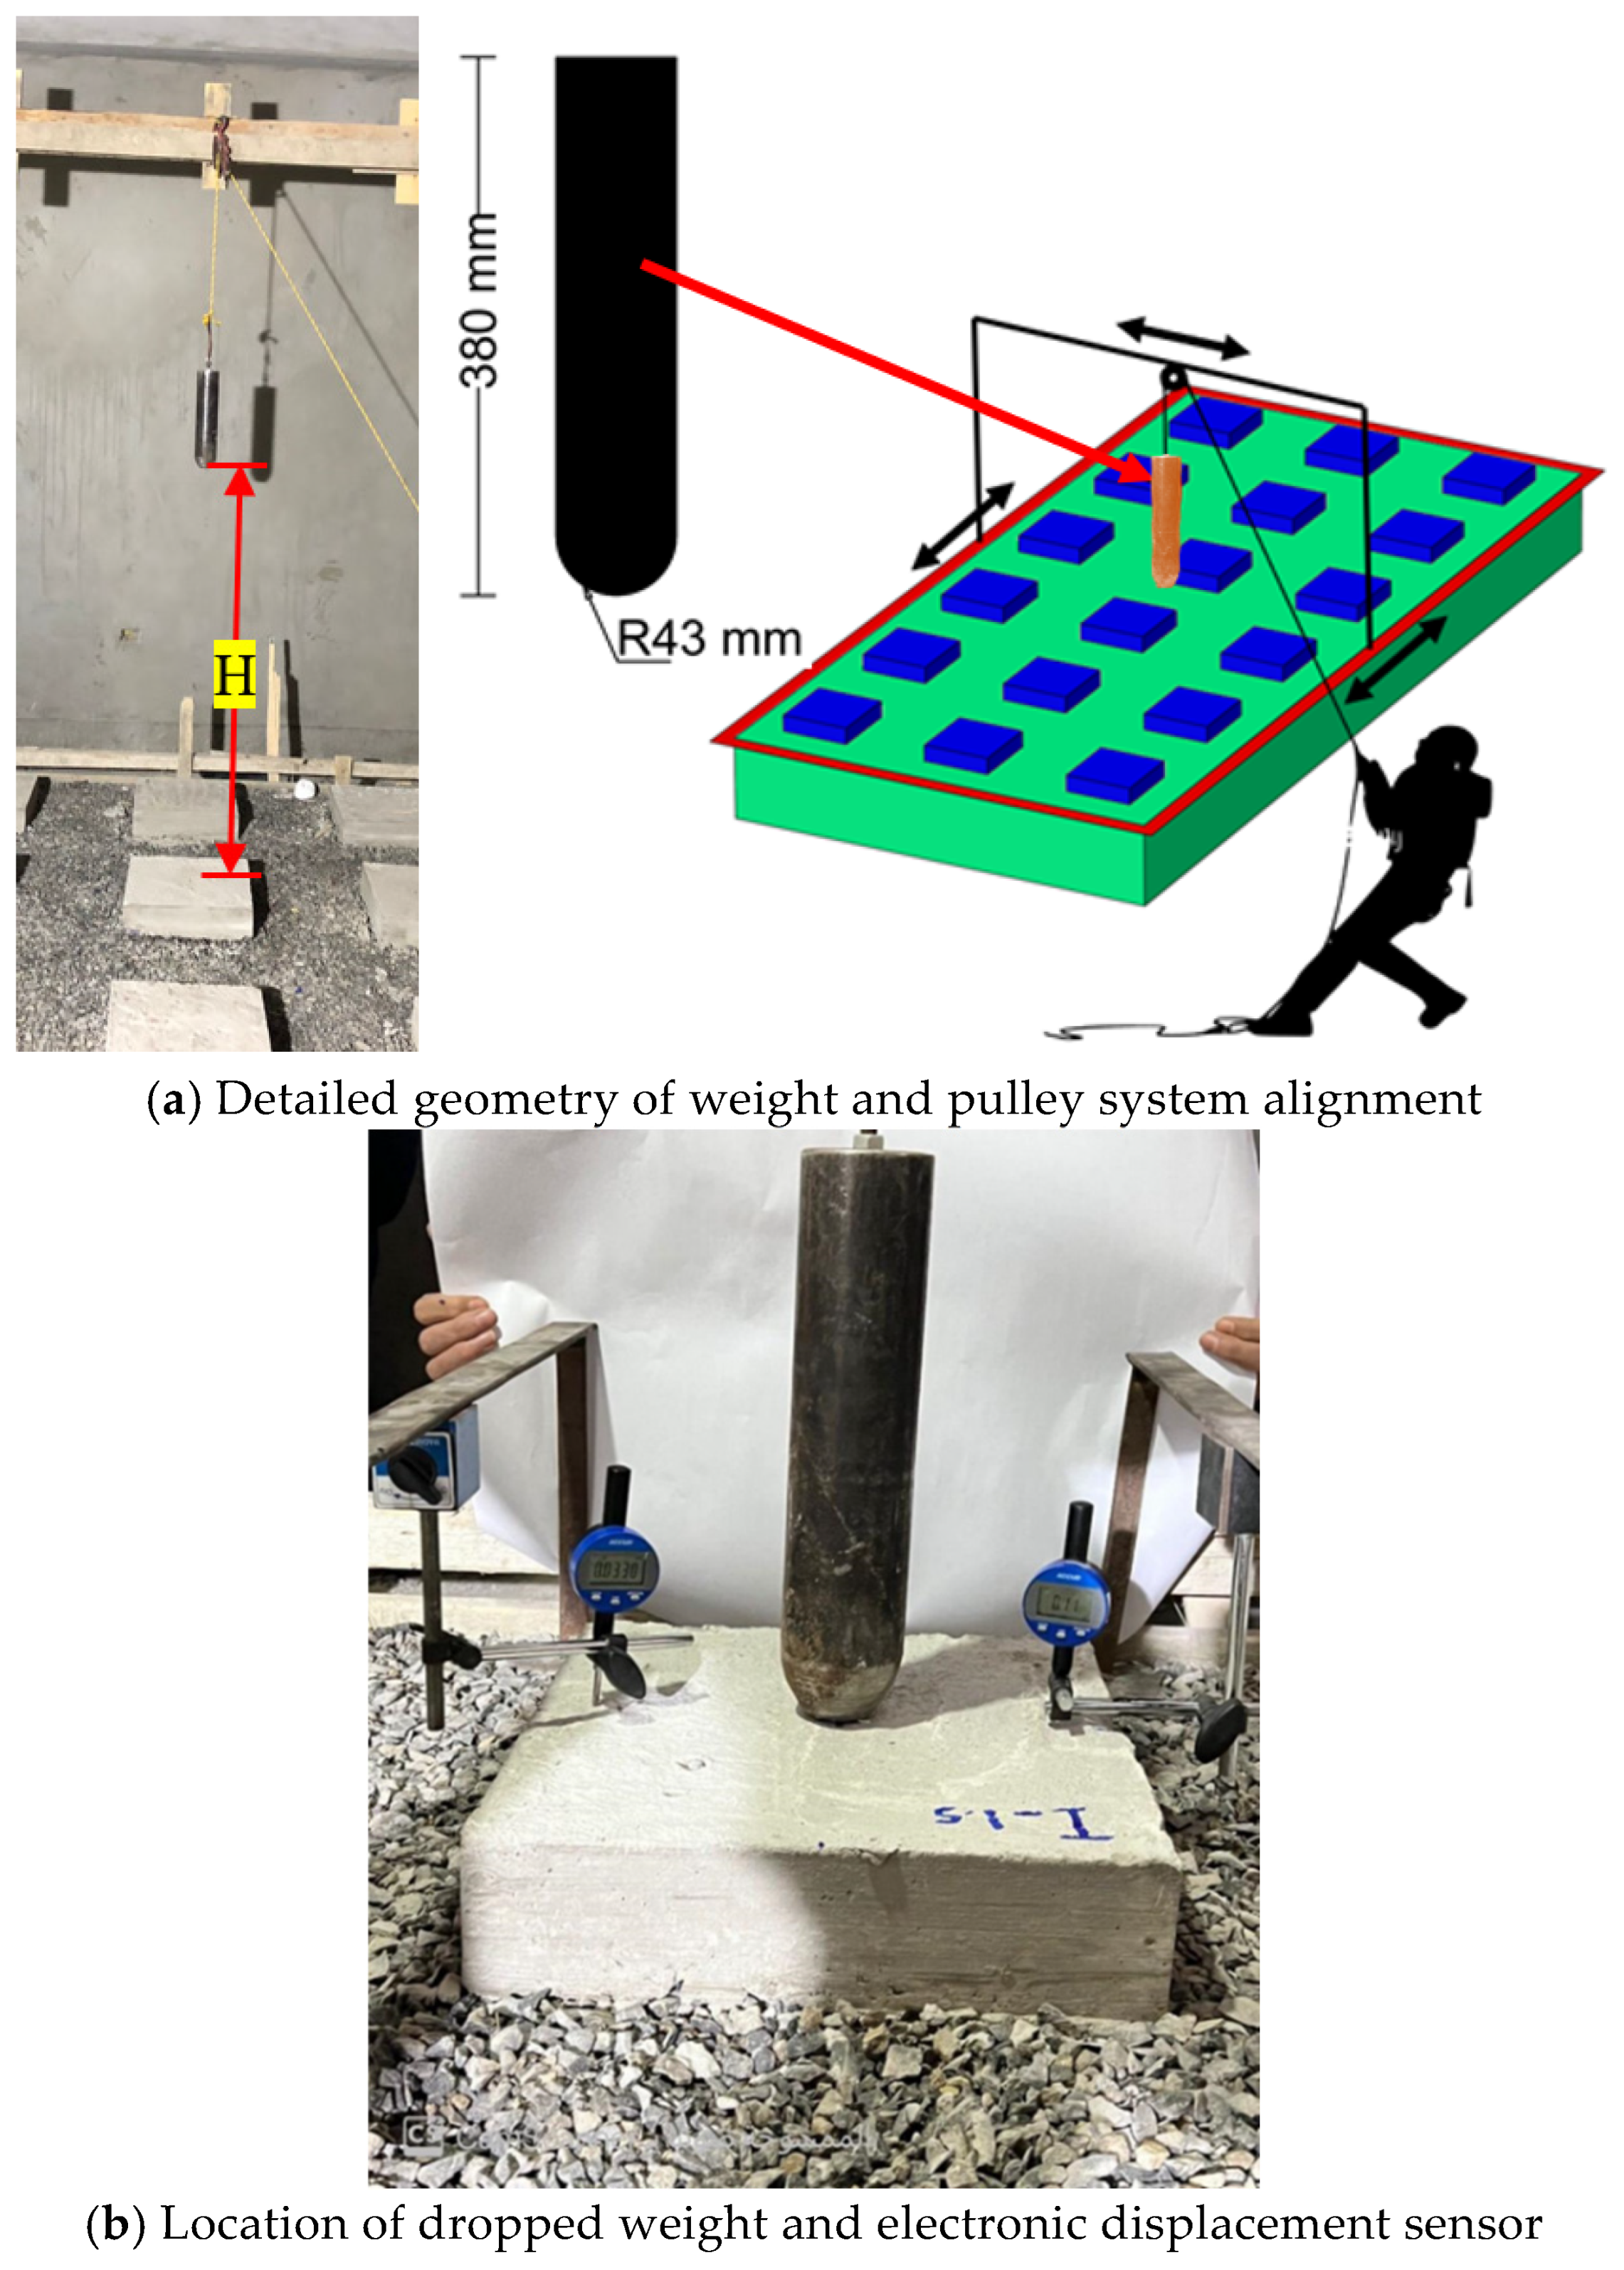
The prepared GSCSs were tested under repeated impact loading using a specially designed wooden frame setup. The frame had a height of 2 m and was capable of moving in a single direction, along the length of the trench, allowing forward and backward positioning. At the top beam of the frame, a pulley system was installed, which could be adjusted laterally (left and right) to ensure precise alignment with the target point on the slab surface (see Figure 9a). A strong rope passed through the pulley, from which a cylindrical steel weight was suspended. This weight, with a mass of 15 kg, a diameter of 86 mm, and a height of 380 mm, was designed to deliver controlled impact energy to the test slabs. The detailed geometry of the weight is also illustrated in Figure 9a. To ensure accuracy in positioning, a plumb bob was utilized so that the weight could be released exactly at the center of the slab.
Figure 9.
Designed wooden frame setup for applying impact load.
For each test, the weight was first raised to a specific height (H), measured as the vertical distance between the bottom of the weight and the top surface of the slab. The weight was then released to free fall under gravity, striking the slab surface from the predetermined height. Three drop heights were adopted in the testing program: 1.0 m, 1.5 m, and 1.75 m, as presented in Table 5. The weight was repeatedly dropped from a constant height until the tested slab reached failure or complete collapse. After every impact, the permanent deformation of the slab surface was recorded using an electronic displacement sensor. This sensor was placed directly on the slab surface, while its opposite end was fixed to a rigid, immovable steel frame to ensure accurate displacement readings (see Figure 9b). It is important to note that all impact tests were conducted 46 days after the casting of the slabs, ensuring that the concrete had achieved sufficient curing and strength development before loading.
4. Results and Discussion
4.1. Crack Initiation and Failure Progression
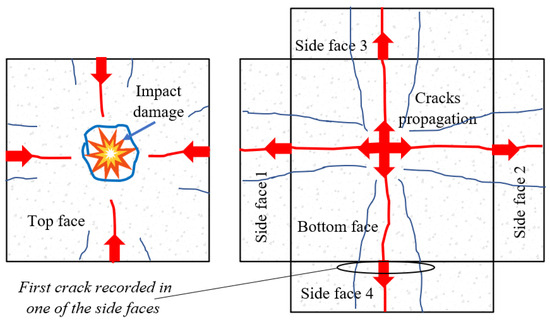
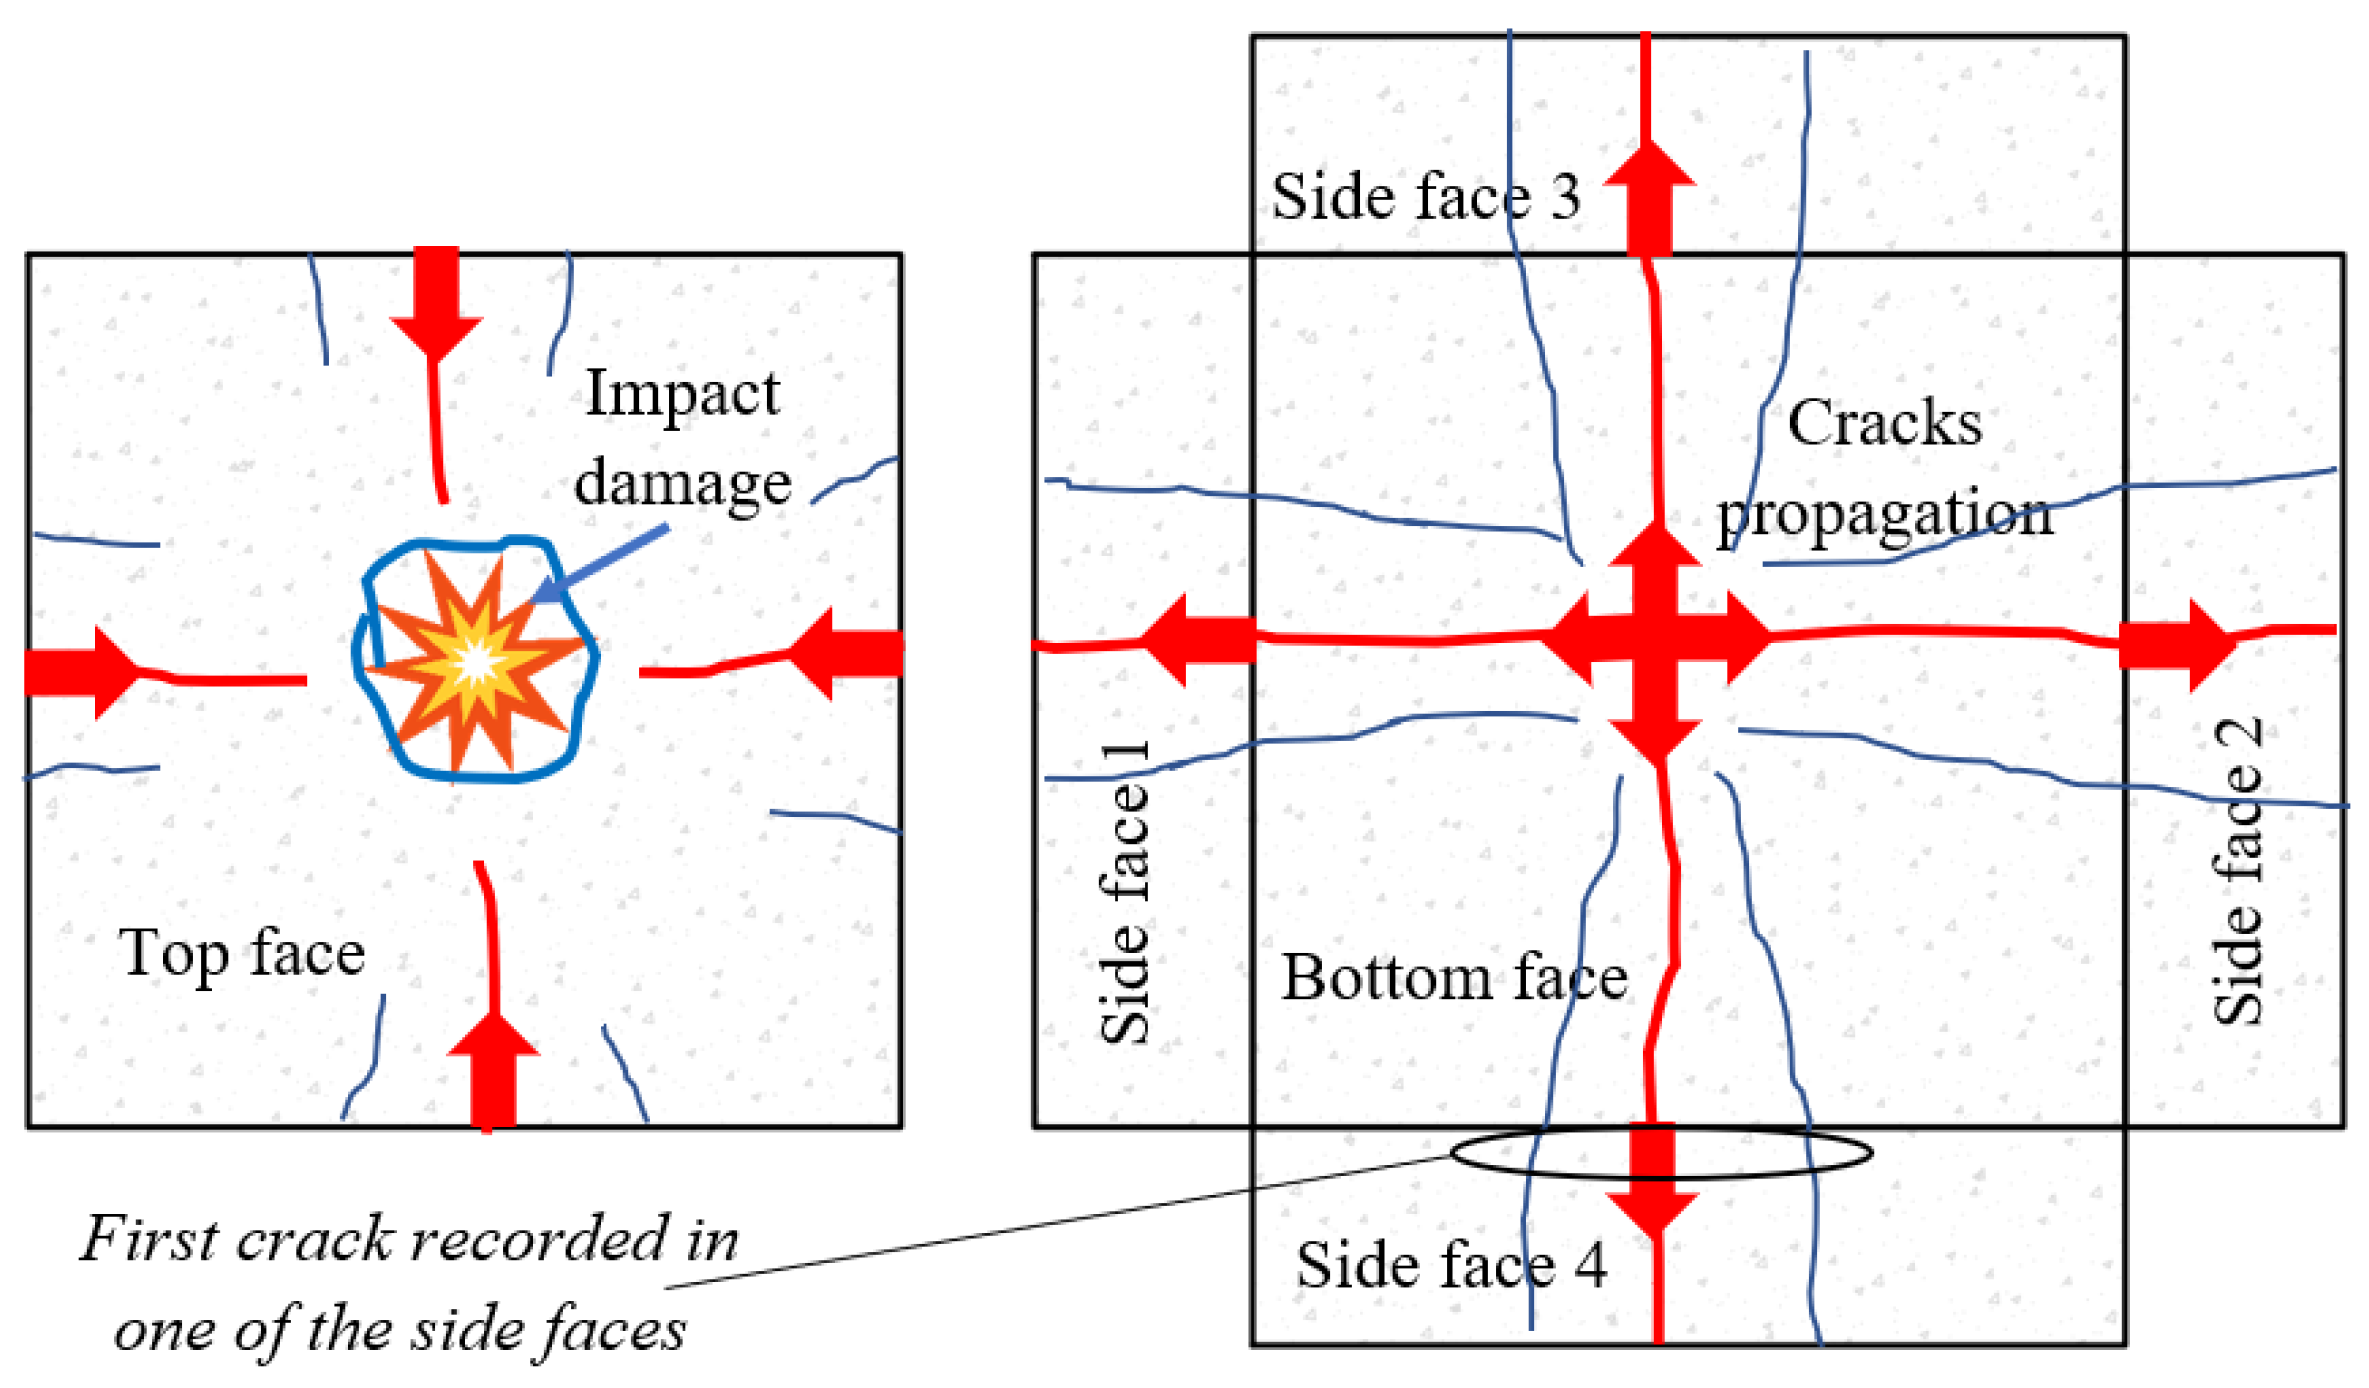
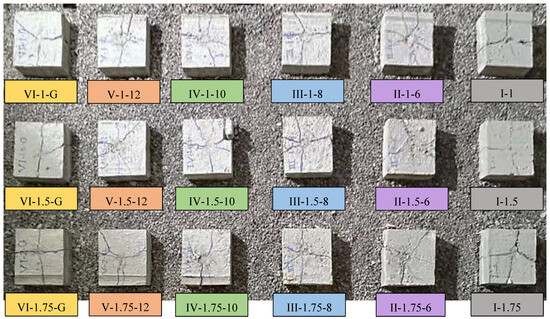
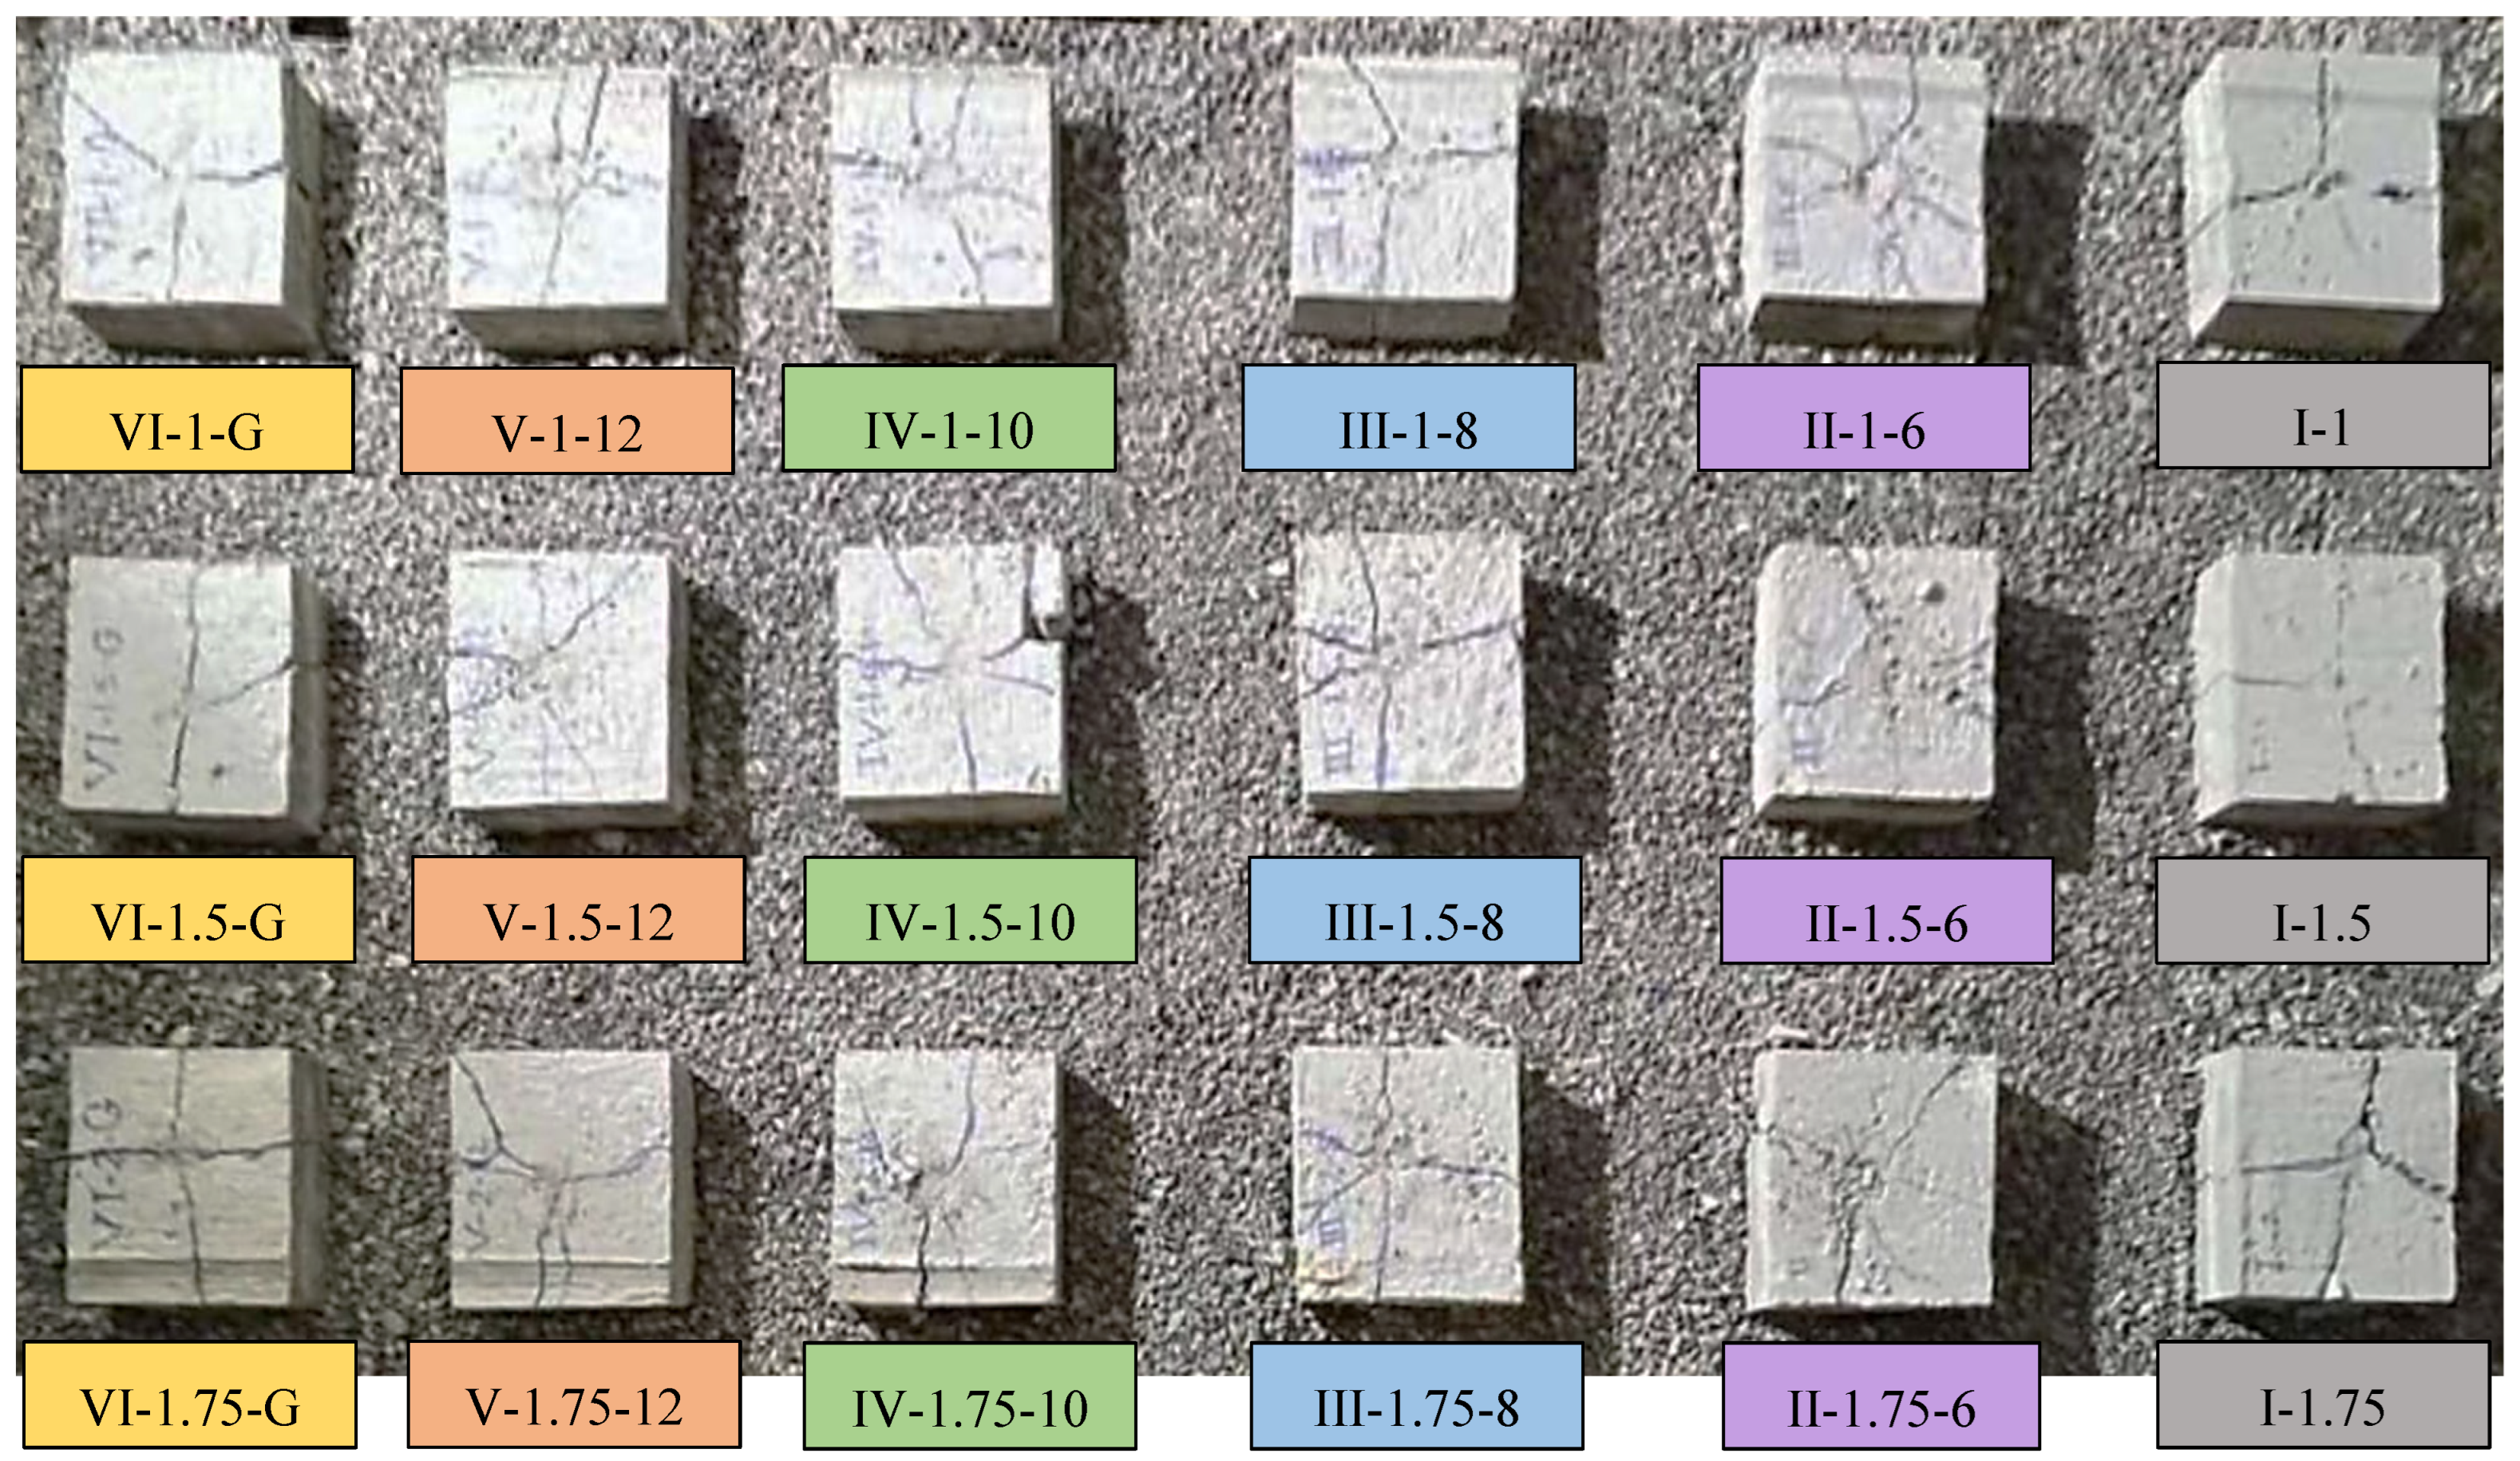
The failure sequence of all slabs exhibited a comparable pattern under repeated impact loading. As displayed in Figure 10, the first visible deterioration occurred at the center of the top surface, where the steel weight directly struck. This localized damage appeared in a semi-circular shape, with its severity diminishing gradually as it moved further from the impact point. With an increasing number of drops, this deterioration zone expanded, and cracks developed in a systematic manner. Four distinct cracks initiated at the center of the bottom surface of the slab and then propagated in two orthogonal directions corresponding to the principal axes of the slab. These cracks extended outward until they became visible on the side faces, after which they progressively moved upward through the depth of the slab. Eventually, the cracks reached the top surface and converged at the impact location, forming a continuous failure path. The test was terminated when this convergence was achieved. Figure 10 illustrates this typical progression pattern for the tested slabs, and Figure 11 shows the failure modes of all tested slabs.
Figure 10.
Typical crack progression pattern for tested slabs.
Figure 11.
Failure modes of all tested slabs.
4.2. Influence of Reinforcement on Crack Development
The cracking patterns revealed clear differences between reinforced (i.e., either reinforced with steel reinforcement bars or geogrid made of knitted polyester ribs) and unreinforced slabs. In the unreinforced specimens, four dominant cracks developed from the impact point and then spread outward in a cross-shaped configuration. In contrast, the reinforced slabs displayed a larger number of cracks, many of them diagonal, which reflects the restraining influence of the steel reinforcement bars.
Two critical parameters were extracted from the test for each slab: the first crack stage (Ncr, Δcr), defined as the number of drops and the corresponding displacement at which the first visible cracks appeared on the side surfaces, and the ultimate stage (Nu, Δu), which marked the number of drops and displacement at failure. The results of these measurements are summarized in Table 6. From these parameters, two performance indices were computed: DF = Δu/Δcr and ISF = Nu/Ncr. ISF measures the slab’s capacity to withstand repeated impact loads after cracking begins. It demonstrates the structural reserve capacity from the beginning of cracking to the final failure. A specimen with a higher ISF can withstand more impact cycles after failure initiation before losing its ability to support loads. DF measures a slab’s capacity to undergo further deformation after its initial cracking phase before its eventual failure. In essence, it measures the ability of the slab to absorb energy through deformation rather than by strength. Higher DF values signify more ductile behavior and greater capacity to dissipate impact energy without sudden collapse. From Table 6, DF values varied between 2.67 (I-1) and 5.61 (III-1.75-8 and IV-1.75-10), indicating substantial differences in post-cracking deformability.
Table 6.
Summary of experimental program results.
The DF for each tested slab varied significantly, as displayed in Table 6, ranging from 2.67 for specimen I-1 to 5.61 for specimens III-1.75-8 and IV-1.75-10. Notable variations in post-cracking deformability are seen in this broad range. Slab I-1, for instance, had a DF of 2.67 and an ISF of 10.60, demonstrating low ductility and a more brittle response after cracking initiation. Slab V-1.75-12, on the other hand, recorded an ISF value of 12.18 while achieving a markedly better ductility value of DF = 5.50.
These results highlight an important trend: while reinforcement increases the number and distribution of cracks, it also changes the overall failure mechanism. The application of reinforcement enables slabs to experience progressive energy dissipation during failure stages, which extends their deformation capacity before structural collapse occurs.
The observed behavior can be attributed to the mechanisms of stress redistribution and progressive energy dissipation under repeated impacts. In reinforced slabs, the presence of steel reinforcement bars or geogrids allows stresses to be redistributed away from the impact zone, reducing stress concentration and delaying crack localization. This leads to the formation of multiple, more distributed cracks instead of a single dominant crack path. With successive impacts, energy is gradually dissipated through crack initiation, propagation, and frictional interaction along crack surfaces, in addition to the contribution of reinforcement through tension resistance and, in the case of steel, yielding. This results in a more ductile response and enhanced impact resistance. In contrast, unreinforced slabs lack such mechanisms, leading to rapid crack localization, limited energy absorption, and a more brittle failure mode.
4.3. Effect of Reinforcement Ratio
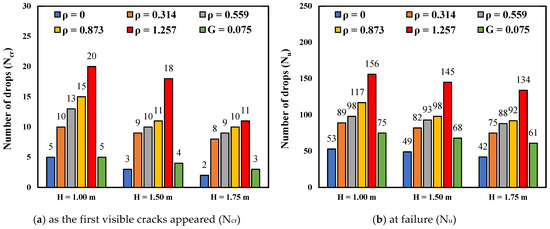
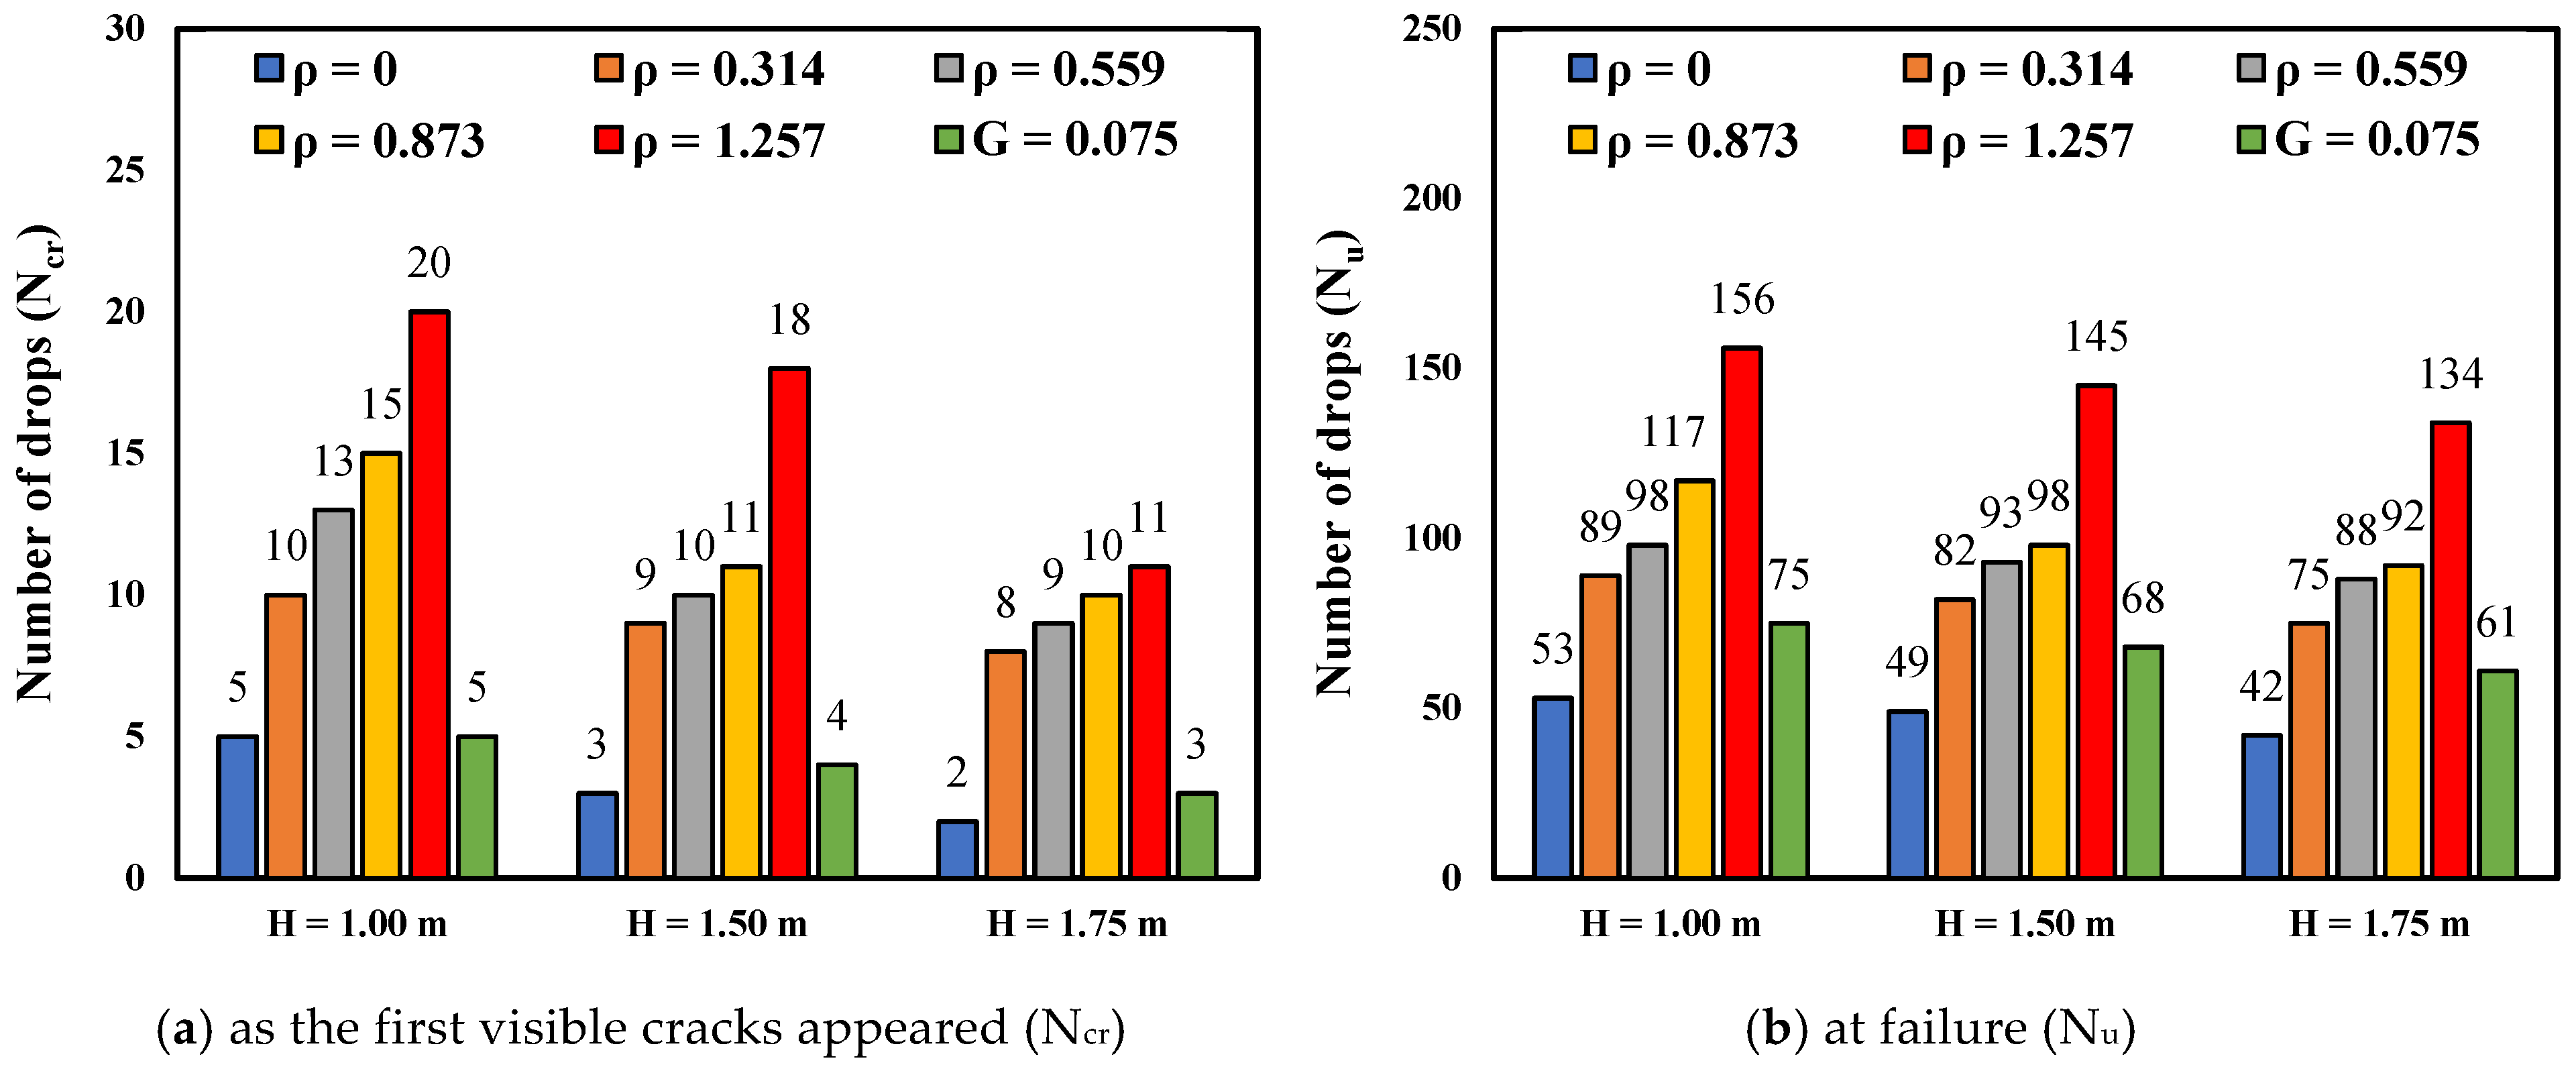
The influence of reinforcement ratio (ρ) is clearly shown in Figure 12. The number of drops required for reaching failure in the slab increased as the reinforcement ratio increased, with drop height held constant. This trend highlights the effect of using reinforcement in slab design, which enhances the impact resistance of concrete slabs. For example, as presented in Table 6, specimens with higher reinforcement ratios (e.g., V-1.75-12 with 134 drops) consistently outperformed those with lower reinforcement ratios (e.g., II-1.75-6 with 75 drops). This improvement is attributed to the ability of steel reinforcement bars to distribute stresses more effectively, delay crack propagation, and absorb additional energy through yielding before failure.
Figure 12.
Relationship between number of drops and reinforcement ratio (ρ%), with drop height (H) held constant.
The results indicate that increasing the reinforcement ratio from 0.314% to 1.257% improves the number of drops at failure by approximately 79%, while DF demonstrates a more limited increase. This suggests that although higher reinforcement ratio enhances impact resistance, the rate of improvement decreases at higher ratios. A reinforcement range between approximately 0.87% and 1.26% appears to provide a more efficient balance between impact resistance and ductility performance.
4.4. Effect of Drop Height
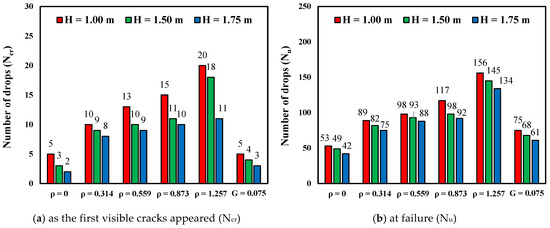
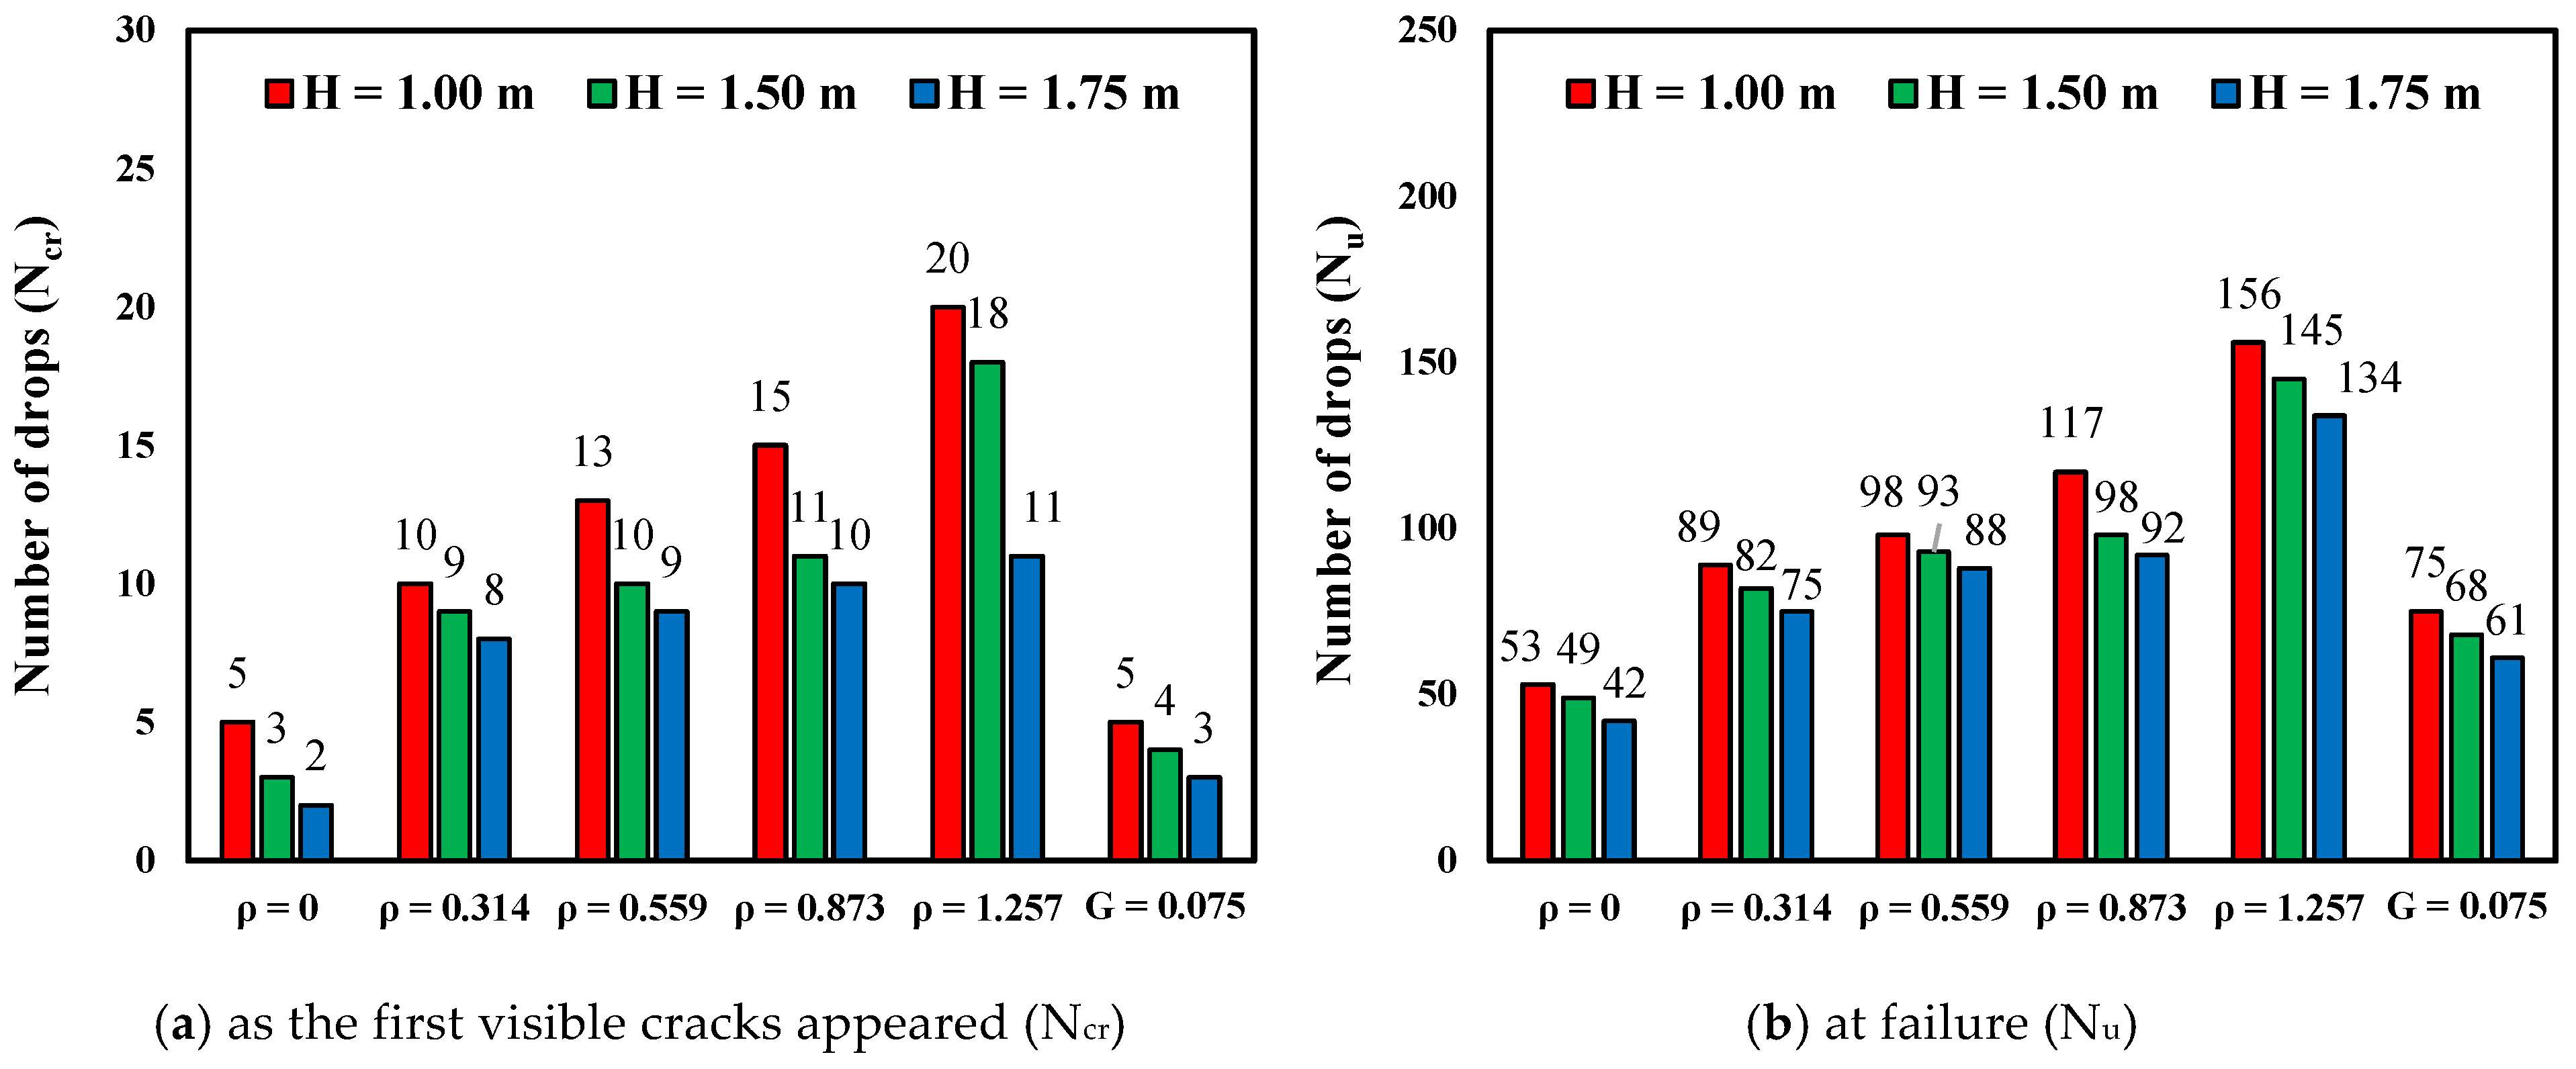
The relationships between drop height (H) and the number of drops needed to cause cracks and failure in the slabs under constant reinforcement ratio conditions are depicted in Figure 13. The study results revealed that increased drop heights reduce the number of drops required to trigger slab failure. This pattern was observed in all the tested slab groups during the test. For example, slabs tested at 1 m drop height withstood up to 156 drops, while slabs tested at 1.75 m height withstood up to 134 drops. This illustrates that increasing impact energy per drop increases damage accumulation and reduces the number of impacts required for failure. These results are comparable to prior studies [26,27], which reported a similar decrease in impact resistance as drop height increased.
Figure 13.
Relationship between number of drops (N) and drop height (H), with reinforcement ratio (ρ%) held constant.
It should be noted that the tested GSCS dimensions are relatively small compared with full-scale GSCSs used in practice, which may introduce scale effects influencing the absolute values of impact resistance and deformation. However, the observed trends related to crack propagation, failure mechanisms, and the influence of reinforcement are primarily governed by material behavior and stress distribution and are therefore expected to be consistent at larger scales. Accordingly, the results of this study provide reliable insight into the relative performance and behavioral trends, although direct extrapolation of quantitative values to full-scale applications should be approached with caution.
4.5. Impact Energy Calculation
The impact energy corresponding to different drop heights was analyzed in this study, calculated for each drop height, to provide a better understanding of actual loading conditions. Actual loading severity is measured through impact energy, which depends on both the falling weight’s mass and the drop height, while impact tests use drop height as their standard measurement. The impact energy () was calculated using the classical expression: , where = mass of the drop weight (kg), = acceleration due to gravity (9.81 m/s2), = drop height (m). In the present study, a cylindrical steel weight with a mass of 15 kg was utilized. Based on the adopted drop heights in this study, the corresponding impact energies for drop heights of 1.0 m, 1.5 m, and 1.75 m were 147 J, 221 J, and 257 J, respectively.
The total energy at failure is the product of the number of drops to failure () and the energy per drop. For repeated impact loading, the total energy at failure is defined as: , where = total absorbed energy at failure (J), = number of drops at failure, = energy per single drop . The total energy at failure is listed in Table 7.
Table 7.
Total energy at failure for tested slabs.
The total energy at failure offers a clearer and more realistic measure of how the slabs perform under repeated impact loading compared with simply counting the number of drops. As shown in Table 7, the ability of the slabs to absorb energy increases when they are reinforced with steel and with higher reinforcement ratios. For example, at a 1.75 m drop height, the unreinforced slabs (Group I) absorbed about 10.8 kJ, while slabs reinforced with 12 mm steel bars (Group V) reached up to 34.4 kJ, which is more than three times higher. This demonstrates how reinforcement helps the slab sustain repeated impacts by spreading cracks and allowing more energy to be dissipated before failure.
Another important observation relates to the effect of drop height. Even though higher drop heights lead to failure in fewer impacts, each impact carries more energy. As a result, the total energy absorbed at failure tends to increase with drop height. In other words, slabs subjected to more severe impacts fail faster, but they still absorb more energy overall because each impact is stronger. This highlights the importance of considering both the intensity of the impact and the number of repetitions when evaluating slab performance.
When comparing reinforcement types, steel-reinforced slabs consistently show better performance in terms of total energy absorption than geogrid-reinforced slabs. While geogrids are effective in controlling cracks and improving post-cracking behavior, their contribution to ultimate energy resistance is more limited compared with steel reinforcement. This suggests that steel reinforcement is more suitable for situations where high impact resistance is required, whereas geogrids may be more appropriate when crack control and serviceability are the main concerns.
Overall, these results confirm that total energy at failure is a reliable and practical indicator of slab performance, as it combines both the number of impacts and the energy of each impact. Using this parameter facilitates comparison between different slab configurations and provides useful guidance for designing slabs exposed to repeated impact loading.
5. Numerical Modeling
Numerical modeling is characterized by saving effort, time, and cost of conducting experimental tests, as it allows predicting the behavior of structural elements and performing parametric studies. ABAQUS [28] is considered one of the most widely used structural analysis programs for such modeling, which is based on the finite element method. ABAQUS can be used for linear or nonlinear, static or dynamic analysis. Many researchers have utilized ABAQUS to study the nonlinear behavior of RC structural elements [29,30,31,32]. This section presents a numerical analysis using ABAQUS to study the behavior of GSCSs under impact loads.
5.1. Material Definition
5.1.1. Concrete
To model the linear behavior of concrete, Poisson’s ratio was taken as 0.2, while Young’s modulus (E) was defined by estimating the slope of the linear portion of the stress–strain curve obtained from the previously mentioned experimental direct compression tests. Moreover, to model the nonlinear behavior of concrete, the concrete damaged plasticity (CDP) model, available in the ABAQUS material library, was employed. The variables used to define this model are summarized in Table 8. A parametric study was conducted to determine the values of these parameters. The results of the study demonstrated that the values obtained were consistent with the studies presented by Elsamak et al. [33]. To define the relationship between stress and strain in both tension and compression, the results of direct compression and tension tests, previously mentioned in Section 3.1, were used.
Table 8.
CDP model parameters used to model nonlinear behavior of concrete.
5.1.2. Steel Reinforcement and Geogrid
The elastic-plastic model with isotropic hardening was used to model both steel reinforcements and geogrid, in accordance with the results of the direct tensile tests for both, as previously mentioned in Section 3.1. Poisson’s ratio was taken as 0.3, and Young’s modulus was defined as 200 GPa for steel reinforcement; for geogrid, Poisson’s ratio and Young’s modulus were set at 0.3 and 8 GPa, respectively.
5.1.3. Base Layer (Basalt Aggregate)
To model the elastic behavior of the base layer, Poisson’s ratio and Young’s modulus were considered to be 0.30 and 20 GPa, respectively. To model the inelastic behavior, the Mohr-Coulomb plasticity model was utilized with a friction angle of 40°, a dilation angle of 0, and a cohesion of 10 kPa, in accordance with [34].
5.2. Model Components: Element Types, Boundary Conditions, and Interaction Modeling
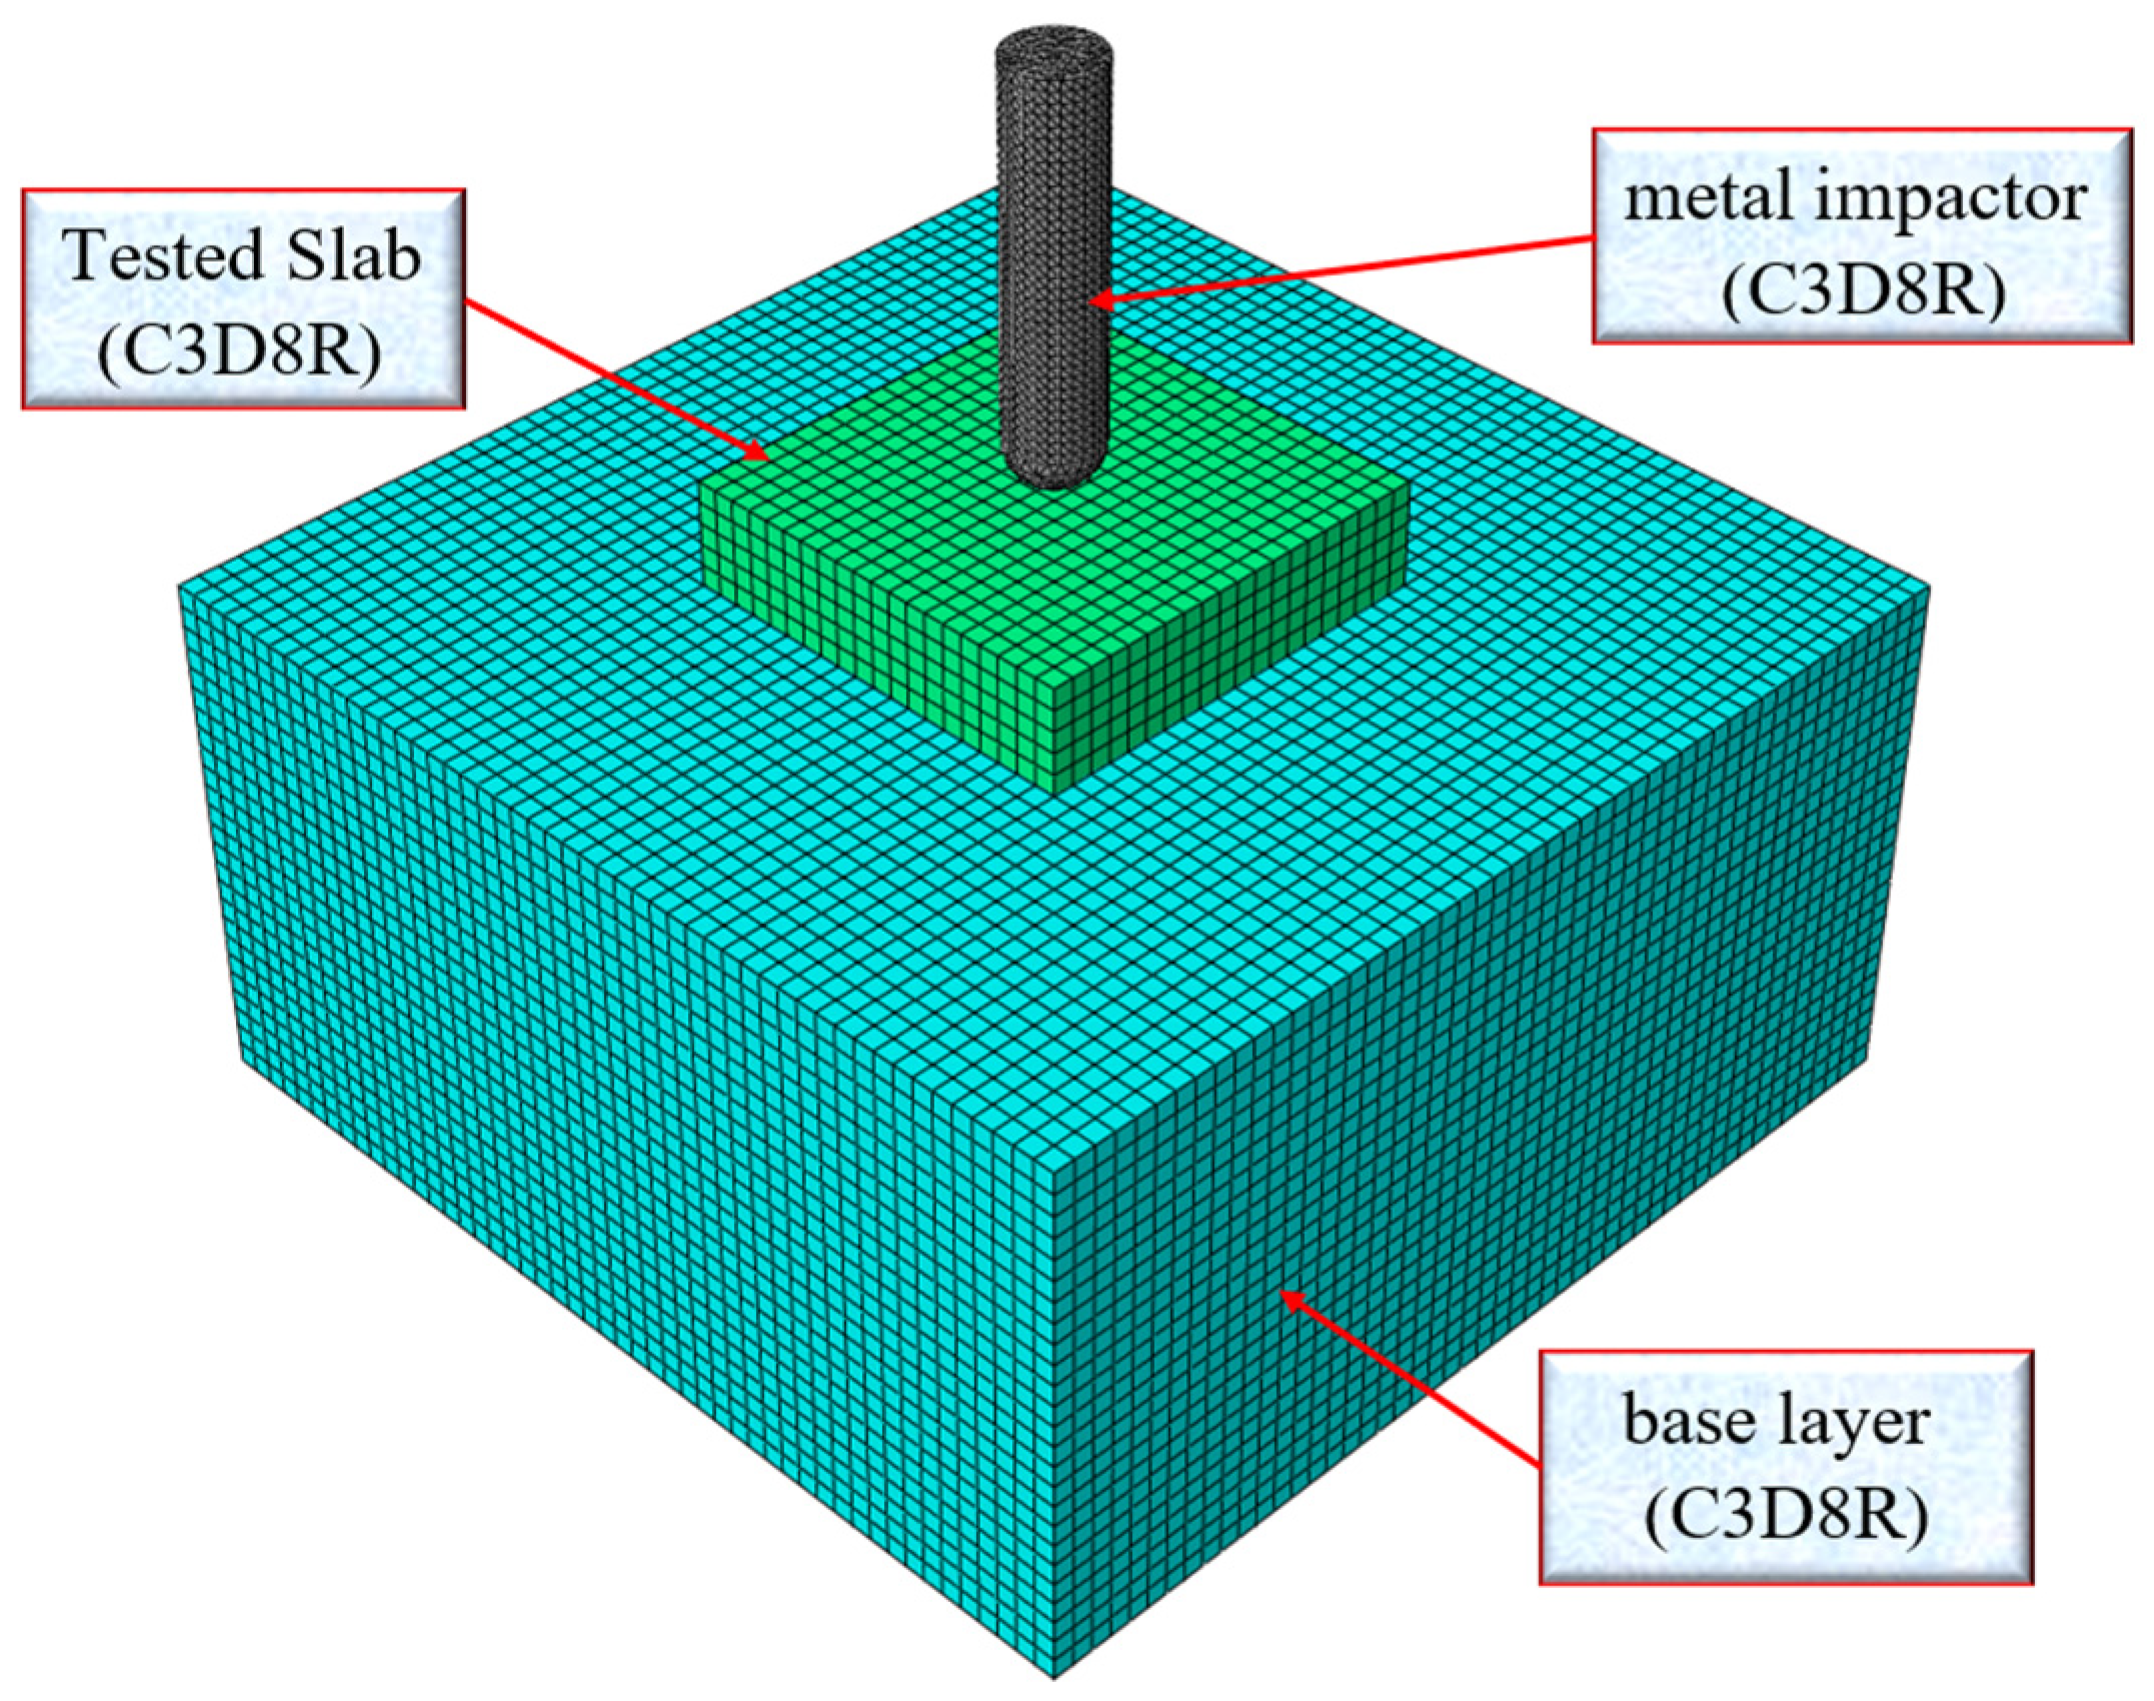
In the numerical model, the C3D8R element, an 8-node linear brick with reduced integration and hourglass control, was employed to model the concrete slab, base layer, and metal impactor. The T3D2 element, a 2-node linear 3-D truss, was used to model the steel reinforcement inside the concrete slabs. The S4R element (a 4-node doubly curved thin or thick shell, reduced integration, hourglass control, finite membrane strains) was utilized to model the geogrid.
The interaction between the steel reinforcement bars (or geogrids) and the surrounding concrete slab was assumed to be fully bonded, meaning that no relative slip was allowed at the interface. This was implemented in ABAQUS using the embedded region constraint, which ensures that the reinforcement behaves as an integral part of the concrete matrix throughout the analysis. On the other hand, the contact between the concrete slab and the loading metal impactor, as well as the contact between the slab and the supporting base layer, was treated differently. These interfaces were modeled as surface-to-surface contacts capable of transmitting compressive stresses (vertical loads) but unable to resist tension. In other words, separation was permitted whenever tensile stresses developed at the interface. To account for frictional resistance along these contact surfaces, a friction coefficient of 0.25 was specified. This allowed sliding to occur under sufficient shear stresses while still representing the realistic resistance offered by the surfaces in contact. All vertical side soil surfaces (the vertical surfaces passing through the midpoint between adjacent slabs in both directions), as well as the lower surface of the base layer (the surface representing the interaction of the base layer with the concrete enclosure that contains it), were considered to be fixed in all directions.
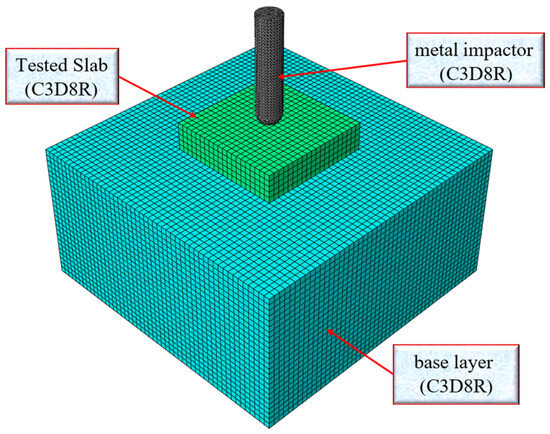
The entire geometry of the concrete slab was explicitly modeled in the analysis, without making use of geometric or loading symmetry about the vertical planes. In other words, no symmetric boundary conditions were applied, and the full slab was represented in the finite element model. This approach was adopted to capture the complete structural response and possible asymmetric damage or cracking patterns that might occur under impact loading. The numerical analysis of the tested slabs was performed in a series of steps that simulated the progressive loading until failure. Each analysis step corresponded to a single experimental impact event. In the model, the metal impactor was assigned an initial velocity equivalent to the velocity it would attain at the moment of contact with the slab during free fall, calculated using the gravitational acceleration g = 9810 mm/s2. The numerical modeling of a slab is illustrated in Figure 14.
Figure 14.
Numerical modeling of a slab.
The interaction between the geogrid and the surrounding concrete was modeled using the embedded region constraint, assuming a fully bonded condition with no relative slip. This simplification was adopted to ensure numerical stability and because of the lack of detailed bond–slip data for the specific geogrid material used in this study. Under this assumption, the geogrid is considered to act integrally with the concrete matrix, providing distributed tensile resistance.
It is recognized, however, that in reality, the geogrid–concrete interface may exhibit partial bonding, slip, or local debonding, particularly under repeated impact loading. Neglecting these effects may lead to a slight overestimation of stiffness and load transfer efficiency in the numerical model. Therefore, while the adopted approach provides a reasonable approximation of the global structural response, future studies are recommended to incorporate more advanced interface models to capture the bond–slip behavior more accurately.
5.3. Numerical Modeling Validation Results
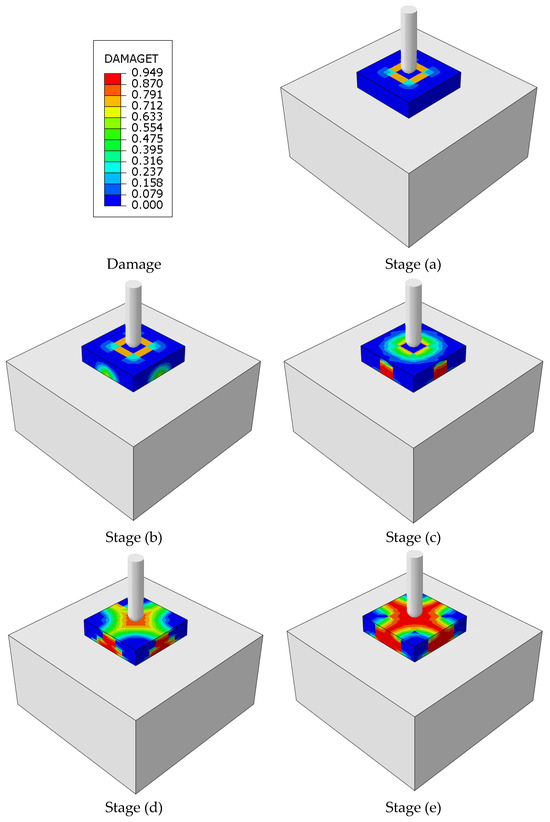
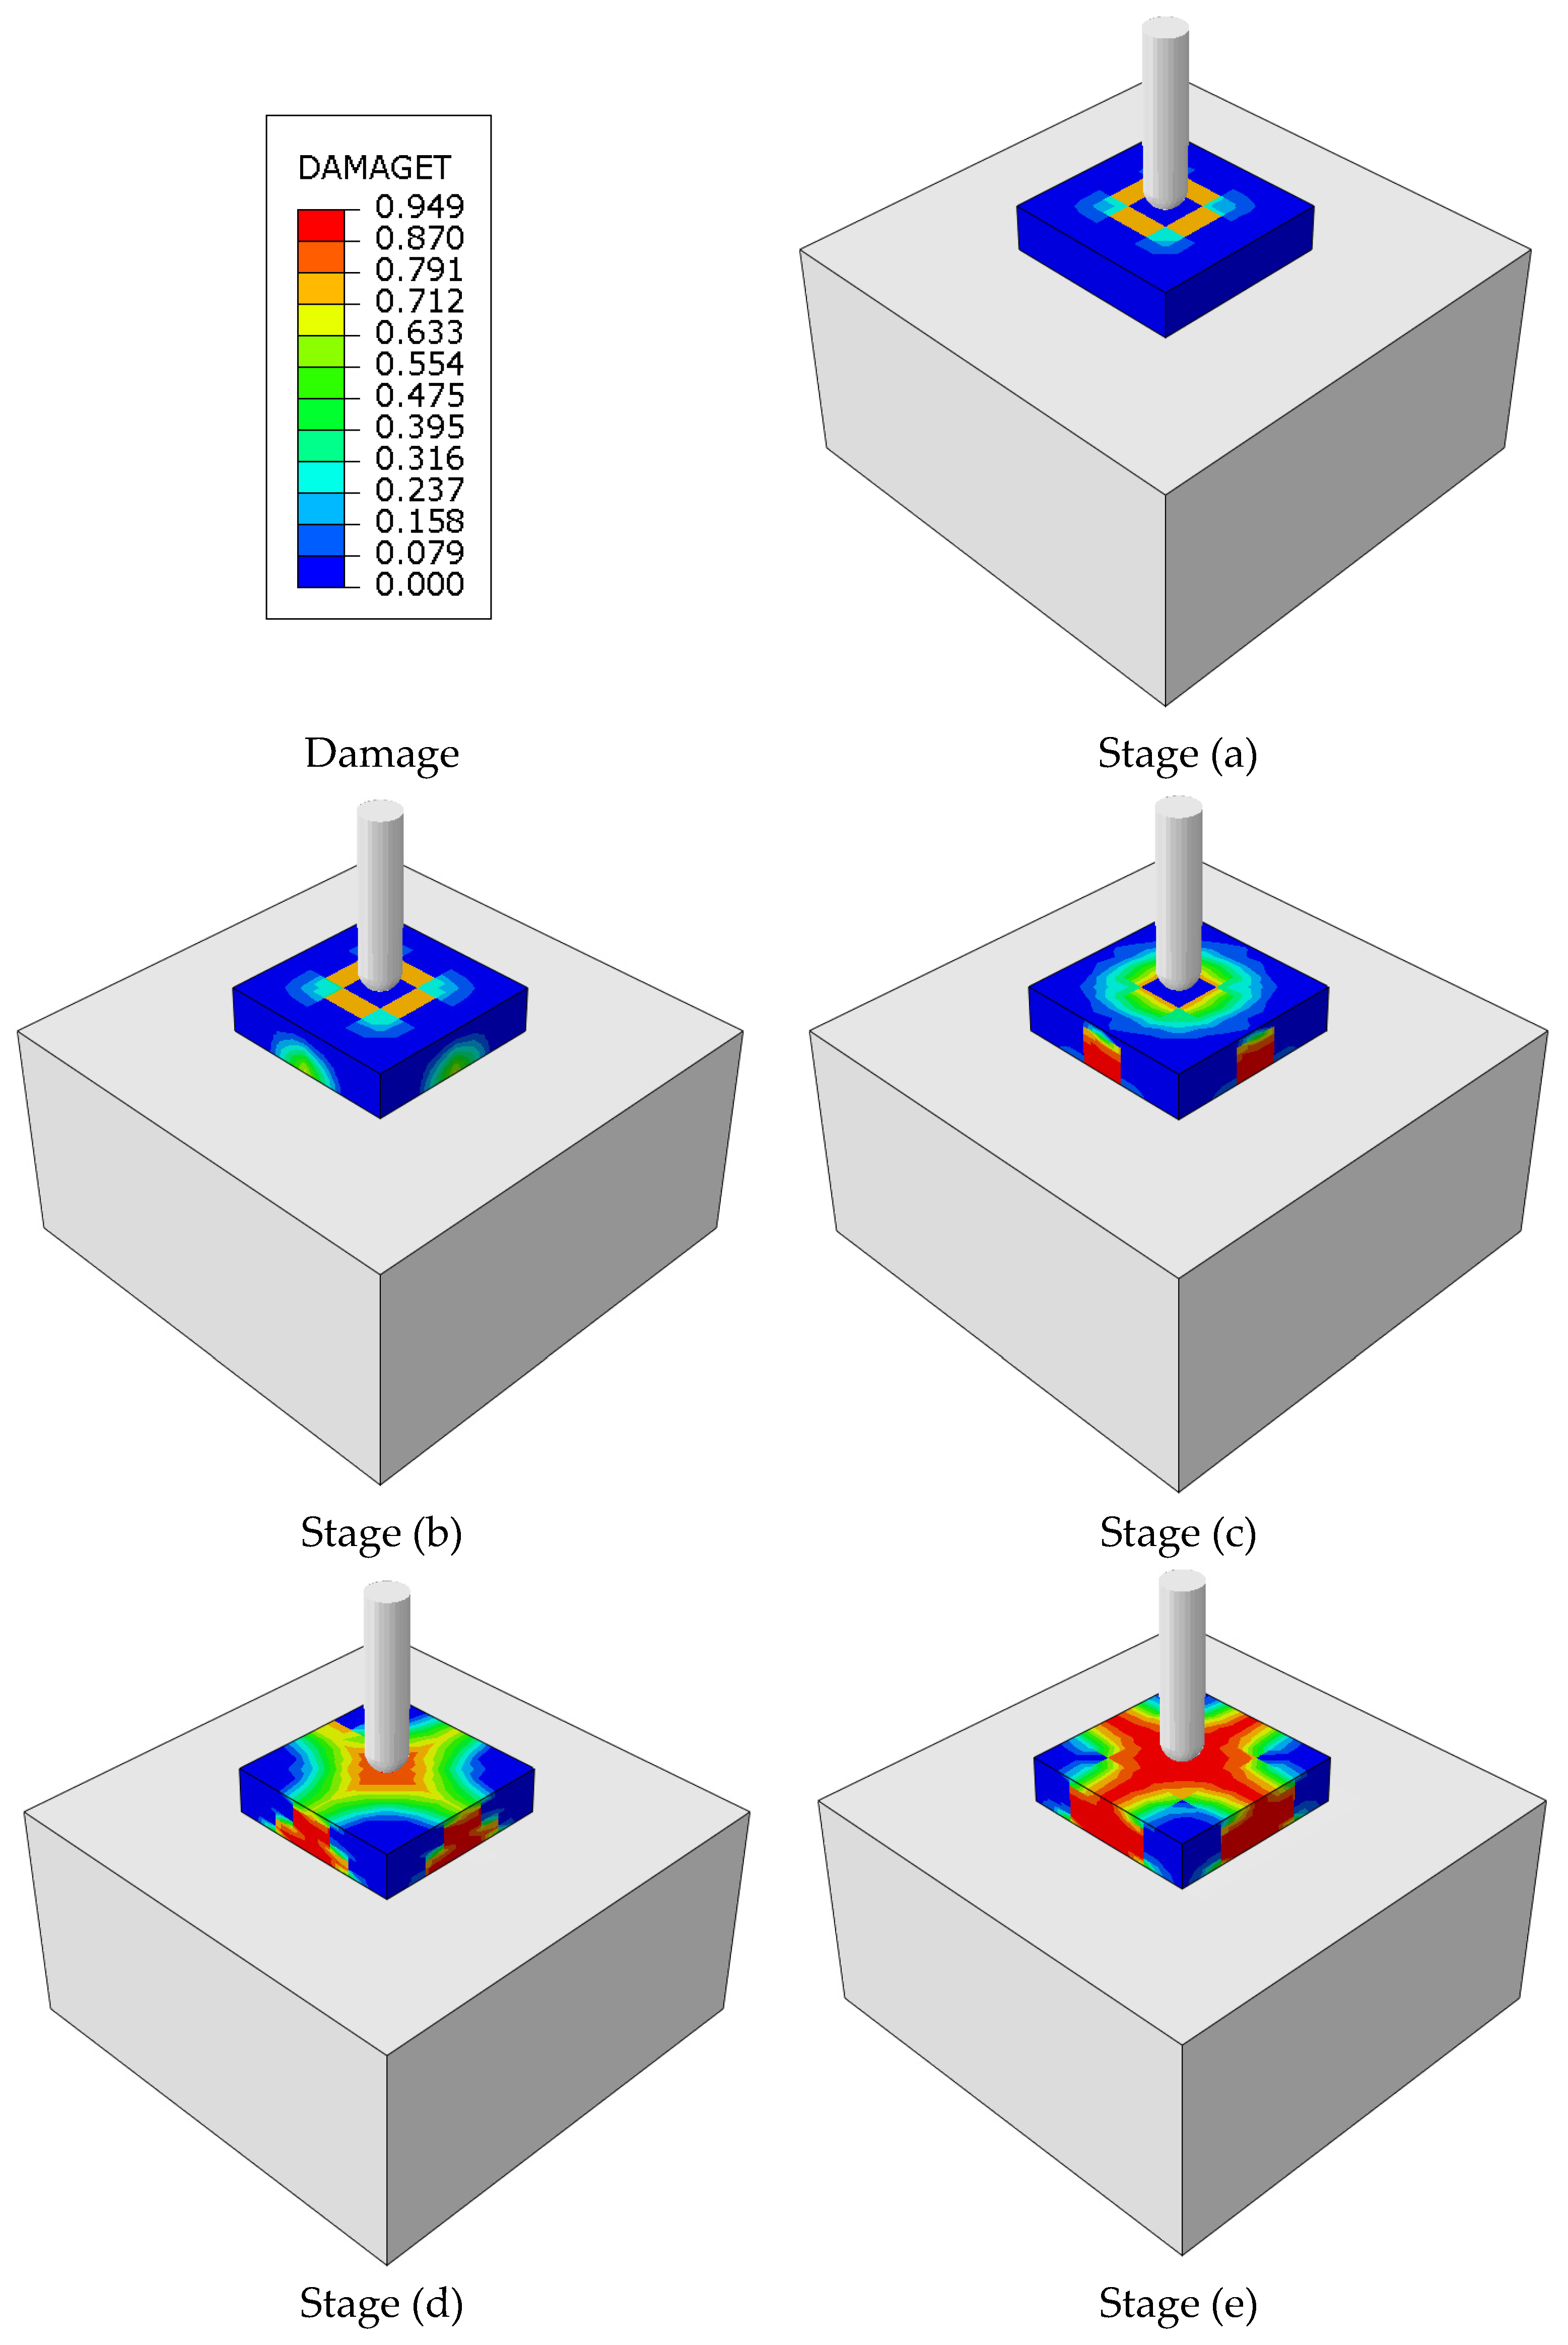
Figure 15 displays the numerical simulation of crack progression in slab I-1 (a plain concrete slab without reinforcement). The sequence (a–e) shows the stages of how damage initiates, propagates, and eventually leads to failure under repeated impact loading applied by a drop weight. Stage (a): Localized cracking initiation is observed directly beneath the impact point when loading begins. High stress concentration at the center leads to the formation of early micro-cracks, which are seen in the initial damage contours in the contact region. Stage (b): As the impacts continue, radial crack propagation from the contact point of the spherical impactor toward the outside occurs, generating damage zones along the upper surface of the slab, while vertical cracks develop through the thickness of the slab beneath the impactor. Stage (c): Crack propagation in both radial and downward directions indicates a well-defined conical failure pattern, typical of impact loading on brittle concrete. Localized cracking underneath the edges of the slab, resulting from stress reflection and redistribution, begins to appear. Throughout the thickness of the slab, several radial cracks are visible on the upper surface. Stage (d): Extensive cracking develops in the slab, with many shear cracks reaching the vertical edges. This stage demonstrates a significant reduction in the load-bearing capacity of the slab. Stage (e): Ultimately, the slab is completely cracked and fragmented in the impact zone, which exhibits high damage values (close to 1.0), indicating extensive material degradation. The crack pattern illustrates crushing beneath the impactor, with radial and circumferential cracks extending to the slab boundaries. In general, the numerical results confirm brittle failure behavior in the plain concrete slab (no reinforcement), dominated by localized crushing under the impact zone and rapid propagation of radial and shear cracks until complete collapse. This behavior shows that unreinforced concrete under dynamic impact loading has a limited capacity for energy absorption and ductility. The numerical results obtained for slab I-1 (Figure 15) align well with the typical experimental behavior of plain concrete slabs subjected to repeated impact loading.
Figure 15.
Numerical simulation of crack propagation in slab I-1 under drop-weight impact loading.
5.4. Parametric Study
5.4.1. Slab Thickness
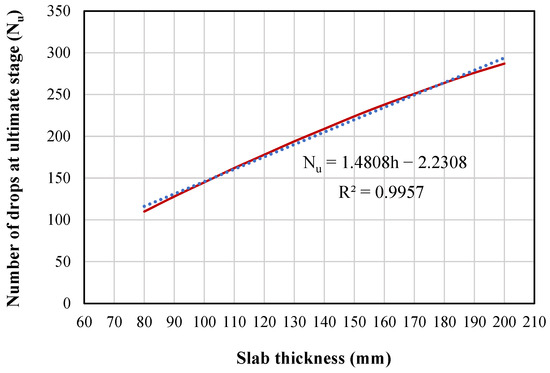
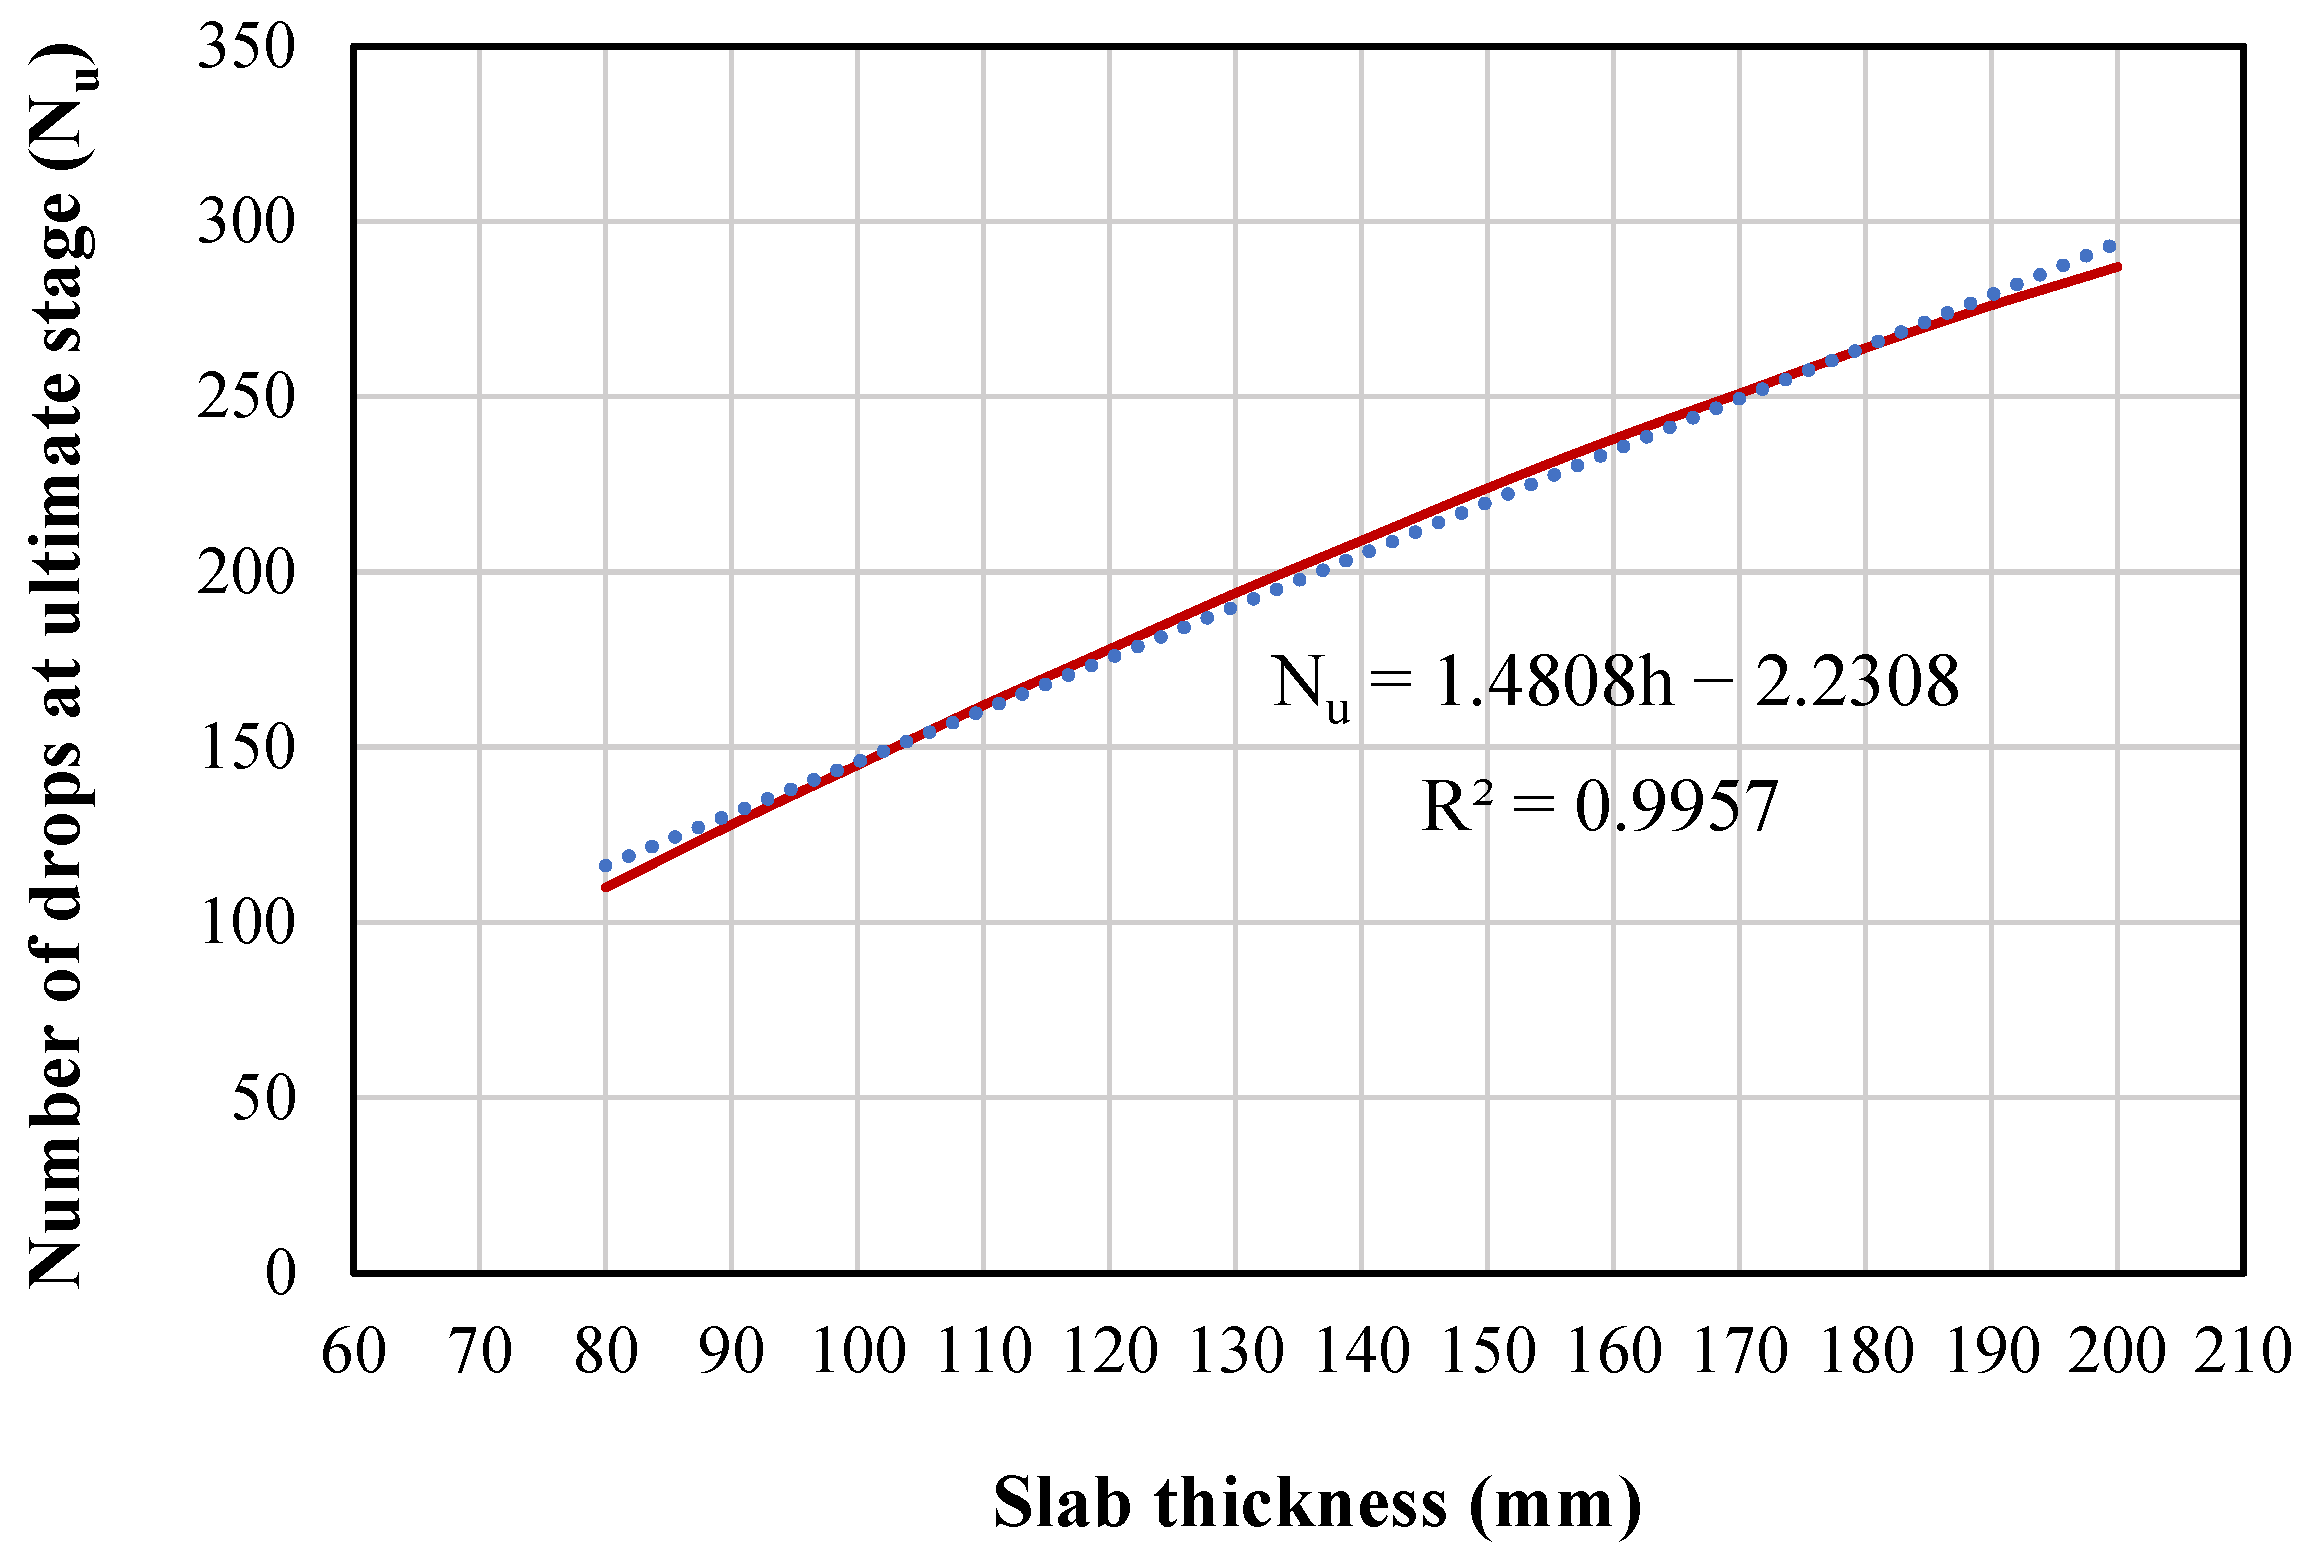
The slab thickness influences the flexural stiffness, load-spreading capacity, and resistance to localized damage in a direct way. A parametric numerical investigation has been conducted to evaluate the influence of slab thickness on the impact performance of RC slabs subjected to repeated drop-weight loading. The specimen (V-1.5-12-100) that corresponds to a slab thickness of 100 mm reinforced with 12 mm steel bars and impacted from a height of 1.5 m has been chosen as a reference specimen. A wide range of slab thicknesses has been investigated, which are 80, 90, 100, 110, 120, 130, 140, 150, 160, 170, 180, 190, and 200 mm. The results of this study are summarized in Table 9. The increase in slab thickness from 80 mm to 200 mm resulted in a pronounced improvement in both crack resistance and ultimate impact capacity. The number of drops required to initiate the first visible crack (Ncr) increased from 14 for the 80 mm slab to 38 for the 200 mm slab, while the number of drops at failure (Nu) rose from 110 to 287, which shows a substantial improvement in its ability to absorb energy. This improvement is attributed to the higher flexural stiffness and load-spreading capacity of slabs with larger thickness, which reduces stress concentration beneath the impact point and delays crack initiation. The relationship between slab thickness and the number of drops at the ultimate stage is illustrated in Figure 16.
Table 9.
Results of numerical parametric study for different slab thicknesses.
Figure 16.
Effect of slab thickness on impact performance (number of drops at ultimate stage).
The deflection at first crack (Δcr) exhibited a moderate increase with thickness because a stiffer system requires more energy to achieve tensile failure. Similarly, the ultimate deflection (Δu) increased from 6.50 mm to 9.70 mm, indicating an improvement in the deformation capacity prior to collapse. However, DF = Δu/Δcr remained nearly constant at approximately 5.5 across the investigated thickness range, suggesting that the fundamental failure mechanism did not change considerably and remained governed by flexural behavior rather than brittle punching. In contrast, ISF = Nu/Ncr displayed a slight decreasing trend with increasing thickness, demonstrating that although thicker slabs resist higher absolute impact loads, the proportional increase in ultimate capacity relative to cracking resistance becomes less pronounced.
Overall, the results demonstrated that slab thickness is a dominant parameter that controls the impact resistance of GSCSs. Increasing the slab thickness enhances the structural robustness significantly and delays damage accumulation. However, this effect diminishes at larger thicknesses. These findings highlight the importance of selecting an optimal thickness that balances structural performance with material economy for practical design applications in slabs subjected to repeated impact loading.
5.4.2. Influence of Base Layer Stiffness
Following validation of the finite element model against the experimental results, an additional parametric study was carried out to investigate the influence of the supporting base stiffness on the impact performance of the reference slab V-1.5-12-100. The selected slab had a thickness of 100 mm, was reinforced with 4ϕ12 steel bars, and was subjected to repeated drop-weight impacts from a height of 1.5 m. The base layer was modeled using three elastic stiffness levels representing different support conditions: soft support , baseline basalt support , and rigid support . All other material properties, contact definitions, and loading conditions were kept unchanged.
The results presented in Table 10 show that base stiffness has a pronounced effect on both crack initiation and ultimate resistance. Reducing the base stiffness from the baseline basalt condition to a softer support decreased the number of drops required to initiate cracking from 18 to 14, corresponding to a reduction of 22.2%, while the number of drops at failure decreased from 145 to 104, representing a reduction of 28.3%. At the same time, the first-crack and ultimate deflections increased by 9.2% and 9.9%, respectively, demonstrating greater slab deformability and more rapid damage accumulation. In contrast, increasing the support stiffness to a rigid base improved slab resistance substantially, with increasing to 22 and increasing to 184, corresponding to gains of 22.2% and 26.9%, respectively. The associated reduction in and confirms that a stiffer base restrains slab deformation and delays crack growth under repeated impact loading.
Table 10.
Results of numerical parametric study for different base layer stiffness values.
From a mechanical standpoint, these trends reflect the role of slab–foundation interaction in governing impact behavior. A soft base permits greater local indentation and curvature, which amplifies tensile stresses at the bottom of the slab and accelerates crack propagation. A stiffer base, however, provides stronger reaction support beneath the impact point, improves stress redistribution, and reduces the severity of flexural deformation. Although DF remained nearly constant across the investigated range, varying only from 5.47 to 5.55, the improvements in and confirm that support stiffness primarily enhances absolute resistance rather than fundamentally altering the failure mode. ISF also increased slightly for the rigid base, indicating a modest improvement in post-cracking reserve capacity. Overall, the results reveal that improving the stiffness of the supporting layer can substantially enhance the impact durability and structural robustness of GSCSs.
It should be noted that the elastic modulus reported for the basalt aggregate in Table 1 (92 GPa) corresponds to the stiffness of the solid rock material. However, the base layer used in the experimental setup consists of compacted crushed basalt, which behaves as a granular medium rather than a continuous solid. Therefore, an equivalent elastic modulus of 20 GPa was adopted in the numerical model to represent the effective stiffness of the compacted base layer. This value falls within the typical range stated in the literature for granular base materials and accounts for the effects of voids, particle interaction, and contact behavior.
The parametric study confirms that base layer stiffness is a key design variable in the impact performance of GSCSs. Compared with the baseline basalt support, a soft base significantly reduced both crack resistance and ultimate impact capacity, while a rigid base produced clear improvements in both parameters and reduced slab deflections.
5.4.3. Combined Insight of Support Stiffness with Slab Thickness Results
When the findings of the influence of base layer stiffness are considered together with the slab-thickness parametric study, an important design conclusion emerges: both slab thickness and support stiffness increase impact resistance, but they do so through different mechanisms. Increasing slab thickness mainly improves flexural stiffness and energy absorption capacity within the slab itself, whereas increasing base stiffness enhances reaction support and reduces local curvature and downward deformation. In practical design, the conclusion means that a thinner slab on a very stiff base may still perform competitively, while a thicker slab on a weak support may not fully realize its potential resistance. Therefore, optimum impact design should not be based on slab thickness alone; it should consider the slab–foundation system as an integrated structural unit.
6. Conclusions
The behavior of GSCSs is examined in the present study, including how the drop height and reinforcement ratio influence failure modes, crack propagation, and overall performance. Several key conclusions are drawn from the experimental results:
- Failure progression: A consistent pattern of failure is observed in all slabs. Damage started from the impact point on the upper surface, followed by crack propagation from the bottom center toward the sides of the slab, converging at the top surface. In contrast to the simple, cross-shaped cracking that occurs in unreinforced slabs, the presence of reinforcement influenced the cracking pattern, resulting in a greater number of diagonal cracks.
- Reinforcement: The effect of reinforcement played a significant role in the performance of the slabs. Whereas the unreinforced slabs had fewer cracks and their failure was somewhat more brittle, with reinforcement, slabs showed greater distributed cracking and deformation capacity, whereby the failure mode transformed from brittle to ductile energy dissipation.
- Impact strength and ductility: Two performance indices, ISF and DF, were used to assess the response of the slabs. Values of ISF demonstrated considerable variation (7.54–21.00), attributed to the variability in the capacity of slabs to withstand repeated impacts after cracking. Values of DF (2.67–5.61) indicated that a notable variation in deformability was obtained post-cracking. Moderate reinforcement ratios enhanced ductility, whereas excessive reinforcement led to more brittle behavior. Drop height governed the applied impact energy rather than the actual impact resistance of the material. Accordingly, impact performance should be assessed based on total absorbed energy rather than the number of impacts alone.
- Influence of drop height: When the drop height increased, the number of drops to failure decreased, since greater impact energy per drop accelerated damage development. This trend was in line with previous investigations, confirming the dominant role of impact energy in governing slab performance.
- The slab thickness is a dominant parameter that controls the impact resistance of GSCSs. Increasing the slab thickness enhanced the structural robustness substantially and delayed damage accumulation. However, this effect diminished at larger thicknesses.
- The base layer stiffness is a key design variable in the impact performance of GSCSs. A soft base considerably reduced both crack resistance and ultimate impact capacity, while a rigid base produced clear improvements in both parameters and reduced slab deflections.
Overall, the results showed that reinforcement not only enhanced the load-carrying capacity of slabs under impact but also altered their failure characteristics to be more ductile and tough. The combination of ISF with DF represents a relatively integrated assessment of slab performance and will help greatly in the design of concrete slabs that would be subjected to impact loading in protective structures, pavements, and industrial flooring.
The results of this study provide practical guidance for the design of GSCSs under impact loading. Increasing reinforcement ratio improves impact resistance; however, ductility enhancement is dependent on maintaining an appropriate reinforcement level to avoid brittle behavior. Steel reinforcement is more effective in enhancing ultimate capacity, while geogrid reinforcement can improve post-cracking performance. The significant effect of impact energy highlights the need to consider realistic impact scenarios in design. Therefore, a performance-based approach that considers both strength and ductility is recommended for slab design under repeated impact loading.
7. Limitations
Despite the valuable findings presented in this study, several limitations should be acknowledged. The experimental program was conducted on relatively small-scale specimens, which may not fully represent the behavior of full-scale slabs in practical applications. In addition, the study focused on a limited number of parameters, including reinforcement type, reinforcement ratio, drop height, slab thickness, and subgrade stiffness, while other influential factors such as impactor shape, slab size, and different impact scenarios were not considered. The numerical model also involved certain assumptions, such as a perfect bond between reinforcement and concrete and simplified contact interactions, which may affect the accuracy of the simulations. Furthermore, the results have not been validated through field-scale applications. Therefore, future research is recommended to include larger-scale testing, expanded parametric investigations, and field validation to enhance the applicability of the findings.
Author Contributions
U.H.: Conceptualization, methodology, investigation, validation, writing—original draft, writing—review and editing; A.B. (Alireza Bahrami): Conceptualization, methodology, formal analysis, visualization, writing—original draft, writing—review and editing, project administration; M.G.: Conceptualization, methodology, investigation, validation, writing—original draft, writing—review and editing; G.E.: formal analysis, writing—review and editing; A.A.A.: Conceptualization, methodology, validation, writing—original draft, writing—review and editing; A.B. (Ali Basha): Validation, formal analysis. All authors have read and agreed to the published version of the manuscript.
Funding
This research received no external funding.
Data Availability Statement
The original contributions presented in the study are included in the article; further inquiries can be directed to the corresponding authors.
Conflicts of Interest
The authors declare no conflicts of interest.
References
- Alani, A.M.; Rizzuto, J.; Beckett, D.; Aboutalebi, M. Structural Behaviour and Deformation Patterns in Loaded Plain Concrete Ground-supported Slabs. Struct. Concr. 2014, 15, 81–93. [Google Scholar] [CrossRef] [Scilit]
- Labudkova, J.; Cajka, R. Experimental Measurements of Subsoil–Structure Interaction and 3D Numerical Models. Perspect. Sci. 2016, 7, 240–246. [Google Scholar] [CrossRef] [Scilit]
- Øverli, J. Experimental and Numerical Investigation of Slabs on Ground Subjected to Concentrated Loads. Open Eng. 2014, 4, 210–225. [Google Scholar] [CrossRef] [Scilit]
- Tang, X.; Jlilati, M.N.; Higgins, I. Concrete Slab-on-Grade Reinforced by Geogrids. In Proceedings of the Geo-Congress 2019; American Society of Civil Engineers: Reston, VA, USA, 2019; pp. 474–479. [Google Scholar]
- Sucharda, O.; Smirakova, M.; Vaskova, J.; Mateckova, P.; Kubosek, J.; Cajka, R. Punching Shear Failure of Concrete Ground Supported Slab. Int. J. Concr. Struct. Mater. 2018, 12, 36. [Google Scholar] [CrossRef] [Scilit]
- Cajka, R.; Marcalikova, Z.; Bilek, V.; Sucharda, O. Numerical Modeling and Analysis of Concrete Slabs in Interaction with Subsoil. Sustainability 2020, 12, 9868. [Google Scholar] [CrossRef] [Scilit]
- Said, A.I.; Mabrook Mouwainea, E. Experimental Investigation on Reinforced Concrete Slabs under High-Mass Low Velocity Repeated Impact Loads. Structures 2022, 35, 314–324. [Google Scholar] [CrossRef] [Scilit]
- Othman, H.; Marzouk, H. An Experimental Investigation on the Effect of Steel Reinforcement on Impact Response of Reinforced Concrete Plates. Int. J. Impact Eng. 2016, 88, 12–21. [Google Scholar] [CrossRef] [Scilit]
- Yoo, D.-Y.; Yoon, Y.-S. Influence of Steel Fibers and Fiber-Reinforced Polymers on the Impact Resistance of One-Way Concrete Slabs. J. Compos. Mater. 2014, 48, 695–706. [Google Scholar] [CrossRef] [Scilit]
- Xu, T.; Zhao, G.; Zhu, W.; Chen, C.; Yuan, L. Mesoscale Modeling of Spallation Failure in Fiber-Reinforced Concrete Slab Due to Impact Loading. Int. J. Geomech. 2016, 16, B4015001. [Google Scholar] [CrossRef] [Scilit]
- Almusallam, T.H.; Abadel, A.A.; Al-Salloum, Y.A.; Siddiqui, N.A.; Abbas, H. Effectiveness of Hybrid-Fibers in Improving the Impact Resistance of RC Slabs. Int. J. Impact Eng. 2015, 81, 61–73. [Google Scholar] [CrossRef] [Scilit]
- Ranade, R.; Li, V.C.; Heard, W.F.; Williams, B.A. Impact Resistance of High Strength-High Ductility Concrete. Cem. Concr. Res. 2017, 98, 24–35. [Google Scholar] [CrossRef] [Scilit]
- Almusallam, T.H.; Siddiqui, N.A.; Iqbal, R.A.; Abbas, H. Response of Hybrid-Fiber Reinforced Concrete Slabs to Hard Projectile Impact. Int. J. Impact Eng. 2013, 58, 17–30. [Google Scholar] [CrossRef] [Scilit]
- Habel, K.; Gauvreau, P. Response of Ultra-High Performance Fiber Reinforced Concrete (UHPFRC) to Impact and Static Loading. Cem. Concr. Compos. 2008, 30, 938–946. [Google Scholar] [CrossRef] [Scilit]
- Farnam, Y.; Mohammadi, S.; Shekarchi, M. Experimental and Numerical Investigations of Low Velocity Impact Behavior of High-Performance Fiber-Reinforced Cement Based Composite. Int. J. Impact Eng. 2010, 37, 220–229. [Google Scholar] [CrossRef] [Scilit]
- Rao, H.S.; Ghorpade, V.G.; Ramana, N.V.; Gnaneswar, K. Response of SIFCON Two-Way Slabs under Impact Loading. Int. J. Impact Eng. 2010, 37, 452–458. [Google Scholar] [CrossRef] [Scilit]
- Mahmoud, M.H.; Afefy, H.M.; Baraghith, A.T.; Elnagar, A.B. Impact and Static Behavior of Strain-Hardening Cementitious Composites–Strengthened Reinforced Concrete Slabs. Adv. Struct. Eng. 2020, 23, 1614–1628. [Google Scholar] [CrossRef] [Scilit]
- Sadraie, H.; Khaloo, A.; Soltani, H. Dynamic Performance of Concrete Slabs Reinforced with Steel and GFRP Bars under Impact Loading. Eng. Struct. 2019, 191, 62–81. [Google Scholar] [CrossRef] [Scilit]
- Mousavi, T.; Shafei, E. Impact Response of Hybrid FRP-Steel Reinforced Concrete Slabs. Structures 2019, 19, 436–448. [Google Scholar] [CrossRef] [Scilit]
- Emara, M.; Hamoda, A.; Hu, J.W. Numerical Assessment of Rectangular One- and Two-Way RC Slabs Strengthened with CFRP under Impact Loads. Comput. Concr. 2023, 31, 173–184. [Google Scholar]
- ACI PRC-211.1-91; Standard Practice for Selecting Proportions for Normal, Heavyweight, and Mass Concrete. American Concrete Institute: Farmington Hills, MI, USA, 2009.
- Zeng, J.-J.; Zeng, W.-B.; Ye, Y.-Y.; Liao, J.; Zhuge, Y.; Fan, T.-H. Flexural Behavior of FRP Grid Reinforced Ultra-High-Performance Concrete Composite Plates with Different Types of Fibers. Eng. Struct. 2022, 272, 115020. [Google Scholar] [CrossRef] [Scilit]
- Nagai, Y.; Ichinomiya, T.; Kosaka, T.; Ferrara, L. Investigating Parameters Governing UHPFRC Tensile Fatigue Behaviour via Direct Tensile Tests on Dog-Bone Shaped Specimens. Constr. Build. Mater. 2025, 503, 144526. [Google Scholar] [CrossRef] [Scilit]
- Dai, Y.; Li, Y.; Xu, X.; Zhu, Q.; Yin, Y.; Ge, S.; Huang, A.; Pan, L. Characterization of Tensile Failure Behaviour of Magnesia Refractory Materials by a Modified Dog-Bone Shape Direct Tensile Method and Splitting Tests. Ceram. Int. 2020, 46, 6517–6525. [Google Scholar] [CrossRef] [Scilit]
- Elnagar, A.B.; Afefy, H.M.; Baraghith, A.T.; Mahmoud, M.H. Experimental and Numerical Investigations on the Impact Resistance of SHCC-Strengthened RC Slabs Subjected to Drop Weight Loading. Constr. Build. Mater. 2019, 229, 116866. [Google Scholar] [CrossRef] [Scilit]
- Sawan, J.; Abdel-Rohman, M. Impact Effect on R.C. Slabs: Experimental Approach. J. Struct. Eng. 1986, 112, 2057–2065. [Google Scholar] [CrossRef] [Scilit]
- Murtiadi, S.; Marzouk, H. Behaviour of High-Strength Concrete Plates under Impact Loading. Mag. Concr. Res. 2001, 53, 43–50. [Google Scholar] [CrossRef]
- Abaqus FEA. Documentation: ABAQUS Theory Manual, Elements; Abaqus: Providence, RI, USA, 2017. [Google Scholar]
- Alkhawaldeh, A.A.; Alhassan, M.; Betoush, N.; Alkhawaldeh, M.; Al-Huthaifi, N. Response of Overhanging RC Beams Strengthened with Various Schemes of Externally Bonded CFRP Strips. Pract. Period. Struct. Des. Constr. 2024, 29, 04024068. [Google Scholar] [CrossRef] [Scilit]
- Al-Smadi, Y.M.; Alkhawaldeh, A.A.; Elsamak, G.; Ghalla, M.; Al-Huthaifi, N. Flexural Strengthening of RC Beams with Longitudinal Openings: Experimental and Numerical Evaluation of CFRP Strip and Ring Configurations. Mech. Based Des. Struct. Mach. 2026, 54, 2631690. [Google Scholar] [CrossRef] [Scilit]
- Altobgy, M.A.; Sun, X.; Bazuhair, R.W.; Bin Mahfouz, Y.M.; Alkhawaldeh, A.A.; Ghalla, M. Seismic Strengthening of Unreinforced Masonry Walls Using Hybrid SHCC–Steel Retrofit Systems. Eng. Fail. Anal. 2026, 188, 110671. [Google Scholar] [CrossRef] [Scilit]
- Alharthai, M.; Bahrami, A.; Badawi, M.; Ghalla, M.; Elsamak, G.; Abdelmgeed, F.A. Numerical Study on Enhancing Shear Performance of RC Beams with External Aluminum Alloy Plates Bonded Using Steel Anchors. Results Eng. 2024, 22, 102143. [Google Scholar] [CrossRef] [Scilit]
- Elsamak, G.; Abdullah, A.; Salama, M.I.; Hu, J.W.; El-Mandouh, M.A. Punching Shear Behavior of Slabs Made from Different Types of Concrete Internally Reinforced with SHCC-Filled Steel Tubes. Materials 2022, 16, 72. [Google Scholar] [CrossRef] [Scilit]
- Bhasi, A.; Rajagopal, K. Geosynthetic-Reinforced Piled Embankments: Comparison of Numerical and Analytical Methods. Int. J. Geomech. 2015, 15, 04014074. [Google Scholar] [CrossRef] [Scilit]

Disclaimer/Publisher’s Note: The statements, opinions and data contained in all publications are solely those of the individual author(s) and contributor(s) and not of MDPI and/or the editor(s). MDPI and/or the editor(s) disclaim responsibility for any injury to people or property resulting from any ideas, methods, instructions or products referred to in the content. |
© 2026 by the authors. Licensee MDPI, Basel, Switzerland. This article is an open access article distributed under the terms and conditions of the Creative Commons Attribution (CC BY) license.