


Abstract
Understanding individual growth is essential for assessing exploitation status and supporting sustainable fishery management. For the southern Brazilian stock of the mullet Mugil liza, previous growth estimates were based on whole otolith readings and included few young individuals, potentially influencing growth parameter estimation and stock assessment outputs. In this study, daily otolith microincrements of juveniles were validated using oxytetracycline (OTC) marking and combined with age–length data from a previous study to evaluate the effect of incorporating validated juvenile ages into von Bertalanffy growth function estimates. The updated model yielded a 15% smaller asymptotic length (564 mm), a 47% higher growth coefficient (0.28 yr−1), and a theoretical age at zero length closer to biologically plausible values (t0 = −0.11). Revised growth parameters were incorporated into an age-structured production model (ASPM). Although temporal trends in spawning biomass and fishing mortality remained similar, substantial differences were observed in biomass scale and biological reference points. These findings highlight the sensitivity of stock assessment outputs to growth parameterization and the importance of adequately representing early life stages in growth models.
Keywords:
fish; stock assessment; modeling; age; ASPM; life-history; young-of-the-year; stock synthesis; management Key Contribution:
Validation of daily otolith microincrements in juvenile Mugil liza revealed that young-of-the-year age incorporation substantially changes growth estimates and stock assessment outcomes for the southern Brazilian stock.
1. Introduction
Growth is one of the most fundamental life-history traits in fishes, shaping maturation schedules, mortality rates, productivity, and stock resilience [1]. In fisheries biology, growth is most often described by the von Bertalanffy growth function (VBGF), whose parameters (L∞, k, t0) are central inputs for stock-assessment models and for deriving biological reference points [1,2,3]. Since biological reference points are directly derived from these life-history parameters, inaccuracies in growth estimation inevitably influence stock assessments and management advice [4,5].
Even a single change in a misestimated growth parameter can shift the demographic basis of stock assessments and change reference-point estimations. For example, Kuriyama et al. [6] demonstrated that spawning stock biomass (SSB) estimated through an integrated model may be substantially biased if the growth parameters are misspecified. Such misestimations may yield false-negative outcomes, wherein a stock is erroneously estimated to have exceeded a limit, or false-positive outcomes, where serious depletion remains undetected [7,8]. Both types of outcomes can impose substantial costs on management, whether through unnecessary allocation of resources to rebuilding measures or through the failure to recognize dangerously low stock levels [9].
The Brazilian mullet Mugil liza sustains important artisanal and industrial fisheries in southeastern and southern Brazil [10,11,12]. The southern population of this species extends from the coast of São Paulo (23° S) to Argentina (36° S) [13], and it migrates annually among estuaries in Argentina, Uruguay, and southern Brazil to reproduce in marine spawning grounds near 26° S [14,15]. While this stock is shared across national boundaries, management measures are implemented independently by each country. In Brazil, catch limits have been assigned to different fisheries by the federal management system since 2018 based on stock-assessment models that integrate fishery-dependent data with biological information to estimate stock status and sustainable yields [11,16]. In these models, life-history traits, particularly the growth parameters derived from the VBGF, are key determinants of productivity and resilience. Therefore, uncertainties in growth estimation directly affect Brazilian assessments and have potential consequences for quota recommendations and national management decisions.
Although M. liza is generally considered a single migratory stock throughout southern Brazil, Uruguay, and Argentina, estimates of VBGF parameters remain inconsistent among studies, posing a challenge for stock assessments in Brazil. González-Castro et al. [17] analyzed whole otoliths to perform age determination of individuals caught in Argentina and reported relatively fast growth (L∞ = 563.8 mm, k = 0.30 year−1, t0 = −0.057). The species examined by González-Castro et al. [17] was described as Mugil platanus, following the nomenclature adopted at the time. Subsequent taxonomic revisions recognized populations from the southwestern Atlantic as M. liza [18]. In contrast, Garbin et al. [19] analyzed whole otoliths from southern Brazil and reported considerably slower growth (L∞ = 662 mm, k = 0.168 year−1, t0 = −1.7). These discrepancies may reflect a combination of biological, temporal, and methodological factors. However, reliable estimation of growth parameters requires representative sampling across all life stages. In this regard, misrepresentation of certain age classes, particularly early juveniles, can bias growth trajectories and compromise the accuracy of subsequent analyses [20,21]. In particular, the Brazilian dataset [19] lacks juvenile data (fish younger than 1.5 years). In VBGF fits, omitting data from early ages typically inflates L∞, deflates k, and drives t0 to unrealistically negative values to reconcile the curve with the observed lengths at each age [22].
Inclusion of juvenile length-at-age observations can reduce biases in the estimates of VBGF parameters by anchoring the rapidly changing early portion of growth [23]. Early growth can be estimated from daily microincrements in sagittal otoliths, provided the increment periodicity is independently validated for the study population [24,25]; such validation can be obtained through controlled chemical marking. Oxytetracycline (OTC) produces a persistent fluorescent mark in otoliths, allowing direct confirmation of daily incremental deposition under experimental conditions [26,27]. When OTC-validated juvenile ages are integrated with validated ages of older individuals, the resulting length-at-age series can span ontogeny and support more stable VBGF fits, mitigating the artifacts associated with juvenile underrepresentation [23,28].
Given this context, the present study first attempted to validate the daily periodicity of otolith microincrements in juvenile M. liza from southern Brazil by using an oxytetracycline (OTC) immersion experiment. Then, we integrated the resulting juvenile length-at-age data into the otolith dataset of individuals older than 1.5 years analyzed by Garbin et al. [19] to refit the VBGF and quantify the effect of early ages on the estimates of von Bertalanffy parameters (L∞, k, t0). Finally, for the southern Brazilian stock, we fit an age-structured production model (ASPM) parameterized with the juvenile-informed VBGF and assessed its sensitivity to growth specifications by contrasting its outputs with those from the latest official ASPM assessment for the stock (i.e., [16]), which used the growth function proposed by Garbin et al. [19].
2. Materials and Methods
2.1. Microincrement Validation
To validate the daily microincrements in sagittal otoliths in juvenile M. liza, we conducted an OTC immersion marking experiment under controlled laboratory conditions. For this purpose, a total of 109 juveniles (total length [TL], 48–94 mm) were collected with a dip net in the Patos Lagoon estuary, southern Brazil (32°8.65′ S, 52°6.13′ W) on 25 August 2024 and transported in aerated containers to the Marine Aquaculture Station (EMA), Institute of Oceanography, Federal University of Rio Grande. At the EMA, the fish were maintained in two identical 1000-L circular black tanks (Tank A: n = 55 fish; Tank B: n = 54) connected to a recirculating seawater system. The intake seawater was filtered to a sump and recirculated to the tanks by a secondary pump; evaporative losses were compensated by weekly water additions to the sump. The tanks were illuminated by overhead fluorescent lamps controlled by a programmable timer adjusted weekly to match the natural photoperiod. Water quality was monitored daily (ammonia, nitrite, alkalinity, dissolved oxygen, temperature, and salinity), while pH was monitored weekly; continuous aeration maintained the dissolved oxygen level at 7.5–8.5 mg L−1. During the holding period, the mean in-tank temperature was 18.5 °C, and mean salinity was 29 ppt. The fish were fed a commercial omnivorous diet twice daily to apparent satiation. For the purposes of this study, fish were considered acclimated after at least seven consecutive days without mortality following transfer to the experimental tanks, in accordance with OECD recommendations for fish acclimation [29]. This criterion was achieved after 61 days in holding, after which OTC marking was initiated.
Following acclimation, we implemented the OTC immersion protocol that has been previously validated for the congeneric species Mugil cephalus [27], adapting it for juvenile M. liza to assess the daily periodicity of otolith microincremental deposition. The surviving juveniles (n = 42) were randomly allocated to four aerated 50-L containers (10 fish in three containers and 12 in the remaining tank) filled with seawater from the recirculating system. The fish were exposed to an OTC bath at 600 mg L−1 for 24 h and then returned to their original holding tanks. Post-marking, five fish were euthanized at 7-day intervals over a 56-day period (days 7, 14, 21, 28, 35, 42, 49, and 56) to quantify the intervals between the OTC mark and the otolith edge. At each sampling, TL (mm) was recorded, and sagittal otoliths were removed for subsequent preparation and reading.
The sagittal otoliths were embedded in polyester resin blocks and transversely sectioned through the core with a low-speed metallographic saw equipped with a diamond-powder blade (Isomet, Buehler Ltd., Coventry, UK) to obtain 0.25-mm-thick sections. These sections were mounted on glass slides by using Entellan® (Merck, Darmstadt, Germany) acrylic mounting medium and polished with sandpapers of varying grit sizes until the microstructure was clearly resolved. A fluorescence microscope (Optiphot, Nikon Corporation, Tokyo, Japan) equipped with a 50-W mercury-vapor lamp (Carl Zeiss AG, Oberkochen, Germany) and incident ultraviolet illumination was used to detect the OTC mark, which appeared as a greenish band due to the reaction between OTC and calcium. Fluorescence was observed through a 540–570-nm band filter, in accordance with the protocol described by Tzeng & Yu [30].
For each otolith, growth microincrements were read five times by the same reader at 24-h intervals to minimize potential memory biases and increase the reliability of within-reader precision estimates. The median value across the five readings was used as the microincrement count for that otolith. To evaluate daily periodicity, only the OTC mark-to-edge increments were read three times at 24-h intervals by the same reader; the median OTC mark-to-edge count for each individual was then regressed against the number of days elapsed since OTC immersion. Daily deposition was inferred when the fitted relationship showed a slope close to 1 and an intercept close to 0, consistent with one increment per day.
2.2. Growth Estimation
To estimate growth parameters for the southern Brazilian M. liza stock, we assembled a merged length-at-age dataset by appending 42 OTC-validated juvenile specimens to the adult length-at-age dataset reported by Garbin et al. [19], which comprised 1211 specimens (368 males, 290 females, and 553 unsexed individuals) with ages ranging from 1.5 to 10.5 years. Juvenile ages, originally determined from daily otolith microincrement counts, were converted to decimal years (days/365.25) prior to merging with the adult dataset to ensure a common temporal scale. This conversion may introduce a negligible rounding error in the youngest age classes, but its effect is minimal relative to the age range represented in the combined dataset. We then fitted the VBGF using a Bayesian approach to estimate L∞, k, and t0 with 95% credible intervals. The merged dataset was used in all model configurations, including a combined-sex fit and separate fits for males and females.
The age-at-length data were assumed to show a log-normal distribution: yi = log(μi,σ2), where yi is the length distribution with an average expected length at an age class i, μi, and with variance σ2. A logarithmic version of the von Bertalanffy equation was used for computational convenience:
- (1)
- Uninformative priors were used as follows:
Posterior distributions for each sex and combined-sex were developed from Markov Chain Monte Carlo (MCMC) analysis. After 5000 burn-in runs, every second value of the remaining 20,000 was retained, resulting in a final sample of 10,000 in each of the tree chains in the posterior distribution of the VBGF parameters [31]. The MCMC sampling was performed in JAGS [32] using the rjags interface package under R 4.4. [33].
2.3. Stock Assessment
The status of the M. liza southern Brazilian stock was assessed up to 2022 by FURG/MPA [16] using the Stock Assessment Continuum Tool (SAC-Tool; [34]), which is based on the Stock Synthesis likelihood-based statistical catch-at-age framework (SS3; [35]). Among the configurations available in SAC-Tool (SS3 V3.30.25), the ASPM was selected, since it aligns with the data available for this stock. In addition to incorporating input data related to fishing sources, such as catches and abundance indices, this configuration is based on pre-specified life-history parameters, including growth (L∞, k and t0), natural mortality (M), female length at maturity (L50 and L95), length–weight relationship, and recruitment parameters (steepness, log of virgin recruitment level, and standard deviation of log recruitment).
In the present study, we re-ran the ASPM applied in FURG/MPA [16], which originally incorporated the Garbin et al. [19] growth function, replacing it with the juvenile-informed VBGF described in Section 2.2. All other data inputs and estimation settings were kept identical to the official assessment. For both assessments, we reported the time series of the SSB, spawning stock biomass ratio (SSB/SSBMSY), fishing mortality ratio (F/FMSY), recruitment, and equilibrium yield-depletion curves with the derived reference points. The differences between the two runs were interpreted as the sensitivity of the stock status to growth specifications.
The model was configured to reconstruct the historical SSB with a single fleet, single area, and pooled-sexes approach. Natural mortality (M) was fixed at 0.45, derived from the empirical relationship M = 5.109/tmax [36]. The pooled-sex length–weight relationship from the study by Garbin et al. [19] was applied: TW = 0.0006 × TL 3.062. Fecundity was modeled as a power function of total length: eggs = a × TL b. Maturation parameters were L50 = 422 mm and L95 = 485 mm [15]. Fishery selectivity was specified as logistic, based on the length compositions in the study by Garbin et al. [19], with SL50 = 325 mm and SL95 = 420 mm. A standard Beverton–Holt stock-recruitment function was assumed, and the log of the virgin recruitment level (lnR0) was estimated internally through maximum likelihood estimation (MLE). Steepness was fixed at 0.684, matching the FishLife package estimate for this species [37].
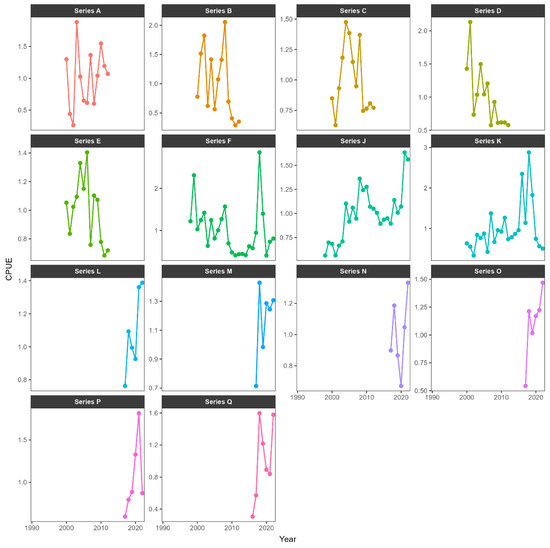
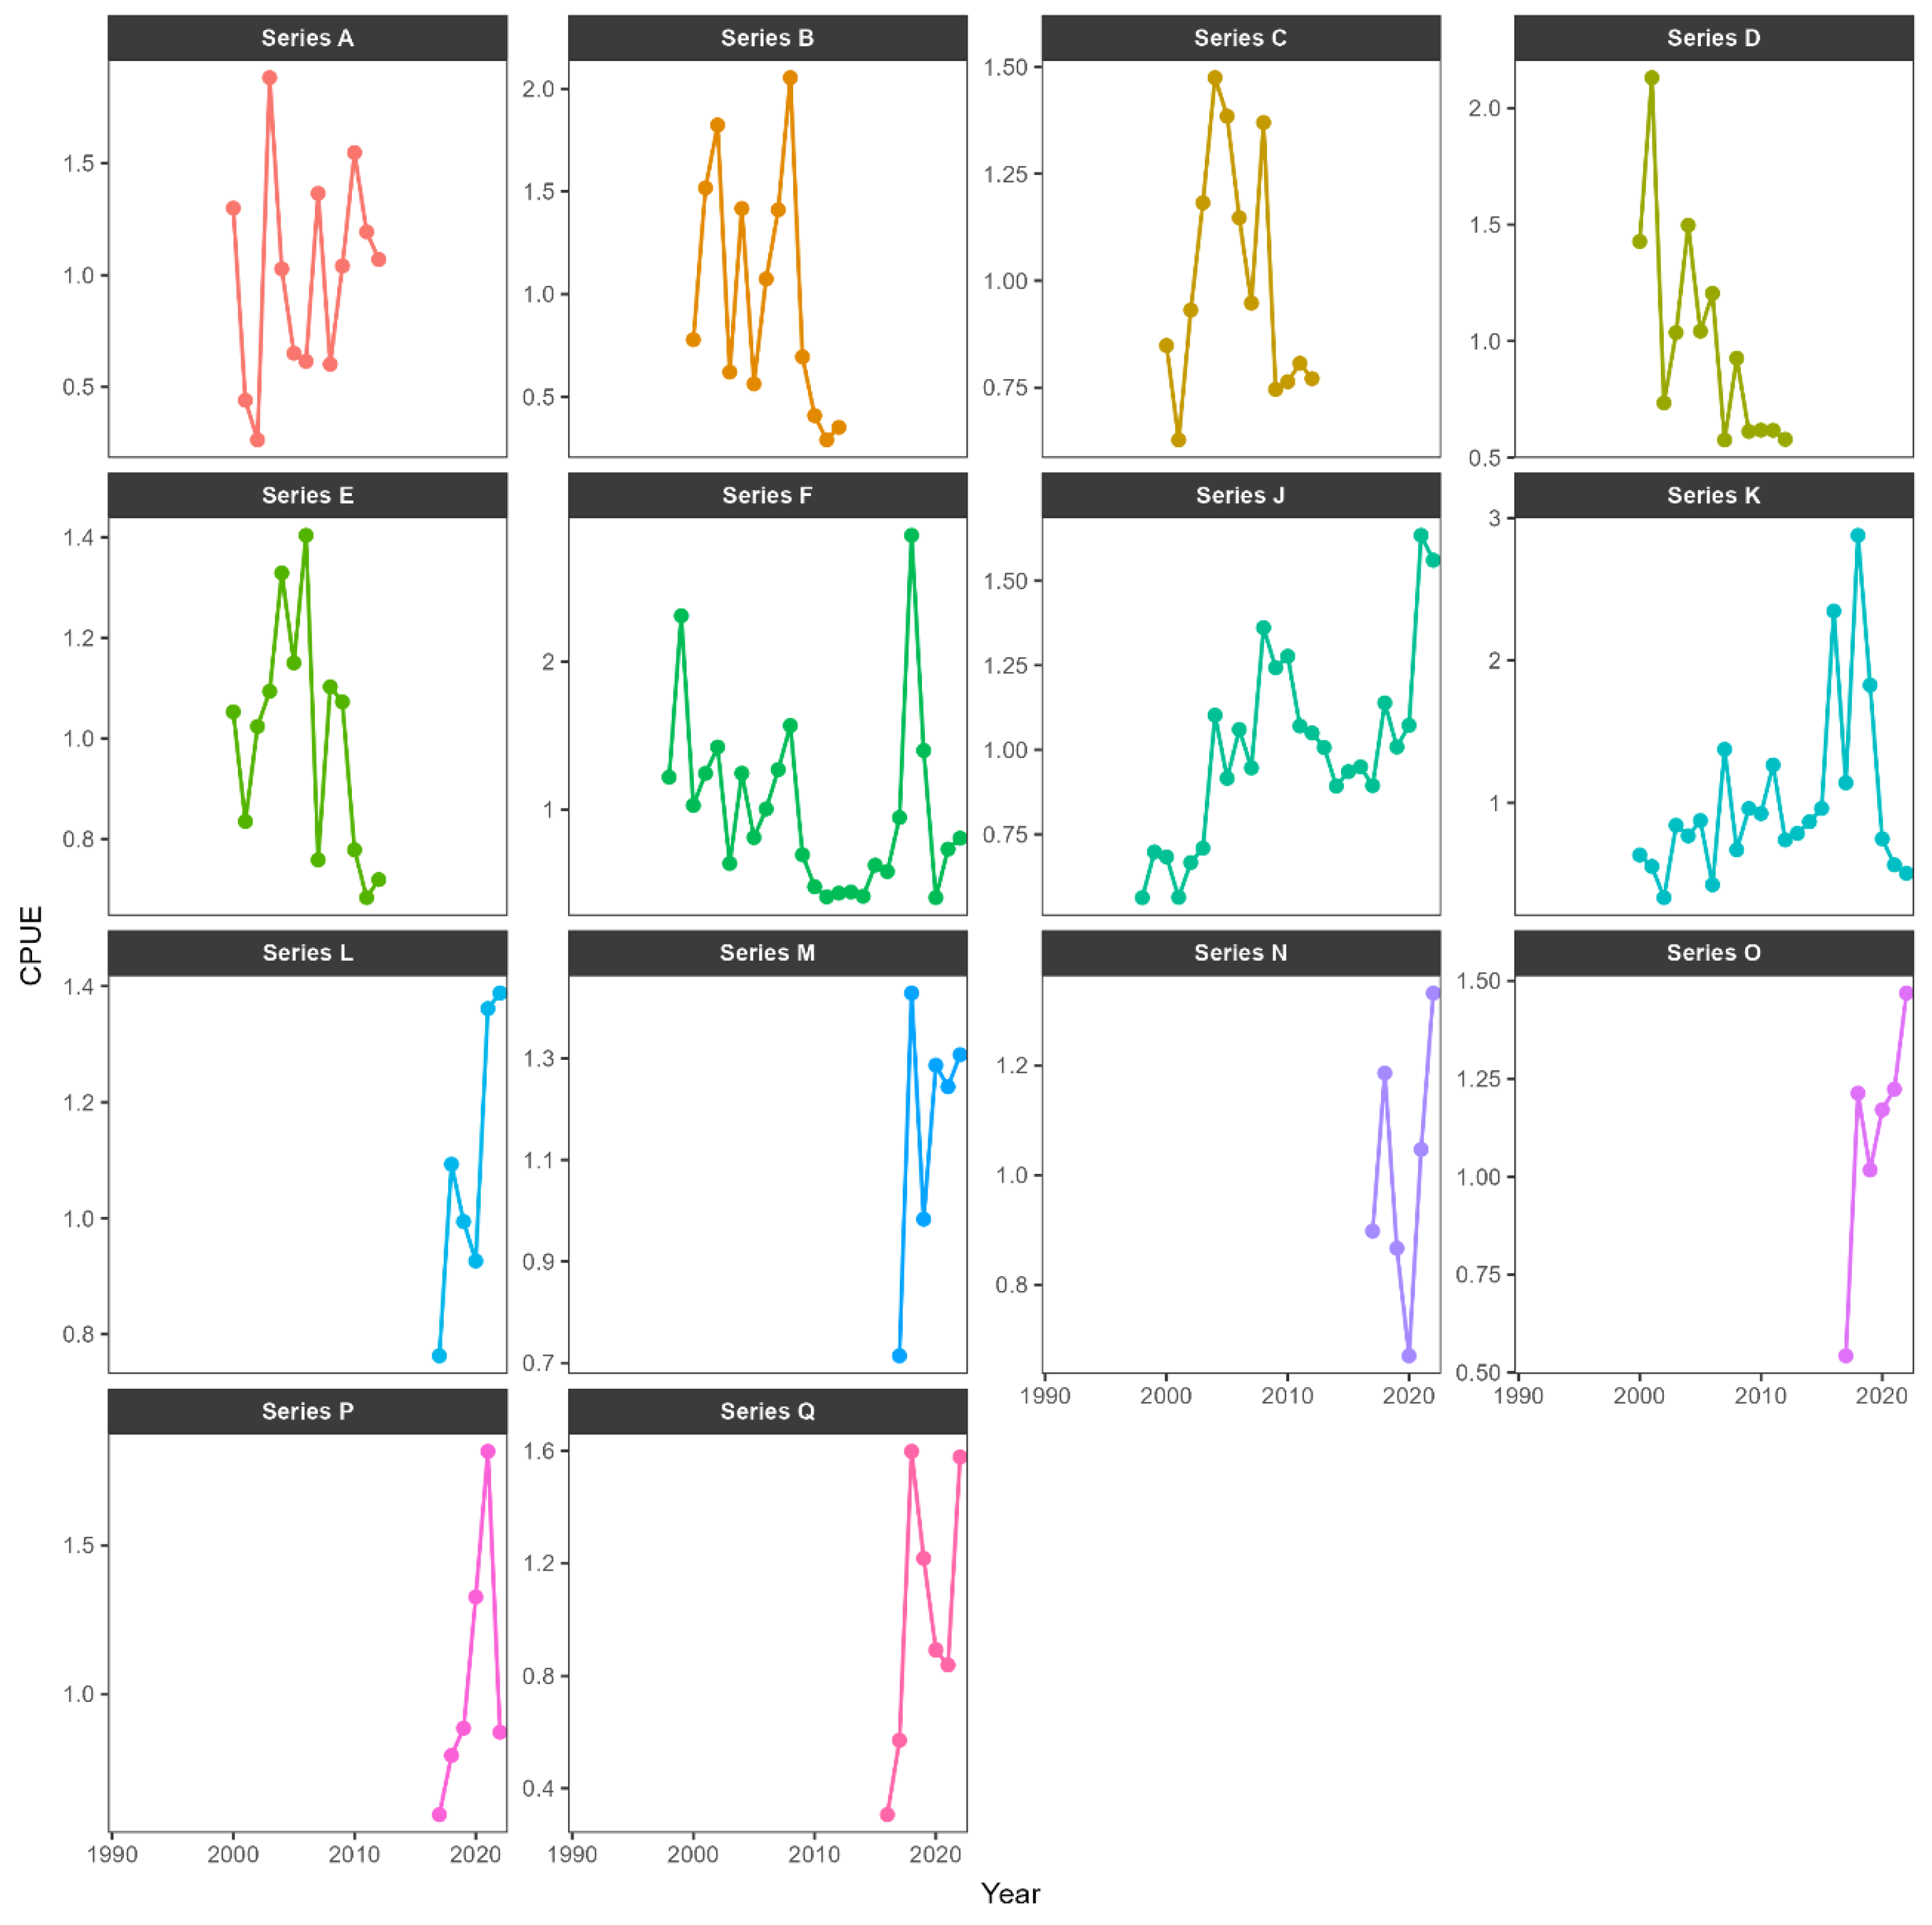
The catch time series encompassed landings from fisheries that operate along the São Paulo (SP), Paraná (PR), Santa Catarina (SC), and Rio Grande do Sul (RS) states, which constitute the southern stock of M. liza [14]. The historical series (1979–2022) was sourced directly from FURG/MPA ([16], scenario 01), which consisted of data from both official and unofficial databases with all catches aggregated into a single fleet. Relative abundance was represented by 14 fishery-dependent nominal CPUE series, also derived from FURG/MPA [16], which were incorporated into the model as survey series, all corresponding to the single aggregated fleet (Table 1; Figure 1).
Table 1.
The fishery-dependent CPUE series used as abundance indices in the age-structured production model (ASPM) assessment for the southern Brazilian stock of M. liza. Indices were compiled from state units of São Paulo (SP), Paraná (PR), and Santa Catarina (SC). Adapted from FURG/MPA [16].
Figure 1.
Fishery-dependent CPUE series used as abundance indices in the age-structured production model (ASPM) assessment for the southern Brazilian stock of M. liza. Adapted from the FURG/MPA assessment report [16].
3. Results
3.1. Microincrement Validation and Juvenile Age Determination
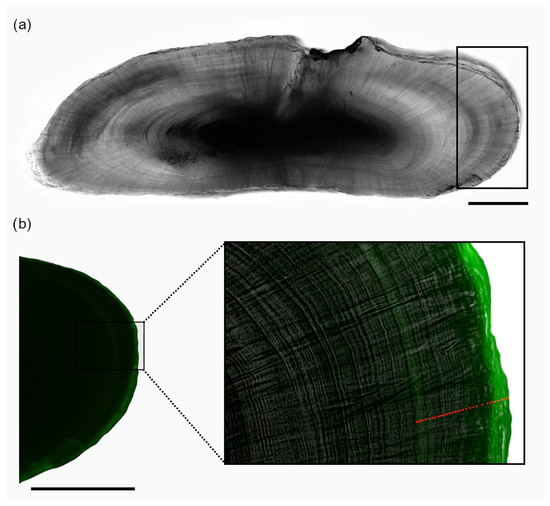
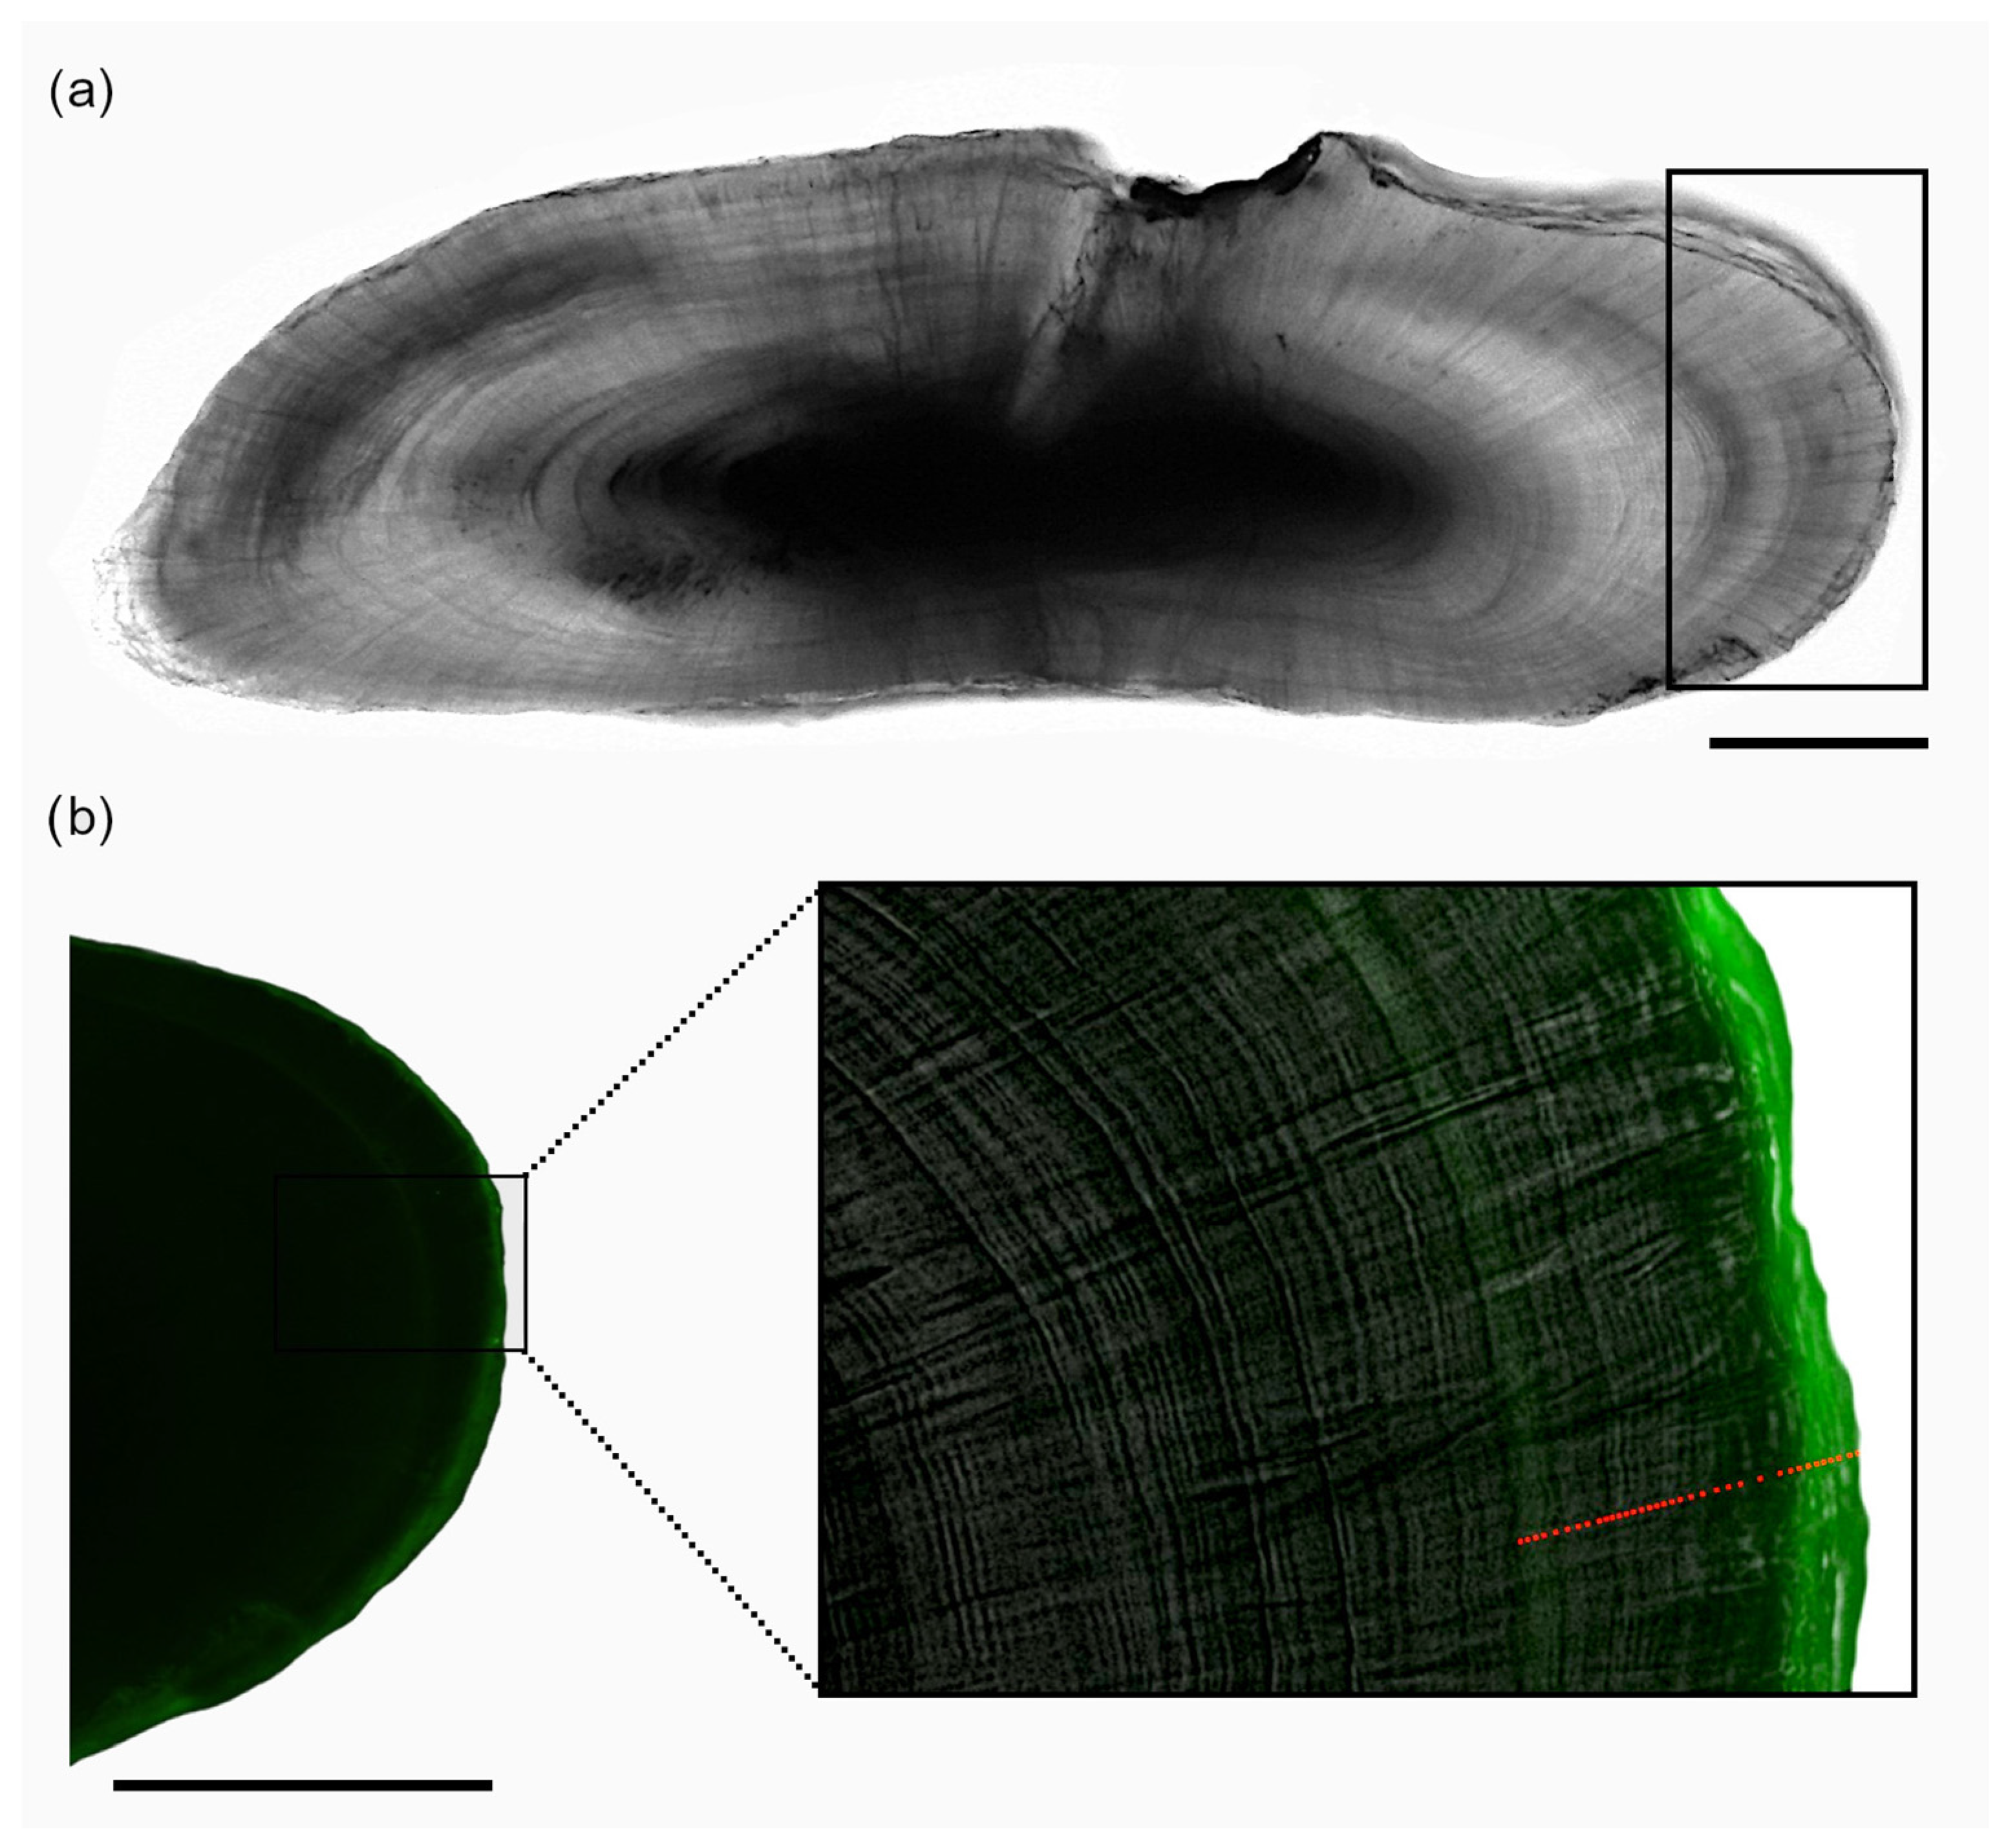
Of the 109 juveniles collected and held through acclimation, 42 survived until the OTC immersion. Post-immersion mortality was low: one death occurred during the marking/holding period (97.6% survival). Sagittal otoliths were recovered from all marked fish; 11 were deemed unreadable and excluded, and the remaining 31 otoliths were suitable for analysis of increments beyond the OTC mark. Across readable otoliths, total microincrement counts averaged 160.8 (standard deviation [SD], 9.42), with a mean within-reader coefficient of variation (CV) of 5.93%. Mark-to-edge counts closely tracked the number of days elapsed since immersion (Figure 2), supporting daily deposition.
Figure 2.
(a) Transverse section through the core of the sagittal otolith from a juvenile M. liza (total length [TL], 78 mm) sampled 35 days after oxytetracycline (OTC) immersion; a total of 160 daily microincrements were counted along the reading axis. (b) Image under epifluorescence showing the OTC mark as a greenish band; red dots indicate the 35 mark-to-edge increments counted for this specimen. The black scale bar represents 2 mm.
By the sampling weeks, mean OTC mark-to-edge counts closely matched the number of elapsed days (Table 2), ranging from 6.88 ± 0.84 at day 7 to 56.25 ± 1.24 at day 56. The CV declined as time increased (12.2% at day 7; ≤3% from day 35 onward), and the observed ranges consistently bracketed the elapsed days (e.g., 5–9 at day 7; 53–59 at day 56). Taken together, these patterns indicated near 1:1 correspondence between the counted increments and days since immersion and showed stable within-reader precision.
Table 2.
Summary statistics of mark-to-edge otolith microincrement counts by sampling week following oxytetracycline (OTC) immersion of juvenile M. liza. Columns show elapsed days since immersion, mean count ± standard deviation (SD), coefficient of variation (CV), observed range, and sample size (n = 31).
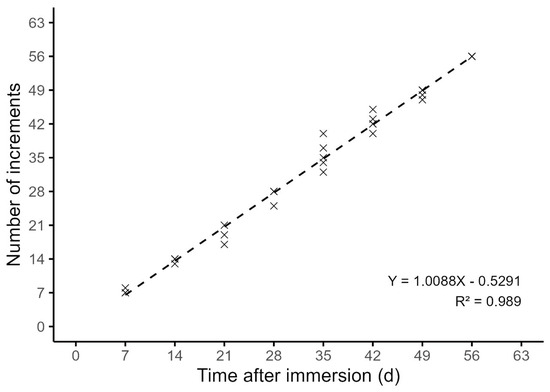
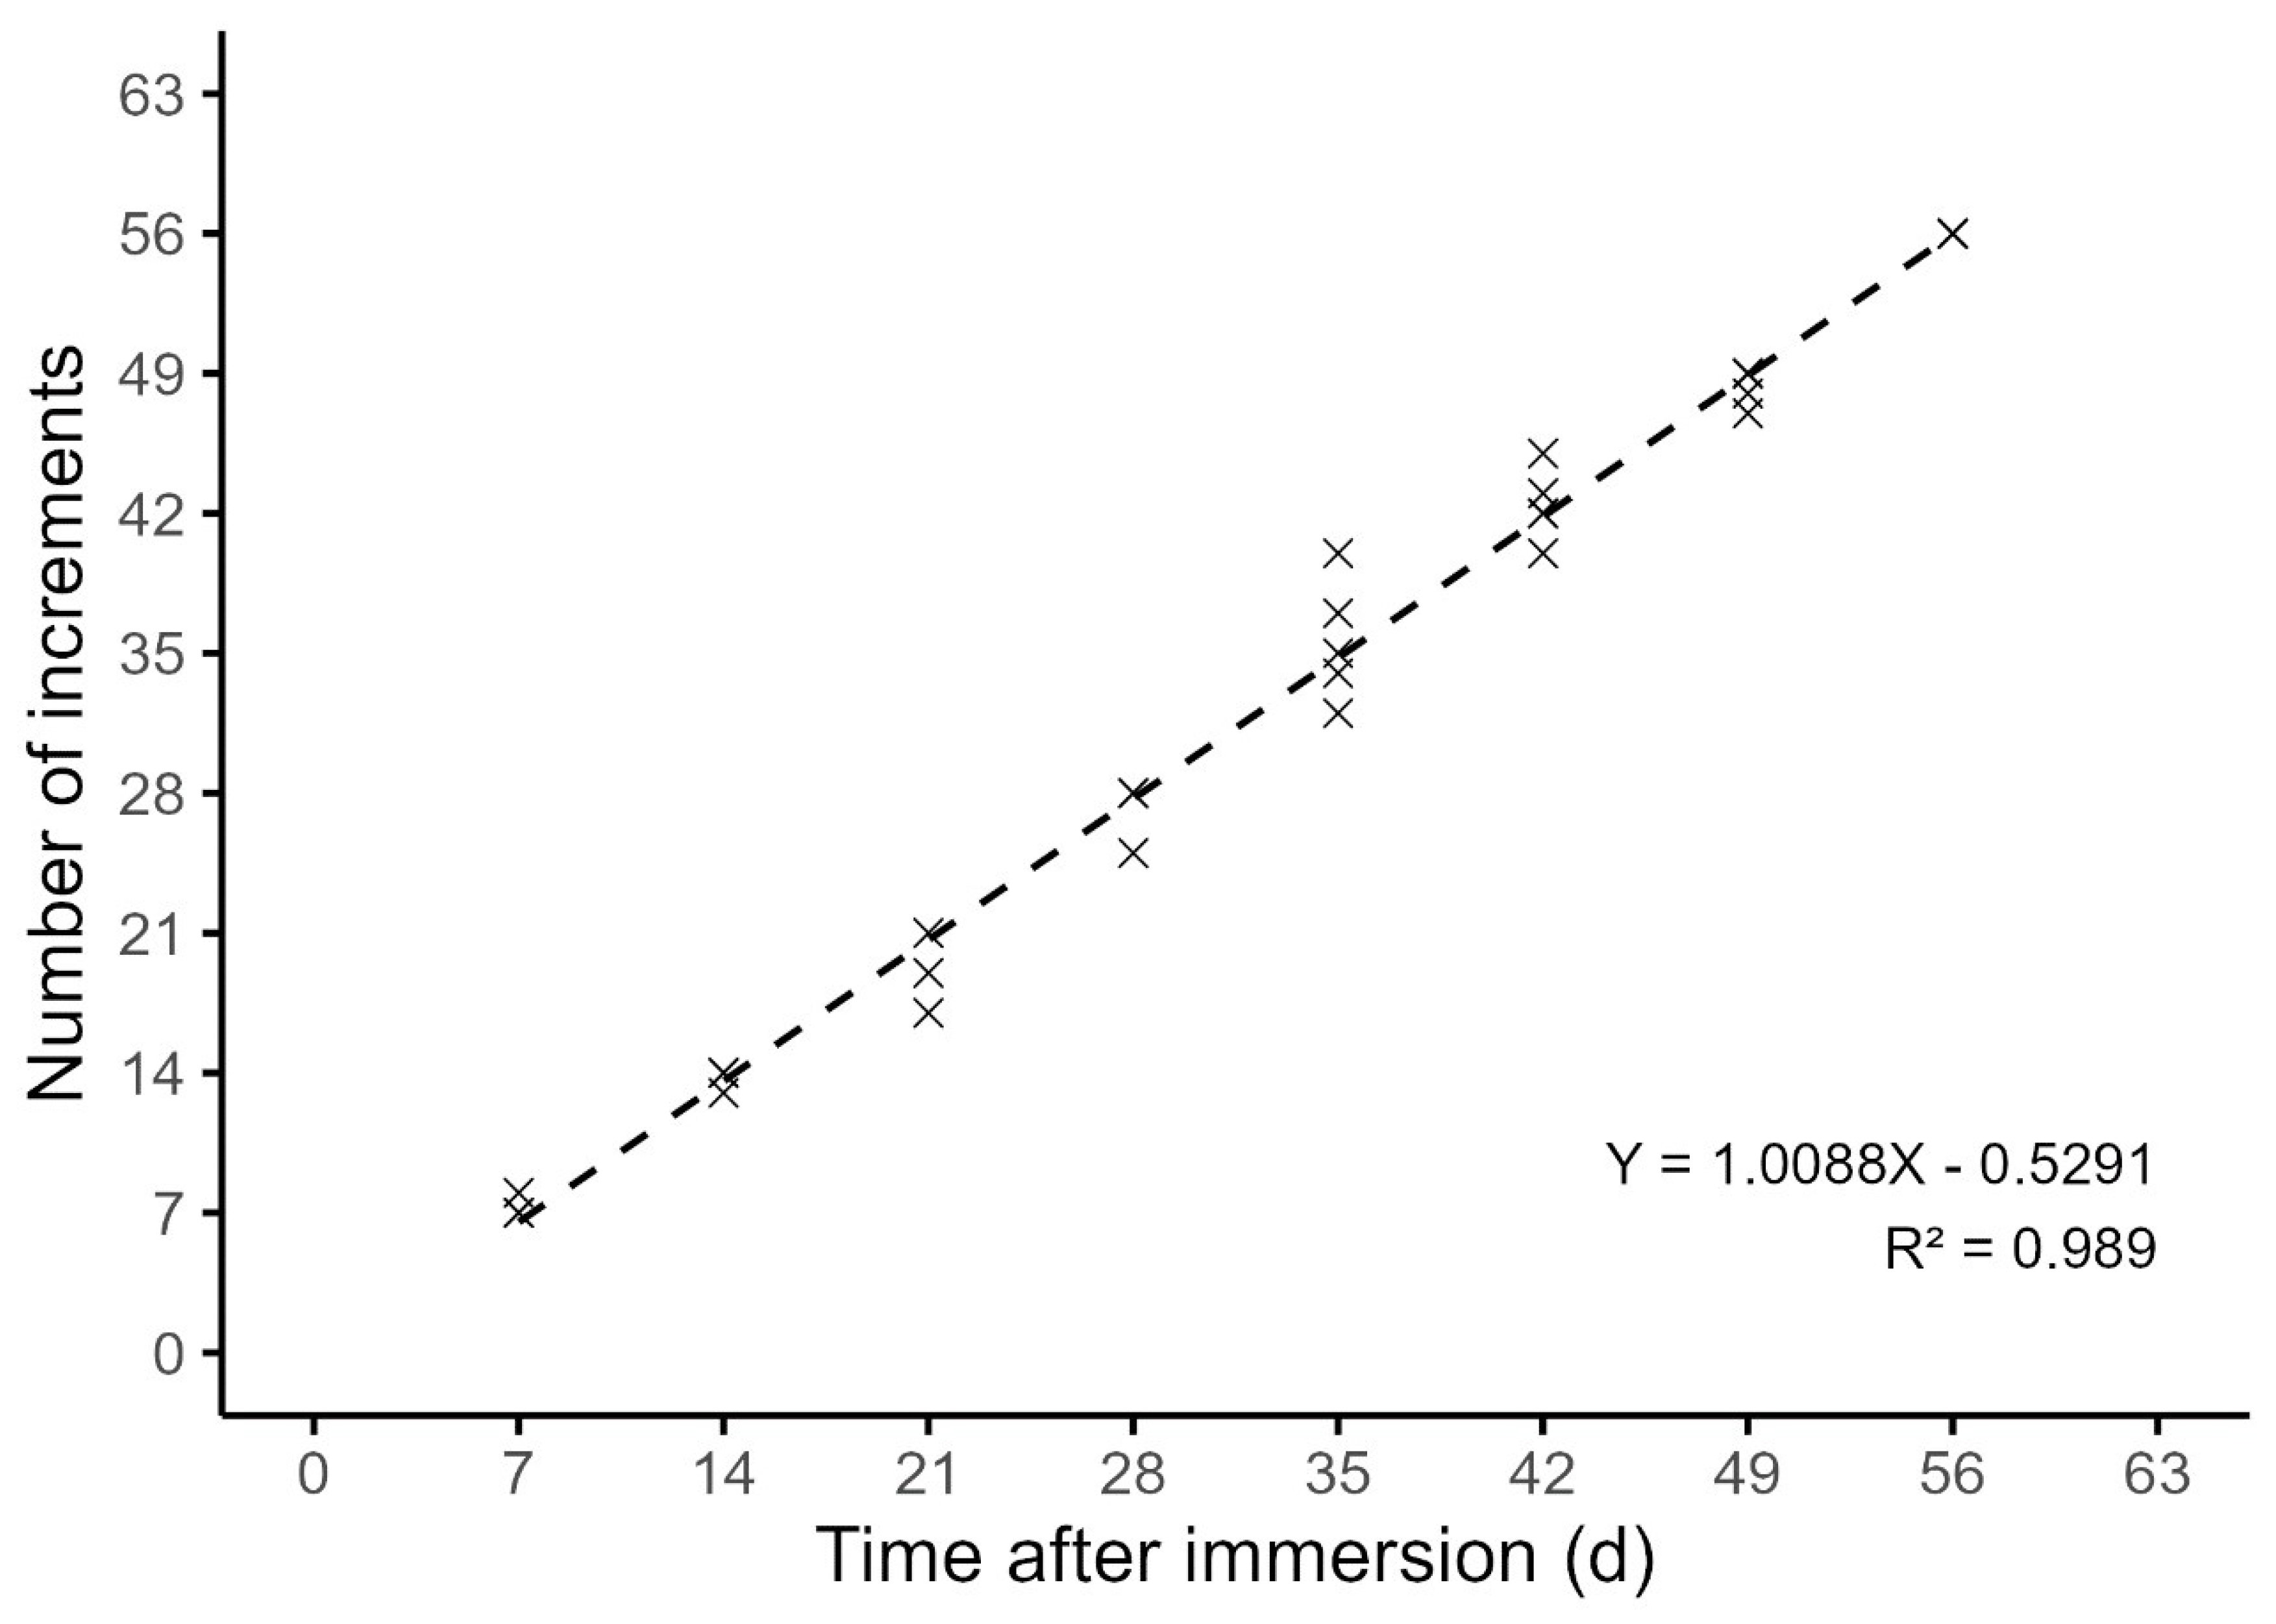
Mark-to-edge microincrement counts increased linearly with days after OTC immersion (Figure 3). The ordinary least-squares fit was described by Equation (2) with R2 = 0.989, where Y is the number of increments and X the elapsed days. The near-unity slope and near-zero intercept indicated that approximately one increment was formed per day across the 7–56-day range, consistent with daily deposition.
Y = 1.0088X − 0.5291
Figure 3.
Relationship between mark-to-edge otolith microincrement counts and days after oxytetracycline (OTC) immersion in juvenile M. liza. Each point represents the median count for one otolith; the dashed line is the ordinary least-squares fit.
3.2. Estimation of Von Bertalanffy Growth Parameters
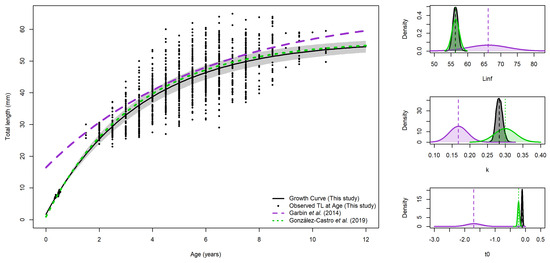
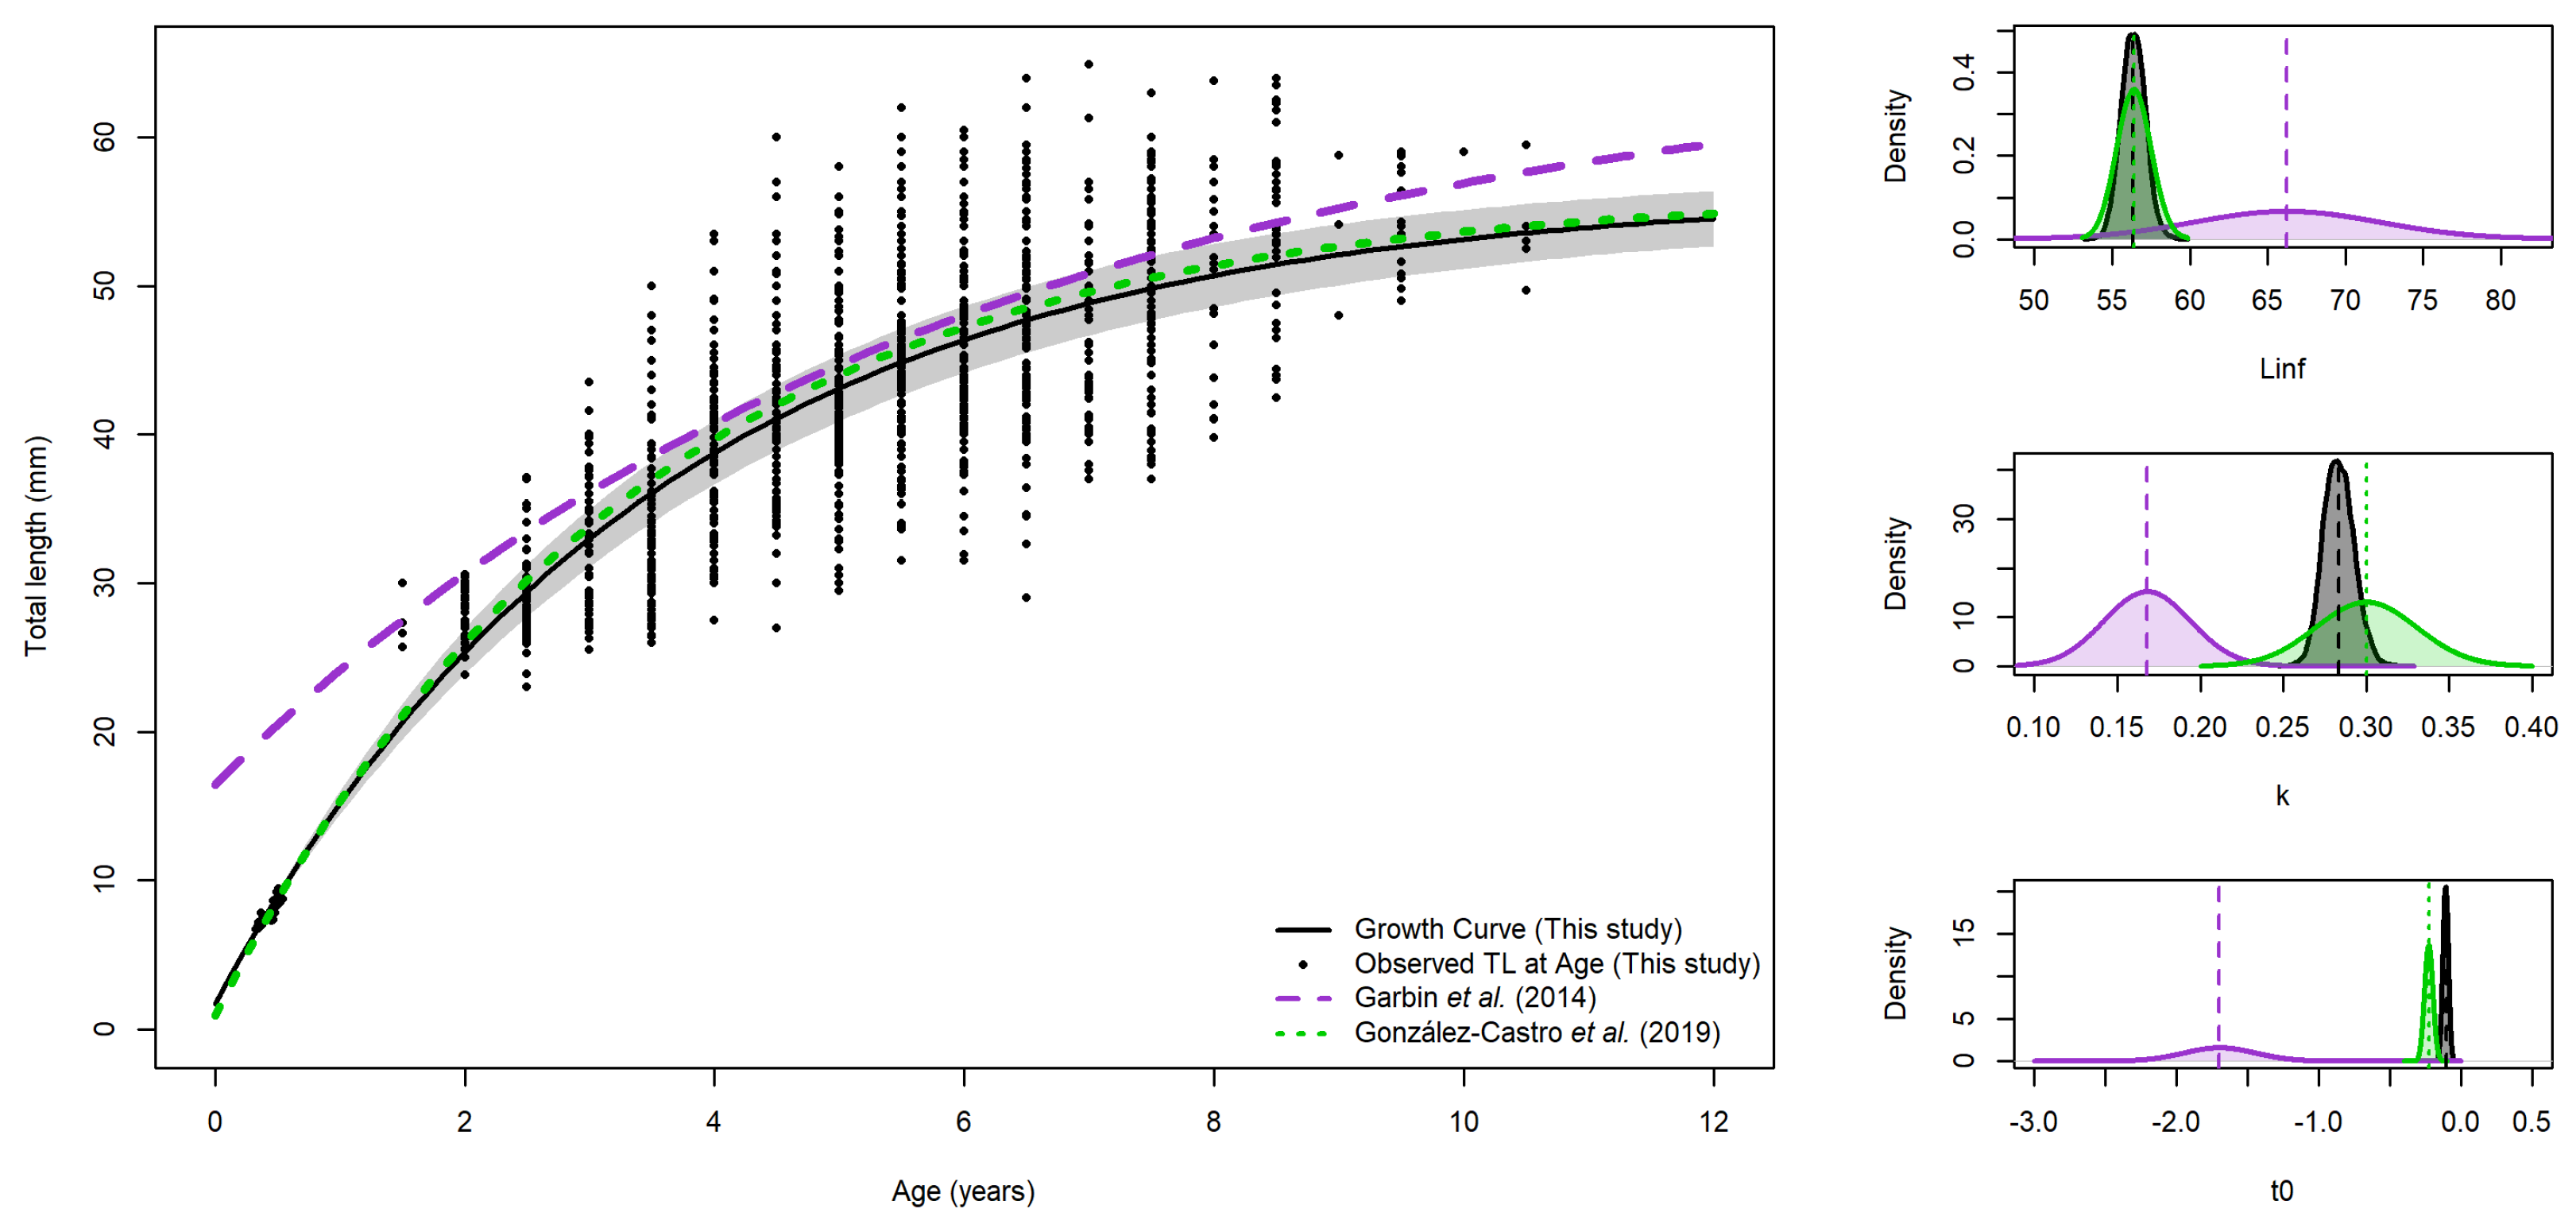
The decimal ages of juveniles were appended to the adult length-at-age series reported by Garbin et al. [19], and a Bayesian VBGF was fitted for both sexes combined and separately (Figure 4 and Figure 5). The refitted curve followed the juvenile observations and the adult data across the full age range. Visual inspection of the MCMC trace plots indicated adequate mixing and convergence for all estimated parameters (Supplementary Materials). The posterior densities for k and t0 showed little to no overlap with those reported by Garbin et al. [19] for all groups, and the L∞ posteriors were displaced downward with limited overlap. The updated model produced lower L∞ and higher k values, and the t0 shifted toward zero (Table 3). Notably, the combined-sex parameters converged towards those reported by González-Castro et al. [17] for Argentina (L∞ = 563.8, k = 0.30 yr−1, t0 = −0.057), indicating that inclusion of juvenile ages brings the early limb of the curve in line with these faster growth trajectories (Figure 4).
Figure 4.
Von Bertalanffy growth curves for the southern Brazilian stock of M. liza (sexes combined). Points represent observed length-at-age. The solid black line represents the posterior mean VBGF fitted in this study, and the gray band indicates the 95% credible interval. The purple dashed line represents the growth curve reported by [19], whereas the green dashed line represents the growth curve reported by [17]. Posterior density panels for L∞, k, and t0 are shown on the right, with vertical dashed lines indicating the corresponding parameter values from the published studies in the same colors.
Figure 5.
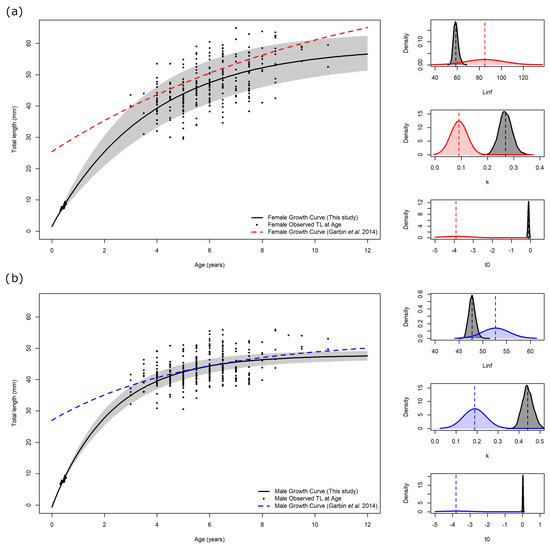
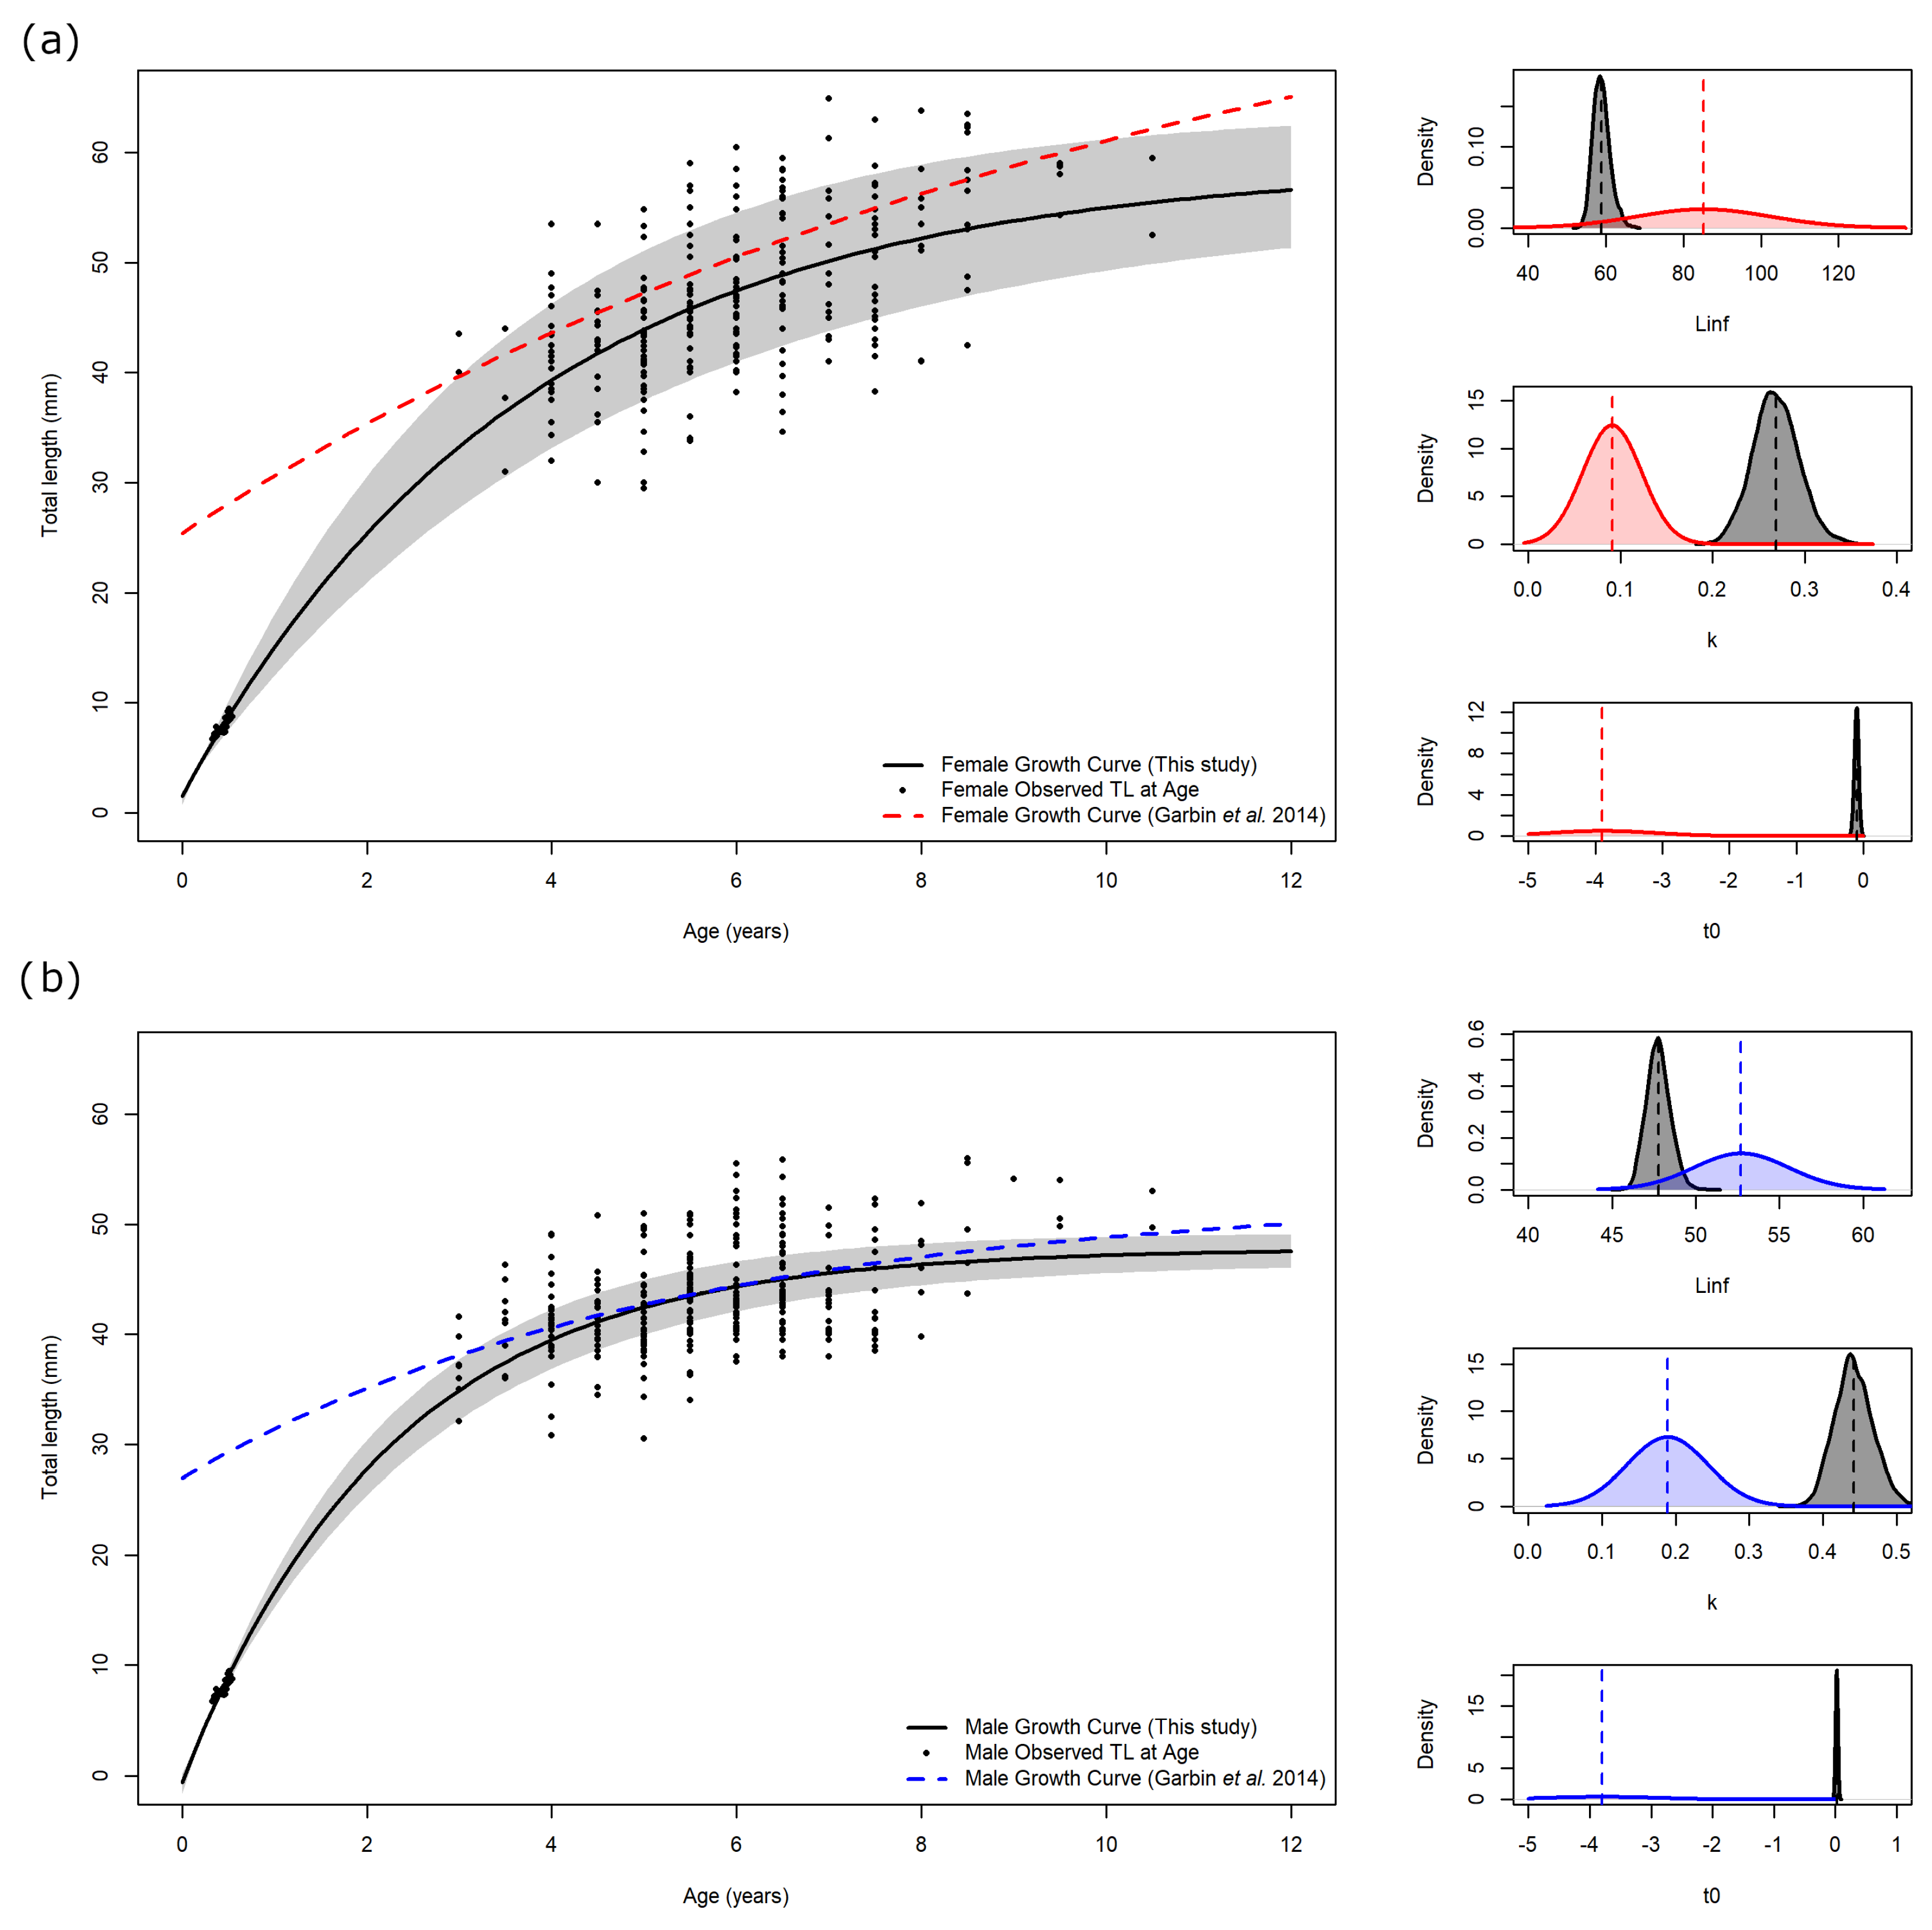
Von Bertalanffy growth curves for the southern Brazilian stock of M. liza: (a) females and (b) males. Points represent observed length-at-age. The solid black lines represent the posterior mean VBGFs fitted in this study, and the gray bands indicate the 95% credible intervals. The red dashed line in panel (a) and the blue dashed line in panel (b) represent the growth curves reported by [19] for females and males, respectively. Posterior density panels for L∞, k, and t0; are shown on the right, with vertical dashed lines indicating the corresponding parameter values from [19] in the same colors.
Table 3.
Von Bertalanffy growth function (VBGF) parameter estimates for the southern Brazilian stock of M. liza. Posterior means and 95% credible intervals (2.5–97.5%) are shown for this study (incorporating OTC-validated juvenile decimal ages) and for the findings reported by Garbin et al. (2014) [19], for both sexes combined and for males and females separately. Units: L∞ (mm TL), k (yr−1), t0 (yr).
Relative to the findings obtained by Garbin et al. [19], our new estimation of L∞ was ≈15% lower for both sexes combined (662 → 564 TL mm), ≈7% lower for males (527 → 488 TL mm), and ≈30% lower for females (851 → 592 TL mm); the new growth coefficient k was ≈47% higher in the combined model (0.19 → 0.28 yr−1), ≈111% higher in males (0.19 → 0.40 yr−1), and ≈189% higher in females (0.09 → 0.26 yr−1); and the magnitude of t0 declined markedly (−1.70 → −0.11 combined; −3.80 → −0.01 males; −3.90 → −0.10 females). Nevertheless, sex-specific fits preserved the expected contrast, with males (Figure 5a) showing higher k and smaller L∞ than females; this trend remained consistent with the observed length-at-age scatter (Figure 5b).
3.3. Re-Assessment of ASPM with the Alternative Growth Specifications
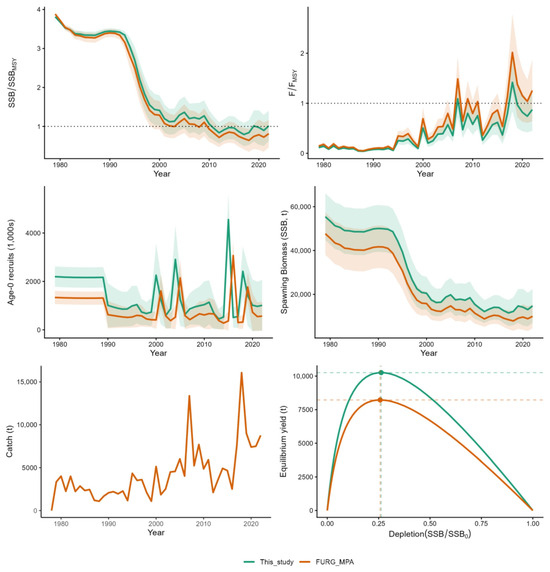
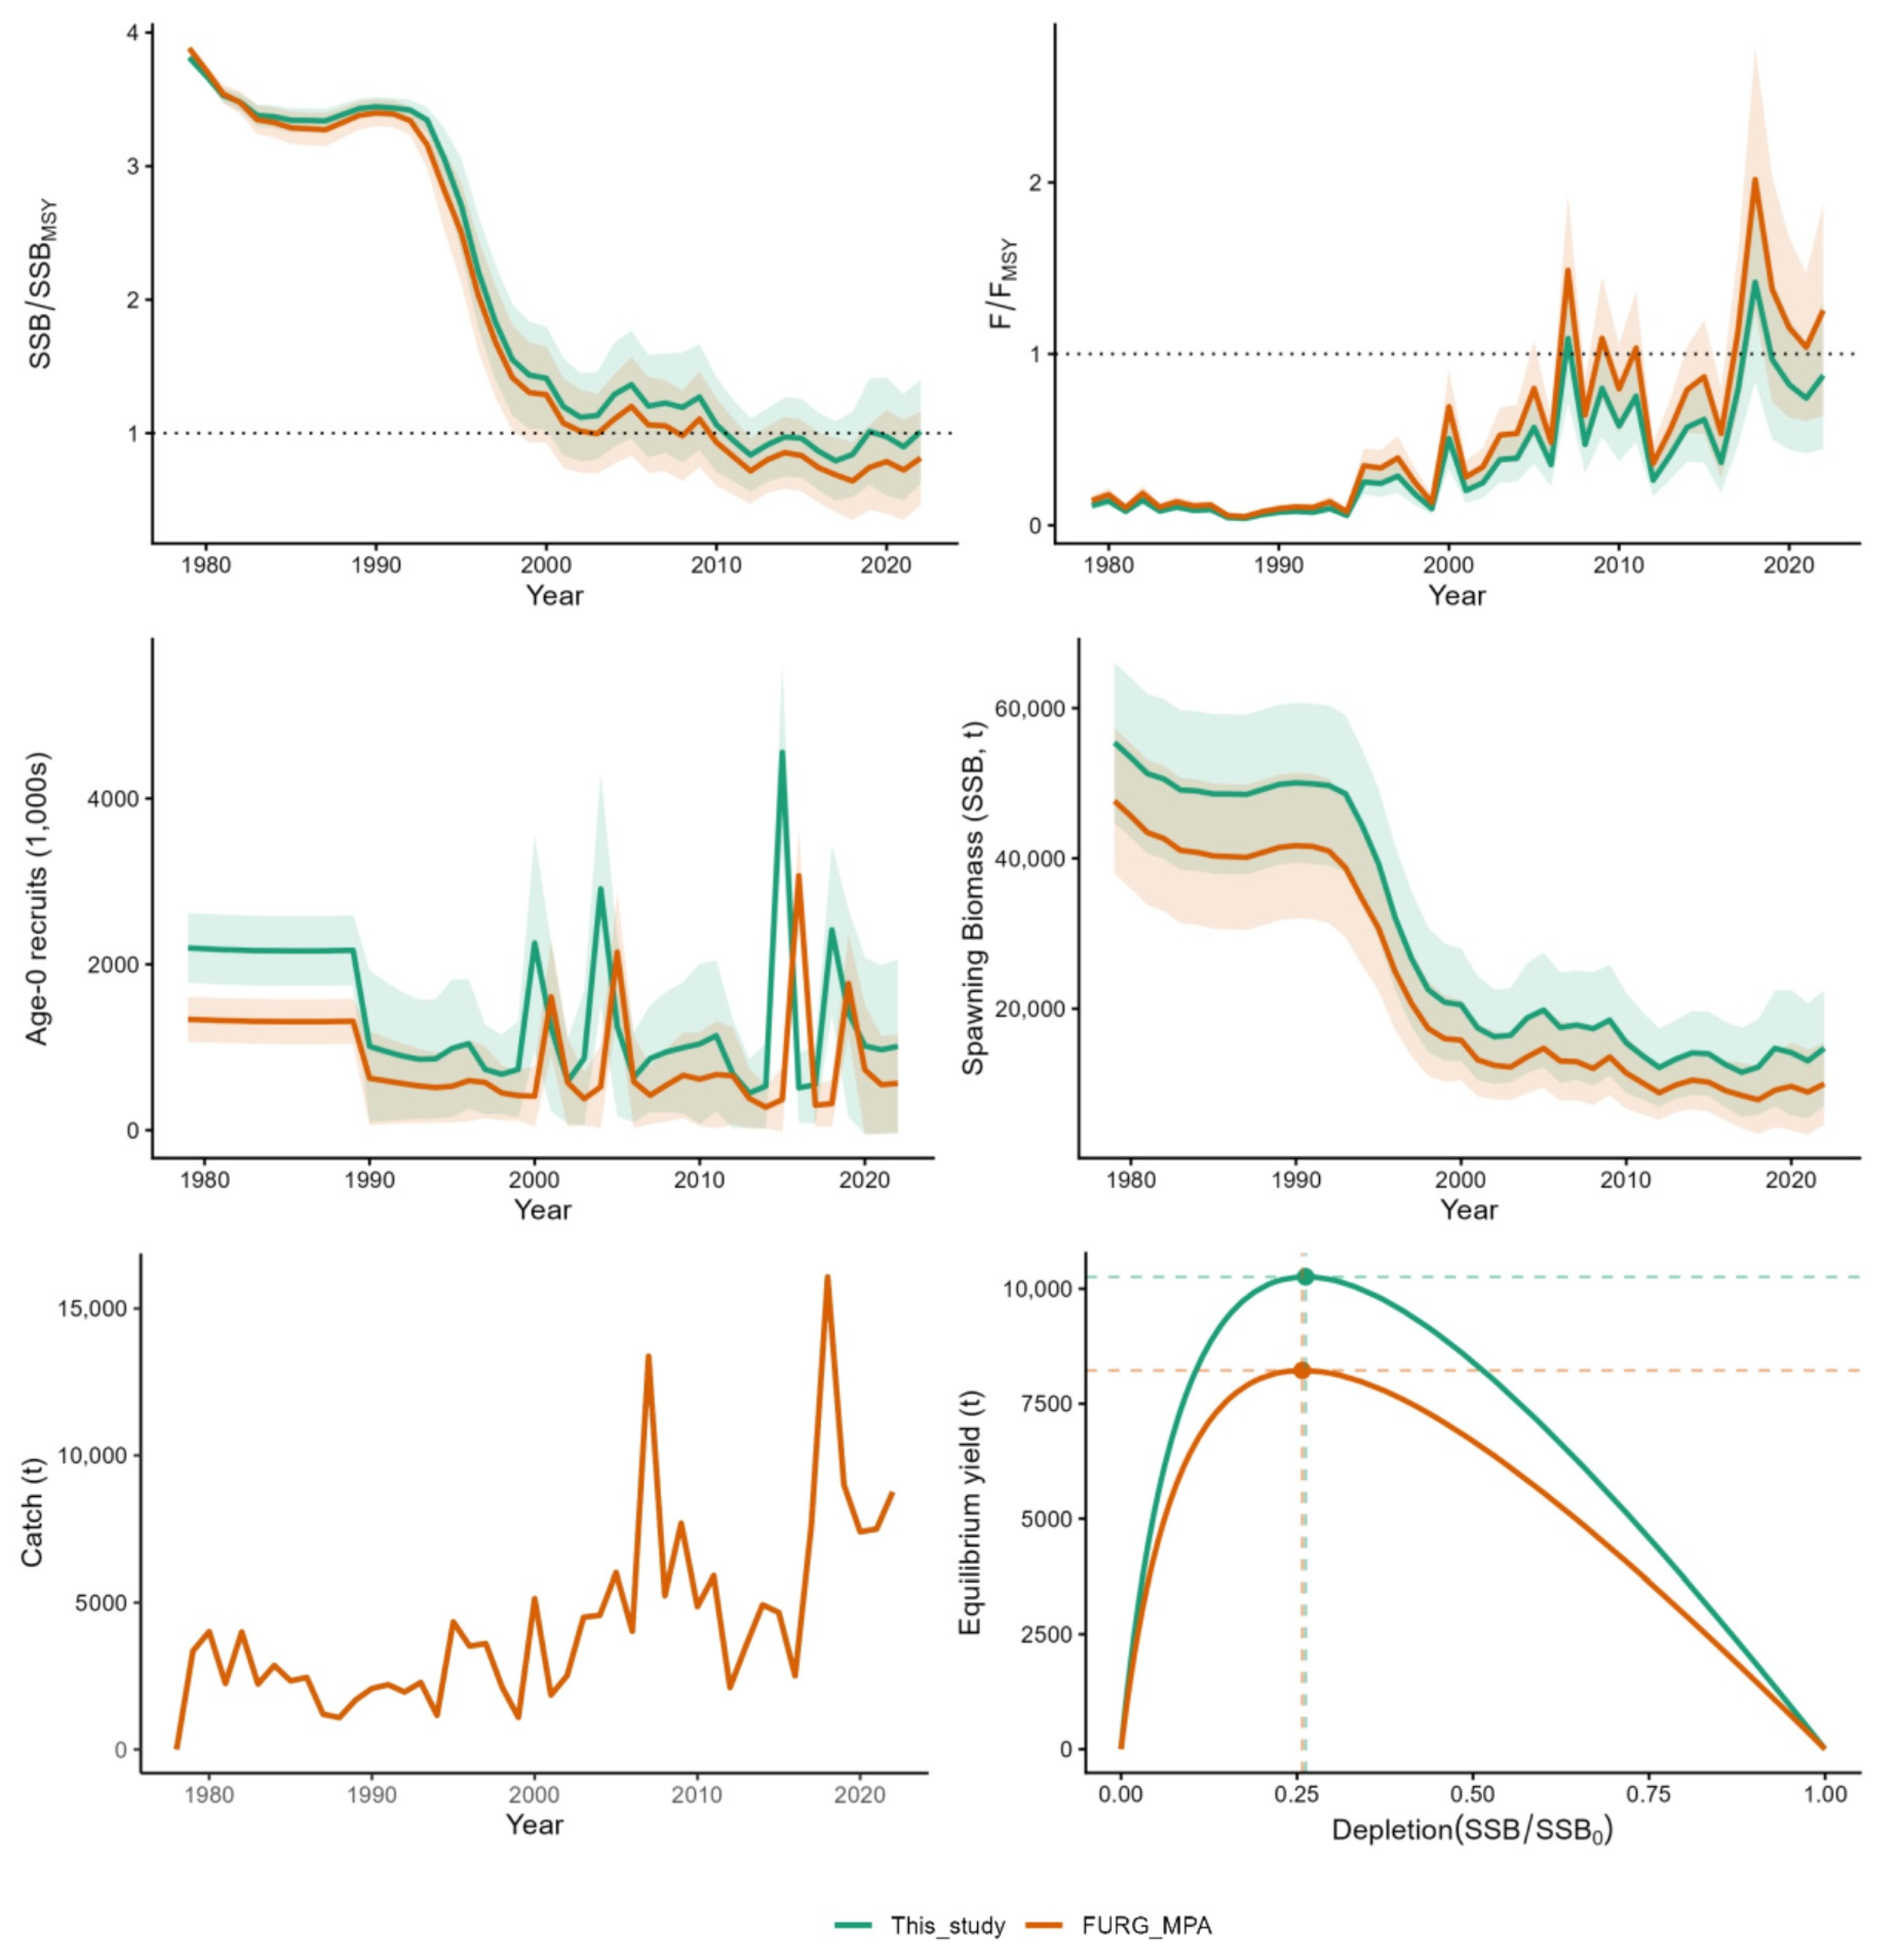
The outputs of the ASPM provided consistent reconstructions of the historical dynamics of the southern Brazilian M. liza stock (Figure 6). Both scenario 01 of the official FURG/MPA [16] assessment and the re-run with the juvenile-informed growth function indicated a pronounced decline in spawning biomass from the late 1970s to the mid-2000s, which was followed by stabilization at relatively low levels. The trajectories of the SSB, SSB/SSBMSY, and F/FMSY were highly similar in shape across the two configurations, showing the same periods of depletion and episodes of higher fishing pressure. Recruitment patterns were also consistent, with strong pulses in the 1980s, early 2000s, and 2010s. These results indicated that the temporal patterns of biomass, fishing mortality, and recruitment were consistent across growth assumptions, although differences in scale led to contrasting conclusions regarding current stock status.
Figure 6.
Outputs of the age-structured production model (ASPM) for the southern Brazilian stock of M. liza under two growth specifications: scenario 01 with the official FURG/MPA [16] assessment and the re-run with the juvenile-informed von Bertalanffy growth function (this study). Green lines represent the results obtained using the juvenile-informed growth model (this study), whereas orange lines represent the official FURG/MPA assessment. Solid lines indicate the estimated trajectories, shaded bands represent the standard deviations, and the dashed horizontal and vertical lines in the equilibrium yield panel indicate the corresponding reference points for each scenario.
Despite these parallels in the temporal trends, the two models diverged in the absolute scale of their outputs, which directly influenced the interpretation of stock status (Table 4). The juvenile-informed growth function yielded systematically higher estimates of SSB and SSB/SSBMSY and lower estimates of F/FMSY relative to the official assessment. For example, the SSB in 2022 was 9986 t in FURG/MPA [16] in comparison with 14,729 t in this study, and the corresponding biomass ratio shifted from 0.81 to 1.01. Similarly, fishing mortality moved from above the limit (F2022/FMSY = 1.25) to below it (0.87). Reference points were also rescaled upwards, with the MSY increasing from 8224 t to 10,259 t. These updates changed the qualitative perception of the stock: while scenario 01 of the official assessment classified M. liza as overfished (SSB2022/SSBMSY = 0.81) and subject to overfishing (F2022/FMSY = 1.25), the alternative growth specifications indicated that the stock was near the biomass threshold (SSB2022/SSBMSY = 1.01), with exploitation levels slightly below the limit (F2022/FMSY = 0.87). Overall, the re-assessment highlighted that alternative growth assumptions substantially shifted the biomass scale of stock trajectories, yielding more optimistic status outcomes and higher stock productivity. These results underscore the pivotal role of growth specifications in shaping management advice for M. liza.
Table 4.
Reference points for the southern Brazilian stock of M. liza estimated under the official ASPM scenario 01 (FURG/MPA, [16]) and the re-run with the juvenile-informed growth function (This study). The values in parentheses indicate standard deviations.
4. Discussion
This study was designed primarily as a methodological exercise, evaluating the effect of incorporating validated juvenile age data on growth parameter estimation and its downstream consequences for stock assessment outputs, rather than providing a definitive re-assessment of the southern Brazilian M. liza stock.
Validation of the daily periodicity of sagittal otolith microincrements in juvenile M. liza showed a deposition rate of ≈1 increment day−1, confirming the suitability of microincrement counts for early-age estimation. Moreover, the high post-marking survival following OTC immersion supported the reliability of the protocol. Concordant validations in other fast-growing taxa, such as anchovies and mullets [38,39,40], further corroborate this pattern. Notably, the experiment was conducted under controlled captivity, which may not capture the full extent of natural variability. Nevertheless, the experimental design and the internal consistency of the results support the validity of the method for growth modeling. In this context, the outcomes of this study strengthen confidence in the juvenile age estimates, providing a robust anchor for fitting the early portion of the VBGF. Although the juvenile dataset was more spatially restricted than the adult dataset of Garbin et al. [19], its inclusion improved the representation of the youngest age classes in the growth analysis.
The incorporation of validated juvenile ages substantially modified the VBGF parameter estimates in comparison with those reported by Garbin et al. [19], who used whole otoliths for age determination and did so without data from individuals younger than 1.5 years. With the inclusion of data from younger individuals, the asymptotic length (L∞) decreased, the growth coefficient (k) increased, and t0 shifted toward values closer to zero. This outcome is expected when early ages are adequately represented [23], since the absence of juveniles tends to artificially inflate L∞, reduce k, and yield biologically unrealistic t0 values [22]. Such distortions were particularly evident in the sex-specific growth trajectories reported by Garbin et al. [19], which were estimated using only individuals older than 2.5 years due to undetermined sex in younger ages. Therefore, when fitted separately by sex, the inclusion of juveniles in the VBGF estimations had an even stronger effect. In males, L∞ decreased slightly by approximately 7%, while k more than doubled, with an increase of ≈110%. In females, the changes were more pronounced, with L∞ reducing by ≈30% and k increasing by nearly 190%, an almost threefold rise.
The revised VBGF parameters are very close to those reported for the Argentine stock by González-Castro et al. [17], whose specimens were referred to as Mugil platanus, following the nomenclature adopted at the time; subsequent taxonomic revisions recognized southwestern Atlantic populations as M. liza [18]. This similarity indicates that the inclusion of juveniles aligns the southern Brazilian growth trajectory with patterns already described for adjacent portions of the migratory population. In contrast, the stock at Guanabara Bay in Rio de Janeiro (RJ) represents a distinct unit [13,14] and may naturally exhibit different growth dynamics, as expected for separate stocks within this region [41]. Nevertheless, the reduction in t0 observed here yielded a k value similar to that estimated by da Costa et al. [42] for the RJ stock (k ≈ 0.30 yr−1). Thus, while part of the variation observed among studies may reflect ecological, temporal, or methodological differences, the omission of juvenile age classes and the use of whole otoliths for age determination likely contributed to the extreme VBGF parameters reported by Garbin et al. [19]. The inclusion of validated juvenile ages may have reduced these effects, yielding growth parameters for the southern Brazilian stock that fall within biologically plausible limits and are comparable to those documented in neighboring regions [17].
Changes in growth specifications are already recognized as one of the main sources of sensitivity in stock assessments [37,43,44,45]. Consistent with this, changing the growth function in the ASPM substantially shifted the absolute scale of biomass, fishing mortality, and reference points, without altering the overall temporal trends. In the juvenile-informed scenario, the smaller L∞ and higher k implied smaller but more numerous individuals at each age, resulting in higher SSB and recruitment estimates throughout the series. These differences were most evident in the terminal year: SSB2022 increased from 9986 t to 14,729 t, the biomass ratio shifted from 0.81 to 1.01, and F2022/FMSY moved from above the limit (1.25) to below it (0.87), altering the qualitative perception of stock status. MSY was also rescaled upward from 8224 t to 10,259 t. These results illustrate how differences in growth parameterization can propagate into demographic estimates and shift biological reference points, with direct consequences for management advice [46,47].
While these results provide useful insights, they should be interpreted in light of important limitations. The scenarios presented here are a sensitivity exercise for isolating the effects of growth specifications and are not intended for direct management use. Beyond modeling aspects, the study design itself introduces biological constraints that warrant explicit acknowledgment. The juvenile dataset was collected approximately a decade after the adult dataset of Garbin et al. [19], meaning that ontogenetic differences cannot be fully disentangled from potential temporal changes in growth driven by shifts in environmental conditions or fishing pressure over that period. Furthermore, juvenile specimens were collected from a single location within the Patos Lagoon estuary, representing a more restricted geographic area than the adult dataset, which limits the representativeness of the juvenile growth data for the stock as a whole. The juvenile sample size was also considerably smaller than the adult dataset, which may increase uncertainty around the early portion of the growth curve. While the resulting pooled parameters may be statistically sound, these limitations mean they cannot be assumed to be biologically more accurate solely on the basis of the current design. Additionally, the daily increment periodicity was validated under controlled conditions from a single sampling event, and seasonal validation was not conducted. Variability in increment deposition rates associated with seasonal changes in temperature, food availability, or reproductive activity cannot be ruled out, representing a further source of uncertainty in the juvenile age estimates. Future studies should address seasonal validation of increment periodicity and, ideally, collect juvenile and adult specimens concurrently to eliminate temporal confounding. Age determination of M. liza in southern Brazil using otolith sections should also be explored, as sections generally provide better reading conditions for annual growth increments compared to whole otoliths [25,48,49], and the existing juvenile dataset can assist in identifying the first annuli. Continued investment in aligned methodologies and updated fishery data at the regional level would reduce uncertainty and strengthen the scientific basis for M. liza management.
5. Conclusions
In summary, this study demonstrated that incorporating validated juvenile ages into growth analyses can substantially influence VBGF parameter estimates and alter stock assessment outputs when early life stages are underrepresented. The resulting changes, including lower L∞, higher k, and t0 values closer to zero, produced substantial differences in biomass, productivity, and biological reference point estimates, highlighting the sensitivity of stock assessments to growth specifications. Although the scenarios presented here are exploratory and subject to the design limitations discussed above, the findings underscore the importance of validated, temporally consistent age data and methodological transparency as a foundation for future assessments. More broadly, the study highlights the value of adequately representing early life stages in growth models and reinforces the need for continued refinement of age determination and growth estimation approaches for M. liza.
Supplementary Materials
The following supporting information can be downloaded at: https://www.mdpi.com/article/10.3390/fishes11070412/s1, Figure S1: MCMC trace plots for the Bayesian von Bertalanffy growth model fitted to the combined-sex dataset of the southern Brazilian stock of Mugil liza. Trace plots are shown for the posterior distributions of the asymptotic length (L∞), growth coefficient (k), and theoretical age at zero length (t0). Figure S2: MCMC trace plots for the Bayesian von Bertalanffy growth model fitted to the female dataset of the southern Brazilian stock of Mugil liza. Trace plots are shown for the posterior distributions of the asymptotic length (L∞), growth coefficient (k), and theoretical age at zero length (t0). Figure S3: MCMC trace plots for the Bayesian von Bertalanffy growth model fitted to the male dataset of the southern Brazilian stock of Mugil liza. Trace plots are shown for the posterior distributions of the asymptotic length (L∞), growth coefficient (k), and theoretical age at zero length (t0).
Author Contributions
Conceptualization, V.S.M., E.K., J.P.C. and L.G.C.; Methodology, V.S.M., E.K., R.S., B.L.M., T.G., R.V.R., J.P.C. and L.G.C.; Software, V.S.M., E.K., R.S. and B.L.M.; Validation, V.S.M., J.P.C. and L.G.C.; Formal analysis, V.S.M., E.K., R.S., B.L.M., J.P.C. and L.G.C.; Investigation, V.S.M., E.K., R.S., T.G., J.P.C. and L.G.C.; Resources, E.K., J.P.C. and L.G.C.; Data curation, V.S.M., T.G., J.P.C. and L.G.C.; Writing—original draft, V.S.M., E.K., J.P.C. and L.G.C.; Writing—review & editing, V.S.M., E.K., J.P.C. and L.G.C.; Visualization, V.S.M., E.K., R.V.R., J.P.C. and L.G.C.; Supervision, E.K., R.S., J.P.C. and L.G.C.; Project administration, E.K., J.P.C. and L.G.C.; Funding acquisition, E.K., J.P.C. and L.G.C. All authors have read and agreed to the published version of the manuscript.
Funding
This study was financed in part by the Coordenação de Aperfeiçoamento de Pessoal de Nível Superior—Brazil (CAPES) (Finance code 001) and by the National Council for Scientific and Technological Development—CNPq and the Ministry of Fisheries and Aquaculture—MPA within the scope of the Call CNPq/MPA Nº 15/2024—Ordenamento da Pesca Marinha Brasileira (Process number: 446468/2024-0).
Institutional Review Board Statement
All experimental procedures and protocols used in this study were previously approved by the Animal Use Ethics Committee of the Federal University of Rio Grande (Process No. 23116.012954/2024-49—CEUA010/2025; Approval date: 27 August 2025). All experimental procedures were conducted in accordance with the current guidelines of the Brazilian National Council for the Control of Animal Experimentation (CONCEA).
Informed Consent Statement
Not applicable.
Data Availability Statement
The data presented in this study are available on request from the corresponding author.
Acknowledgments
We thank the staff team from the Marine Aquaculture Station—EMA/FURG-IO and Antonio Sergio Varela for providing access to the epifluorescence microscope.
Conflicts of Interest
The authors declare that they have no known competing financial interests or personal relationships that could have appeared to influence the work reported in this paper.
References
- King, M. Fisheries Biology, Assessment and Management, 2nd ed.; Wiley-Blackwell: Hoboken, NJ, USA, 2013. [Google Scholar] [CrossRef] [Scilit]
- Hilborn, R.; Walters, C.J. Quantitative Fisheries Stock Assessment: Choice, Dynamics and Uncertainty; Chapman and Hall: London, UK, 1992; 570p. [Google Scholar] [CrossRef] [Scilit]
- Maunder, M.N.; Hamel, O.S.; Lee, H.H.; Piner, K.R.; Cope, J.M.; Punt, A.E.; Methot, R.D. A review of estimation methods for natural mortality and their performance in the context of fishery stock assessment. Fish. Res. 2023, 257, 106489. [Google Scholar] [CrossRef] [Scilit]
- Caddy, J.F.; Mahon, R. Reference Points for Fisheries Management; FAO Fisheries Technical Paper No. 347; FAO: Rome, Italy, 1995; Available online: https://openknowledge.fao.org/handle/20.500.14283/v8400e (accessed on 7 July 2026).
- Heino, M.; Baulier, L.; Boukal, D.S.; Ernande, B.; Johnston, F.D.; Mollet, F.M.; Pardoe, H.; Therkildsen, N.O.; Uusi-Heikkilä, S.; Vainikka, A.; et al. Can fisheries-induced evolution shift reference points for fisheries management? ICES J. Mar. Sci. 2013, 70, 707–721. [Google Scholar] [CrossRef] [Scilit]
- Kuriyama, P.T.; Ono, K.; Hurtado-Ferro, F.; Hicks, A.C.; Taylor, I.G.; Licandeo, R.R.; Johnson, K.F.; Anderson, S.C.; Monnahan, C.C.; Rudd, M.B.; et al. An empirical weight-at-age approach reduces estimation bias compared to modeling parametric growth in integrated, statistical stock assessment models when growth is time varying. Fish. Res. 2016, 180, 119–127. [Google Scholar] [CrossRef] [Scilit]
- Kuparinen, A.; Mäntyniemi, S.; Hutchings, J.A.; Kuikka, S. Increasing biological realism of fisheries stock assessment: Towards hierarchical Bayesian methods. Environ. Rev. 2012, 20, 135–151. [Google Scholar] [CrossRef] [Scilit]
- Evans, M.R.; Grimm, V.; Johst, K.; Knuuttila, T.; De Langhe, R.; Lessells, C.M.; Merz, M.; O’Malley, M.A.; Orzack, S.H.; Weisberg, M.; et al. Do simple models lead to generality in ecology? Trends Ecol. Evol. 2013, 28, 578–583. [Google Scholar] [CrossRef] [Scilit] [PubMed]
- Little, L.R.; Punt, A.E.; Dichmont, C.M.; Dowling, N.; Smith, D.C.; Fulton, E.A.; Sporcic, M.; Gorton, R.J. Decision trade-offs for cost-constrained fisheries management. ICES J. Mar. Sci. 2016, 73, 494–502. [Google Scholar] [CrossRef] [Scilit]
- Vieira, J.P.; Scalabrin, C. Migração reprodutiva da “Tainha” (Mugil platanus, Günther, 1880) no sul do Brasil. Atlântica 1991, 13, 131–141. [Google Scholar] [CrossRef] [Scilit]
- Sant’Ana, R.; Kinas, P.G.; Miranda, L.V.; Schwingel, P.R.; Castello, J.P.; Vieira, J.P. Bayesian state-space models with multiple CPUE data: The case of a mullet fishery. Sci. Mar. 2017, 81, 361–370. [Google Scholar] [CrossRef] [Scilit]
- Abreu-Mota, M.A.; Medeiros, R.P.; Noernberg, M.A. Resilience thinking applied fisheries management: Perspectives for the mullet fishery in Southern-Southeastern Brazil. Reg. Environ. Change 2018, 18, 2047–2058. [Google Scholar] [CrossRef] [Scilit]
- Lemos, V.M.; Monteiro-Neto, C.; Cabral, H.; Vieira, J.P. Stock identification of tainha (Mugil liza) by analyzing stable carbon and oxygen isotopes in otoliths. Fish. Bull. 2017, 115, 201–206. [Google Scholar] [CrossRef] [Scilit]
- Mai, A.C.; Mino, C.I.; Marins, L.F.; Monteiro-Neto, C.; Miranda, L.; Schwingel, P.R.; Lemos, V.M.; Gonzalez-Castro, M.; Castello, J.P.; Vieira, J.P. Microsatellite variation and genetic structuring in Mugil liza (Teleostei: Mugilidae) populations from Argentina and Brazil. Estuar. Coast. Shelf Sci. 2014, 149, 80–86. [Google Scholar] [CrossRef] [Scilit]
- Lemos, V.M.; Mai, A.C.; Martins, A.C.; Martins, J.V.; Andrade, S.; Cabral, H.; Vieira, J.P. Variation in otolith microchemistry for Lebranche mullet (Mugil liza) in southern Brazil and its potential use in identifying their nursery grounds. Fish. Bull. 2024, 122, 13–25. [Google Scholar] [CrossRef] [Scilit]
- FAURG/IIAC. Relatório Técnico de Avaliação do Estoque da Tainha (Mugil liza) no Sudeste e Sul do Brasil. 2023; 56p. Available online: https://www.gov.br/mpa/pt-br/assuntos/cadastro-registro-e-monitoramento/pesquisa/relatorios-tecnicos-e-consultorias/tainha-1/tainha-2023/produto_02_relatorio-de-avaliacao-de-estoque-da-tainha-2023_final.pdf (accessed on 7 July 2026).
- González-Castro, M.G.; Abachian, V.; Perrotta, R.G. Age and growth of the striped mullet, Mugil platanus (Actinopterygii, Mugilidae), in a southwestern Atlantic coastal lagoon: A proposal for a life-history model. J. Appl. Ichthyol. 2009, 25, 61–66. [Google Scholar] [CrossRef] [Scilit]
- Menezes, N.A.; Oliveira, C.D.; Nirchio, M. An old taxonomic dilemma: The identity of the western south Atlantic lebranche mullet (Teleostei: Perciformes: Mugilidae). Zootaxa 2010, 2519, 59–68. [Google Scholar] [CrossRef] [Scilit]
- Garbin, T.; Castello, J.P.; Kinas, P.G. Age, growth and mortality of the mullet Mugil liza in Brazil’s southern and southeastern coastal regions. Fish. Res. 2014, 149, 61–68. [Google Scholar] [CrossRef] [Scilit]
- Audzijonyte, A.; Fulton, E.; Haddon, M.; Helidoniotis, F.; Hobday, A.J.; Kuparinen, A.; Morrongiello, J.; Smith, A.; Upston, J.; Waples, R. Trends and management implications of human-influenced life-history changes in marine ectotherms. Fish Fish. 2016, 17, 1005–1028. [Google Scholar] [CrossRef] [Scilit]
- Froese, R. Estimating somatic growth of fishes from maximum age or maturity. Acta Ichthyol. Piscat. 2022, 52, 125–133. [Google Scholar] [CrossRef] [Scilit]
- Berumen, M.L. The importance of juveniles in modelling growth: Butterflyfish at Lizard Island. Environ. Biol. Fishes 2005, 72, 409–413. [Google Scholar] [CrossRef] [Scilit]
- Cavole, L.M.; Cardoso, L.G.; Almeida, M.S.; Haimovici, M. Unravelling growth trajectories from complicated otoliths: The case of Brazilian codling Urophycis brasiliensis. J. Fish Biol. 2018, 92, 1290–1311. [Google Scholar] [CrossRef] [Scilit] [PubMed]
- Campana, S.E.; Jones, C.M. Analysis of otolith microstructure data. In Otolith Microstructure Examination and Analysis; Stevenson, D.K., Campana, S.E., Eds.; Canadian Special Publication of Fisheries and Aquatic Sciences: Ottawa, ON, USA, 1992; Volume 117, pp. 73–100. [Google Scholar]
- Campana, S.E. Accuracy, precision and quality control in age determination, including a review of the use and abuse of age validation methods. J. Fish Biol. 2001, 59, 197–242. [Google Scholar] [CrossRef]
- Morales-Nin, B. Determination of Growth in Bony Fishes from Otolith Microstructure; FAO: Rome, Italy, 1992; Available online: https://openknowledge.fao.org/handle/20.500.14283/t0529e (accessed on 7 July 2026).
- Chang, C.W.; Tzeng, W.N.; Lee, Y.C. Recruitment and hatching dates of grey mullet (Mugil cephalus L.) juveniles in the Tanshui estuary of northwest Taiwan. Zool. Stud. 2000, 39, 99–106. [Google Scholar]
- Cavole, L.M.; Haimovici, M. The use of otolith microstructure in resolving issues of ageing and growth of young Micropogonias furnieri from southern Brazil. Mar. Biol. Res. 2015, 11, 933–943. [Google Scholar] [CrossRef] [Scilit]
- OECD. Test No. 203: Fish, Acute Toxicity Test; OECD Guidelines for the Testing of Chemicals, Section 2; OECD Publishing: Paris, France, 2025. [Google Scholar] [CrossRef] [Scilit]
- Tzeng, W.N.; Yu, S.Y. Validation of daily growth increments in otoliths of milkfish larvae by oxytetracycline labeling. Trans. Am. Fish. Soc. 1989, 118, 168–174. [Google Scholar] [CrossRef] [Scilit]
- Kinas, P.G.; Andrade, H.A. Introdução à Análise Bayesiana (Com R); Editora Mais Que Nada: Porto Alegre, Brazil, 2010. [Google Scholar]
- Plummer, M. JAGS: A program for analysis of Bayesian graphical models using Gibbs sampling. In Proceedings of the 3rd International Workshop on Distributed Statistical Computing (DSC 2003); Hornik, K., Leisch, F., Zeileis, A., Eds.; The R Foundation for Statistical Computing: Vienna, Austria, 2003. [Google Scholar]
- R Core Team. R: A Language and Environment for Statistical Computing; R Foundation for Statistical Computing: Vienna, Austria, 2024. [Google Scholar]
- Cope, J.M. The Stock Synthesis Data-Limited Tool (SS-DL Tool). 2020. Available online: https://github.com/shcaba/SS-DL-tool#the-stock-synthesis-data-limited-tool-ss-dl-tool (accessed on 7 July 2026).
- Methot, R.D.; Wetzel, C.R. Stock synthesis: A biological and statistical framework for fish stock assessment and fishery management. Fish. Res. 2013, 142, 86–99. [Google Scholar] [CrossRef] [Scilit]
- Then, A.Y.; Hoenig, J.M.; Hall, N.G.; Hewitt, D.A. Evaluating the predictive performance of empirical estimators of natural mortality rate using information on over 200 fish species. ICES J. Mar. Sci. 2015, 72, 82–92. [Google Scholar] [CrossRef] [Scilit]
- Thorson, J.T.; Monnahan, C.C.; Cope, J.M. The potential impact of time-variation in vital rates on fisheries management targets for marine fishes. Fish. Res. 2015, 169, 8–17. [Google Scholar] [CrossRef] [Scilit]
- Cermeño, P.; Uriarte, A.; De Murguía, A.M.; Morales-Nin, B. Validation of daily increment formation in otoliths of juvenile and adult European anchovy. J. Fish Biol. 2003, 62, 679–691. [Google Scholar] [CrossRef] [Scilit]
- Hsu, C.; Tzeng, W. Validation of annular deposition in scales and otoliths of flathead mullet Mugil cephalus. Zool. Stud. 2009, 48, 640–648. [Google Scholar]
- Plaza, G.; Cerna, F. Validation of daily microincrement deposition in otoliths of juvenile and adult Peruvian anchovy Engraulis ringens. J. Fish Biol. 2015, 86, 203–216. [Google Scholar] [CrossRef] [Scilit] [PubMed]
- Kikuchi, E.; Cardoso, L.G.; Canel, D.; Timi, J.T.; Haimovici, M. Using growth rates and otolith shape to identify the population structure of Umbrina canosai (Sciaenidae) from the Southwestern Atlantic. Mar. Biol. Res. 2021, 17, 272–285. [Google Scholar] [CrossRef] [Scilit]
- da Costa, M.R.; Martins, R.R.M.; Tomás, A.R.G.; de Almeida Tubino, R.; Monteiro-Neto, C. Biological aspects of Mugil liza Valenciennes, 1836 in a tropical estuarine bay in the southwestern Atlantic. Reg. Stud. Mar. Sci. 2021, 43, 101651. [Google Scholar] [CrossRef] [Scilit]
- Lee, Q.; Thorson, J.T.; Gertseva, V.V.; Punt, A.E. The benefits and risks of incorporating climate-driven growth variation into stock assessment models, with application to Splitnose Rockfish (Sebastes diploproa). ICES J. Mar. Sci. 2018, 75, 245–256. [Google Scholar] [CrossRef] [Scilit]
- Stawitz, C.C.; Haltuch, M.A.; Johnson, K.F. How does growth misspecification affect management advice derived from an integrated fisheries stock assessment model? Fish. Res. 2019, 213, 12–21. [Google Scholar] [CrossRef] [Scilit]
- Correa, G.M.; McGilliard, C.R.; Ciannelli, L.; Fuentes, C. Spatial and temporal variability in somatic growth in fisheries stock assessment models: Evaluating the consequences of misspecification. ICES J. Mar. Sci. 2021, 78, 1900–1908. [Google Scholar] [CrossRef] [Scilit]
- Walters, C.J.; McGuire, J.J. Lessons for stock assessment from the northern cod collapse. Rev. Fish Biol. Fish. 1996, 6, 125–137. [Google Scholar] [CrossRef] [Scilit]
- Mangin, T.; Costello, C.; Anderson, J.; Arnason, R.; Elliott, M.; Gaines, S.D.; Hilborn, R.; Peterson, E.; Sumaila, R. Are fishery management upgrades worth the cost? PLoS ONE 2018, 13, e0204258. [Google Scholar] [CrossRef] [Scilit] [PubMed]
- Beamish, R.J. Differences in the age of Pacific hake (Merluccius productus) using whole otoliths and sections of otoliths. J. Fish. Board Can. 1979, 36, 141–151. [Google Scholar] [CrossRef] [Scilit]
- Chilton, D.E.; Beamish, R.J. Age Determination Methods for Fishes Studied by the Groundfish Program at the Pacific Biological Station; Canadian Special Publication of Fisheries and Aquatic Sciences No. 60; Department of Fisheries and Oceans: Ottawa, ON, USA, 1982; pp. 1–102. [Google Scholar]

Disclaimer/Publisher’s Note: The statements, opinions and data contained in all publications are solely those of the individual author(s) and contributor(s) and not of MDPI and/or the editor(s). MDPI and/or the editor(s) disclaim responsibility for any injury to people or property resulting from any ideas, methods, instructions or products referred to in the content. |
© 2026 by the authors. Licensee MDPI, Basel, Switzerland. This article is an open access article distributed under the terms and conditions of the Creative Commons Attribution (CC BY) license.