Article

Integrated Application of Iso-Seq and RNA-Seq Analyses to Uncover Genes Involved in Ovarian Development in Platypharodon extremus

1
Department of Zoology and Biomedical Science, School of Life Sciences, Lanzhou University, Lanzhou 730000, China
2
Gansu Fisheries Research Institute, Lanzhou 730030, China
3
Key Laboratory of Grassland Livestock Industry Innovation, Ministry of Agriculture and Rural Affairs, Grassland Agriculture Engineering Center, Ministry of Education, College of Pastoral Agriculture Science and Technology, Lanzhou University, Lanzhou 730020, China
*
Authors to whom correspondence should be addressed.
Fishes 2026, 11(7), 411; https://doi.org/10.3390/fishes11070411
Submission received: 11 May 2026 / Revised: 7 July 2026 / Accepted: 8 July 2026 / Published: 12 July 2026
(This article belongs to the Special Issue Physiological and Behavioral Studies in Aquaculture)

Abstract

This study focused on Platypharodon extremus, a species endemic to the Qinghai–Tibet Plateau, and systematically analyzed its reproductive biology, sex steroid hormones, ovarian histology, and transcriptomic characteristics throughout its complete reproductive cycle (August 2020 to June 2021). The results demonstrated that the body length, height, body weight, and gonadal weight of female individuals continuously increased with age, while the Gonadosomatic index (GSI) was lowest during the breeding season (June–August) and gradually rose during the non-breeding period. Serum estradiol (E2) and progesterone (P4) exhibited rhythmic fluctuations corresponding to ovarian development: E2 rose from 25.77 ng/L in stage-I to 146.00 ng/L in stage-V, then declined post-ovulation; P4 increased from 59.88 pmol/L in stage-I to 239.03 pmol/L in stage-V, showing a significant decrease after ovulation. Histological observations classified ovarian development into stages I–VI, clearly delineating the complete process from oogonium proliferation, cortical vesicle formation, yolk accumulation, maturation to postpartum regression. To explore molecular changes during the transition from vitellogenesis to oocyte maturation, we built a reference transcriptome with 30,060 non-redundant transcripts (average length = 1975 bp) using PacBio and Illumina data, and 91.87% of these transcripts received functional annotation hits against public databases. A comparative differential expression analysis was performed between ovarian stage III (active yolk accumulation) and stage V (oocyte fully matured). A total of 11,324 differentially expressed genes were identified (5249 upregulated and 6175 downregulated) between these two stages. GO enrichment analysis revealed predominant involvement in cellular processes, cellular components, and catalytic activities, while KEGG analysis demonstrated significant enrichment in metabolic pathways, PI3K-Akt, MAPK, and calcium signaling pathways. Quantitative PCR (qPCR) validation confirmed that candidate genes, including pik3a, calm, mapk1 map2k ddx49, and igf2 were significantly upregulated at stage V. These differentially expressed genes (DEGs) may represent potential molecular signatures linked to the transition from vitellogenesis to oocyte maturation. Our integrated transcriptomic and qPCR data identify potential gene candidates involved in ovarian maturation; however, these findings reveal correlation rather than direct regulatory causality. This study offers fundamental data and theoretical insights for understanding the reproductive regulatory mechanisms and aquaculture management of this endemic species.
Key Contribution: For the first time, the use of third-generation transcriptome sequencing technology revealed genes related to ovarian development in Tibetan Plateau fish Platypharodon extremus.

1. Introduction

The biodiversity of fish in the upper reaches of the Yellow River is of great significance to the ecological protection of the Yellow River Basin. Schizothoracinae fishes are an important population in the upper reaches of the Yellow River [1]. They play an important role in maintaining the balance of aquatic ecosystems on plateaus. Platypharodon extremus is a unique monotypic species of Chinese fish belonging to Cypriniformes, Schizothoracinae, Platypharodon. It is distributed mainly in rivers and lakes of the Qinghai–Tibet Plateau and can adapt to extreme environments such as high altitude and low oxygen. It has a slow growth rate and typically takes 6–7 years to reach sexual maturity [2]. In the 1950s, a fishery survey was carried out in Maqu, Gansu Province, China, and P. extremus was identified as the dominant species [3]. Since the 1970s, continuous intensification of human activities has led to worsening of the ecological environment in the upper reaches of the Yellow River, which have been under the influence of overfishing, wading project construction and other factors [4]. In addition, due to the limited distribution of Schizothorax, the resources available to P. extremus decreased rapidly. In 1998, P. extremus was listed as vulnerable (V) in the Red Book of Endangered Animals of China-Fish and in 2021 it was listed as a second-class national protected wild animal [5]. In 2002, researchers in Gansu Province collected wild P. extremus for artificial breeding. In 2007, artificial breeding and larval development of P. extremus were achieved, providing an indication that artificial breeding programmes can be successful in this species [6]. However, there have been some problems in the process of artificial reproduction in recent years. The relatively long ovarian maturity cycle of P. extremus means that at sexual maturity female fish have underdeveloped ovaries. Moreover, the genes involved in the regulation of ovarian development are not clear. Due to the lack of genomic information for this species, studies on the regulatory mechanisms of ovarian development are limited. This limited understanding has led to some troubles in the artificial breeding process.
With the development of sequencing technology, genome and transcriptome data resources are constantly being developed, and full-length transcriptome sequencing technology can not only improve the accuracy of transcriptome annotation but also provide a more comprehensive approach for functional gene annotation [7]. The PacBio third-generation sequencing technology utilizes single-molecule real-time (SMRT) technology to directly sequence transcripts without the need for an assembly process. Compared with second-generation sequencing technology, the transcript sequences obtained by the PacBio platform provide a longer read length and improved annotation rate, which are features well suited for application in addressing unsolved problems in genome, transcriptome and epigenetic research [8]. Transcriptome sequencing can be used to identify genes involved in biological processes including body growth, development and immune regulation and to analyse important functions related to gene expression regulation [9]. Over the past decade, a great deal of research has focused on genetics and developmental transcriptomics. In zebrafish, a comprehensive analysis of transcriptome data from nine different stages of embryonic development was conducted to identify the key roles of pathways and functional genes involved in development [10]. Sequencing of Lateolabrax maculatus, using SMRT, has increased our understanding of the salinity adaptation mechanism of bony fish [11]. Huang [12] used next-generation sequencing (NGS) technology for full-length transcriptome analysis of sexually mature and immature fine-scale salmon, which provides a valuable reference for the study of bony fish gene function, gene expression, and evolutionary relationships. This study may elucidate the basic regulatory mechanism of ovarian development in bony fish. In Schizothorax, few full-length transcriptome studies have been conducted in many species due to the lack of reference genome information. Full-length transcriptome data of Gymnocypris przewalskii [13], Gymnocypris namensis [14], and Schizothorax prenanti [15] have been analysed, and their transcriptomes may provide a resource for further study.
In this study, we employed PacBio Iso-Seq combined with Illumina RNA-seq to construct a full-length reference transcriptome of P. extremus, providing a high-quality genomic resource for subsequent analyses. Ovarian histology and serum sex steroid hormone profiles (E2 and P4) were examined across the complete reproductive cycle to characterize the physiological and morphological changes associated with ovarian development. Using the full-length transcriptome as a reference, we performed comparative transcriptomic analysis between distinct ovarian developmental stages (vitellogenesis and maturation/ovulation) to screen for differentially expressed genes involved in ovarian development. Functional enrichment analysis and quantitative PCR validation were further conducted to identify potential key genes and signaling pathways regulating the transition from vitellogenesis to oocyte maturation. Our findings aim to elucidate the molecular regulatory mechanisms underlying ovarian development and maturation in this endemic species, thereby providing a theoretical foundation for artificial reproduction and aquaculture management of P. extremus.

2. Materials and Methods

2.1. Ethics Statement

The fish collection process complied with the guidelines of Gansu Fisheries Research Institute. This study was approved by the Laboratory Animal Ethics Committee of Gansu Fisheries Research Institute, the ethical approval number is GFRl-2022-09-26-04.

2.2. Sample Collection

Sample collection: The P. extremus experimental material were the sexually mature F1 generation that was artificially bred in Gansu Fisheries Research Institute (Linxia, Gansu). From August 2020 to June 2021 (a reproductive cycle), 30 female samples were collected every two months to measure body length (cm), body height (cm), body weight (g), gonadal weight (g), and GSI (Gonadosomatic index), calculated as follows: GSI = gonadal weight/body weight × 100%. The collected sample information is shown in Table 1.
Meanwhile, the experimental fish were anesthetized with anesthetic agents (typically 100 mg/L MS-222). The primary method involves tail vein puncture or blood collection from the caudal peduncle. Blood is drawn using a sterile syringe, with a standard volume of 3–5 mL per fish. Place the collected blood in a 4 °C refrigerator and allow it to stand for 4–6 h (or overnight) to facilitate natural coagulation. Subsequently, centrifuge at 3000–4000× g for 10–20 min under 4 °C conditions and carefully collect the supernatant of the clarified serum. The isolated serum should be aliquoted into sterile centrifuge tubes and immediately frozen at −80 °C ultra-low temperature freezer until hormone testing is performed.

2.3. Histological Experiment

Ovarian tissue samples fixed in Born solution were embedded in paraffin wax and cut into 6–12 µm continuous sections. The ovaries were stained using standard haematoxylin and eosin solutions. As described by Selman [16], the P. extremus ovaries were classified into six stages which contain eggs at different stages of development. The developmental stages were assessed under a 10× and 40× microscope.
Oocyte diameter measurements were performed using ImageJ software (Version 1.54f; National Institutes of Health, Bethesda, MD, USA) on sections where the oocyte nucleus was clearly visible. For each female, 15 oocytes were randomly selected and measured. Data are expressed as mean ± SD. Inter-individual variability was assessed using coefficient of variation (CV = SD/mean × 100%). Differences in oocyte diameter between stages were evaluated using unpaired Student’s t-test, with statistical significance set at p < 0.05.

2.4. Hormone Testing

Estrogen diol (E2) and progesterone (P4) were measured using enzyme-linked immunosorbent assay (ELISA). The ELISA kit was produced by Nanjing Jiancheng Bioengineering Research Institute Co., Ltd. (Nanjing, China). The assay method was performed according to the kit instructions, and analysis was conducted using an enzyme microplate reader (Labsystems Multiskan MS, Helsinki, Finland).
All data are expressed as means ± SD (n = 3 per stage). Normality of the residuals was assessed using the Shapiro–Wilk test, and homogeneity of variances was evaluated using Levene’s test. Both E2 and P4 datasets met the assumptions of parametric tests (Shapiro–Wilk: p > 0.05 for both; Levene’s: p > 0.05 for both). Differences among the six ovarian developmental stages were therefore analyzed using one-way analysis of variance (ANOVA) followed by Tukey’s honest significant difference (HSD) post hoc test for multiple comparisons. All statistical tests were two-tailed, and significance was set at α = 0.05. All analyses were performed using IBM SPSS Statistics version 22.0 (IBM Corp., Armonk, NY, USA).

2.5. RNA Extraction and Quality Evaluation

Stage III (active yolk accumulation) and stage V (oocyte fully matured) were selected for comparative transcriptomic analysis based on their distinct physiological states. Early stages (I and II), which center on oogonial proliferation and primary oocyte growth, were not included in the transcriptomic comparison.
The 3 samples of P. extremus collected in April 2021 were selected, and total RNA from ovary, brain, heart, liver, gills, and muscle was constructed into a PacBio library. RNA samples were separately collected from ovaries (n = 6, sellected in April and June 2021) for short-read RNA-seq analysis.
RNA extraction: Total RNA was extracted from tissue samples by TRIzol reagent (Invitrogen, Carlsbad, CA, USA). The concentration and purity of the extracted RNA were assessed by a Nanodrop 2000 (Thermo Fisher Scientific, Waltham, MA, USA). Genomic contamination, purity and RNA integrity were detected by agarose gel electrophoresis on an Agilent Bioanalyzer 2100 system (Agilent Technologies, Santa Clara, CA, USA). Only the total RNA samples with RIN value ≥ 8 and those with an OD260/280 between 1.8 and 2.2 were used for constructing the cDNA library used in PacBio sequencing. All sequencing experiments were conducted at Frasergen Information Co., Ltd. (Wuhan, China).

2.6. Library Construction and PacBio Sequencing

After the samples were qualified, library construction was performed. Full-length cDNA was synthesized from mRNA using the Clonetech SMARTerTM PCR cDNA Synthesis Kit (Takara Clontech Biotech, Dalian, China) according to the standard protocol. The resulting full-length cDNA was amplified by PCR, and the products were purified by PB magnetic beads. The amplified full-length cDNA was purified using PB magnetic beads to remove partial and small fragment cDNA below 1 kb. After full-length cDNA was end-repaired, it was constructed with SMRTBell (Pacific Biosciences, Menlo Park, CA, USA) following the manufacturer’s recommendations. Sequences were purified using PB magnetic beads to obtain the sequencing library. The size range of the library was detected with an Agilent Bioanalyzer 2100 system (Agilent Technologies, Santa Clara, CA, USA) and quantified using Qubit 3.0. The SMRT cells for the three libraries were then sequenced on the Pacific Bioscience RSII platform (Pacific Biosciences, Menlo Park, CA, USA).
Pac Bio raw data were pre-processed and filtered by SMRT Link v10.1 pipelines (https://www.pacb.com/support/software-downloads/, accessed on 8 September 2021). In short, the raw polymerase reads were filtered and trimmed to generate the subreads using the RS_subreads protocol (parameters: 50 bp < subread length < 15,000 bp, minimum number of passes = 3, minimum predicted accuracy = 0.99). First, circular consensus sequence (CCS) reads were generated from the subreads using the CCS model with default parameters. The full-length nonchimeric (FLNC) reads were identified from CCS reads by searching for the 50/30 cDNA primers and the poly (A) tail in the read of inserts (ROI). Next, we used iterative clustering for error correction (ICE) and Quiver software (v2.3.2, Pacific Biosciences of California, Inc., Menlo Park, CA, USA) to cluster and polish multiple FLNCs from the same isoform to obtain the nonredundant isoform sequence. This analysis was performed using the SMRT Analysis software suite (version 2.3.0; Pacific Biosciences, Menlo Park, CA, USA), which implements the ICE clustering and Quiver polishing algorithms. Furthermore, the high-quality polished isoform sequences (postcorrection accuracy < 99%) were used for the subsequent analysis. The full-length transcripts were used to remove redundancy by the CD-HIT tool (v 4.8.1) [17]. Finally, the first high-quality FL transcript data set for P. extremus was obtained in the present study.

2.7. Illumina Library Construction and Sequencing

The Illumina library for the ovaries was constructed using the TruSeq RNA Sample Prep Kit (Illumina, San Diego, CA, USA) following the manufacturer’s instructions. First, the polyA mRNA enriched by magnetic beads with Oligo (dT) was fragmented into short fragments. Then, using mRNA as a template, two-strand cDNA was synthesized by reverse transcriptase and random primers. Finally, AMPure XP beads were used to purify double-stranded cDNA, and PCR enrichment was carried out to generate the cDNA library. The cDNA libraries were sequenced on an Illumina HiSeq X Ten platform (Illumina HiSeq 2000) by Wuhan Feisha Technology Co., Ltd. (Wuhan, China).
Raw reads of the six transcriptome data sets were cleaned by filtering adaptor-only and low-quality reads using SOAPnuke [18] (v2.1.0), thus clean reads were obtained. The Q20 and Q30 values and the GC content of the clean data were also calculated. Meanwhile, the quality of these clean data was estimated by Q30%, i.e., reads with a Q30% greater than 85% were retained as high-quality reads. Finally, the isoform was used as the reference, and the clean short reads were mapped by Bowtie2 software (v2.3.5, developed by Ben Langmead at Johns Hopkins University, Baltimore, MD, USA) [19].

2.8. Bioinformatics Analysis

For quality control and filtering of sequencing data, reads with low quality and short read lengths were removed. The filtered reads underwent classification, clustering, and correction to obtain high-quality full-length transcripts. Due to the stringent clustering requirements for full-length transcripts, CD-HIT software (version 4.8.1, University of California, San Diego, CA, USA) [20] was employed to deduplicate the transcripts, followed by functional annotation.
Using PacBio full-length transcripts as reference sequences, Bowtie 2 v2.1.0 software [21] was employed to align clean reads (second-generation data) from each sample back to the reference sequences. The alignment results were statistically analyzed using RSEM 1.2.15 software [22] to quantify the abundance of each transcript. For each sample, the expected read counts generated by RSEM were extracted, rounded to integers, and used as the input matrix for differential expression analysis. FPKM (fragments per kilobase of transcript sequence per million sequenced base pairs) values were simultaneously calculated by RSEM and used exclusively for transcript expression visualization (e.g., heatmaps) but not for statistical testing. Differential expression analysis of transcripts between ovarian stages was conducted using edge R v3.16.5 software [23] with the integer count matrix as input. Differentially expressed transcripts (DETs) were identified using thresholds of |log2(fold change)| ≥ 1 and Padj < 0.05. GO functional enrichment and KEGG pathway enrichment analyses were further performed on the identified DETs.

2.9. Validation of Expression of DEGs by Real-Time PCR

To further validate the reliability of the RNA-seq data, 16 DEGs were selected and detected by qPCR. Specific primers were designed based on the reference sequences obtained from the full-length transcriptome of P. extremus (Table 2). The β-actin gene was selected as the internal reference. Total RNA was extracted from ovarian tissue samples at stages III and stages-V (n = 3 per stage). RNA purity was assessed by measuring the optical density at 260 nm and 280 nm, and RNA integrity was evaluated by agarose gel electrophoresis.
Subsequently, reverse transcription was performed using a two-step procedure. Residual genomic DNA was removed by mixing 400 ng of total RNA with RNase-free ddH2O to a final volume of 12 µL, followed by addition of 3 µL of 5 × gDNA digester Mix. The mixture was incubated at 42 °C for 2 min. Then, 5 µL of 4 × Hifair III SuperMix plus was added to yield a final volume of 20 µL. The reverse transcription reaction was carried out under the following conditions: 25 °C for 5 min, 55 °C for 15 min, and 85 °C for 5 min. The resulting cDNA was stored at −20 °C for subsequent qPCR analysis.
qPCR assays were conducted using SYBR Premix Ex Taq (Takara, Beijing, China) on a real-time PCR system (e.g., ABI 7500, Foster, CA, USA). The reaction volume was set at 20 µL, which consisted of 10 µL of 2 × SYBR Premix Ex Taq, 1.0 µL of both the forward and reverse primers (10 µmol/L), 1 µL of the synthesized cDNA, and RNase-free ddH2O was added to adjust the final volume. The reaction conditions were precisely defined as follows: an initial denaturation step at 95 °C for 5 min, followed by 40 cycles of amplification. Each cycle included a denaturation phase at 95 °C for 10 s and an annealing/extension step at 60 °C for 30 s, with signal detection at 72 °C. After the 40 cycles, a melting curve analysis was performed with the following conditions: 95 °C for 15 s, 60 °C for 60 s, and 95 °C for 15 s with continuous signal detection. Finally, the relative expression fold changes in the selected genes across different ovarian developmental stages were analyzed using the 2−ΔΔCT method [24].

3. Results

3.1. Body Measurement and GSI

During the reproductive cycle of P. extremus (August 2020 to June 2021), sampling was conducted at bimonthly intervals, and morphometric and gonadal parameters of fish are summarized in Table 3. In each sampling event, 30 female individuals were randomly captured to determine body length (cm), body height (cm), body weight (g), gonadal weight (g), and gonadosomatic index (GSI, %). As the reproductive cycle progressed, body weight exhibited a consistent significant increasing trend. Body length and gonadal weight gradually increased from August 2020 to April 2021, while no significant intergroup difference was detected in body height throughout the whole cycle. GSI showed an overall rising tendency from August 2020 to April 2021, reaching the maximum value of 9.32% in April 2021; the minimum GSI value (3.02%) was observed in August 2020, followed by a sharp decline in June 2021.

3.2. Histological Characteristics of Ovarian Samples

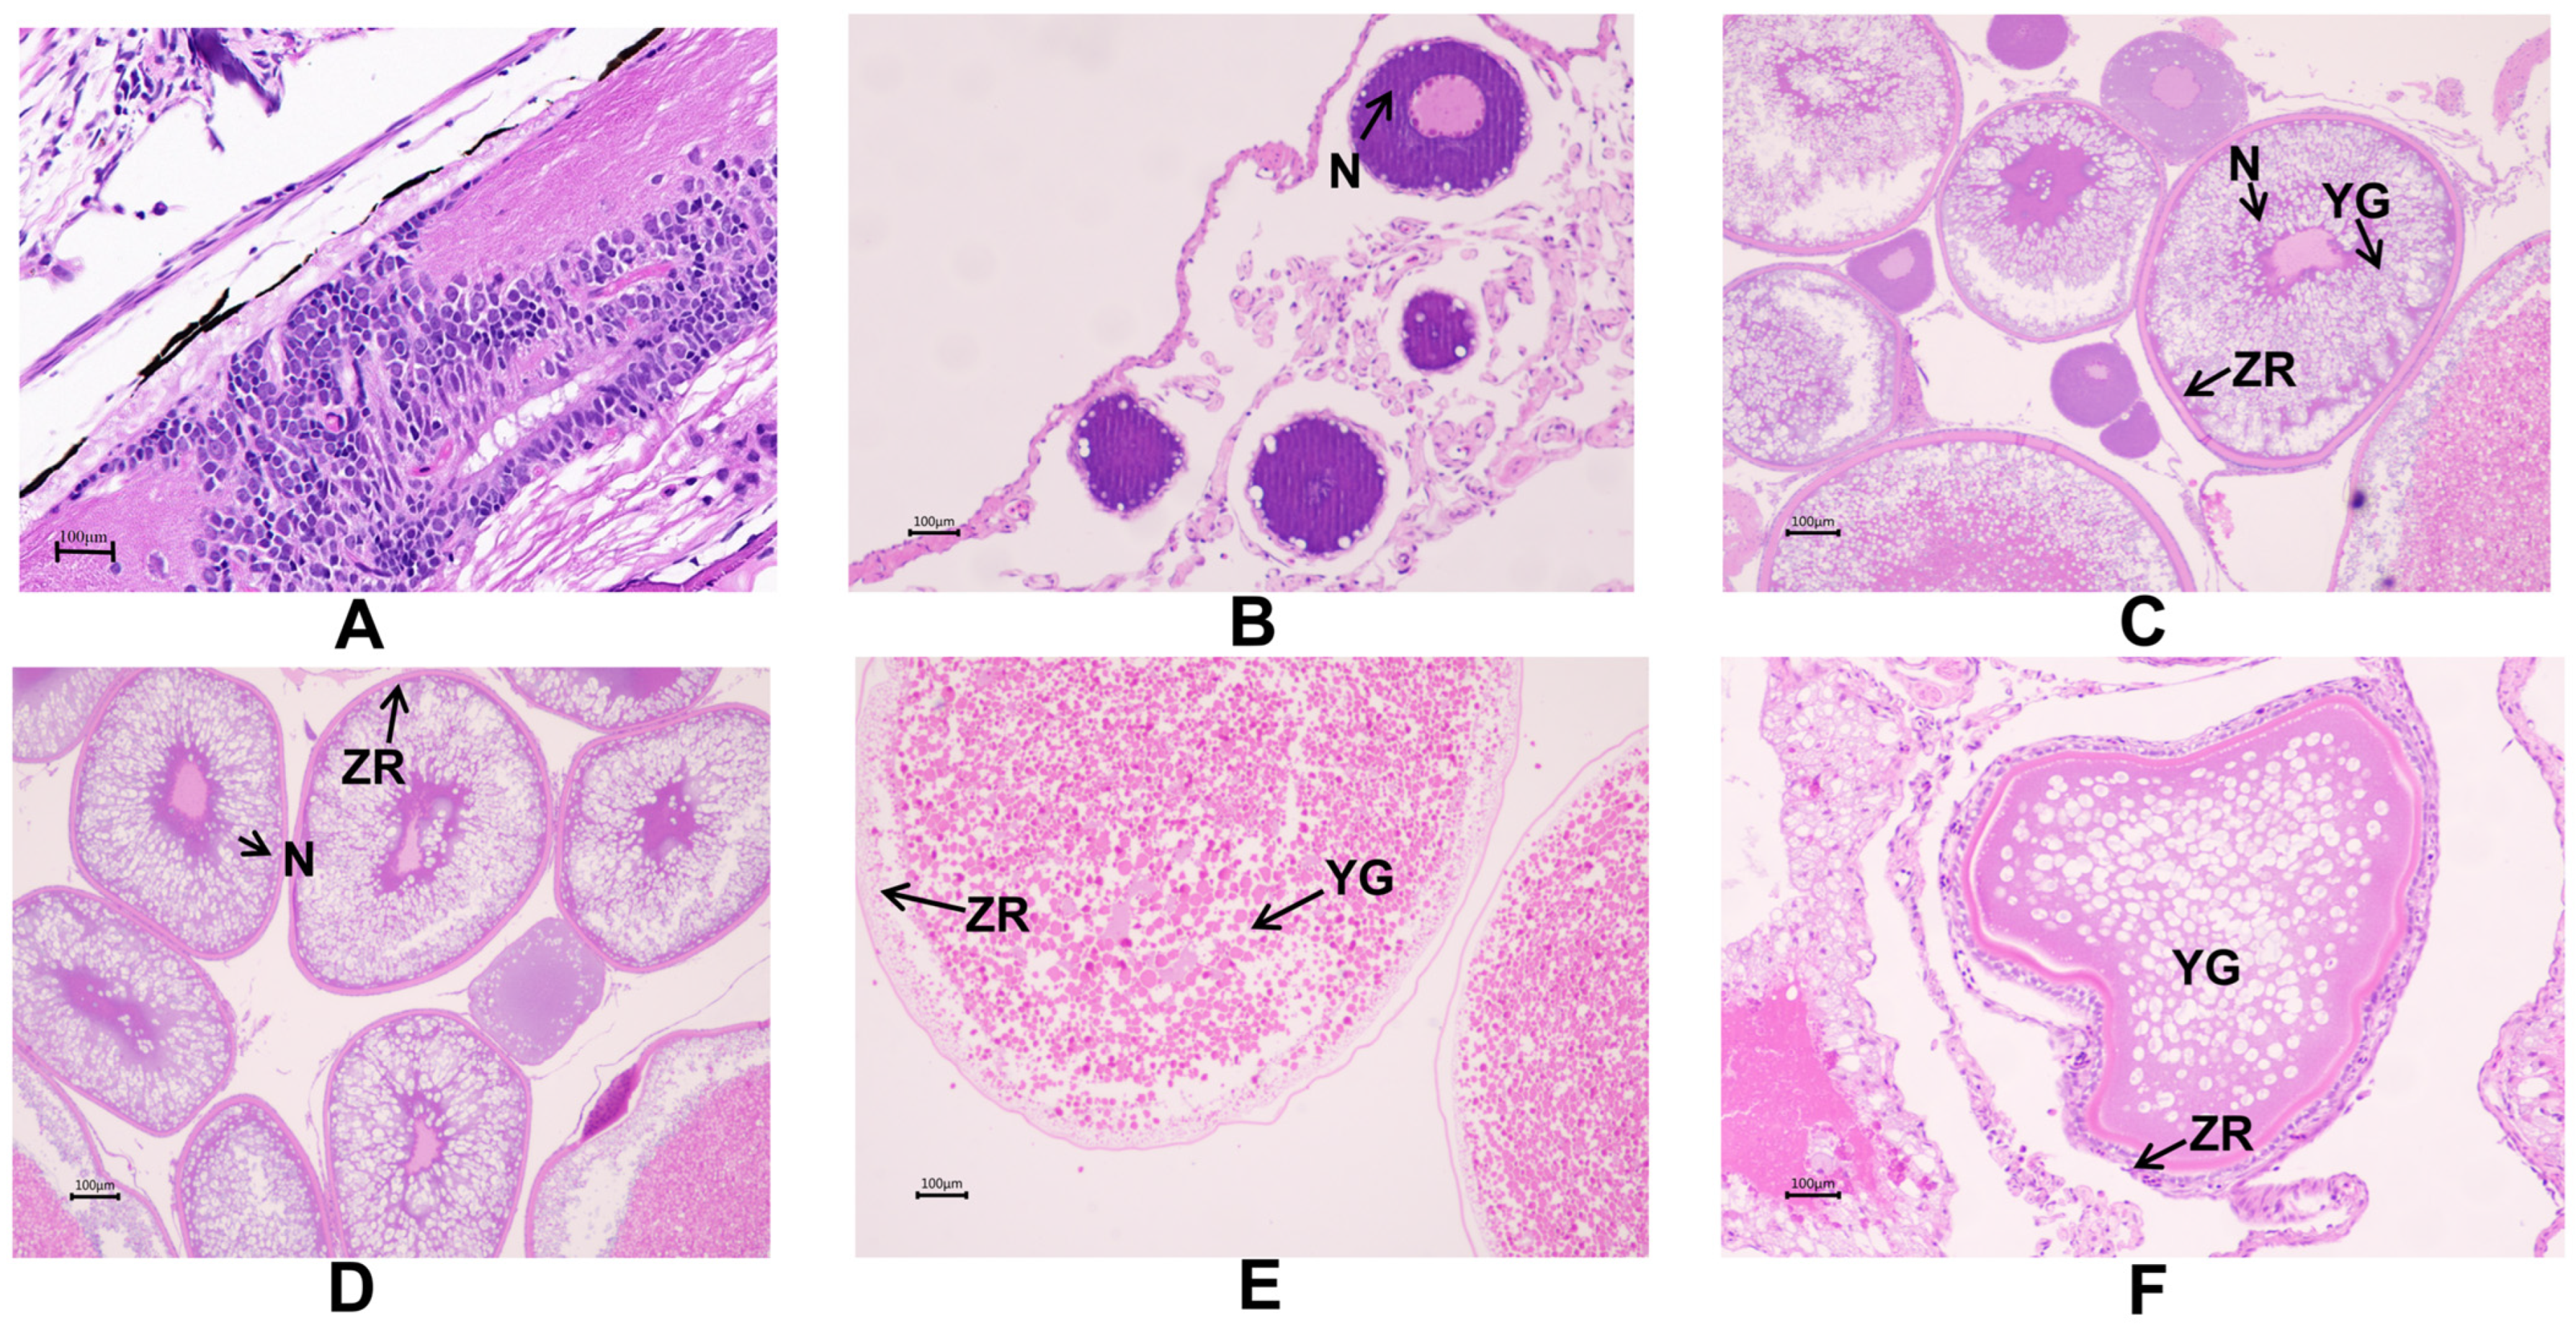
This study employed conventional paraffin sectioning and HE staining techniques to conduct annual histological observations of the ovaries of P. extremus throughout a complete reproductive cycle (Figure 1). Based on characteristics such as oocyte morphology, yolk accumulation, follicular membrane structure, and nuclear changes, and referring the classification criteria of Liu Yun et al. and Teresa, ovarian development was divided into six stages (Stage I–VI) corresponding to sequential oocyte developmental stages.
For each ovarian stage, 3 female individuals were sampled, with 45 oocytes measured per individual for morphometric quantification (Table 4). Oocyte diameter increased progressively from Stage I to Stage V, with mean diameters ranging from 33.4 ± 6.1 μm (Stage I) to 3251.2 ± 32.6 μm (Stage V). One-way ANOVA revealed extremely significant interstage differences in mean oocyte diameter (p < 0.01). Post hoc multiple comparisons confirmed that all adjacent developmental stages exhibited significant differences in oocyte size (all p < 0.05), with the largest diameter increment detected between Stage IV and Stage V (an increase of approximately 1102.7 μm). Notably, Stage VI ovaries showed a sharp decline in mean oocyte diameter (1388.0 ± 21.9 μm) relative to Stage V, which corresponds to follicular atresia and regression of post-ovulatory mature oocytes. In terms of dominant oocyte proportion, the characteristic dominant oocyte type accounted for 71.3–82.3% of total oocytes across Stage I–V, demonstrating that each ovarian stage was dominated by its corresponding typical oocyte population. The highest proportion of stage-specific dominant oocytes was recorded in Stage V (82.3 ± 5.2%), whereas Stage VI displayed a drastic drop in dominant oocyte proportion (10.0 ± 4.8%), indicating massive depletion of mature oocytes after ovulation.
Stage I (Oogonial proliferation stage): The ovary remains immature and is mainly composed of oogonia and early primary oocytes. Oocytes are small, with diameters ranging from 23 to 44 μm, and exhibit round or polygonal shapes with intensely basophilic cytoplasm. One to two nucleoli are positioned centrally or peripherally within the nucleus (Figure 1A). The follicle wall is composed of a single layer of squamous follicular cells.
Stage II (Primary growth stage): The ovary enters the early small growth phase, dominated by Stage II oocytes. Oocytes enlarge markedly, with diameters of 160–187 μm, and show elliptical or irregular rounded outlines. Small cortical vacuoles of varying sizes first appear at the cytoplasmic periphery and gradually migrate inward toward the nucleus. The follicle wall remains monolayered but slightly thickened (Figure 1B).
Stage III (Active yolk accumulated stage): The ovary enters the initial stage of rapid growth. Stage III oocytes dominate, exhibiting significantly increased cell volume (520–658 µm in diameter) with morphology tending toward roundness or ovality. The number and layers of cortical vacuoles at the cytoplasmic periphery increase and fill inward. The follicular membrane differentiates into distinct inner and outer layers, forming a radial band structure in the middle. The nucleus is prominent with multiple nucleoli attached to the medial side of the nuclear membrane (Figure 1C).
Stage IV (Yolk Formation stage): The ovary is in the late rapid growth phase, dominated by vitellogenic oocytes ranging 1905–2392 μm in diameter. The cytoplasm is fully filled with eosinophilic yolk granules that occupy nearly the entire cytoplasmic compartment. The germinal vesicle remains centrally positioned at this stage, with intact nuclear membrane and distinct zona radiata and follicular wall structures observable under histology (Figure 1D).
Stage V (Oocyte fully matured): The ovary is fully mature and ready for ovulation. During this stage, oocytes exhibit distinct characteristics, with cell volume reaching 3195–3308 µm in diameter. The nucleus is completely dissolved and disappears, or only residual remnants remain. Yolk granules further merge and enlarge to fill the entire cell. The follicular membrane appears in a free state (Figure 1E).
Stage VI (Degeneration stage):
Unspawned post-ovulatory mature oocytes enter the atretic degeneration phase at Stage VI. Oocytes display irregular deformed morphology; internal yolk granules are degraded, phagocytosed, and gelatinized to form large cytoplasmic vacuoles (VG). The zona radiata thickens significantly, while the follicular wall becomes blurred, fragmented, or ruptured, accompanied by nuclear lysis and breakdown (Figure 1F).
Postpartum or anovulatory oocytes enter the degeneration stage. During stage VI, Oocytes display irregular contours; their yolk granules undergo phagocytosis, degradation, and gelatinization to form large cytoplasmic vacuoles (VG). The zona radiata thickens significantly, while the follicular wall becomes blurred, fragmented, or ruptured, accompanied by nuclear lysis and breakdown (Figure 1F).

3.3. Reproductive Hormones

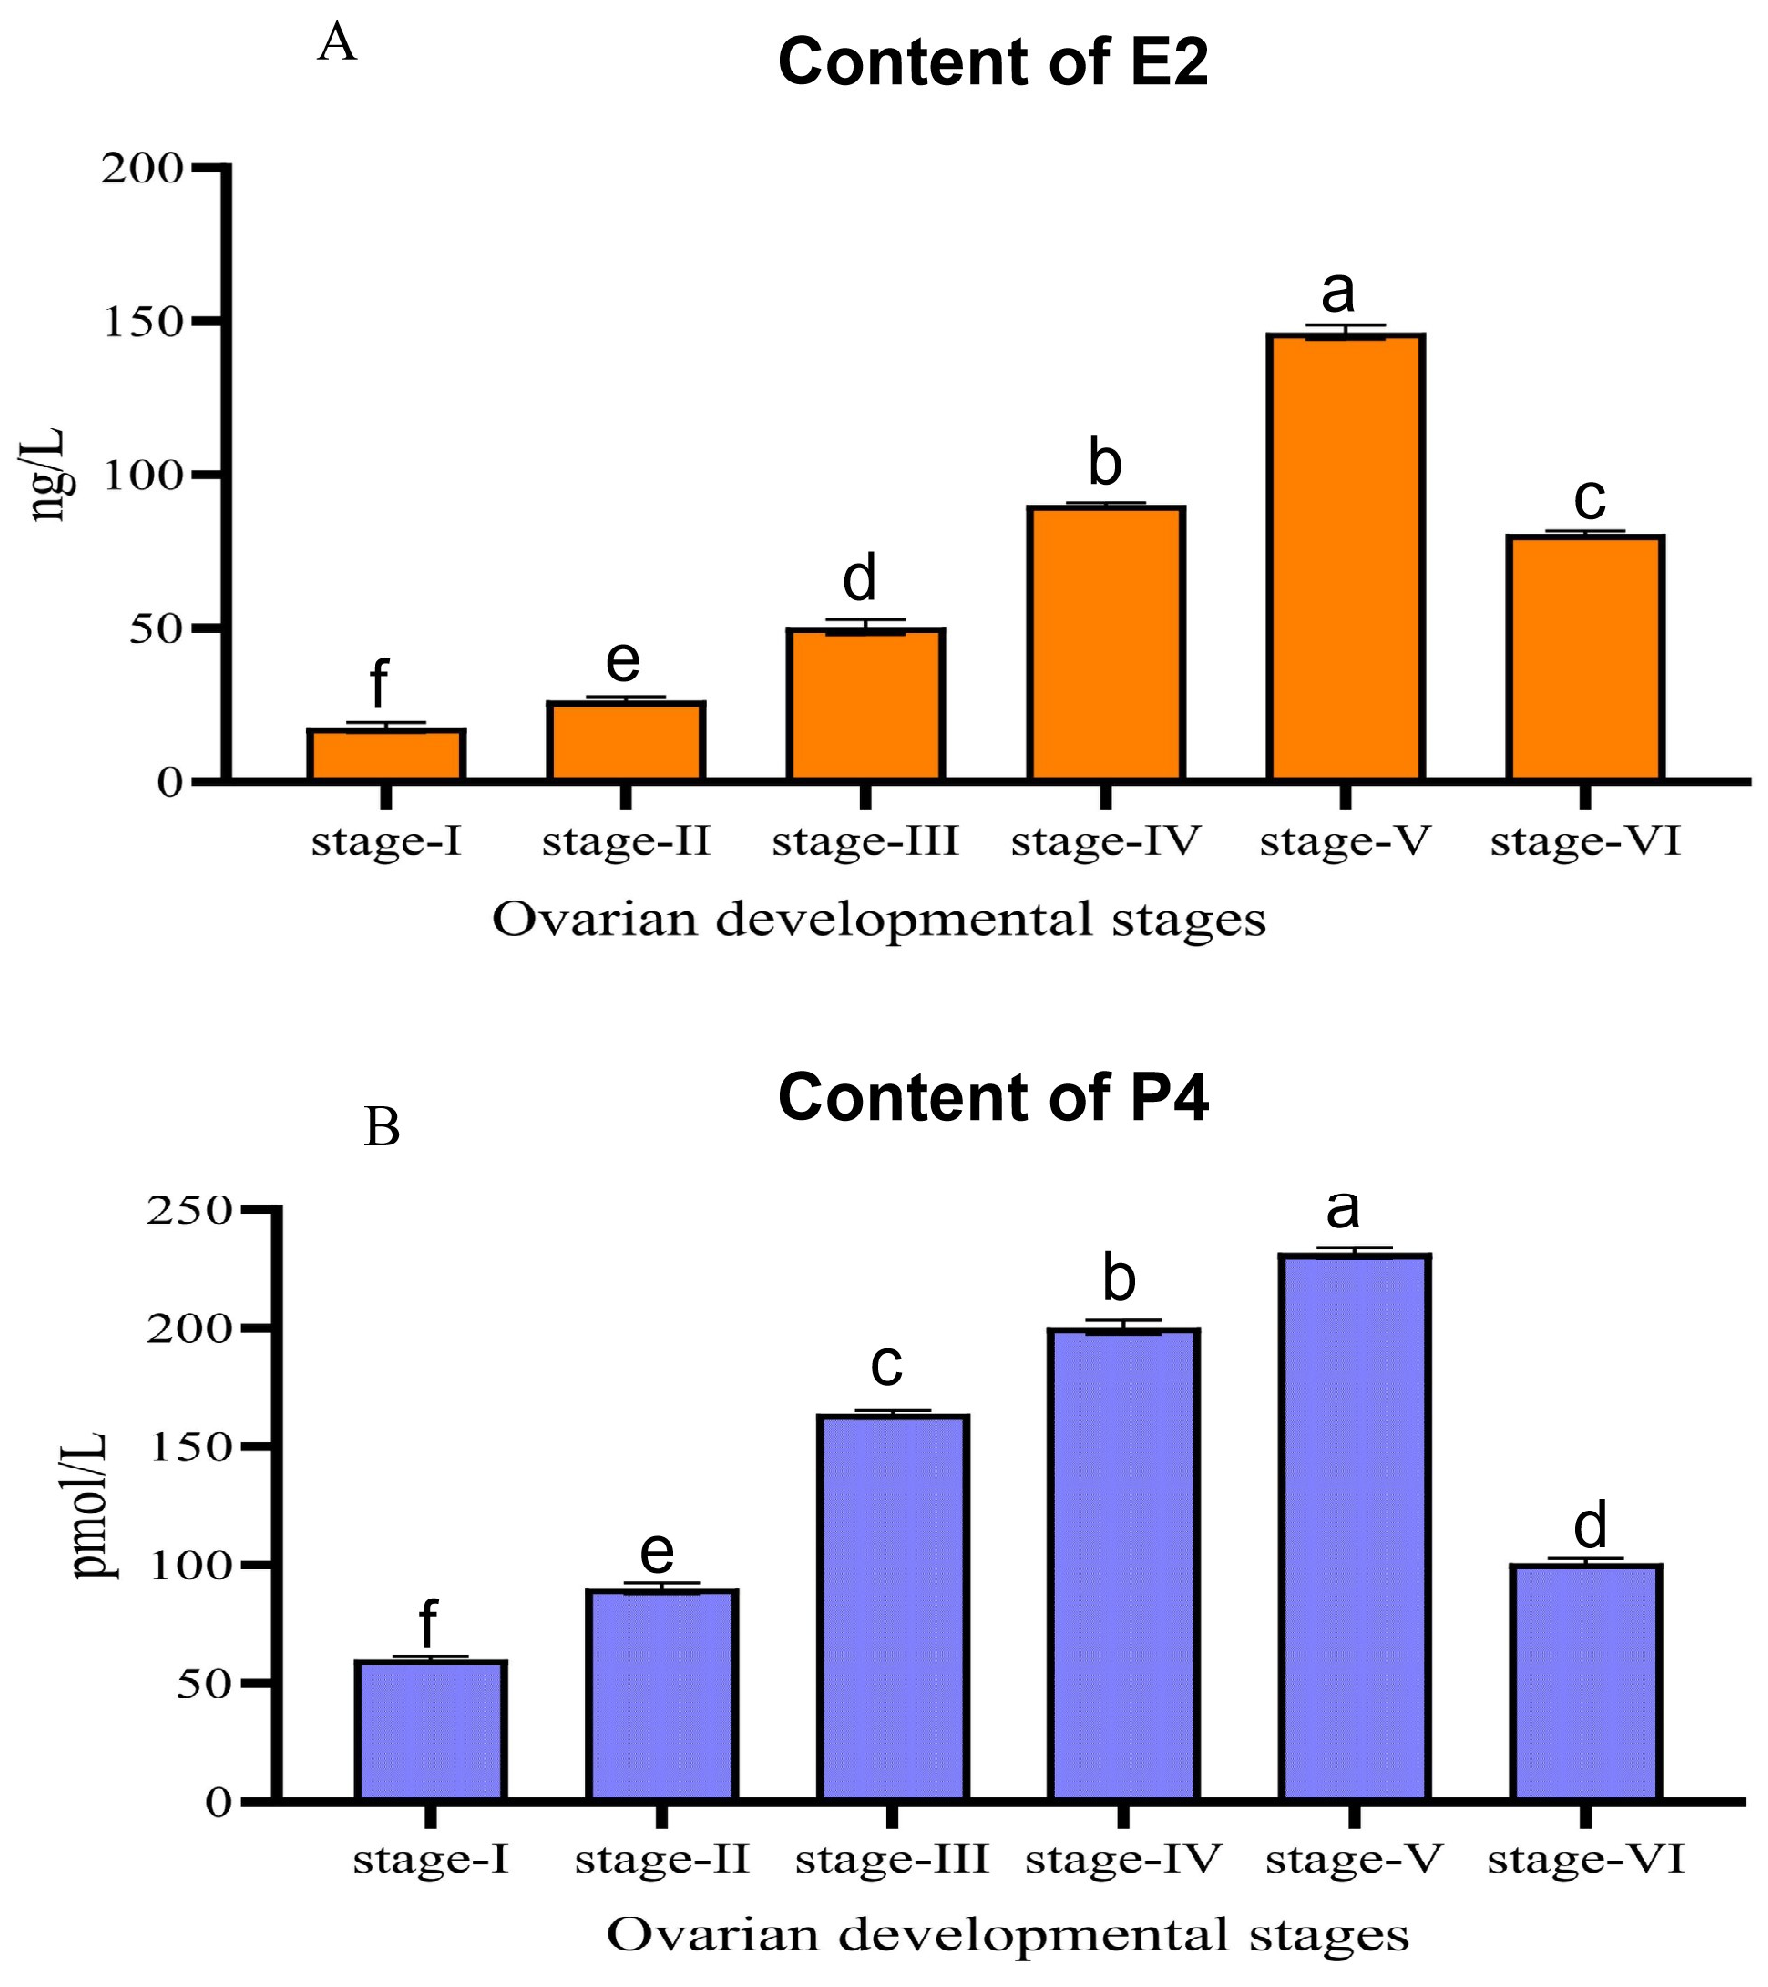
This study monitored serum estradiol (E2) concentration dynamics across six sequential ovarian developmental stages of P. extremus throughout a full reproductive cycle (Figure 2A). E2 levels displayed obvious stage-dependent rhythmic fluctuations along ovarian maturation. Serum E2 started at a low baseline of 25.77 ± 0.58 ng/L at the immature Stage I. As oogenesis advanced, E2 concentrations rose continuously: 37.77 ± 0.85 ng/L at Stage II, 48.68 ± 1.21 ng/L at Stage III, and 90.73 ± 2.14 ng/L at Stage IV. The maximum serum E2 level (146.00 ± 3.05 ng/L) occurred at fully mature Stage V, which was 5.7-fold higher than Stage I. After ovulation at Stage VI, serum E2 dropped sharply to 80.35 ± 1.92 ng/L; this value was still significantly higher than E2 concentrations measured at Stage I, II and III, but significantly lower than the peak at Stage V. One-way ANOVA confirmed extremely significant interstage differences in serum E2 (F5,12 = 142.67, p < 0.001), with Tukey’s HSD post hoc test identifying distinct differences indicated by different lowercase letters above bars.
In parallel, serum progesterone (P4) concentrations exhibited clear stage-specific temporal variation during ovarian development (Figure 2B). P4 concentrations increased continuously and significantly from Stage I to Stage V, rising from 59.88 ± 2.10 pmol/L (Stage I) to a peak value of 239.03 ± 7.94 pmol/L in Stage V. During the early vitellogenic period (Stage II to III), P4 increased markedly from 91.23 ± 1.23 pmol/L to 165.15 ± 2.02 pmol/L, reflecting robust P4 biosynthesis accompanying yolk deposition. P4 remained elevated during late vitellogenesis (Stage IV) and reached its maximum at pre-ovulatory Stage V. After ovulation, atretic Stage VI saw a sharp drop in serumP4 to 101.11 ± 1.33 pmol/L. This concentration was significantly lower than those of Stage III, IV, V and only significantly higher than Stage I and II. Global one-way ANOVA revealed highly significant differences in serumP4 across all ovarian stages (F5,12 = 187.34, p < 0.001), with pairwise differences verified via Tukey’s HSD test.

3.4. PacBio Iso-Seq and Bioinformatic Analysis

Mixed-tissue total RNA was used to construct an Iso-Seq library, which was sequenced on the PacBio Sequel platform. Stepwise data statistics of the Iso-Seq analytical pipeline are summarized in Table 5. A total of 49,087,081 raw subreads were generated from sequencing data. After initial preprocessing, 567,407 circular consensus sequence (CCS) reads were yielded, and 380,158 full-length non-chimeric (FLNC) reads were screened out by detecting 5′/3′ primers and poly(A) tails. All FLNC reads were clustered via the ICE module within SMRT Link to produce 31,372 polished consensus transcripts; no redundancy removal was performed at this clustering stage. These polished isoforms were then subjected to secondary base error correction using LoRDEC software (version 0.9; CNRS, Université de Montpellier, Montpellier, France) supported by Illumina short reads, and the transcript count remained 31,372 after correction without additional clustering. The corrected transcripts were subsequently deduplicated using cd-hit software (version 4.8.1, University of California, San Diego, CA, USA) with a 99% identity threshold, ultimately yielding 30,060 nonredundant isoforms. The lengths of these final nonredundant isoforms ranged from 75 bp to 7453 bp, with an average length of 1975 bp and an N50 value of 2422 bp. This high-quality nonredundant transcriptome was adopted as the reference sequence for all subsequent downstream analyses.
All 30,060 nonredundant full-length isoforms were subjected to functional annotation via BLASTX (version 2.11.0; National Center for Biotechnology Information, Bethesda, MD, USA) searches against multiple public protein databases. Detailed annotation statistics are summarized in Table 6. Overall, 27,615 isoforms (91.87% of all transcripts) obtained at least one functional annotation hit, whereas the remaining 2445 isoforms (8.13%) could not be matched to any public database and were classified as unannotated sequences. Individually, 27,595 (91.80%), 11,276 (37.51%), 17,466 (58.10%), 19,751 (65.71%) and 25,440 (84.63%) isoforms received functional annotations from the NR, GO, KEGG, KOG and Swiss-Prot databases, respectively. Note that individual transcripts may be annotated in multiple databases simultaneously, so the sum of annotated entries across all databases exceeds the total number of unique isoforms. Therefore, this high-confidence full-length transcriptome was used as the reference sequence for all subsequent transcriptomic analyses.

3.5. Illumina Sequencing and Analysis of Ovary and Testis

Based on ovarian histological observations, Stage III (active vitellogenesis stage) and Stage V (oocyte fully matured) were identified as two critical transition points during ovarian development of P. extremus. Stage III corresponds to the period of vigorous yolk deposition following rapid ovarian growth, whereas Stage V represents fully mature ovaries ready for ovulation. To uncover the molecular regulatory mechanisms governing these two key developmental stages, Illumina RNA-seq was conducted on ovarian tissues collected from Stage III (n = 3 biological replicates, A1–A3) and Stage V (n = 3 biological replicates, B1–B3). In total, 46.14 Gb of clean sequencing data were obtained. Every sample generated no fewer than 4.18 × 10⁷ clean reads; the Q30 value of all libraries was above 89.8%, and the GC content ranged from 44.2% to 49.3% (Table 7). These quality metrics confirmed that the sequencing data were of high integrity and quality for subsequent differential expression and functional enrichment analyses.
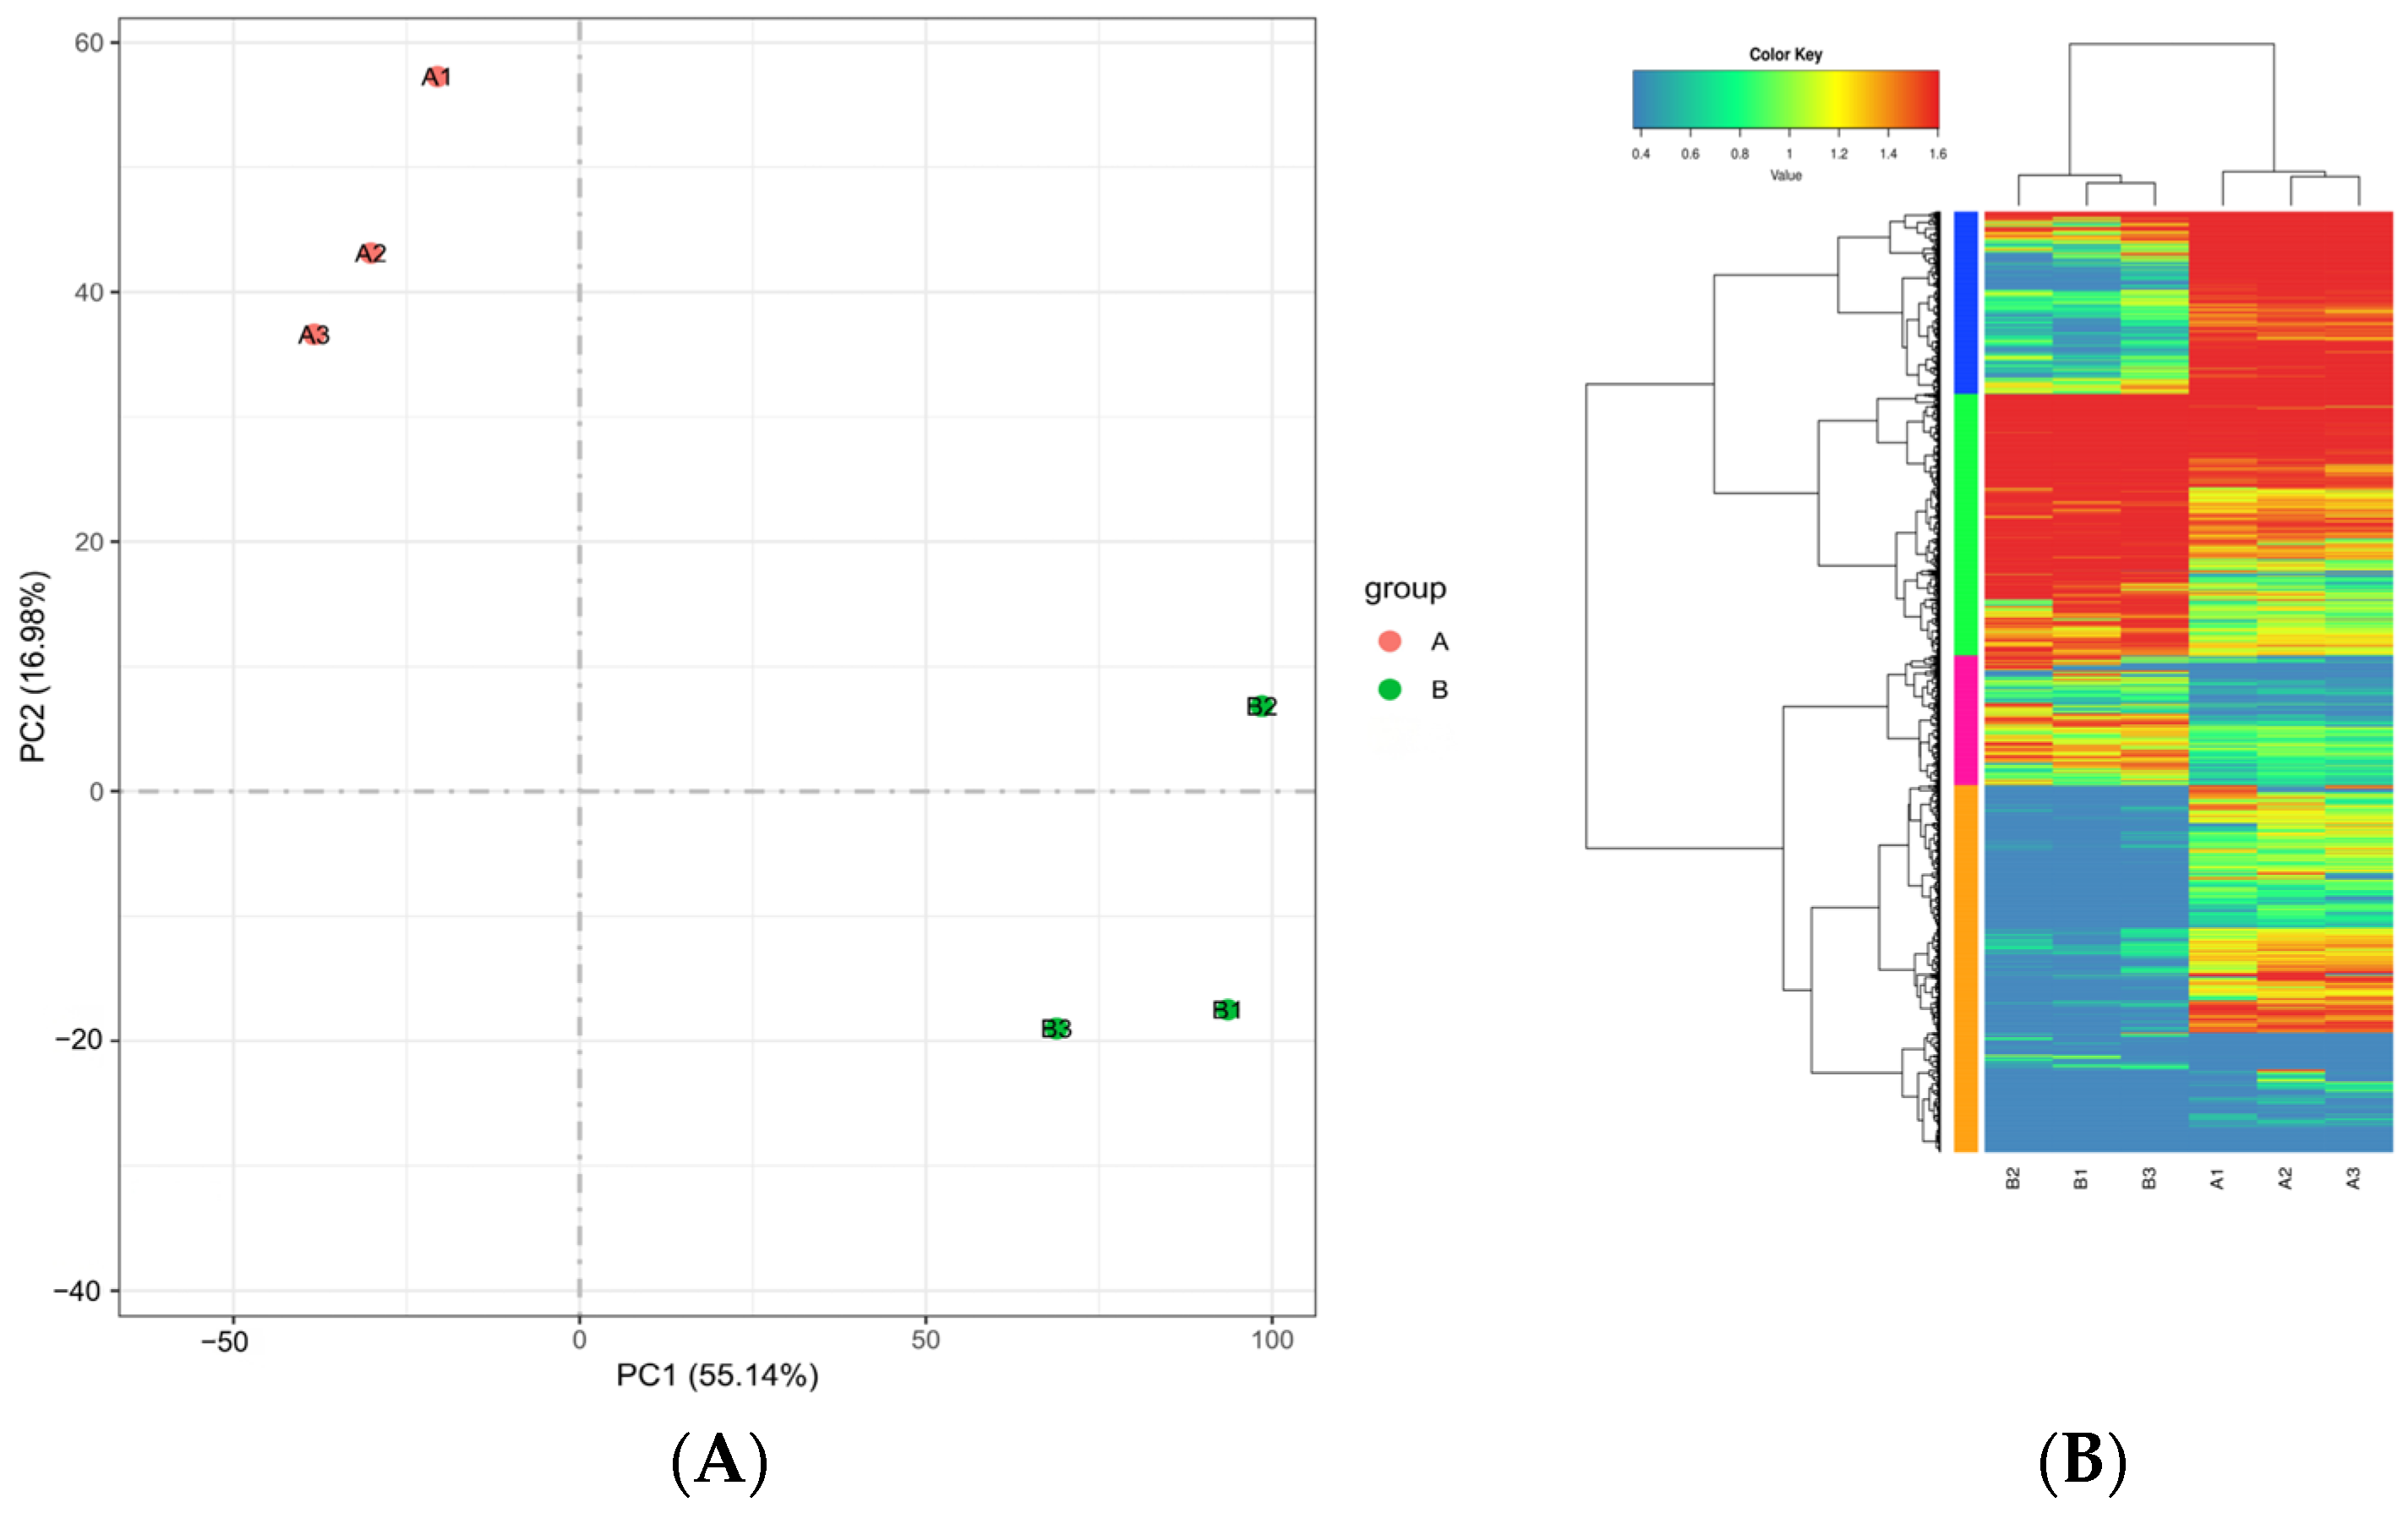
To assess global transcriptional divergence between Stage III and Stage V ovarian tissues, principal component analysis (PCA) and hierarchical sample clustering were conducted. PCA results (Figure 3A) revealed that the first two principal components PC1 and PC2 accounted for 55.14% and 16.98% of the total transcriptional variance, with a cumulative explained variance of 72.12%. Clear separation was observed along the PC1 axis: all Stage III replicates (A1–A3) distributed on the negative side of PC1, while Stage V samples (B1–B3) clustered on the positive side of PC1. This distinct grouping demonstrates that dramatic transcriptomic remodeling takes place during the transition from Stage III to Stage V, and PC1 constitutes the primary source of transcriptional variation discriminating the two ovarian developmental stages. Hierarchical clustering (Figure 3B) further corroborated the PCA findings. All samples were partitioned into two discrete major clusters corresponding to Stage III and Stage V, with every biological replicate tightly grouped within its respective developmental stage, which reflects high intra-group reproducibility and prominent inter-group transcriptional differences. The dendrogram displayed long branch lengths separating the two stages, indicative of extensive overall transcriptomic divergence; by contrast, short intra-stage branch lengths confirmed robust consistency among biological replicates.

3.6. Identification of Ovary Development-Related DEGs

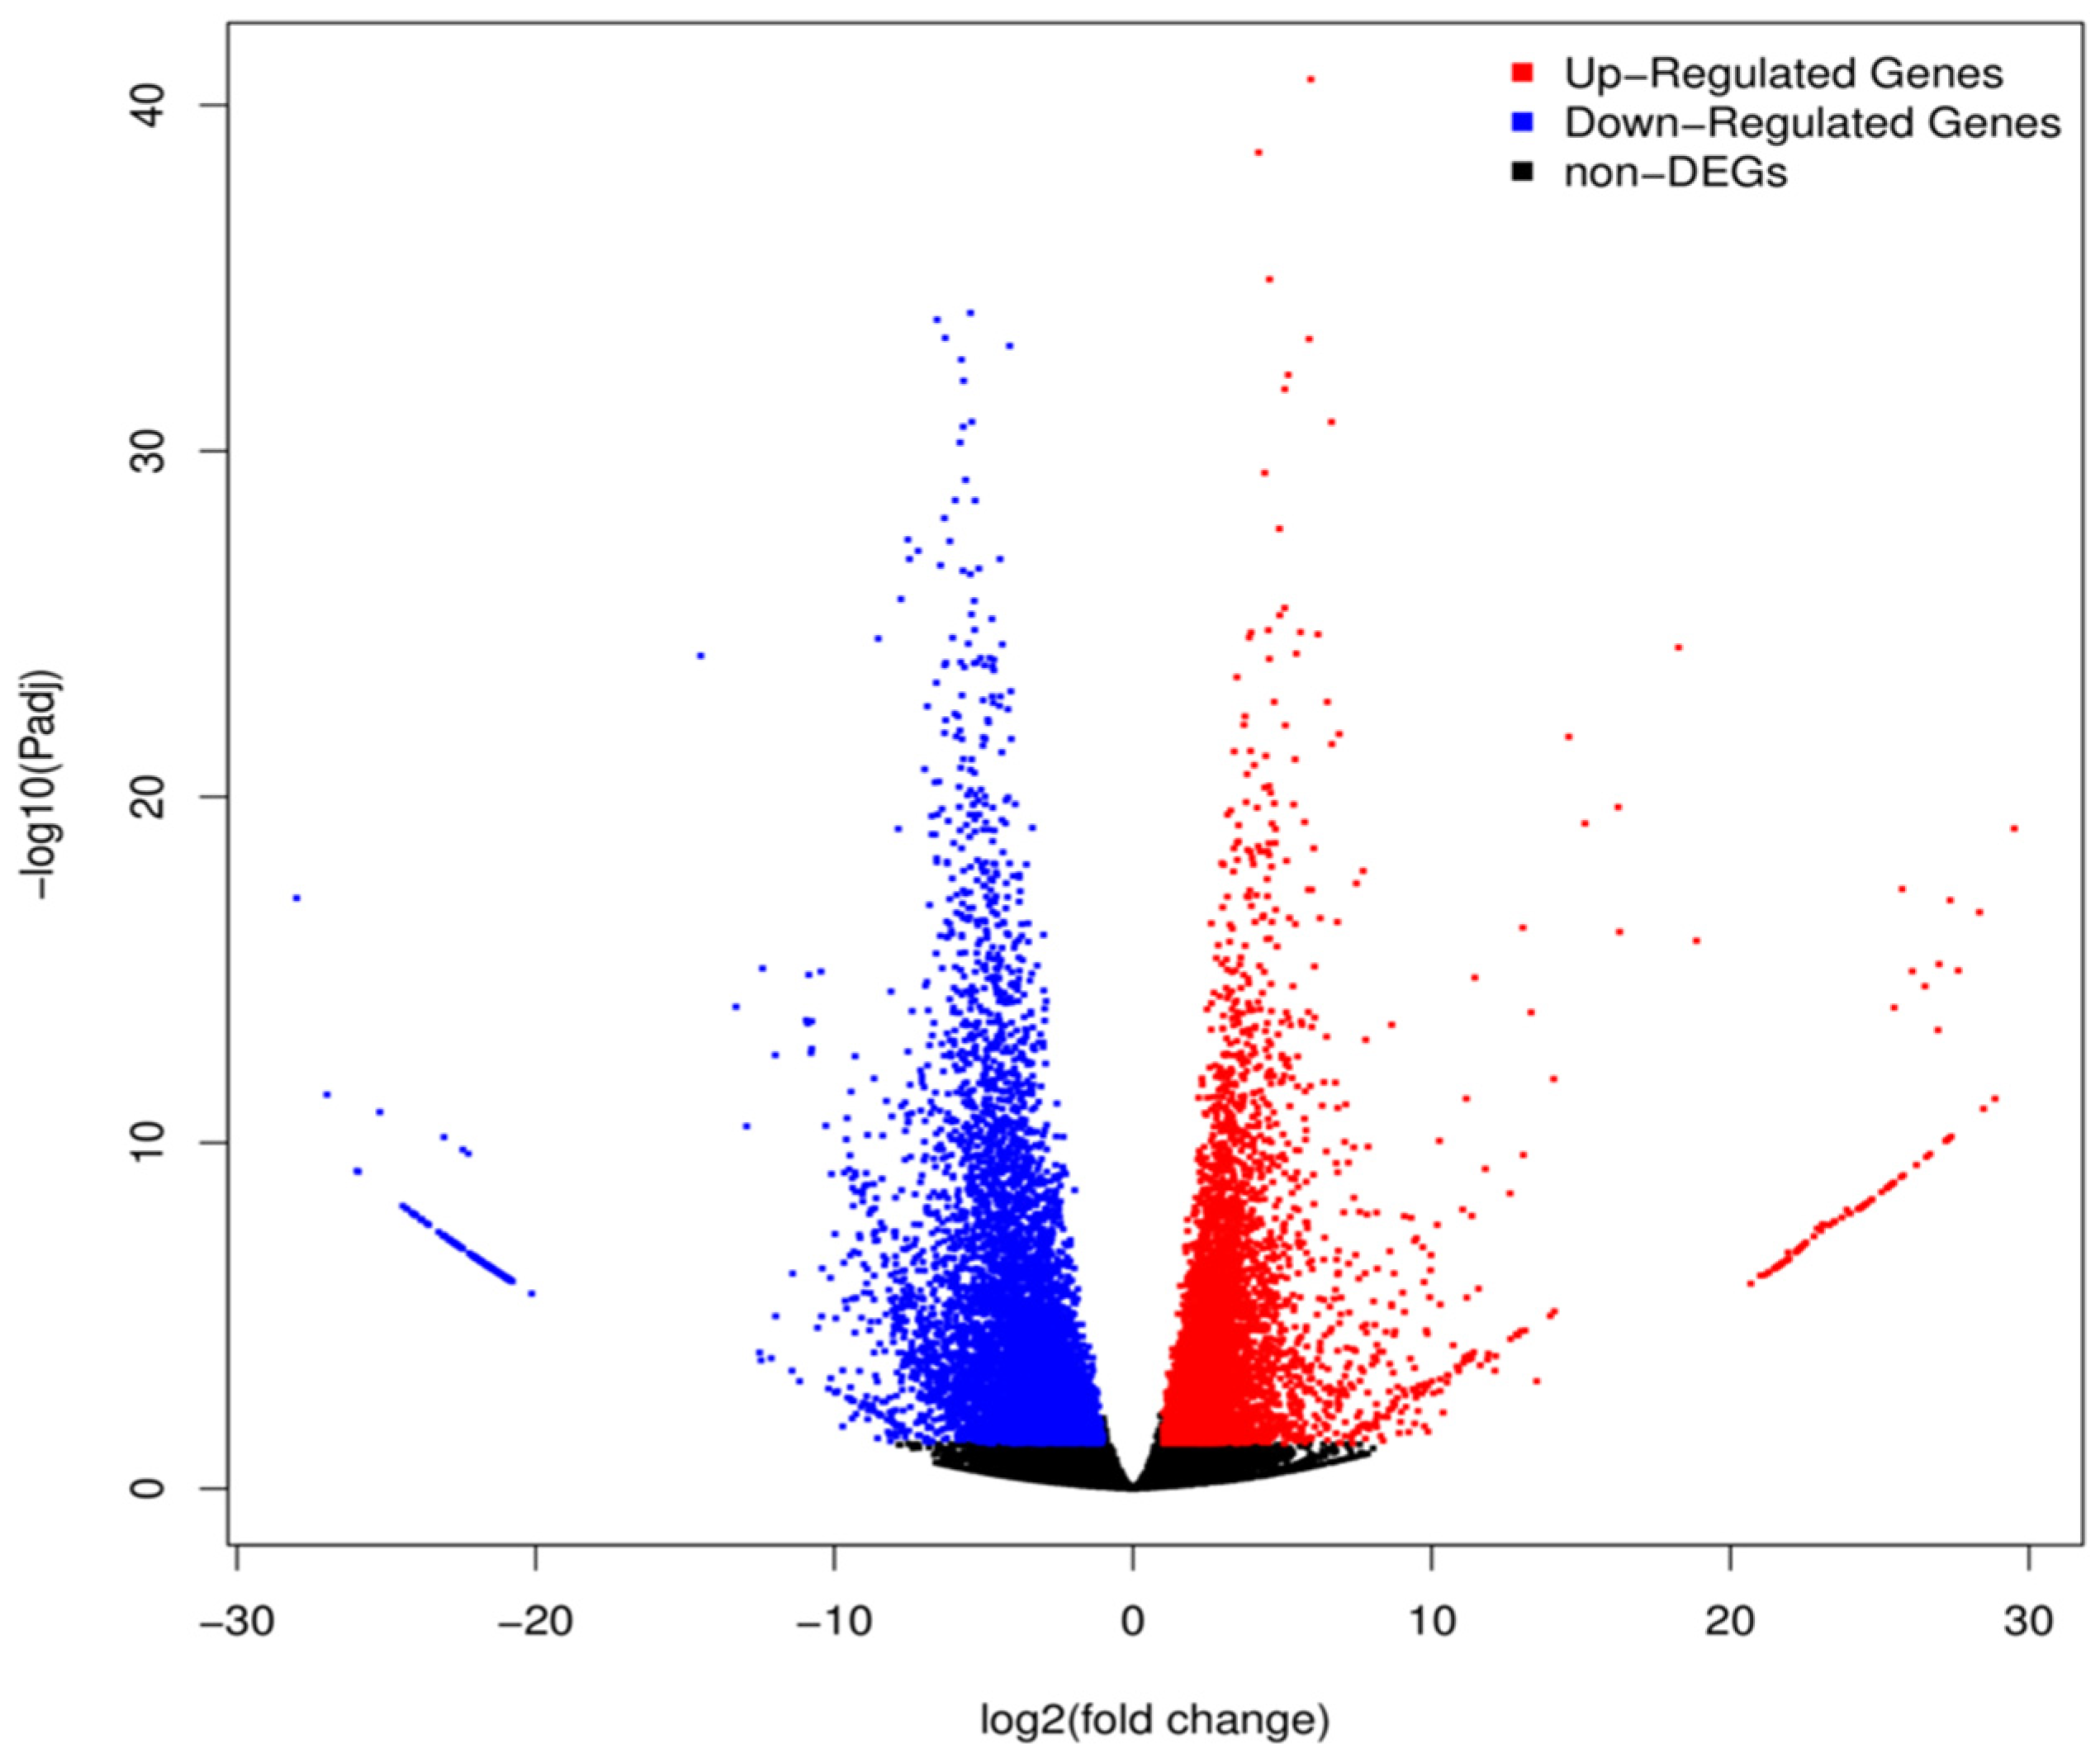
Differential expression analysis was conducted between ovarian transcriptomes of Stage III and Stage V of P. extremus, with the high-confidence full-length transcriptome assembled via PacBio Iso-Seq used as the reference sequence. Gene expression abundance was quantified as FPKM values across all six ovarian samples, and differentially expressed genes (DEGs) were screened with the threshold of |log2(fold change)| ≥ 1 and FDR-adjusted Padj < 0.05 (comparison: Stage V vs. Stage III). In total, 11,424 DEGs were identified, including 5249 significantly upregulated transcripts and 6175 significantly downregulated transcripts in Stage V relative to Stage III (Figure 4). The volcano plot (Figure 4) visualizes the global distribution of DEGs: red dots represent upregulated genes, blue dots denote downregulated genes, and black dots indicate transcripts with non-significant expression variation (Padj ≥ 0.05 or |log2FC| < 1).

3.7. Functional Enrichment Analysis of Differentially Expressed Genes

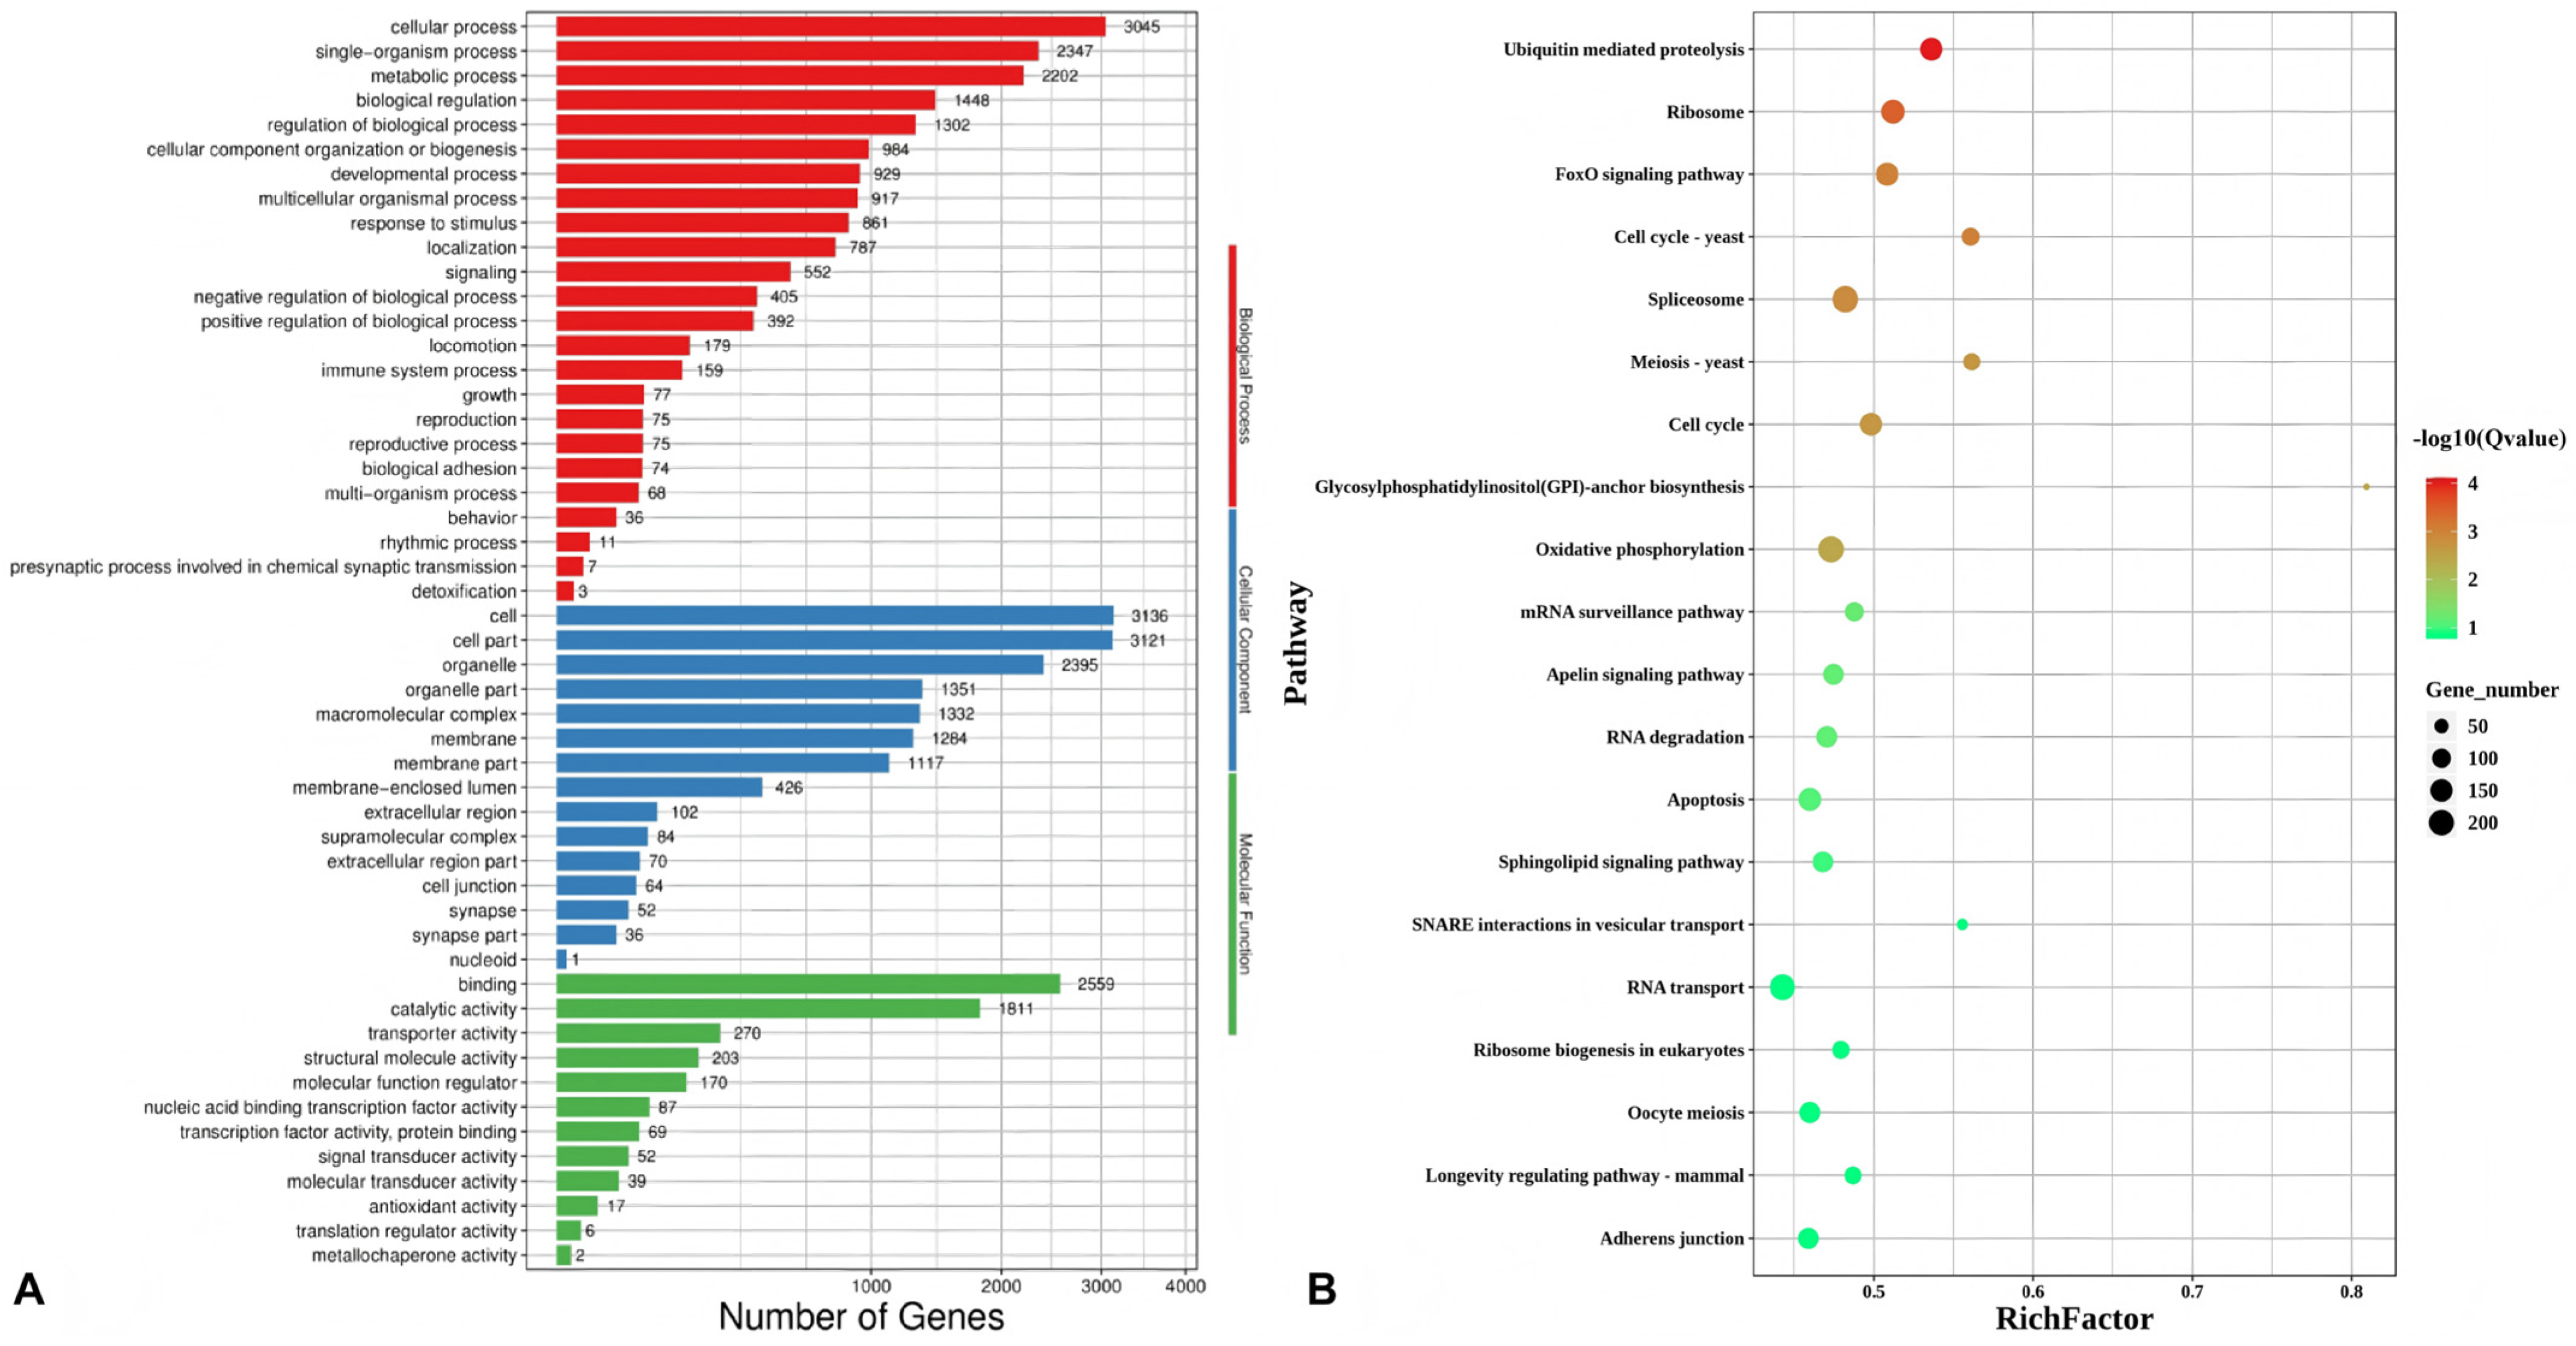
Functional enrichment analyses of DEGs were performed via Gene Ontology (GO) and Kyoto Encyclopedia of Genes and Genomes (KEGG) annotations to dissect their biological functions (Figure 5).
GO classification of all DEGs was divided into three standard top-level categories: Biological Process, Cellular Component, and Molecular Function (Figure 5A). Within Biological Process, the term cellular process contained the largest number of DEGs (3045), followed by single-organism process (2947) and metabolic process (2202). For Cellular Component, the dominant entry was cell (3136), with cell part (3121) and organelle (2395) also enriched with abundant DEGs. In the Molecular Function category, binding harbored the maximum number of DEGs (2559), while catalytic activity ranked second (1811). This indicates that DEGs mainly participate in molecular binding and catalytic biochemical reactions during ovarian development.
KEGG pathway enrichment bubble analysis (Figure 5B) further screened significantly enriched pathways associated with ovarian maturation. In this bubble plot, the x-axis represents Rich factor, dot size corresponds to the number of enriched DEGs, and the color gradient corresponds to -log10 (Qvalue) (higher values mean more significant enrichment). The most significantly enriched pathways with high Rich factor and strong statistical significance included ubiquitin-mediated proteolysis, ribosome biogenesis, FoxO signaling pathway, cell cycle, and oocyte meiosis. These pathways are closely linked to oocyte proliferation, meiosis maturation, protein degradation and translational regulation, implying their central regulatory roles during the transition from Stage III to Stage V ovaries of P. extremus.

3.8. qRT-PCR Verification of Differentially Expressed Genes

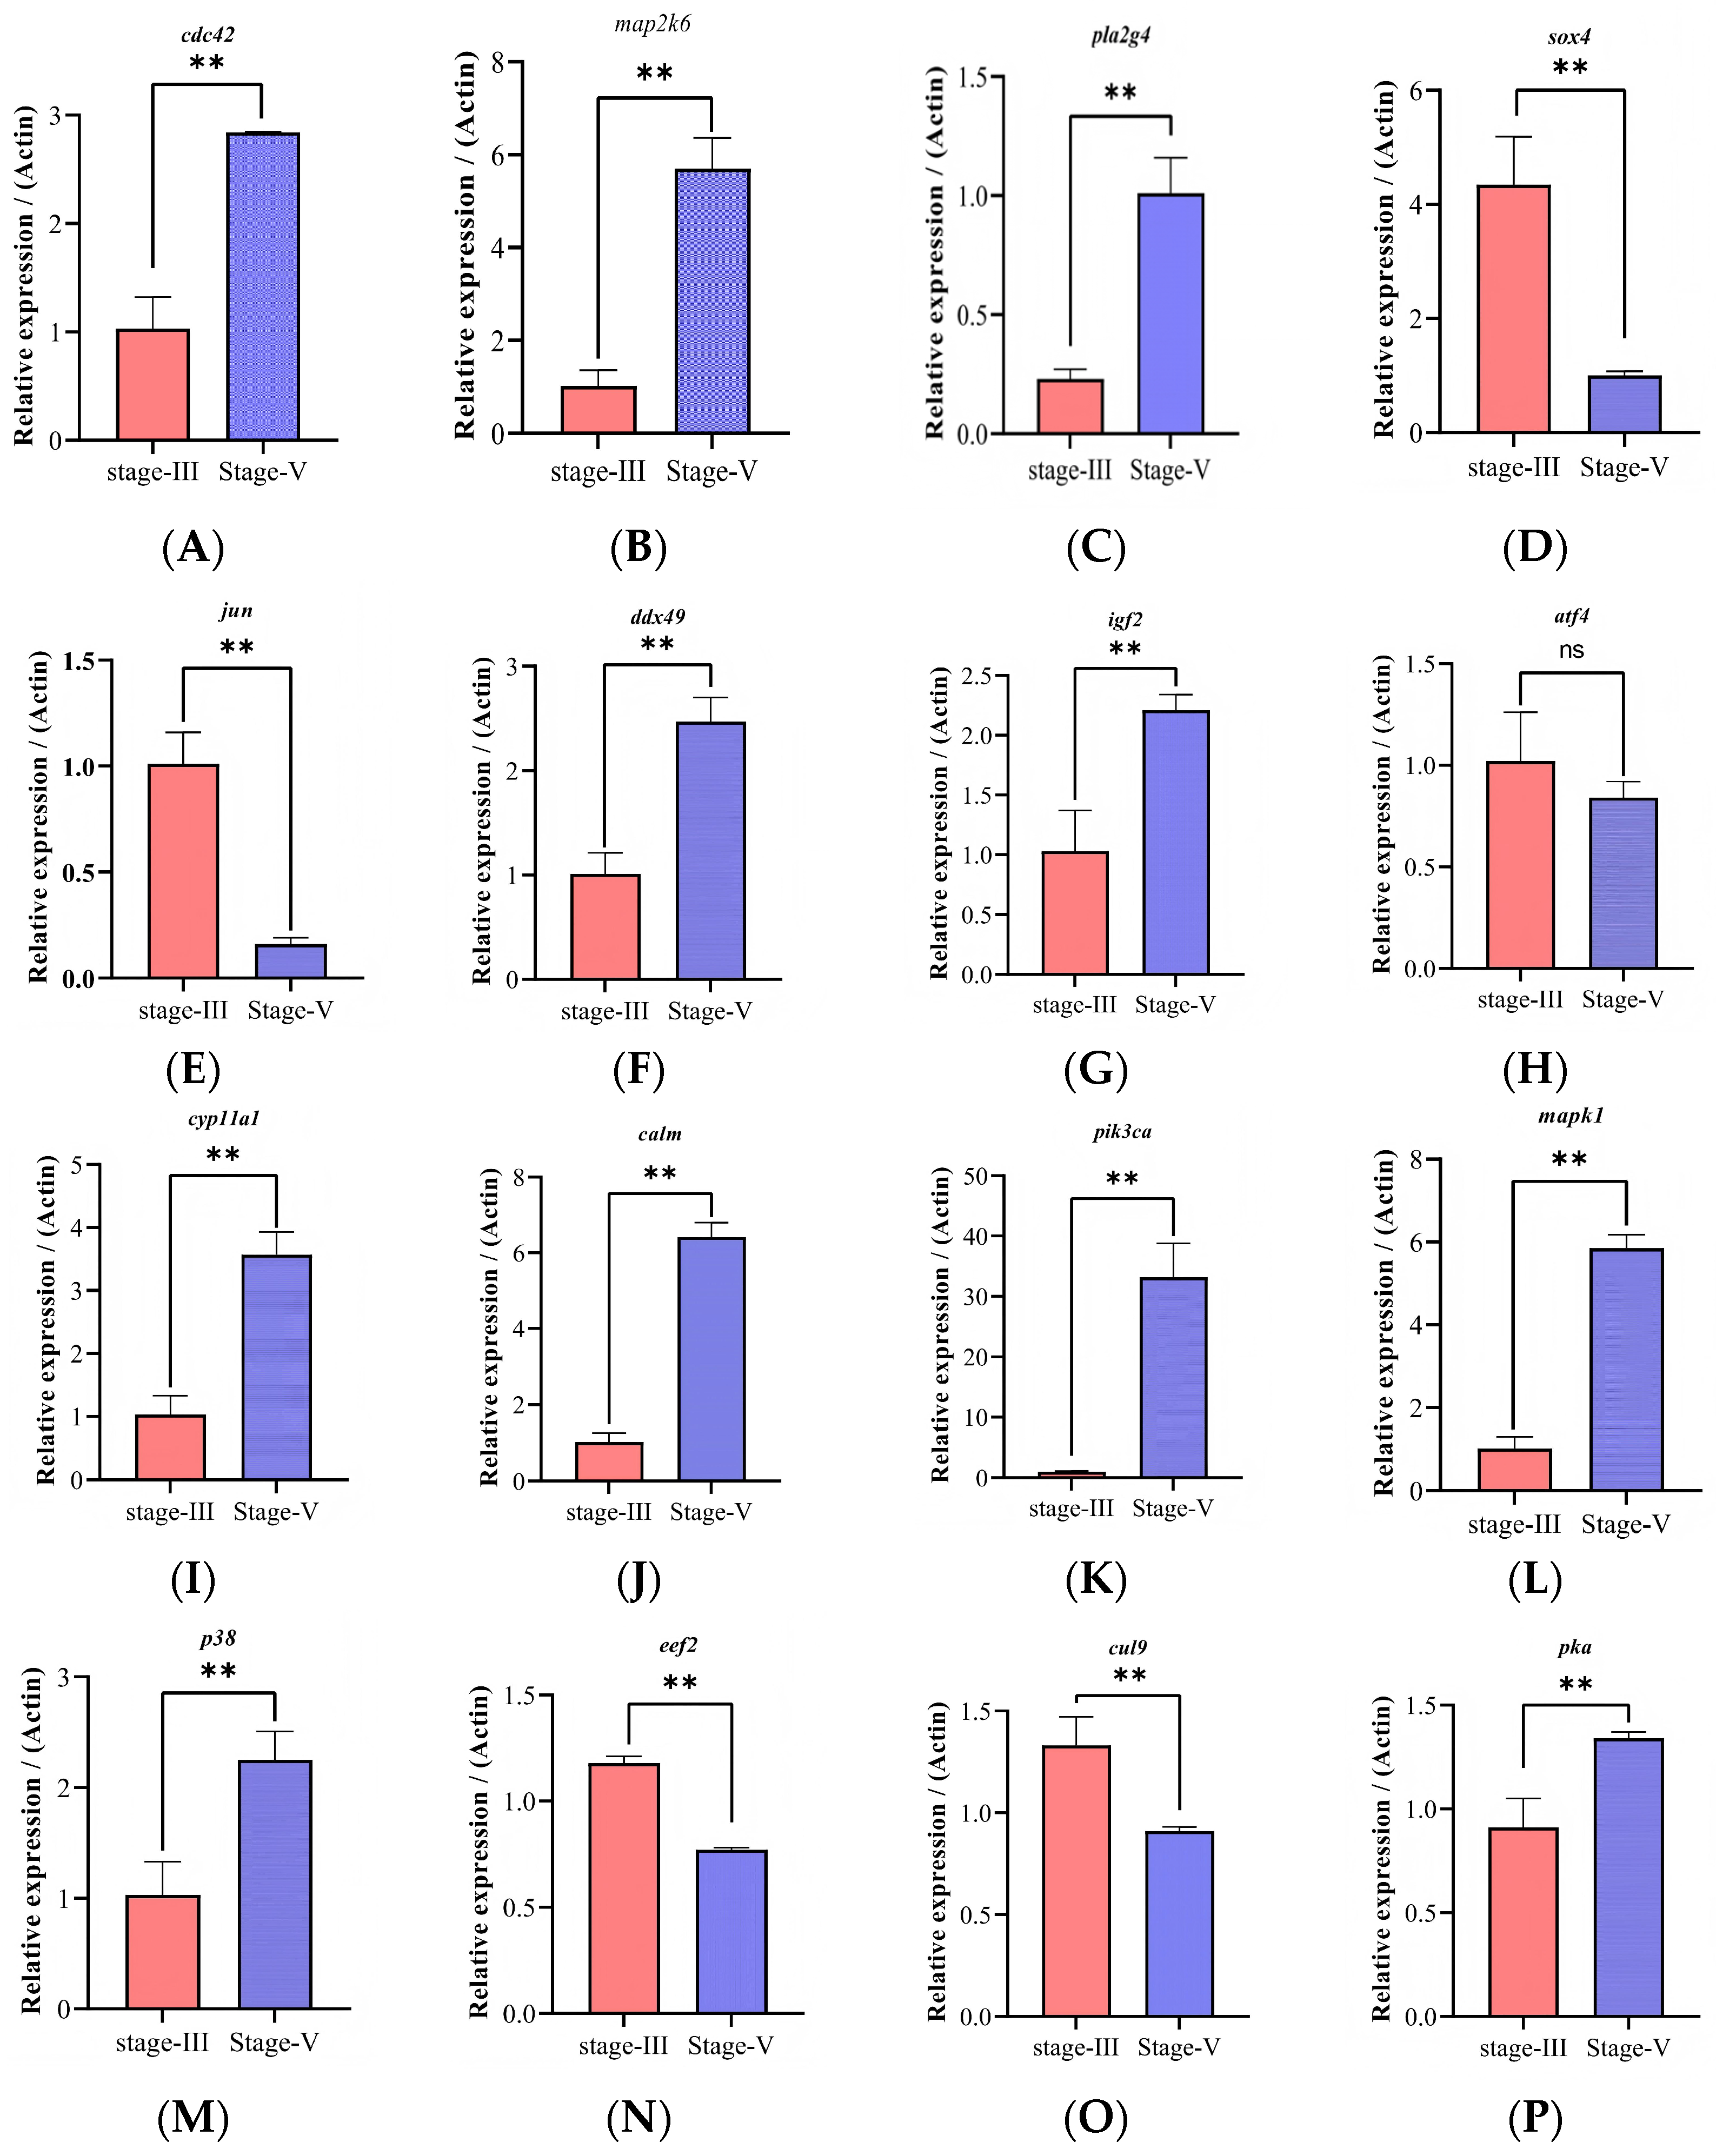
Quantitative real-time PCR (qPCR) was conducted to preliminarily verify the potential expression trends of selected candidate genes between Stage III and Stage V ovarian tissues (Figure 6). Most of the tested genes appeared to undergo obvious expression shifts across the two developmental stages, while only atf4 showed non-significant transcriptional variation.
Genes such as cdc42, map2k6, pla2g4a, ddx49, igf2, cyp11a1, calm, pik3ca, mapk1, p38 and pka tended to display markedly elevated relative expression in Stage V relative to Stage III, which may imply their potential positive involvement in ovarian maturation (p < 0.01). On the contrary, four genes (sox4, jun, eef2, cul9) were found to be significantly less abundant in Stage V, suggesting that they might exert suppressive or stage-specific functions during late oocyte development.
The exact raw and adjusted p values for all 16 validated genes are provided in Table S4. Generally speaking, the changing patterns of these qPCR-detected genes largely aligned with the differential expression trends predicted by transcriptome sequencing data. Collectively, these expression variations hint that these candidate genes could serve as potential molecular correlates linked to the late maturation of ovaries. Nevertheless, further functional validation assays will still be necessary to clarify their exact direct regulatory roles in governing oocyte maturation processes.

4. Discussion

4.1. Hormone Levels

Serum E2 and P4 of P. extremus exhibited obvious stage-dependent fluctuation patterns tightly coupled with ovarian histological development, which coincides with the reproductive endocrine regulatory mode governed by the hypothalamic-pituitary-gonadal (HPG) axis reported in multiple teleost species including Schizothorax irregularis [25].
Serum E2 showed a gradual increase from immature Stage I and seemed to enter a rapid rising phase starting at Stage III (48.68 ± 1.21 ng/L), which largely coincides with extensive yolk deposition within oocytes observed via histology. This temporal synchrony might imply a core physiological role of E2: it could stimulate hepatic vitellogenin synthesis to provide raw materials for oocyte yolk accumulation. E2 reached its maximum concentration at pre-ovulatory Stage V (146.00 ± 3.05 ng/L) once yolk filling was complete, which potentially signals the termination of vitellogenesis and the initiation of oocyte final maturation. The peak E2 concentration measured in the present study was somewhat lower than values reported in several other fish species [26]. Such disparity may be largely derived from interspecific variations in reproductive strategies, ecological adaptation and genetic background. Even so, the universal Stage V peak of E2 across teleost taxa may suggest that the timing of E2 elevation could act as a more credible biomarker for gonadal maturity than absolute hormone concentrations.
P4 exhibited a comparable ascending trend from Stage II to Stage V alongside E2, which hints at complementary physiological functions of the two steroids: E2 may predominantly participate in vitellogenic processes (Stage III–IV), whereas P4 might contribute more to pre-ovulatory oocyte maturation. This coordinated yet stage-differentiated fluctuation pattern may reflect synergistic endocrine modulation throughout ovarian development.
One point worthy of discussion is that we only quantified circulating P4 rather than its bioactive metabolite 17α,20β-dihydroxyprogesterone (DHP), which has been regarded as the primary maturation-inducing hormone (MIH) in most bony fish [27]. P4 is commonly converted to DHP by ovarian 20β-hydroxysteroid dehydrogenase, so the Stage V P4 peak detected here may mainly serve as a precursor reservoir for DHP synthesis, rather than exerting direct maturation-inducing effects itself. Whether P4 carries out independent regulatory functions during late vitellogenesis still requires further functional experiments to clarify.

4.2. Histology

This study classified the ovarian developmental process of P. extremus into six sequential stages (Stage I–VI) based on oocyte morphological traits, yolk deposition patterns and follicular structural features, with reference to established staging standards from previous teleost studies [28,29]. Histological observations appear to reveal a conserved oogenetic workflow across bony fish, which may encompass cortical vacuole proliferation, progressive yolk accumulation, germinal vesicle migration and breakdown, followed by full maturation and post-ovulatory follicular atresia. Quantitative morphometric data in Table 4 showed that oocyte diameter increased significantly from Stage I to V, with the most prominent size increment detected between Stage IV and V, and the dominant oocyte population occupied 71.3–82.3% of total follicles within each stage. Such coexistence of multi-stage oocytes yet stage-dominant follicle populations may imply a potential reproductive characteristic of this species. Combined with the concentrated occurrence of Stage V mature ovaries and widespread atretic follicles in Stage VI, we tentatively speculate that this fish might adopt a single synchronous spawning strategy [30]. though further population-scale sampling would be required to validate this reproductive mode.
Integrating histological characteristics with serum steroid hormone dynamics, stage-specific endocrine regulatory patterns can be preliminarily inferred. During Stage I–II, oocytes grew moderately while serum E2 remained at low concentrations ranging from 25.77 to 37.77 ng/L, which may suggest these early phases mainly rely on gonadotropin signaling and could correspond to a preparatory period for establishing ovarian hormone responsiveness. At Stage III, oocytes expanded to an average diameter of 520–650 μm, cortical vacuoles multiplied, and follicles differentiated into bilayered theca-granulosa structures with visible zona radiata; meanwhile, E2 rose to 48.68 ng/L. This synchronous change might indicate that E2 could shift its primary function toward facilitating vitellogenin synthesis in the liver, with zona radiata potentially mediating vitellogenin transportation into oocytes to form yolk granules. In Stage IV, ooplasm was largely filled with yolk granules and the germinal vesicle began to shift toward the animal pole, accompanied by elevated E2 (90.73 ng/L) that had not yet peaked. This co-occurrence may represent an overlapping phase for sustained vitellogenesis and the gradual initiation of meiotic resumption preparation. At Stage V, the germinal vesicle completely degenerated and yolk granules fused; serum E2 reached its peak at 146.00 ng/L alongside maximum P4 levels. We tentatively propose that the E2 summit may signal the termination of de novo yolk production, while P4 or its bioactive metabolite DHP could potentially act as a maturation-inducing signal to trigger meiotic progression and subsequent ovulation.
Stage VI ovaries displayed typical follicular atresia and sharply reduced dominant oocyte ratios, yet serum E2 maintained a relatively high concentration of 80.35 ng/L, significantly higher than values measured in Stage I–III. This observation hints that Stage VI may not simply serve as a dormant resting phase; instead, it could represent an active remodeling window for residual follicles to recover and prepare for the next reproductive cycle. Comparable histological and endocrine profiles have also been documented in teleost species such as Oxyeleotris lineolata [31], which may point to partially conserved ovarian developmental regulatory frameworks across bony fish taxa.
Taken together, the stage-specific complementary fluctuation of E2 and P4 may constitute a core endocrine cascade driving the transition from vitellogenesis to ovulation. The sustained moderate E2 level in post-ovulatory Stage VI might provide a favorable hormonal microenvironment for follicular reconstruction and the initiation of the next annual reproductive cycle.

4.3. Transcriptome

In recent years, PacBio long-read sequencing has enabled the acquisition of full-length transcripts without short-read assembly, which may be especially advantageous for non-model species lacking high-quality reference genomes [32]. As an endangered plateau fish lacking a complete genome, P. extremus relies on full-length transcriptomes for reproductive gene exploration. Here, we constructed a PacBio Iso-Seq reference transcriptome corrected by Illumina short reads, yielding 30,060 nonredundant isoforms. Among them, 91.87% obtained functional annotations across multiple databases (Table 6). Intact full-length transcripts from SMRT sequencing tentatively suggest this dataset acts as a reliable sequence resource for ovarian molecular research of P. extremus.
Ovarian maturation involves successive oocyte growth, vitellogenesis and germinal vesicle breakdown [33]. Combined with histological staging, Stage III (massive yolk accumulation) and Stage V (pre-ovulatory maturation) were selected for comparative RNA-seq. PCA and clustering clearly separated samples of the two stages (Figure 3), hinting that profound transcriptional remodeling occurs during late ovarian development. We identified 11,424 DEGs (5249 upregulated, 6175 downregulated in Stage V vs. III; Figure 4). GO and KEGG enrichment revealed abundant DEGs enriched in endocrine signaling pathways, which may indicate endocrine networks dominate gonadal developmental regulation [34]. Major enriched hormone-related pathways included insulin, oxytocin, progesterone-mediated oocyte maturation, estrogen and GnRH signaling pathways.
Multiple candidate genes with consistent transcriptomic and qPCR expression trends were selected for verification (Figure 6). Genes including cdc42, map2k6, pla2g4a, ddx49, igf2, cyp11a1, calm, pik3ca, mapk1, p38 and pka exhibited significantly elevated expression at Stage V (p < 0.01). Pik3ca and mapk1/map2k6 encode core components of the PI3K-Akt and MAPK/ERK cascades, which have been reported to participate in oocyte meiotic resumption and ovulation across vertebrate models [35]. Integrating our hormone profiling data showing peak E2 (146.00 ng/L) and P4 concentrations at Stage V, we tentatively propose a correlative regulatory model: upon steroid hormone signal accumulation, PI3K-Akt and MAPK pathways might be synergistically activated, potentially triggering downstream molecular cascades that facilitate follicle remodeling and ovulation. This inference is merely based on transcriptional correlation and requires further functional validation.
PI3K, AKT and PKA act as key intermediate mediators within the insulin signaling pathway and the PI3K/Akt axis has been implicated in ovarian follicle differentiation in other fish taxa [36]. Here, 138 DEGs were enriched in the insulin signaling pathway, and qPCR verified significantly higher expression of pka and mapk1 at Stage V. These coordinated expression patterns may imply that insulin pathway signals could modulate late ovarian maturation of P. extremus, though this association cannot yet confirm direct functional causality. MAPK family kinases respond to mitotic and differentiation stimuli and are widely documented to regulate oocyte meiosis and maturation; cAMP/PKA signaling governs LH-triggered steroid synthesis in granulosa cells and participates in tissue remodeling and hormonal feedback [37]. Previous zebrafish research also reported that FSH-mediated p38 activation drives meiotic progression in oocytes. The elevated abundance of p38, pka and mapk1 transcripts at Stage V shows consistent correlation with oocyte full maturation, marking these genes as candidate regulatory factors worthy of future mechanistic testing, rather than offering definitive functional evidence.
By contrast, four genes (sox4, jun, eef2, cul9) displayed significantly lower expression in Stage V ovaries. pla2g4a participates in arachidonic acid metabolism and inflammatory responses; its transcriptional decline at Stage V might reflect a potential shift in preovulatory follicles from growth-related inflammatory status toward an ovulation-competent state [38]. As a core subunit of AP-1 transcription factor complexes, reduced jun expression could be linked to the suppression of specific transcriptional programs after E2 reaches its maximal concentration. The downregulation of eef2 appears somewhat counterintuitive, given that inhibited eef2 generally suppresses global protein synthesis. Consistent with prior findings in Xenopus [39], the downregulation of eef2 transcripts at Stage V may hint at altered translational activity during final oocyte maturation, though the underlying translational regulatory mode cannot be determined solely from transcriptomic data. Downregulated cul9 lacks protein-level evidence to confirm its meiotic regulatory function, leaving its biological impact speculative [40]. However, all the above deductions are only based on transcriptional data and qPCR validation, which cannot confirm causal gene functions. Further pharmacological interference, protein detection and hormone treatment assays are needed to clarify the regulatory roles of these endocrine pathways in ovarian maturation.
This study has an obvious limitation: only Stage III and Stage V ovaries were compared, while intermediate stages (II, IV) were excluded. Ovarian development proceeds continuously, so transient mild transcriptional shifts during Stage II–III, III–IV and IV–V transitions may be masked by the large expression divergence between Stage III and V. Our data can only capture major transcriptional reprogramming at late maturation but cannot reconstruct a complete continuous gene regulatory cascade covering all six developmental stages. Future studies are warranted to address the limitations of the current work and to functionally validate the candidate genes identified. Meanwhile, functional validation of the key genes and pathways highlighted here will be pursued through in vitro ovarian follicle culture systems combined with hormone or inhibitor treatments to dissect downstream signaling events, as well as CRISPR/Cas9-based genome editing to generate stable knockout lines for examining in vivo phenotypic consequences on ovarian morphology and fecundity. These complementary approaches will not only validate our transcriptomic findings but also establish a comprehensive molecular framework for understanding teleost ovarian development.


5. Conclusions

This study combined PacBio Iso-Seq and Illumina RNA-seq to build the full-length transcriptome of P. extremus. We obtained 30,060 full-length transcripts (average length: 1975 bp; N50: 2422 bp), 91.87% of which were annotated, and this dataset may offer better transcript integrity than short-read data alone. Combining ovarian histology and serum E2/P4 dynamics, we characterized gonadal stage features and screened DEGs mediating the shift from vitellogenic Stage III to mature Stage V. qRT-PCR verified high expression of pka, mapk1 and p38 at Stage V, implying their potential roles in oocyte maturation. Though only Stage III and V were sequenced, their comparison may reflect major transcriptional remodeling switching ovarian function from yolk deposition to meiosis. This transcriptome resource provides basic molecular references for exploring ovarian development and artificial breeding of P. extremus. Further multi-stage sequencing is needed to complete the regulatory network.

Supplementary Materials

The following supporting information can be downloaded at: https://www.mdpi.com/article/10.3390/fishes11070411/s1, Figure S1: Five database annotation results presented in a Venn diagram; Figure S2: The expression values of all unigenes; Table S1: PacBio Iso-Seq output stastics; Table S2: Summary stastics of Iso-seq; Table S3: Number of annotated transcripts of each database; Table S4: Exact adjusted p-values of representative key differentially expressed genes between Stage III and Stage V ovarian tissues.

Author Contributions

J.W. and W.J. designed and conceived this work. W.K. and W.H. were collected the samples. Y.Z. was analysis part of the data. Y.Y. was modification of the article language. Z.Y. involved in the acquisition, analysis and interpretation of the data, the drafting of the paper. All authors have read and agreed to the published version of the manuscript.

Funding

This research was funded by the Major Science and Technology Project of Gansu Province, grant number 25ZDNA006; the Gansu Province Science and Technology Planning Project, grant numbers 25CXNA068 and 26CXNA048.

Institutional Review Board Statement

The fish collection process complied with the guidelines of Gansu Fisheries Research Institute. This study was approved by the Laboratory Animal Ethics Committee of Gansu Fisheries Research Institute (Protocol number: GFRI-2022-09-26-04, Approval date: 26 September 2022). All animals and experiments were conducted in accordance with the “Guidelines for Experimental Animals” of the Ministry of Science and Technology (Beijing, China).

Informed Consent Statement

Not applicable.

Data Availability Statement

The datasets generated and analyzed during this study have been deposited in the Short Read Archive (SRA) of the National Center for Biotechnology Information (NCBI) under accession number PRJNA1478210. The data are publicly available at http://www.ncbi.nlm.nih.gov/Traces/sra, number PRJNA1478210 (accessed on 8 May 2026).

Conflicts of Interest

The authors declare no conflicts of interest.

References

  1. Zhao, Y.; Xing, Y.; Lü, B.; Zhou, C.; Yang, W.; Zhao, K. Species diversity and conservation of freshwater fishes in the Yellow River basin. Biodivers. Sci. 2020, 28, 1496–1510. [Google Scholar] [CrossRef]
  2. Wu, Y.; Wu, C. Fish at the source of the Yellow River and the Xingxiu. Acta Zootaxonomica Sin. 1988, 13, 95–100. [Google Scholar]
  3. Liu, Y. Discussion on fishery status and proliferation pathway in Maqu Section of the Yellow River. Freshw. Fish. 1981, 37–40. [Google Scholar]
  4. Lou, Z.; Zhang, Y.; Hu, Y. Analysis of fishery development of Gansu since the founding of China. Chin. Fish. 2022, 71–73. [Google Scholar]
  5. Yue, P.; Chen, Y. China Red Data Book of Endangered Animals; Science Press: Beijing, China, 1998. [Google Scholar]
  6. Zhang, Y.; Lou, Z.; Su, J.; Jiao, W.; Wang, T.; Gong, X.; Qi, S.; Wu, J.; Wei, Y. Artificial propagation of Platypharodon extremus. J. Fish. China 2010, 34, 1698–1703. [Google Scholar] [CrossRef]
  7. Katneni, V.K.; Shekhar, M.S.; Jangam, A.K.; Prabhudas, S.K.; Krishnan, K.; Kaikkolante, N.; Paran, B.C.; Baghel, D.S.; Koyadan, V.K.; Jena, J.; et al. Novel isoform sequencing based full-length transcriptome resource for Indian white shrimp, Penaeus indicus. Front. Mar. Sci. 2020, 7, 605098. [Google Scholar] [CrossRef]
  8. Pootakham, W.; Uengwetwanit, T.; Sonthirod, C.; Sittikankaew, K.; Karoonuthaisiri, N. A novel full-length transcriptome resource for black tiger shrimp (Penaeus monodon) developed using isoform sequencing (Iso-Seq). Front. Mar. Sci. 2020, 7, 172. [Google Scholar] [CrossRef]
  9. Chen, Y.; Wu, X.; Lai, J.; Liu, Y.; Song, M.; Li, F.; Gong, Q. Full-length transcriptome sequencing and identification and immune response of TRIM genes in Dabry’s sturgeon (Acipenser dabryanus). Aquaculture 2021, 538, 736599. [Google Scholar] [CrossRef]
  10. Yang, H.; Zhou, Y.; Gu, J.; Xie, S.; Xu, Y.; Zhu, G.; Wang, L.; Huang, J.; Ma, H.; Yao, J. Deep mRNA sequencing analysis to capture the transcriptome landscape of zebrafish embryos and larvae. PLoS ONE 2013, 8, e64058. [Google Scholar] [CrossRef] [PubMed]
  11. Tian, Y.; Wen, H.; Qi, X.; Zhang, X.; Liu, S.; Li, B.; Sun, Y.; Li, J.; He, F.; Yang, W.; et al. Characterization of full-length transcriptome sequences and splice variants of lateolabrax maculatus by single-molecule long-read sequencing and their involvement in salinity regulation. Front. Genet. 2019, 10, 1126. [Google Scholar] [CrossRef] [PubMed]
  12. Huang, T.; Gu, W.; Liu, E.; Zhang, L.; Dong, F.; He, X.; Jiao, W.; Li, C.; Wang, B.; Xu, G. Screening and validation of p38 MAPK involved in ovarian development of Brachymystax lenok. Front. Vet. Sci. 2022, 9, 752521. [Google Scholar] [CrossRef] [PubMed]
  13. Li, X.; Wu, J.; Xiao, X.; Rong, Y.; Yang, H.; Li, J.; Zhou, Q.; Zhou, W.; Shi, J.; Qi, H.; et al. Characterization and complexity of transcriptome in Gymnocypris przewalskii using single-molecule long-read sequencing and RNA-seq. DNA Res. 2021, 28, dsab005. [Google Scholar] [CrossRef] [PubMed]
  14. Luo, H.; Liu, H.; Zhang, J.; Hu, B.; Zhou, C.; Xiang, M.; Yang, Y.; Zhou, M.; Jing, T.; Li, Z.; et al. Full-length transcript sequencing accelerates the transcriptome research of Gymnocypris namensis, an iconic fish of the Tibetan Plateau. Sci. Rep. 2020, 10, 9668. [Google Scholar] [CrossRef] [PubMed]
  15. Wang, L.; Zhu, P.; Mo, Q.; Luo, W.; Du, Z.; Jiang, J.; Yang, S.; Zhao, L.; Gong, Q.; Wang, Y. Comprehensive analysis of full-length transcriptomes of Schizothorax prenanti by single-molecule long-read sequencing. Genomics 2022, 114, 456–464. [Google Scholar] [CrossRef] [PubMed]
  16. Selman, K.; Wallace, R.A.; Sarka, A.; Qi, X. Stages of oocyte development in the zebrafish, Brachydanio rerio. J. Morphol. 1993, 218, 203–224. [Google Scholar] [CrossRef] [PubMed]
  17. Li, W.; Godzik, A. Cd-hit: A fast program for clustering and comparing large sets of protein or nucleotide sequences. Bioinformatics 2006, 22, 1658–1659. [Google Scholar] [CrossRef] [PubMed]
  18. Chen, Y.; Chen, Y.; Shi, C.; Huang, Z.; Zhang, Y.; Li, S.; Li, Y.; Ye, J.; Yu, C.; Li, Z.; et al. SOAPnuke: A MapReduce acceleration-supported software for integrated quality control and preprocessing of high-throughput sequencing data. GigaScience 2018, 7, gix120. [Google Scholar] [CrossRef] [PubMed]
  19. Langmead, B. Aligning short sequencing reads with bowtie. Curr. Protoc. Bioinform. 2010, 32, 11.7.1–11.7.14. [Google Scholar] [CrossRef] [PubMed]
  20. Fu, L.; Niu, B.; Zhu, Z.; Wu, S.; Li, W. CD-HIT: Accelerated for clustering the next-generation sequencing data. Bioinformatics 2012, 28, 3150–3152. [Google Scholar] [CrossRef] [PubMed]
  21. Langmead, B.; Salzberg, S.L. Fast gapped-read alignment with Bowtie 2. Nat. Methods 2012, 9, 357–359. [Google Scholar] [CrossRef] [PubMed]
  22. Li, B.; Dewey, C.N. RSEM: Accurate transcript quantification from RNA-seq data with or without a reference genome. BMC Bioinform. 2011, 12, 323. [Google Scholar] [CrossRef] [PubMed]
  23. Robinson, M.D.; McCarthy, D.J.; Smyth, G.K. edgeR: A Bioconductor package for differential expression analysis of digital gene expression data. Bioinformatics 2010, 26, 139–140. [Google Scholar] [CrossRef] [PubMed]
  24. Livak, K.J.; Schmittgen, T.D. Analysis of relative gene expression data using real-time quantitative PCR and the 2−ΔΔCT Method. Methods 2001, 25, 402–408. [Google Scholar] [CrossRef] [PubMed]
  25. Luo, W.; Nie, Z.; Zhan, F.; Wei, J.; Wang, W.; Gao, Z. Rapid development of microsatellite markers for the endangered fish Schizothorax biddulphi (Günther) using next generation sequencing and cross-species amplification. Int. J. Mol. Sci. 2012, 13, 14946–14955. [Google Scholar] [CrossRef] [PubMed]
  26. Reinecke, M. Insulin-like growth factors and fish reproduction. Biol. Reprod. 2010, 82, 656–661. [Google Scholar] [CrossRef] [PubMed]
  27. Duan, J.R.; Zhou, Y.F.; Xu, D.P.; Zhang, M.Y.; Liu, K.; Shi, Y.; Wei, Q.W.; Fang, D.A. Ovary transcriptome profiling of Coilia nasus during spawning migration stages by Illumina sequencing. Mar. Genom. 2015, 21, 17–19. [Google Scholar] [CrossRef] [PubMed]
  28. Nagahama, Y.; Yamashita, M. Regulation of oocyte maturation in fish. Dev. Growth Differ. 2008, 50, S195–S219. [Google Scholar] [CrossRef] [PubMed]
  29. Liu, H.; Wang, J.; Zhang, L.; Zhang, Y.; Wu, L.; Wang, L.; Dong, C.; Nie, G.; Li, X. Transcriptome analysis of common carp (Cyprinus carpio) provides insights into the ovarian maturation related genes and pathways in response to LHRH-A and dopamine inhibitors induction. Gen. Comp. Endocrinol. 2021, 301, 113668. [Google Scholar] [CrossRef] [PubMed]
  30. Degani, G.; Hurvitz, A.; Eliraz, Y.; Meerson, A. Sex-related gonadal gene expression differences in the Russian sturgeon (Acipenser gueldenstaedtii) grown in stable aquaculture conditions. Anim. Reprod. Sci. 2019, 200, 75–85. [Google Scholar] [CrossRef] [PubMed]
  31. Fan, J.; Ma, D.; Zhu, H.; Lin, M.; Zhong, Z.; Tian, Y. Full-Length Transcriptome Sequencing and Comparative Transcriptomics Reveal the Molecular Mechanisms Underlying Gonadal Development in Sleepy Cod (Oxyeleotris lineolata). Biology 2025, 14, 232. [Google Scholar] [CrossRef] [PubMed]
  32. Begum, S.; Gnanasree, S.M.; Anusha, N.; Senthilkumaran, B. Germ cell markers in fishes—A review. Aquac. Fish. 2022, 7, 540–552. [Google Scholar] [CrossRef]
  33. Cowan, M.; Azpeleta, C.; López-Olmeda, J.F. Rhythms in the endocrine system of fish: A review. J. Comp. Physiol. B 2017, 187, 1057–1089. [Google Scholar] [CrossRef] [PubMed]
  34. Lin, X.; Zhou, D.; Zhang, X.; Li, G.; Zhang, Y.; Huang, C.; Zhang, Z.; Tian, C. A First Insight into the Gonad Transcriptome of Hong Kong Catfish (Clarias fuscus). Animals 2021, 11, 1131. [Google Scholar] [CrossRef] [PubMed]
  35. Zheng, W.; Nagaraju, G.; Liu, Z.; Liu, K. Functional roles of the phosphatidylinositol 3-kinases (PI3Ks) signaling in the mammalian ovary. Mol. Cell. Endocrinol. 2012, 356, 24–30. [Google Scholar] [CrossRef] [PubMed]
  36. Otani, T.; Maruo, T.; Yukimura, N.; Mochizuki, M. Effect of insulin on porcine granulosa cells: Implications of a possible receptor mediated action. Eur. J. Endocrinol. 1985, 108, 104–110. [Google Scholar] [CrossRef] [PubMed]
  37. Fernández-Hernández, P.; Sánchez-Calabuig, M.J.; García-Marín, L.J.; Bragado, M.J.; Gutiérrez-Adán, A.; Millet, Ó.; Bruzzone, C.; González-Fernández, L.; Macías-García, B. Study of the Metabolomics of Equine Preovulatory Follicular Fluid: A Way to Improve Current In Vitro Maturation Media. Animals 2020, 10, 883. [Google Scholar] [CrossRef] [PubMed]
  38. Tang, H.; Wang, L.; Chen, Y.; He, J.; Qu, L.; Guo, Y.; Liu, Y.; Liu, X.; Lin, H. Ovulation is associated with the LH-dependent induction of pla2g4aa in zebrafish. Mol. Cell. Endocrinol. 2018, 473, 53–60. [Google Scholar] [CrossRef] [PubMed]
  39. Iyyappan, R.; Aleshkina, D.; Ming, H.; Dvoran, M.; Kakavand, K.; Jansova, D.; Del Llano, E.; Gahurova, L.; Bruce, A.W.; Masek, T.; et al. The translational oscillation in oocyte and early embryo development. Nucleic Acids Res. 2023, 51, 12076–12091. [Google Scholar] [CrossRef] [PubMed]
  40. Tenugu, S.; Senthilkumaran, B. Analysis of star promoter in common carp and catfish testis: Role of c-jun and its association with testicular function as a transcription factor. J. Steroid Biochem. Mol. Biol. 2025, 253, 106817. [Google Scholar] [CrossRef] [PubMed]
Figure 1. Ovarian histology of P. extremus at different developmental stages (I–VI). (A) Stage I of ovary; (B) Stage II of ovary; (C) Stage III of ovary; (D) Stage IV of ovary; (E) Stage V of ovary; (F) Stage VI of ovary. N: nucleus; ZR: Zone radiata; YG: Yolk Granule. Scale bars = 100 µm.
Fishes 11 00411 g001
Figure 2. Changes in reproductive hormone levels during different stages of ovarian development. (A) Concentration of estradiol (E2) in serum; (B) Concentration of progesterone (P4) in serum. Data are shown as means ± SD (n = 3 per stage). Different lowercase letters (a, b, c, d, e, f) above the bars indicate significant differences between stages (one-way ANOVA followed by Tukey’s HSD post hoc test; E2: F5,12 = 142.67, p < 0.001; P4: F5,12 = 187.34, p < 0.001).
Fishes 11 00411 g002
Figure 3. Transcriptomic comparison between Stage III and Stage V ovaries. (A) PCA plot showing the distribution of Stage III (A1–A3) and Stage V (B1–B3) samples. PC1 and PC2 explained 55.14% and 16.98% of the variance, respectively. (B) Sample clustering heatmap showing the expression similarity among samples. The color key indicates normalized expression values (0.4 to 1.6). Stage III and Stage V samples formed two distinct clusters, with all biological replicates grouped together within each stage.
Fishes 11 00411 g003
Figure 4. Volcano plot of differential gene expression between stage III and stage V ovaries of Platypharodon extremus. The x-axis represents log2(fold change) (stage V/stage III), and the y-axis shows −log10(FDR-adjusted Padj). Red dots: significantly upregulated genes in stage V (|log2FC| ≥ 1, Padj < 0.05); blue dots: significantly downregulated genes (|log2FC| ≤ −1, Padj < 0.05); black dots: non-differentially expressed genes with Padj ≥ 0.05 or |log2FC| < 1.
Fishes 11 00411 g004
Figure 5. Enrichment analysis of differentially expressed genes (DEGs). (A) GO functional classification of all DEGs between Stage III and Stage V ovaries of P. extremus; (B) KEGG pathway enrichment bubble plot of all DEGs.
Fishes 11 00411 g005
Figure 6. Validation of selected differentially expressed genes by qRT-PCR. Relative mRNA expression levels of 16 genes between stage III and stage V ovaries of P. extremus were normalized to the reference gene β-actin and calculated using the 2−ΔΔCT method. Bars represent geometric means ± SD (n = 3 per stage). ** indicates p < 0.01 (t-test); ns indicates no significant difference (p ≥ 0.05). Exact raw and adjusted p values are listed in Table S4. (A) cdc42; (B) map2k6; (C) pla2g4a; (D) sox4; (E) jun; (F) ddx49; (G) igf2; (H) atf4; (I) cyp11a1; (J) calm; (K) pik3ca; (L) mapk1; (M) p38; (N) eef2; (O) cul9; (P) pka.
Fishes 11 00411 g006
Table 1. Sample collection information form.
Experimental StageCollection SizeCollection TissueCollection Time
Body size and GSI measurementsn = 30 × 6Fishes2020.08, 2020.10, 2020.12, 2021.02, 2021.04, 2021.06
Histological analysisn = 3 × 6ovary2020.08, 2020.10, 2020.12, 2021.02, 2021.04, 2021.06
Hormone measurementsn = 3 × 6blood2020.08, 2020.10, 2020.12, 2021.02, 2021.04, 2021.06
PacBio Iso-seqn = 3 × 2ovary, brain, heart, liver, gills, muscle2021.04, 2021.06
Illumina RNA-seqn = 3 × 2ovary2021.04, 2021.06
qRT-PCR biological replicatesn = 3 × 2ovary2021.04, 2021.06
Table 2. The sequences information of primers used for qRT-PCR.
DEGsPrimer IDPrimer Sequences (5′–3′)Transcript Number
cdc42FAATCCCTGGAACAAATAGCACCPe_mix_transcript_10836
RCCATTCTTGTGCGGCTTTG
map2k6FATTCTGCGGTTTCCCTATGACPe_mix_transcript_13161
RAACTCGGGTGAGAATCGGTC
pla2g4aFACTGAGACGAGAGACTATGCGGPe_mix_transcript_14411
RGGATGTGAATCACGGTTGGAC
sox4FGGGTCCCAAATAGCAGGTGTPe_mix_transcript_8029
RTTGCTACAAAACGCAGATGG
junFAAGGGACAAAGTTCAGGGGCPe_mix_transcript_16639
RTGCCCTCTGATGCTGTCTCTG
ddx49FTCTTCCTATTCATTCCGTCACCPe_mix_transcript_28865
RGGTTTGAATACCACAGGACAGG
igf2FATTCTGTCATTGTTCGTGGTCGPe_mix_transcript_18042
RAGGAAACATCTCGCTCGGAC
atf4FTTGGCAAAATGGCGTCCTPe_mix_transcript_19649
RTCATCGGAGACACCACGGA
cyp11a1FAAGTTTGCTCTGGAATCGGTGPe_mix_transcript_21412
RATGAAGTGCTGGGCGTCTG
calmFCGACGAGCGATAACATCAAGGPe_mix_transcript_23743
RTGAGTACCTGGTGATAAACCCG
pik3caFGCAGACTACAGAGGAAAGGGAAPe_mix_transcript_24207
RCATTGGGCTTCTCTACTGGTGA
mapk1FATCAAAATCCTCCTGCGGTTPe_mix_transcript_3312
RAGGTCGGTCTCCATCAGGTC
p38FTTCTCCCAGTACCACGACCCPe_mix_transcript_4418
RCACGACTCCATCTCATCTCCG
eef2FGACCACGGGAAGTCTACGCTPe_mix_transcript_6025
RGCATCGCTCTTGCTCGTCT
cul9FTGGATGTGTGGTTCACGAGGPe_mix_transcript_8232
RCAAGCACACGGACTAAAGGAAC
pkaFACTGGGATTGTTGTTACCGCAPe_mix_transcript_8696
RCAGAGCACGGCTGACCTAAAA
β-actinFGTCTGGAGGTACCACCATGTACC
RCACATCTGCTGGAAGGTGGAC
Table 3. Body length, body height, body weight, gonadal weight and GSI of a Reproductive Cycle for P. extremus.
GroupCollection TimeBody Length (cm)Body Height (cm)Body Weight (g)Gonadal Weight (g)Gonado Somatic Index GSI (%)
12020.0834.15 ± 0.83 c6.78 ± 0.23 a302.85 ± 6.57 f17.16 ± 0.8 d3.02 ± 0.06 d
22020.1036.88 ± 6.70 b6.70 ± 1.24 a321.86 ± 1.73 e17.61 ± 0.88 d4.75 ± 0.26 c
32020.1237.68 ± 6.98 b6.98 ± 0.59 a403.46 ± 0.42 d26.45 ± 0.79 c5.20 ± 1.00 bc
42021.0237.74 ± 7.20 b7.20 ± 0.56 a 455.20 ± 2.94 c36.75 ± 2.13 b5.97 ± 0.39 b
52021.0440.51 ± 7.39 a7.39 ± 0.50 a488.08 ± 4.57 b39.47 ± 1.51 a9.32 ± 0.59 b
62021.0641.17 ± 7.88 a7.88 ± 0.17 a501.34 ± 2.51 a40.53 ± 1.36 a5.90 ± 0.38 a
Note: Means ± SD; different letters (a, b, c, d, e, f) indicate a statistically significant difference among groups at significance level p < 0.05.
Table 4. Histological parameters of ovarian developmental stages for P. extremus.
Developmental StageNo. of Females (N)No. of Oocytes Measured (n)Mean Oocyte Diameter (μm)Range (μm)Dominant Oocyte Type (%)
Stage I34533.4 ± 6.1 f23–44 71.3 ± 5.1%
Stage II345173.6 ± 7.8 e160–187 75.4 ± 6.2%
Stage III345589.0 ± 39.8 d520–658 78.1 ± 5.5%
Stage IV3452148.5 ± 140.6 b1905–239275.9 ± 6.1%
Stage V3453251.2 ± 32.6 a3195–330882.3 ± 5.2%
Stage VI3451388.0 ± 21.9 c1350–142610.0 ± 4.8%
Note: Means ± SD; different letters (a, b, c, d, e, f) indicate a statistically significant difference among groups at significance level p < 0.05. N = number of females; n = total number of oocytes measured (15 oocytes per female × 3 females), Dominant oocyte type (%) indicates the proportion of oocytes at the characteristic stage relative to the total oocytes counted per individual.
Table 5. Workflow flowchart and statistics of PacBio Iso-Seq.
Process OrderSequence ProductCore Processing StepSequence Count
InputRaw subreadOriginal single-molecule subreads, basic short/low-quality read discard49,087,081
Step 1CCS ReadsRaw subread circular consensus correction to improve single-molecule accuracy567,407
Step 2FLNC ReadsIdentify full-length non-chimeric molecules via primer & polyA signal screening380,158
Step 3Polished TranscriptsCluster FLNC reads by isoform similarity to produce rough consensus transcripts31,372
Step 4LoRDEC-corrected transcriptsSecondary base error correction of polished transcripts supported by Illumina short-read data (LoRDEC)31,372
OutputNonredundant isoformsDeduplicate corrected transcripts using cd-hit (99% identity threshold) to get the reference transcriptome30,060
Note: Raw single-molecule subreads were processed sequentially via CCS generation, FLNC screening, ICE clustering, LoRDEC secondary error correction, and cd-hit deduplication. The number of sequences retained at each processing stage is shown in the right column. Secondary error correction using Illumina short reads did not alter the total number of polished transcripts. Deduplication was performed with cd-hit at a 99% sequence identity threshold to obtain the final nonredundant isoform set as the reference transcriptome.
Table 6. Number of annotated transcripts of each database.
Annotated DatabasesNumber of Transcripts
All30,060 (100.00%)
NR27,595 (91.80%)
GO11,276 (37.51%)
KEGG17,466 (58.10%)
KOG19,751 (65.71%)
Swiss-prot25,440 (84.63%)
Unannotated2445 (8.13%)
Note: Percentages were calculated based on the total 30,060 transcripts. Individual transcripts can be assigned to multiple annotation databases, so the counts of each database are not mutually exclusive.
Table 7. Evaluation statistics of sequencing data for ovary at Stages III and V.
SampleGroupClean ReadsClean Bases (G)Effective Rate (%)Q30 (%)GC Content (%)
A1Stage III59,354,9868.9096.2790.047.9
A2Stage III64,335,0209.6596.7990.248.3
A3Stage III57,148,9268.5796.7189.849.3
B1Stage V41,858,2746.2896.9591.745.1
B2Stage V42,771,9726.4296.6791.544.2
B3Stage V42,108,2326.3297.0791.647.0
Disclaimer/Publisher’s Note: The statements, opinions and data contained in all publications are solely those of the individual author(s) and contributor(s) and not of MDPI and/or the editor(s). MDPI and/or the editor(s) disclaim responsibility for any injury to people or property resulting from any ideas, methods, instructions or products referred to in the content.