


Abstract
Road safety is a global priority, and driver behavioral factors are among its most critical determinants. Although the literature has advanced in characterizing driving styles using psychometric instruments such as the Multidimensional Driving Style Inventory (MDSI), an empirical gap persists in the simultaneous integration of latent behavioral profiles, driving exposure, and road safety outcomes, particularly in Latin American contexts and across generational extremes. This study examined the relationship between latent driving style profiles and road safety outcomes among young (18–25 years) and older (≥65 years) licensed drivers in Ecuador, while evaluating the moderating role of driving exposure. A structured survey based on the MDSI was administered to 833 active drivers, and data were analyzed using Latent Profile Analysis (LPA) and binary logistic regression. The six-profile solution was selected according to the Bayesian Information Criterion (BIC = 11,655.07), with acceptable classification quality (entropy = 0.860; minimum posterior probability = 0.808); for inferential parsimony, these profiles were subsequently consolidated into three analytically interpretable categories: Predominantly Careful, Predominantly Risky, and Distress-Reduction. The Predominantly Risky profile was significantly associated with higher odds of traffic accident involvement (OR = 2.76, 95% CI [1.55, 4.93]), whereas the Distress-Reduction profile showed substantially higher odds of receiving traffic infraction fines (OR = 4.74, 95% CI [1.69, 13.34]). The composite driving exposure index was a robust predictor across both models (accident model: OR = 2.82, 95% CI [1.60, 5.14]; fine model: OR = 1.87, 95% CI [1.29, 2.74]). In addition, a significant interaction was observed between the Predominantly Risky profile and driving exposure in the model predicting traffic infraction fines, suggesting that exposure amplified sanction risk within this behavioral category. Older drivers showed a substantially higher representation of the Distress-Reduction profile than young drivers. These findings underscore the utility of person-centered approaches for identifying heterogeneous driver configurations and for designing profile-differentiated road safety interventions; from a practical perspective, these results support the development of targeted road safety programs that integrate behavioral profile screening with exposure-based risk management for young and older drivers.
1. Introduction
Road safety represents a persistent challenge for contemporary transport systems and constitutes a priority for public policies aimed at sustainable mobility. Globally, traffic crashes rank among the leading causes of mortality and injury, particularly in populations with high driving exposure, generating a substantial burden on healthcare systems and the socioeconomic development of countries [1]. Numerous studies have demonstrated that human factors play a decisive role in crash occurrence, surpassing even the influence of infrastructure- or vehicle-related variables [2,3]. Scientific evidence indicates that behaviors such as aggressive driving, driver distraction, speeding, and non-compliance with traffic regulations are among the primary determinants of road traffic crashes [3,4]. Likewise, recent research continues to confirm that driver behavioral factors constitute one of the most influential elements in the probability of road collisions [5]. Consequently, understanding the behavioral patterns that characterize the way individuals drive has become a key element for explaining crash risk and developing evidence-based prevention strategies.
Within this framework, driving styles have been widely used as a conceptual approach to describe relatively stable patterns of behavior during driving. Driving styles reflect the way in which individuals perceive the road environment, make decisions, and respond to traffic situations. One of the most widely used instruments for assessing these behavioral patterns is the Multidimensional Driving Style Inventory (MDSI), a psychometric tool developed to measure different dimensions of driving behavior [6]. This instrument identifies styles such as aggressive, anxious, careful, dissociative, risky, and distress-reduction, which have been shown to be associated with varying levels of road risk [7]. Accordingly, the analysis of driving styles provides a solid empirical basis for understanding individual differences in driver behavior.
Various studies have demonstrated that certain driving behavior patterns are associated with a higher probability of involvement in traffic infractions and crashes. Empirical research has shown that risk behaviors—such as driver distraction, attentional errors, and deliberate violations of traffic norms—significantly increase the likelihood of road collisions [8,9,10]. For example, studies based on naturalistic driving paradigms have found that drivers who report higher levels of risky behavior also exhibit a greater frequency of crashes and near crashes during everyday driving [9]. Similarly, behavioral analyses have shown that psychological traits such as hostility, sensation seeking, and certain negative attitudes towards road safety are associated with a higher incidence of infractions, errors, and crashes across different age groups of drivers [11]. Nevertheless, a substantial proportion of these studies analyze driving behaviors in isolation, which limits the understanding of how multiple behavioral patterns interact and combine into more complex driving profiles.
In response to this limitation, person-centered methodologies capable of identifying behavioral typologies within driver populations have gained traction in the road safety literature [12,13]. In this regard, person-centered approaches such as Latent Profile Analysis (LPA) and other behavioral segmentation methods allow drivers to be grouped according to similar behavioral patterns, providing a more integrated understanding of the driving typologies present in a given population [14,15]. These approaches have proven useful for explaining heterogeneity in driving behaviors and their relationship with road safety indicators such as infractions and crashes [16]. However, the impact of these profiles cannot be adequately analyzed without considering the level of drivers’ exposure to the traffic system. Consequently, variables such as driving frequency, distance travelled, and driving schedules have begun to be incorporated as relevant factors in explaining road risk and in the analysis of behaviors associated with transport safety [17].
Driving exposure constitutes a critical element in road safety research, as it determines the degree of driver interaction with the traffic environment. Drivers who cover greater distances, have more experience, or drive more frequently face different levels of probability of encountering risky situations, which may influence driving behavior patterns and the likelihood of adverse events [18,19]. Research has demonstrated that factors such as driving experience, risk perception, and individual driver characteristics influence the adoption of risky driving behaviors and, consequently, the probability of crash involvement [18]. Likewise, recent studies have shown that traffic exposure, combined with behavioral and contextual variables, can modify the relationship between driving behaviors and road safety outcomes [20,21]. In this sense, driving exposure may act as a moderating factor in the relationship between driving styles and crash risk, as it determines the level of driver interaction with potentially hazardous situations in the road system [22]. Despite its theoretical and practical relevance, the empirical evidence simultaneously integrating driving style profiles, road exposure, and crash risk remains limited, particularly in Latin American contexts. This knowledge gap is even more pronounced when generational differences in driver behavior and their relationship with road safety are examined.
Generational differences in driving styles have received growing attention in recent literature, particularly with regard to young and older drivers. Several studies have shown that age is a relevant factor in explaining variations in road safety attitudes, driving behaviors, and the likelihood of crash involvement [11,23]. Young drivers tend to exhibit higher levels of risk behavior due to factors such as sensation seeking, limited driving experience, and a greater propensity for dangerous driving conduct [24]. On the other hand, older drivers may face challenges associated with cognitive, perceptual, and motor changes that can affect their driving performance and interaction with the road environment [24]. Recent research has also indicated that road safety attitudes and personality traits may differentially influence driving behaviors across age groups, highlighting the need to examine these differences through generational comparative approaches [11]. The deliberate focus on these two extremes—rather than a continuous age spectrum—is supported by evidence that young and older drivers represent qualitatively distinct risk archetypes, with young drivers characterized primarily by behavioral inexperience and sensation-seeking, and older drivers by age-related functional decline [23,24,25]. This bimodal design follows methodological precedents in the driver behavior literature that contrast age-extreme groups to maximize the detection of profile differences while maintaining analytical parsimony [26,27]. However, there is a scarcity of studies that simultaneously analyze these two generational extremes using advanced analytical approaches—such as latent profiles—while accounting for the moderating role of driving exposure. In this context, the present study aims to analyze the relationship between latent driving style profiles and road crash risk among young drivers (18–25 years) and older drivers (≥65 years) in Ecuador, evaluating the moderating effect of driving exposure. To this end, a dataset comprising 833 drivers from various Ecuadorian cities was used; participants completed the MDSI instrument along with sociodemographic and driving behavior questions, and data were analyzed using statistical techniques oriented towards the identification of behavioral profiles and their association with road safety indicators.
The present study contributes to the literature in three specific ways: first, it applies LPA to the MDSI in an Ecuadorian context, extending person-centered approaches to a Latin American setting where such evidence remains scarce [26,28]; second, it simultaneously contrasts two age-extreme driver groups that are rarely examined together using latent segmentation methods [18,25,26,27,28]; and third, it operationalizes driving exposure as a multidimensional composite index rather than a single proxy indicator, thereby providing a broader representation of driver interaction with the traffic system [17,18,19]. The findings may contribute to the design of prevention strategies targeted at specific driver profiles and to the formulation of evidence-based public policies to improve road safety in contexts where both young and older drivers may present differentiated patterns of risk [25].
Based on previous literature, two working hypotheses guided the empirical analysis. First, latent driving style profiles were expected to differ in their association with road safety outcomes, particularly traffic accidents and infraction fines. Second, driving exposure was expected to moderate the relationship between driving profile membership and road safety outcomes, such that higher exposure would amplify the probability of adverse events among risk-related driver profiles.
2. Materials and Methods
2.1. Study Design and Setting
This study examined the relationship between latent driving style profiles and road safety outcomes, with particular attention to the role of driving exposure among two generational extremes of licensed drivers. The study followed a quantitative, correlational, and cross-sectional design [29], based on self-reported data collected through a structured survey administered to active drivers [30]. The study was conducted in Ecuador, within the framework of an ongoing research project focused on the adaptation and psychometric validation of the Multidimensional Driving Style Inventory (MDSI) for the Ecuadorian context [6,7]. The present analysis specifically focuses on two age-extreme subgroups from that broader validation process: young drivers aged 18–25 years and older drivers aged 65 years or above. Although the overall Ecuadorian adaptation project includes a wider driver population, the psychometric reliability of the MDSI subscales was re-evaluated in the present analytical sample to ensure the suitability of the instrument for these two generational groups. Data collection was carried out during a single information-gathering phase corresponding to the most recent execution period of the research project.
2.2. Participants
The analytical sample comprised 833 licensed drivers who fully completed the administered questionnaire. Participation was voluntary and conducted via a digital structured questionnaire [31]. The study focused on two age-extreme groups to contrast behavioral patterns associated with age and driving experience: 612 young drivers aged 18–25 years and 221 older drivers aged 65 years or above. These two age-extreme groups were deliberately selected—rather than a continuous age stratification—to contrast behaviorally distinct risk archetypes: young drivers characterized by limited experience, elevated sensation seeking, and recent license acquisition, and older drivers defined by extended driving trajectories and age-related cognitive and perceptual changes [23,24]. This bimodal design maximizes the detection of profile differences and follows methodological precedents in the latent driver behavior literature [25,28]. Drivers belonging to intermediate age groups (26–64 years) were excluded from the analytical sample given that the present study’s primary objective was the comparison of these two contrasting generational extremes; future research should examine the full age spectrum.
Inclusion criteria required participants to hold a valid driver’s license, to be actively driving, to have driven at least once in the month preceding the survey, and to have fully completed all questionnaire items. Exclusion criteria comprised incomplete questionnaires, missing data in key driving-related variables, and participants not belonging to the two predefined age groups. Prior to analysis, the database was screened according to predefined exclusion criteria. A total of 31 records were removed because participants had not driven during the last month, were outside the target age ranges (18–25 years or 65 years and older), completed the survey in less than 3 min, or exhibited evident careless response patterns (e.g., selecting the same response option across all items). The 3-min threshold was used as a conservative data-quality screening criterion because completing a 54-variable questionnaire within this time frame was considered implausibly fast for attentive participation. Because individual completion-time distribution metrics were not retained in the final anonymized dataset, this threshold was treated as a pragmatic exclusion rule rather than a statistically derived cutoff. The final dataset included 833 observations and 54 variables, encompassing sociodemographic characteristics, driving exposure indicators, road safety outcomes, and individual MDSI items.
Participants were recruited using a non-probabilistic convenience sampling strategy [32], disseminated through academic institutional networks, driving schools, and community organizations across ten Ecuadorian cities. The digital questionnaire was distributed via institutional email lists and social media platforms during October–November 2026. Although no a priori power analysis was conducted for the LPA stage, given the iterative, exploratory nature of latent profile enumeration, the total sample of n = 833 satisfies the minimum recommended per-profile cell size of n ≥ 25 for most identified profiles [33]. However, the Distress-Reduction profile (n = 36) approaches this threshold, which may have limited the precision of interaction estimates in the regression models (see Section 4.7). The convenience sampling approach limits the national representativeness of the findings, as discussed in the Limitations section. Given the digital and network-based recruitment strategy, the sample may have overrepresented participants with greater access to online communication channels and stronger links to academic or institutional environments. This issue is particularly relevant for the young driver group, whose large representation in the sample may partly reflect university-affiliated and digitally active respondents rather than the full diversity of young licensed drivers in Ecuador.
2.3. Data Collection Instrument
Data were collected through a structured questionnaire designed to capture different dimensions of driving behavior and exposure-related variables [34]. The instrument was organized into four sections, as detailed in Table 1.
Table 1.
Sections of the data collection instrument.
Section 1 collected sociodemographic information, including sex, educational level, city of residence, and driver’s license type. Section 2 assessed driving exposure through years of driving experience, weekly driving frequency, estimated weekly kilometers driven, and habitual driving schedule (diurnal, nocturnal, or mixed) [17,18,19]. Section 3 comprised the full Spanish-language adaptation of the Multidimensional Driving Style Inventory (MDSI), originally developed by Taubman-Ben-Ari et al. [6] and subsequently validated across multiple cultural and linguistic contexts [7,35]. This psychometric instrument evaluates the frequency with which drivers report engaging in specific driving behaviors, organized into six subscales: risky, dissociative, aggressive, careful, anxious, and distress-reduction driving. Each subscale score was computed as the mean of the corresponding items and used as a continuous variable in subsequent analyses [6]. Section 4 recorded road safety outcomes, specifically self-reported involvement in traffic accidents and receipt of traffic infraction fines during the preceding year [8,16].
2.4. Data Cleaning and Preparation
All data management and preparation procedures were performed in R (version 4.5.1) [36]. Raw data were imported from the original Excel file containing survey responses and subjected to a systematic cleaning pipeline comprising multiple sequential stages.
First, variable names were standardized to ensure consistency across all analytical procedures. Second, categorical variables underwent text normalization, including removal of extraneous whitespace, label harmonization, and correction of typographical inconsistencies. Third, explicit variable type conversion was applied, transforming categorical responses into factors and ordinal responses into numeric values as required for statistical modeling. Fourth, specific recoding procedures were implemented for variables related to driving frequency, weekly kilometers driven, and driving schedule.
Derived variables were subsequently constructed, including: (a) the age-group variable (18–25 years and 65 years or older); (b) numeric driving exposure indicators; and (c) the six MDSI subscale scores, computed following the methodology established by Taubman-Ben-Ari et al. [6]. A missing data diagnostic was also conducted, calculating the percentage of missing values per variable to verify that data loss would not compromise the validity of subsequent analyses [37].
Finally, a composite driving exposure index was constructed by standardizing (z-score transformation) four exposure-related variables: years of driving experience, weekly driving frequency, weekly kilometers driven, and habitual driving schedule. The standardized values were then averaged to yield a single composite exposure indicator for use in regression models [17,18,19]. As part of the index construction process, Spearman correlations among its four indicators were examined. Correlations ranged from very weak to moderate: years of driving experience showed weak associations with weekly driving frequency (ρ = 0.183) and weekly kilometers driven (ρ = 0.229), but a negligible association with habitual driving schedule (ρ = −0.024). Weekly driving frequency showed moderate associations with weekly kilometers driven (ρ = 0.449) and habitual driving schedule (ρ = 0.359), while weekly kilometers driven was moderately associated with habitual driving schedule (ρ = 0.355). Internal consistency analysis of the four exposure indicators yielded a very low Cronbach’s alpha (α = 0.073), indicating that the variables should not be interpreted as a reflective psychometric scale. Accordingly, the exposure measure was treated as a formative composite index, in which each component captures a distinct aspect of traffic-system exposure rather than interchangeable manifestations of a single latent construct. Equal weighting was therefore used as a transparent and parsimonious exploratory strategy, avoiding the assignment of arbitrary differential weights in the absence of prior Ecuadorian evidence or validated weighting schemes for these exposure indicators.
2.5. Statistical Analysis
All statistical analyses were conducted using R version 4.5.1 within the RStudio integrated development environment (version 2024.12.1+563) [38]. Data manipulation, statistical modeling, and visualization were carried out using the following specialized packages: tidyverse (v2.0.0) [39] for data manipulation and transformation; readxl [40] for importing Excel files; janitor [41] for data cleaning procedures; psych [42] for reliability analysis; naniar [37] for missing data diagnostics; tidyLPA [43] and mclust [44] for latent profile analysis; broom [45] for statistical model summarization; ggeffects [46] for estimating marginal predictions; svglite [47] for exporting figures in scalable vector format; and pROC for receiver operating characteristic curve analysis.
The statistical analysis proceeded through five sequential stages. In the first stage, descriptive statistics were computed to characterize the sample. Frequencies and percentages were reported for categorical variables, whereas means and measures of dispersion were calculated for continuous variables. In the second stage, bivariate analyses were conducted to assess differences between the two age groups. Categorical variables were evaluated using chi-square tests, while numerical and ordinal variables were compared using the Wilcoxon rank-sum test [48] as Shapiro–Wilk tests indicated significant departures from normality for all continuous variables (p < 0.05). Effect sizes were additionally computed using Cramér’s V for categorical comparisons and rank-biserial correlations for Wilcoxon tests. In the third stage, the internal consistency of the MDSI subscales was assessed using Cronbach’s alpha coefficient, with a threshold of α ≥ 0.70 considered acceptable [49,50]. In the fourth stage, a Latent Profile Analysis (LPA) was performed using the six MDSI subscale scores as continuous indicators [43,44]. Models ranging from one to six latent profiles were estimated using Gaussian mixture models implemented via the tidyLPA package [43] with the mclust computational engine [44]. In the present study, Model 1 was specified (‘models = 1’), which corresponds to an EEI covariance structure in mclust, that is, equal variances across classes and covariances fixed to zero [43,44]. This specification assumes conditional independence among the MDSI indicators within each latent profile. As a supplementary sensitivity assessment, alternative covariance structures available in the mclust framework were compared, including EEI, VVI, and VVV specifications. Although the VVV specification yielded a lower BIC, the EEI model was retained for the primary analysis because it offered a more parsimonious solution with stable classification, clearer substantive interpretability, and reduced risk of overfitting in the presence of small profile sizes. Model selection was guided primarily by the Bayesian Information Criterion (BIC), with lower values indicating better model fit [33]. Entropy, minimum posterior classification probability, profile interpretability, and class size were additionally considered to support substantive interpretation [51]. In the fifth stage, binary logistic regression models were estimated to evaluate the association between driving profile categories and road safety outcomes [52]. The dependent variables were: (a) self-reported involvement in a traffic accident during the past year, and (b) receipt of a traffic infraction fine during the past year.
To evaluate the robustness of the profile consolidation strategy, a sensitivity analysis was additionally conducted in which the “Low activation/Disengaged” profile (Profile 2) was treated as an independent analytical category rather than being merged into the Predominantly Careful reference group. The resulting regression estimates were subsequently compared with the primary models to assess the stability of the observed associations.
Because the six-profile LPA solution contained several behaviorally adjacent configurations and some profiles had small membership sizes, the profiles were consolidated into three broader analytical categories for the regression stage. This consolidation was not intended to replace the six-profile latent structure, but to improve inferential stability, reduce sparse-cell problems, and preserve theoretically meaningful contrasts among low-risk, risk-oriented, and distress-related behavioral configurations. Profiles 1, 2, and 4 were grouped as Predominantly Careful because they did not show prominent elevations in risk-related dimensions; however, Profile 2 was recognized as theoretically distinct because of its globally low activation pattern and low careful score. Profiles 3 and 5 were grouped as Predominantly Risky because both showed elevated risky or risk-adjacent behavioral tendencies. Profile 6 was retained as Distress-Reduction because it showed the highest combined scores in dissociative, aggressive, anxious, and distress-reduction dimensions. This procedure was applied exclusively to the inferential regression models to improve interpretability and statistical stability. Both regression models included interaction terms between driving profile category and the composite driving exposure index, thereby enabling examination of the hypothesized moderating effect of exposure [18,22]. Model calibration was additionally evaluated using the Hosmer–Lemeshow goodness-of-fit test, while Nagelkerke pseudo-R2 statistics and receiver operating characteristic (ROC) curve analyses were computed to assess the explanatory and discriminative performance of the regression models. Multicollinearity was assessed using generalized variance inflation factors (GVIF), with adjusted GVIF values interpreted for multi-level categorical predictors. Non-significant Hosmer–Lemeshow p-values were interpreted as evidence of acceptable fit. Results were expressed as odds ratios (ORs) with 95% confidence intervals (CIs).
Generative artificial intelligence tools, including OpenAI ChatGPT (GPT-5.5, OpenAI, San Francisco, CA, USA), were used only as support for statistical code refinement, debugging, and editorial language improvement. All analytical decisions, data interpretation, statistical outputs, and final manuscript content were reviewed, verified, and approved by the authors.
2.6. Ethical Considerations
The study was conducted in accordance with the Declaration of Helsinki [53] and the Ecuadorian Organic Law on Personal Data Protection [54], ensuring participant anonymity and the use of aggregated data only. The study protocol was reviewed by the Ethics Committee for Research Involving Human Subjects of the Universidad Técnica Particular de Loja (CEISH-UTPL), which classified the study as “Research Without Risk” and determined that it was exempt from full ethical evaluation due to its anonymous, non-interventional, and non-sensitive nature. This determination was based on the fact that the study collected information anonymously through questionnaires and did not record personal identifiers, sensitive data, vulnerable populations, or sensitive behavioral information. Consequently, informed consent was obtained from all participants prior to data collection, emphasizing the voluntary and confidential nature of their participation [53]. All survey responses were anonymized prior to processing, with no direct identifiers retained in the analytical dataset. Data were handled exclusively in aggregate form and for academic and scientific purposes only. The statistical scripts and data processing procedures were developed in R and organized to ensure full traceability and reproducibility of the analytical workflow [36].
3. Results
3.1. Sample Characterization
The analytical sample comprised 833 licensed drivers distributed across two age-extreme groups: 612 young drivers aged 18–25 years (73.5%) and 221 older drivers aged 65 years or above (26.5%). The overall sample was predominantly male (n = 595, 71.4%), with most participants holding a Type B license (n = 584, 70.1%). In terms of educational attainment, 50.5% had completed undergraduate education and 38.3% had secondary-level schooling. Participants were distributed across ten Ecuadorian cities, with the largest representation from Santa Elena (17.4%), Guayaquil (15.7%), and Zamora (11.8%).
With respect to driving habits, 39.5% of participants drove every day of the week and an additional 22.2% drove five days per week. The mean number of kilometers driven per week was 90.77 (SD = 70.30), and 69.6% reported a mixed driving schedule combining diurnal and nocturnal driving. During the preceding year, 9.8% of participants reported involvement in at least one traffic accident (n = 82) and 21.8% reported having received an infraction fine (n = 182). Detailed sample characteristics by age group, together with bivariate comparisons, are presented in Table 2. Figure 1 provides a visual overview of the sample distribution across age groups. Effect size estimates indicated substantial differences between age groups for driving experience (rank-biserial r = −0.879) and moderate associations for educational level (Cramér’s V = 0.343), driving schedule (Cramér’s V = 0.264), and driving frequency (rank-biserial r = 0.170), whereas most remaining associations were small in magnitude.
Table 2.
Sociodemographic and driving characteristics of the sample by age group.
Figure 1.
Distribution of the sample by age group (young drivers: 18–25 years, n = 612; older drivers: ≥65 years, n = 221). Bars represent absolute counts and relative proportions within each group.
3.2. Internal Consistency of MDSI Subscales and Descriptive Statistics
Internal consistency was evaluated for each of the six MDSI subscales using Cronbach’s alpha coefficient. All subscales demonstrated acceptable to excellent reliability. The dissociative (α = 0.929), aggressive (α = 0.909), risky (α = 0.908), and careful (α = 0.904) subscales showed the highest values, followed by the anxious (α = 0.793) and distress-reduction (α = 0.750) subscales. All coefficients exceeded the recommended threshold of α ≥ 0.70, supporting the reliability of the instrument for the present sample.
At the descriptive level, the careful subscale obtained the highest mean score across the full sample, indicating that careful driving behaviors were the most frequently reported. Conversely, dissociative and anxious dimensions exhibited lower mean scores relative to the remaining styles. Table 3 presents the reliability indices and descriptive statistics for each MDSI subscale.
Table 3.
Internal consistency and descriptive statistics of the MDSI subscales (n = 833).
3.3. Latent Profile Analysis
A Latent Profile Analysis (LPA) was conducted using the six MDSI subscale scores as continuous indicators. Gaussian mixture models were estimated for solutions ranging from one to six latent profiles. Model selection was guided primarily by the Bayesian Information Criterion (BIC), supplemented by considerations of entropy, minimum class probability, and theoretical interpretability. Table 4 presents the fit indices for all estimated solutions.
Table 4.
Fit indices for latent profile solutions with 1 to 6 profiles.
Within the EEI covariance structure selected for the primary analysis, the BIC indicated that the six-profile solution provided the best statistical fit to the data. Although profile interpretation remained an essential criterion for substantive evaluation, the six-class structure was retained as the preferred latent solution within the EEI specification. The resulting profile configurations revealed substantial heterogeneity in driving style patterns, ranging from highly careful and low-risk profiles to more complex configurations characterized by elevated risky, aggressive, anxious, dissociative, and distress-reduction tendencies. Because several of these classes showed partially overlapping behavioral patterns, the six latent profiles were subsequently consolidated into three broader analytical categories for inferential purposes: Predominantly Careful, Predominantly Risky, and Distress-Reduction.
This consolidation was performed solely for inferential parsimony in the regression stage and should not be interpreted as replacing the six-class latent structure identified by the LPA.
As a supplementary sensitivity assessment, alternative covariance structures available in the mclust framework were additionally compared, including EEI, VVI, and VVV specifications. The lowest overall BIC was observed for a four-profile VVV solution (BIC = −10,554.94). However, because the VVV structure allows class-specific variances and covariances, it constitutes a substantially more parameter-intensive and less parsimonious solution. Given the exploratory nature of the present study, the relatively small size of some latent classes, and the need to preserve stable downstream regression estimates, the six-profile EEI solution was retained as the primary analytical model on the basis of inferential parsimony, classification stability, and substantive interpretability.
Table 5 presents the mean MDSI subscale scores by latent profile. The profile structure showed that one class was clearly dominated by careful driving, whereas another exhibited globally elevated scores across dissociative, aggressive, anxious, and distress-reduction dimensions, constituting the most behaviorally burdened configuration. Additional classes reflected moderate or mixed combinations of risky, careful, and emotion-related tendencies rather than purely unidimensional styles.
Table 5.
Mean MDSI subscale scores by latent profile (six-profile LPA solution).
For inferential purposes, the six-profile solution was subsequently consolidated into three broader analytical categories, as described in the Methods section. This approach is consistent with person-centered segmentation strategies that prioritize analytically interpretable behavioral configurations for downstream modeling [14]. The heatmap displayed in Figure 2 provides a visual representation of the subscale mean profiles.
Figure 2.
Heatmap of MDSI subscales by profile.
3.4. Distribution of Latent Profiles by Age Group
The distribution of the three analytically consolidated profile categories differed significantly between the two age groups (χ2(2) = 49.15, p < 0.001). Among young drivers (18–25 years), 75.16% were classified within the Predominantly Careful category, whereas 23.37% fell within the Predominantly Risky category and only 1.47% within the Distress-Reduction category. In contrast, the Predominantly Careful category accounted for 60.63% of older drivers (≥65 years), with higher proportions classified as Predominantly Risky (27.15%) and, especially, Distress-Reduction (12.22%). Table 6 presents the profile distribution by age group.
Table 6.
Distribution of driving profiles by age group (n = 833).
3.5. Association Between Driving Profiles, Driving Exposure, and Road Safety Outcomes
Two binary logistic regression models were estimated to evaluate the association between the identified driving profiles and road safety outcomes, with the Predominantly Careful profile as the reference category and including interaction terms between driving profile and the composite driving exposure index.
Hosmer–Lemeshow goodness-of-fit tests indicated acceptable calibration for both regression models. The accident model showed good fit (χ2 = 6.56, df = 8, p = 0.585), while the traffic infraction model showed borderline but acceptable calibration (χ2 = 14.54, df = 8, p = 0.069). Nagelkerke pseudo-R2 statistics indicated moderate explanatory capacity for both models, accounting for approximately 20.4% of the variance in traffic accident involvement and 15.2% of the variance in traffic infraction fines. Receiver operating characteristic (ROC) analysis showed acceptable discriminatory performance for both models, with AUC values of 0.754 for the accident model and 0.711 for the traffic infraction model. Multicollinearity diagnostics showed no evidence of problematic collinearity, with maximum adjusted GVIF values of 1.70 for the accident model and 1.25 for the traffic infraction model.
3.5.1. Traffic Accident Involvement
The model predicting self-reported involvement in a traffic accident during the preceding year identified two significant predictors. Compared with the Predominantly Careful profile, the Predominantly Risky profile was associated with significantly higher odds of accident involvement (OR = 2.76, 95% CI [1.55, 4.93], p < 0.001). The composite driving exposure index was likewise a significant positive predictor (OR = 2.82, 95% CI [1.60, 5.14], p < 0.001), indicating that higher exposure was associated with a substantially increased probability of reporting an accident. The Distress-Reduction profile did not differ significantly from the Careful reference category in its main effect (OR = 1.69, p = 0.596), and neither interaction term reached statistical significance. Given the small size of the Distress-Reduction category (n = 36) and the resulting width of its confidence interval, this coefficient should be treated as imprecise and reported for completeness only. Notably, the interaction between the Distress-Reduction profile and driving exposure approached but did not reach the conventional significance threshold (OR = 1.35, p = 0.055), suggesting a possible amplification of accident risk with increasing exposure within this behavioral category that warrants investigation in larger samples. Age group, sex, and educational level were not consistently associated with accident involvement after adjustment. Table 7 presents the full model results. Predicted probability curves are displayed in Figure 3.
Table 7.
Binary logistic regression model for traffic accident involvement (past year).
Figure 3.
Predicted probability of accidents based on exposure and profile.
3.5.2. Traffic Infraction Fines
The model predicting receipt of a traffic infraction fine during the preceding year identified two significant main effects and one significant interaction. Compared with the Predominantly Careful category, the Distress-Reduction profile was associated with significantly higher odds of receiving a fine (OR = 4.74, 95% CI [1.69, 13.34], p = 0.002). Although this association was statistically significant, it should still be interpreted cautiously because the Distress-Reduction category contained a small number of participants (n = 36), which may limit the precision of the estimate. The composite driving exposure index was likewise a significant positive predictor (OR = 1.87, 95% CI [1.29, 2.74], p = 0.001). In addition, the interaction between the Predominantly Risky profile and driving exposure was statistically significant (OR = 2.46, 95% CI [1.17, 5.38], p = 0.020), indicating that greater exposure amplified the probability of infraction fine receipt within this behavioral category. The main effect of the Predominantly Risky profile approached significance but did not reach the conventional threshold (OR = 1.53, p = 0.052). Table 8 presents the complete model results. Predicted probability curves for fine receipt are displayed in Figure 4.
Table 8.
Binary logistic regression model for traffic infraction fine receipt (past year).
Figure 4.
Predicted probability of fine receipt based on exposure and profile.
Sensitivity analyses treating the “Low activation/Disengaged” profile as an independent fourth category yielded substantively similar results to the primary models. In the accident model, the Predominantly Risky profile remained significantly associated with traffic accident involvement (OR = 3.38, 95% CI [1.84, 6.51], p < 0.001), whereas the Low activation/Disengaged profile was not significantly associated with accident involvement. In the infraction fine model, the Distress-Reduction profile remained significantly associated with receipt of traffic infraction fines (OR = 4.68, 95% CI [1.66, 12.33], p = 0.002), while the Low activation/Disengaged profile was not significantly associated with fine receipt. These results indicate that the main findings were robust to treat Profile 2 as a separate analytical category.
4. Discussion
The present study aimed to analyze the relationship between latent driving style profiles and crash risk across two generational extremes of Ecuadorian drivers, young adults aged 18 to 25 years and older adults aged 65 years or above, while evaluating the moderating role of driving exposure. By combining MDSI subscale scores, latent profile segmentation, and adjusted logistic regression models, the study shows that road safety outcomes in this sample were better explained by behavioral configurations and driving exposure than by age group alone. The results are discussed below in relation to the main thematic axes of the study.
4.1. MDSI Reliability and Dominance of the Careful Profile in the Sample
The internal consistency coefficients obtained for the six MDSI subscales were satisfactory, with Cronbach’s alpha values ranging from 0.750 to 0.929, confirming the psychometric adequacy of the instrument in the Ecuadorian context. The dissociative, aggressive, risky, and careful subscales showed particularly high reliability, whereas the anxious and distress-reduction dimensions remained within acceptable ranges. These findings are broadly consistent with those reported in international MDSI adaptation studies, where reliability coefficients have typically ranged between 0.70 and 0.93 [6,7]. Overall, the reliability coefficients indicate that the adapted Ecuadorian version of the MDSI retained adequate psychometric performance across the six evaluated dimensions.
At the descriptive level, the careful driving subscale obtained the highest mean score in the overall sample (M = 4.54), indicating that most drivers self-reported precautionary driving behaviors as the most frequent. This pattern has been documented recurrently in international literature and may reflect both a genuine tendency towards prudent driving and a social desirability effect in responses to self-report instruments [6]. Furthermore, the high concentration of participants in the Predominantly Careful profile (71.3%) suggests an asymmetric distribution of driving styles in the sample, which is to be expected in active driver populations not specifically selected based on crash history or infraction records [14].
4.2. Latent Driving Profiles: Configuration and Theoretical Coherence
The six-profile LPA solution was selected according to the BIC, indicating that the latent structure of the sample was more heterogeneous than initially expected. The use of LPA as a person-centered segmentation method is particularly appropriate for studying driving styles, as it captures complex behavioral configurations that cannot be detected through isolated variable analyses [14,15]. Similar profile-based approaches have also been reported in previous studies examining heterogeneous driver typologies across different traffic contexts [16,18,25,26,27,28].
From a methodological standpoint, person-centered approaches such as LPA offer important advantages over traditional variable-centered analyses commonly used in traffic psychology research. Whereas variable-centered models evaluate isolated associations between single driving dimensions and road safety outcomes, person-centered techniques allow the identification of naturally occurring behavioral configurations that integrate multiple coexisting tendencies within the same driver. This distinction is particularly relevant because risky, dissociative, anxious, aggressive, and careful driving tendencies frequently overlap rather than operating as mutually exclusive constructs. Consequently, the latent profiles identified in the present study should be interpreted as multidimensional behavioral organizations rather than as isolated dominant traits. In this sense, the present findings reinforce the methodological value of LPA for capturing the complexity and heterogeneity of real-world driving behavior.
The profiles identified in the present study were conceptually coherent with the multidimensional nature of the MDSI. Rather than reflecting purely unidimensional styles, several classes combined elevated scores across more than one dimension, suggesting that driver behavior is often configured through overlapping behavioral and emotional tendencies. One class was clearly dominated by careful driving and low risk-related scores, whereas another displayed globally elevated scores across dissociative, aggressive, anxious, and distress-reduction dimensions, representing the most behaviorally burdened configuration. Additional classes reflected intermediate or mixed combinations of risky, careful, and emotional-distress-reduction tendencies. For inferential purposes, these six latent configurations were subsequently consolidated into three broader analytical categories, a decision that improved interpretability and model parsimony but may also have reduced within-profile heterogeneity.
The Distress-Reduction/Dissociative profile presented the most complex configuration, with simultaneously elevated scores on the dissociative, aggressive, anxious, and distress-reduction dimensions. This pattern suggests the presence of drivers who actively manage emotional distress through driving, but whose behavior at the wheel is also modulated by inattention and hostility. Previous research has indicated that dysfunctional emotional regulation during driving constitutes a relevant predictor of risk behaviors and increased crash likelihood [11], which provides theoretical coherence to the observed association between this profile and road safety outcomes.
4.3. Generational Differences in Profile Distribution
One of the most noteworthy contributions of the present study is the evidence of significant differences in the distribution of analytically consolidated driving profiles between young and older drivers (χ2(2) = 49.15, p < 0.001). Although the Predominantly Careful category remained the most frequent in both groups, its proportion was considerably higher among young drivers (75.16%) than among older drivers (60.63%). The most striking generational contrast was observed in the Distress-Reduction category, which represented only 1.47% of young drivers but 12.22% of older drivers.
This result is theoretically relevant because it suggests that ageing does not simply translate into more careful driving, but may also be associated with a differentiated subgroup characterized by emotional regulation, tension, dissociation, and higher behavioral burden while driving. Previous research has shown that older drivers may experience cognitive, perceptual, and adaptive changes that alter their interaction with the traffic environment [24]. In this context, the greater representation of older drivers in the Distress-Reduction category may reflect coping-oriented or emotionally modulated driving patterns associated with accumulated exposure and age-related changes in perceived driving demands.
A plausible explanation for this pattern lies in the interaction between self-perception, accumulated driving experience, and adaptation to the traffic environment across the life course. Young drivers, particularly those who have recently obtained their license, may report more cautious behaviors due to greater awareness of formal traffic regulations and the influence of social desirability in self-report instruments [23,55]. In contrast, older drivers may exhibit more heterogeneous behavioral configurations as a result of decades of exposure to the road system, the development of individualized coping strategies, and age-related cognitive, perceptual, and emotional changes that can influence driving behavior [11,18,24]. From a road safety perspective, this behavioral heterogeneity among older drivers underscores the importance of moving beyond age-based categorization toward profile-differentiated interventions that account for the affective and attentional dimensions of driving behavior in later life.
4.4. The Role of Driving Exposure as a Predictor of Road Risk
The composite driving exposure index emerged as a robust predictor in both regression models, with higher exposure associated with increased odds of both traffic accident involvement and receipt of traffic infraction fines. These findings are consistent with prior research identifying traffic-system exposure as one of the most stable and direct determinants of road risk, irrespective of individual driver characteristics [17,18,19]. The exposure index incorporated multiple dimensions of traffic-system contact, including driving experience, weekly driving frequency, weekly kilometers, and habitual driving schedule, thereby providing a broader representation of exposure than approaches based on a single indicator [22]. With respect to moderation, the findings were differentiated by outcome. In the traffic accident model, no statistically significant interaction was observed between driving profile category and exposure, indicating that exposure functioned primarily as a direct predictor of crash probability. In contrast, the model predicting traffic infraction fines revealed a significant interaction between the Predominantly Risky profile and driving exposure, suggesting that higher exposure amplified sanction risk within this behavioral category. This result partially supports the hypothesized moderating role of exposure and indicates that its effect may depend on the specific road safety outcome under examination. It is also noteworthy that the Distress-Reduction × Exposure interaction in the accident model approached significance (p = 0.055). Although this result does not meet the conventional α = 0.05 threshold, the direction of the effect is consistent with the hypothesized moderating role of exposure and may reflect insufficient statistical power given the limited representation of this profile category in the sample (n = 36).
4.5. Driving Profiles and Road Safety Outcomes
Regarding the main effects of driving profile categories on road safety outcomes, the findings revealed a differentiated pattern according to the outcome examined. For traffic accident involvement, the Predominantly Risky category was significantly associated with higher odds of reporting an accident compared with the Predominantly Careful reference group. This association is consistent with the behavioral composition of the Predominantly Risky category, which includes drivers with higher risk-taking tendencies and weaker regulatory caution. The Distress-Reduction category did not reach statistical significance in the accident model, which may be attributable to the relatively small number of participants in this category and the resulting imprecision of the estimate.
For receipt of traffic infraction fines, the Distress-Reduction category showed the strongest and most consistent association, with substantially higher odds of sanction compared with the Careful reference group. This result is consistent with the structure of the Distress-Reduction category, where dissociative, aggressive, anxious, and emotion-regulation tendencies may increase the likelihood of sanctionable driving behaviors. In addition, the interaction between the Predominantly Risky category and driving exposure was statistically significant, indicating that the probability of receiving an infraction fine increased more steeply with exposure in this behavioral group. The pattern of results indicates that profile–outcome associations were not uniform: risky configurations were more closely linked to accident involvement, whereas distress-related configurations were more strongly linked to infraction fines.
The fact that age group was not an independent significant predictor of road safety outcomes in the adjusted models, despite the raw differences observed between groups, indicates that generational differences in risk are largely mediated by driving profile and exposure rather than by age alone. For prevention, this means that interventions should be organized around behavioral profile and exposure level rather than age group alone.
4.6. Implications for Road Safety Prevention and Public Policy
The results of the present study have direct implications for the design of profile-differentiated road safety prevention strategies. First, the identification of the Distress-Reduction category as the profile most consistently associated with traffic infraction fines suggests that interventions targeting emotional regulation, stress management, and attentional control during driving could be particularly effective within this subgroup. Second, the significant association between the Predominantly Risky category and traffic accidents indicates that this group may benefit from interventions focused on deliberate risk-taking, behavioral self-monitoring, and traffic norm compliance [11,23]. Third, the significant interaction between the Predominantly Risky category and driving exposure in the infraction model suggests that high-exposure drivers within this category may require targeted monitoring or tailored prevention strategies [25].
4.7. Limitations
The present study has several limitations that should be considered when interpreting its findings. First, the cross-sectional design precludes the establishment of causal relationships between driving profiles, exposure, and road safety outcomes. The observed associations must be interpreted as correlational, and it is not possible to determine the direction of effects or to control for the influence of unobserved variables that might confound the studied relationships.
Second, all variables analyzed, including driving styles, exposure, and road safety outcomes, were obtained through self-report. This measurement approach is subject to memory bias, social desirability effects, and attribution biases, which may operate differentially depending on the age group and educational level of participants. In particular, the underreporting of risk behaviors and the overreporting of careful driving behaviors are well-documented patterns in self-report instruments applied in the driving domain [9,14]. This possibility may be especially relevant in the young driver subgroup, which was recruited predominantly through digital and academic dissemination channels. Participants with stronger educational or institutional affiliation may have been more likely to provide socially desirable responses emphasizing careful driving behaviors, potentially contributing to the high prevalence of the Predominantly Careful category observed in the sample. In addition, because individual completion-time metadata were not retained in the final anonymized dataset, the 3-min exclusion threshold could not be benchmarked against the median completion time or interquartile range and should therefore be interpreted as a pragmatic data-quality criterion rather than a statistically derived cutoff.
Third, the relatively small size of some risk-related latent configurations, particularly those associated with the Distress-Reduction category (n = 36), limited the statistical power of the regression analyses, especially with respect to the interaction terms. In addition, the consolidated Predominantly Careful category represented approximately 71.3% of the analytical sample, generating a substantial imbalance between the reference category and the smaller risk-related groups. This asymmetry may have affected the stability, precision, and interpretability of several estimated odds ratios, particularly for interaction-level coefficients and low-frequency behavioral configurations. Moreover, the small Distress-Reduction cell produced notably wide confidence intervals for several estimates, rendering some coefficients highly imprecise and unsuitable for isolated substantive interpretation. Replication of the analyses in larger and more behaviorally balanced samples would yield more stable estimates and improve the robustness of profile-specific inferences.
Fourth, the sample was collected across ten Ecuadorian cities through convenience and digitally mediated recruitment, which limits the national representativeness of the findings and the extent to which results can be generalized to other Latin American contexts with different traffic conditions, regulatory frameworks, and cultural characteristics. This recruitment strategy may have overrepresented participants with higher access to online communication channels, stronger links to academic or institutional networks, and greater willingness to participate in research. This potential selection bias is particularly relevant for the young driver group, which represented the largest proportion of the sample and may include a higher share of university-affiliated or digitally active respondents. Furthermore, the unequal distribution between age groups, with a considerably higher proportion of young drivers than older adults, may have affected the stability of certain estimates.
An additional limitation concerns the analytical consolidation of the six latent profiles into three broader categories for inferential purposes. Although this procedure improved model parsimony and reduced sparse-cell problems, it may also have obscured meaningful within-profile heterogeneity. This issue is particularly relevant for Profile 2 (“Low activation/Disengaged”), which was assigned to the Predominantly Careful analytical category due to the absence of elevated risk-related dimensions rather than the presence of genuinely careful driving tendencies. Although sensitivity analyses treating Profile 2 as an independent category supported the robustness of the main findings, future studies should consider retaining this configuration as a separate profile when sample size permits.
Finally, the composite driving exposure index was constructed by standardizing and averaging four indicators without differentially weighting their contributions to road risk. Although this procedure is methodologically acceptable as an exploratory strategy, future studies should examine empirically or expert-informed weighting models to refine the representation of driving exposure.
4.8. Directions for Future Research
The findings of the present study open several lines of inquiry that merit exploration in subsequent research. First, it would be pertinent to replicate the analysis using longitudinal designs that allow evaluation of the stability of driving profiles over time and their prospective relationship with crash risk. Such a design would overcome the causal limitations inherent to cross-sectional studies and enable deeper investigation of how behavioral profiles evolve with age and accumulated driving experience.
Second, future studies should incorporate objective measures of driving behavior, such as telematics or naturalistic driving data, to complement self-reported information and reduce the biases associated with self-report methodology. Integrating vehicular telemetry data with psychometric instruments such as the MDSI would represent a significant methodological advance for driving style and road safety research in Latin American contexts.
Third, it would be valuable to extend the analysis to intermediate age groups and more representative samples of the Ecuadorian driver population, with the aim of characterizing the distribution of latent profiles across the full spectrum of the driving life cycle. This would make it possible to identify whether there are inflection points in profile transitions associated with age, driving experience, or specific life events.
Fourth, the moderating role of exposure deserves more detailed investigation in studies with greater statistical power and more balanced profile sizes. In the present study, no significant moderation effect was observed for accident involvement, whereas a significant interaction emerged between the Predominantly Risky category and driving exposure in the model predicting traffic infraction fines. This differentiated pattern suggests that exposure may amplify some forms of behavioral risk more strongly than others, an issue that warrants further theoretical and empirical examination.
Finally, it would be of considerable interest to develop international comparative studies examining the distribution of latent driving style profiles and their relationship with road safety across different Latin American countries, considering variability in traffic regulatory systems, road infrastructure characteristics, and cultural factors that may shape driving behaviors. Such research would contribute to building a robust regional evidence base for the development of road safety policies adapted to local contexts.
5. Conclusions
The present study examined the relationship between latent driving style profiles and road safety outcomes among young and older drivers in Ecuador, while evaluating the role of driving exposure in these relationships. The findings indicate that Latent Profile Analysis applied to the MDSI subscales identified a heterogeneous six-profile latent structure, supporting the usefulness of person-centered approaches for understanding behavioral variability in driving populations.
For inferential purposes, the six latent profiles were subsequently consolidated into three broader analytical categories. Within this framework, the Predominantly Risky category was significantly associated with higher odds of traffic accident involvement, whereas the Distress-Reduction category was significantly associated with a higher likelihood of receiving traffic infraction fines. The composite driving exposure index emerged as a robust predictor across both statistical models, indicating that higher levels of exposure were associated with increased probabilities of both accident involvement and traffic infractions.
The first working hypothesis was supported: latent driving style profiles differed significantly in their association with road safety outcomes, with the Predominantly Risky category predicting accident involvement and the Distress-Reduction category predicting infraction fines. The second hypothesis received only partial support. No statistically significant interaction was observed in the accident model, but a significant interaction emerged between the Predominantly Risky category and driving exposure in the model predicting traffic infraction fines. This finding suggests that the effect of exposure may depend on the specific type of road safety outcome under examination.
Generational differences in the distribution of behavioral profile categories were statistically significant. Although the Predominantly Careful category remained the most frequent in both age groups, older drivers showed a substantially higher representation of the Distress-Reduction category. These findings reinforce the relevance of behavior-centered approaches for understanding driver heterogeneity and for designing evidence-based road safety interventions that account for both behavioral tendencies and exposure-related conditions.
Author Contributions
Conceptualization, X.M.-V.; methodology, X.M.-V.; software, F.D.-M. and Y.G.-R.; validation, F.D.-M. and Y.G.-R.; formal analysis, X.M.-V.; investigation, X.M.-V.; resources, X.M.-V.; data curation, X.M.-V.; writing—original draft preparation, X.M.-V.; writing—review and editing, X.M.-V., F.D.-M. and Y.G.-R.; visualization, X.M.-V.; supervision, X.M.-V.; project administration, X.M.-V.; funding acquisition, X.M.-V. All authors have read and agreed to the published version of the manuscript.
Funding
This research was funded by Universidad Técnica Particular de Loja, grant number POA VIN-56.
Institutional Review Board Statement
The study was conducted in accordance with the Declaration of Helsinki, and approved by the Ethics Committee for Research Involving Human Subjects of Universidad Técnica Particular de Loja (CEISH-UTPL) (Approval Code: Oficio CEISH-UTPL-(03)-(2026) No. 43; Approval date: 31 March 2026).
Informed Consent Statement
Informed consent was obtained from all participants involved in the study prior to data collection, emphasizing the voluntary and confidential nature of their participation.
Data Availability Statement
The data presented in this study are available on request from the corresponding author due to privacy and ethical restrictions related to the use of anonymized survey data from human participants.
Acknowledgments
The authors gratefully acknowledge the institutional support provided by the Universidad Técnica Particular de Loja (UTPL), whose resources and research infrastructure made this study possible. The authors acknowledge the use of generative artificial intelligence tools including OpenAI ChatGPT (GPT-5.5, OpenAI, San Francisco, CA, USA) to support statistical code refinement, debugging, and editorial language improvement during manuscript preparation. The authors retained full responsibility for the study design, data analysis, interpretation of results, intellectual content, and final version of the manuscript.
Conflicts of Interest
The authors declare no conflicts of interest. The funders had no role in the design of the study; in the collection, analyses, or interpretation of data; in the writing of the manuscript; or in the decision to publish the results.
Abbreviations
The following abbreviations are used in this manuscript:
| BIC | Bayesian Information Criterion |
| AIC | Akaike Information Criterion |
| SABIC | Sample-size-adjusted Bayesian Information Criterion |
| CEISH | Comité de Ética de Investigación en Seres Humanos |
| CI | Confidence Interval |
| LPA | Latent Profile Analysis |
| MDSI | Multidimensional Driving Style Inventory |
| OR | Odds Ratio |
| UTPL | Universidad Técnica Particular de Loja |
| SD | Standard Deviation |
References
- Organización Mundial de la Salud. Traumatismos Causados Por El Tránsito. Available online: https://www.who.int/es/news-room/fact-sheets/detail/road-traffic-injuries (accessed on 8 March 2026).
- Shinar, D. Traffic Safety and Human Behavior; Emerald Group Publishing: Bingley, UK, 2017; Volume 7, p. 1262. [Google Scholar]
- Mahmood, K.; Bashir, T.; Rehman, H.M.; Rehman, M.; Nayyar, Z. Analysing the Role of Driver Behaviors in Road Traffic Accidents: An Application of Machine Learning. Int. J. Manag. Stud. 2024, 31, 269–298. [Google Scholar] [CrossRef] [Scilit]
- Luke, R. Current and Future Trends in Driver Behaviour and Traffic Safety Scholarship: An African Research Agenda. Int. J. Environ. Res. Public Health 2023, 20, 4290. [Google Scholar] [CrossRef] [Scilit] [PubMed]
- Scott-Parker, B.; Oviedo-Trespalacios, O. Young Driver Risky Behaviour and Predictors of Crash Risk in Australia, New Zealand and Colombia: Same but Different? Accid. Anal. Prev. 2017, 99, 30–38. [Google Scholar] [CrossRef] [Scilit] [PubMed]
- Taubman-Ben-Ari, O.; Mikulincer, M.; Gillath, O. The Multidimensional Driving Style Inventory—Scale Construct and Validation. Accid. Anal. Prev. 2004, 36, 323–332. [Google Scholar] [CrossRef] [Scilit] [PubMed]
- Taubman Ben-Ari, O.; Skvirsky, V. The Multidimensional Driving Style Inventory a Decade Later: Review of the Literature and Re-Evaluation of the Scale. Accid. Anal. Prev. 2016, 93, 179–188. [Google Scholar] [CrossRef] [Scilit]
- Constantinou, E.; Panayiotou, G.; Konstantinou, N.; Loutsiou-Ladd, A.; Kapardis, A. Risky and Aggressive Driving in Young Adults: Personality Matters. Accid. Anal. Prev. 2011, 43, 1323–1331. [Google Scholar] [CrossRef] [Scilit]
- Wang, X.; Xu, X. Assessing the Relationship between Self-Reported Driving Behaviors and Driver Risk Using a Naturalistic Driving Study. Accid. Anal. Prev. 2019, 128, 8–16. [Google Scholar] [CrossRef] [Scilit]
- Dingus, T.A.; Guo, F.; Lee, S.; Antin, J.F.; Perez, M.; Buchanan-King, M.; Hankey, J. Driver Crash Risk Factors and Prevalence Evaluation Using Naturalistic Driving Data. Proc. Natl. Acad. Sci. USA 2016, 113, 2636–2641. [Google Scholar] [CrossRef] [Scilit]
- Lucidi, F.; Girelli, L.; Chirico, A.; Alivernini, F.; Cozzolino, M.; Violani, C.; Mallia, L. Personality Traits and Attitudes Toward Traffic Safety Predict Risky Behavior Across Young, Adult, and Older Drivers. Front. Psychol. 2019, 10, 536. [Google Scholar] [CrossRef] [Scilit]
- Tanglai, W.; Chen, C.-F.; Rattanapan, C.; Laosee, O. The Effects of Personality and Attitude on Risky Driving Behavior Among Public van Drivers: Hierarchical Modeling. Saf. Health Work 2022, 13, 187–191. [Google Scholar] [CrossRef] [Scilit]
- Chen, D.; Chen, Z.; Zhang, Y.; Qu, X.; Zhang, M.; Wu, C. Driving Style Recognition under Connected Circumstance Using a Supervised Hierarchical Bayesian Model. J. Adv. Transp. 2021, 2021, 6687378. [Google Scholar] [CrossRef] [Scilit]
- Berrouachedi, A.; Jaziri, R.; Bernard, G. Driver Behavior Profiling: Clustering Techniques for Enhanced Road Safety and Personalized Mobility. In Proceedings of the 2025 IEEE 5th International Conference on Smart Information Systems and Technologies (SIST); IEEE: New York, NY, USA, 2025; pp. 1–6. [Google Scholar]
- Nees, M.A.; Herwig, K.; Quigley, L.; Zhang, J. Relationships among Driving Styles, Desire for Control, Illusion of Control, and Self-Reported Driving Behaviors. Traffic Inj. Prev. 2021, 22, 372–377. [Google Scholar] [CrossRef] [Scilit]
- Sharmin, S.; Ivan, J.N.; Marsh, K.L.; Paxton, A.; Tucker, A. Driver Psychology Latent Classes as Predictors of Traffic Incident Occurrence in Naturalistic Driving Study Data. Transp. Res. Rec. J. Transp. Res. Board 2023, 2677, 839–857. [Google Scholar] [CrossRef] [Scilit]
- Ma, J.; Yang, Y.; Ren, G.; Wang, S. Exploring Risky Driving Behaviors in Severe Taxi Crashes: Accounting for Unobserved Heterogeneities Using Latent Class Clustering and Partial Proportional Odds Model. Traffic Inj. Prev. 2026, 27, 77–83. [Google Scholar] [CrossRef] [Scilit] [PubMed]
- Song, X.; Yin, Y.; Cao, H.; Zhao, S.; Li, M.; Yi, B. The Mediating Effect of Driver Characteristics on Risky Driving Behaviors Moderated by Gender, and the Classification Model of Driver’s Driving Risk. Accid. Anal. Prev. 2021, 153, 106038. [Google Scholar] [CrossRef] [Scilit]
- Rios, P.A.A.; Mota, E.L.A.; Ferreira, L.N.; Cardoso, J.P.; Ribeiro, V.M.; Souza, B.S.D. Fatores Associados a Acidentes de Trânsito Entre Condutores de Veículos: Achados de Um Estudo de Base Populacional. Cien. Saude Colet. 2020, 25, 943–955. [Google Scholar] [CrossRef] [Scilit]
- Elander, J.; West, R.; French, D. Behavioral Correlates of Individual Differences in Road-Traffic Crash Risk: An Examination of Methods and Findings. Psychol. Bull. 1993, 113, 279–294. [Google Scholar] [CrossRef] [PubMed]
- Sheykhfard, A.; Qin, X.; Shaaban, K.; Koppel, S. An Exploration of the Role of Driving Experience on Self-Reported and Real-World Aberrant Driving Behaviors. Accid. Anal. Prev. 2022, 178, 106873. [Google Scholar] [CrossRef] [Scilit]
- Tao, D.; Zhang, R.; Qu, X. The Role of Personality Traits and Driving Experience in Self-Reported Risky Driving Behaviors and Accident Risk among Chinese Drivers. Accid. Anal. Prev. 2017, 99, 228–235. [Google Scholar] [CrossRef] [Scilit] [PubMed]
- Lyon, C.; Mayhew, D.; Granié, M.-A.; Robertson, R.; Vanlaar, W.; Woods-Fry, H.; Thevenet, C.; Furian, G.; Soteropoulos, A. Age and Road Safety Performance: Focusing on Elderly and Young Drivers. IATSS Res. 2020, 44, 212–219. [Google Scholar] [CrossRef] [Scilit]
- Menze, F.; Churchill, N.W.; Schweizer, T.A.; Graham, S.J. Simulated Driving Behavior over the Adult Age Span. Front. Aging Neurosci. 2025, 17, 1496224. [Google Scholar] [CrossRef] [Scilit]
- Gomes-Franco, K.; Rivera-Izquierdo, M.; Martín-delosReyes, L.M.; Jiménez-Mejías, E.; Martínez-Ruiz, V. Explaining the Association between Driver’s Age and the Risk of Causing a Road Crash through Mediation Analysis. Int. J. Environ. Res. Public Health 2020, 17, 9041. [Google Scholar] [CrossRef] [Scilit]
- Labbo, M.S.; Qu, L.; Xu, C.; Bai, W.; Ayele Atumo, E.; Jiang, X. Understanding Risky Driving Behaviors among Young Novice Drivers in Nigeria: A Latent Class Analysis Coupled with Association Rule Mining Approach. Accid. Anal. Prev. 2024, 200, 107557. [Google Scholar] [CrossRef] [Scilit] [PubMed]
- Michaels, J.; Chaumillon, R.; Nguyen-Tri, D.; Watanabe, D.; Hirsch, P.; Bellavance, F.; Giraudet, G.; Bernardin, D.; Faubert, J. Driving Simulator Scenarios and Measures to Faithfully Evaluate Risky Driving Behavior: A Comparative Study of Different Driver Age Groups. PLoS ONE 2017, 12, e0185909. [Google Scholar] [CrossRef] [Scilit] [PubMed]
- Zhu, Y.; Jiang, M.; Yamamoto, T. Personality, Functional Performance, and Travel Patterns Related to Older Drivers’ Risky Driving Behavior: A Naturalistic Driving Study. Accid. Anal. Prev. 2025, 209, 107833. [Google Scholar] [CrossRef] [Scilit] [PubMed]
- Ward Creswell, J. Research Design: Qualitative, Quantitative, and Mixed Methods Approaches; SAGE Publications, Inc.: Thousand Oaks, CA, USA, 2018; pp. 3–23. [Google Scholar]
- Dillman, D.A.; Smyth, J.D.; Christian, L.M. Internet, Phone, Mail, and Mixed-Mode Surveys: The Tailored Design Method; Wiley: Hoboken, NJ, USA, 2014. [Google Scholar]
- Callegaro, M.; Manfreda, K.L.; Vehovar, V. Web Survey Methodology; SAGE Publications, Inc.: Thousand Oaks, CA, USA, 2015. [Google Scholar] [CrossRef] [Scilit]
- Etikan, I. Comparision of Snowball Sampling and Sequential Sampling Technique. Biom. Biostat. Int. J. 2016, 3, 6–7. [Google Scholar] [CrossRef] [Scilit]
- Nylund, K.L.; Asparouhov, T.; Muthén, B.O. Deciding on the Number of Classes in Latent Class Analysis and Growth Mixture Modeling: A Monte Carlo Simulation Study. Struct. Equ. Model. 2007, 14, 535–569. [Google Scholar] [CrossRef] [Scilit]
- Oppenheim, A.N. Questionnaire Design, Interviewing and Attitude Measurement; Continuum: New York, NY, USA, 2008. [Google Scholar]
- Poó, F.M.; Taubman-Ben-Ari, O.; Ledesma, R.D.; Díaz-Lázaro, C.M. Reliability and Validity of a Spanish-Language Version of the Multidimensional Driving Style Inventory. Transp. Res. Part F Traffic Psychol. Behav. 2013, 17, 75–87. [Google Scholar] [CrossRef] [Scilit]
- R Core Team. R A Language and Environment for Statistical Computing. Available online: https://www.r-project.org/ (accessed on 12 March 2026).
- Tierney, N.; Cook, D. Expanding Tidy Data Principles to Facilitate Missing Data Exploration, Visualization and Assessment of Imputations. J. Stat. Softw. 2023, 105, 1–31. [Google Scholar] [CrossRef] [Scilit]
- Download RStudio|The Popular Open-Source IDE from Posit. Available online: https://posit.co/products/open-source/rstudio/?sid=1 (accessed on 12 March 2026).
- Wickham, H.; Averick, M.; Bryan, J.; Chang, W.; McGowan, L.; François, R.; Grolemund, G.; Hayes, A.; Henry, L.; Hester, J.; et al. Welcome to the Tidyverse. J. Open Source Softw. 2019, 4, 1686. [Google Scholar] [CrossRef] [Scilit]
- Wickham, H.; Bryan, J. Read Excel Files, R Package Readxl Version 1.4.5. CRAN: Contributed Packages. CRAN: Vienna, Austria, 2025. [CrossRef] [Scilit]
- Firke, S. Simple Tools for Examining and Cleaning Dirty Data, R Package Janitor Version 2.2.1. CRAN: Contributed Packages. CRAN: Vienna, Austria, 2024. [CrossRef] [Scilit]
- Revelle, W. Procedures for Psychological, Psychometric, and Personality Research, R Package Psych Version 2.6.1. CRAN: Contrib. Packages. CRAN: Vienna, Austria, 2026. [CrossRef] [Scilit]
- Rosenberg, J.M.; Beymer, P.N.; Anderson, D.J.; van Lissa, C.J.; Schmidt, J.A. TidyLPA: An R Package to Easily Carry Out Latent Profile Analysis (LPA) Using Open-Source or Commercial Software. J. Open Source Softw. 2018, 3, 978. [Google Scholar] [CrossRef] [Scilit]
- Scrucca, L.; Fop, M.; Murphy, T.B.; Raftery, A.E. Mclust 5: Clustering, Classification and Density Estimation Using Gaussian Finite Mixture Models. R J. 2016, 8, 289–317. [Google Scholar] [CrossRef] [Scilit]
- Robinson, D.; Hayes, A.; Couch, S.; Hvitfeldt, E. Convert Statistical Objects into Tidy Tibbles, R Package Broom Version 1.0.12. CRAN: Contributed Packages. CRAN: Vienna, Austria, 2026. [CrossRef] [Scilit]
- Lüdecke, D. Ggeffects: Tidy Data Frames of Marginal Effects from Regression Models. J. Open Source Softw. 2018, 3, 772. [Google Scholar] [CrossRef] [Scilit]
- Wickham, H.; Henry, L.; Pedersen, T.L.; Luciani, T.J.; Decorde, M.; Lise, V. An “SVG” Graphics Device, R Package Svglite Version 2.2.2. CRAN: Contributed Packages. CRAN: Vienna, Austria, 2025. [CrossRef] [Scilit]
- Hollander, M.; Wolfe, D.A.; Chicken, E. Nonparametric Statistical Methods; John Wiley & Sons: Hoboken, NJ, USA, 2014; p. 819. [Google Scholar]
- ten Berge, J.M.F. J. C. Nunnally and I. H. Bernstein. Psychometric Theory. New York: McGraw-Hill, 1994, Xxiv+752 Pages, £51.95. Psychometrika 1995, 60, 313–315. [Google Scholar] [CrossRef] [Scilit]
- Bland, J.M.; Altman, D.G. Cronbach’s Alpha. BMJ 1997, 314, 572. [Google Scholar] [CrossRef] [Scilit] [PubMed]
- Weller, B.E.; Bowen, N.K.; Faubert, S.J. Latent Class Analysis: A Guide to Best Practice. J. Black Psychol. 2020, 46, 287–311. [Google Scholar] [CrossRef] [Scilit]
- Hosmer, D.W.; Lemeshow, S.; Sturdivant, R.X. Applied Logistic Regression, 3rd ed.; John Wiley & Sons: Hoboken, NJ, USA, 2013; pp. 1–510. [Google Scholar] [CrossRef] [Scilit]
- Association, W.M. World Medical Association Declaration of Helsinki: Ethical Principles for Medical Research Involving Human Subjects. JAMA 2013, 310, 2191–2194. [Google Scholar] [CrossRef] [Scilit]
- Asamblea Nacional del Ecuador. Ley Orgánica de Protección de Datos Personales; Registro Oficial Suplemento: Quito, Ecuador, 2021.
- Lajunen, T.; Summala, H. Can We Trust Self-Reports of Driving? Effects of Impression Management on Driver Behaviour Questionnaire Responses. Transp. Res. Part F Traffic Psychol. Behav. 2003, 6, 97–107. [Google Scholar] [CrossRef] [Scilit]
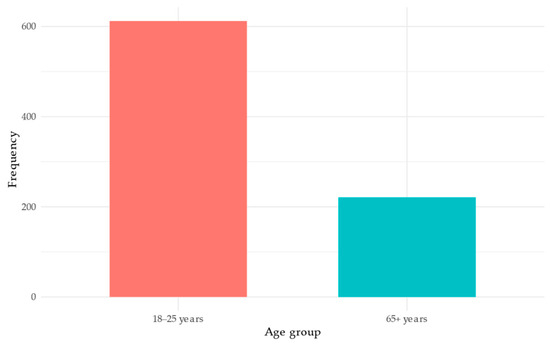
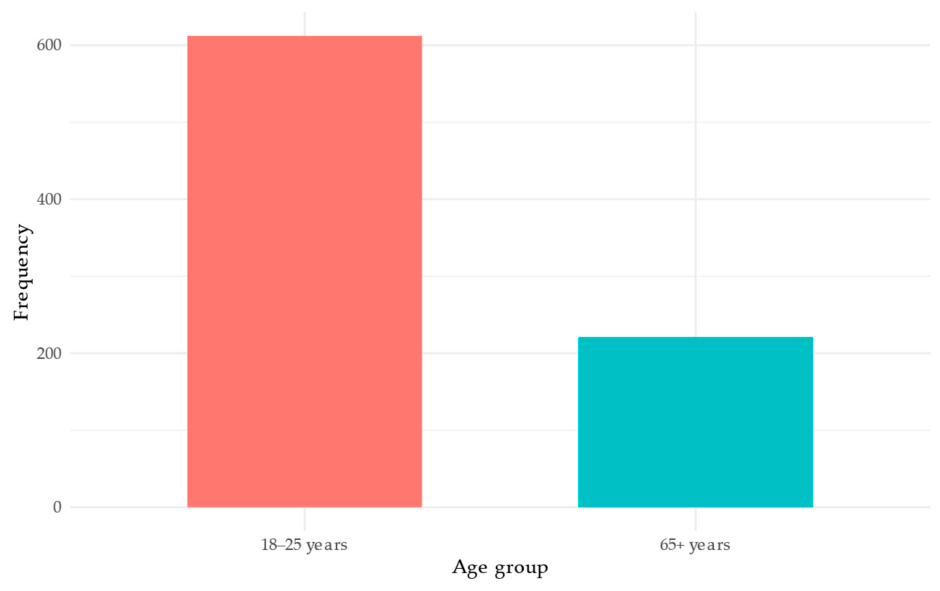
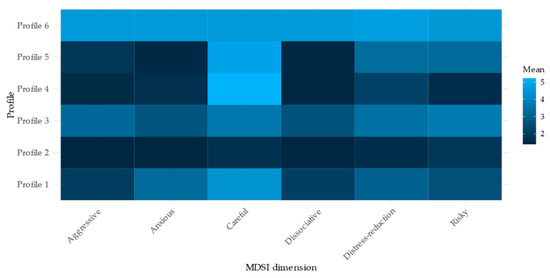
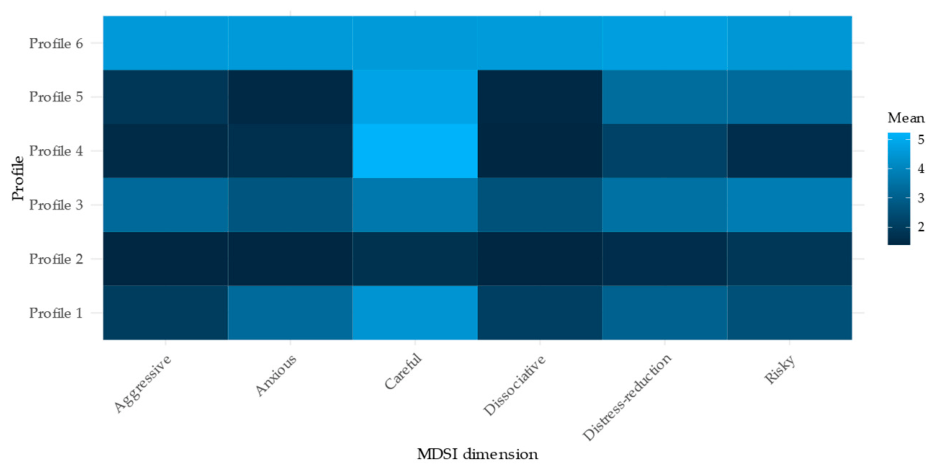
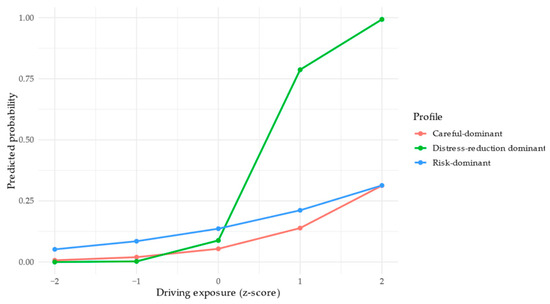
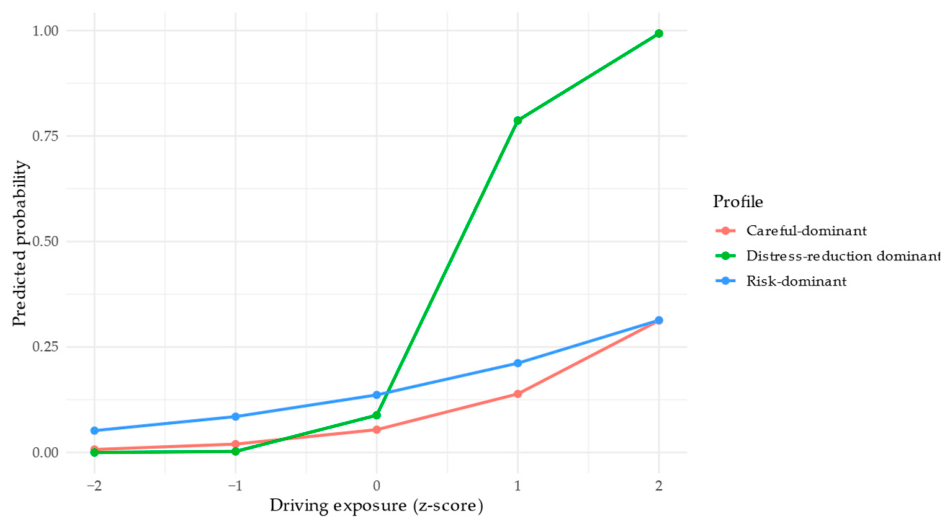
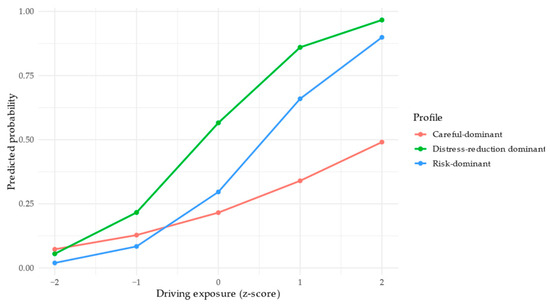
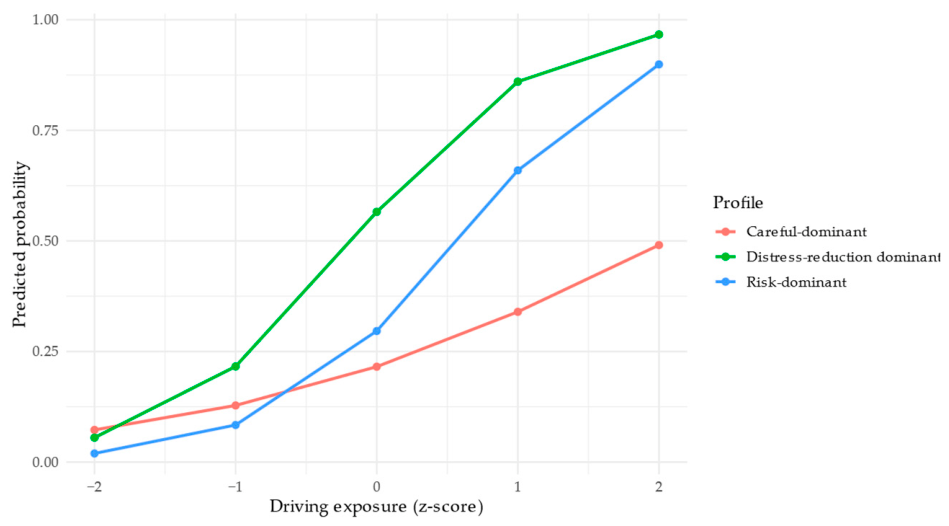

Disclaimer/Publisher’s Note: The statements, opinions and data contained in all publications are solely those of the individual author(s) and contributor(s) and not of MDPI and/or the editor(s). MDPI and/or the editor(s) disclaim responsibility for any injury to people or property resulting from any ideas, methods, instructions or products referred to in the content. |
© 2026 by the authors. Licensee MDPI, Basel, Switzerland. This article is an open access article distributed under the terms and conditions of the Creative Commons Attribution (CC BY) license.