


Abstract
In emergency decision-making for carbon capture, utilization, and storage (CCUS) CO2 pipeline leakage, risk levels and warning distances/impact ranges are often derived from different methodological systems—risk-matrix scoring versus mechanistic consequence modeling. Differences in threshold definitions and modeling assumptions make it difficult to align level assignment with distance boundaries for the same scenario, which in turn reduces the comparability and traceability of multi-scenario batch screening. To address this, this study proposes an integrated framework based on “threshold impact-distance calculation–risk-matrix mapping,” with physical consequence quantification as the main thread. A scenario library (N = 4320) covering phase state, leak aperture, operating conditions, and meteorological fields is constructed; impact distances corresponding to CO2 volume-fraction thresholds of 1%/4%/10% (R1%, R4%, R10%) are computed and then mapped to five RiskLevel classes under a unified rule set, enabling standardized synchronous outputs. The modeling tasks are formulated as RiskLevel classification and threshold-distance regression. Using a stratified 70%/30% train–test split, Extreme Gradient Boosting (XGBoost) is adopted as the primary model and compared with logistic regression (LR), support vector classification (SVC), ordinary least squares regression (OLS), and support vector regression (SVR). Results show that XGBoost achieves an accuracy of 0.806 and a macro-F1 of 0.825 for RiskLevel classification, with a recall of 0.631 for the high-risk classes (RiskLevel 4–5), and yields mean absolute errors (MAEs) of 95/62/41 m for R1%/R4%/R10% regression with coefficient of determination (R2) values of 0.795–0.814. Distributional analysis further indicates that threshold impact distances increase overall with higher RiskLevel, while dispersion becomes larger at higher levels. Accordingly, a parallel representation of “RiskLevel + multi-threshold rings” is recommended to support coordinated graded control and zoned warning delineation.
1. Introduction
Against the backdrop of global climate change, achieving carbon neutrality has become a shared goal for national energy and industrial transitions worldwide [1]. Carbon capture, utilization, and storage (CCUS) is widely recognized as one of the critical enabling technologies for the low-carbon transition of fossil energy systems and for deep decarbonization in hard-to-abate sectors [2,3]. With the continued growth in capture capacity and storage demand, cross-regional transport of CO2 within source–sink systems has become a key bottleneck for large-scale CCUS deployment, and long-distance pipeline transport, owing to its continuity, cost-effectiveness, and high throughput, is regarded as a mainstream option for CO2 transportation [4,5]. However, CO2 pipelines typically operate under high pressure, and the release and dispersion processes after a leak are jointly influenced by phase behavior, negative buoyancy effects near the ground, and terrain/meteorological conditions [6,7,8,9,10]. Once leakage occurs, a high-concentration impact zone may form downwind, leading to asphyxiation and human exposure risks and imposing more stringent requirements on on-site emergency response and regional safety management [7,8,10,11].
From the perspective of emergency management and engineering decision-making, rapid assessment of leakage in CO2 pipelines generally needs to provide two types of key information simultaneously: (i) the risk level, which supports graded response activation, resource allocation, and prioritization of mitigation actions; and (ii) the warning distance/impact extent, which supports delineation of cordon zones, evacuation boundaries, and control partitions [12,13]. In practice, risk levels may be determined using different methodological routes, including rapid screening tools such as risk matrices/scorecards as well as probabilistic or network-based methods for structured representation of scenario risks [14,15,16]. By contrast, warning distances/impact extents more often rely on mechanistic or semi-empirical consequence models, which typically output isopleth distances under toxicity thresholds, flammability/explosion thresholds, or thermal radiation thresholds, and are coupled with GIS spatial data to support exposure verification, zonal control, and evacuation strategy simulation [17,18,19,20,21,22,23]. Because these two outputs are commonly built on different threshold systems, modeling assumptions, and regulatory conventions, inconsistencies between “level determination” and “distance boundaries” may arise for the same leakage scenario, particularly when different software tools or frameworks are used in parallel [24]. When batch verification and rapid screening are required across multiple phases, leak apertures, and meteorological combinations, such inconsistencies further increase assessment and review costs and weaken interpretability and operational usefulness, thereby limiting direct application in emergency zoning and risk screening [25].
Regarding the spatial quantification of leakage consequences, both domestic and international research has established dispersion and consequence modeling pathways centered on mechanistic approaches. These include analytical/semi-analytical methods, heavy-gas dispersion models, and CFD/coupled numerical simulations to compute isopleth distances or impact extents under specified concentration thresholds, thereby determining hazardous impact ranges and safety protection distances [26,27,28,29]. Such methods can characterize in detail the combined effects of source strength, operating conditions, and meteorological fields on dispersion behavior; however, two practical constraints remain in emergency contexts. First, combinations of multiple apertures, operating conditions, and wind fields/stability classes cause the scenario space to expand rapidly, and numerical simulations and multi-scenario consequence calculations are often time- and computation-intensive, making rapid batch assessment difficult to achieve. Accordingly, recent studies have explored machine learning/deep learning to generate fast surrogate predictions of dispersion or exposure consequences, seeking a trade-off between accuracy and timeliness [30,31,32]. Second, in engineering practice, “impact distance/isopleths” must still be mapped into “risk levels/response tiers”. Yet, the binning boundaries, level meanings, and usability of risk matrices are highly dependent on specific design choices and contexts, and different organizations/regions may adopt different matrices and threshold criteria. As a result, the same scenario may be assigned inconsistent risk levels under different frameworks, undermining the comparability and auditability of assessment conclusions [33,34,35].
Risk level assessment may follow different methodological routes. In engineering-oriented screening, commonly used approaches include risk matrices, tiering standards, or probability–consequence composite criteria for rapid categorization [36]. Although these approaches are structurally clear and convenient for management decisions, conventional matrix methods also face a key limitation: consequence indicators and spatial boundaries are difficult to align. Risk levels are typically discrete labels and do not directly provide an actionable spatial control scale. Moreover, if risk tiering lacks a unified consequence quantification basis, it can be overly influenced by empirical weights and expert judgment, resulting in insufficient stability across different teams and assessment batches [36,37]. Therefore, from the standpoint of operational emergency implementation, there is a clear need for a methodological framework that can output risk levels and warning distances simultaneously under a unified rule set, closing the loop between “graded control” and “zonal warning” within a single indicator system and supporting batch, auditable engineering applications [38].
In recent years, machine learning has provided a feasible pathway for rapid engineering risk assessment [39,40,41]. By constructing a scenario sample library that covers representative operating conditions and adverse combinations and training surrogate models accordingly, near-real-time inference can be achieved while substantially reducing computational cost, thereby improving batch inference efficiency [39,41]. Recent studies have further demonstrated the applicability of data-driven methods to leakage-related tasks. Comparative evaluation of multiple machine learning algorithms has shown that CO2 leak location and size in geo-sequestration injection wells can be predicted from wellhead and bottom-hole operating data, supporting fast leak prediction and characterization [42]. In parallel, intelligent leak detection and localization strategies have also been developed in adjacent pipeline-safety contexts, where vehicle–canine collaborative detection has been shown to improve methane leak detection and localization efficiency in urban pipeline networks [43]. However, existing data-driven studies often focus on a single target (e.g., predicting concentration/dispersion behavior only or deriving risk classification cues only), and unified modeling and traceable engineering implementation for joint “level–distance” outputs remain insufficient [40,44]. In addition, high-resolution delineation of spatial consequence boundaries still frequently depends on mechanistic/numerical simulation pipelines, further highlighting the necessity of establishing a closed-loop, auditable mapping from “distance” to “level” under a unified rule framework [45].
This study aims to establish a unified emergency assessment framework for CCUS CO2 pipeline leakage that can generate synchronized outputs of risk level and warning distance under a consistent rule set. To achieve this objective, a scenario library containing 4320 cases was constructed to cover transportation phase state, leak aperture, operating conditions, and meteorological fields. Three threshold impact distances, corresponding to CO2 volume-fraction thresholds of 1%, 4%, and 10% (R1%, R4%, and R10%), were calculated and then mapped to five RiskLevel classes, and a joint learning task system combining RiskLevel classification and threshold-distance regression was developed with XGBoost as the primary model and baseline comparisons. The results show that XGBoost achieves the best overall performance, with an accuracy of 0.806 and a macro-F1 of 0.825 for RiskLevel classification, together with MAEs of 95, 62, and 41 m for R1%, R4%, and R10% regression, respectively. The results further show that threshold impact distance increases overall with RiskLevel, while higher levels exhibit greater dispersion. These findings support the use of a coupled representation of “RiskLevel + multi-threshold distance rings” for graded response activation, warning-zone delineation, and rapid engineering-oriented emergency screening.
2. Materials and Methods
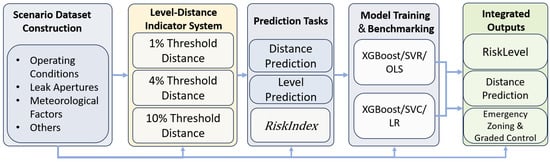
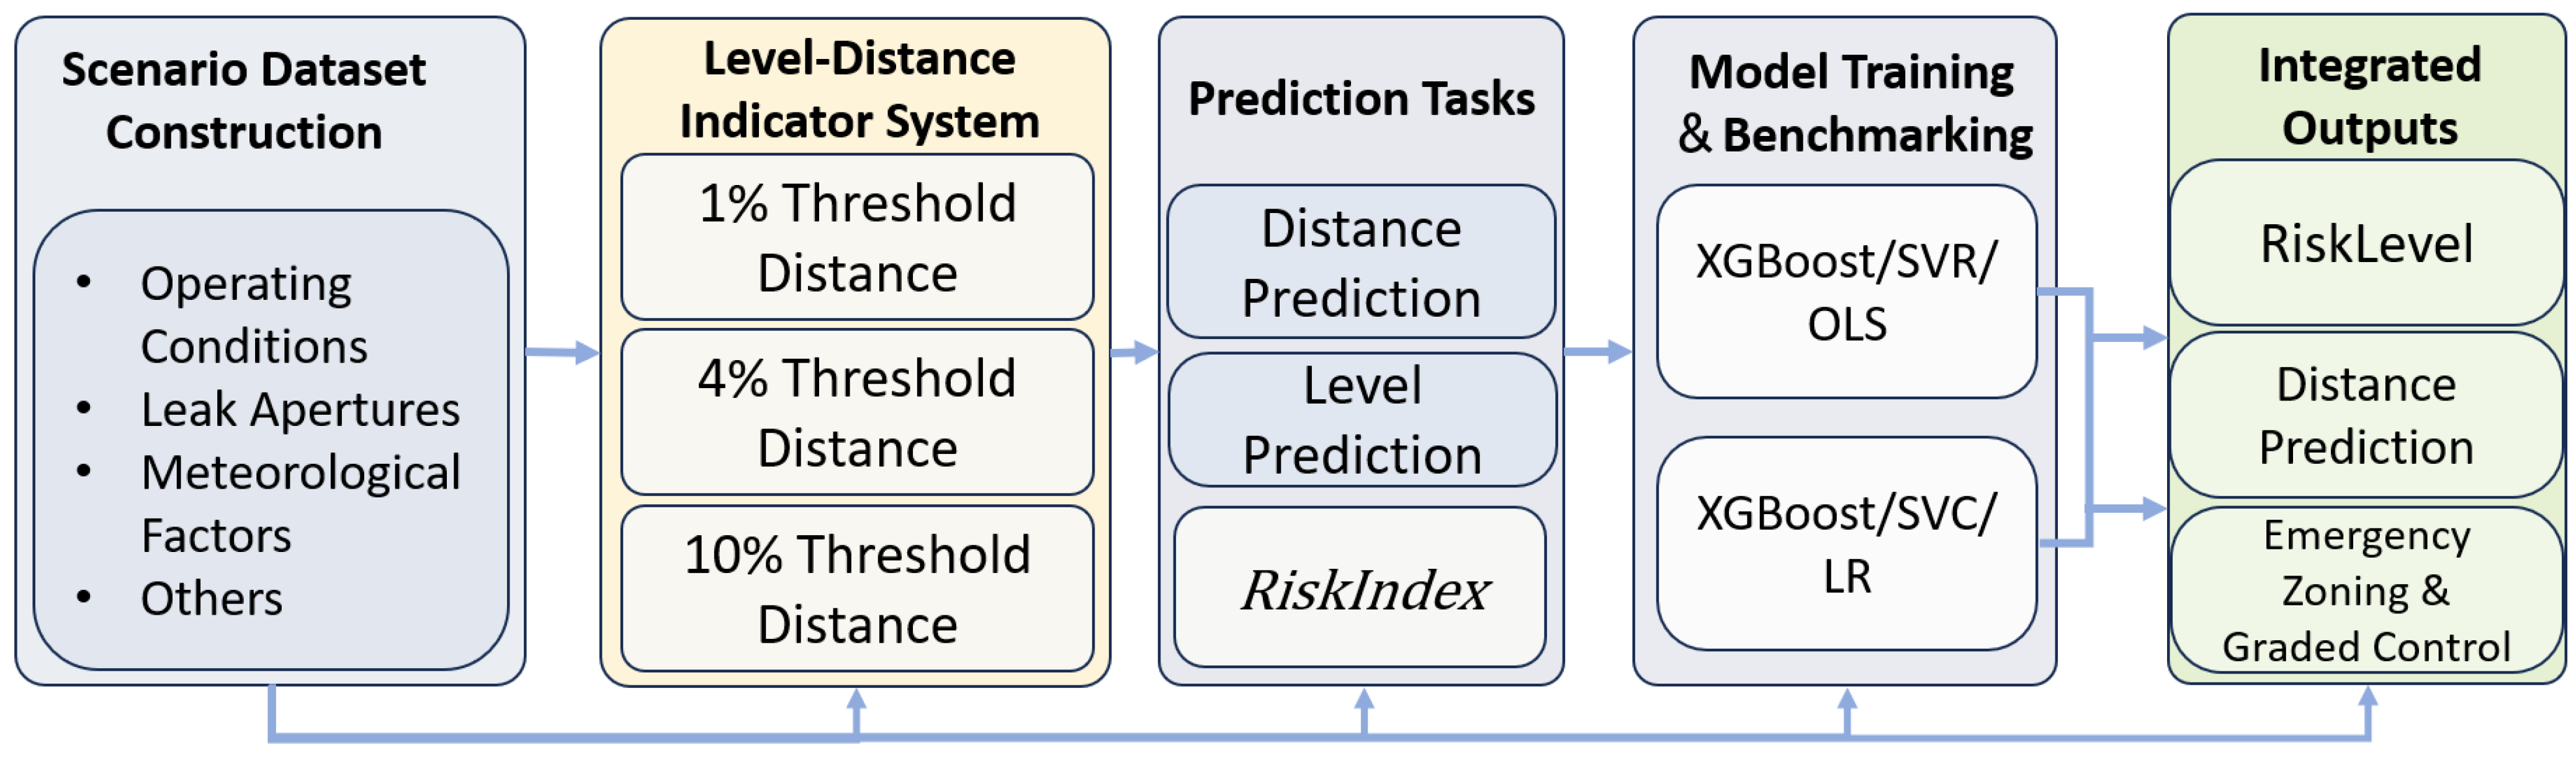
This study proposes an integrated emergency assessment workflow for CCUS CO2 pipeline leakage to generate synchronized outputs of risk level for graded response and warning distance/impact range for zoned delineation. First, a scenario library (N = 4320) with balanced coverage across key factor dimensions (phase state, leak aperture, operating conditions, and meteorological fields) is constructed within engineering-constrained ranges; the RiskLevel class distribution is not necessarily balanced. Second, for each scenario, the maximum downwind impact distances under CO2 volume-fraction thresholds of 1%/4%/10% (, , and ) are quantified as continuous consequence indicators. Third, R10% is discretized into a five-grade consequence intensity level, and a probability–consequence scoring scheme is employed to map scenarios into five RiskLevel classes under a unified rule set. Finally, the learning tasks are formulated as multi-class classification for RiskLevel and regression for (, , and ). XGBoost is adopted as the primary model and benchmarked against LR/SVC for classification and OLS/SVR for regression using a stratified train–test split and cross-validation. The overall methodological framework is illustrated in Figure 1.
Figure 1.
Assessment framework for CCUS CO2 pipeline leakage.
A distinctive feature of this workflow is the closed-loop coupling between “impact distance” and “risk level”. The proposed framework is intended as an engineering-oriented emergency screening method for the pipeline-transport segment of CCUS rather than a full-chain process model. Methodologically, the framework combines three established components widely reported in risk and safety analysis studies: (i) consequence-distance quantification for leakage scenarios, (ii) probability–consequence risk grading for management-oriented rapid decision support, and (iii) data-driven surrogate modeling for efficient multi-scenario inference. In the present study, these components are integrated under one explicit rule set so that threshold-distance calculation provides the consequence basis, probability–consequence mapping provides the grading logic, and machine learning models provide rapid prediction across large scenario libraries. Therefore, the contribution of this work lies in the integration and operationalization of these established approaches into a unified workflow for CCUS CO2 pipeline-leakage emergency screening. Its methodological basis follows a structured risk-management logic in which the selected techniques are matched to the decision context, available data, and intended use [46]. Accordingly, this study combines threshold-distance quantification with management-oriented risk-level mapping to generate synchronized outputs that are interpretable, auditable, and suitable for rapid multi-scenario screening. The engineering boundary and operational assumptions are therefore defined for the transport segment and for leakage consequence assessment, rather than for the full capture–transport–storage process [47]. Instead of deriving distance boundaries and level assignments from independent methodological systems, the RiskLevel label is generated through an explicit mapping of quantified consequence indicators together with management-oriented probability/exposure terms, thereby enabling auditable batch screening with consistent thresholds. This design supports rapid scenario inference while preserving interpretability for emergency zoning, graded control, and prioritization of response actions. For this reason, process variables associated with capture, utilization, or storage operations are not included in the present model, not because they were overlooked, but because they fall outside the decision boundary of transport-segment leakage emergency screening addressed in this study.
2.1. Construction of Scenario Dataset
The scenario dataset in this study was constructed under engineering boundary constraints to support the rapid prediction of both risk levels and warning ranges for CCUS CO2 pipeline leakage. The variable system was centered on operating conditions and transport-state characteristics, including inlet pressure, inlet temperature, and transportation phase state, while leak hole diameter, leak location, valve isolation time, and venting/emergency shut-off time were used to characterize source release and emergency response conditions. In addition, external-field variables, including wind speed, atmospheric stability, ambient temperature, and surface roughness, were introduced to reflect differences in near-ground dispersion and dilution of heavy gases. The input variables and their factor levels are listed in Table 1.
Table 1.
Input variables and factor levels of the scenario dataset.
It should be noted that wind speed, atmospheric stability, ambient temperature, and surface roughness were not fully crossed independently over their entire ranges. Instead, they were pre-combined into 12 representative environmental scenarios in order to control the sample size and avoid redundant combinations. As a result, the final scenario library was generated from 12 environmental scenarios, 3 transportation phase states, 3 leak hole diameter levels, 4 leak locations, 5 valve isolation times, and 2 venting/emergency shut-off times.
Existing experimental and numerical studies have shown that high-pressure CO2 leakage can form a significant downwind high-concentration impact area, and the determination of the safe distance needs to consider the amplification effect of the hole diameter and phase state on the dangerous distance. The scenario sample library constructed accordingly provides a unified data input foundation for subsequent model training and performance comparison. The constructed dataset covers the typical operating conditions of current CCUS pipelines and is consistent with the engineering parameters reported in the literature, thus ensuring the engineering representativeness of the samples.
2.2. Output Indicators and Task Definition
This study defines output indicators covering both impact range and risk level so as to achieve a consistent representation of “warning distance–risk level” for emergency response. For the impact range, the maximum impact distances under CO2 volume-fraction thresholds, , , and , are adopted as continuous consequence indicators. The consequence grading primarily relies on , because this threshold better represents the high-concentration core hazard zone and aligns with decision needs for emergency zoning and public protection distances. The three thresholds are retained simultaneously because they represent different severity bands of the consequence field, whereas R10% is used for primary grading because it is more directly associated with the core impact zone relevant to emergency isolation and protective-distance decisions. In accordance with relevant requirements on public protective distances and emergency zoning in the applicable standards [48], and in combination with typical risk thresholds for CO2 leakage consequences, is categorized into Levels 1–5 to obtain the consequence intensity level . This five-level discretization is introduced to keep the consequence term on the same ordinal scale as the probability-related terms in the subsequent probability–consequence scoring framework.
The construction of the risk-level label follows a two-dimensional “probability–consequence” scoring scheme with risk-matrix mapping. The probability dimension includes the baseline occurrence probability level and the control-barrier level . Specifically, is categorized into five grades (1–5) according to the leakage mode and segment-level environmental settings, while is determined by segmented isolation/mitigation time to reflect response efficiency. The consequence dimension includes the consequence severity level and the exposure/susceptibility level , where is mapped into five grades (1–5) based on population density and the type of sensitive targets. Accordingly, the scores are defined as follows:
And the five-class label is then generated via , thereby defining the learning tasks in this study as regression prediction of , , and , and classification prediction of , enabling synchronous and rapid outputs of both risk level and impact extent. The additive forms of and are used to combine the two contributing dimensions within the probability side and the consequence side, respectively, while the bounded formulation keeps both scores within the same five-grade range. The final RiskLevel is then generated from the product of and so that probability-related and consequence-related factors jointly determine the label under one explicit rule set, rather than being assigned independently.
The parameterization adopted here is rule-based rather than expert-elicited. Specifically, R10% is used as the primary consequence-grading indicator because it represents the high-concentration core impact zone most directly related to emergency isolation and protective-distance decisions, while R1% and R4% are retained as supplementary outputs for outer warning-zone interpretation. The five-grade mapping is used to maintain consistency with the management-oriented probability–consequence scoring structure adopted in this study. This design is intended to support reproducible batch screening under a unified rule set, rather than site-specific quantitative risk assessment for a single pipeline project. Because matrix-based screening tools and probabilistic/network-based methods serve different purposes and have different strengths, the present framework combines explicit grading rules with structured predictive modeling under a unified workflow [49,50].
2.3. Model Construction and Control Setup
This study adopts the XGBoost algorithm to construct a machine learning prediction model. Considering the differences in output types of different prediction tasks, classification models and regression models are built for comparative analysis.
In the risk-level prediction task, LR and SVC are selected as baseline models for linear and kernel methods and are compared with the XGBoost classification model. In the threshold impact distance prediction task, since the target variable is continuous, OLS and SVR are selected as baseline regression models, and an XGBoost regression model is constructed for comparison.
In both types of tasks, all models adopt the same data partitioning method, and hyperparameter tuning is performed based on five-fold cross-validation to ensure the fairness and stability of the model comparison results.
2.4. Evaluation Metrics
To assess the generalization ability of the model on unseen scenarios and avoid information leakage during the training phase, this study divides the scenario database into a training set and a test set at a ratio of 70%/30%, as shown in Table 2. This split is used to reserve an independent out-of-sample test set while maintaining sufficient training samples for model fitting and hyperparameter selection. A stratified sampling method based on risk levels is adopted to ensure that the proportion of each risk level in both the training set and the test set is consistent with that in the entire database. This treatment is necessary because the high-risk classes account for a relatively small proportion of the total samples, and unstratified splitting may lead to unstable evaluation results for these classes. This ensures that the test results can truly reflect the model’s ability to identify a small number of high-risk samples.
Table 2.
Dataset partitioning table.
For the classification task, the XGBoost model is used as the main model, with LR and SVC set as comparative baselines. During the training phase, k-fold cross-validation is adopted on the stratified sampled training set to determine the optimal hyperparameters.
The performance of the classification models is intuitively verified through confusion matrices and comprehensively evaluated using accuracy, precision, recall, and F1-score. The confusion matrix is used to show not only whether a sample is correctly classified, but also where misclassification occurs across risk levels. Accuracy is used to measure overall correctness, whereas precision, recall, and F1-score are used to reflect class-wise identification performance, especially for the minority high-risk classes. Given a total of n samples, where the true label is , and the predicted label is , the accuracy is defined as follows:
For class c, let the true positive (TP), false positive (FP), and false negative (FN) be denoted as and , respectively. The corresponding formulas are as follows:
For multiclass classification, overall performance can be summarized using macro-, micro-, and weighted-averaging schemes. Macro-averaging assigns equal weight to each class; micro-averaging aggregates true positives, false positives, and false negatives over all classes before metric calculation, and weighted-averaging computes the class-wise metrics according to class support. In this study, macro-averaged precision, recall, and F1-score are reported in the main text because they better reflect balanced performance across different risk levels:
The regression task is designed to predict the threshold impact distance. In this study, MAE and are adopted as evaluation metrics. MAE is adopted because it directly reflects the absolute prediction error in physical distance units, whereas R2 is used to describe the overall goodness of fit between predicted and observed distances. Accordingly, the effectiveness and reliability of the proposed framework are evaluated through independent test-set validation, stratified sampling for rare high-risk classes, cross-validation-based model selection, and baseline-model comparison under the same rule set. Their calculation formulas are as follows:
where represents the true value, denotes the predicted value, and is the mean of the true values. MAE is used to characterize the average level of prediction errors, with a smaller value indicating a lower prediction bias. is employed to measure the model’s ability to explain the variance of the target variable, and a value closer to 1 means a better fitting degree.
To facilitate reproducibility, the implementation sequence of the proposed framework is summarized as follows: First, the system boundary is defined as emergency screening for CO2 leakage scenarios in the pipeline-transport segment of CCUS. Second, a scenario library is generated within the parameter ranges and factor combinations specified in Table 1. Third, the three threshold impact distances (R1%, R4%, and R10%) are calculated for each scenario as continuous consequence indicators. Fourth, the R10% value is discretized into a five-level consequence indicator . Fifth, the probability-related and exposure-related factors are combined according to the explicit grading rules defined in Section 2.2 to calculate , , and the composite , which determines the five-class RiskLevel label. Sixth, the resulting dataset is partitioned into training and testing subsets using stratified 70%/30% splitting. Finally, the XGBoost model and baseline algorithms are trained and evaluated under the same partition and metric system. This procedure allows other researchers to reconstruct the workflow using newly defined scenario libraries under comparable engineering boundaries.
3. Results
3.1. Model Validity for Dual Outputs
For the classification task, XGBoost is used as the primary model, with LR and SVC selected as comparative baselines. LR is employed to characterize the lower-bound performance of “linear separability”, while SVC is used to verify the learning ability of traditional nonlinear classification boundaries.
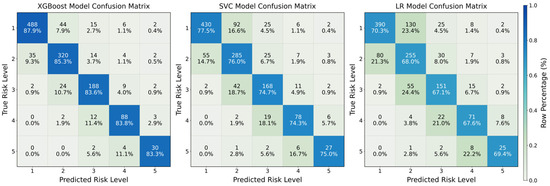
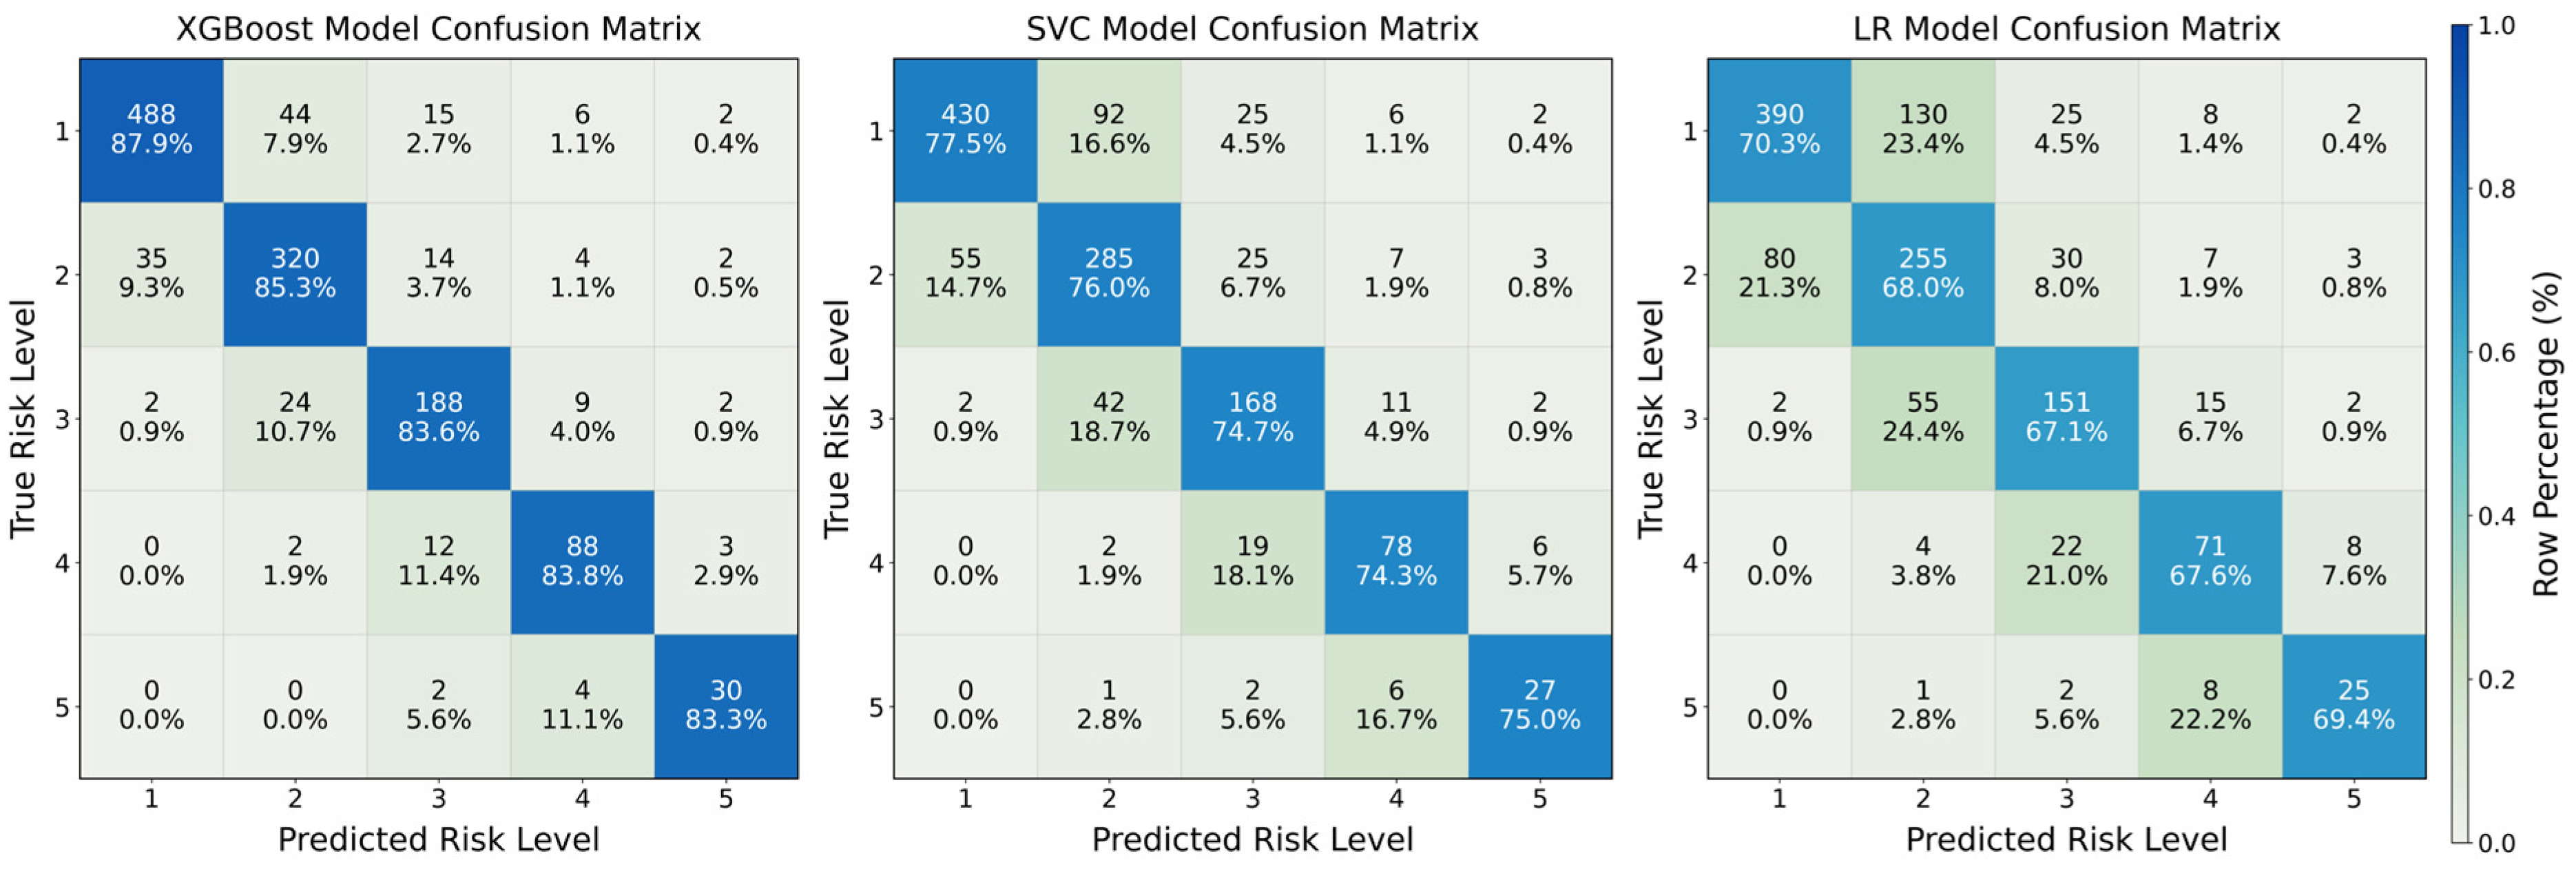
Figure 2 presents the confusion matrices of the three classification models on the test set. In the confusion matrix, the rows represent the true classes and the columns represent the predicted classes; the diagonal cells indicate correctly classified samples, whereas the off-diagonal cells indicate misclassifications. Structurally, XGBoost exhibits a higher concentration along the diagonal and demonstrates stronger recall capability for high-risk levels. In addition, most classification errors are concentrated between adjacent risk levels rather than between distant levels, indicating that the model preserves the ordinal structure of risk grading to a certain extent. Compared with LR and SVC, XGBoost significantly reduces the miss rate of misclassifying high-risk cases as low-risk. Table 3 further quantitatively validates the above conclusions using accuracy, macro-averaged precision/recall/F1, and the recall of the high-risk classes (RiskLevel 4–5), denoted as recall (4–5).
Figure 2.
Confusion matrix results of various prediction models.
Table 3.
Comparison of evaluation metrics for machine learning classification models.
The regression results for the threshold impact distance are presented in Table 4. The XGBoost model constructs the regression objective based on the squared error loss function and is used to predict multi-threshold impact distances. The results show that, compared with the OLS and SVR baseline models, XGBoost achieves better performance in both MAE and metrics. This indicates that the ensemble model based on the gradient-boosted tree structure can effectively characterize the nonlinear interactive relationships among variables such as hole diameter, phase state, wind speed, and atmospheric stability, thereby improving the prediction accuracy of the impact distance.
Table 4.
Performance comparison of regression models for predicting multi-threshold impact distances.
3.2. Joint Characterization and Regularity Analysis of Risk Level and Impact Range
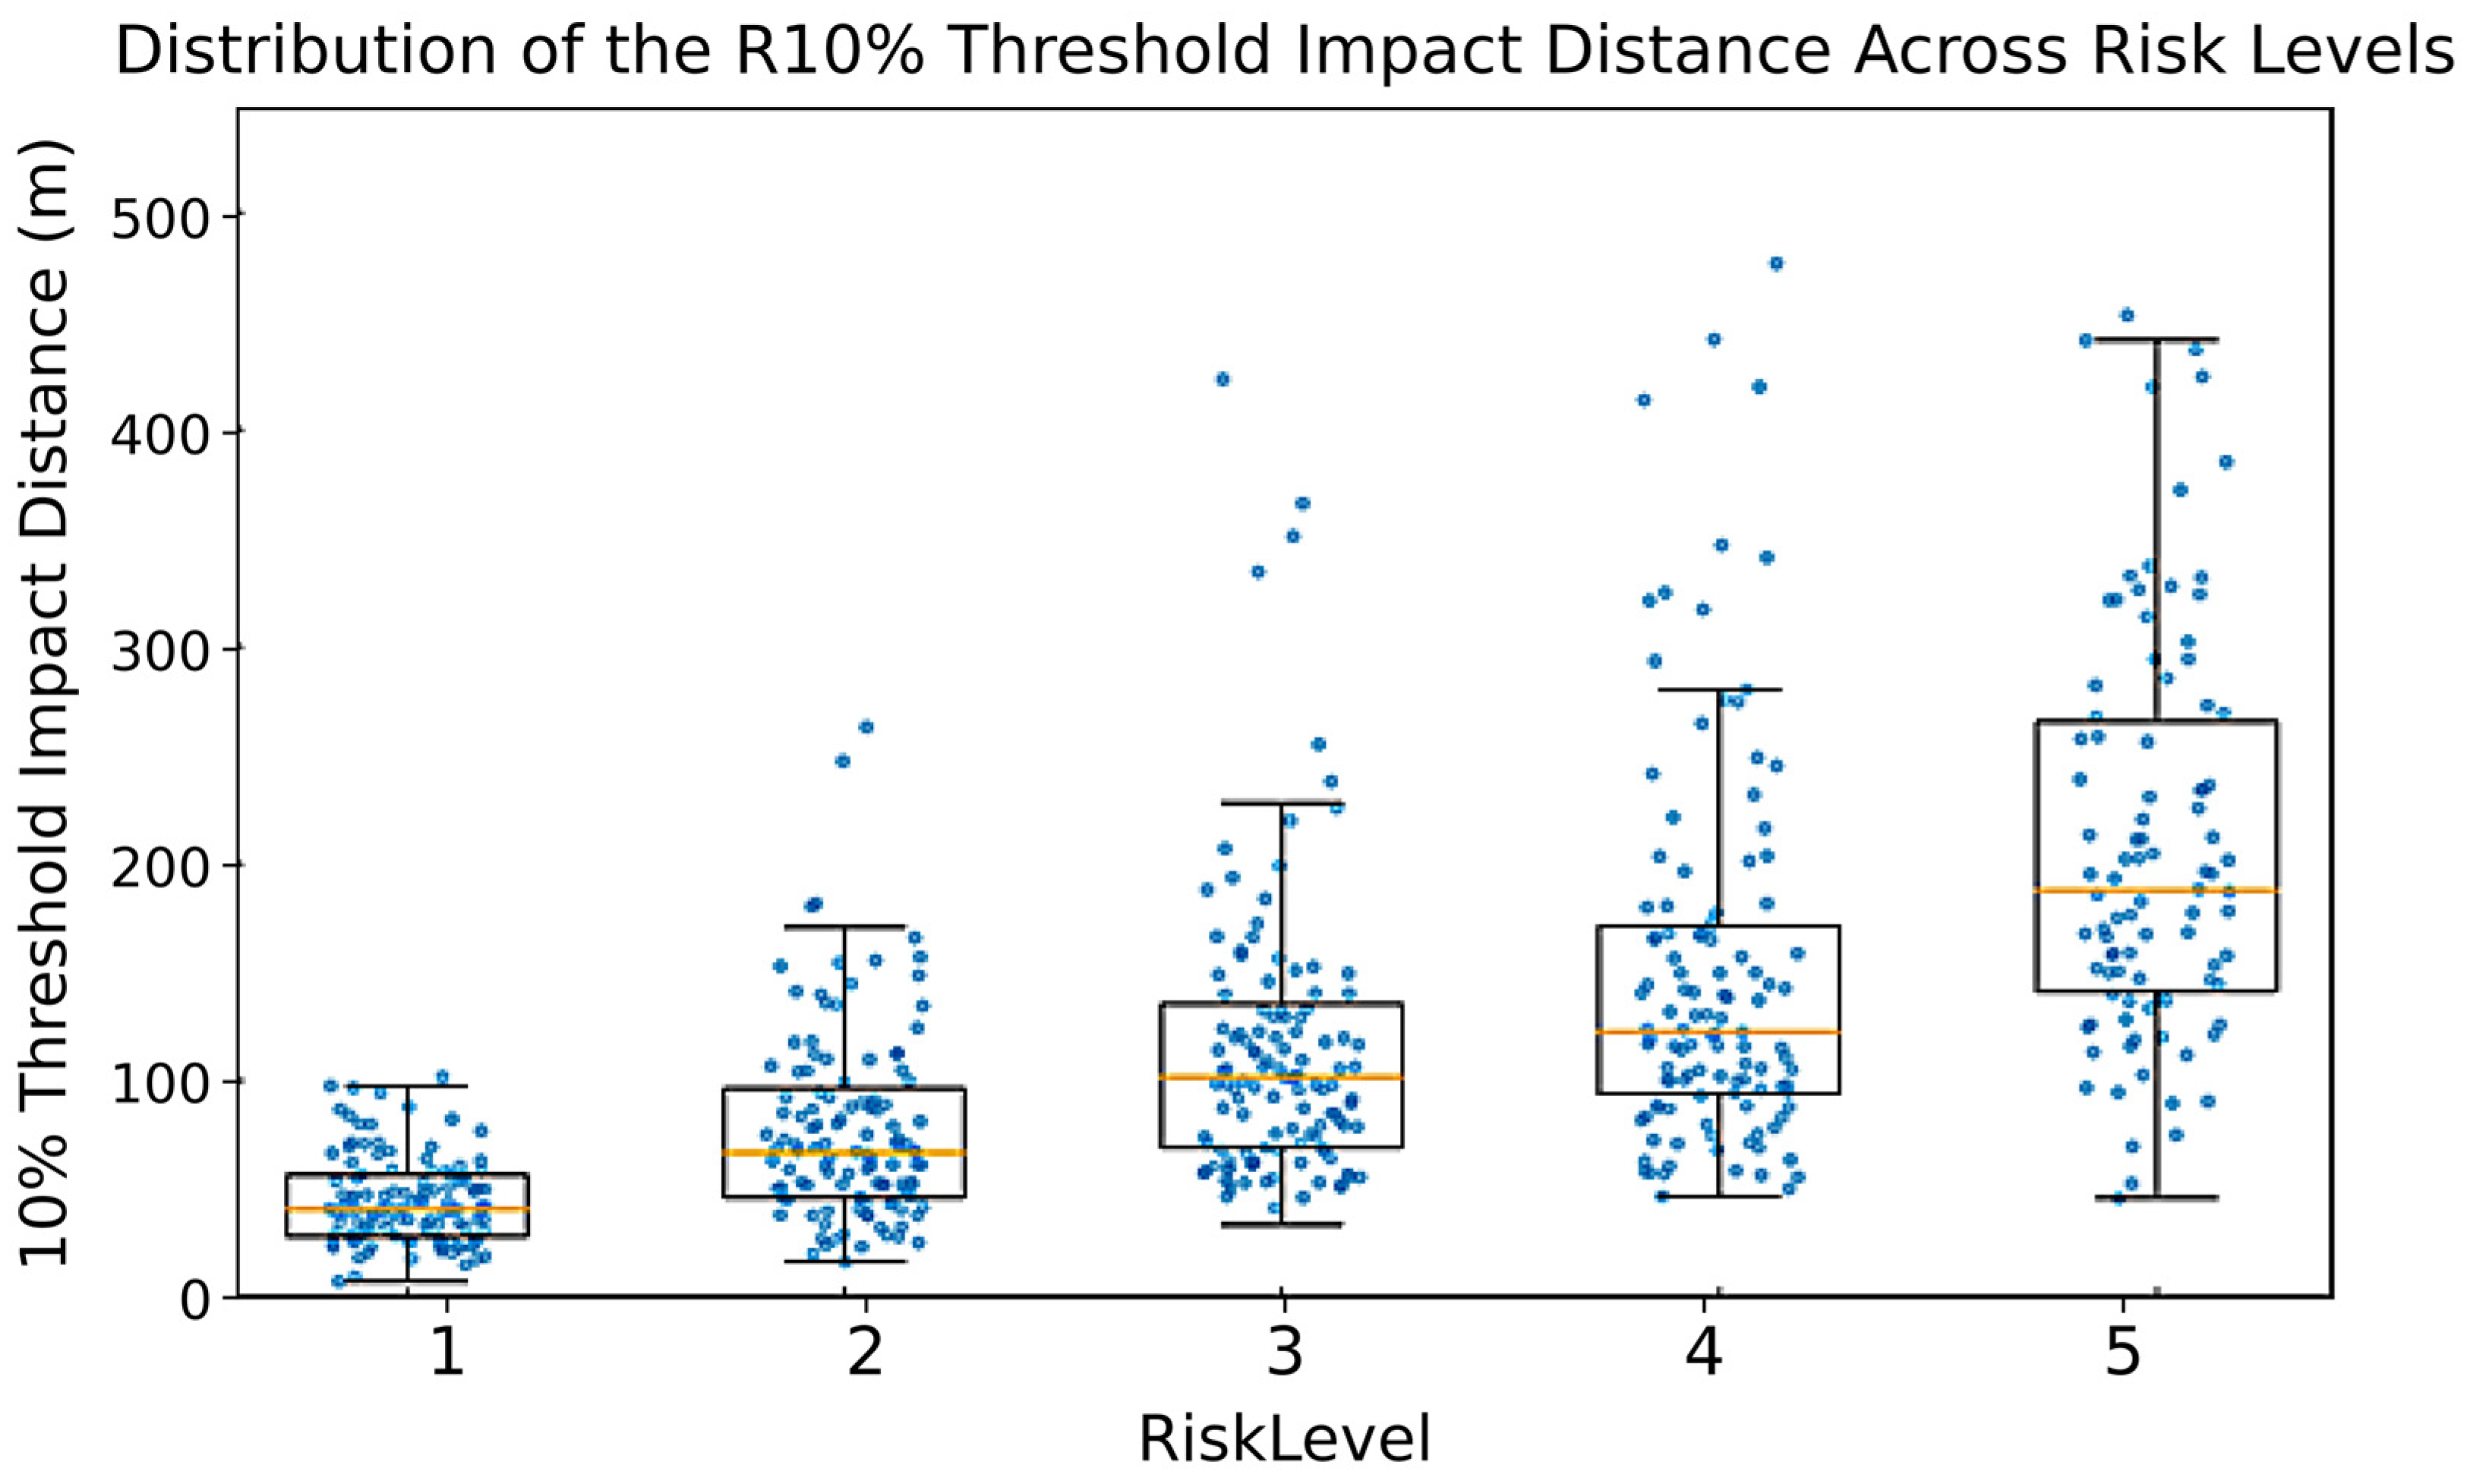
To convert the “risk level” into an operable spatial control scale and verify the consistency between labels and consequence indicators, this study conducts a joint characterization of the threshold impact distance under different risk levels from the perspective of statistical distribution. is used to perform grouped statistics on the threshold impact distance of the entire sample across all risk levels, from which the corresponding “level-range” regularity can be derived. This provides an intuitive basis for the determination of emergency zoning and protection distance.
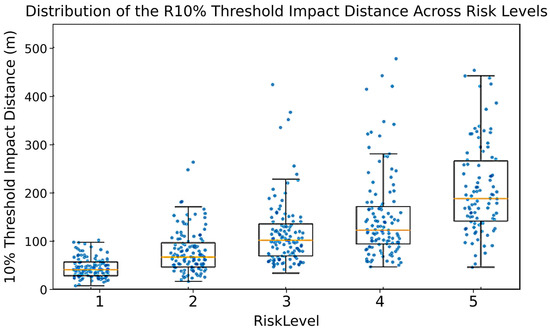
Figure 3 presents the box-scatter joint distribution of and the threshold impact distance. Overall, exhibits an obvious monotonically increasing trend with the rise of risk level: the values of low-level samples are mostly concentrated in a relatively narrow interval, while for high-level samples, not only does the median increase significantly, but the distribution dispersion also expands synchronously. This means that as the risk level rises, the impact range not only expands as a whole but also tends to form long-tail consequences under the combination of adverse meteorological and source term conditions, such as larger hole diameters, light wind, and more stable atmospheric stratification, thus widening the fluctuation of impact distance within the same risk level. At the same time, there is a certain interval overlap between different risk levels: a small number of outliers with relatively large values can be observed in the medium and low levels, while some samples with relatively small values also exist at high levels. This phenomenon reflects that is not determined by a single consequence indicator but a graded result obtained by comprehensively integrating factors such as the probability side and the exposure side.
Figure 3.
Risk level and the distribution of the threshold impact distance.
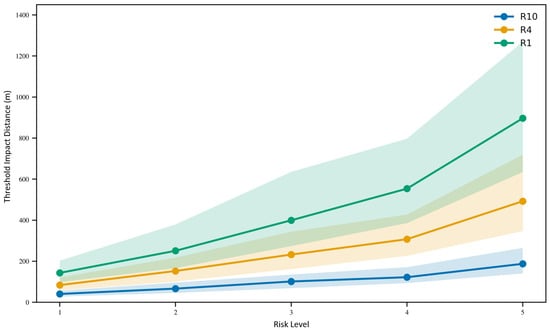
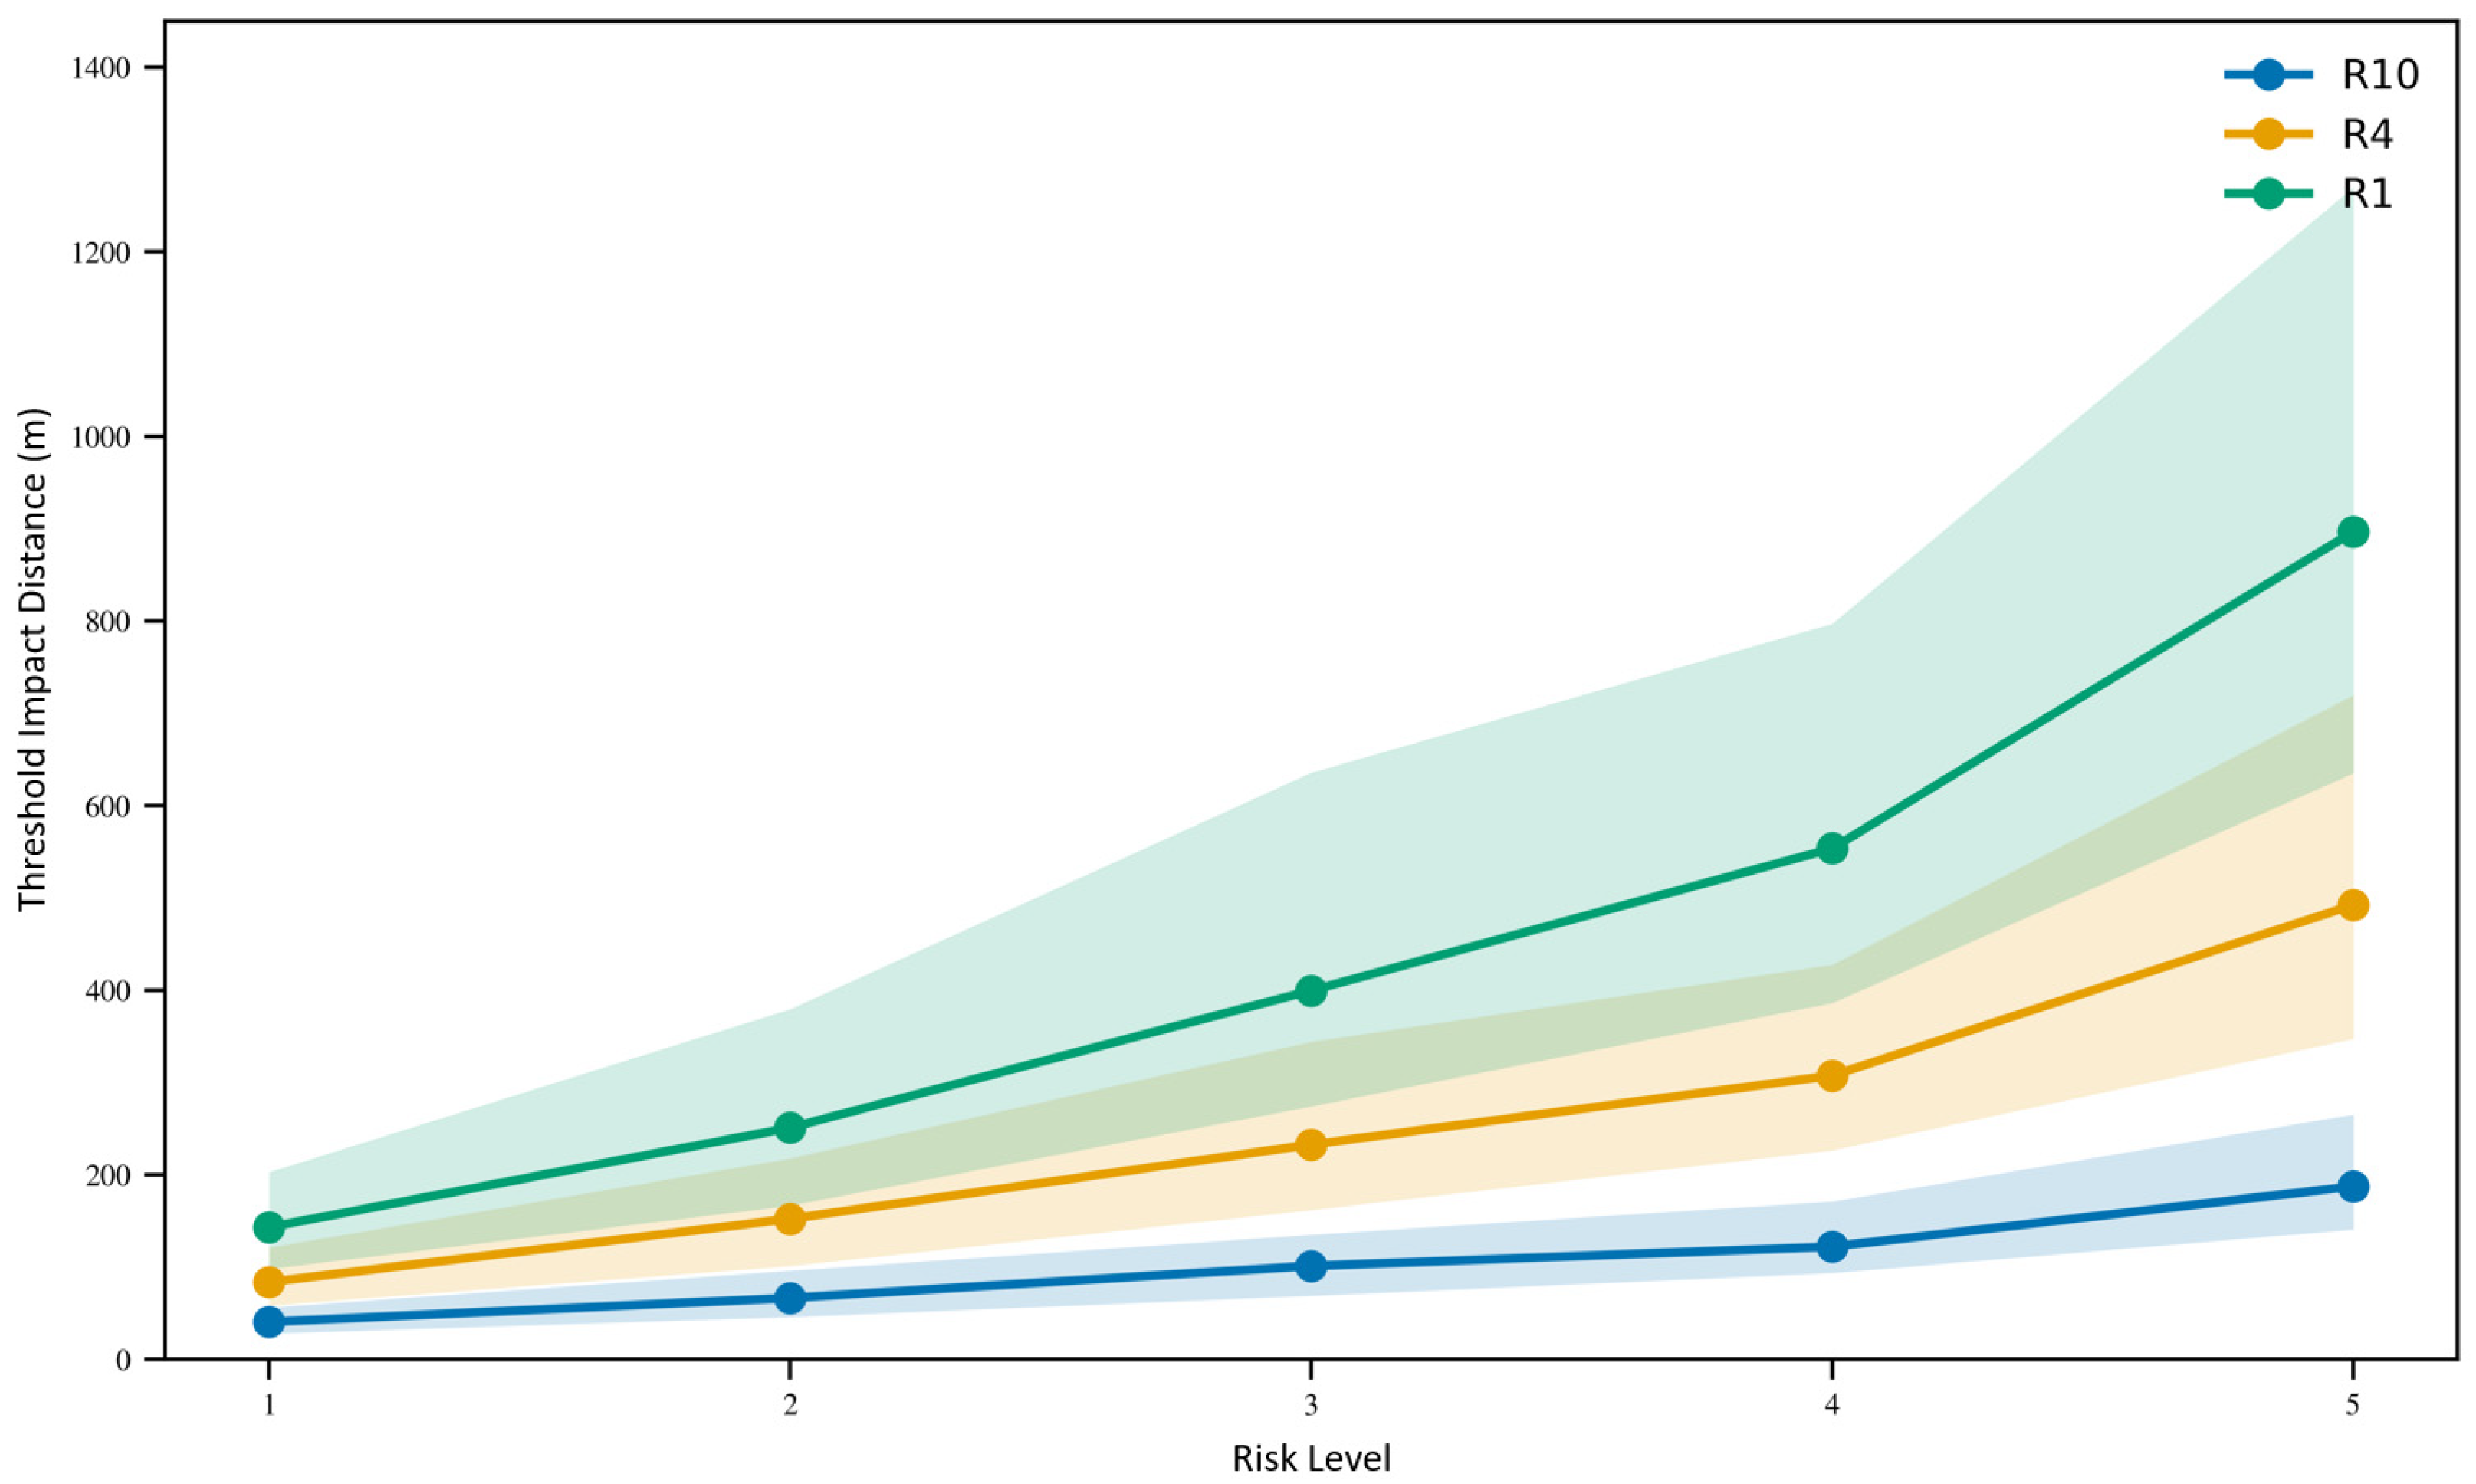
Figure 4 further presents the statistical intervals and central tendencies of three types of threshold impact distances, , and , under different risk levels. The results show that > > holds for any given risk level, which indicates that a lower threshold corresponds to a farther outward impact boundary. Meanwhile, the three curves shift upward overall with the increase in risk level, and the interval bands expand significantly at high risk levels. This indicates that the far-field boundary is more sensitive to external diffusion conditions, with greater uncertainty in high-risk scenarios. This regularity can directly support graded emergency response and spatial control: is used to characterize the near-field core impact range with high concentration, for the intermediate transition range, and for the peripheral warning boundary, thus forming a multi-circle distance output of “core–buffer–periphery”. For a given risk level, statistical measures such as the median or upper quartile can be further adopted as the recommended distance to achieve a balance between robustness and conservatism.
Figure 4.
Statistical trends of multi-threshold impact distances across risk levels.
To further interpret the observation that higher is associated with an overall upward shift in impact distances and greater dispersion at high levels, and to identify the dominant drivers of level transitions and long-tailed distance distributions, the next section conducts a feature-importance analysis. The results are interpreted along the dimensions of source strength, phase/operating conditions, and meteorological dilution, providing a prioritized set of key variables for rapid emergency screening.
3.3. Ranking of Key Factor Importance
This section performs a feature-importance analysis based on the trained models to identify input variables that contribute most to the prediction of and /, and to provide an engineering interpretation of the statistical patterns observed in the previous section. The analysis not only offers driver evidence for the coupling between risk level and impact distance but also yields an actionable ranking of variables to support parameter acquisition, monitoring prioritization, and control strategies in emergency-response scenarios.
The importance calculation is based on the Gain metric of XGBoost, which refers to the sum of the objective function improvement brought by a feature in all tree splits. Compared with Cover and Weight, Gain better reflects the stability of global contributions and is suitable for explaining the overall impact of variables on prediction results. The sum of the objective function improvement brought by feature in all tree splits is defined as , and the relative importance is obtained through normalization:
Table 5 presents the Top 10 key features and their relative importance. The results show that the leak hole has the highest contribution, which directly determines the effective discharge area and source term intensity and is the primary driver affecting the threshold impact distance and risk level. Phase state and inlet pressure rank next; they jointly constrain the density, compressibility, and phase change path, thereby altering the characteristics of jet cooling and heavy gas ground-hugging diffusion. Wind and atmospheric stability reflect the external dilution capacity: an increase in wind speed generally accelerates mixing and dilution and shortens the isopleth distance, while an increase in stability suppresses turbulent mixing and expands the high-concentration impact range. Inlet mass flow and valve isolation time jointly characterize the “release amount” dimension: for a given hole diameter and operating condition, a higher flow rate or slower isolation leads to a larger total release amount, making it more likely for the consequence level to rise. Population density ranks among the Top 10, indicating that is not only driven by physical consequences but also explicitly incorporates the influence of exposure terms on grade determination. Although surface roughness and ambient temperature have relatively low importance, they produce cumulative effects near the surface layer shear and phase boundary, which can explain the prediction differences in some boundary scenarios.
Table 5.
Key characteristics and their relative importance.
3.4. Coupling Mechanisms Between Impact Range and Risk Level and Analysis of Key Driving Factors
and / exhibit a consistent upward shift, yet they are not in a one-to-one correspondence. In addition to consequence magnitude, the generation of is influenced by probability-related factors and exposure terms. Therefore, level differences may still occur when impact distances are similar, resulting in overlapping distance intervals across different risk levels. Combined with the feature-importance results, the driving mechanisms can be summarized into three categories. First, source-strength-related variables (e.g., leak aperture and release intensity/duration) determine the fundamental scale of the impact range and are the primary causes of long-distance outliers and the long-tailed distributions observed at high risk levels. Second, operating-condition variables such as phase state and pressure alter near-ground dispersion and accumulation characteristics, leading to substantial differences in both distance and level even under the same aperture. Third, meteorological dilution conditions, including wind speed and atmospheric stability, are more sensitive to the far-field boundary and tend to amplify the dispersion of R1% under high-risk scenarios. Based on these coupling relationships, impact distance is more suitable for defining warning zones and spatial partition boundaries, whereas is more suitable for prioritizing response actions across multiple scenarios. In practical applications, priority should be given to acquiring aperture/source-strength variables, phase and pressure parameters, and key meteorological inputs; under combinations of “high source strength and unfavorable dilution,” more conservative distance recommendations should be adopted to enhance the robustness of emergency decision-making.
4. Conclusions
This study developed a closed-loop “threshold impact-distance calculation–risk-matrix mapping” approach for CCUS CO2 pipeline leakage, aiming to couple warning range outputs with management-oriented risk levels under a unified rule set. Based on a scenario library of 4320 cases spanning phase state, leak aperture, operating conditions, and meteorological fields, three threshold impact distances (R1%, R4%, and R10% under 1%/4%/10% CO2 volume-fraction criteria) were quantified and mapped to a five-class RiskLevel, forming a traceable “level–range” coupled output system.
Model evaluations with a stratified 70%/30% train–test split and baseline comparisons indicate that XGBoost provides robust performance for both tasks, achieving 0.806 accuracy, 0.825 macro-F1, and a high-risk-class recall of 0.631 (RiskLevel 4–5) for RiskLevel classification and MAEs of 95/62/41 m for R1%/R4%/R10% regression with R2 values of 0.795–0.814, outperforming the LR/SVC baselines for classification and the OLS/SVR baselines for regression. The statistical patterns further show that threshold impact distances increase with RiskLevel, while higher levels exhibit substantially greater dispersion, implying long-tailed consequences under adverse source and dispersion conditions. These findings support using RiskLevel to prioritize graded response while leveraging multi-threshold distance rings to delineate spatial warning boundaries, thereby improving the coordination and robustness of graded control and zoned warning in emergency applications. The reliability demonstrated in this study refers to reliability within the defined application boundary, namely, emergency screening of CO2 pipeline-leakage scenarios in the CCUS transport segment. This reliability is supported by explicit rule definitions, engineering-constrained scenario construction, stratified out-of-sample testing, cross-validation-based model selection, and baseline-model comparison. Formal structured expert review and cross-project external validation would further strengthen the transferability of the framework and may be pursued in future applications. Future work should incorporate external engineering case validation and structured expert review to further test the robustness and transferability of the adopted parameterization and grading rules.
Author Contributions
Conceptualization, H.Z. and F.W.; methodology, H.Z. and F.W.; software, S.W.; validation, H.Z.; formal analysis, F.W.; resources, X.J.; data curation, H.Z.; writing—original draft preparation, H.Z.; writing—review and editing, X.J. and F.W.; visualization, S.W.; supervision, F.W.; project administration, X.J.; funding acquisition, X.J. All authors have read and agreed to the published version of the manuscript.
Funding
The authors would like to thank the financial support provided by the National Natural Science Foundation of China (52270184).
Institutional Review Board Statement
Not applicable.
Informed Consent Statement
Not applicable.
Data Availability Statement
The data used in this work are available upon reasonable request addressed to the corresponding author.
Conflicts of Interest
The authors declare no conflicts of interest.
References
- Tong, S.; Bambrick, H.; Shi, X.; Pascal, M.; Prior, J.; Lavigne, E. Accelerating Clean Energy Transitions to Safeguard Human Health and Survival. Environ. Health 2024, 3, 114–117. [Google Scholar] [CrossRef] [Scilit]
- Song, D.; Jiang, T.; Rao, C. Review of Policy Framework for the Development of Carbon Capture, Utilization and Storage in China. Int. J. Environ. Res. Public Health 2022, 19, 16853. [Google Scholar] [CrossRef] [Scilit]
- Gunawan, T.A.; Gittoes, L.; Isaac, C.; Greig, C.; Larson, E. Design Insights for Industrial CO2 Capture, Transport, and Storage Systems. Environ. Sci. Technol. 2024, 58, 14608–14617. [Google Scholar] [CrossRef] [Scilit]
- Edwards, R.W.J.; Celia, M.A. Infrastructure to Enable Deployment of Carbon Capture, Utilization, and Storage in the United States. Proc. Natl. Acad. Sci. USA 2018, 115, E8815–E8824. [Google Scholar] [CrossRef] [Scilit]
- Velasco-Lozano, M.; Ma, Z.; Chen, B.; Pawar, R. Optimizing Large-Scale CO2 Pipeline Networks Using a Geospatial Splitting Approach. J. Environ. Manag. 2024, 370, 122522. [Google Scholar] [CrossRef] [Scilit] [PubMed]
- Koornneef, J.; Spruijt, M.; Molag, M.; Ramírez, A.; Turkenburg, W.; Faaij, A. Quantitative Risk Assessment of CO2 Transport by Pipelines—A Review of Uncertainties and Their Impacts. J. Hazard. Mater. 2010, 177, 12–27. [Google Scholar] [CrossRef] [Scilit]
- Wang, H.; Liu, B.; Liu, X.; Lu, C.; Deng, J.; You, Z. Dispersion of Carbon Dioxide Released from Buried High-Pressure Pipeline over Complex Terrain. Environ. Sci. Pollut. Res. Int. 2021, 28, 6635–6648. [Google Scholar] [CrossRef] [Scilit]
- Li, Z.; Liu, B.; Gao, Y.; Liu, X.; You, Z.; Han, P. A CFD Study of the Effects of Combined Impurities, Ground Temperature, and Topography upon the Consequence Distances and Plume Shapes Generated by CO2 Release from CCS Pipeline Failure. Environ. Sci. Pollut. Res. Int. 2023, 30, 31835–31850. [Google Scholar] [CrossRef] [Scilit] [PubMed]
- Mack, A.; Spruijt, M.P.N. Validation of Open Foam for Heavy Gas Dispersion Applications. J. Hazard. Mater. 2013, 262, 504–516. [Google Scholar] [CrossRef] [Scilit] [PubMed]
- Xing, J.; Liu, Z.; Huang, P.; Feng, C.; Zhou, Y.; Zhang, D.; Wang, F. Experimental and Numerical Study of the Dispersion of Carbon Dioxide Plume. J. Hazard. Mater. 2013, 256–257, 40–48. [Google Scholar] [CrossRef] [Scilit]
- Langford, N.J. Carbon Dioxide Poisoning. Toxicol. Rev. 2005, 24, 229–235. [Google Scholar] [CrossRef] [Scilit] [PubMed]
- Lee, H.E.; Kim, M.-G.; Yoon, S.J.; Huh, D.-A.; Moon, K.-W. Changes in Risk in Medium Business Plating and Paint Manufacturing Plants following the Revision of the Korean Chemical Accident Prevention System. Int. J. Environ. Res. Public Health 2021, 18, 11982. [Google Scholar] [CrossRef] [Scilit] [PubMed]
- Kim, M.; Cho, G.-H. Influence of Evacuation Policy on Clearance Time under Large-Scale Chemical Accident: An Agent-Based Modeling. Int. J. Environ. Res. Public Health 2020, 17, 9442. [Google Scholar] [CrossRef] [Scilit]
- Lu, Y.; Wang, T.; Liu, T. Bayesian Network-Based Risk Analysis of Chemical Plant Explosion Accidents. Int. J. Environ. Res. Public Health 2020, 17, 5364. [Google Scholar] [CrossRef] [Scilit]
- Su, M.; Wei, L.; Zhou, S.; Yang, G.; Wang, R.; Duo, Y.; Chen, S.; Sun, M.; Li, J.; Kong, X. Study on Dynamic Probability and Quantitative Risk Calculation Method of Domino Accident in Pool Fire in Chemical Storage Tank Area. Int. J. Environ. Res. Public Health 2022, 19, 16483. [Google Scholar] [CrossRef] [Scilit]
- Jiang, W.; Huang, Z.; Wu, Z.; Su, H.; Zhou, X. Quantitative Study on Human Error in Emergency Activities of Road Transportation Leakage Accidents of Hazardous Chemicals. Int. J. Environ. Res. Public Health 2022, 19, 14662. [Google Scholar] [CrossRef] [Scilit]
- Lee, H.E.; Sohn, J.-R.; Byeon, S.-H.; Yoon, S.J.; Moon, K.W. Alternative Risk Assessment for Dangerous Chemicals in South Korea Regulation: Comparing Three Modeling Programs. Int. J. Environ. Res. Public Health 2018, 15, 1600. [Google Scholar] [CrossRef] [Scilit]
- Lee, H.E.; Yoon, S.J.; Sohn, J.-R.; Huh, D.-A.; Jang, S.-W.; Moon, K.W. Suitability Assessment of Legal Regulation of Chemical Concentrations According to Vapor Pressure and Damage Radius. Int. J. Environ. Res. Public Health 2019, 16, 347. [Google Scholar] [CrossRef] [Scilit] [PubMed]
- Lee, H.E.; Yoon, S.J.; Sohn, J.-R.; Huh, D.-A.; Lee, B.W.; Moon, K.W. Flammable Substances in Korea Considering the Domino Effect: Assessment of Safety Distance. Int. J. Environ. Res. Public Health 2019, 16, 969. [Google Scholar] [CrossRef] [Scilit]
- Choi, J.-Y.; Byeon, S.-H. Case Study: Safety Assessment of Plant Layout between Ethylene Storage Tanks and Process Equipment According to Capacity and Weather Conditions. Int. J. Environ. Res. Public Health 2020, 17, 2849. [Google Scholar] [CrossRef] [Scilit]
- Bondžić, J.; Sremački, M.; Popov, S.; Mihajlović, I.; Vujić, B.; Petrović, M. Exposure to Hazmat Road Accidents—Toxic Release Simulation and GIS-Based Assessment Method. J. Environ. Manag. 2021, 293, 112941. [Google Scholar] [CrossRef] [Scilit]
- Ortega Montoya, C.Y.; López-Pérez, A.O.; Ugalde Monzalvo, M.; Ruvalcaba Sánchez, M.L.G. Multidimensional Urban Exposure Analysis of Industrial Chemical Risk Scenarios in Mexican Metropolitan Areas. Int. J. Environ. Res. Public Health 2021, 18, 5674. [Google Scholar] [CrossRef] [Scilit]
- Ahn, M.S.; Lee, H.E.; Cheon, K.S.; Joo, H.G.; Ochang Chemical Safety Community; Son, B.-S. Feasibility Evaluation of Designated Quantities for Chemicals Requiring Preparation for Accidents in the Korean Chemical Accident Prevention System. Int. J. Environ. Res. Public Health 2020, 17, 1927. [Google Scholar] [CrossRef] [Scilit]
- Su, X.; Qin, L.; Liao, Z.; Han, J. Numerical Simulation and Risk Assessment of Toluene Tank Leakage in Petrochemical Industries, China. Environ. Sci. Pollut. Res. Int. 2024, 31, 62745–62760. [Google Scholar] [CrossRef] [Scilit]
- Zhang, W.; Cheng, W.; Gai, W. Hazardous Chemicals Road Transportation Accidents and the Corresponding Evacuation Events from 2012 to 2020 in China: A Review. Int. J. Environ. Res. Public Health 2022, 19, 15182. [Google Scholar] [CrossRef] [Scilit]
- Pouyakian, M.; Ashouri, M.; Eidani, S.; Fallah Madvari, R.; Laal, F. A Systematic Review of Consequence Modeling Studies of the Process Accidents in Iran from 2006 to 2022. Heliyon 2023, 9, e13550. [Google Scholar] [CrossRef] [Scilit] [PubMed]
- Anjana, N.S.; Amarnath, A.; Harindranathan Nair, M.V. Toxic Hazards of Ammonia Release and Population Vulnerability Assessment Using Geographical Information System. J. Environ. Manag. 2018, 210, 201–209. [Google Scholar] [CrossRef] [Scilit]
- Barjoee, S.S.; Elmi, M.R.; Talebi Varaoon, V.; Keykhosravi, S.S.; Karimi, F. Hazards of Toluene Storage Tanks in a Petrochemical Plant: Modeling Effects, Consequence Analysis, and Comparison of Two Modeling Programs. Environ. Sci. Pollut. Res. Int. 2022, 29, 4587–4615. [Google Scholar] [CrossRef] [Scilit] [PubMed]
- Xin, B.; Yu, J.; Dang, W.; Wan, L. Dynamic Characteristics of Chlorine Dispersion Process and Quantitative Risk Assessment of Pollution Hazard. Environ. Sci. Pollut. Res. Int. 2021, 28, 46161–46175. [Google Scholar] [CrossRef] [Scilit]
- Wai, K.-M.; Yu, P.K.N. Application of a Machine Learning Method for Prediction of Urban Neighborhood-Scale Air Pollution. Int. J. Environ. Res. Public Health 2023, 20, 2412. [Google Scholar] [CrossRef] [Scilit] [PubMed]
- Wang, Y.; Luo, Z.; Luo, J. A hybrid deep learning model for predicting diffusion of toxic heavy gas sulfur dioxide and balancing precision and time efficiency. Sci. Total Environ. 2023, 901, 166506. [Google Scholar] [CrossRef] [Scilit] [PubMed]
- Wang, R.; Chen, B.; Qiu, S.; Zhu, Z.; Wang, Y.; Wang, Y.; Qiu, X. Comparison of Machine Learning Models for Hazardous Gas Dispersion Prediction in Field Cases. Int. J. Environ. Res. Public Health 2018, 15, 1450. [Google Scholar] [CrossRef] [Scilit] [PubMed]
- Sutherland, H.; Recchia, G.; Dryhurst, S.; Freeman, A.L.J. How People Understand Risk Matrices, and How Matrix Design Can Improve their Use: Findings from Randomized Controlled Studies. Risk Anal. 2022, 42, 1023–1041. [Google Scholar] [CrossRef] [Scilit] [PubMed]
- Jensen, R.C.; Bird, R.L.; Nichols, B.W. Risk Assessment Matrices: Design for Usability. Int. J. Environ. Res. Public Health 2022, 19, 2763. [Google Scholar] [CrossRef] [Scilit]
- Kutej, A.; Rass, S. Comparing Traditional and Graphical Risk Matrices: A Case Study in Healthcare. Risk Anal. 2025, 45, 3758–3780. [Google Scholar] [CrossRef] [Scilit]
- Pascarella, G.; Strumia, A.; Piliego, C.; Bruno, F.; Del Buono, R.; Costa, F.; Scarlata, S.; Agrò, F.E. Risk Analysis in Healthcare Organizations: Methodological Framework and Critical Variables. Risk Manag. Healthc. Policy 2021, 14, 2897–2911. [Google Scholar] [CrossRef] [Scilit]
- Iphar, M.; Cukurluoz, A.K. Fuzzy Risk Assessment for Mechanized Underground Coal Mines. Int. J. Occup. Saf. Ergon. 2020, 26, 256–271. [Google Scholar] [CrossRef] [Scilit]
- Seiti, H.; Makui, A.; Hafezalkotob, A.; Khalaj, M.; Hameed, I.A. R.Graph: A New Risk-Based Causal Reasoning and Its Application to COVID-19 Risk Analysis. Process Saf. Environ. Prot. 2022, 159, 585–604. [Google Scholar] [CrossRef] [Scilit]
- Lee, J.; Oh, S.; Baek, S.; Chung, C.; Ma, B. Development of the Quantitative Property–Consequence Relationship Model for Prediction of Hydrogen Leakage and Dispersion Using Response Surface Method and Artificial Neural Network Approaches. ACS Omega 2024, 9, 40857–40869. [Google Scholar] [CrossRef] [Scilit]
- Qian, F.; Chen, L.; Li, J.; Ding, C.; Chen, X.; Wang, J. Direct Prediction of the Toxic Gas Diffusion Rule in a Real Environment Based on LSTM. Int. J. Environ. Res. Public Health 2019, 16, 2133. [Google Scholar] [CrossRef] [Scilit]
- Wang, Y.; Fernández-Godino, M.G.; Gunawardena, N.; Lucas, D.D.; Yue, X. Spatiotemporal Predictions of Toxic Urban Plumes Using Deep Learning. PNAS Nexus 2025, 4, pgaf198. [Google Scholar] [CrossRef] [Scilit] [PubMed]
- Harati, S.; Rezaei Gomari, S.; Rahman, M.A.; Hassan, R.; Hassan, I.; Sleiti, A.K.; Hamilton, M. Performance Analysis of Various Machine Learning Algorithms for CO2 Leak Prediction and Characterization in Geo-Sequestration Injection Wells. Process Saf. Environ. Prot. 2024, 183, 99–110. [Google Scholar] [CrossRef] [Scilit]
- Lu, H.; Xi, D.; Xiang, Y.; Su, Z.; Cheng, Y.F. Vehicle–Canine Collaboration for Urban Pipeline Methane Leak Detection. Nat. Cities 2025, 2, 336–343. [Google Scholar] [CrossRef] [Scilit]
- Yuan, S.; Zhang, Z.; Sun, Y.; Kwon, J.S.-I.; Mashuga, C.V. Liquid Flammability Ratings Predicted by Machine Learning Considering Aerosolization. J. Hazard. Mater. 2020, 386, 121640. [Google Scholar] [CrossRef] [Scilit]
- Pontiggia, M.; Derudi, M.; Alba, M.; Scaioni, M.; Rota, R. Hazardous Gas Releases in Urban Areas: Assessment of Consequences through CFD Modelling. J. Hazard. Mater. 2010, 176, 589–596. [Google Scholar] [CrossRef] [Scilit]
- Jardine, C.G.; Hrudey, S.E.; Shortreed, J.H.; Craig, L.; Krewski, D.; Furgal, C.; McColl, S. Risk Management Frameworks for Human Health and Environmental Risks. J. Toxicol. Environ. Health B Crit. Rev. 2003, 6, 569–720. [Google Scholar] [CrossRef]
- Shin, S.; Lee, G.; Ahmed, U.; Lee, Y.; Na, J.; Han, C. Risk-Based Underground Pipeline Safety Management Considering Corrosion Effect. J. Hazard. Mater. 2018, 342, 279–289. [Google Scholar] [CrossRef] [Scilit]
- GB/T 42797-2023; Carbon Dioxide Capture, Transportation and Geological Storage—Pipeline Transportation Systems. Standards Press of China: Beijing, China, 2023.
- Cox, L.A., Jr. What’s Wrong with Risk Matrices? Risk Anal. 2008, 28, 497–512. [Google Scholar]
- Kaikkonen, L.; Parviainen, T.; Rahikainen, M.; Uusitalo, L.; Lehikoinen, A. Bayesian Networks in Environmental Risk Assessment: A Review. Integr. Environ. Assess. Manag. 2021, 17, 62–78. [Google Scholar] [CrossRef] [Scilit]

Disclaimer/Publisher’s Note: The statements, opinions and data contained in all publications are solely those of the individual author(s) and contributor(s) and not of MDPI and/or the editor(s). MDPI and/or the editor(s) disclaim responsibility for any injury to people or property resulting from any ideas, methods, instructions or products referred to in the content. |
© 2026 by the authors. Licensee MDPI, Basel, Switzerland. This article is an open access article distributed under the terms and conditions of the Creative Commons Attribution (CC BY) license.