Abstract
The transport of dangerous goods (TDG) produces serious risks, particularly in urban areas, due to the high presence of people and sensitive infrastructures from a social, environmental and economic point of view. Transport Risk Assessment combines occurrence, vulnerability and exposure to support urban transport planning aimed at achieving the Sustainable Development Goals. The objective of this paper is to propose a simplified risk calculation method, referring to a single link of the urban transport network, with reference to the occurrence component of the risk. The proposed formulation considers the sequence of factors that determine the overall dangerous event. The specification of the occurrence factors and a quantitative definition of the different parameters for a widespread type of transport of dangerous goods in urban areas is proposed. The results obtained are interesting because (1) the method, with quantitative parameters, can be applied to any urban area, and (2) some of the factors can also be used by replacing and introducing, where known, specific factors and relative parameters calibrated for the area for which it is planned to be implemented. The results indicate the feasibility of the proposed method without significant chemical–physical or electromechanical insights. This work is of potential interest for urban transport planners and public and private decision makers.
1. Introduction
The transport of dangerous goods (TDG) is particularly important for the economic development of industrial activities [1] and for the development of many activities that take place in urban areas [2]. At the same time, the TDG involves significant risks for social, economic and environmental development, with significant impacts on people and things [3]. The TDG is regulated according to the recommendations of the United Nations (UN) [4] in relation to different transport sectors [5]. In line with these recommendations, the European Commission has produced guidelines for risk analysis in order to support both public and private decision makers responsible for the TDG [6]. In the same way, reference guidelines are those issued in the USA for the Transport Risk Analysis (TRA) [7] as an evolution of Quantitative Risk Analysis [8,9].
Knowledge of the TDG is particularly important because it allows for evaluating risk reduction in urban transport as a central element of transport planning [10,11]. In the literature, there are specific works relating to risk reduction in a transport system under extraordinary conditions, considering each basic component: transport supply [12], demand [13] and their interactions [14,15]. The different components have been integrated into different Decision Support Systems (DSSs) [16]. The development of the DSSs requires transport system models (TSMs) to be adapted from ordinary to emergency conditions to analyse demand, supply and interactions, and for estimating potential effects of actions aimed at risk reduction [17].
The formulation of the risk, shared in the literature [18,19,20], relating to transport systems considers the product of the probabilities relating to: the occurrence of accidental events due to the transport of dangerous goods; vulnerability linked to the resistance of the elements impacted by the effects potentially produced by the generic event considered; and exposure related to the number of people and things present and potentially affected by the effects of the event. This formulation is the reference for the entire TRA.
The calculation of the recalled probabilities inside a TRA implies an interdisciplinary approach. However, in the literature, each risk component is generally analysed in an isolated way. In relation to the occurrence component, the main issue is estimating road accident probability by means of analytical approaches [21,22]. Advancements in knowledge about the occurrence component and its causal factors support the definition of prevention activities aimed at avoiding accidental events relating to some characteristics of infrastructures and their configuration (e.g., width and number of lanes) [23,24], vehicles [25,26], services [27] and users [28,29,30,31]. Road speed is one of the key factors that influence road accidents, particularly in urban areas. [32,33]. In relation to vulnerability, the main issue relates to consequence analyses using historical and real-time data [34,35,36,37,38]. More insights about vulnerability components support the definition of protection activities aimed at increasing the resistance of infrastructures [39] and vehicles [40,41]. In relation to exposure, scientific advancements regarding the combination of TSMs and risk analyses aim to increase the knowledge of mobility in evacuation conditions [10,11,42]. Research about exposure components supports the definition of management and evacuation activities [43,44]. From this literature review, the necessity of integrating methods and models deriving from different disciplines for improving knowledge of the TDG by road, related risks and their components (occurrence, vulnerability and exposure) emerges.
Risk assessment implies the use of Transport System Models, and in particular: advanced transport supply models, to simulate infrastructures and services and their connectivity [45,46,47] needed to perform TDG activities [48]; transport demand models with dynamic utility and choices [49,50,51]; and supply–demand interaction models for estimating road flows of vehicles connected to the TDG [52,53]. TSMs constitute the engine for planning [54,55] and for advanced DSSs as Digital Twins for representing risk in the current and planned configurations [56,57,58,59].
The scientific literature referred to is important and in-depth for studying the risks associated with transporting dangerous goods. This results in a highly specialised approach to the regulatory requirements that transporters must follow. The 2030 Agenda [60,61] highlights the need to plan for risk in urban areas, and risk from dangerous goods transport is certainly one of the most widespread, even though it generally produces localised effects. Its widespread use, therefore, requires adequate plans to be prepared alongside transport plans. The quantitative method of planning is profoundly different from the method that individual transporters must use to prepare for the transport of a specific load of dangerous goods [3]. Agenda 2030 aims to reduce risk in absolute terms and to plan for prevention across various sustainable development goals. For each SDG, the Agenda identifies the reference targets that must be achieved and the indicators that measure how close each country is to achieving them each year. Therefore, it is useful to review the targets and indicators, highlighting which ones are involved and how they are connected to each other.
From the available evidence, it appears that there is a lack of literature on risk-reduction planning for all vehicles in urban areas, whereas extensive literature exists on the risk reduction associated with the transportation of dangerous goods. Once the importance of risk-reduction planning has been established, it becomes relevant to apply it to a real urban area in a “what if” scenario to assess how the occurrence of risk can be reduced. In this study, both vulnerability and exposure are considered to be fixed and independent.
The primary objective of this paper is to integrate consolidated methods from various disciplines, specifically transport, physics, and chemical engineering, to define occurrence indexes in a simplified manner for planning risk reduction in urban areas related to the TDG.
Within this defined scope, this work’s main objective is to provide a brief analytical overview of the risk associated with the TDG and its specifications for an event. This is particularly important because it forms the basis for the overall risk formulation and constitutes the connecting element with the results obtained from the application of TSMs, which are used for calculating the event.
To verify the effectiveness of the event calculation model, the model is applied to a metropolitan area in Italy. The results show that it is possible to evaluate the occurrence in all links in the network, using the method applied to a generic link.
After the introduction, this paper is structured as follows: Section 2 presents risk reduction planning in the SDGs context, then a summary formulation of the risks and specifics for one of such occurrences in the transport of dangerous goods; Section 3 describes the general evaluation of occurrence, defining the singles factors components; Section 4 presents the main results obtained in a case study with a “what if” example, and the last section discusses the results and further research developments.
This work is useful for technicians of private companies and public bodies to plan risk reduction during the transport of dangerous goods. This work is also useful for researchers because it provides a consistent basis for analysing the various events that make up an overall event in sequence.
2. Transport Risk Occurrence Formulation in Planning for SDGs
This section highlights the importance of risk analyses for estimating the 2030 Agenda indicators (Section 2.1). By taking into account this importance, risk formulations for the transport of hazardous goods in urban areas are then proposed (Section 2.2). Finally, Section 2.3 analyses the occurrence component that forms the basis of risk analyses of the TDG in urban areas.
2.1. Risk in SDG Framework
The interactions between TRA and Agenda 2030 are manifold and extend those generally mentioned in the introduction.
Three main target groups can be identified using the relevant indicators. A proper study of TRA and its implementation in spatial plans could provide valuable insights into these groups.
Firstly, SDG 1: Poverty. Target 1.5 is very clear in the objective of defending all people from disasters. It is significant that the target directly refers to the poor:
1.5. By 2030, build the resilience of the poor and those in vulnerable situations and reduce their exposure and vulnerability to climate-related extreme events and other economic, social and environmental shocks and disasters.
This target is based on the state-of-the-art. In fact, regardless of what it might seem in an initial survey, disasters affect the poor sections of the population much more, regardless of the country and the degree of coverage from disasters that public forces can put into place. It is sufficient here to recall the disaster caused by Hurricane Katrina [62] with the dead and the homeless that it left behind. It is necessary to recall the four indicators that Agenda 2030 reports on, in order to underline the level of attention given to the pursuit of the goal.
1.5.1. Number of deaths, missing persons and directly affected persons attributed to disasters per 100,000 population.
1.5.2. Direct economic loss attributed to disasters in relation to global gross domestic product (GDP).
1.5.3. Number of countries that adopt and implement national disaster risk reduction strategies in line with the Sendai Framework for Disaster Risk Reduction 2015–2030.
1.5.4. Proportion of local governments that adopt and implement local disaster risk reduction strategies in line with national disaster risk reduction strategies.
It is particularly important to analyse these indicators in this work because it is clear that two different paths are being taken. On the one hand, the first two indicators (1.5.1 and 1.5.2) refer to reality as it is, that is, they ask individual countries to report the number of people affected by disasters and the amount of economic loss. On the other hand, the other two indicators (1.5.3 and 1.5.4) ask countries what strategies and plans they are putting in place to counter potential disasters, that is, what risk reduction strategies for the various potential dangers they are adopting. It is particularly significant that a specific indicator has been provided that refers to the role of local governments. The indicator then identifies the planning responsibilities at different levels, from national (1.5.3) to local (1.5.4).
Along with SDG 1, the other SDG that explicitly addresses the risk problem is SDG 11 on cities and human settlements. This SDG sets two targets as a reference, target 11.5 and target 11.B:
11.5. By 2030, significantly reduce the number of deaths and the number of people affected and substantially decrease the direct economic losses relative to global gross domestic product caused by disasters, including water-related disasters, with a focus on protecting the poor and people in vulnerable situations.
11.B. By 2020, substantially increase the number of cities and human settlements adopting and implementing integrated policies and plans towards inclusion, resource efficiency, mitigation and adaptation to climate change, resilience to disasters, and develop and implement, in line with the Sendai Framework for Disaster Risk Reduction 2015–2030, holistic disaster risk management at all levels.
It is important to highlight how these two targets are then translated into indicators that coincide with those already seen for SDG 1. Specifically, target 11.5 has as indicators 11.5.1 and 11.5.2 that coincide with the first two of 1.5, that is, the indicators focus on cities and the need to know what happens with cities as they are. Target 11.B focuses on planning, and its indicators 11.B.1 and 11.B.2 coincide with those already seen for 1.5, namely 1.5.3 and 1.5.4.
It is necessary to highlight that target 11.5 goes beyond what is defined in target 1.5 because it introduces the importance of knowing what happens to the most important infrastructures and services in urbanised areas. They influence the possibility of resuming life in urban areas after a disaster.
11.5.3. (a) Damage to critical infrastructure and (b) number of disruptions to basic services, attributed to disasters.
It is possible to recall that also the SDG 13 “climate change” defines target 13.1 in relation to natural disasters.
13.1. Strengthen resilience and adaptive capacity to climate related hazards and natural disasters in all countries.
The indicators of 13.1 are still those seen from target 1.5. Specifically, 13.1.1 refers to the current situation and, therefore, to the victims of disasters, while 13.1.2 and 13.1.3 refer to national and local level planning tools.
In addition to the group impact indicators on infrastructure, following a homogeneous theoretical path among the three recalled SDGs, it is finally necessary to recall SDG 12, sustainable consumption and production patterns, where all the problems connected with the transport of dangerous goods in the industrial sector are de facto considered, both in production and consumption.
In this case, target 12.4 must be recalled.
12.4. By 2020, achieve the environmentally sound management of chemicals and all wastes throughout their life cycle, in accordance with agreed international frameworks, and significantly reduce their release to air, water and soil in order to minimize their adverse impacts on human health and the environment.
The indicators closely related to this target are 12.4.1 and 12.4.2. In this case, the indicators deal with the current reality, both in general terms of agreements to be defined and in terms of real risk. Specific guidance for strategies and plans is missing, which is referred to with the indicators previously seen.
12.4.1. Number of parties to international multilateral environmental agreements on hazardous waste, and other chemicals that meet their commitments and obligations in transmitting information as required by each relevant agreement.
12.4.2. (a) Hazardous waste generated per capita; and (b) proportion of hazardous waste treated, by type of treatment.
Indicators 1.5.4, 11.B.2, and 13.1.3 unequivocally define the need for local governments to adopt risk reduction plans. These indicators, together with those in target 12.4, imply the need for risk reduction plans that explicitly consider the TDG. Figure 1 shows the overall structure, showing how individual SDGs move to specific targets and how the targets are linked to indicators, thus showing how the individual indicator is used in different contexts.
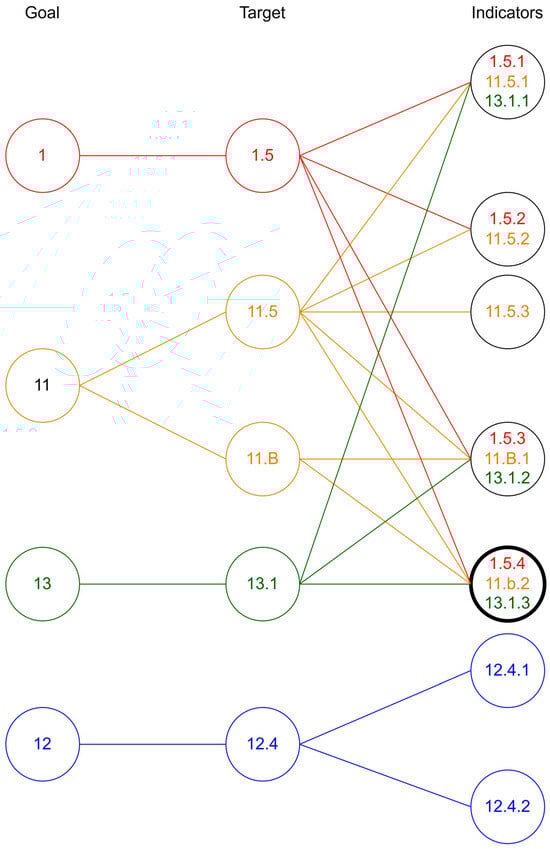
Figure 1.
Overall framework of SDGs, targets and indicators related to TDG risk.
The figure shows the central role of planning indicators in pursuing different SDGs and thus the importance attached to the relationship between planning and transport of dangerous goods.
2.2. Definitions, Notations and Formulation Relative to TRA
The literature offers many formulations of risk that consider different disastrous events, natural and anthropogenic. In this work, the formulation developed for TRA [7,20] is used. Following this approach [5,63,64], the risk in a transport system can be calculated with the following formulation:
where
R = O × M = O × V × E
- O—the occurrence of a TDG event;
- M—the magnitude of the potential effects produced by the TDG;
- V—vulnerability related to the system’s resistance to the TDG effects;
- E—exposure related to the people and/or goods potentially affected by the TDG effects.
By recalling the literature’s definitions [10,65], the following notations can be introduced. The variables are presented with a unified symbolism compared to the literature originals, which may have different symbols.
- A—study area;
- S—the set of disastrous events produced by the TDG event;
- s—a generic TDG event s ∈ S;
- w—the generic point in the study area where the TDG event occurs;
- y—the generic point in the study area where the effects of the TDG event are verified;
- Ls—the maximum level of intensity of effects produced by the event s in the point w;
- iw—intensity of effects produced by the event s in the point w; iw ∈ (0, Ls);
- iy—intensity of effects produced by the event s occurred in the point w, evaluated in the point y; iy ≤ iw; iy ∈ (0, Ls);
- Δ—the temporal period for which risk is estimated;
- t—the generic time instant belonging to the temporal period Δ; t ∈ Δ;
- ℓ—the generic road link in the study area A (ℓ ∈ A);
- r—the generic surface element of the area A, obtained from the subdivision of A (r ∈ A); (y ∈ r).
For each event s in w, an average occurrence in the points y can be calculated:
O (y, iy, t) = ∫y ∈ A ∫iy ∈ L ∫t ∈ Δ p(y, iy, t) dy diy dt/(∫y ∈ A ∫iy ∈ Ls ∫t ∈ Δ dy diy dt)
The overall risk in y can be calculated as the sum (integral) of all risks related to all TDG events Sw, which could occur at each point w of links crossed by vehicles carrying dangerous goods, of intensity iw.
From Equation (2), the total occurrence Oy in y can be calculated from the different occurrences that can happen in the different w points, and can be represented with a function:
Oy = ∑S, w OSw (y, iy, t)
The quantitative value of risk can be obtained by introducing (3) into (1).
Then, the basic problem is to obtain the occurrence function for the generic w and the following occurrence function in the generic y.
A schematic graphical representation of the main elements defined is reported in Figure 2.
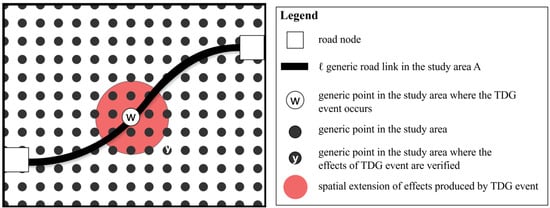
Figure 2.
A schematic representation of a TDG event(s) and its spatial effect.
2.3. Occurrence Formulation
The overall occurrence of a road accident during the transport of dangerous goods is defined by a succession of basic factors that can occur:
Each event s is determined in general by five basic factors. The following variables are defined:
- fℓ—the road flow on the link ℓ and at the instant t;
- j—the class of dangerous goods moved by a heavy vehicle (flammable, gases, toxic, …);
- m—breakage event of one mechanical component;
- k—chemical–physical factor due to m and j (e.g., related to pressure, temperature, or toxicity).
The study area is divided into a grid in which the basic element is r, link ℓ ∈ r.
The combination of fℓ, j, m, and k defines the event s in the points w of the link ℓ. The five factors are:
- (1)
- Accident—happens at time (t) and at a point (w) of a road link ( w ∈ ) crossed by a flow of vehicles (fℓ) of different categories (light vehicles for transport of people, heavy vehicles for transport of goods, …);
- (2)
- Heavy Vehicle—involved in the road accident defined in point 1);
- (3)
- TDG—the heavy vehicle involved in the road accident is carrying dangerous goods of substance j (for instance, flammable, gases, toxic, …);
- (4)
- Release—after the TDG road accident, a breakage m of one component (e.g., a valve) of the load unit occurs, with the release of a quantity of dangerous goods belonging to the substance j;
- (5)
- Scenario—after the release of substance of point 4, one or more events of type k can happen (e.g., temperature, pressure, or toxicity). The intensity in the point w depends on physical characteristics of the substance i and on the environmental conditions that characterise a road accident (e.g., meteorological conditions).
For each of the five factors, it is possible to formulate and estimate an occurrence probability. The occurrence probability of each factor can be or not partially dependent by previous factors. In general, it is possible to introduce the following probability functions:
- O1—road accident probability at the link ;
- O2—probability that a heavy vehicle is involved;
- O3—probability that a heavy vehicle is dedicated to the transport of dangerous goods of substance j;
- O4—probability that a breakage m occurs in the tank and it produces a release of dangerous goods;
- O5—probability that, after the release of dangerous goods, a disastrous event occurs.
In the case of an urban road network, the overall road accident occurrence in the road link that involves dangerous goods i with a disastrous event can be expressed as:
where the product is extended to all the factors considered in the sequence, which in the proposed model are five.
OSw (y, iy, t) = O1∙ × O2∙ × O3 × O4 × O5
Figure 3 illustrates a fault tree of the subsequent factors associated with road accidents involving vehicles transporting dangerous goods (TDG events).
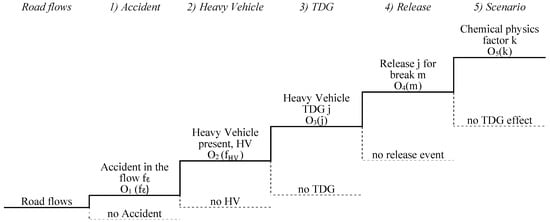
Figure 3.
A fault tree of a road accident involving the TDG.
3. Transport Risk Occurrence Evaluation in Planning for SDGs
3.1. Accident Road Flows Event, O1 (fℓ)
The literature proposes different models to estimate the probability of a road accident occurring. A review of these models is presented in [66].
The number of road accidents (), in a temporal period (day, months, or years), that happens in the link can be estimated considering road flows in the same link, and the function that measures occurrence’s probability depends on the independent attributes (xℓ) and the parameters (αℓ) relative to the elements of the link (see Figure 4):
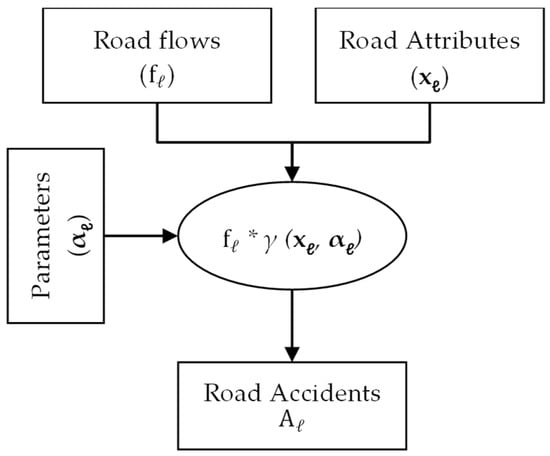
Figure 4.
The structure of models to estimate the number of road accidents at the link .
The quantitative models available in the literature adopt link or network flows as independent variables. For instance, [67] proposes the following function to estimate the annual number of road accidents in a link:
where
- x1—is the annual number of distances travelled by road vehicles (veh*km);
- x2—is the number of road lanes (number);
- α1, α2, α3—are the calibrated parameters.
3.2. Heavy Vehicle Event, O2 ()
The number of road accidents is a function of the road link flows. In a very general way, it is possible to assume a similar function for heavy vehicles; in this case, it is necessary to consider only the road flows of heavy vehicles.
where is the road flow of heavy vehicle in the link , and is a statistical parameter.
3.3. Dangerous Goods Events, O3 (j)
The road accident events that involve dangerous goods j can be classified into:
- Events occurring to an isolated vehicle, caused by a breakage of a vehicle component or load unit that carries dangerous goods;
- Events occurring after a collision between two or more road vehicles; the collision causes the breakage of a vehicle component or load unit that is carrying dangerous goods; after the breakage, a release of dangerous goods occurs, and it produces disastrous effects.
In both cases, it is necessary to know the probability that a heavy vehicle carrying dangerous goods of the type j crosses the road link .
3.4. Release Events, O4 (m)
The release of dangerous goods after road accidents constitutes the study object of different scientific disciplines. Generally, it can refer to:
- The quantity of a released substance, with respect to the total transported content;
- Breakage dimensions, for instance, that are expressed with the equivalent diameter of an ideal hole and, therefore, based on the physical conditions in which the substance is transported (e.g., in the liquid or gaseous state), on the value of the average release flow rate of the substance.
In the literature, it is possible to identify the following breakage categories:
- Minor breakages, with a limited quantity of dangerous goods released;
- Serious breakages, with continuous releases of substances over time until all or most of the transported quantity of dangerous goods has leaked;
- Catastrophic breakages, with instantaneous releases, or in a very short time, of the entire quantity of goods.
The type of breakage of the mechanical component with the corresponding quantity released is indicated with m.
3.5. Scenario Event, O5 (k)
In the literature, the consequences of each breakage category (m) on the TDG final factor (k) are identified with the term “accident scenario”. Each scenario characterises damage events for humans and/or the environment, produced by the release of dangerous goods. It is possible to consider:
- The thermal flow, in the case of the release of substances that contribute to a fire (e.g., gasoline);
- A high-pressure wave generated by an explosion caused by the release of a substance (e.g., oxygen);
- A high concentration of a toxic substance (e.g., chlorine) in the atmosphere.
Physical–mathematical models are used for estimating the distribution in space and time of the intensity of the effect of each accident scenario. These models estimate the consequences or physicochemical effects caused by the release of dangerous goods. It is therefore necessary to estimate the occurrence probability of each accident scenario, which is usually based on:
- The physical state of the released good (gas, liquefied gas, or liquid);
- The type of substance released (flammable, explosive, toxic or harmful to the environment);
- The quantity of the release, in relation to the introduced breakage categories;
- The characteristics of the environment in which the release occurs (e.g., weather conditions).
The main accident scenarios concerning damage caused by a high-temperature (or radiation) thermal flow are known by the following terms:
- A pool fire, that is a fire developing large amounts of heat; it can happen, for example, in the case of large quantities of liquefied gas (e.g., Liquefied Natural Gas, LNG) for which the release is immediate;
- A jet fire, that is, the leakage of a combustible liquid or gas under pressure that produces a flame from a container or from a pressurised pipe; the phenomenon is characterised by the direction and size of the flame itself;
- A flash fire, that is a fire of vapours leaking from the tank; the phenomenon can evolve towards a jet fire or a pool fire;
- A tank fire, similar to a circular pool fire that occurs at a higher level than the ground level;
- A fireball, that is, a fire of a vapour cloud extended in space; it may occur in the case of a flammable liquefied gas following an instantaneous release.
As far as concerns about the damage events caused by a high-pressure wave (or overpressure), the main accident scenarios are known with the following terms:
- BLEVE (Boiling Liquid Expanding Vapour Explosion), or vapour explosion, which expands when a liquid boils; it is a mechanical explosion caused by the rupture of a tank containing a liquid at a temperature significantly above its boiling temperature at atmospheric pressure; this produces a shock wave that extends in space even at high distances from the source.
- VCE (Vapour Cloud Explosion), or confined explosion by a leak of dust, gas or combustible vapours within a containment volume.
3.6. Planning for Occurrence Reduction
The method proposed in the previous sections can be directly used in a planned process that has the pursuit of (SDGs) measured by its indicator.
The process is divided into distinct phases and is organised using the “what if” approach, i.e., introducing hypotheses of alternative scenarios and verifying the level of indicators. The scheme of the planning process is shown in Figure 5, and is adapted from the work of [68,69]. The process begins with the analysis of the current situation (the studied urban area), which enables planners to define objectives (e.g., SDGs) and constraints (e.g., available financial resources). The effects of planned strategies and interventions can be estimated by adopting TSMs for calculating risk indicators and then the achievement of planned objectives.
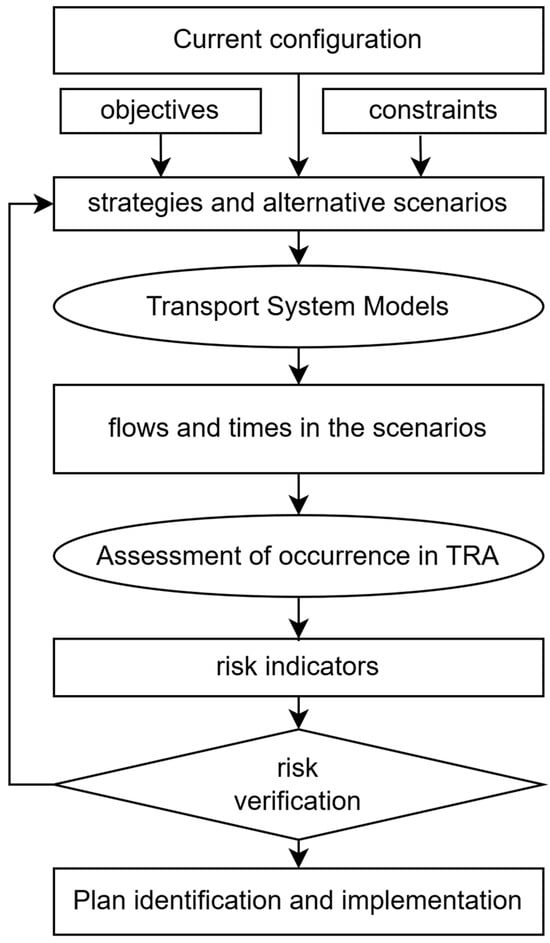
Figure 5.
Risk assessment in the transportation planning process.
In more detail, the main steps in the process are (Figure 5):
- Analysis of the current configuration of the system in the defined area, and the formulation of defined objectives and constraints;
- Definition of strategies that can be implemented, and proposals for alternative scenarios compared to the current one;
- Transport system modelling to calculate road flows for each band of time;
- Evaluation of traffic flow for each link in different bands of time: total flow, fHV, and fHV_TDG;
- Assessment of the level of indicators from (for example) the occurrence model presented in this work;
- Verification of objectives and constraints, in terms of risk, before the plan proposal;
- Identification and implementation of the plan actions;
- Identification of the planned configuration.
It should be noted that evaluations of the indicators are made with the method presented in this work. It should also be noted that the process is iterative, typical of what-if planning, and therefore, is repeated with subsequent alternative scenarios, which must be evaluated and verified until the level of indicators meets the objectives and constraints defined at the beginning of the process.
In the plan process, the models to be used are those typical of TSMs, and therefore of supply and demand, briefly referred to in the introduction, and those of TRA specified for the subject of this study, therefore, the evaluation of the occurrence of the transport of dangerous goods.
The result of the plan is therefore to propose alternative scenarios that allow the occurrence indicator to be reduced to the levels required by the political authority, which is the final decision-maker of the plan, and which must compose the various instances present in the area.
In the next chapter, a test case is first proposed for the implementation of the whole method in a real situation. In the final part of the next chapter, an iteration of the plan process is proposed. It is highlighted that the proposed method allows the evaluation of plan indicators in ex ante conditions, i.e., in the current scenario, and how it allows the calculation of plan indicators in ex post conditions after the proposal of an alternative scenario to the current one. It is evident that in real cases, various alternative scenarios can be proposed, compared to the current situation, and they can all be evaluated with the method presented in this work.
4. A Case Study in an Urban Context
The case study concerns the TDG by road in the downtown of Reggio Calabria, a metropolitan city in southern Italy.
The main assumptions are:
- The application involves a main road of the urban area used by light and heavy vehicles;
- The quantity of dangerous goods includes flammable liquids, and in particular, fuels and chlorine;
- The application aims at calculating the local risk in a grid constituted by single rectangular forms of 50 × 50 m in dimensions.
This section reports the functions used for measuring the components of the occurrence described in Section 3 in an urban area. For an easy application and in connection to the literature about available data, it will be referred to the frequency of occurrence. To obtain an overall measurement, the parameters and variables obtained from official sources are reported in Table 1.
4.1. Road Accidents Probability/Frequency
The occurrence O1, in the road link can be calculated with different functions [67], and there is a very large amount of literature from this field. For an exemplificative approach, O1 can be calculated in an aggregate way using the following formulation:
where
- is the annual number of road accidents in the observed city;
- are the total annual travelled distances by road vehicles crossing the road network of the observed city;
- is the total number of road vehicles travelling on the link in a year;
- is the length of the road link .
For estimating the accident frequency, it is necessary to estimate vkmTOT,city by using the variables and parameters described in Table 1.
The value of O1 is:
4.2. Heavy Vehicle
The probability that a heavy vehicle is involved in the accident, O2, can be calculated as:
where PINCMP is the percentage of road accidents that involve heavy vehicles in the city, considered with respect to the total of road accidents.
4.3. Dangerous Goods
The O3 probability is calculated in relation to the class of TDG [35,70,71]. In urban areas, gasoline transport is:
where
- j—is the dangerous good substance transported; in this case, it is assumed to be gasoline;
- PINCTDG—is the percentage incidence of road accidents involving dangerous goods in the study area, transported by heavy vehicles;
- PINCTDG(1)—is the percentage incidence of road accidents involving gasoline (j = 1) in the study area with respect to the accidents involving dangerous goods;
- PINCTDG(2)—is the percentage incidence of road accidents involving chlorine (j = 2) in the study area with respect to the accidents involving dangerous goods.

Table 1.
Reference values Oj.
Table 1.
Reference values Oj.
| Component | Variable | Description | Value | Unit of Measure | Source |
|---|---|---|---|---|---|
| O1 | Total road accidents | 939 | accidents/year | [72] | |
| Total annual distances travelled by road vehicles in the network | 2.63 | 109/year | [73] | ||
| Road link length | 5.6 | Km | [74] | ||
| 7,679,400 | veh/year | [75] | |||
| O2 | PINCMP | Percentage of road accidents with heavy vehicles | 5.47% | % | [72] |
| O3 | PINCTDG | Percentage of road accidents with TDG | 6.7% | % | [64] |
| PINCTDG(1) | Percentage of road accidents with release of gasoline | 12.5% | % | [76] | |
| PINCTDG(2) | Percentage of road accidents with release of chlorine | 1.8% | % | [76] | |
| O4 | PINCbreak | Percentage of breakage | 2.49% | % | [77] |
4.4. Release
The release probability, O4, can be estimated through the occurrence frequency of a tanker rupture (m = break), which produces a release of a generic dangerous good. The frequency of the accident may depend on the hours of use of the tank [77,78] and, therefore, the following value can be used:
O4 = PINCbreak = 2.49%
4.5. Scenario
Only one final factor, k, generated by the release of gasoline, is considered. This is in the field of “thermal flow”, and it is the “pool fire”.
This is the final event, within a maximum distance of 20 m (y), that produces harmful effects following high temperatures (k: poolfire), with a frequency of 3 × 10⁻³, and therefore:
O5 (gasoline) = 3 × 10⁻³
4.6. Occurrence and Risk
The calculation of the total occurrence is obtained through the product of the individual factors calculated in the previous paragraphs by applying formulation (4), considering the flow in the link.
O = O1∙ × O2∙ × O3 × O4 × O5 = 15.35 × 0.0547 × 8.375 × 10−3 × 0.0249 × 3 × 10−3 = 5.25 × 10⁻⁷
The occurrence, as calculated, has a frequency value that refers to a single scenario that could occur at a generic point on the road link, with effect in y.
4.7. Extension to Other TDG
For calculating the risk, it would be necessary to extend the calculation to other scenarios to apply the Formula (4). For each event, it is necessary to calculate the intensity of the effect as the distance from the source varies. For example, in the case of overpressure, it is possible to use a function such as the one reported in Figure 6, obtained with a formulation available in the literature in the case of a gas explosion. Figure 6 shows the pressure value expressed in kpa as the distance in meters from the source varies.
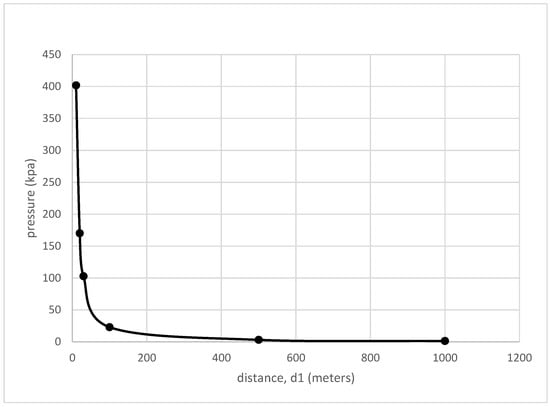
Figure 6.
Pressure evolution in a space after an explosion of gas.
In the case of an explosion, pressures above 3 kpa produce the death of an individual; therefore, for distances less than 500 m, the probability of death is equal to 1.
For calculating the exposure component, it is possible to assume the presence of at least one individual in the impact area.
The combination of the factors makes it possible to calculate the risk at each point of the territory and create a risk map [79], which represents the cumulative risks relating to all accident scenarios.
4.8. Example of Risk Reduction by Plan
With the formulas specified in the previous paragraphs, it is possible to calculate and represent the risk associated with the movement of vehicles supplying the petrol stations located within the urban centre of Reggio Calabria. Currently, heavy vehicles from outside arrive in the city via the motorway. From the motorway, they can enter the city following different routes to reach the petrol stations. In the current configuration of the transport system, there is no regulation for the transit of vehicles carrying hazardous goods, and therefore, tankers carrying petrol can cross any road at any time.
Starting from the current configuration, a plan configuration was assumed in which measures were introduced to regulate the transit of HGVs carrying hazardous goods. In particular, a scenario was defined in which the main coastal axis, i.e., the city’s seafront, which is characterised, especially during summer periods, by high traffic flows, is banned from the transit of heavy goods vehicles carrying hazardous goods. Fuel stations located along the primary roads delimiting the city centre were considered for the risk analyses.
Figure 7a shows a representation of the risk map in the current configuration, considering the main road arcs crossed by the heavy vehicles transporting gasoline.
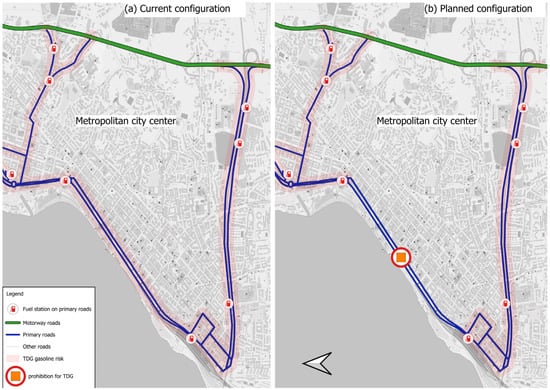
Figure 7.
The TDG gasoline risk map of the study area: a comparison between the current and planned configurations.
Using the results obtained in Section 4.6, it is possible to calculate the occurrence of the TDG of gasoline in the current and planned configuration (Figure 7b) for the entire urban network. By comparing the two configurations, it is possible to estimate a reduction of 22%.
5. Discussion
The TDG is one of the main sources of risk associated with urban freight transport. The community, and its public representatives, are particularly interested in knowing the risks because the transport of dangerous goods is necessary for various activities, but creates dangerous conditions for inhabitants. Risk assessment tools are built into commercial software, often very complex to calculate risk for each specific movement of dangerous goods.
This note presents a general formulation of the risk that is easy to interpret and understand. A formulation of the occurrence has been proposed, which considers the sequence of factors that generate the overall occurrence. The proposed model has been applied to the case study of the urban centre of a metropolitan area in Italy. This paper proposes a simplified methodology that combines elements typical of TSMs, including vehicle flows per link with percentages of heavy vehicles and percentages of vehicles carrying dangerous goods, and elements typical of TRA, such as the substance of dangerous goods and overall scenarios. The proposed approach is useful for estimating the occurrence at the urban level. The results of this application show the feasibility of the methodology. Simplified hypotheses are introduced, which nonetheless allow analysts to obtain estimates of the levels of occurrence.
Note that the proposed approach is useful to estimate sustainability impacts produced by TDG events [80].
6. Conclusions
On the basis of the results obtained, it is possible to make some conclusions.
The first concerns the simplicity of the application of the method that allows, with little information, the calculation of the occurrence values and, therefore, if necessary, representation through a GIS (Geographical Information System) of the different levels of occurrence in an urban area, without the use of specialist software. The second concerns the possibility of easily extending the method from point occurrence calculation to occurrence calculation along a path followed by a vehicle transporting dangerous goods. To the authors’ knowledge, the proposed simplified approach represents a novelty through considering the complexity of existing TRA approaches.
The knowledge of the occurrence in all arcs in the urban network makes it possible to support the sustainable mobility planning process, explicitly considering mobility in emergency conditions. System planning, with the aim of sustainable mobility, is one of the most important issues for the future of cities today. The proposed method and prototypical results presented in this paper are useful for different public and private actors involved in the TDG. This constitutes support for the planning and design of prevention interventions contributing to risk reduction. Public authorities could benefit from the proposed methodology for supporting road network hazard reduction, starting from the risk assessment of the TDG by road and implementing risk plans in urban areas to optimise the indicators of SGDs.
This paper presents some limitations. The main limitation is regarding one of the three risk components. The other relevant limitation concerns the quantity of available data. The data for the case study were derived from statistical sources. However, they may vary significantly depending on the type of tank, its physical and mechanical characteristics, and operating conditions.
Research developments may involve various aspects. The main directions are extending the methodology for occurrence to different materials and different scenarios, and producing more insights into methods of transferring the event to the points where the effect occurs, thus considering the vulnerability and the exposure. It is necessary to acquire other data from alternative sources to produce more insights into the variability of the adopted parameters. More generally, future developments could consider the integration of ICT with TSMs and TRA within DSSs, which already contain TSMs and TRA.
Author Contributions
Conceptualisation, F.R.; methodology, F.R. and C.R.; formal analysis, F.R.; investigation, C.R.; resources, F.R.; data curation, C.R.; writing—original draft preparation, F.R.; writing—review and editing, C.R.; visualisation, C.R.; supervision, F.R.; funding acquisition, F.R. All authors have read and agreed to the published version of the manuscript.
Funding
This study was carried out within the research project “RISK: Recovery Increasing by Social Knowledge” —2022B4TT2M (CUP 1-C53D23004800006), PIANO NAZIONALE DI RIPRESA E RESILIENZA (PNRR) Missione 4 “Istruzione e Ricerca”—Componente 1-C2, Investimento 1.1 “Fondo per il Programma Nazionale di Ricerca e Progetti di Rilevante Interesse Nazionale (PRIN)”, D.D. n. 104 del 2 febbraio 2022, ERC SH7 “Human Mobility, Environment, and Space”. This paper reflects only the authors’ views and opinions, and neither the European Union, the European Commission, nor the Italian Ministry of the University and Research can be considered responsible for them.
Data Availability Statement
The data used are reported in the text.
Conflicts of Interest
The authors declare no conflicts of interest.
References
- Bender, H.F.; Eisenbarth, P. Hazardous Chemicals: Control and Regulation in the European Market, 1st ed.; Wiley: Hoboken, NJ, USA, 2006; ISBN 978-3-527-31541-3. [Google Scholar]
- EUROSTAT. Road Freight Transport of Dangerous Goods by Type of Dangerous Goods and Territorial Coverage; EUROSTAT: Luxembourg, 2024. [Google Scholar]
- United Nations. ADR Agreement Concerning the International Carriage of Dangerous Goods by Road; United Nations: Geneva, Switzerland, 2025. [Google Scholar]
- United Nations; Inland Transport Committee (ITC). UNECE Bodies Dealing with Transport of Dangerous Goods; United Nations: Geneva, Switzerland, 2025. [Google Scholar]
- Khaskheli, M.B.; Zhao, Y.; Lai, Z. Sustainable Maritime Governance of Digital Technologies for Marine Economic Development and for Managing Challenges in Shipping Risk: Legal Policy and Marine Environmental Management. Sustainability 2025, 17, 9526. [Google Scholar] [CrossRef]
- European Union Agency for Railways. Risk Management Framework for Inland Transport of Dangerous Goods: Guide for Decision Making; Publications Office: Luxembourg, 2018. [Google Scholar]
- Center for Chemical Process Safety. Guidelines for Process Safety Documentation, 1st ed.; Wiley: Hoboken, NJ, USA, 1995; ISBN 978-0-8169-0625-3. [Google Scholar]
- Saccomanno, F.; Haastrup, P. Influence of Safety Measures on the Risks of Transporting Dangerous Goods Through Road Tunnels. Risk Anal. 2002, 22, 1059–1069. [Google Scholar] [CrossRef] [PubMed]
- Caliendo, C.; Genovese, G. Quantitative Risk Assessment on the Transport of Dangerous Goods Vehicles Through Unidirectional Road Tunnels: An Evaluation of the Risk of Transporting Hydrogen. Risk Anal. 2021, 41, 1522–1539. [Google Scholar] [CrossRef] [PubMed]
- Russo, F.; Vitetta, A. Risk Evaluation in a Transportation System. Int. J. Sustain. Dev. Plan. 2006, 1, 170–191. [Google Scholar] [CrossRef]
- Rindone, C.; Panuccio, P. Planning for Risk Reduction in the Transport System at Urban Level. Int. J. Transp. Dev. Integr. 2023, 7, 27–34. [Google Scholar] [CrossRef]
- Musolino, G. Risk reduction in transport system in emergency conditions: A framework for supply analysis. WIT Trans. Built Environ. 2022, 206, 275–284. [Google Scholar]
- Russo, F.; Chilà, G. Dynamic Approaches to Demand Model in Evacuation Conditions; WIT Press: Southampton, UK, 2010; pp. 303–312. [Google Scholar]
- Marcianò, F.A.; Musolino, G.; Vitetta, A. Signal Setting Design on a Road Network: Application of a System of Models in Evacuation Conditions. WIT Trans. Inf. Commun. Technol. 2010, 43, I443–I454. [Google Scholar]
- Vitetta, A. Network Design Problem for Risk Reduction in Transport System: A Models Specification. Int. J. Transp. Dev. Integr. 2022, 6, 283–297. [Google Scholar] [CrossRef]
- Di Gangi, M.; Belcore, O.M.; Polimeni, A. An Overview on Decision Support Systems for Risk Management in Emergency Conditions: Present, Past and Future Trends. Int. J. Transp. Dev. Integr. 2023, 7, 45–53. [Google Scholar] [CrossRef]
- Caliendo, C.; De Guglielmo, M.L. Quantitative Risk Analysis on the Transport of Dangerous Goods Through a Bi-Directional Road Tunnel. Risk Anal. 2017, 37, 116–129. [Google Scholar] [CrossRef]
- Bagli, S.; Spadoni, G. A Multimedia, Multiple Pathway Exposure and Risk Assessment Using EHHRA-GIS: A Real Case of Contamination Due to an Industrial Facility. In WIT Transactions on Ecology and the Environment; WIT Press: Billerica, MA, USA, 2000; Volume 45, ISBN 1-85312-830-9. [Google Scholar]
- Bubbico, R.; Di Cave, S.; Mazzarotta, B. Risk Analysis for Road and Rail Transport of Hazardous Materials: A Simplified Approach. J. Loss Prev. Process Ind. 2004, 17, 477–482. [Google Scholar] [CrossRef]
- Russo, F.; Vitetta, A. Safety of Users in Road Evacuation: General Methodology and Main Results. In Proceedings of the Urban Transport XIII: Urban Transport and the Environment in the 21st Century; WIT Press: Coimbra, Portugal, 2007; Volume I, pp. 763–772. [Google Scholar]
- Izdebski, M.; Jacyna-Gołda, I.; Gołda, P. Minimisation of the Probability of Serious Road Accidents in the Transport of Dangerous Goods. Reliab. Eng. Syst. Saf. 2022, 217, 108093. [Google Scholar] [CrossRef]
- Niu, S.; Ukkusuri, S.V. Risk Assessment of Commercial Dangerous -Goods Truck Drivers Using Geo-Location Data: A Case Study in China. Accid. Anal. Prev. 2020, 137, 105427. [Google Scholar] [CrossRef] [PubMed]
- Fabiano, B.; Currò, F.; Palazzi, E.; Pastorino, R. A Framework for Risk Assessment and Decision-Making Strategies in Dangerous Good Transportation. J. Hazard. Mater. 2002, 93, 1–15. [Google Scholar] [CrossRef] [PubMed]
- Praticò, F.G.; Fedele, R. Economic Sustainability of High–Speed and High–Capacity Railways. Sustainability 2022, 15, 725. [Google Scholar] [CrossRef]
- Spouge, J. Frequencies of Leaks of Dangerous Goods from Road Tankers. In Proceedings of the 29th European Safety and Reliability Conference (ESREL); Research Publishing Services: London, UK, 2019; pp. 3497–3502. [Google Scholar]
- Barabino, B.; Bonera, M.; Maternini, G.; Porcu, F.; Ventura, R. Refining a Crash Risk Framework for Urban Bus Safety Assessment: Evidence from Sardinia (Italy). Reliab. Eng. Syst. Saf. 2024, 245, 110003. [Google Scholar] [CrossRef]
- Conca, A.; Ridella, C.; Sapori, E. A Risk Assessment for Road Transportation of Dangerous Goods: A Routing Solution. Transp. Res. Procedia 2016, 14, 2890–2899. [Google Scholar] [CrossRef]
- Bęczkowska, S.; Choromański, W.; Grabarek, I. Risk and human factor in carriage of dangerous goods by road. Transp. Probl. 2020, 15, 19–28. [Google Scholar] [CrossRef]
- Sun, M.; Zhou, R.; Jiao, C.; Sun, X. Severity Analysis of Hazardous Material Road Transportation Crashes with a Bayesian Network Using Highway Safety Information System Data. Int. J. Environ. Res. Public Health 2022, 19, 4002. [Google Scholar] [CrossRef]
- Stevenson, M.R.; Elkington, J.; Sharwood, L.; Meuleners, L.; Ivers, R.; Boufous, S.; Williamson, A.; Haworth, N.; Quinlan, M.; Grunstein, R.; et al. The Role of Sleepiness, Sleep Disorders, and the Work Environment on Heavy-Vehicle Crashes in 2 Australian States. Am. J. Epidemiol. 2014, 179, 594–601. [Google Scholar] [CrossRef]
- Shaffiee Haghshenas, S.; Guido, G.; Shaffiee Haghshenas, S.; Astarita, V. Predicting the Level of Road Crash Severity: A Comparative Analysis of Logit Model and Machine Learning Models. Transp. Eng. 2025, 20, 100323. [Google Scholar] [CrossRef]
- Martinelli, V.; Ventura, R.; Bonera, M.; Barabino, B.; Maternini, G. Effects of Urban Road Environment on Vehicular Speed. Evidence from Brescia (Italy). Transp. Res. Procedia 2022, 60, 592–599. [Google Scholar] [CrossRef]
- Raccagni, S.; Ventura, R.; Barabino, B. Impact of Urban Road Characteristics on Vehicle Speed: Insights from Brescia, Italy. Heliyon 2024, 10, e39459. [Google Scholar] [CrossRef] [PubMed]
- Bubbico, R.; Maschio, G.; Mazzarotta, B.; Milazzo, M.F.; Parisi, E. Risk Management of Road and Rail Transport of Hazardous Materials in Sicily. J. Loss Prev. Process Ind. 2006, 19, 32–38. [Google Scholar] [CrossRef]
- Milazzo, M.F.; Lisi, R.; Maschio, G.; Antonioni, G.; Spadoni, G. A Study of Land Transport of Dangerous Substances in Eastern Sicily. J. Loss Prev. Process Ind. 2010, 23, 393–403. [Google Scholar] [CrossRef]
- Tomasoni, A.M.; Bersani, C.; Sacile, R.; Zero, E. Ict Based System to Monitor Hazmat Road Transportation and a Rapid Mapping Technique for Accident Scenarios. Chem. Eng. Trans. 2022, 91, 139–144. [Google Scholar] [CrossRef]
- Tseng, J.M.; Su, T.S.; Kuo, C.Y. Consequence Evaluation of Toxic Chemical Releases by ALOHA. Procedia Eng. 2012, 45, 384–389. [Google Scholar] [CrossRef]
- Mohammadfam, I.; Kalatpour, O.; Gholamizadeh, K. Quantitative Assessment of Safety and Health Risks in HAZMAT Road Transport Using a Hybrid Approach: A Case Study in Tehran. ACS Chem. Health Saf. 2020, 27, 240–250. [Google Scholar] [CrossRef]
- Strauss, A.; Moser, T.; Honeger, C.; Spyridis, P.; Frangopol, D.M. Likelihood of impact events in transport networks considering road conditions, traffic and routing elements properties. J. Civ. Eng. Manag. 2020, 26, 95–112. [Google Scholar] [CrossRef]
- Liu, H.; Ren, C.; Zhang, G.; Zhou, W.; Zhang, X. Research and Evaluation on Safety Critical Information of Road Tanker for Dangerous Liquid Goods Based on Multi-Source Data. Procedia Comput. Sci. 2022, 208, 79–87. [Google Scholar] [CrossRef]
- Sohrabi, S.; Weng, Y.; Das, S.; German Paal, S. Safe Route-Finding: A Review of Literature and Future Directions. Accid. Anal. Prev. 2022, 177, 106816. [Google Scholar] [CrossRef] [PubMed]
- Chila, G.; Musolino, G.; Polimeni, A.; Rindone, C.; Russo, F.; Vitetta, A. Transport Models and Intelligent Transportation System to Support Urban Evacuation Planning Process. IET Intell. Transp. Syst. 2016, 10, 279–286. [Google Scholar] [CrossRef]
- Dong, X.; Xu, Z.; Yuan, L. Quantitative Risk Analysis of Dangerous Goods Road Transport Vehicles and Networks. In Smart Communications, Intelligent Algorithms and Interactive Methods; Smart Innovation, Systems and Technologies; Jain, L.C., Kountchev, R., Hu, B., Kountcheva, R., Eds.; Springer Nature: Singapore, 2022; Volume 257, pp. 105–110. ISBN 978-981-16-5163-2. [Google Scholar]
- Fabiano, B.; Currò, F.; Reverberi, A.P.; Pastorino, R. Dangerous Good Transportation by Road: From Risk Analysis to Emergency Planning. J. Loss Prev. Process Ind. 2005, 18, 403–413. [Google Scholar] [CrossRef]
- Tesoriere, G.; Russo, A.; De Cet, G.; Vianello, C.; Campisi, T. The Centrality of Italian Airports before and after the COVID-19 Period: What Happened? Eur. Transp. Trasp. Eur. 2023, 93, 1–16. [Google Scholar] [CrossRef]
- Campisi, T.; Russo, A.; Trwdy, E.; Zanne, M.; Tesoriere, G. Some Considerations on the Analysis of Port Centrality in the Adriatic Basin for Tourist Transport Purposes. Transp. Res. Procedia 2025, 83, 125–132. [Google Scholar] [CrossRef]
- Rindone, C.; Russo, A. Centrality Analysis for Railway Network Planning: Constrained Measures for High Speed. Transp. Eng. 2025, 22, 100393. [Google Scholar] [CrossRef]
- Musolino, G. Methods for Risk Reduction: Modelling Users’ Updating Utilities in Urban Transport Networks. Sustainability 2024, 16, 2468. [Google Scholar] [CrossRef]
- Russo, F.; Chilà, G. Safety of Users in Road Evacuation: RP vs. SP Surveys in Demand Analysis. WIT Trans. Built Environ. 2008, 101, 703–713. [Google Scholar] [CrossRef]
- Russo, F.; Chilà, G. Safety of Users in Road Evacuation: Modelling and DSS for Demand. WIT Trans. Ecol. Environ. 2009, 120, 465–474. [Google Scholar] [CrossRef]
- Russo, F.; Comi, A.; Chilà, G. Dynamic Approach to Update Utility and Choice by Emerging Technologies to Reduce Risk in Urban Road Transportation Systems. Future Transp. 2024, 4, 1078–1099. [Google Scholar] [CrossRef]
- Vitetta, A. A Quantum Utility Model for Route Choice in Transport Systems. Travel Behav. Soc. 2016, 3, 29–37. [Google Scholar] [CrossRef]
- Vitetta, A. Influence of Vehicular Flow Instability in a Transport Network on Risk Reduction: Test in a Two-Link Network. J. Adv. Transp. 2025, 2025, 7966144. [Google Scholar] [CrossRef]
- Russo, F.; Rindone, C. Safety of Users in Road Evacuation: The Logical Framework Approach in Evacuation Planning. WIT Trans. Built Environ. 2008, 101, 751–760. [Google Scholar] [CrossRef]
- Russo, F.; Rindone, C. Planning in Road Evacuation: Classification of Exogenous Activities. WIT Trans. Built Environ. 2011, 116, 639–651. [Google Scholar] [CrossRef]
- Astarita, V.; Haghshenas, S.S.; Haghshenas, S.S.; Guido, G.; Martino, G. Bibliometric-Based Literature Review on Artificial Intelligence in Disaster Response. In Proceedings of the AIIT 4TH International Conference Greening the Way Forward: Sustainable Transport Infrastructure and Systems, Rome, Italy, 19–20 September 2024. [Google Scholar]
- Martino, G.; Astarita, V.; Guido, G.; Haghshenas, S.S.; Shaffiee Haghshenas, S. Risk Management in Transportation Systems: How Big Data Can Help Predict Behaviors and Events. Procedia Comput. Sci. 2025, 257, 39–46. [Google Scholar] [CrossRef]
- Astarita, V.; Martino, G.; Guido, G.; Haghshenas, S.S.; Shaffiee Haghshenas, S. Risk Management in Transportation Systems: The Use of Blockchain for Risk Reduction in Disaster’s Occurrence. Procedia Comput. Sci. 2025, 257, 428–435. [Google Scholar] [CrossRef]
- Rindone, C.; Russo, A. Disaster Risk Reduction in a Manhattan-Type Road Network: A Framework for Serious Game Activities for Evacuation. Sustainability 2025, 17, 6326. [Google Scholar] [CrossRef]
- UN. Sustainable Development Goals (SDG). Available online: https://sdgs.un.org/goals (accessed on 7 May 2023).
- UN. SDG Indicators. Global Indicator Framework for the Sustainable Development Goals and Targets of the 2030 Agenda for Sustainable Development. Available online: https://unstats.un.org/sdgs/indicators/indicators-list/ (accessed on 7 May 2023).
- Kates, R.W.; Colten, C.E.; Laska, S.; Leatherman, S.P. Reconstruction of New Orleans after Hurricane Katrina: A Research Perspective. Proc. Natl. Acad. Sci. USA 2006, 103, 14653–14660. [Google Scholar] [CrossRef]
- TNO. Failure and Accidents Technical Information System—FACTS Database; TNO: The Hague, The Netherlands, 2024; Available online: https://www.luctoretemergos.nl/en/about-facts-online/ (accessed on 8 March 2026).
- Federchimica. L’industria Chimica in Cifre 2020; Federchimica: Milan, Italy, 2020; Available online: https://www.federchimica.it/docs/default-source/materiali-assemblea-2020/1-pubblicazioni/l'industria-chimica-in-cifre-2020.pdf?sfvrsn=e3904b93_4 (accessed on 8 March 2026).
- Russo, F.; Rindone, C. Transport of Dangerous Goods in Urban Area: Planning for Sustainable Future. Sustain. Futures 2025, 9, 100649. [Google Scholar] [CrossRef]
- Marcianò, F.A.; Vitetta, A. Risk Analysis in Road Safety: An Individual Risk Model for Drivers and Pedestrians to Support Decision Planning Processes. Int. J. Saf. Secur. Eng. 2011, 1, 265–282. [Google Scholar] [CrossRef]
- Berhanu, G. Models Relating Traffic Safety with Road Environment and Traffic Flows on Arterial Roads in Addis Ababa. Accid. Anal. Prev. 2004, 36, 697–704. [Google Scholar] [CrossRef] [PubMed]
- Russo, F.; Rindone, C. Safety of Users in Road Evacuation: Planning Internal Processes and Guidelines. In Proceedings of the Urban Transport XIII: Urban Transport and the Environment in the 21st Century; WIT Press: Coimbra, Portugal, 2007; Volume I, pp. 825–834. [Google Scholar]
- Russo, F.; Rindone, C. Methods for Risk Reduction: Training and Exercises to Pursue the Planned Evacuation. Sustainability 2024, 16, 1474. [Google Scholar] [CrossRef]
- Quarto, E.D.; Bonvicini, S.; Spadoni, G. Analisi Di Una Banca-Dati Degli Incidenti Nel Trasporto Di Merci Pericolose; La Chimica e L’industria: Milan, Italy, 2005; no. 6; pp. 50–54. [Google Scholar]
- Milazzo, M.F.; Vianello, C.; Maschio, G. Uncertainties in QRA: Analysis of Losses of Containment from Piping and Implications on Risk Prevention and Mitigation. J. Loss Prev. Process Ind. 2015, 36, 98–107. [Google Scholar] [CrossRef]
- ACI Incidentalità. Dati Statistici Sull’incidentalità Stradale in Italia; ACI Incidentalità: Rome, Italy, 2019. Available online: https://aci.gov.it/attivita-e-progetti/studi-e-ricerche/incidentalita/ (accessed on 8 March 2026).
- CM—RC Città Metropolitana di Reggio Calabria. Available online: https://www.cittametropolitana.rc.it/ (accessed on 13 May 2025).
- Quantum Gis Developers. Quantum Gis. 2024. Available online: https://Qgis.Org/ (accessed on 8 March 2026).
- Calabria Region. Piano Regionale dei Trasporti; Regione Calabria: Catanzaro, Italy, 2016; Available online: https://www.regione.calabria.it/edilizia-infrastrutture-difesa-del-suolo-e-mobilita/piano-regionale-dei-trasporti/ (accessed on 8 March 2026).
- Italian Fighfighters. Annuario Statistico Del Corpo Nazionale Dei Vigili Del Fuoco; Ministero Dell’interno: Rome, Italy, 2024; Available online: https://www.vigilfuoco.it/sites/default/files/2024-07/Annuario%20statistico%202024_1.pdf (accessed on 8 March 2026).
- Tomasoni, A.M.; Soussi, A.; Sacile, R. Toxic Release Damage Distance Assessment Based on the Short-Cut Method: A Case Study for the Transport of Chlorine and Hydrochloric Acid in Densely Urbanized Areas in the Mediterranean Region. ACS Chem. Health Saf. 2023, 30, 165–172. [Google Scholar] [CrossRef]
- Tomasoni, A.M.; Garbolino, E.; Rovatti, M.; Sacile, R. Risk Evaluation of Real-time Accident Scenarios in the Transport of Hazardous Material on Road. Manag. Environ. Qual. Int. J. 2010, 21, 695–711. [Google Scholar] [CrossRef]
- European Commission; Joint Research Centre. Mapping of Risk Web-Platforms and Risk Data: Collection of Good Practices; Publications Office: Luxembourg, 2018; Available online: https://publications.jrc.ec.europa.eu/repository/handle/JRC109146 (accessed on 8 March 2026).
- Ngoc Mai, L.T. The Adjustment of China’s Foreign Investment Policy and Law-Lessons for Vietnam. VNU J. Sci. Leg. Stud. 2022, 38, 13–27. [Google Scholar] [CrossRef]


Disclaimer/Publisher’s Note: The statements, opinions and data contained in all publications are solely those of the individual author(s) and contributor(s) and not of MDPI and/or the editor(s). MDPI and/or the editor(s) disclaim responsibility for any injury to people or property resulting from any ideas, methods, instructions or products referred to in the content. |
© 2026 by the authors. Licensee MDPI, Basel, Switzerland. This article is an open access article distributed under the terms and conditions of the Creative Commons Attribution (CC BY) license.