


Abstract
Lithium-ion batteries are widely used in various energy sectors, and accurately predicting their early remaining useful life (RUL) is crucial for shortening battery evaluation time and accelerating battery commercialization. However, information on degradation during the early cycling stages of batteries is limited, and it is difficult to fully characterize their lifespan. This study proposes a CNN–Transformer–BiGRU-based method for predicting the early RUL of lithium-ion batteries using Grey Wolf Optimization (GWO). First, using only the first 100 cycles of each battery in the MIT dataset, early degradation features are extracted from the dimensions of capacity and internal resistance, and then standardized. Second, a CNN is employed to extract local degradation features, while the Transformer’s self-attention mechanism is used to capture global correlations, and BiGRU is utilized to further extract bidirectional temporal dependency information. Building on this foundation, GWO is introduced to perform joint optimization of the model’s key hyperparameters to obtain optimal network parameters. Finally, the effectiveness of the proposed method is validated through ablation and comparison experiments. The experimental results show that the proposed model achieved an R2 of 0.9633, with RMSE, MAE, and MAPE values of 80.5608 cycles, 63.2524 cycles, and 7.29%, respectively, demonstrating overall prediction performance superior to that of the comparison models. This method can effectively mine degradation information related to battery life from limited early-cycle data, providing an effective approach for the accurate prediction of the early RUL of lithium-ion batteries.
1. Introduction
Achieving carbon peaking and neutrality targets has led to a global emphasis on electrochemical energy storage and electrified transportation [1,2]. Lithium-ion batteries are preferred due to their energy density, lifespan, and cost-effectiveness, essential for energy storage and electric vehicles [3,4]. Prioritizing battery health management is crucial, with RUL as a key metric for lifecycle predictions, defined by a capacity reduction to 70–80% of its nominal value. However, compared to the mid- and late stages of battery degradation, the information available on degradation during the early stages of cycling is relatively limited. Therefore, determining how to use a small amount of early-cycle data to accurately predict long-term battery life trends is of even greater practical significance for shortening life testing cycles and improving the efficiency of battery R&D.
If battery lifespan can be accurately predicted in the early stages, the design and development of lithium-ion batteries can be significantly expedited. For instance, if only the first 100 cycles are analyzed to predict the RUL of a battery with a total lifespan of 2500 cycles, it can obviate the need for testing the remaining 2400 cycles, thereby accelerating the battery development process. Early predictions of battery RUL can also help identify the effects of the fast charging process, allowing for adjustments to charging strategies to prolong battery life. Furthermore, during the manufacturing process, manufacturers can assess battery quality through several cycles and detect abnormalities in advance [5]. Therefore, accurate early predictions of battery remaining service life expedite the assessment of battery longevity across various manufacturing processes and accelerate the commercialization of battery products.
1.1. Literature Review
Current strategies for predicting RUL can be broadly classified into two primary categories: model-based empirical methods and data-driven approaches [6]. The former employs mathematical formulations to elucidate the connections between battery deterioration and cycle counts, relying on existing data to extrapolate future predictions [7]. For instance, He et al. proposed an empirical model based on the physical degradation behavior of lithium-ion batteries [8]. This model integrates the Dempster–Shafer Theory (DST) and Bayesian Monte Carlo (BMC) techniques to forecast the RUL of batteries. Furthermore, Downey et al. used mathematical equations to simulate the electrochemical behavior inside the battery, enabling the analysis of various simultaneous degradation processes. This comprehensive analysis subsequently feeds into a nonlinear framework for real-time RUL predictions [9]. Despite their utility, empirical model-based strategies necessitate a comprehensive understanding of battery aging trajectories and heavily depend on the precision of their model parameters. Given the intricate nature of battery degradation mechanisms [10], it is often only feasible to accurately determine these model parameters once the battery has substantially deteriorated, with a threshold frequently cited at around 30% degradation [11,12]. This limitation constrains the practical applicability of empirical methods. To mitigate this challenge, Tang et al. proposed an algorithm based on model transfer, which leverages insights gleaned from accelerated aging studies to enhance the predictive capabilities of the models [13]. However, it is noteworthy that to achieve reasonably stable prediction outputs, approximately 15% of aging data is still required. Consequently, in scenarios where only initial cyclic data are accessible, empirical model-based forecasting techniques are frequently deemed inadequate.
The methodology rooted in data analysis predominantly depends on artificial intelligence and statistical models, leveraging historical data related to battery charge and discharge cycles to unveil concealed information regarding the aging process of batteries and to estimate their remaining useful life (RUL). These data-centric techniques do not directly factor in the electrochemical properties of lithium-ion batteries, which can enhance their practicality in real-world applications. Numerous data-driven strategies for predicting RUL have been explored, such as Naive Bayes [14], Correlation Vector Machines [15], Gaussian Process Regression [16], and Deep Learning [17]. Although these RUL prediction models demonstrate considerable accuracy, they require a vast amount of historical data for the development of long-term forecasting models. In general, these methodologies necessitate more than 50% of the available battery data; consequently, a lack of sufficient capacity data can obstruct the precise early forecasting of RUL. Another notable issue that influences the efficacy of these models is the occurrence of capacity regeneration. This abrupt capacity recovery renders data-driven approaches especially sensitive to the input data provided; hence, the creation of robust early RUL prediction models that rely on a reduced volume of data could significantly enhance the attainment of high accuracy in practical scenarios.
Tong et al. proposed a forecasting algorithm that combines the features of Adaptive Dropout Long Short-Term Memory (ADLSTM) and Monte Carlo (MC) simulation [18]. This algorithm employs Bayesian optimization to refine the adaptive dropout methodology. Remarkably, this approach delivered precise predictions using merely 25% of the available degradation data. Nevertheless, it mainly succeeded in identifying the general trend in capacity degradation, often missing scenarios in which capacity recovery could occur. Yan et al. proposed a hybrid framework that merges model-based and data-driven methods by dynamically updating empirical model parameters through particle filters and enhancing data-driven model performance via artificial swarm algorithms, effectively improving the accuracy of early predictions regarding battery remaining service life [19]. Tang et al. developed a hybrid deep learning model that integrates convolutional neural networks (CNN) with long short-term memory (LSTM) networks for early predictions of lithium-ion battery lifespan [20]. Experimental results indicate that the model demonstrates superior accuracy and stability compared to traditional methods. Ma et al. proposed a two-stage comprehensive method for predicting lithium-ion battery RUL based on CNN and Gaussian Process Regression (GPR) [21], applying the GPR algorithm for early RUL predictions on each test lithium-ion battery (LIB). Experimental findings reveal that this method surpasses standard CNN and GPR-based RUL prediction techniques. Recent advancements in predicting the lifespan of lithium-ion batteries have been marked by a variety of innovative methodologies. Meng et al. introduced a few-shot, multi-scenario transfer learning framework, integrating Gated Recurrent Units (GRUs) with CNNs for accurate forecasting of battery aging trajectories during early cycling stages [22]. Similarly, Deng et al. developed a physics-informed machine learning (PIML) framework that features both physical and data-driven components, enhancing prediction under fast charging conditions [23]. Lai et al. proposed a data-driven algorithm for predicting remaining useful life (RUL), emphasizing improved output generation to bolster accuracy and generalization capabilities in battery assessments [24]. Safitri et al. combined GRU and Long Short-Term Memory (LSTM) networks to forecast the end-of-life (EoL) of batteries, utilizing voltage and current data from initial cycles and employing efficient feature extraction techniques [25]. In a further innovation, Cui et al. presented a joint prediction method incorporating battery cycle life and inflection point characteristics, accommodating nonlinear aging behaviors [26]. Lastly, Hou et al. introduced a hybrid clustered CNN model, merging manually extracted and machine learning-generated features for enhanced degradation characterization [27]. Collectively, these studies reflect a paradigm shift towards integrative approaches that synergize theoretical insights with empirical data, thereby optimizing the predictive capabilities for lithium-ion battery performance and longevity.
In recent times, the Transformer, an advanced deep learning model that leverages self-attention mechanisms, has achieved remarkable outcomes in various domains, including natural language processing and computer vision [28]. This model enables networks to autonomously identify essential features without dependence on traditional recursive or convolutional architectures, thereby facilitating improved parallel processing and overall efficiency. Furthermore, by employing attention mechanisms, Transformers can effectively capture global dependencies within input sequences, which results in enhanced performance for tasks involving temporal predictions. For instance, Cai et al. introduced a hybrid model combining CEEMDAN, Transformer, and Deep Neural Networks (DNN) for RUL predictions, demonstrating the capability to attain high accuracy using only 25–30% of the total lifetime data [29]. Similarly, Zhao et al. developed a new multi-head self-focused multi-branch visual Transformer that relies solely on historical data from the initial 100 cycles and showcases promising results for early lifetime predictions [30]. Additionally, Gao et al. established a multi-stage time series processing framework based on attention mechanisms, facilitating automatic and comprehensive feature extraction without the need for explicit quantitative models [31]. An overview of the literature examined is summarized in Table 1.
Table 1.
Comparison of the literature on early prediction of battery remaining service life. Note: The checkmark (✓) indicates that the corresponding method adopts the algorithm or strategy listed in the table.
1.2. Research Gaps and Contributions
Based on the insights gathered from prior research, deep learning models are acknowledged for their ability to autonomously extract abstract features from unprocessed cycle data, offering advantages over conventional machine learning methods.
However, these models still encounter specific challenges. Firstly, a reliance on manually derived features and prior experience often limits the algorithmic frameworks, restricting their capacity to harness the full potential of available data. Secondly, early-stage lifespan prediction techniques predominantly emphasize voltage, temperature, and current curves during discharge cycles, neglecting critical information such as the per-cycle capacity. This study addresses these limitations by introducing an innovative deep learning model designated as GWO–CNN–Transformer–BiGRU, which has been rigorously validated. The principal contributions of this research are highlighted below:
(1) The development of the GWO–CNN–Transformer–BiGRU model facilitates an investigation into early predictions regarding the remaining lifespan of lithium-ion batteries. This model synergistically combines the global feature acquisition strengths of the Transformer with the localized feature extraction capabilities of CNNs and the temporal processing expertise of bidirectional gated recurrent units (GRUs). By optimizing the model’s hyperparameters using GWO, notable enhancements in performance and accuracy were achieved.
(2) The study yielded accurate early-stage lifespan predictions based solely on data acquired from the initial 100 charge–discharge cycles of the battery. Additionally, experiments were conducted utilizing a range of charging strategies from the MIT dataset, which affirmed the model’s ability to generalize effectively.
(3) The research utilized four distinct evaluation metrics, including RMSE, to quantify the model’s prediction accuracy. Moreover, comparative experiments alongside ablation studies featuring a variety of models were executed, thereby validating the superior performance and resilient predictive capabilities of the proposed model.
The remaining sections of this paper are systematically organized as follows: Section 2 delineates the problem at hand and defines the structural policy framework. Section 3 provides an in-depth explanation of the theoretical principles and architecture of the proposed model. Section 4 outlines the experimental methodologies and the evaluation metrics employed. Section 5 discusses the simulation experimental results, while Section 6 concludes with a thorough summary of the entire research findings.
2. Problem Description and Strategy
2.1. Problem Description
A critical challenge in the widespread utilization of lithium-ion batteries lies in accurately assessing their early RUL. Early RUL pertains to the precise evaluation of a battery’s performance and longevity during its formative usage stages. Numerous factors influence the aging process of lithium-ion batteries, including the frequency of charge–discharge cycles, the rates at which these cycles occur, ambient temperature, state of charge, and the chemical makeup of the battery. Given the intricate nature of aging mechanisms in the initial phases, reliably predicting a battery’s RUL proves to be a formidable task. Notably, the degradation of performance in lithium-ion batteries is nonlinear; performance may seem stable during early use, yet the deterioration rate can increase significantly as operational time extends. This nonlinear behavior poses additional challenges in the assessment of early RUL, complicating the evaluation process further. The selection of an appropriate model for predicting RUL is essential to address this issue. Current models—encompassing data-driven, physical, and hybrid methodologies—each present unique strengths and weaknesses, with their responsiveness to early-stage data differing widely. Ongoing research continues to focus on how to select and refine these models to better align with the distinct characteristics evident during the initial usage phase of lithium-ion batteries.
The early assessment of the RUL of lithium-ion batteries faces numerous challenges, stemming from the complexity of aging mechanisms, insufficient data, variable environmental factors, and differences in charging strategies. Continued exploration of new methods and technologies is essential to enhance the accuracy and reliability of predictions, ultimately extending battery life and reducing costs.
2.2. Strategy Structure
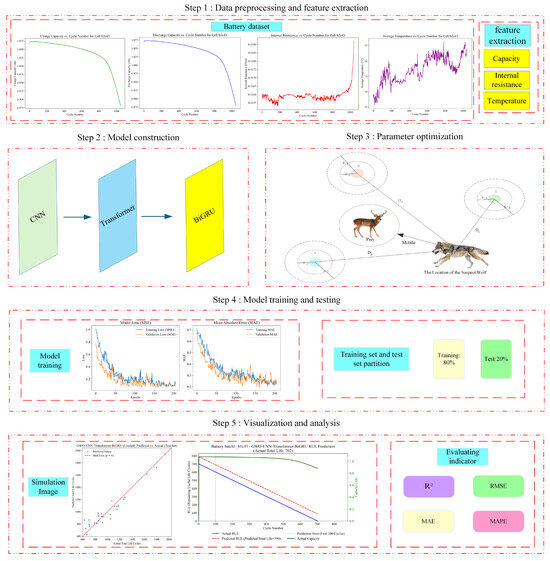
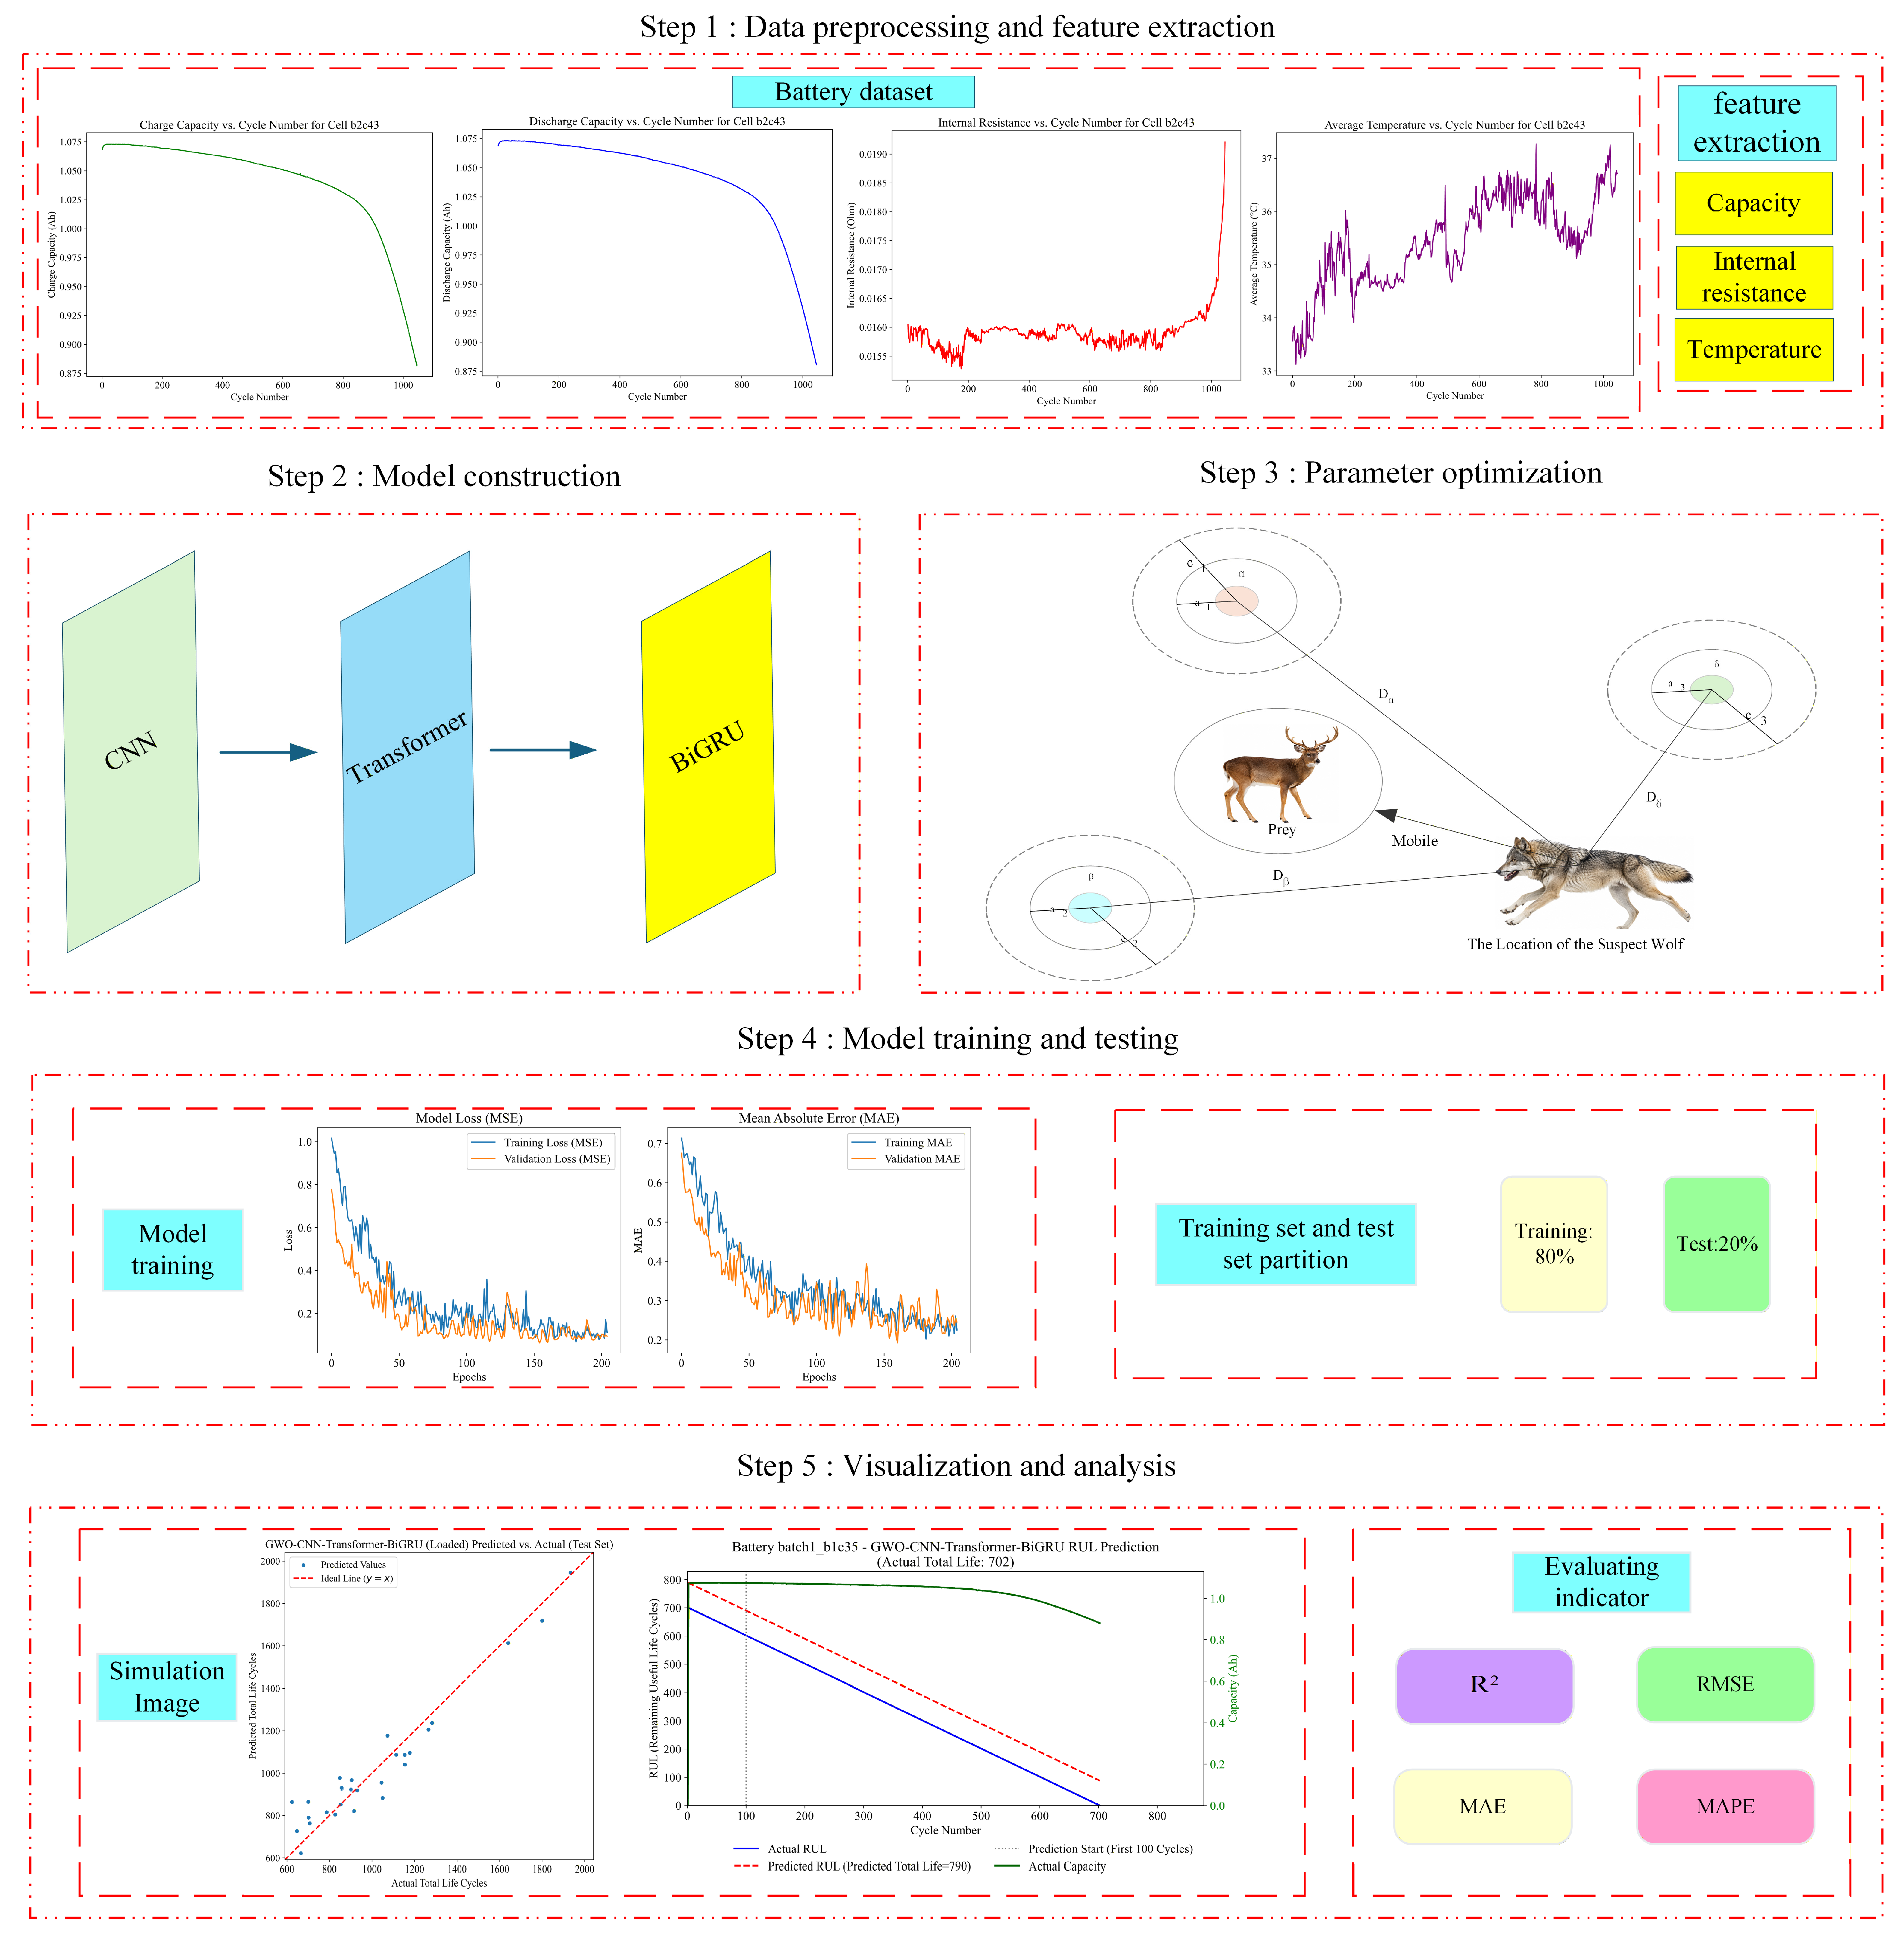
This research introduces a systematic approach for estimating the remaining lifespan of lithium-ion batteries in their early phases. The robust methodology involves data preprocessing, feature extraction, model development, hyperparameter optimization, and model training and testing, along with results visualization and analysis, as shown in Figure 1. This study emphasizes the critical need for reliable life predictions, enhancing battery management and decision-making in applications such as electric vehicles and energy storage systems.
Figure 1.
Early remaining useful life prediction framework for lithium-ion batteries.
Step 1: Data Preparation and Feature Selection.
This study employed data exclusively from the first 100 cycles, which underwent a thorough cleaning procedure. Key features were derived from the data captured during the early cycles, focusing chiefly on two essential dimensions: capacity and internal resistance. Following the extraction process, these features were normalized to ensure consistency and comparability.
Step 2: Model Development.
A variety of deep learning architectures were crafted and evaluated to investigate their effectiveness in predicting the early-stage RUL of batteries. In order to enhance scalability and adaptability, a range of distinct model architectures was generated using multiple defined functions, allowing for a comprehensive exploration of the performance differences among these models.
Step 3: Hyperparameter Optimization.
Hyperparameter optimization was performed using the Gray Wolf Optimization algorithm to enhance model performance and prediction accuracy.
Step 4: Model Training and Testing.
During model training, the Adam optimizer was employed, and the mean squared error (MSE) was used as the loss function. Additionally, an early stopping mechanism and a learning rate reduction callback were implemented to prevent overfitting and expedite convergence. After the completion of model training, predictions were made for the batteries in the test set and compared with the actual values.
Step 5: Visualization and Analysis.
To further analyze the performance of each model, predictions generated by the models were visualized alongside the actual RUL values, and comparison curves illustrating the differences between predicted and actual RUL were plotted. Furthermore, both ablation and comparative experiments were conducted to facilitate a more comprehensive comparison of the performance of different models in early RUL prediction.
3. Methods
3.1. Transformer Model
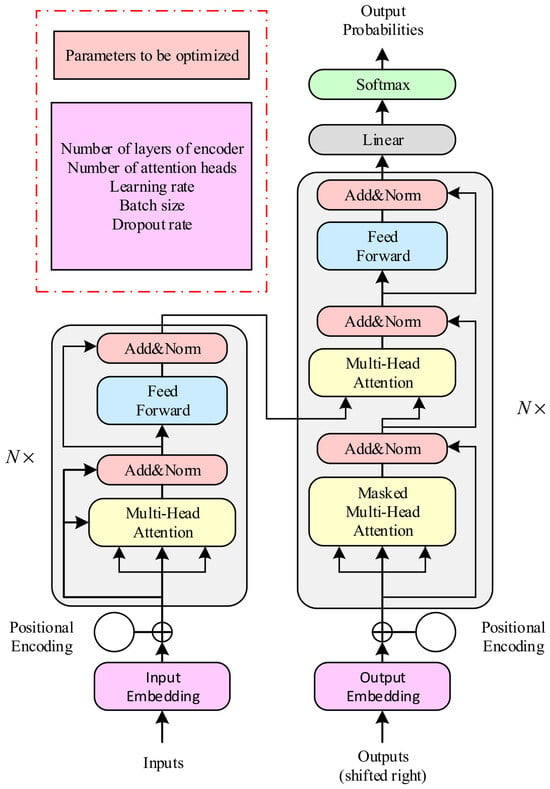
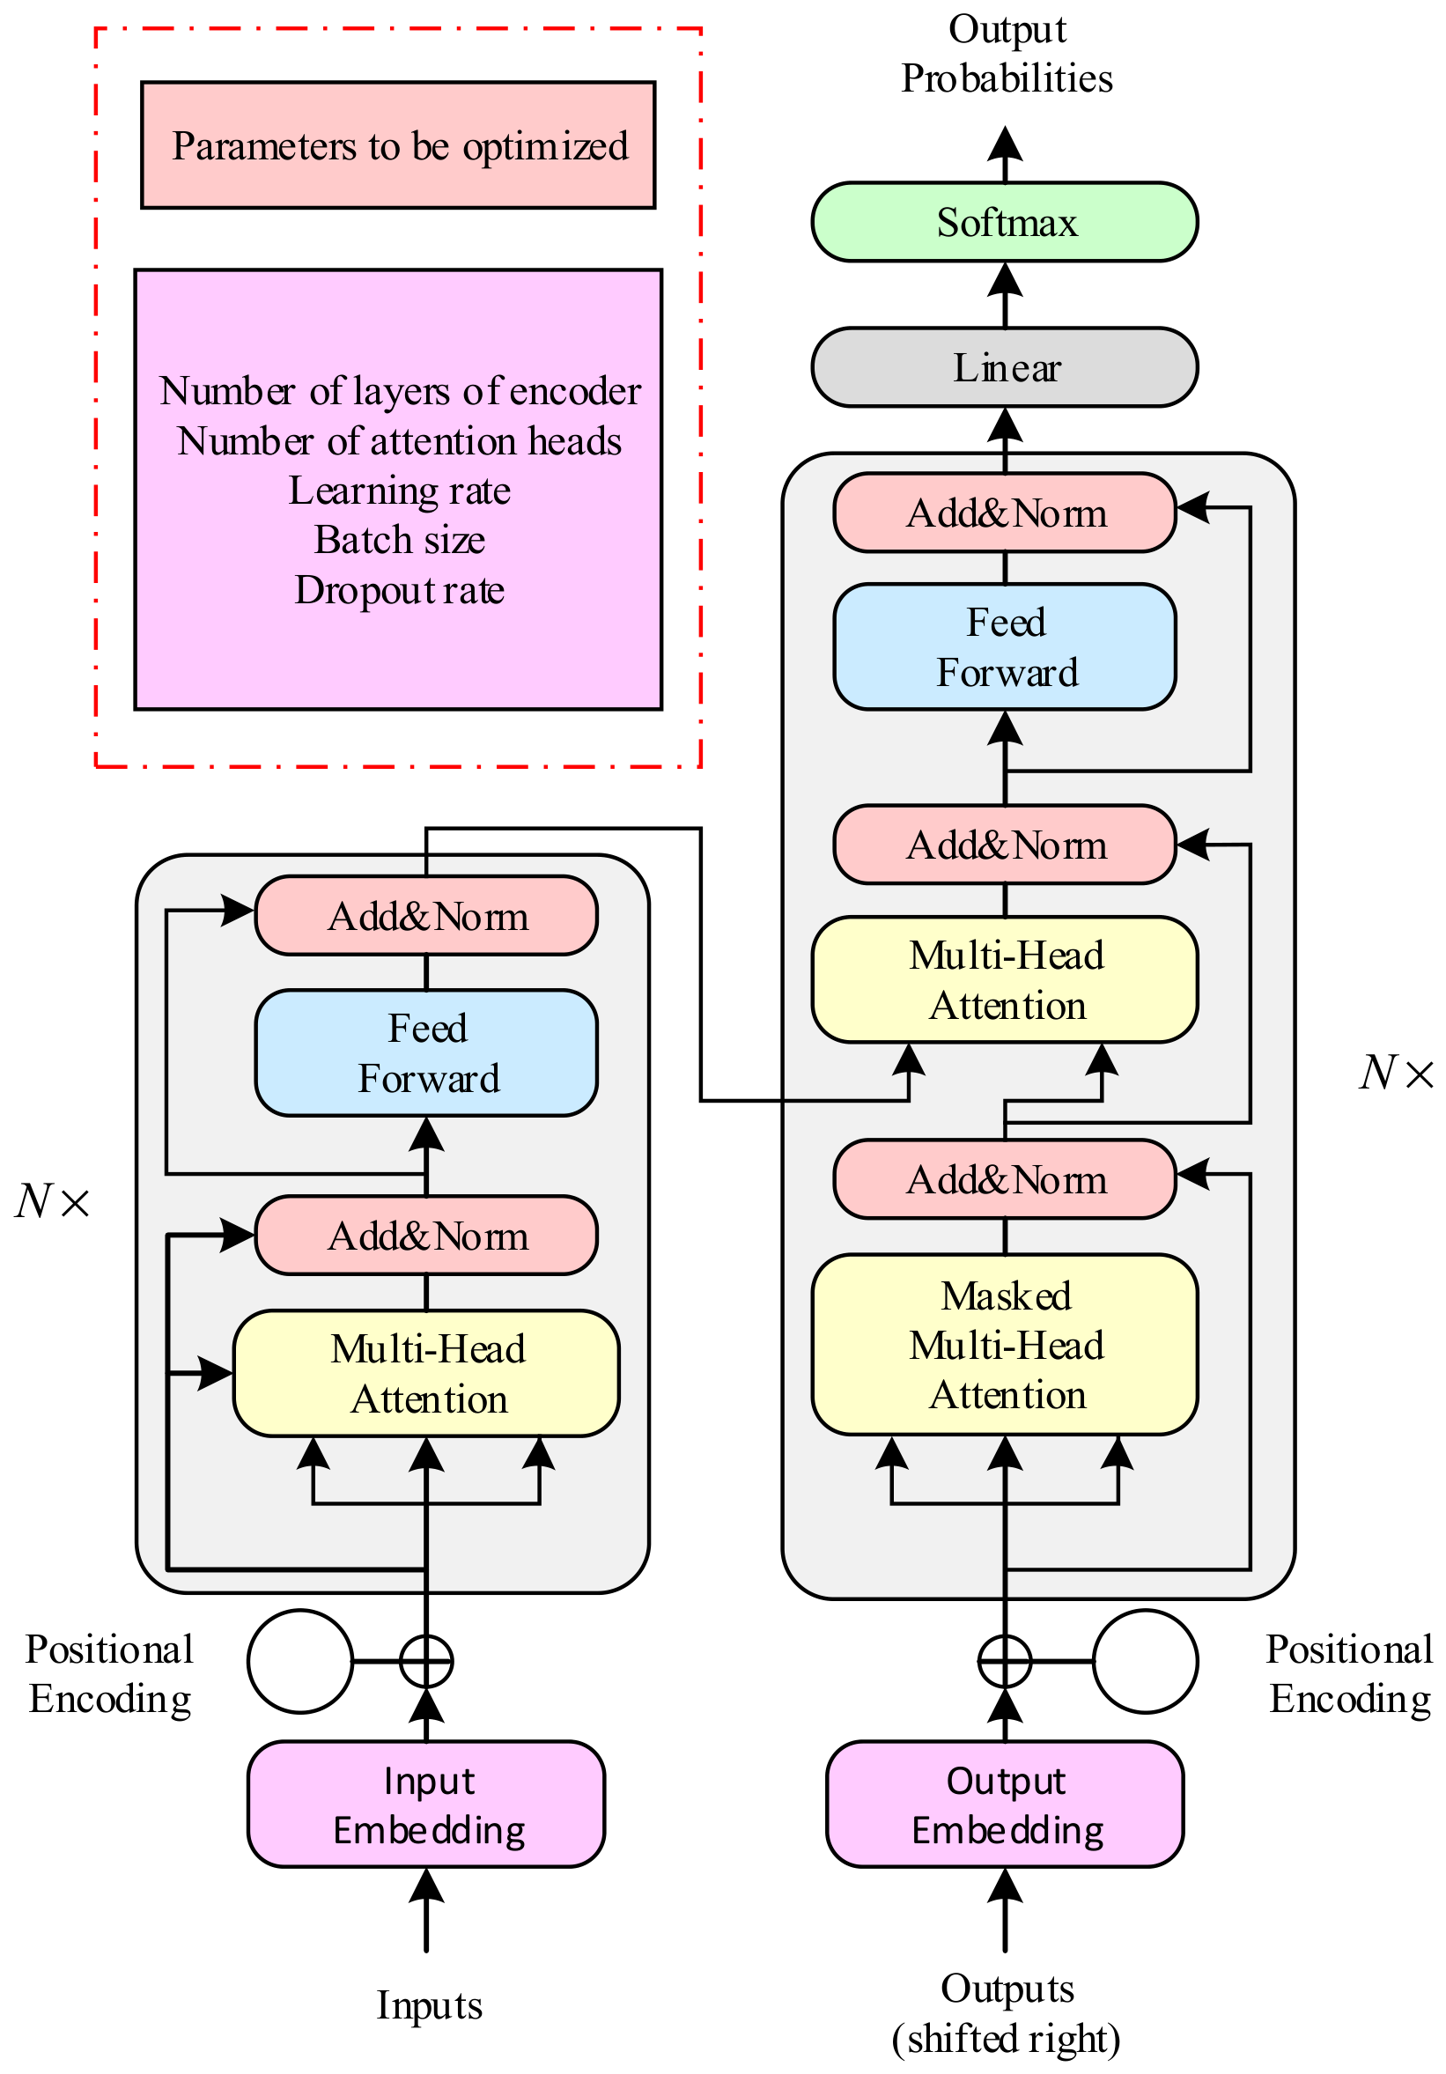
The Transformer model’s self-attention mechanism allows for focusing on varied locations within the input sequence, facilitating the automatic identification of essential features without relying on recursive or convolutional architectures. Utilizing a multi-head attention approach, it computes correlation weights among input elements, which are used to adjust and aggregate inputs into a refined feature representation. This model’s strengths in parallel computation and global dependency capture position it as a cornerstone of modern deep learning frameworks. In battery research, it efficiently processes key data features—like capacity and internal resistance—while effectively managing long-range temporal dependencies. Figure 2 illustrates the Transformer model’s structure and the optimized parameters used in this study. The model’s implementation promises to enhance battery performance predictions, showcasing the potential for advanced machine learning techniques to drive innovation within energy storage systems.
Figure 2.
Transformer model structure diagram.
3.2. Hyperparametric Optimization
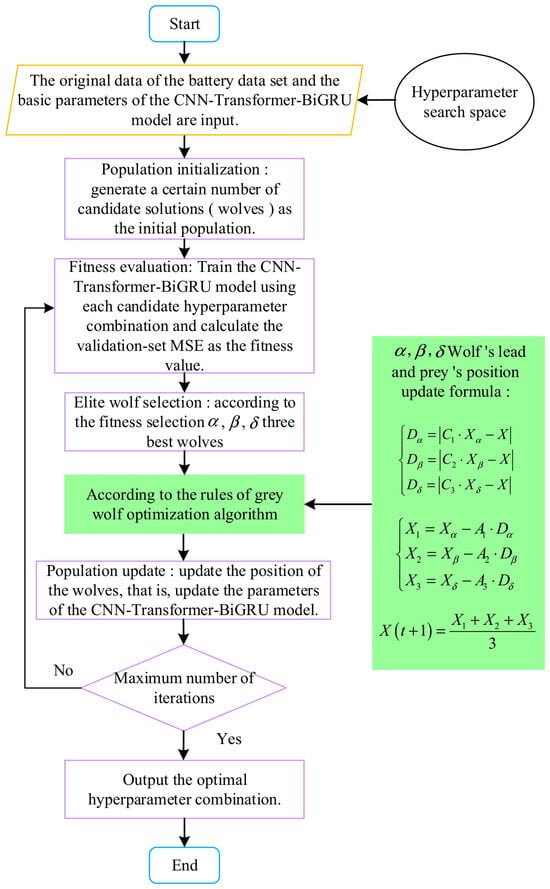
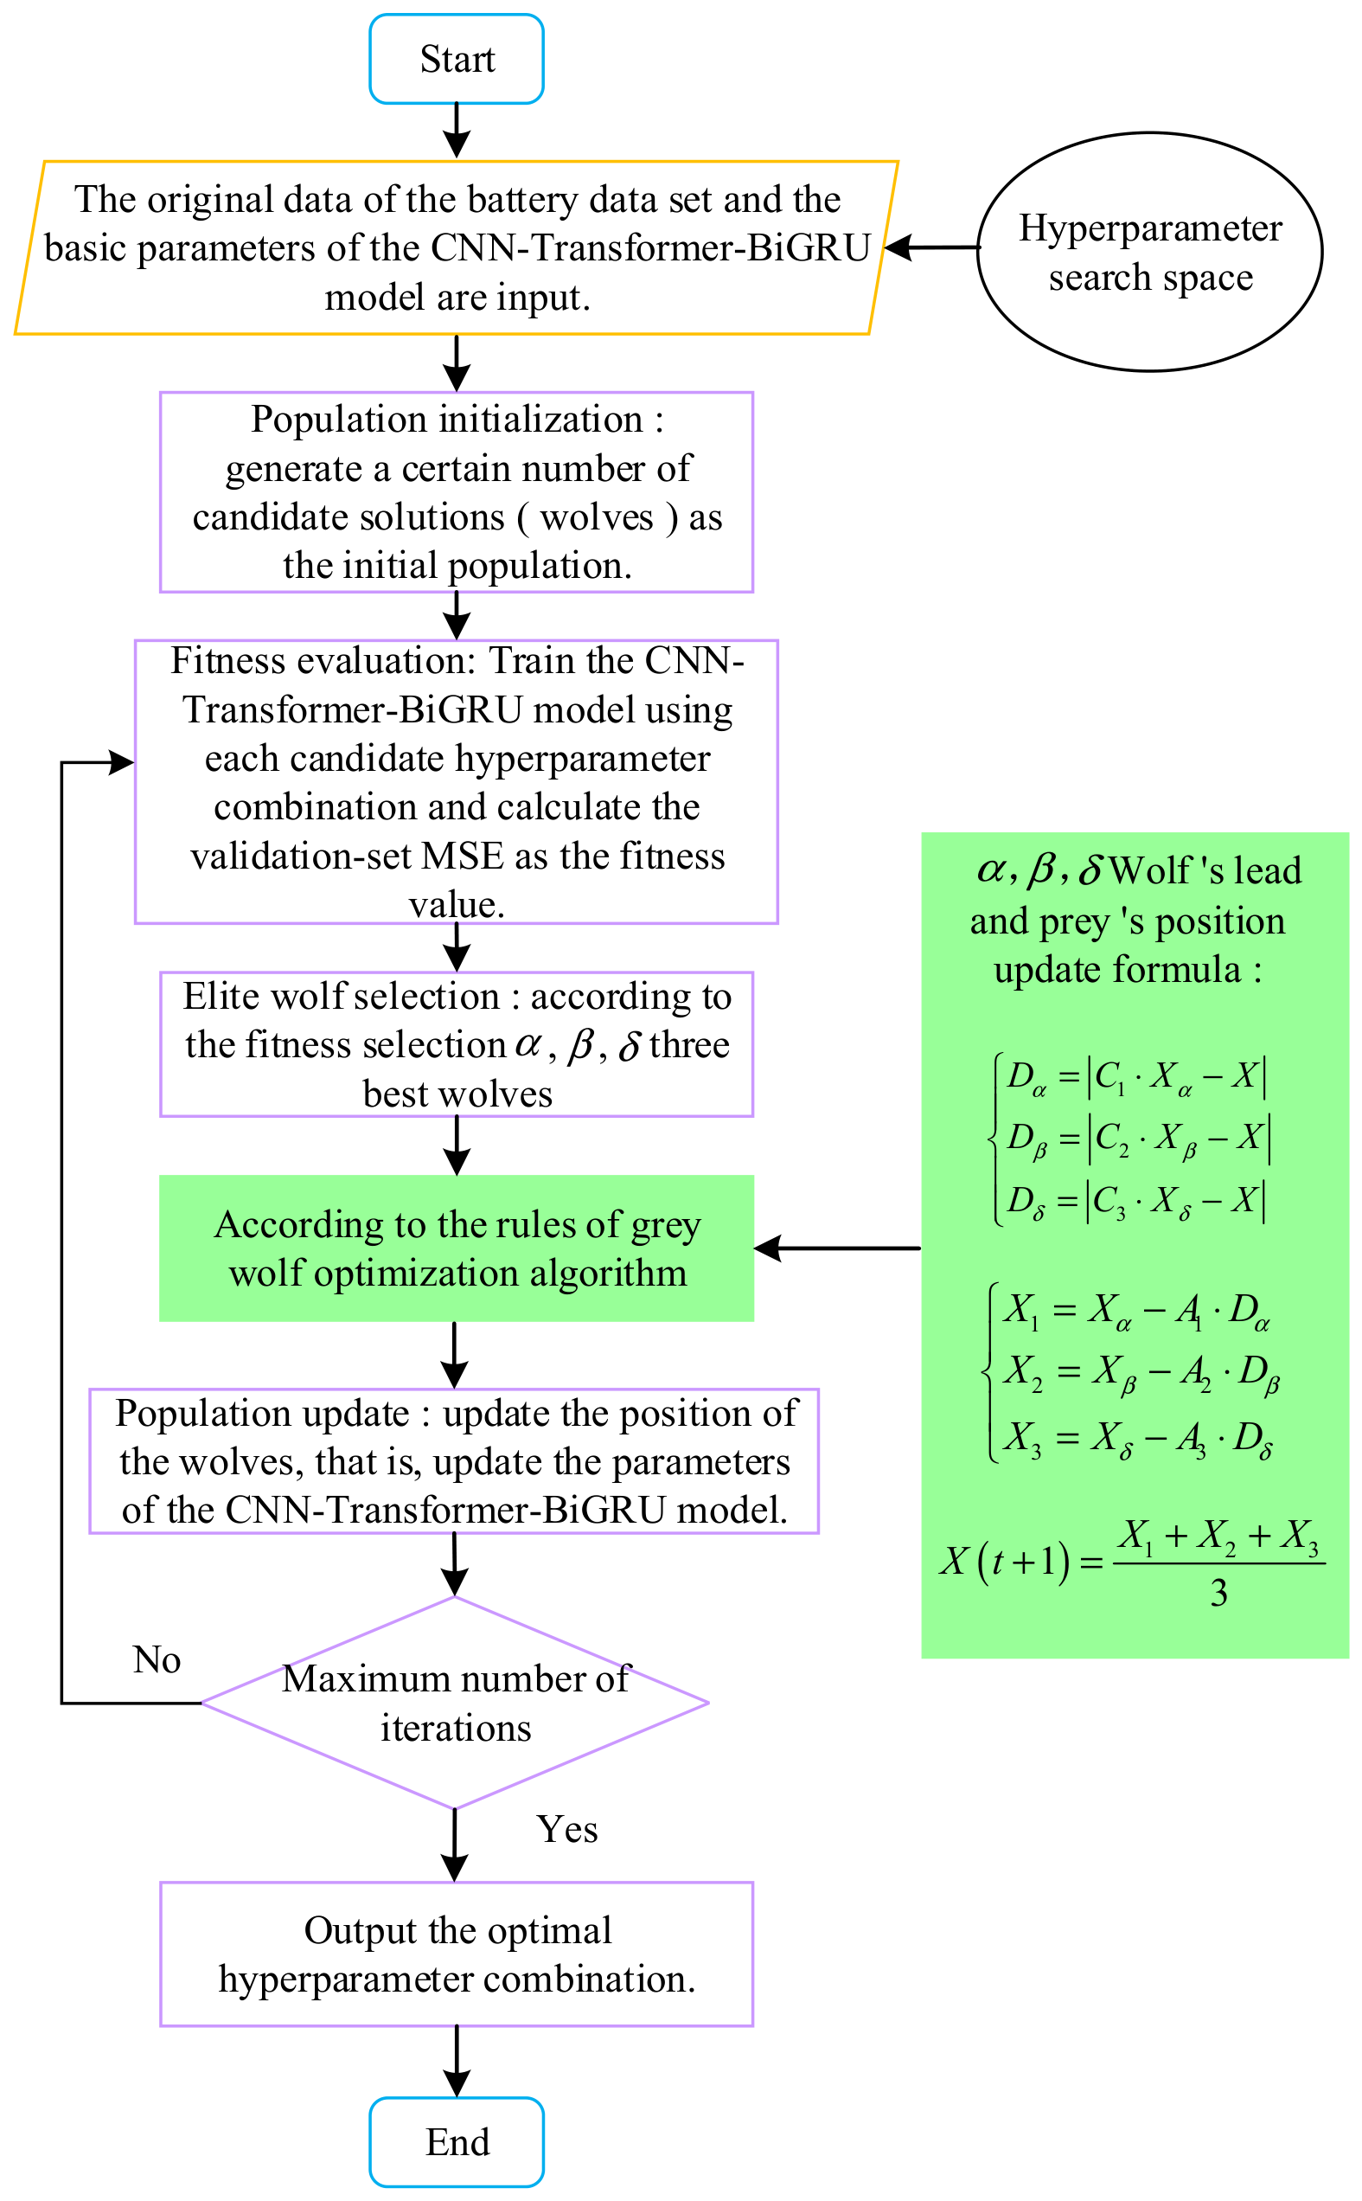
This study employs the Gray Wolf Optimization (GWO) algorithm to perform joint optimization of the key hyperparameters of the CNN–Transformer–BiGRU model. The position of each gray wolf represents a set of candidate hyperparameter combinations. The optimized parameters include batch size, learning rate, number of CNN convolutional kernels, attention head dimension, number of attention heads, feature dimension, number of GRUs, number of Transformer modules, dropout rate, and number of neurons in the MLP layer, among others. First, a population of gray wolves were randomly initialized within a preset hyperparameter search range, and the CNN–Transformer–BiGRU model was constructed using each set of candidate hyperparameters. To evaluate the performance of different parameter combinations, the mean squared error (MSE) on the validation set was used as the fitness function for GWO, as shown in the following formula:
where represents the number of candidate hyperparameter combinations, is the number of samples in the validation set, and are the true RUL and predicted RUL, respectively; a smaller fitness value indicates a better parameter combination. Based on fitness values, the current best, second-best, and third-best gray wolves are defined as wolves , , and , respectively, while the remaining candidate individuals are defined as wolf . Wolf represents the current optimal hyperparameter combination; wolves and are used to assist in determining the direction of subsequent searches. , , and represent the search distances between the current gray wolf and the three leading wolves, respectively, while A and C are position update control coefficients used to adjust the search direction and search range; The control parameters gradually decrease with each iteration, enabling the algorithm to transition from an initial broad-range global search to a later-stage localized, refined search. Under the joint guidance of wolves , , and , the remaining gray wolves continuously update their positions—that is, they generate new candidate hyperparameter combinations—and the model training and fitness calculations are repeated. In this study, the maximum number of iterations is set to . Once the maximum number of iterations is reached, the search stops, and the parameter combination corresponding to the final wolf is adopted as the optimal hyperparameter configuration for the CNN–Transformer–BiGRU model. Additionally, to improve the reproducibility of the optimization process, a fixed random seed is used, and Table 2 further provides the search bounds and final optimal values for each hyperparameter to be optimized. The specific algorithm flowchart is shown in Figure 3.
Table 2.
Hyperparameters of the CNN–Transformer–BiGRU model after GWO optimization.
Figure 3.
Super-parameter optimization based on GWO.
3.3. Prediction Model for the Early-Stage Remaining Service Life of Lithium-Ion Batteries
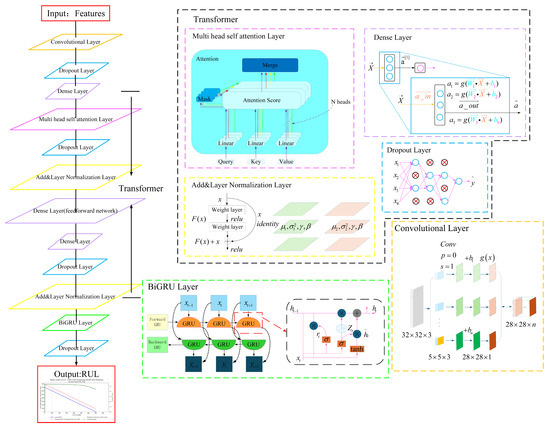
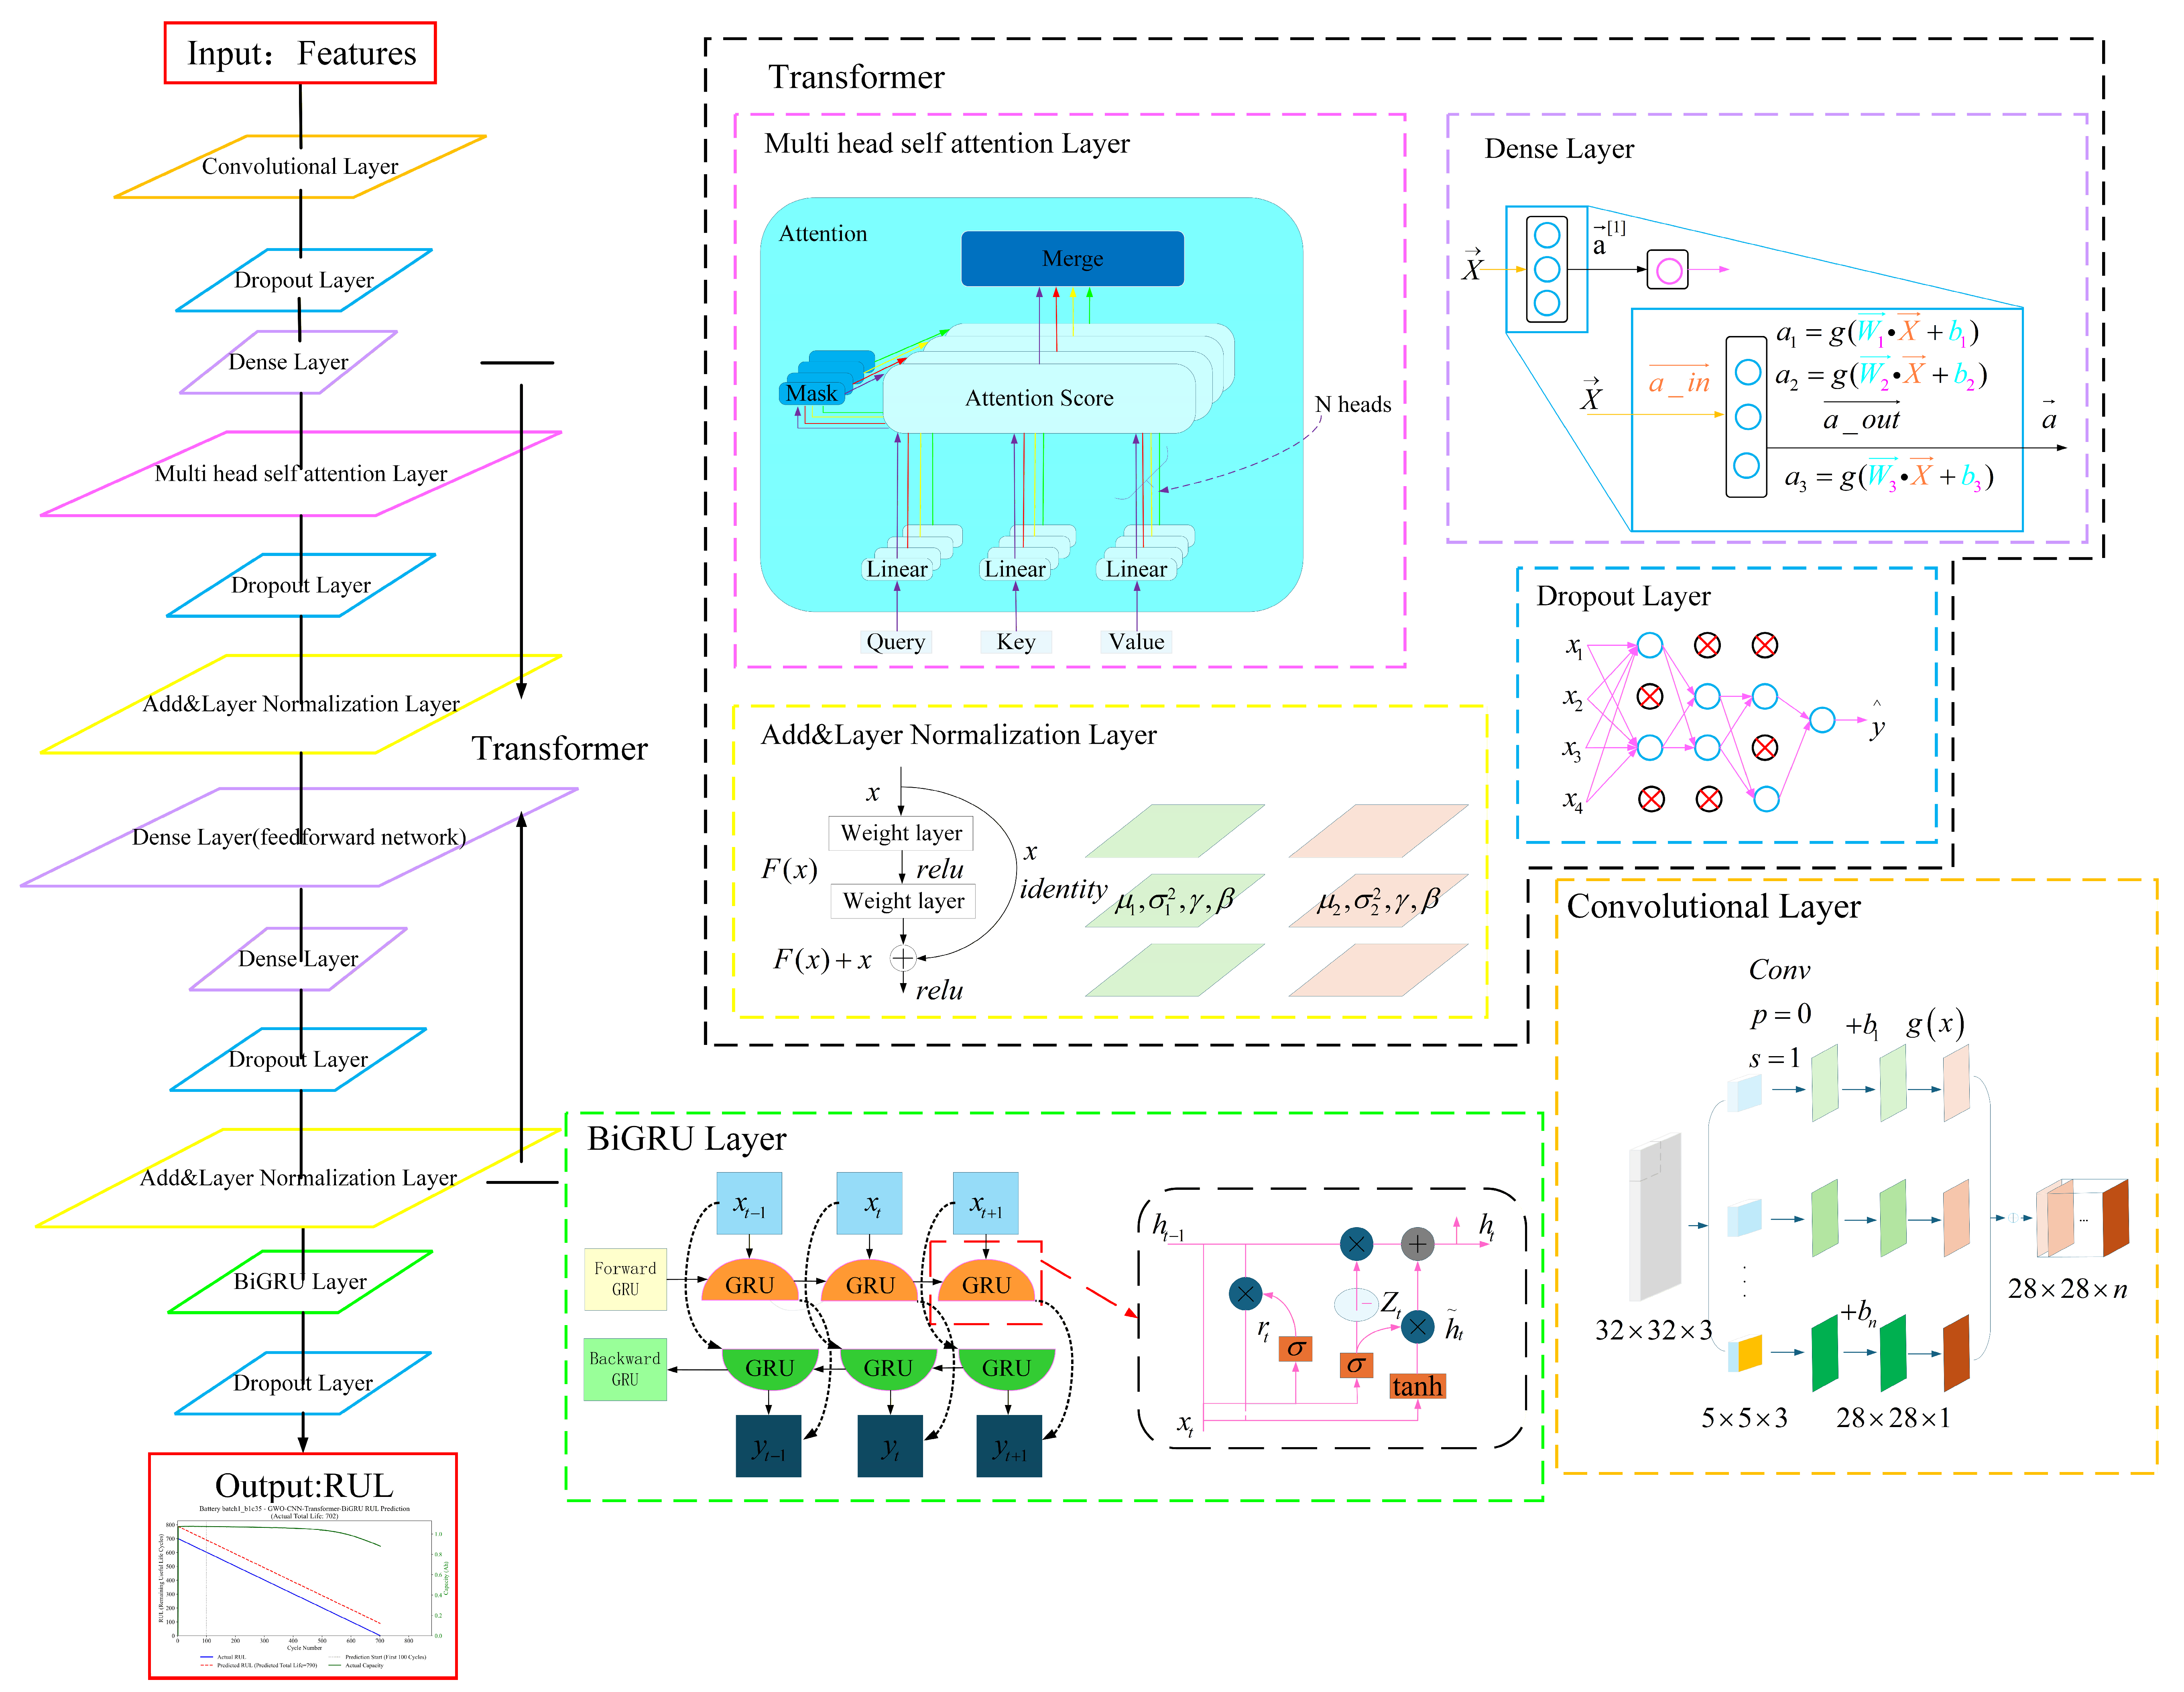
By synthesizing three distinct model architectures—CNN, Transformers, and BiGRU—we have constructed a robust multi-tier framework for analyzing sequential data, specifically tailored to tackle the intricate and multifaceted difficulties associated with predicting the RUL of batteries at early stages of their lifecycle. The CNN module extracts local spatial features from input variables (such as capacity, internal resistance, and temperature during the battery’s early cycles) and employs two one-dimensional convolution layers (Conv1D) to process the three-dimensional input data (number of samples, time steps, and number of features). The convolution kernels capture local patterns and relationships among features (such as trends in capacity over cycles), thereby providing higher-level feature representations for the subsequent Transformer and BiGRU modules and enhancing the model’s ability to extract features related to battery health. The Transformer module utilizes a Multi-Head Attention mechanism to capture global dependencies and long-term sequence patterns among input characteristics, focusing on the interactions between different cycle features (such as the correlation between early and late cycles), thereby improving the model’s capacity to model complex battery degradation dynamics. The BiGRU module processes the Transformer’s output through bidirectional GRU layers to capture temporal dependencies in the time series. This bidirectional design enables the model to simultaneously consider past and future contextual information, making it particularly suitable for modeling dynamic changes during the battery degradation process (such as trends in capacity decay). The BiGRU integrates the sequential information into a fixed-length feature vector, which is subsequently employed by fully connected layers to predict the remaining useful life (RUL), thereby enhancing the model’s robustness in time series prediction. Figure 4 illustrates the basic structure of the predictive model.
Figure 4.
Schematic Diagram of the CNN–Transformer–BiGRU Model.
4. Experiment
4.1. Data Description
This study uses the publicly available lithium-ion battery cycle life dataset published by Severson et al. [32], which consists of observations gathered from the cycling performance of 124 lithium iron phosphate (LFP) graphite batteries—specifically, the A123 Systems model APR 18650 M1A, which has a nominal capacity of 1.1 ampere-hours (Ah). Data were collected under a range of rapid charging conditions while ensuring that discharge conditions remained consistent within a climate-controlled environment maintained at 30 °C. 30 °C was not an operating temperature arbitrarily selected for this study, but rather the experimental condition specified in the original dataset. A constant temperature minimizes the additional impact of ambient temperature fluctuations on the battery degradation process, allowing for a comparison of lifespan differences under various fast-charging strategies within a relatively consistent thermal environment. Cycle life is characterized as the number of charging cycles needed to diminish the battery’s capacity to 80% of its nominal specification. In this instance, the lifespan of these batteries spans a considerable range—from 150 cycles to as many as 2300 cycles. This dataset serves a pivotal role in evaluating the predictive accuracy of the proposed methodology concerning cycle life and battery performance across different charging protocols. This public dataset is available through the MATR data warehouse. The data can be accessed at: https://data.matr.io/1 (accessed on 5 March 2026).
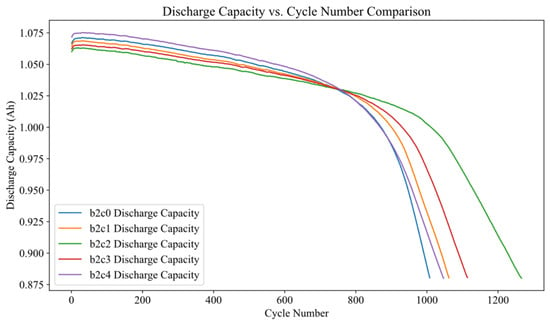
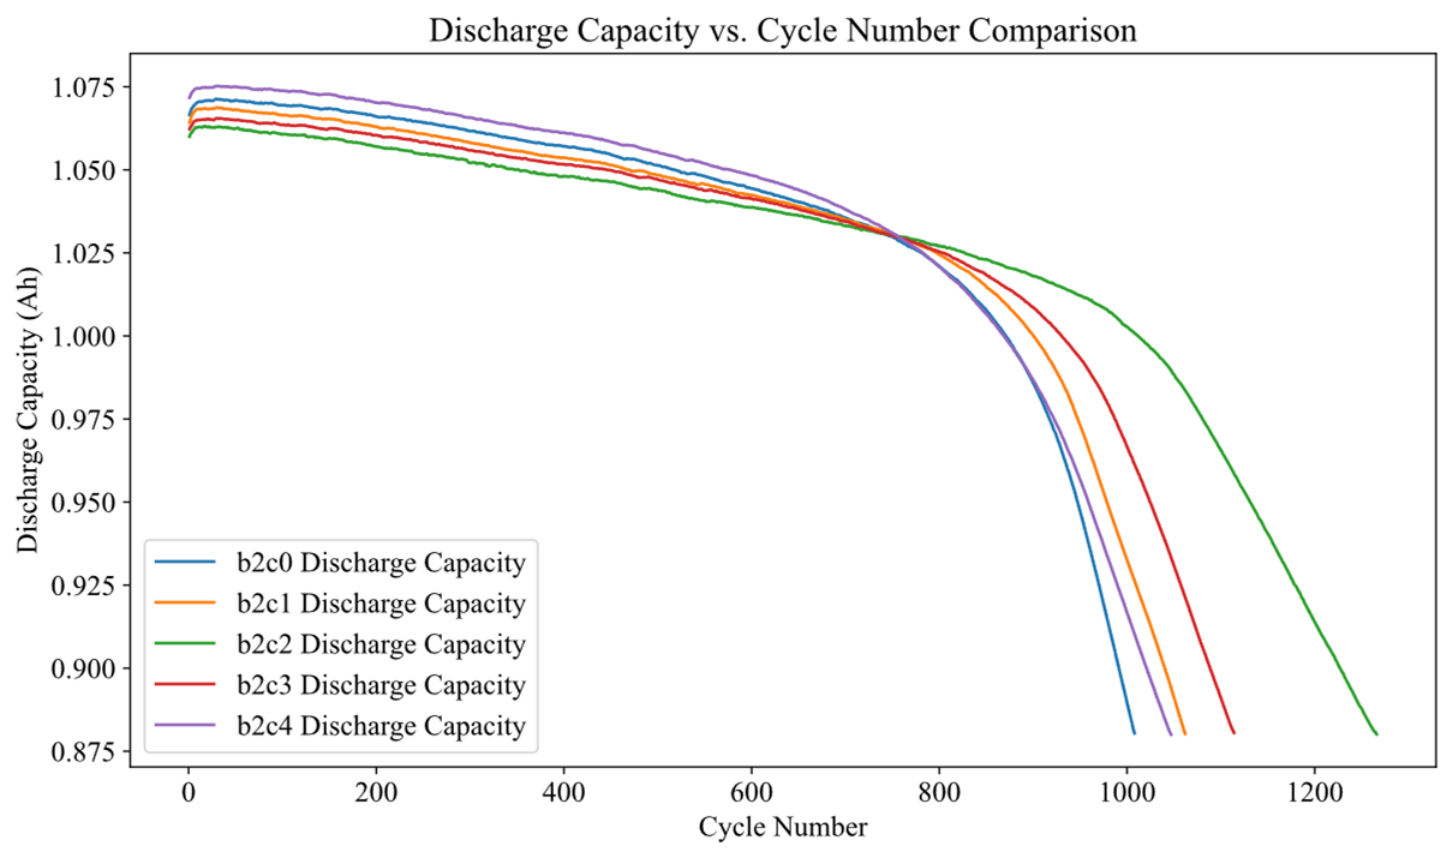
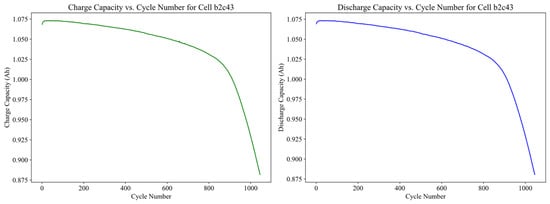
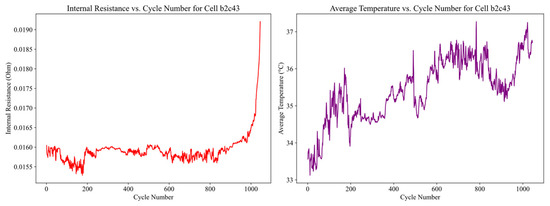
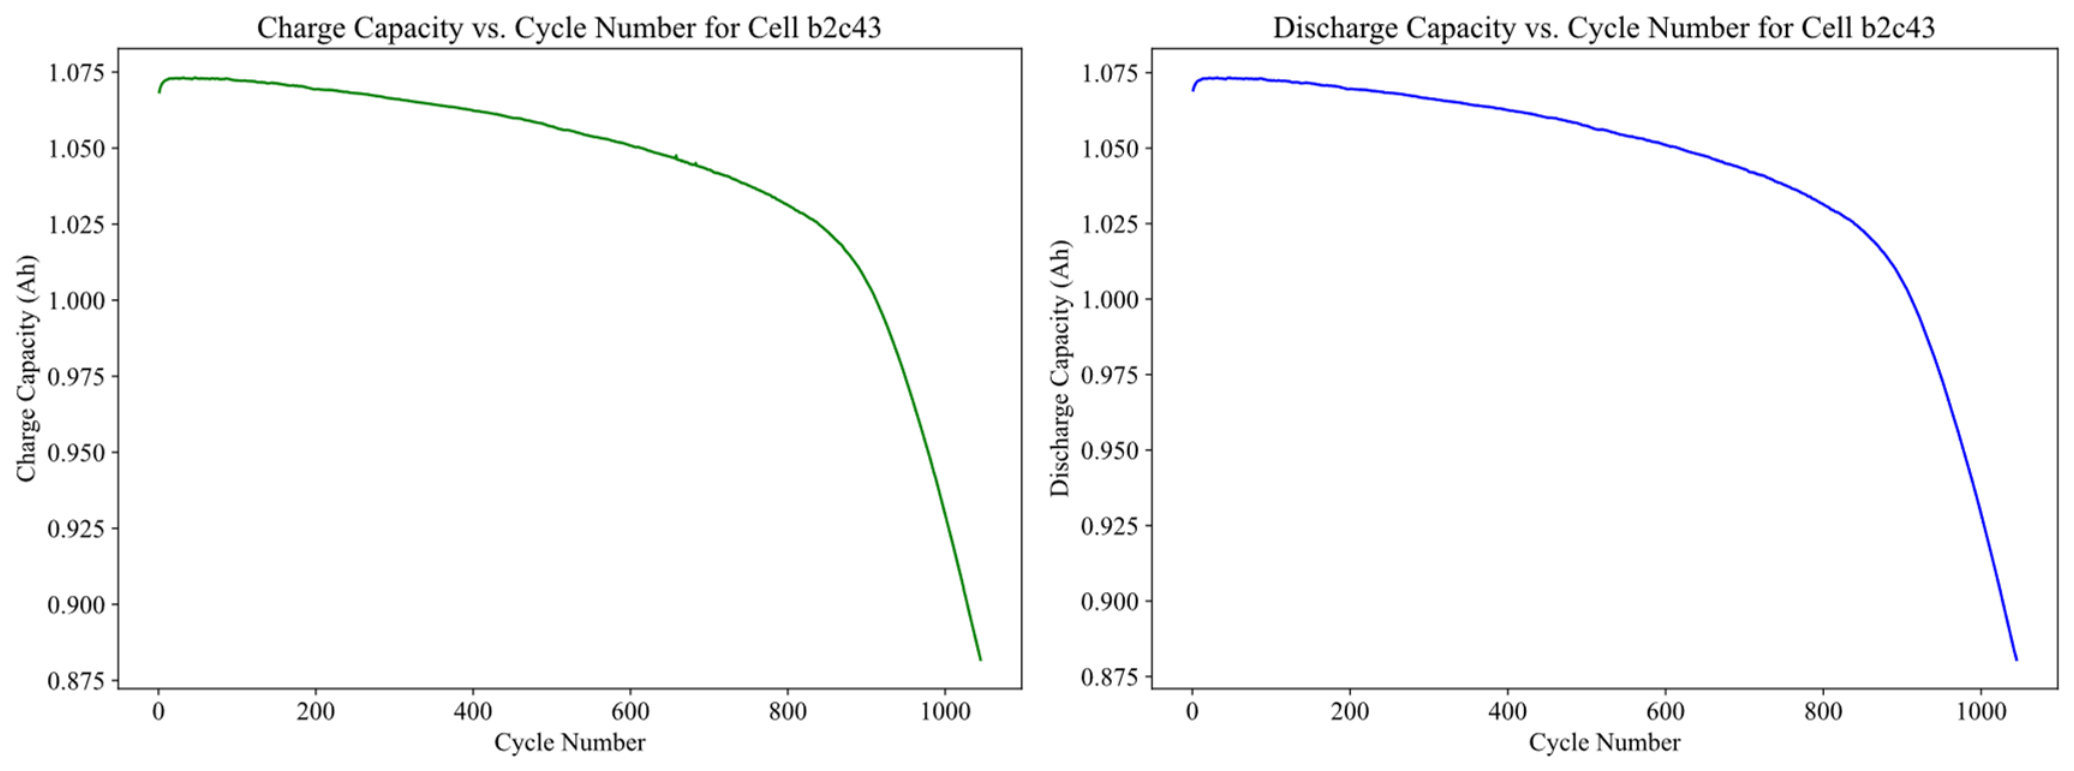
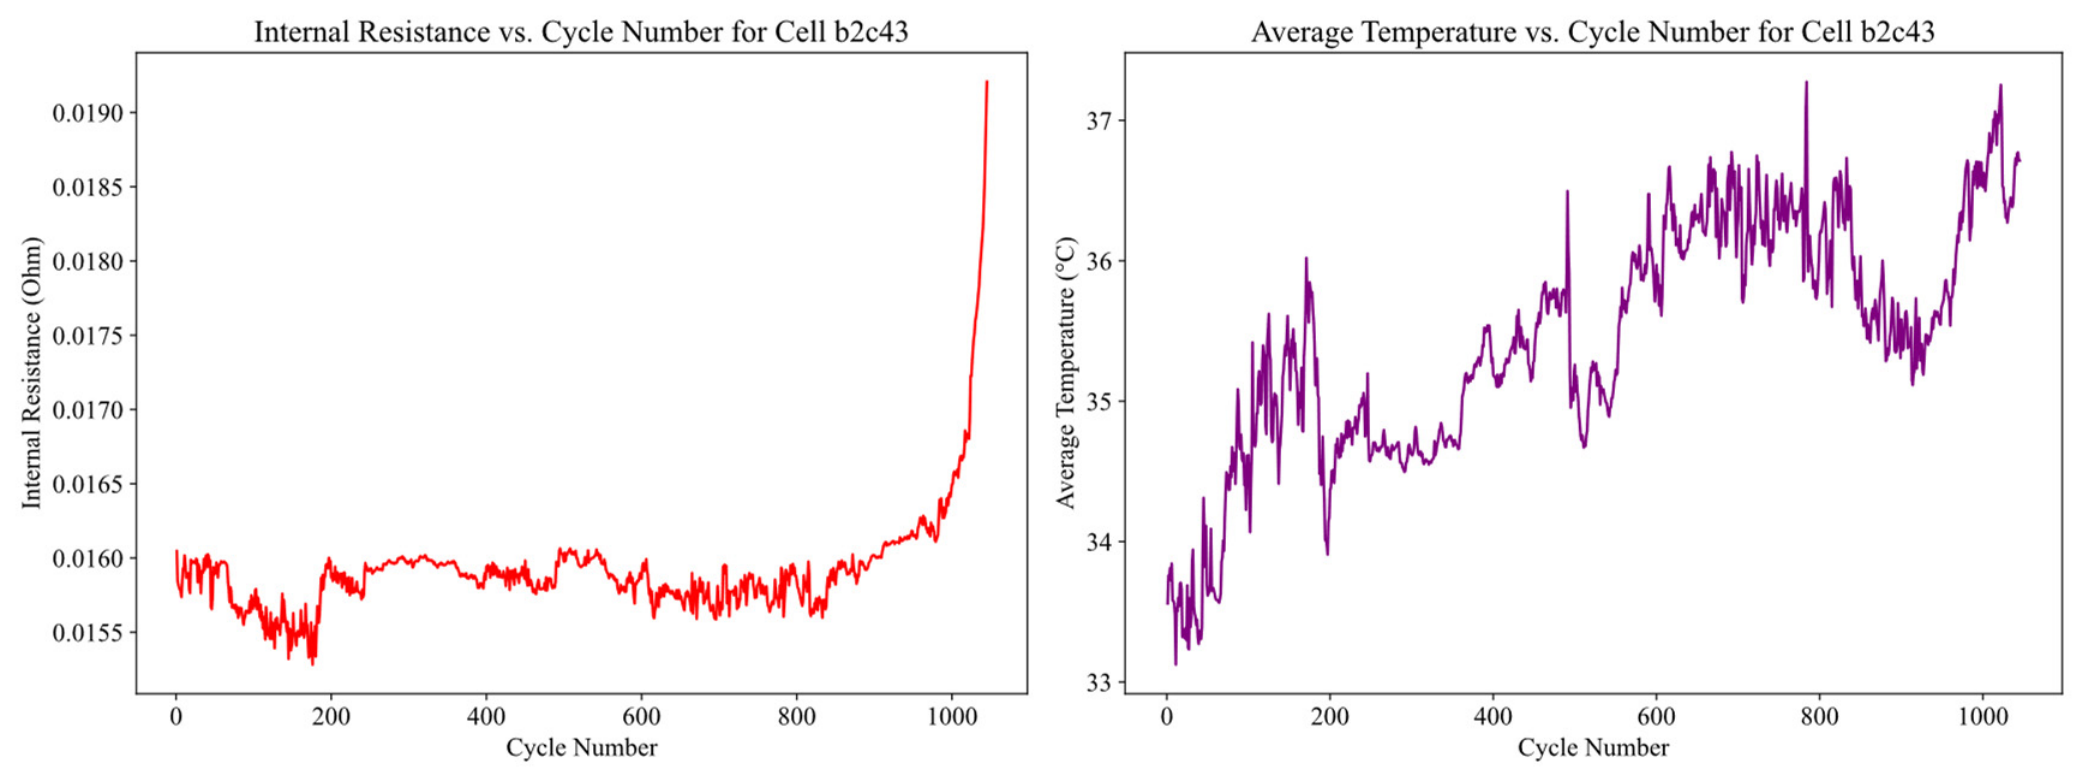
Figure 5 demonstrates the trends in capacity decay for a selected group of batteries within the dataset. The graphical representation reveals a distinct decline in battery capacity, which serves as the most immediate indicator of the degradation process. As depicted, with the increasing number of cycles, the trend towards capacity degradation intensifies for each battery. Notably, in the initial 100 cycles, degradation is relatively minimal, complicating the direct prediction of battery lifespan based solely on capacity variations observed during the early discharge phase. To further analyze battery performance, summary metrics such as cycle count, charge and discharge capacities, internal resistance, and average operational temperature were collected. An illustrative example is highlighted using battery b2c43 (the 43rd unit from the second batch), as shown in Figure 6. The extracted data provides a comprehensive reflection of the battery’s physical performance characteristics, serving as a foundation for subsequent feature extraction aimed at predicting battery longevity.
Figure 5.
Capacity decay curve.
Figure 6.
Summary data of battery b2c43.
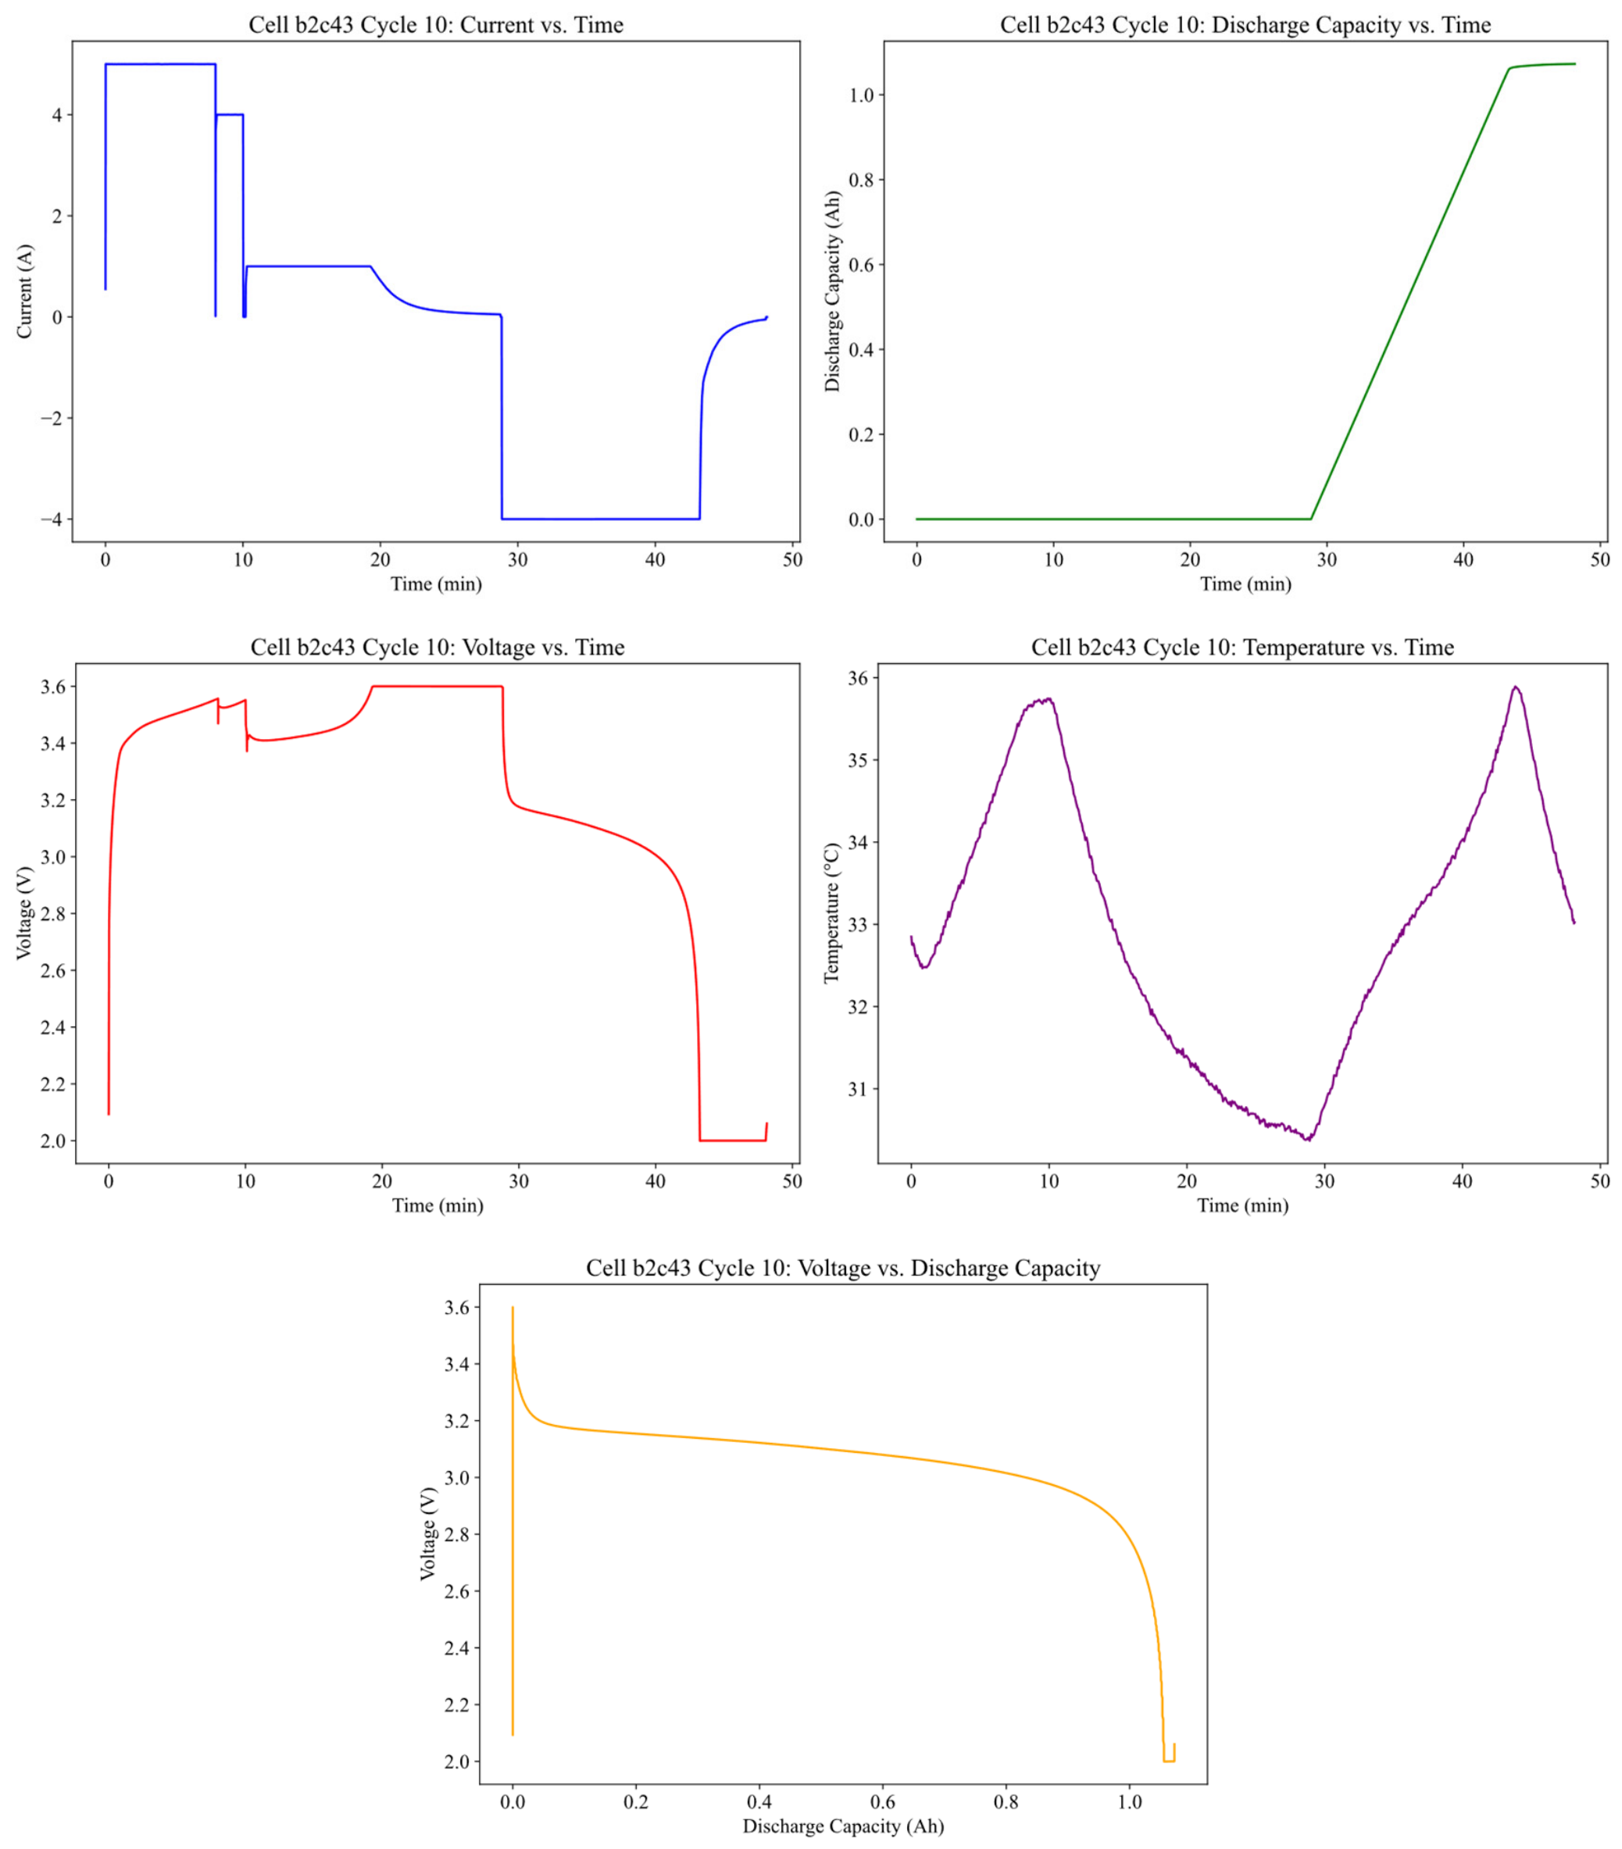
The data summarizing the 10th cycle of battery b2c43 is depicted in Figure 7. In panels (a) to (c), the charge–discharge methodology is presented. Initially, in a single charge cycle, the battery undergoes a rapid charging process identified as “C1 (Q1)–C2.” Here, C1 and C2 denote the current rates applied during distinct phases of the charging process, while Q1 indicates the state of charge (SOC) at which the current shifts. The charging process starts by elevating the battery’s SOC to a specified level, followed by a constant current charging at rate C2 until an 80% SOC is achieved. Subsequently, the battery is charged at a constant current of 1C, maintaining a fixed voltage, until the maximum voltage threshold of 3.6 V is attained. During the discharge phase, all batteries are discharged at a consistent current of 4C until the voltage drops to the lower cutoff point of 2.0 V. Additionally, Panel (d) depicts the temperature variations observed throughout both charging and discharging cycles. Panel (e) presents graphical representations of terminal voltage and capacity during the discharge process. Given the designed operation of discharging at a stable current of 4C until reaching 2.0 V, the voltage demonstrates a continuously descending trend throughout the discharge phase, and the area beneath the discharge capacity-voltage curve exhibits a reduction, indicating a progressive decline in the battery’s discharge capacity.
Figure 7.
Summary data of the 10th cycle of battery b2c43.
4.2. Data Entry and Processing
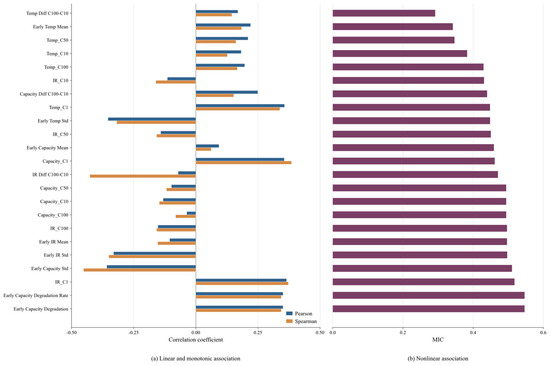
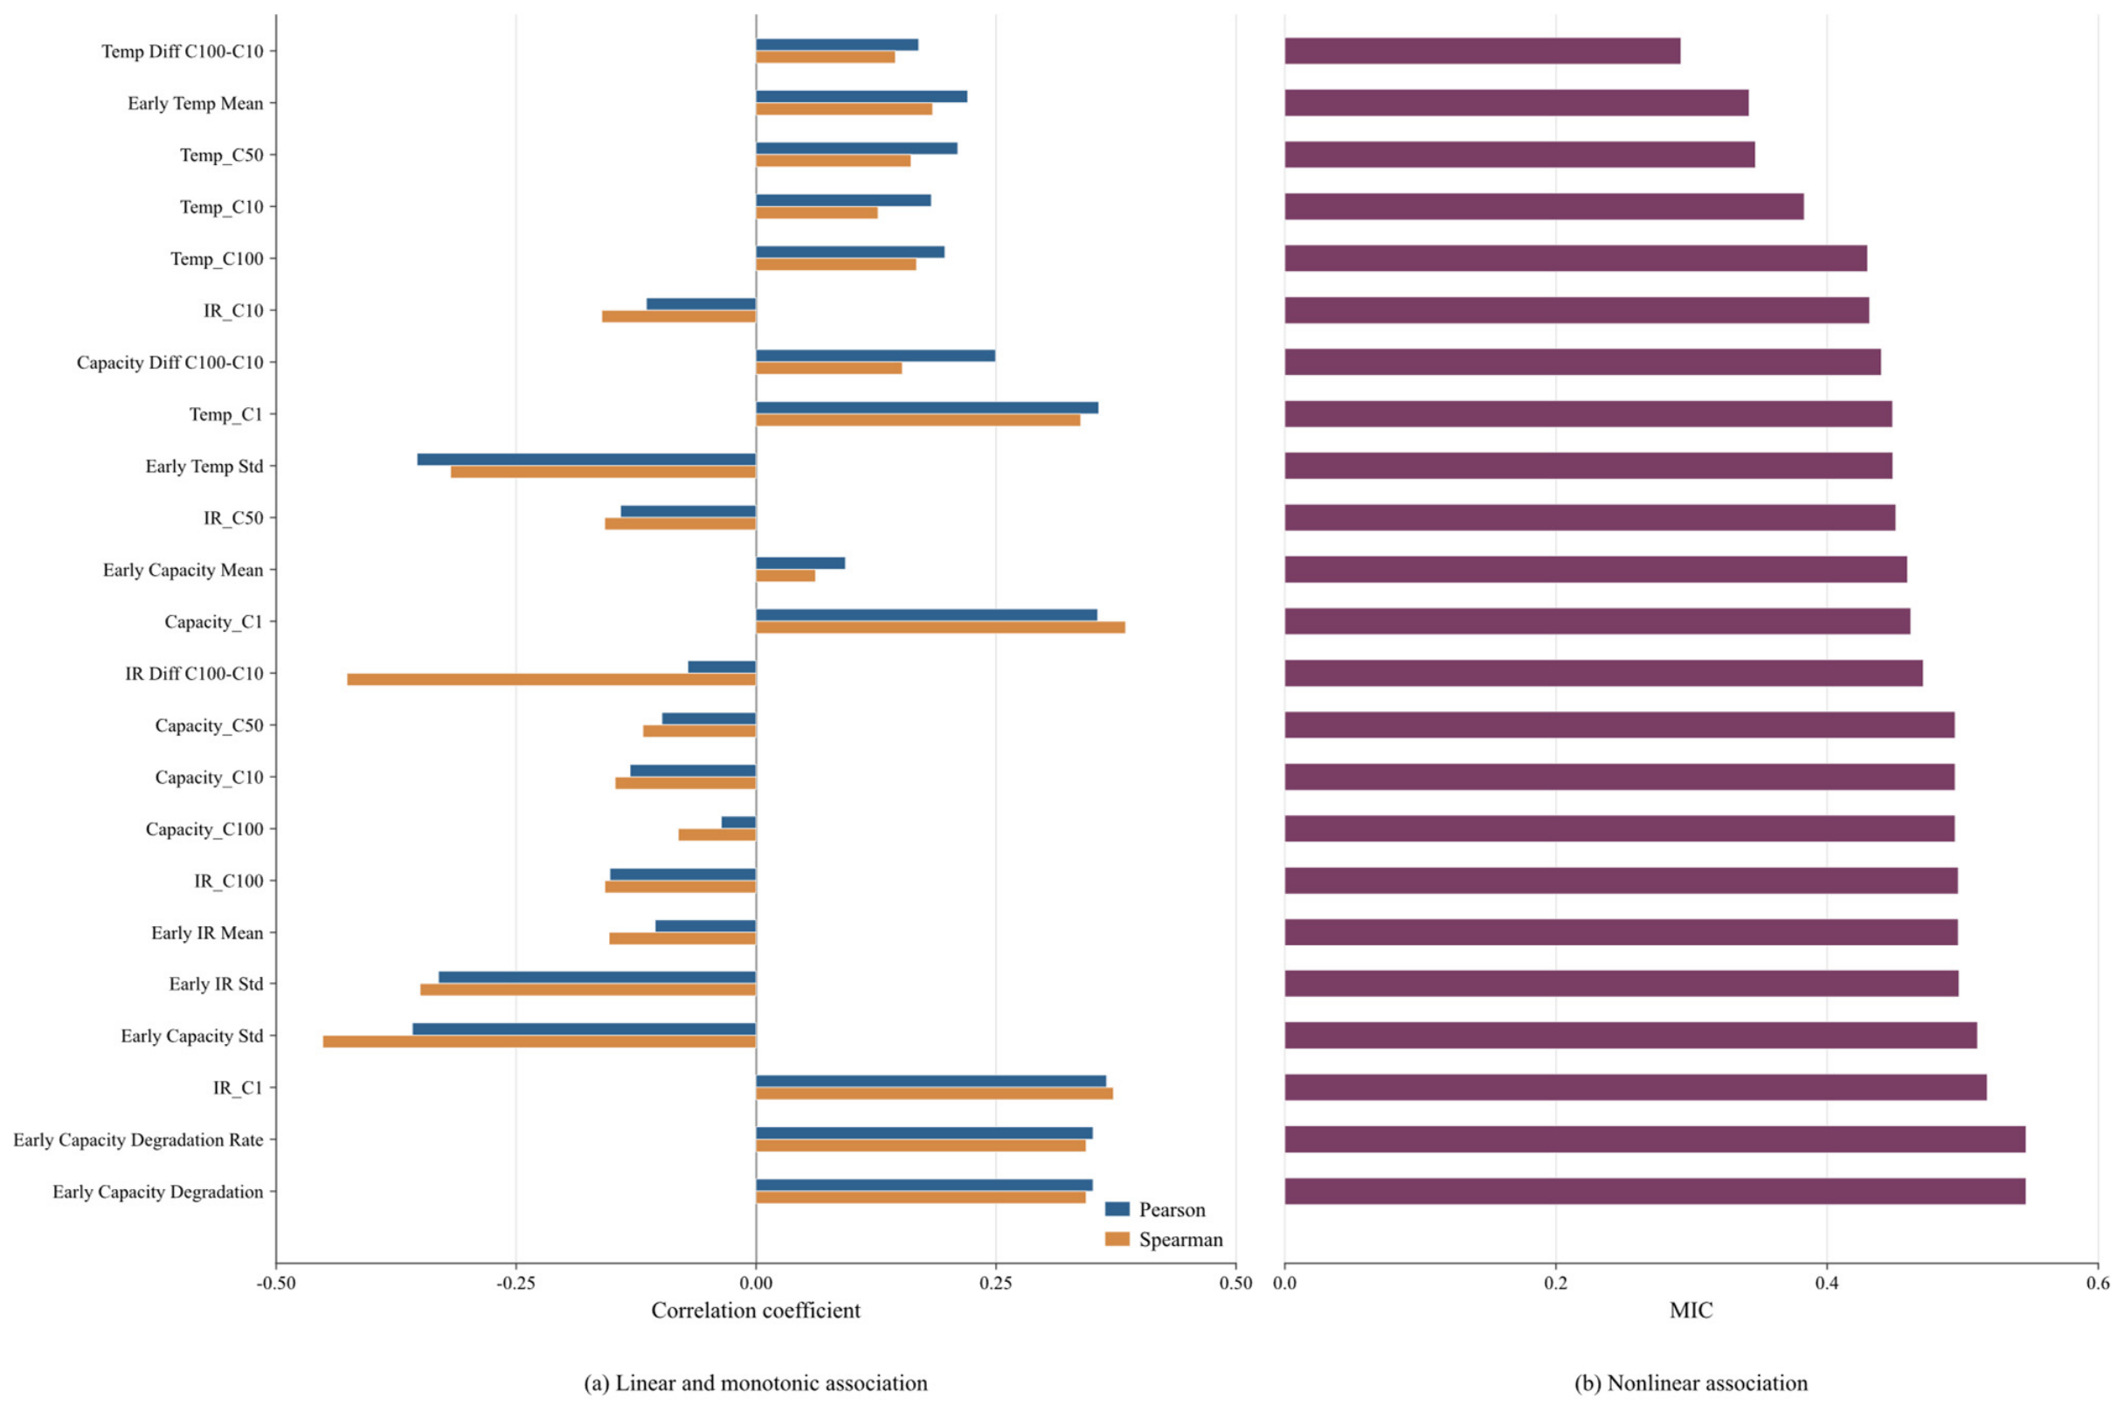
Given that the degree of early battery degradation is relatively mild, this study constructs features based on three dimensions—capacity, internal resistance, and temperature—that reflect the battery’s aging state. Among these, capacity directly characterizes the decline in usable battery capacity; internal resistance reflects changes in the battery’s internal impedance and polarization; and temperature reflects thermal response characteristics during the cycling process. Additionally, statistical and trend features—such as mean, standard deviation, inter-cycle differences, capacity degradation, and degradation rate—were extracted to describe the level of early degradation, the degree of fluctuation, and the trend of change. Correlation results indicate that Pearson and Spearman coefficients generally range from approximately 0.1 to 0.4, suggesting that individual features from the first 100 cycles exhibit limited linear or monotonic relationships with the final RUL; in contrast, the MIC of most features is significantly higher, with some reaching approximately 0.5. Among these, early capacity degradation, capacity degradation rate, initial internal resistance, and capacity statistical features stand out. This suggests that although the selected features do not exhibit a strong simple linear relationship with RUL, they contain distinct nonlinear lifespan information, thereby providing a basis for subsequent multi-feature fusion and nonlinear relationship modeling. The analysis of the correlation between the characteristics and RUL is shown in Figure 8.
Figure 8.
Correlation analysis between early-life battery features and RUL.
4.3. Parameter Settings
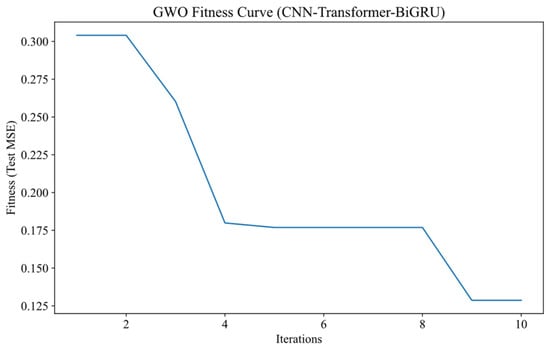
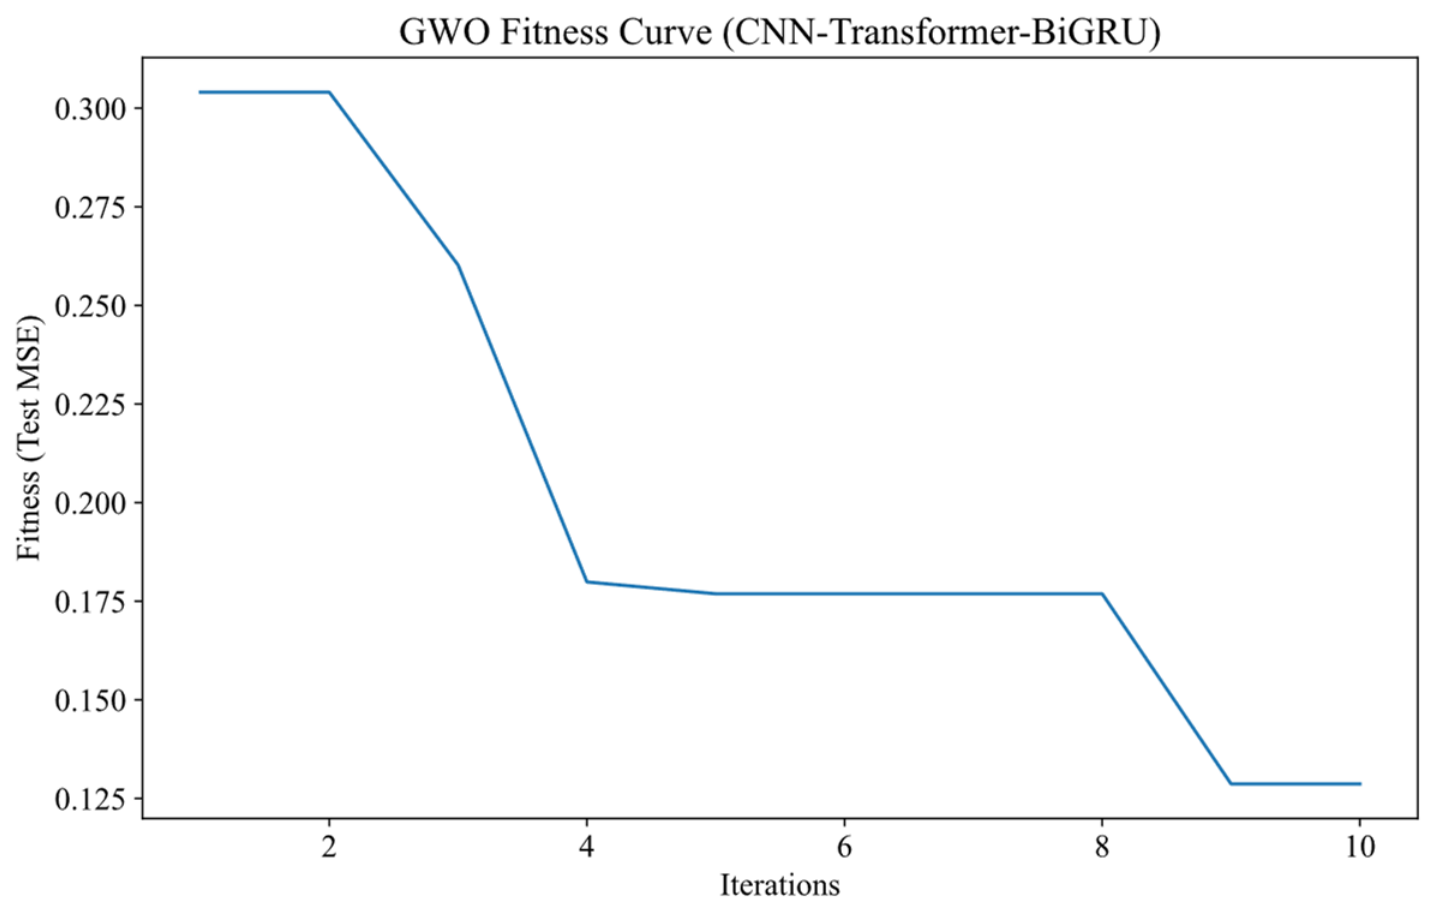
The battery dataset was split into an 80% training set and a 20% testing set. The GWO algorithm was employed to optimize the hyperparameters of the CNN–Transformer–BiGRU model. Figure 9 illustrates the GWO process, with the x-axis indicating the iterations and the y-axis showing the best wolf’s fitness, specifically the mean squared error (MSE) of the test set. Notably, the MSE diminished by over 60% within the first ten iterations, achieving a final prediction error of 0.125. This result signifies the efficacy of GWO in fine-tuning the model’s hyperparameters. Details of these hyperparameters post-optimization are provided in Table 2.
Figure 9.
GWO super-parameter optimization convergence curve.
4.4. Model Training and Software/Hardware Environment
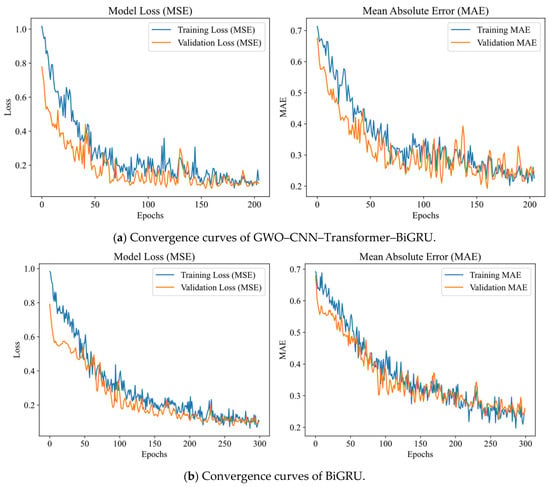
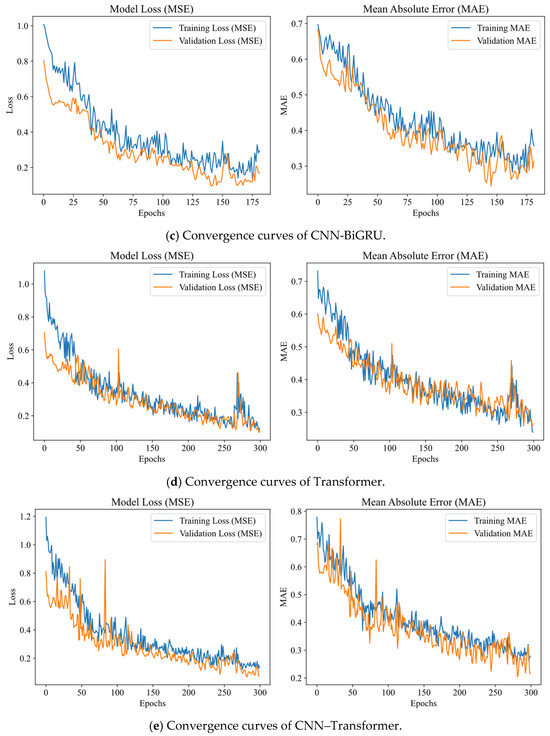
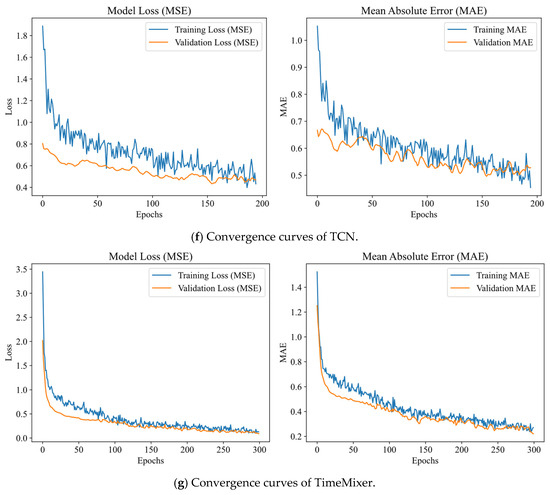
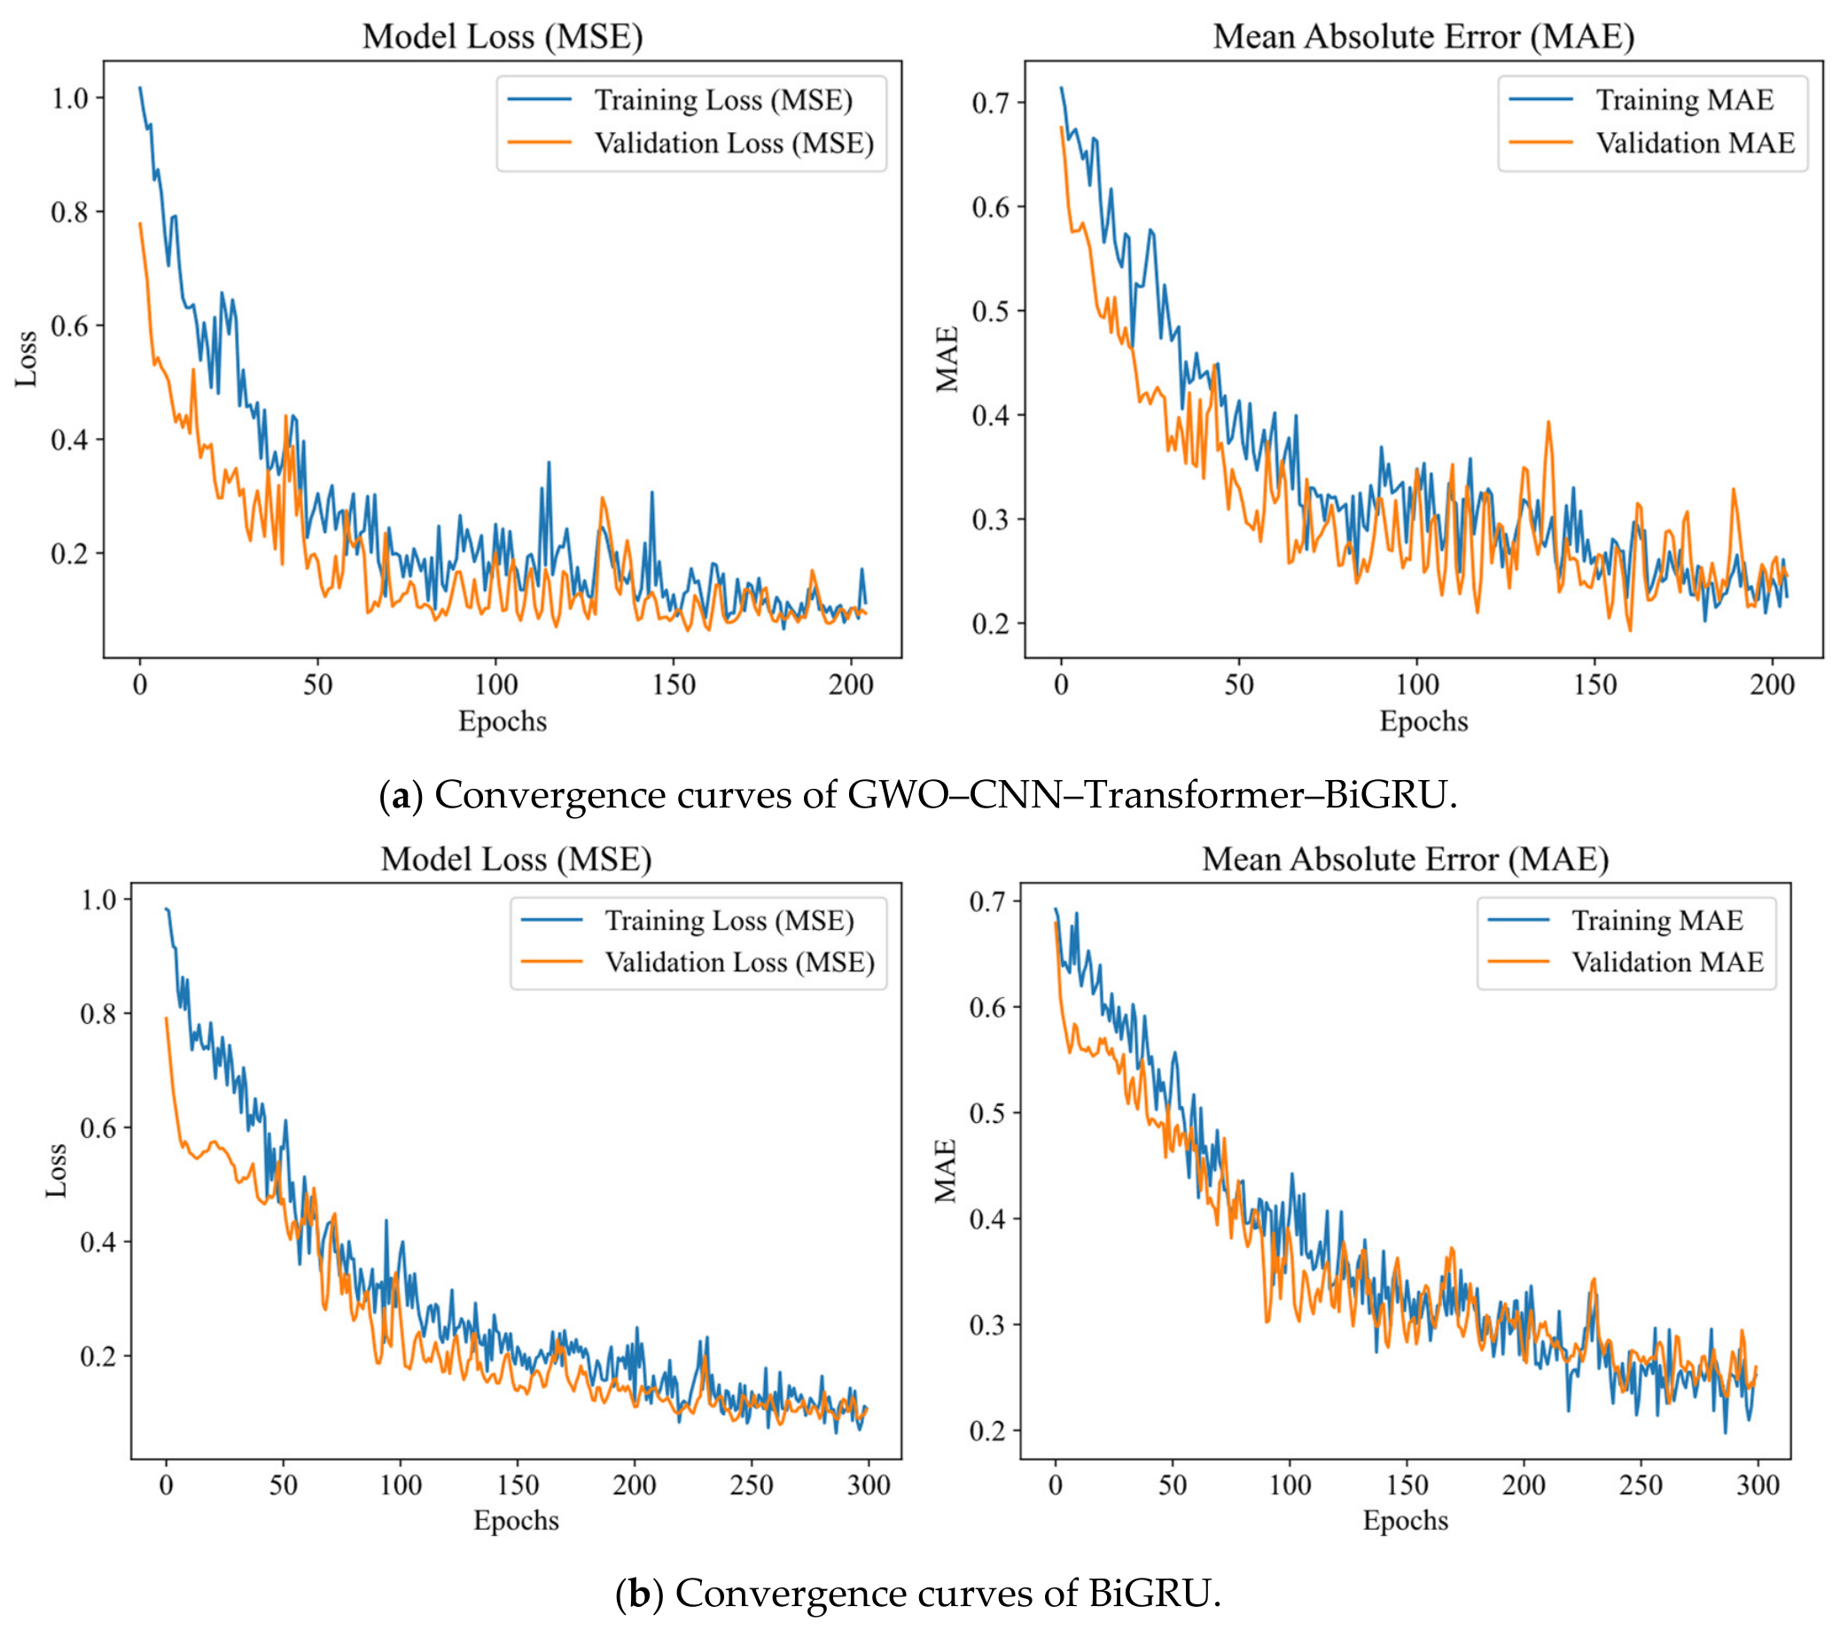
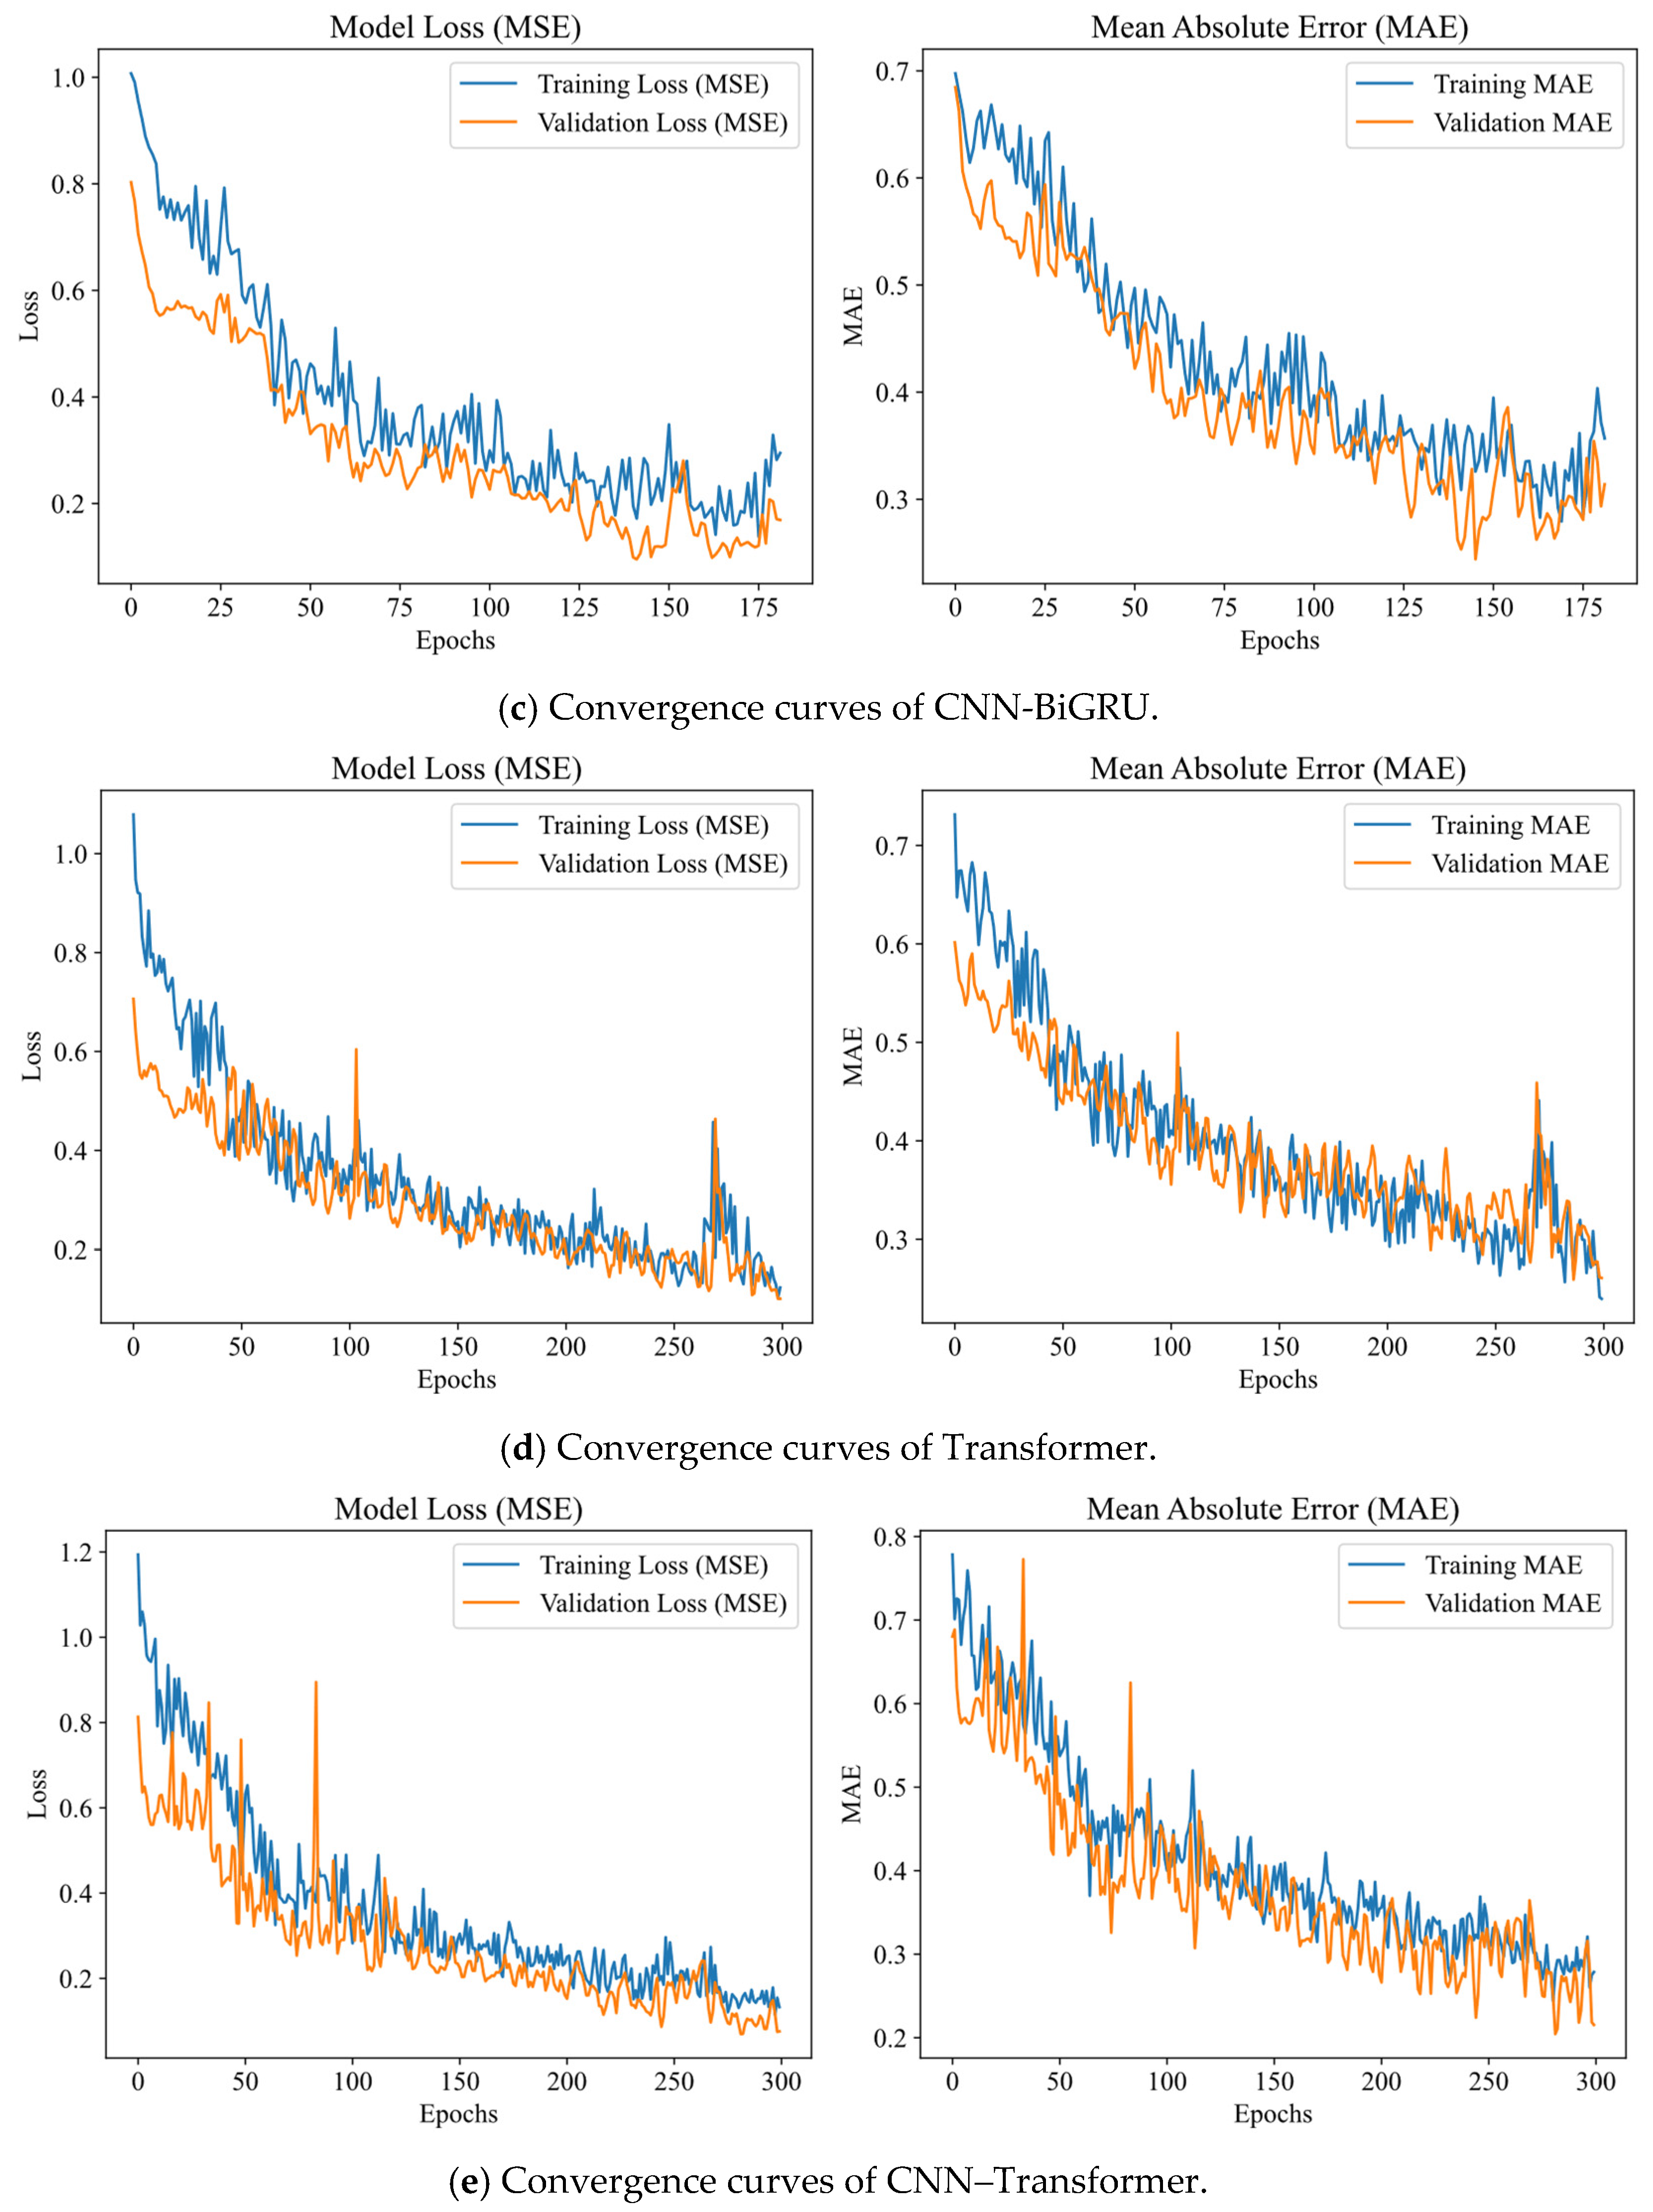
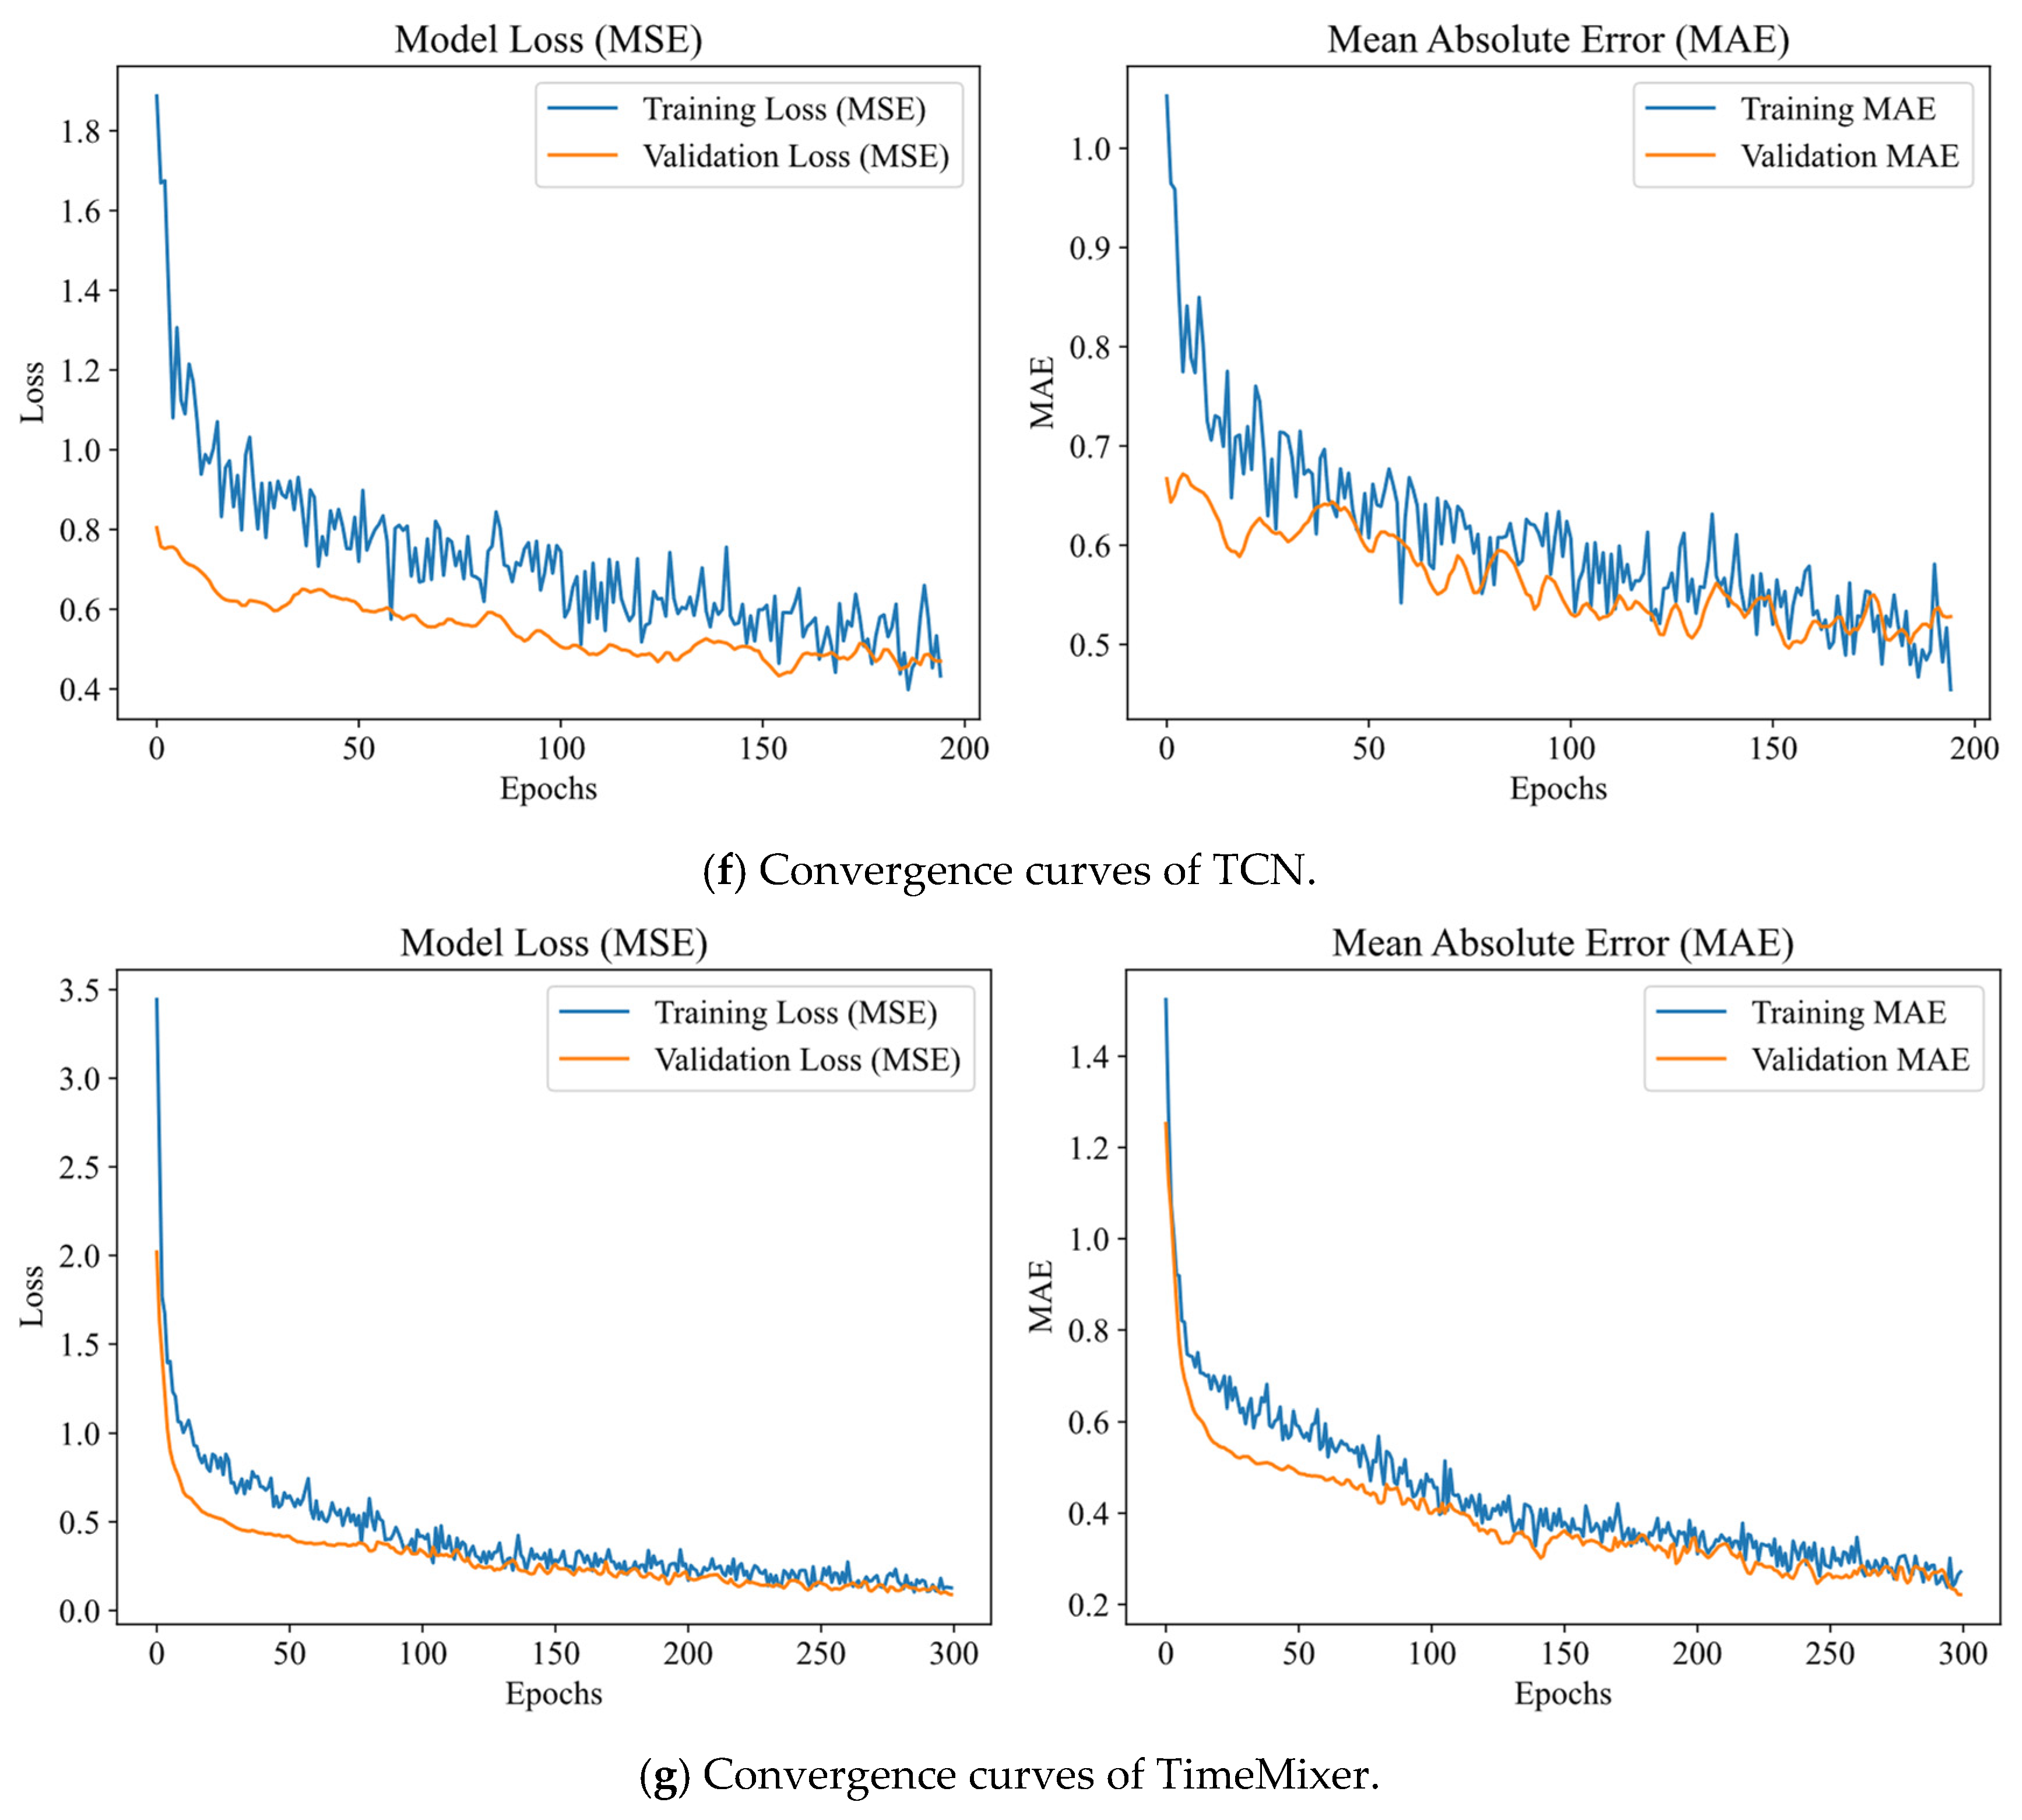
During model development, a critical oversight involved the inappropriate use of the test set as the validation set. The Adam optimizer was employed alongside mean squared error (MSE) as the loss function. To mitigate overfitting and improve convergence, early stopping and ReduceLROnPlateau were incorporated. The early stopping mechanism monitored validation loss, halting training if no improvement occurred after 40 iterations and reverting to optimal weights. The ReduceLROnPlateau callback adapted the learning rate in response to stagnating validation loss, facilitating more stable convergence. The training regimen was capped at 300 epochs across all models, with performance evaluated using the validation set. Figure 10 illustrates the convergence curves of the loss function (MSE) and the mean absolute error (MAE) for the optimized model and various comparison models on both the training and validation sets, providing a visual representation of the models’ training performance and the occurrence of overfitting. All curves decline and stabilize as the number of epochs increases, indicating that the model training was effective.
Figure 10.
Convergence curves of each model.
This study’s experiments were conducted using the PyTorch 2.7.1+cu118 deep learning framework within a Python 3.7 environment, utilizing PyCharm 2024.1.7 as the development interface. The hardware configuration included Windows 11 as the operating system, an AMD Ryzen 5 5600H processor, an NVIDIA GeForce RTX 3050 graphics card, and 32 GB of RAM. This configuration was selected to optimize performance for intensive deep learning tasks, providing the necessary computational power to efficiently manage substantial datasets and advanced neural network models.
4.5. Evaluation Metrics
This research employs four key performance evaluation metrics—, RMSE, MAE, and MAPE—to assess the model’s predictive efficacy. These metrics collectively facilitate a thorough examination of discrepancies between predicted and actual outcomes, thereby enabling a comprehensive evaluation of the model’s reliability. The calculation methodologies for these metrics follow established conventions in the field.
where denotes the actual RUL value, represents the estimated RUL value, and refers to the length of the capacity sequence. refers to the mean of all actual RUL values.
In this study, the target RUL is expressed in terms of the number of cycles; therefore, the RMSE and MAE retain the same physical dimensions as the RUL and can directly reflect the actual number of cycles by which the predicted life differs from the true life, facilitating the evaluation of the model’s error level in predicting actual life. Among these, the RMSE is more sensitive to larger prediction deviations, while the MAE reflects the model’s overall mean absolute prediction error. Given the differences in battery lifespan scales, this study also employs MAPE to evaluate prediction errors in percentage terms, thereby reducing the impact of these scale differences on the interpretation of results. Therefore, to account for both actual cycle errors and relative errors, this study uses RMSE and MAE to characterize absolute prediction errors and MAPE to characterize relative errors in percentage terms.
5. Simulation Analysis
5.1. GWO–CNN–Transformer–BiGRU Prediction Results
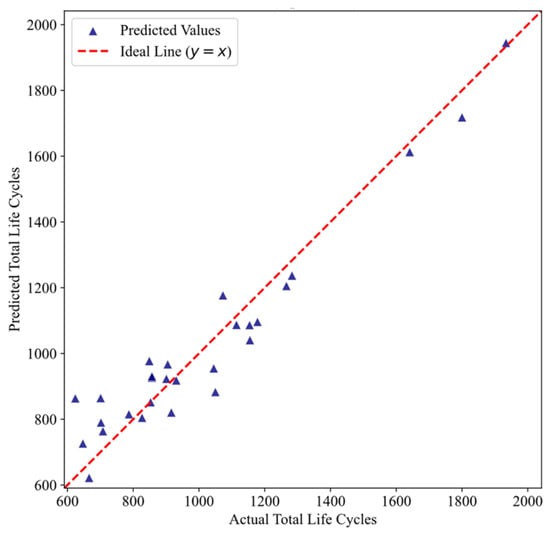
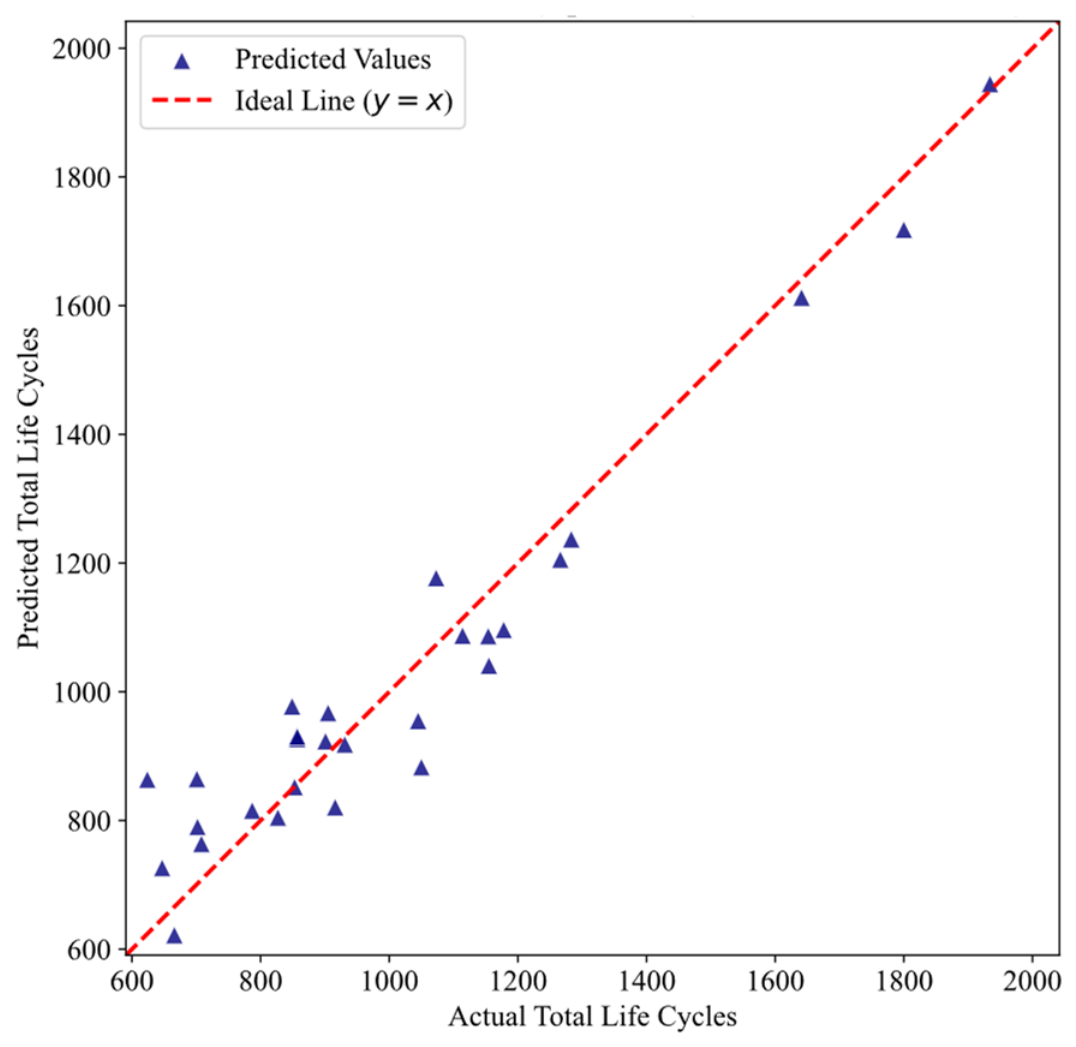
After model training, the RUL of the batteries in the test set was predicted and compared with the actual values. Figure 11 illustrates the deviation between the actual and predicted values for the CNN–Transformer–BiGRU model optimized using GWO across various test sets.
Figure 11.
Deviation Chart of Actual Values and Predicted Values for GWO–CNN–Transformer–BiGRU.
The x-axis represents the actual total Remaining Useful Life, while the y-axis represents the predicted total Remaining Useful Life. The data points illustrate the comparison between the actual and predicted remaining useful life for each battery in the test set, whereas the red dashed line denotes the ideal line (y = x), indicating that the predicted value equals the actual value. This figure intuitively demonstrates the model’s predictive accuracy on the test set. Data points close to the ideal line suggest that the predicted values are near the actual values, with minimal deviation. The degree of dispersion in the data points reflects the consistency and stability of the model’s predictions.
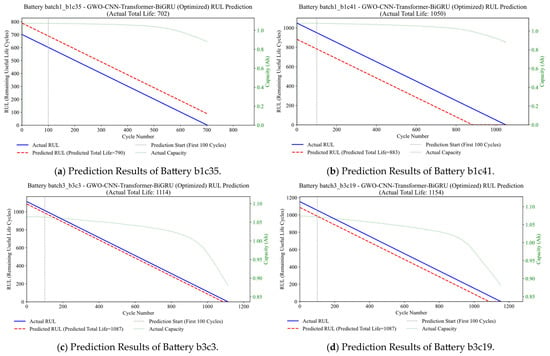
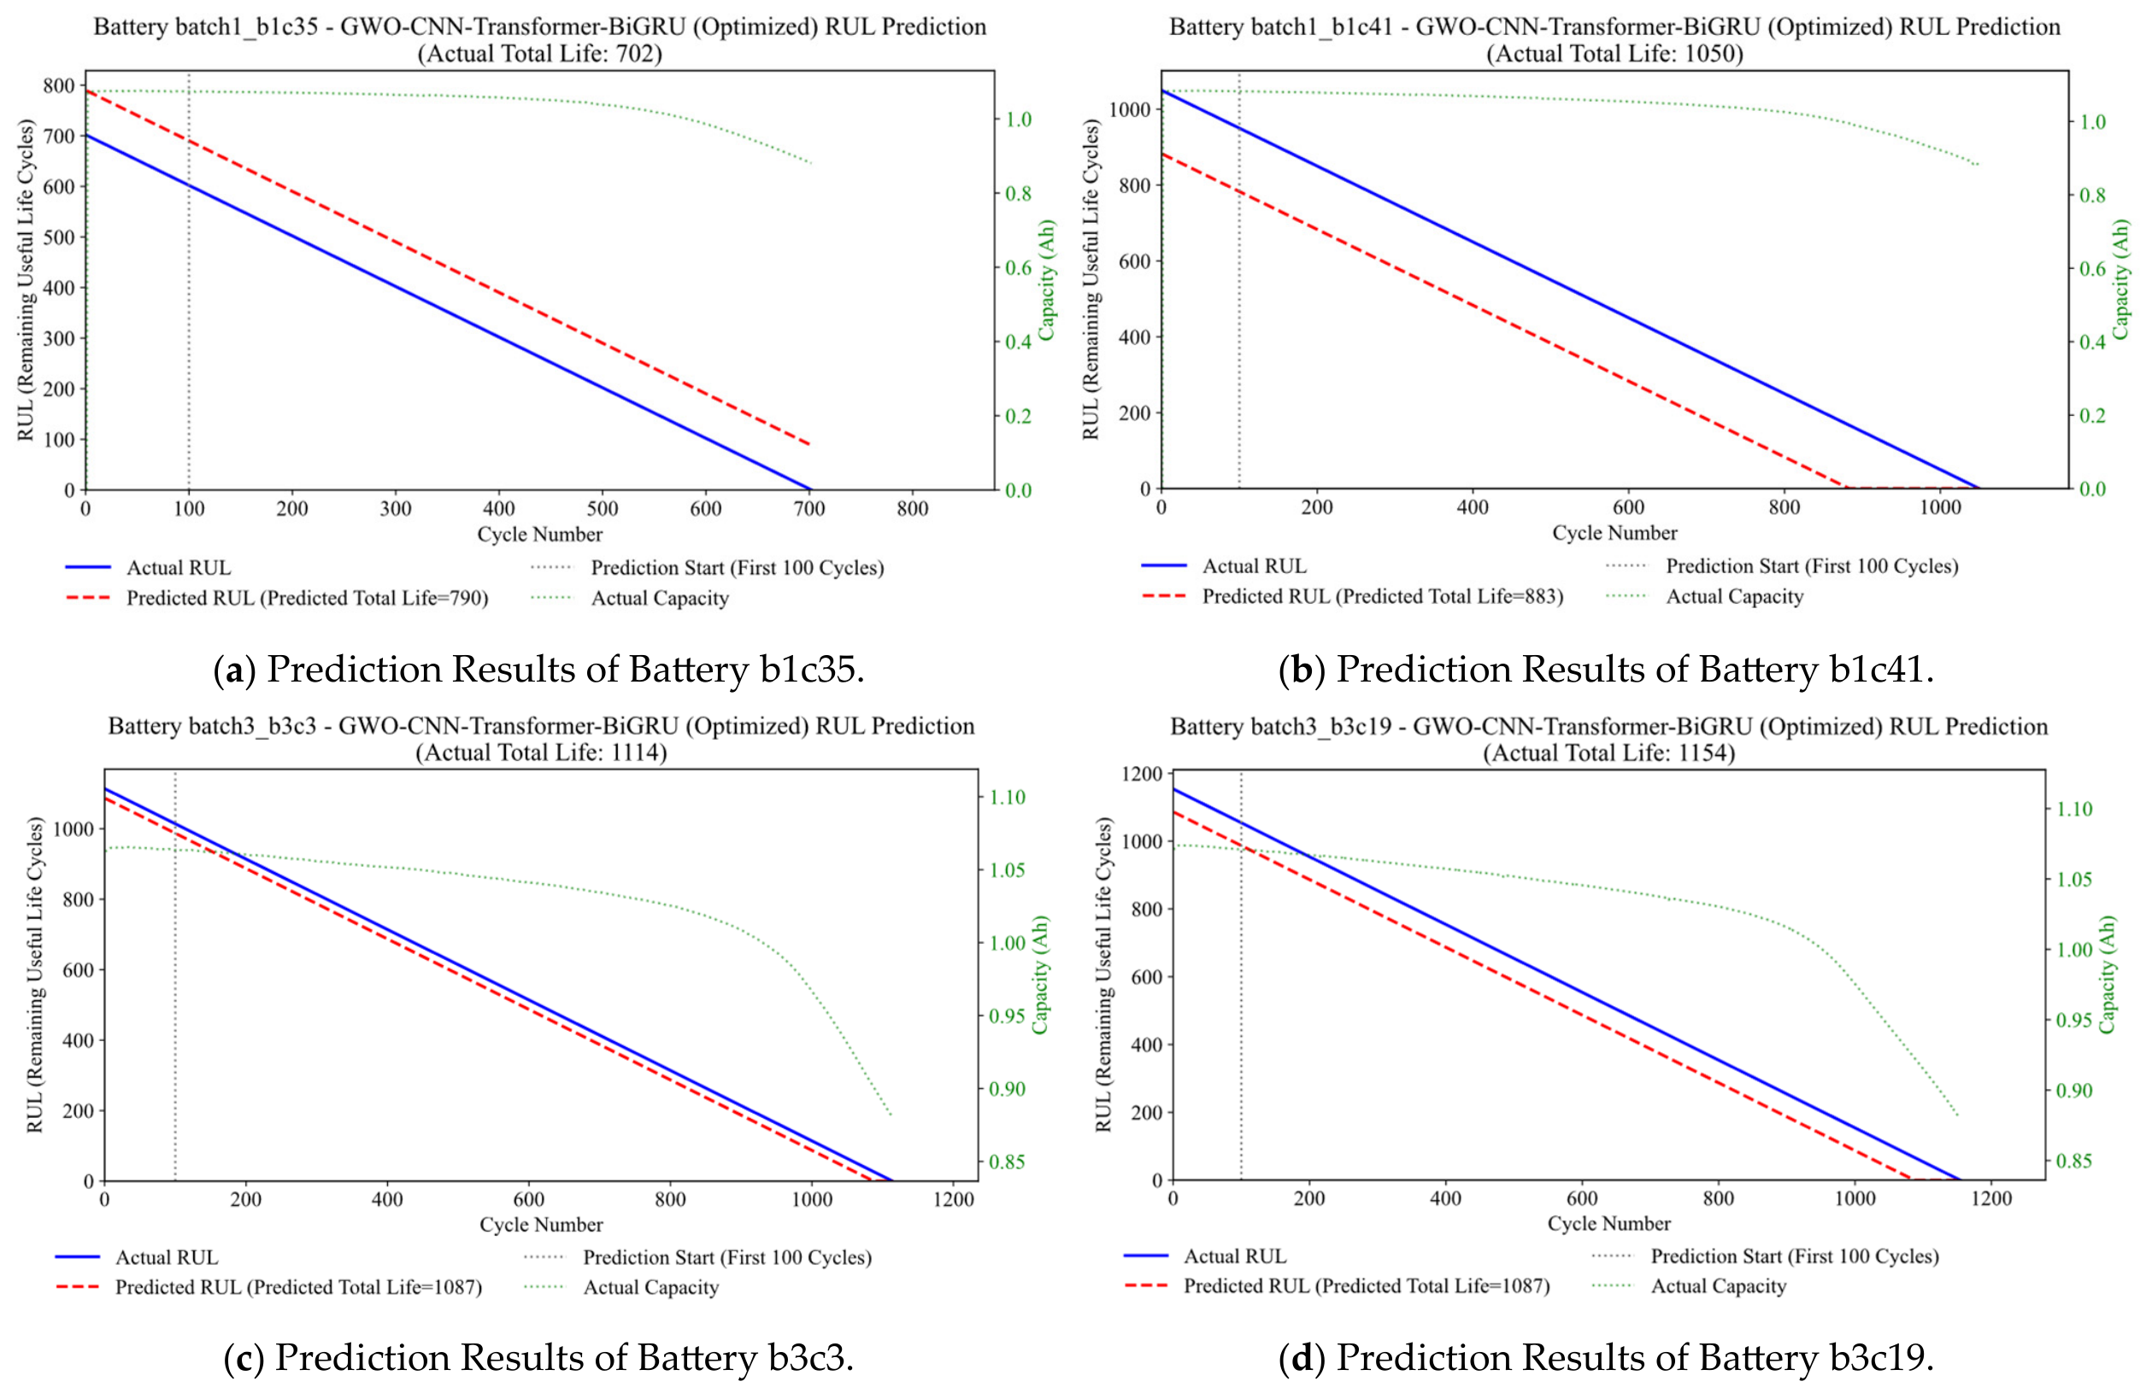
Figure 12 presents the prediction plot for the GWO-optimized CNN–Transformer–BiGRU model, which visualizes the results for four batteries selected from the test set. The primary axis (left Y-axis) represents Remaining Useful Life (RUL); the blue line indicates actual RUL, while the red dashed line portrays predicted RUL. The gray dashed line denotes the early-cycle limit, indicating that the predictions are based solely on data from the first 100 cycles. The secondary axis (right Y-axis) represents capacity; the green dashed line illustrates actual capacity, and the X-axis represents the number of cycles. This figure reveals how the actual and predicted RUL of individual cells vary with the number of cycles. Furthermore, the capacity curve offers critical background information on the health status of the battery, illustrating that capacity decline is correlated with a reduction in RUL. The early-cycle line emphasizes that the model relies exclusively on data from the initial 100 cycles for its predictions. Finally, the predictive performance of the model for individual cells is analyzed in detail, effectively identifying prediction biases for specific cells.
Figure 12.
Prediction Results of GWO–CNN–Transformer–BiGRU.
Table 3 presents the prediction results for the test set of batteries (28 in total), including the predicted total lifespan as well as the absolute and percentage errors relative to the actual total lifespan. This presentation provides a more intuitive illustration of the discrepancies between the predictions and the actual outcomes. As indicated in the table, the model demonstrates robust predictive performance using only the first 100 cycle data points for each battery, with the percentage error for some batteries being less than 1%.
Table 3.
GWO–CNN–Transformer–BiGRU Training Set Battery Prediction Results.
From the above chart, the difference between the predicted RUL of the test set battery and the actual value can be intuitively seen. In most cases, the difference is not significant, effectively verifying the feasibility of using only data from the first 100 battery cycles to predict battery RUL, as well as the model’s performance and prediction accuracy.
5.2. Ablation Experiments and Control Experiments
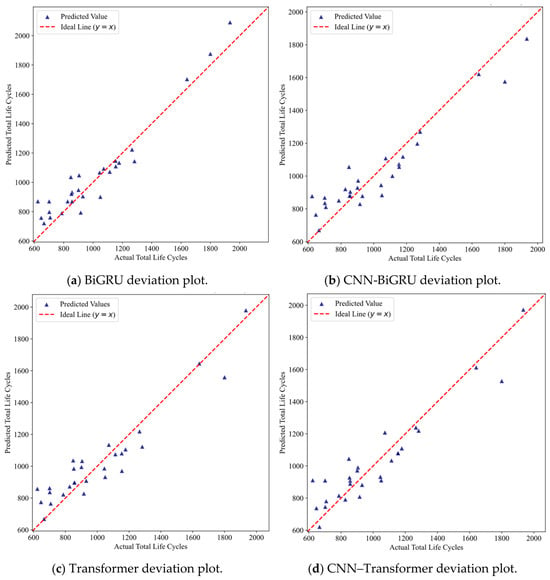
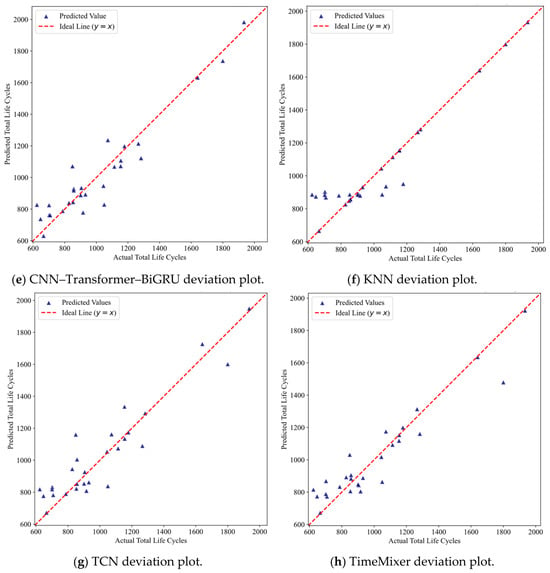
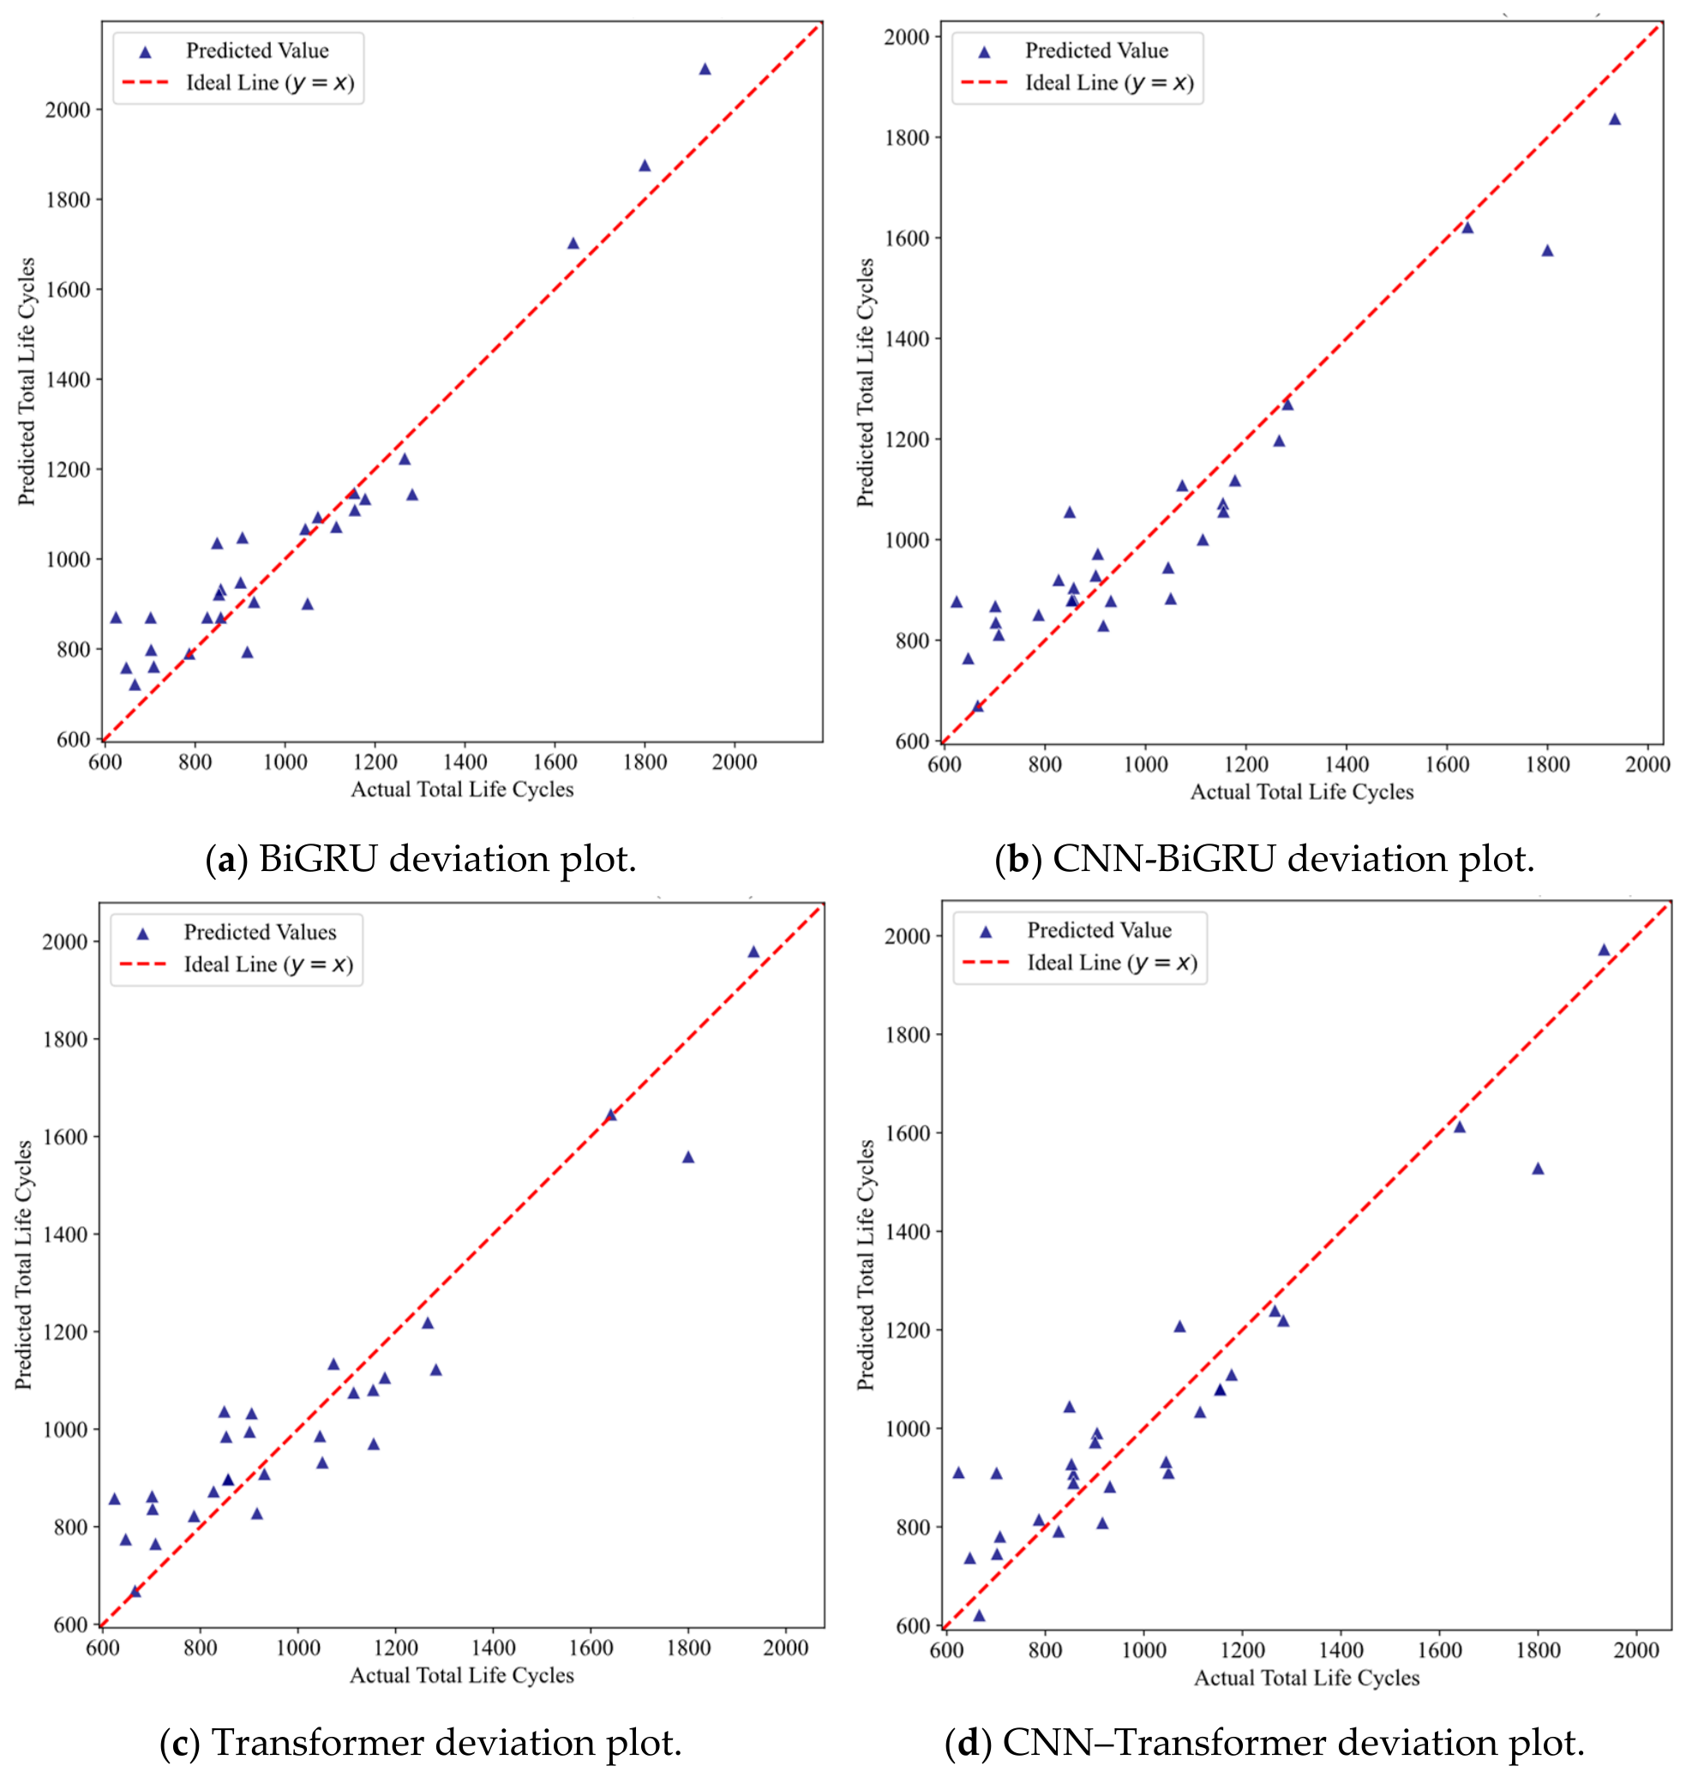
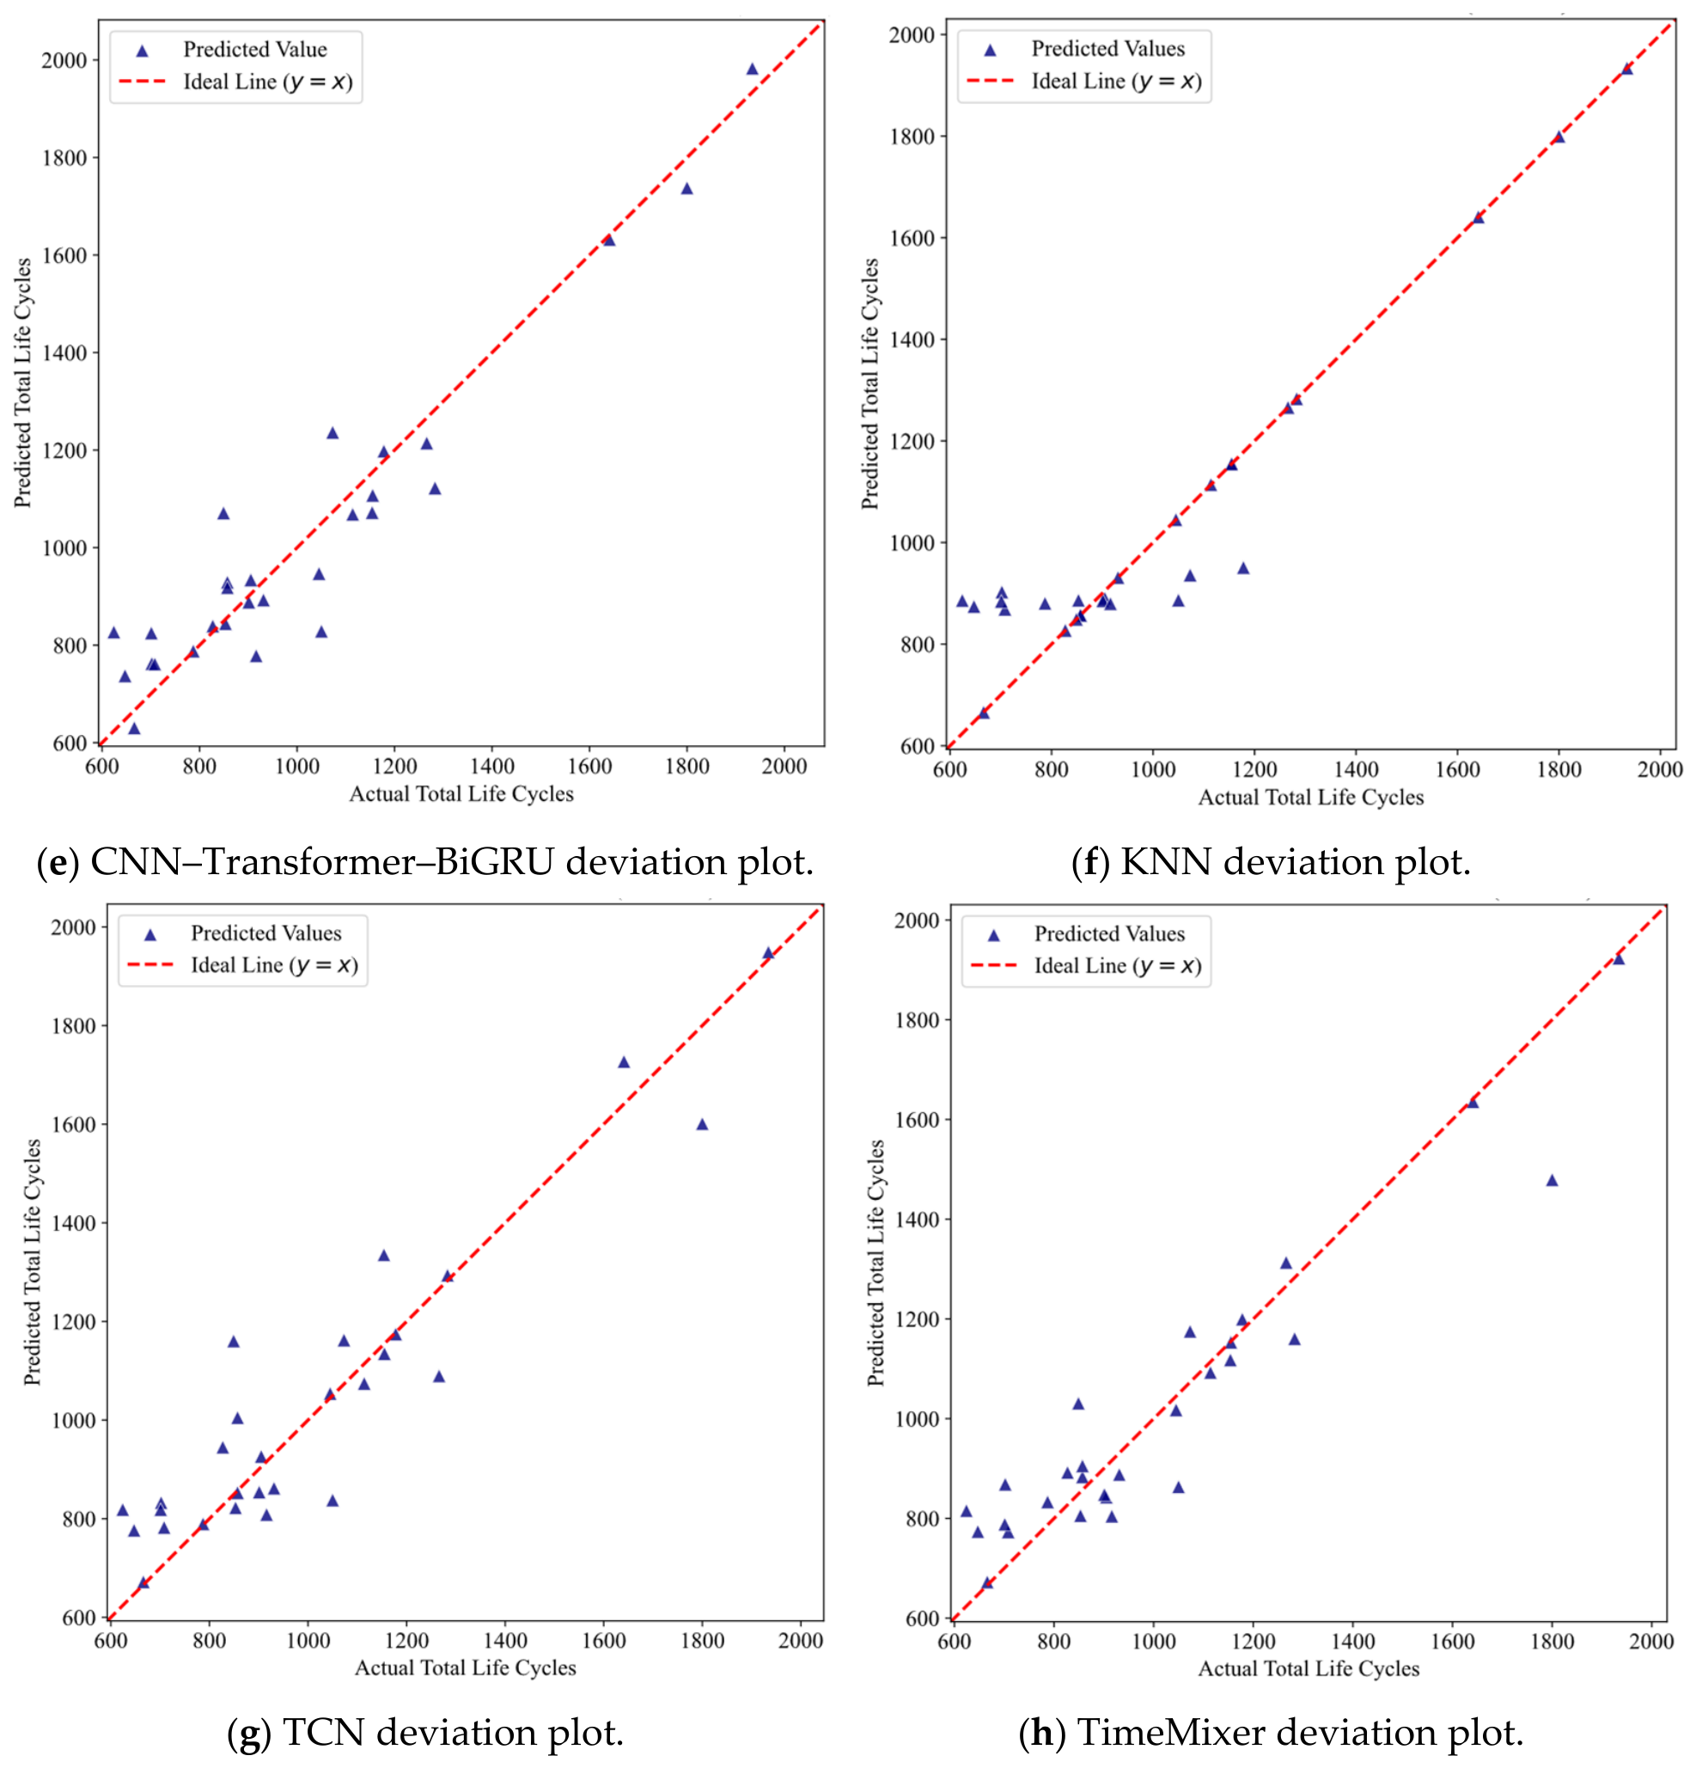
In order to elucidate the strong predictive capabilities of the proposed integrated model, we carried out ablation studies and comparative experiments. Figure 13 details the variations between predicted and actual battery values in the test set for each model evaluated. These findings validate the integrated model’s efficacy and lay the groundwork for future advancements in battery performance prediction.
Figure 13.
Ablation experiment and comparison experimental deviation plot.
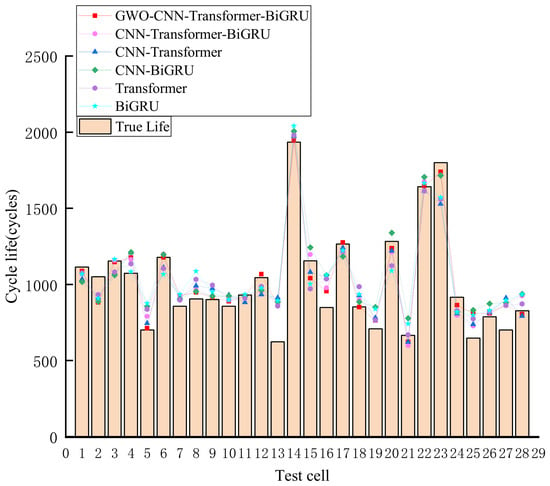
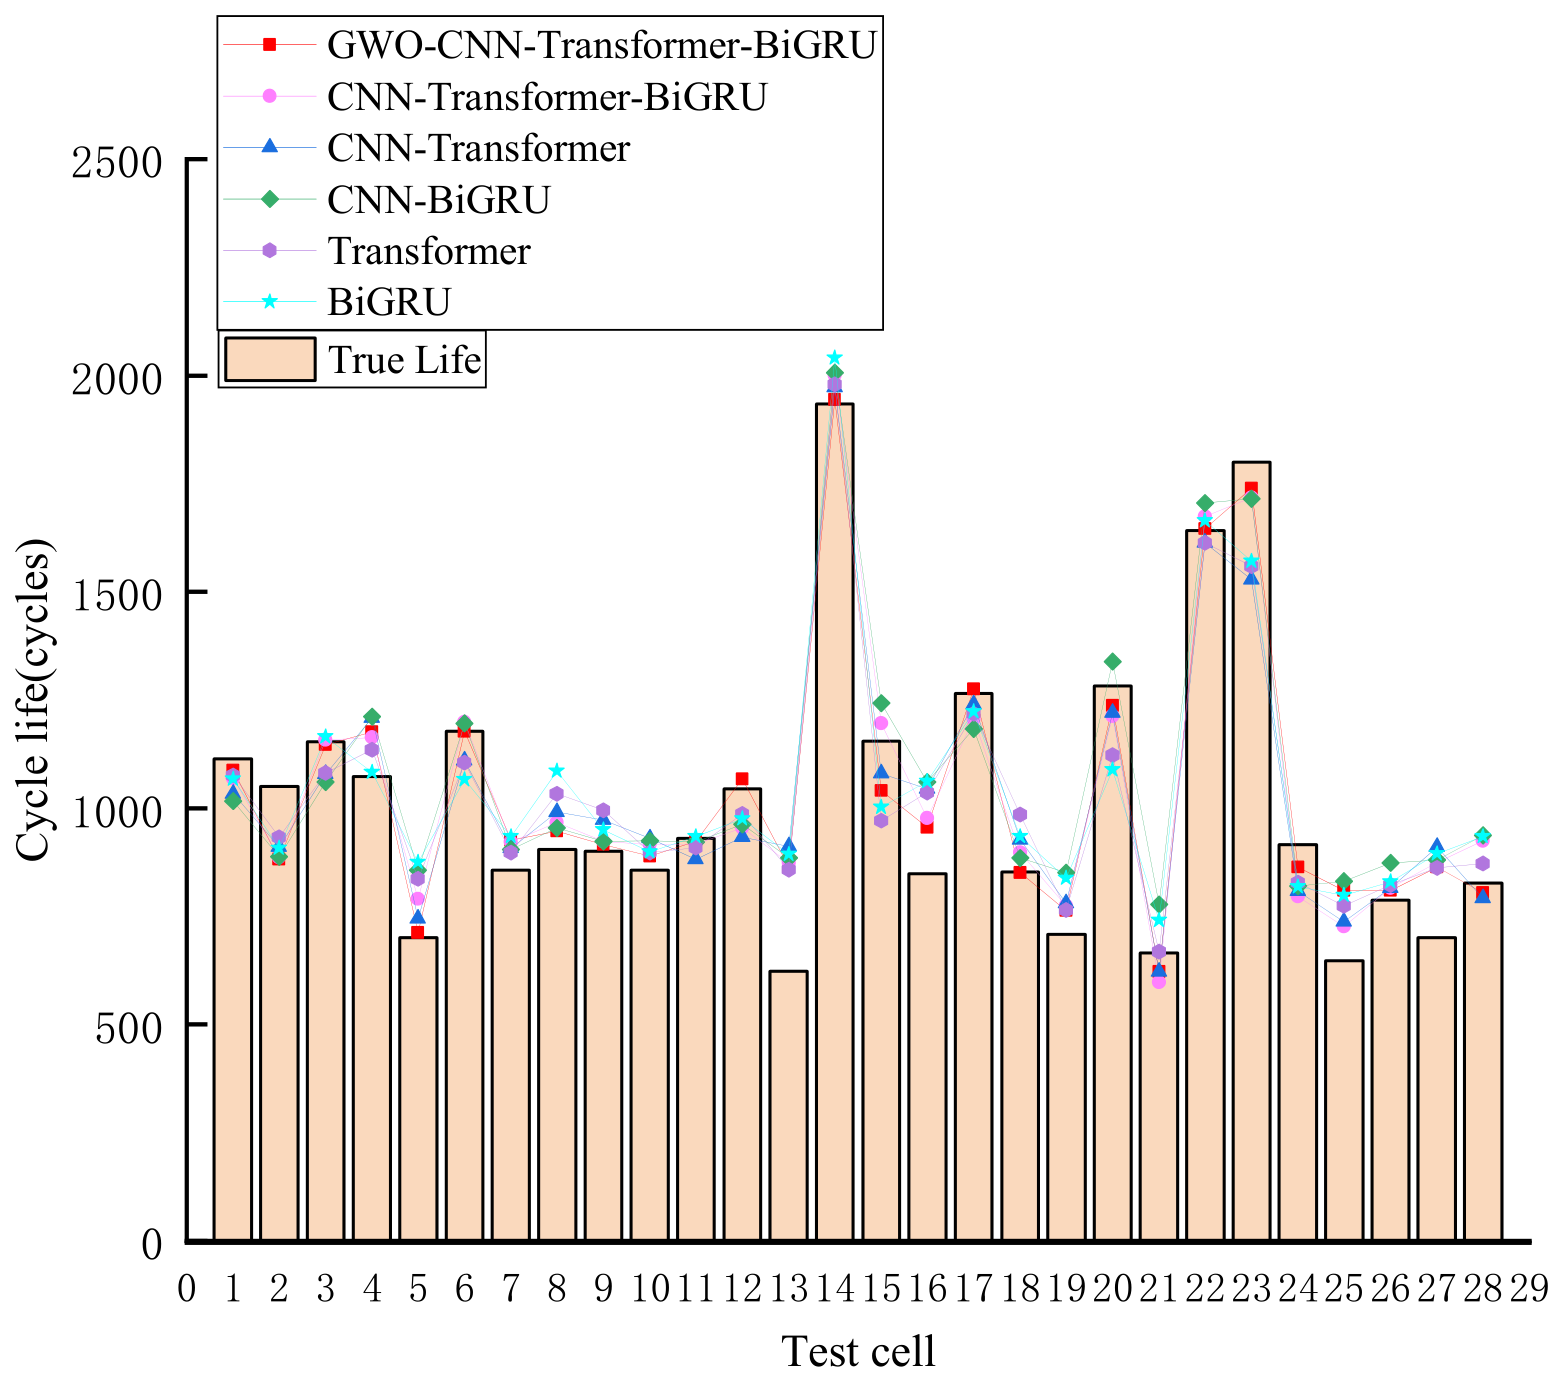
The comparison of predicted and actual battery lifetimes for the test set in the ablation experiments is illustrated in Figure 14. The figure clearly indicates that the estimations generated by the primary model proposed in this study align more closely with the actual outcomes. In Table 4, evaluation metrics pertaining to the ablation experiments are summarized, providing an analytical breakdown of each component’s contributions, namely the Transformer, CNN, BiGRU, and GWO strategies. The data presented reveal that the BiGRU module’s standalone application results in inadequate prediction accuracy. The performance of the model experiences a slight improvement with the addition of the CNN; however, the results for RMSE and MAPE remain unsatisfactory. A substantial enhancement in model efficacy is observed following the integration of the Transformer module, with all evaluation metrics reflecting positive outcomes. This observation reveals that the Transformer significantly enhances the overall performance and serves as the fundamental element of this ensemble model. In contrast, the Gray Wolf Optimization algorithm provides less of a performance boost than the other modules; this may be due to the large number of model parameters and the inherent limitations of the algorithm itself. Based on the above experiments, we can conclude that the combination of Transformer, CNN, and BiGRU, coupled with appropriate optimization, can significantly improve the model’s prediction accuracy across different battery types.
Figure 14.
Comparison of predicted and real life of the test set battery (ablation experiment).
Table 4.
Evaluation index of ablation experiment.
The CNN is located at the front end of the model and uses convolution operations to extract local degradation patterns—such as capacity and internal resistance—from early-stage cycle data, providing effective features for subsequent modeling. The Transformer further utilizes a multi-head self-attention mechanism to establish global dependencies among features from different cycles; however, the CNN–Transformer model still has limited capabilities in capturing the continuous evolution of degrading sequences. Therefore, BiGRU is subsequently introduced to further integrate temporal information from preceding and subsequent cycles through bidirectional recursion, enabling the model to simultaneously perform local feature extraction, global correlation modeling, and temporal dependency representation. Unlike the previous three approaches, GWO does not perform feature extraction directly; instead, it enhances the alignment between modules by optimizing key hyperparameters such as the learning rate, convolution parameters, attention parameters, and the number of GRUs. Consequently, each module functions at four distinct levels—local features, global correlations, temporal dependencies, and parameter optimization—thereby yielding varying degrees of performance improvement.
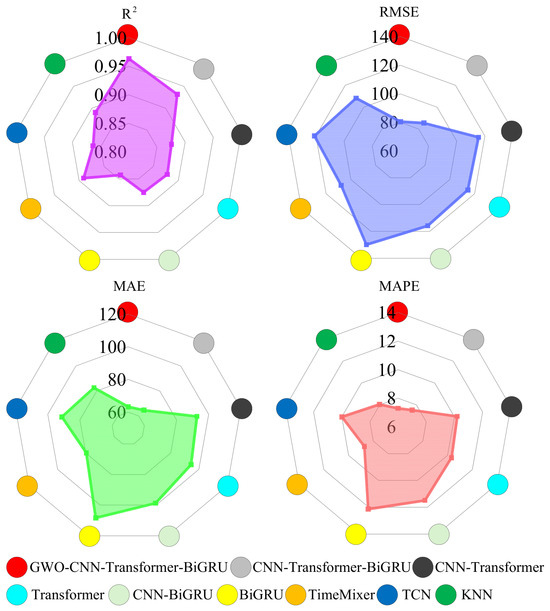
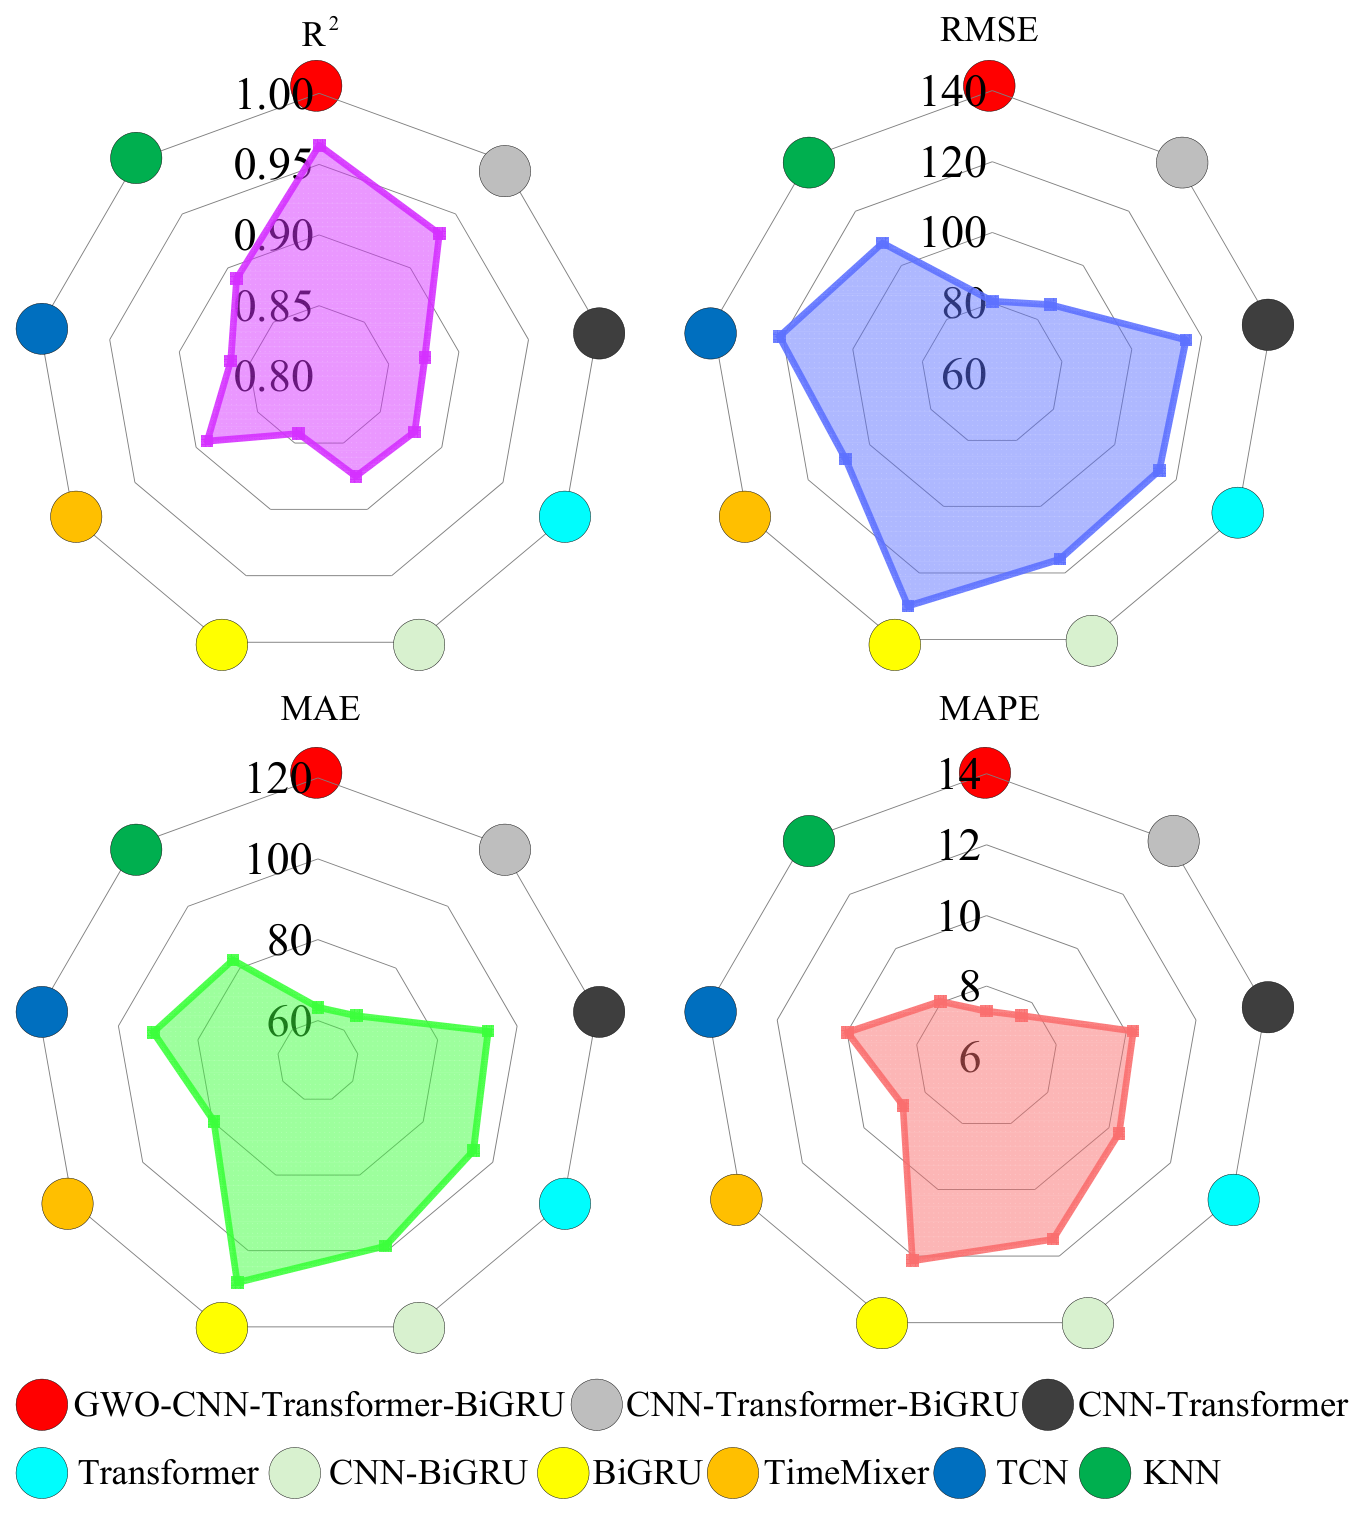
Table 5 summarizes the evaluation metrics from the comparative analysis, illustrating that the proposed integrated model exceeds the performance of three benchmark models across all metrics, thereby demonstrating notable predictive accuracy in estimating the early remaining service life of lithium-ion batteries. Furthermore, Figure 15 employs a radar chart to visually compare the strengths of the models, underscoring the superior performance of the integrated approach relative to its counterparts, which has significant implications for battery management and operational efficiency.
Table 5.
Comparison of the experimental evaluation indicators.
Figure 15.
Radar diagram of the evaluation index of the test set battery.
6. Conclusions
As the landscape of energy solutions transitions towards electric vehicles and renewable energy systems, efficiently predicting the RUL of lithium-ion batteries has emerged as a pivotal challenge, directly impacting battery efficiency, maintenance costs, and safety protocols. A novel deep learning framework, CNN–Transformer–BiGRU, was created to address this need for rapid and precise RUL forecasting.
(1) This model combines a CNN, a Transformer, and a BiGRU to effectively capture critical features from early-stage battery cycling data. Key optimizations were achieved through the GWO algorithm, enhancing the hyperparameter settings for improved performance.
(2) The training process was meticulously structured using the Adam optimizer in conjunction with the MSE function to mitigate overfitting while ensuring high accuracy in predictions. Experimental outcomes demonstrated that the CNN–Transformer–BiGRU model significantly outperformed classical approaches in RUL prediction tasks.
(3) Validation against the MIT dataset confirmed the robustness of this model, revealing its capacity to accurately track battery performance degradation trends with remarkable precision, as evidenced by percentage errors in some forecasts being under 1%. Further analysis through ablation studies indicated the critical impact of the Transformer component, thereby underlining the potential of this ensemble architecture in enhancing lithium-ion battery management systems.
The MIT dataset used in this study includes a variety of fast-charging strategies; therefore, the training and test samples cover different charging protocols, which allows for some validation of the model’s adaptability to changes in charging strategies. However, since the current experimental data were all collected in a constant-temperature environment of 30 °C and under uniform discharge conditions, this study did not systematically validate the model’s generalization capability across different operating conditions at varying ambient temperatures. Consequently, at this stage, the proposed model is primarily applicable to lithium iron phosphate (LFP) batteries and fast-charging conditions similar to those in the MIT dataset. In the future, we plan to incorporate data from different temperatures, battery types, and additional charging and discharging protocols to validate the model’s generalization performance through cross-condition training and testing.
Author Contributions
Conceptualization, X.P. and H.Y.; methodology, C.W. and X.P.; software, C.W. and J.S.; validation, C.W., J.S. and Z.Z.; formal analysis, C.W.; investigation, C.W. and P.Y.; resources, H.Y.; data curation, C.W. and P.Y.; writing—original draft preparation, C.W. and X.P.; writing—review and editing, Z.Z.; visualization, C.W.; supervision, H.Y.; project administration, H.Y.; funding acquisition, X.P. All authors have read and agreed to the published version of the manuscript.
Funding
This work was supported by the Natural Science Foundation of Liaoning Province of China (2025JH2/101330035, 2024-MS-217).
Data Availability Statement
The data that support the findings of this study are available from the corresponding author upon reasonable request.
Conflicts of Interest
Author Pengwei Yu was employed by the Golden Concord Group Energy Technology Co., Ltd., Nantong, China. The remaining authors declare that the research was conducted in the absence of any commercial or financial relationships that could be construed as a potential conflict of interest.
Abbreviations
| RUL | Remaining useful life |
| LIB | Lithium-ion battery |
| CNN | Convolutional neural network |
| BiGRU | Bidirectional gated recurrent unit |
| GWO | Grey wolf optimizer |
| DST | Dempster–Shafer theory |
| MAE | Mean absolute error |
| MAPE | Mean absolute percentage error |
| RMSE | Root mean square error |
| R-squared | |
| BMC | Bayesian Monte Carlo |
| ADLSTM | Bidirectional long short-term memory |
| MC | Monte Carlo |
| PIML | Physics-informed machine learning |
| PI | Physics-informed |
| EoL | End-of-life |
| LSTM | Long short-term memory |
| GPR | Gaussian process regression |
| CEEMDAN | Complete ensemble empirical mode decomposition with adaptive noise |
| DNN | Deep neural network |
| MIT | Massachusetts Institute of Technology |
| CL | Cycle life |
| KNN | K-Nearest neighbors |
| TCN | Temporal convolutional network |
References
- Lai, X.; Chen, J.J.; Chen, Q.W.; Han, X.; Lu, L.; Dai, H.; Zheng, Y. Comprehensive assessment of carbon emissions and environmental impacts of sodium-ion batteries and lithium-ion batteries at the manufacturing stage. J. Clean. Prod. 2023, 423, 138674. [Google Scholar] [CrossRef] [Scilit]
- Chen, Q.W.; Lai, X.; Chen, J.J.; Yao, Y.; Guo, Y.; Zhai, M.; Han, X.; Lu, L.; Zheng, Y. Comparative environmental impacts of different hydrometallurgical recycling and remanufacturing technologies of lithium-ion batteries considering multi-recycling-approach and temporal-geographical scenarios in China. Sep. Purif. Technol. 2023, 324, 124642. [Google Scholar] [CrossRef] [Scilit]
- Tang, X.P.; Wang, Y.J.; Liu, Q.; Gao, F. Reconstruction of the incremental capacity trajectories from current-varying profiles for lithium-ion batteries. iScience 2021, 24, 103103. [Google Scholar] [CrossRef] [Scilit] [PubMed]
- Zhu, J.J.; Lai, X.; Tang, X.P.; Zheng, Y.; Zhang, H.; Dai, H.; Huang, Y. Online multi-scenario impedance spectra generation for batteries based on small-sample learning. Cell Rep. Phys. Sci. 2024, 5, 102134. [Google Scholar] [CrossRef] [Scilit]
- Fei, Z.C.; Zhang, Z.J.; Yang, F.F.; Tsui, K.L.; Li, L. Early-stage lifetime prediction for lithium-ion batteries: A deep learning framework jointly considering machine-learned and handcrafted data features. J. Energy Storage 2022, 52, 104936. [Google Scholar] [CrossRef] [Scilit]
- Chen, Y.; Duan, W.X.; He, Y.G.; Wang, S.; Fernandez, C. A hybrid data driven framework considering feature extraction for battery state of health estimation and remaining useful life prediction. Green Energy Intell. Transp. 2024, 3, 100160. [Google Scholar] [CrossRef] [Scilit]
- Tang, X.P.; Liu, K.L.; Wang, X.; Liu, B.; Gao, F.; Widanage, W.D. Real-time aging trajectory prediction using a base model-oriented gradient-correction particle filter for Lithium-ion batteries. J. Power Sources 2019, 440, 227118. [Google Scholar] [CrossRef] [Scilit]
- He, W.; Williard, N.; Osterman, M.; Pecht, M. Prognostics of lithium-ion batteries based on Dempster–Shafer theory and the Bayesian Monte Carlo method. J. Power Sources 2011, 196, 10314–10321. [Google Scholar] [CrossRef] [Scilit]
- Downey, A.; Lui, Y.; Hu, C.; Laflamme, S.; Hu, S. Physics-based prognostics of lithium-ion battery using non-linear least squares with dynamic bounds. Reliab. Eng. Syst. Saf. 2019, 182, 1–12. [Google Scholar] [CrossRef] [Scilit]
- Zhang, B.H.; Zhu, H.; Ren, Y.; Zhu, H.; Lin, W.; Kai, J.J.; Liu, Q. An Innovative Insight into Performance Degradation of NCM111 Cathode Induced by Suspension of Operation. ACS Appl. Mater. Interfaces 2023, 15, 6612–6620. [Google Scholar] [CrossRef] [Scilit] [PubMed]
- Patil, M.; Tagade, P.; Hariharan, K.; Kolake, S.M.; Song, T.; Yeo, T.; Doo, S. A novel multistage Support Vector Machine based approach for Li ion battery remaining useful life estimation. Appl. Energy 2015, 159, 285–297. [Google Scholar] [CrossRef] [Scilit]
- Wei, J.W.; Dong, G.Z.; Chen, Z.H. Remaining Useful Life Prediction and State of Health Diagnosis for Lithium-Ion Batteries Using Particle Filter and Support Vector Regression. IEEE Trans. Ind. Electron. 2017, 65, 5634–5643. [Google Scholar] [CrossRef] [Scilit]
- Tang, X.P.; Yao, K.; Zou, C.F.; Liu, B.; Gao, F. Predicting Battery Aging Trajectory via a Migrated Aging Model and Bayesian Monte Carlo Method. Energy Procedia 2019, 158, 2456–2461. [Google Scholar] [CrossRef] [Scilit]
- Ng, S.; Xing, Y.J.; Tsui, K. A naive Bayes model for robust remaining useful life prediction of lithium-ion battery. Appl. Energy 2014, 118, 114–123. [Google Scholar] [CrossRef] [Scilit]
- Wang, J.G.; Zhang, S.D.; Li, C.Y.; Wu, L.; Wang, Y. A Data-Driven Method with Mode Decomposition Mechanism for Remaining Useful Life Prediction of Lithium-Ion Batteries. IEEE Trans. Power Electron. 2022, 37, 13684–13695. [Google Scholar] [CrossRef] [Scilit]
- Richardson, R.; Osborne, M.; Howey, D. Gaussian process regression for forecasting battery state of health. J. Power Sources 2017, 357, 209–219. [Google Scholar] [CrossRef] [Scilit]
- Zhang, Y.Z.; Xiong, R.; He, H.W.; Pecht, M.G. Long Short-Term Memory Recurrent Neural Network for Remaining Useful Life Prediction of Lithium-Ion Batteries. IEEE Trans. Veh. Technol. 2018, 67, 5695–5705. [Google Scholar] [CrossRef] [Scilit]
- Tong, Z.M.; Miao, J.Z.; Tong, S.G.; Lu, Y. Early prediction of remaining useful life for Lithium-ion batteries based on a hybrid machine learning method. J. Clean. Prod. 2021, 317, 128265. [Google Scholar] [CrossRef] [Scilit]
- Yan, L.S.; Peng, J.; Gao, D.Z.; Wu, Y.; Liu, Y.; Li, H.; Huang, Z. A hybrid method with cascaded structure for early-stage remaining useful life prediction of lithium-ion battery. Energy 2022, 243, 123038. [Google Scholar] [CrossRef] [Scilit]
- Tang, Y.G.; Yang, K.; Zheng, H.R.; Zhang, S.; Zhang, Z. Early prediction of lithium-ion battery lifetime via a hybrid deep learning model. Measurement 2022, 199, 111530. [Google Scholar] [CrossRef] [Scilit]
- Ma, G.J.; Wang, Z.D.; Liu, W.B.; Fang, J.; Zhang, Y.; Ding, H.; Yuan, Y. A two-stage integrated method for early prediction of remaining useful life of lithium-ion batteries. Knowl.-Based Syst. 2023, 259, 110012. [Google Scholar] [CrossRef] [Scilit]
- Meng, J.H.; You, Y.Q.; Lin, M.Q.; Wu, J.; Song, Z. Multi-scenarios transferable learning framework with few-shot for early lithium-ion battery lifespan trajectory prediction. Energy 2024, 286, 129682. [Google Scholar] [CrossRef] [Scilit]
- Deng, W.K.; Le, H.; Nguyen, K.; Gogu, C.; Medjaher, K.; Morio, J.; Wu, D. A Generic physics-informed machine learning framework for battery remaining useful life prediction using small early-stage lifecycle data. Appl. Energy 2025, 384, 125314. [Google Scholar] [CrossRef] [Scilit]
- Lai, X.; Qian, L.L.; Tang, X.P.; Zheng, Y.; Zhu, J.; Sun, T.; Shen, K.; Lu, J. Early-stage remaining useful life prediction for lithium-ion batteries based on geometric output construction. J. Energy Storage 2025, 114, 115792. [Google Scholar] [CrossRef] [Scilit]
- Safitri, M.; Adji, T.B.; Cahyadi, A.I. Enhanced early prediction of Li-ion battery degradation using multicycle features and an ensemble deep learning model. Results Eng. 2025, 25, 104235. [Google Scholar] [CrossRef] [Scilit]
- Cui, X.R.; Zhang, J.L.; Zhang, D.; Wei, Y.; Qi, H. Joint Prediction of Li-Ion Battery Cycle Life and Knee Point Based on Early Charging Performance. Symmetry 2025, 17, 351. [Google Scholar] [CrossRef] [Scilit]
- Hou, J.; Su, T.A.; Gao, T.; Yang, Y.; Xue, W. Early prediction of battery lifetime for lithium-ion batteries based on a hybrid clustered CNN model. Energy 2025, 319, 134992. [Google Scholar] [CrossRef] [Scilit]
- Xu, Y.F.; Wei, H.P.; Lin, M.X.; Deng, Y.; Sheng, K.; Zhang, M. Transformers in computational visual media: A survey. Comput. Vis. Media 2022, 8, 33–62. [Google Scholar] [CrossRef] [Scilit]
- Cai, Y.X.; Li, W.M.; Zahid, T.; Zheng, C.; Zhang, Q.; Xu, K. Early prediction of remaining useful life for lithium-ion batteries based on CEEMDAN-transformer-DNN hybrid model. Heliyon 2023, 9, e17754. [Google Scholar] [CrossRef] [Scilit] [PubMed]
- Zhao, W.J.; Ding, W.; Zhang, S.J.; Zhang, Z. Enhancing lithium-ion battery lifespan early prediction using a multi-branch vision transformer model. Energy 2024, 302, 131816. [Google Scholar] [CrossRef] [Scilit]
- Gao, M.X.; Fei, Z.C.; Guo, D.X.; Wang, M. A multi-stage time series processing framework based on attention mechanism for early life prediction of lithium-ion batteries. J. Energy Storage 2024, 84, 110771. [Google Scholar] [CrossRef] [Scilit]
- Severson, K.A.; Attia, P.M.; Jin, N.; Perkins, N.; Jiang, B.; Yang, Z.; Braatz, R.D. Data-driven prediction of battery cycle life before capacity degradation. Nat. Energy 2019, 4, 383–391. [Google Scholar] [CrossRef] [Scilit]

Disclaimer/Publisher’s Note: The statements, opinions and data contained in all publications are solely those of the individual author(s) and contributor(s) and not of MDPI and/or the editor(s). MDPI and/or the editor(s) disclaim responsibility for any injury to people or property resulting from any ideas, methods, instructions or products referred to in the content. |
© 2026 by the authors. Licensee MDPI, Basel, Switzerland. This article is an open access article distributed under the terms and conditions of the Creative Commons Attribution (CC BY) license.