Article

A Multi-Channel DC-Bias-Tolerant Electrochemical Impedance Spectroscopy Device for Lithium-Ion Battery Diagnostics

1
College of Mechanical and Electrical Engineering, Hebei Agricultural University, Baoding 071001, China
2
No. 704 Research Institute, China State Shipbuilding Corporation, Shanghai 200031, China
3
School of Mechanical Engineering, Beijing Institute of Technology, Beijing 100081, China
4
Shenzhen Automotive Research Institute of BIT (Shenzhen Research Institute of National Engineering Research Center for Electric Vehicles), Shenzhen 518000, China
*
Author to whom correspondence should be addressed.
Batteries 2026, 12(9), 319; https://doi.org/10.3390/batteries12090319 (registering DOI)
Submission received: 3 July 2026 / Revised: 27 July 2026 / Accepted: 9 August 2026 / Published: 23 August 2026
(This article belongs to the Section Electric Vehicles and Mobile Energy Storage Systems)

Abstract

Electrochemical impedance spectroscopy (EIS) resolves the internal physicochemical processes of lithium-ion batteries across timescales—from ohmic conduction through charge-transfer kinetics to solid-state diffusion. Despite this analytical power, EIS deployment remains largely confined to laboratory electrochemical workstations that are bulky, expensive, and incapable of online multi-cell operation under dynamic DC bias conditions. This study presents a multi-channel EIS measurement device that simultaneously addresses three requirements for practical battery diagnostics: workstation-grade measurement accuracy, multi-cell synchronous acquisition, and tolerance to the DC bias voltage present across battery terminals during operation. The device employs a master–slave distributed architecture: each slave unit is built around the DNB1101 battery-dedicated impedance measurement chip with a Kelvin four-wire sensing configuration, while the STM32F407-based master controller coordinates measurement scheduling and data communication under FreeRTOS. A four-channel slave board with a differential daisy-chain communication topology and hardware broadcast trigger mechanism supports multi-cell synchronous acquisition. The device operates over a frequency range of 0.01 Hz to 5620 Hz with logarithmic spacing, and a C#-based host application provides real-time Nyquist and Bode visualization along with MATLAB R2024a-based post-processing for outlier rejection and data smoothing. Validation was conducted using Panasonic NCR18650 ternary (NCA) and LiFePO4 (LFP) 18650 cells, benchmarked against a CorrTest CS350 electrochemical workstation at SOC = 40% and 25 °C. The device achieves a maximum impedance magnitude error of 1.55% and a maximum phase error of 1.22%. Equivalent circuit model fitting via ZSimpWin yields parameter differences below 1% between the device and the reference workstation. Under online conditions with a 3.6 V DC bias, the impedance measurement deviation of a 20 mΩ precision resistor remains below 0.69% across the full frequency range. Multi-channel synchronous measurements across four cells demonstrate inter-channel amplitude variance below 2.13%. Cross-chemistry validation with LiFePO4 cells yields magnitude and phase errors below 0.92%. These results demonstrate that the proposed device provides laboratory-grade EIS accuracy with multi-channel, online, and cross-chemistry capabilities, offering a practical platform for integrating EIS-based diagnostics into next-generation battery management systems.

1. Introduction

The accelerating global transition toward transportation electrification has positioned lithium-ion batteries as the predominant energy storage technology for electric vehicles (EVs) and grid-scale storage systems [1]. However, lithium-ion batteries are complex nonlinear electrochemical systems whose performance, lifetime, and safety are governed by multiple coupled processes, including charge-transfer kinetics, solid-state ion diffusion, and interfacial phenomena at the solid–electrolyte interphase (SEI) [2]. Critical states—state of charge (SOC), state of health (SOH), and state of power (SOP)—are influenced by temperature, C-rate, and aging history [3]. Without effective diagnostics, batteries can undergo overcharge, lithium plating, internal short circuits, or even thermal runaway [4].
Current battery management systems (BMSs) rely predominantly on macroscopic parameters—terminal voltage, current, and surface temperature—combined with ampere-hour counting or open-circuit voltage methods for state estimation [5]. Although computationally efficient, these approaches are inherently indirect: they infer internal electrochemical conditions from external electrical behavior. Subtle degradation mechanisms, such as SEI thickening, electrolyte depletion, or incipient lithium plating, often produce negligible changes in terminal voltage until damage is advanced [6]. Consequently, conventional BMSs lack the sensitivity required for early fault detection and accurate health prognostics.
Electrochemical impedance spectroscopy (EIS) addresses these limitations by probing battery dynamics across a broad frequency range. By applying a small-amplitude sinusoidal perturbation and measuring the amplitude ratio and phase shift in the response, EIS can resolve distinct physicochemical processes: the ohmic resistance of the electrolyte, separator, and current collectors (high-frequency intercept with the real axis); the charge-transfer resistance at electrode–electrolyte interfaces (mid-frequency depressed semicircle); and the solid-state diffusion of lithium ions within electrode particles (low-frequency Warburg tail) [7,8]. EIS-derived parameters—particularly the ohmic resistance Rb and the charge-transfer resistance Rct—have been shown to correlate strongly with SOC, SOH, internal temperature, and lithium plating onset [9,10,11,12]. Recent advances in onboard battery management systems have further demonstrated that incorporating real-time EIS features enables high-precision state diagnostics and fault prognostics under dynamic operating conditions [13,14].
Despite its well-established diagnostic power, EIS has remained largely confined to laboratory electrochemical workstations. Commercial instruments from Solartron, Autolab, and Ivium offer wide frequency ranges (typically 10 µHz to 1 MHz) and high measurement accuracy, but they are physically large, expensive (USD 30,000–60,000 per channel), and designed exclusively for single-cell offline operation in controlled laboratory environments [15]. This fundamental mismatch between the diagnostic richness of EIS and the practical constraints of field deployment has motivated extensive research toward portable, low-cost, and embeddable EIS measurement solutions.
Three distinct generations of compact EIS architectures have been explored over the past two decades, each addressing part of the deployment challenge but leaving critical gaps. First-generation approaches employed discrete analog components—direct digital synthesis (DDS) signal generators, instrumentation amplifiers, and high-speed analog-to-digital converters—controlled by microcontrollers (MCUs) or field-programmable gate arrays (FPGAs) [16,17]. While these systems demonstrated the feasibility of miniaturized EIS, they suffered from large component counts, high power consumption, and performance degradation at high frequencies due to the limited gain-bandwidth product of operational amplifiers and the difficulty of precisely controlling parasitic impedances in discrete designs. Critically, these systems provided only single-channel measurement capability, as scaling to multiple channels required duplicating the entire analog front-end chain, compounding the cost, size, and calibration challenges.
Second-generation designs leveraged highly integrated impedance converter chips, most notably the AD5933 and the AD594x series from Analog Devices [18,19]. These single-chip solutions integrate excitation signal generation, response acquisition, and discrete Fourier transform (DFT)-based impedance calculation, substantially reducing component count and enabling genuinely compact form factors. However, these general-purpose impedance measurement ICs were designed primarily for biomedical applications (skin impedance, body composition analysis) and industrial sensing, not for the demanding electrical environment of lithium-ion batteries. The AD5933 lacks intrinsic DC bias rejection, requiring external AC coupling capacitors and bias adjustment networks that introduce parasitic impedances at low frequencies and degrade measurement accuracy in the sub-hertz range [20]. The AD5941, while supporting four-wire measurements, was optimized for electrode–skin interfaces with impedance ranges (tens of ohms to kilohms) that differ by orders of magnitude from the milliohm-level impedances of high-capacity lithium-ion cells [21]. Furthermore, neither device offers native multi-channel communication support, meaning that multi-cell expansion requires external analog multiplexers that add parasitic paths, cross-channel leakage, and sequential switching delays.
Third-generation architectures have turned to battery-dedicated monitoring ICs and advanced excitation strategies, wideband multi-frequency excitation, equalized current harmonic injection, or high-density integrated AFEs [12,14,22,23,24]. The DNB1101 (Datang NXP Semiconductors) represents a specialized battery impedance measurement front-end that addresses prior limitations: a 1.9–5.5 V input range directly accommodates cell potentials without external DC-blocking networks; an on-chip switching AC current source provides efficient excitation; a localized 4 MHz DFT engine computes complex impedance directly; and a differential daisy-chain interface supports up to 252 addressable nodes without analog multiplexing [25].
Compared with recently reported online multi-channel EIS systems that rely on sequential multiplexing or centralized FFT processing, the principal novelties of the proposed master–slave architecture lie in:
  • Native DC-Bias Tolerant Galvanostatic Sensing: Achieving milliohm-level impedance accuracy under continuous DC bias without passive AC-coupling networks or resistive dividers.
  • Multiplexing-Free Synchronous Daisy-Chain: Employing transformer-isolated differential daisy-chain links with a hardware broadcast trigger mechanism to achieve phase-aligned, truly simultaneous multi-cell acquisition without cross-channel leakage.
  • Distributed DFT Edge Computation: Offloading DFT processing entirely to individual DNB1101 slave units, reducing bus throughput from high-speed ADC sample streams to compact complex impedance records.
The engineering challenge, however, extends beyond chip selection. Deploying online EIS in a practical BMS context requires solving an architectural trilemma: (i) achieving workstation-grade measurement accuracy in the milliohm regime despite the presence of large DC cell voltages (up to 4.2 V) that overwhelm the microvolt-level AC response signal; (ii) supporting synchronous multi-cell acquisition to enable cell-to-cell variation analysis within the thermal and SOC stability time window of a battery pack; and (iii) maintaining these capabilities at a cost, size, and power envelope compatible with embedded deployment. Prior compact EIS systems have addressed at most one or two of these requirements simultaneously. No existing system has demonstrated all three in a single integrated device.
In this paper, we present the complete design, implementation, and experimental validation of a multi-channel online EIS measurement device that resolves this architectural trilemma. The principal contributions are:
  • A master–slave distributed hardware architecture that combines the DNB1101 chip with a Kelvin four-wire sensing configuration and a switching-type AC current source to achieve milliohm-level measurement accuracy in the presence of large DC cell voltages.
  • A daisy-chain multi-channel expansion scheme with a hardware broadcast trigger mechanism that enables truly synchronous impedance acquisition from multiple cells, with galvanic isolation between adjacent nodes to suppress common-mode interference.
  • A comprehensive software ecosystem including FreeRTOS-based embedded firmware for real-time task scheduling, a C# host application for impedance spectrum visualization, and MATLAB-based post-processing for outlier removal and data smoothing.
  • Systematic experimental validation through five complementary test configurations: single-cell accuracy benchmarking against a commercial electrochemical workstation, equivalent circuit model parameter fitting, four-channel synchronous measurement, online-versus-offline testing under 3.6 V DC bias with a precision resistor standard, and cross-chemistry evaluation with LiFePO4 cells.
The remainder of this paper is organized as follows. Section 2 describes the measurement principle, system architecture, hardware and software design, and experimental methods. Section 3 presents the experimental results across all five validation dimensions. Section 4 discusses the architectural advantages, practical implications, and limitations of the device. Section 5 concludes the paper.

2. Materials and Methods

2.1. Measurement Principle and System Architecture

2.1.1. EIS Measurement Principle

The device operates in galvanostatic EIS mode: a small-amplitude sinusoidal AC current is injected into the battery under test, and the resulting AC voltage response is measured. The complex impedance Z(jω) at angular frequency ω is computed as:
Z j ω = V j ω I j ω = Z + j Z
where Z and Z denote the real (resistive) and imaginary (reactive) components, respectively. The impedance magnitude | Z | and phase angle θ are:
Z = Z 2 + Z 2
θ = atan 2 Z , Z
To ensure valid impedance interpretation, three fundamental conditions must be satisfied [26]. First, causality requires that the measured response originates exclusively from the applied perturbation, necessitating a high signal-to-noise ratio and adequate electromagnetic shielding. Second, linearity requires that the battery behave as a linear time-invariant system within the perturbation amplitude. Although the current–overpotential relationship of an electrode is inherently nonlinear—governed by the Butler–Volmer equation—it can be linearized via first-order Taylor expansion around the operating point under the small-signal approximation:
Δ i Δ η R c t , R c t = R T n F i 0
where R is the gas constant, T is the absolute temperature, n is the number of electrons transferred, F is the Faraday constant, and i 0 is the exchange current. We limit the AC excitation current such that the induced terminal voltage perturbation remains below 10 mV peak-to-peak, strictly satisfying the small-signal linearity condition required for Butler–Volmer linearization. Third, stability requires that the electrochemical state remains quasi-steady throughout the measurement. We enforce a 1 h open-circuit rest period after SOC adjustment and employ pure AC excitation (zero DC component) to prevent SOC drift during acquisition.
The excitation frequency range spans from 0.01 Hz to 5620 Hz, covering the diagnostically relevant spectrum from charge-transfer kinetics (mid-frequency) to solid-state diffusion (low-frequency). Frequency points are distributed logarithmically at 8 points per decade, yielding 45 measurement points per sweep. To mitigate random measurement noise and ensure short-term measurement repeatability during the feasibility evaluation, four consecutive measurements are acquired and averaged at each frequency point before recording the impedance values.

2.1.2. Online Measurement Strategy

For online EIS measurement in the presence of fluctuating load currents and DC voltage backgrounds, two critical design decisions were made: the choice of excitation mode and the choice of sensing configuration.
Current-mode excitation. EIS excitation can employ either voltage-mode (potentiostatic) or current-mode (galvanostatic) control. Potentiostatic (voltage-mode) excitation, commonly used in laboratory electrochemical workstations, relies on stable open-circuit conditions. Under dynamic operating conditions—where battery terminal voltage fluctuates with load current—potentiostatic control becomes susceptible to regulation errors, leading to excitation signal distortion driven by time-varying DC operating points. Current-mode excitation, by contrast, maintains a constant AC current amplitude regardless of the cell’s DC voltage or load-induced fluctuations, offering superior immunity to environmental disturbances [27]. We therefore adopt a galvanostatic excitation strategy.
Switching-type AC current source. Two principal current source topologies exist: linear and switching. Linear current sources offer low output ripple and high dynamic accuracy but suffer from low efficiency (significant power dissipated in the pass transistor), large physical footprint (requiring heat sinking at multi-watt dissipation levels), and limited scalability to multi-channel configurations. Switching-type current sources, based on pulse-width modulation of a MOSFET switching stage, achieve higher efficiency (>85%), smaller footprint, and better scalability at the cost of higher output ripple. For this device, we selected a switching-type topology and mitigated ripple through a combination of output filtering and the inherent narrowband selectivity of the DFT-based demodulation in the DNB1101, which acts as a synchronous filter at the excitation frequency.
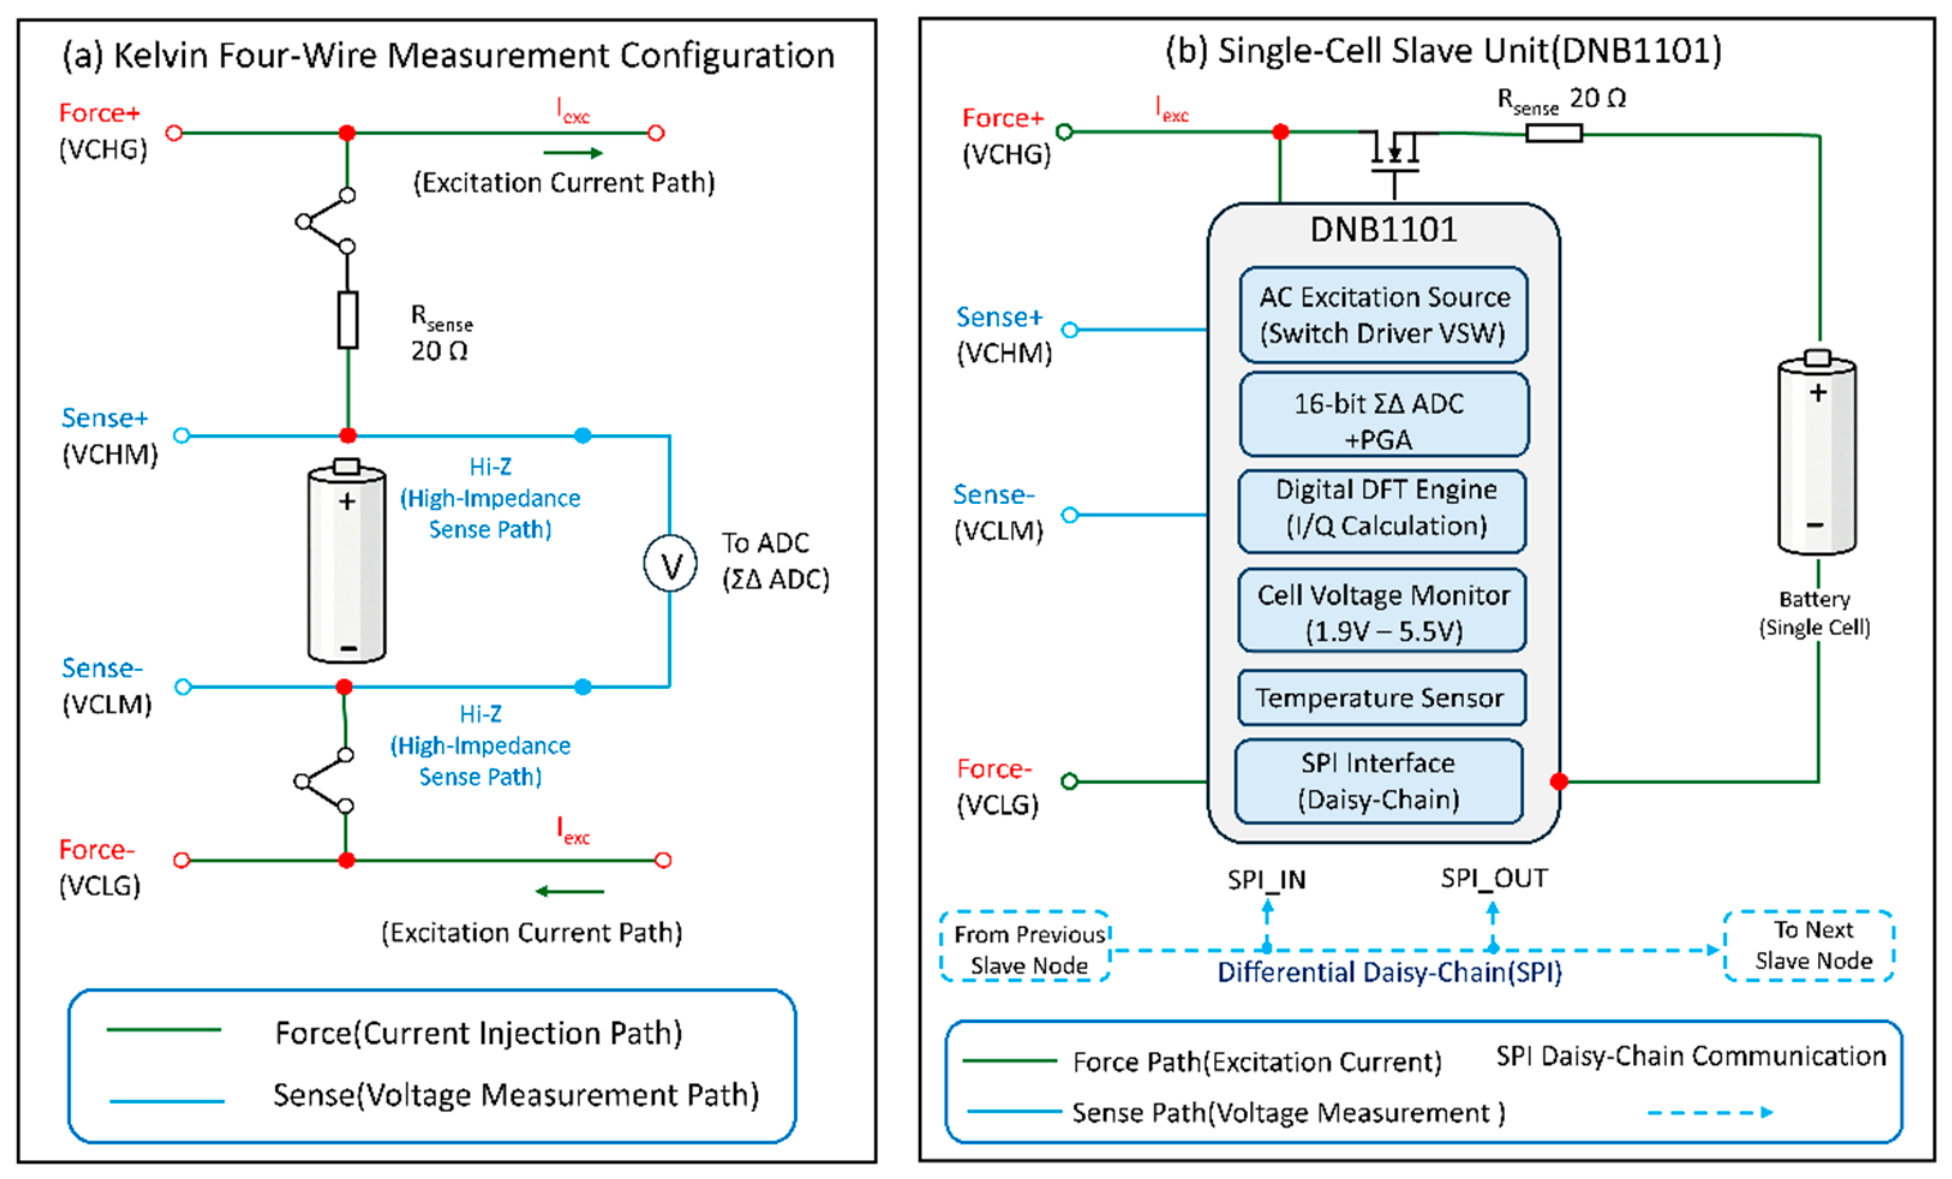
Kelvin four-wire sensing. Lithium-ion battery internal impedances are typically in the milliohm range (approximately 0.3–5 mΩ at 1 kHz for high-capacity automotive cells). In a conventional two-wire measurement, the voltage drop across the test leads—whose resistance can range from several milliohms to tens of milliohms depending on lead length, gauge, and connector quality—appears in series with the cell impedance, introducing errors that can exceed 100% of the quantity being measured. We therefore employ the Kelvin four-wire (force–sense) method, which separates the current-carrying path from the voltage-sensing path. The AC excitation current is delivered through dedicated force leads, while the resulting voltage response is measured independently through high-impedance sense leads that draw negligible current. The IR drop across the force leads and contact interfaces does not appear in the sensed voltage, effectively eliminating wiring and contact resistance contributions to the measured impedance.

2.1.3. Overall System Architecture

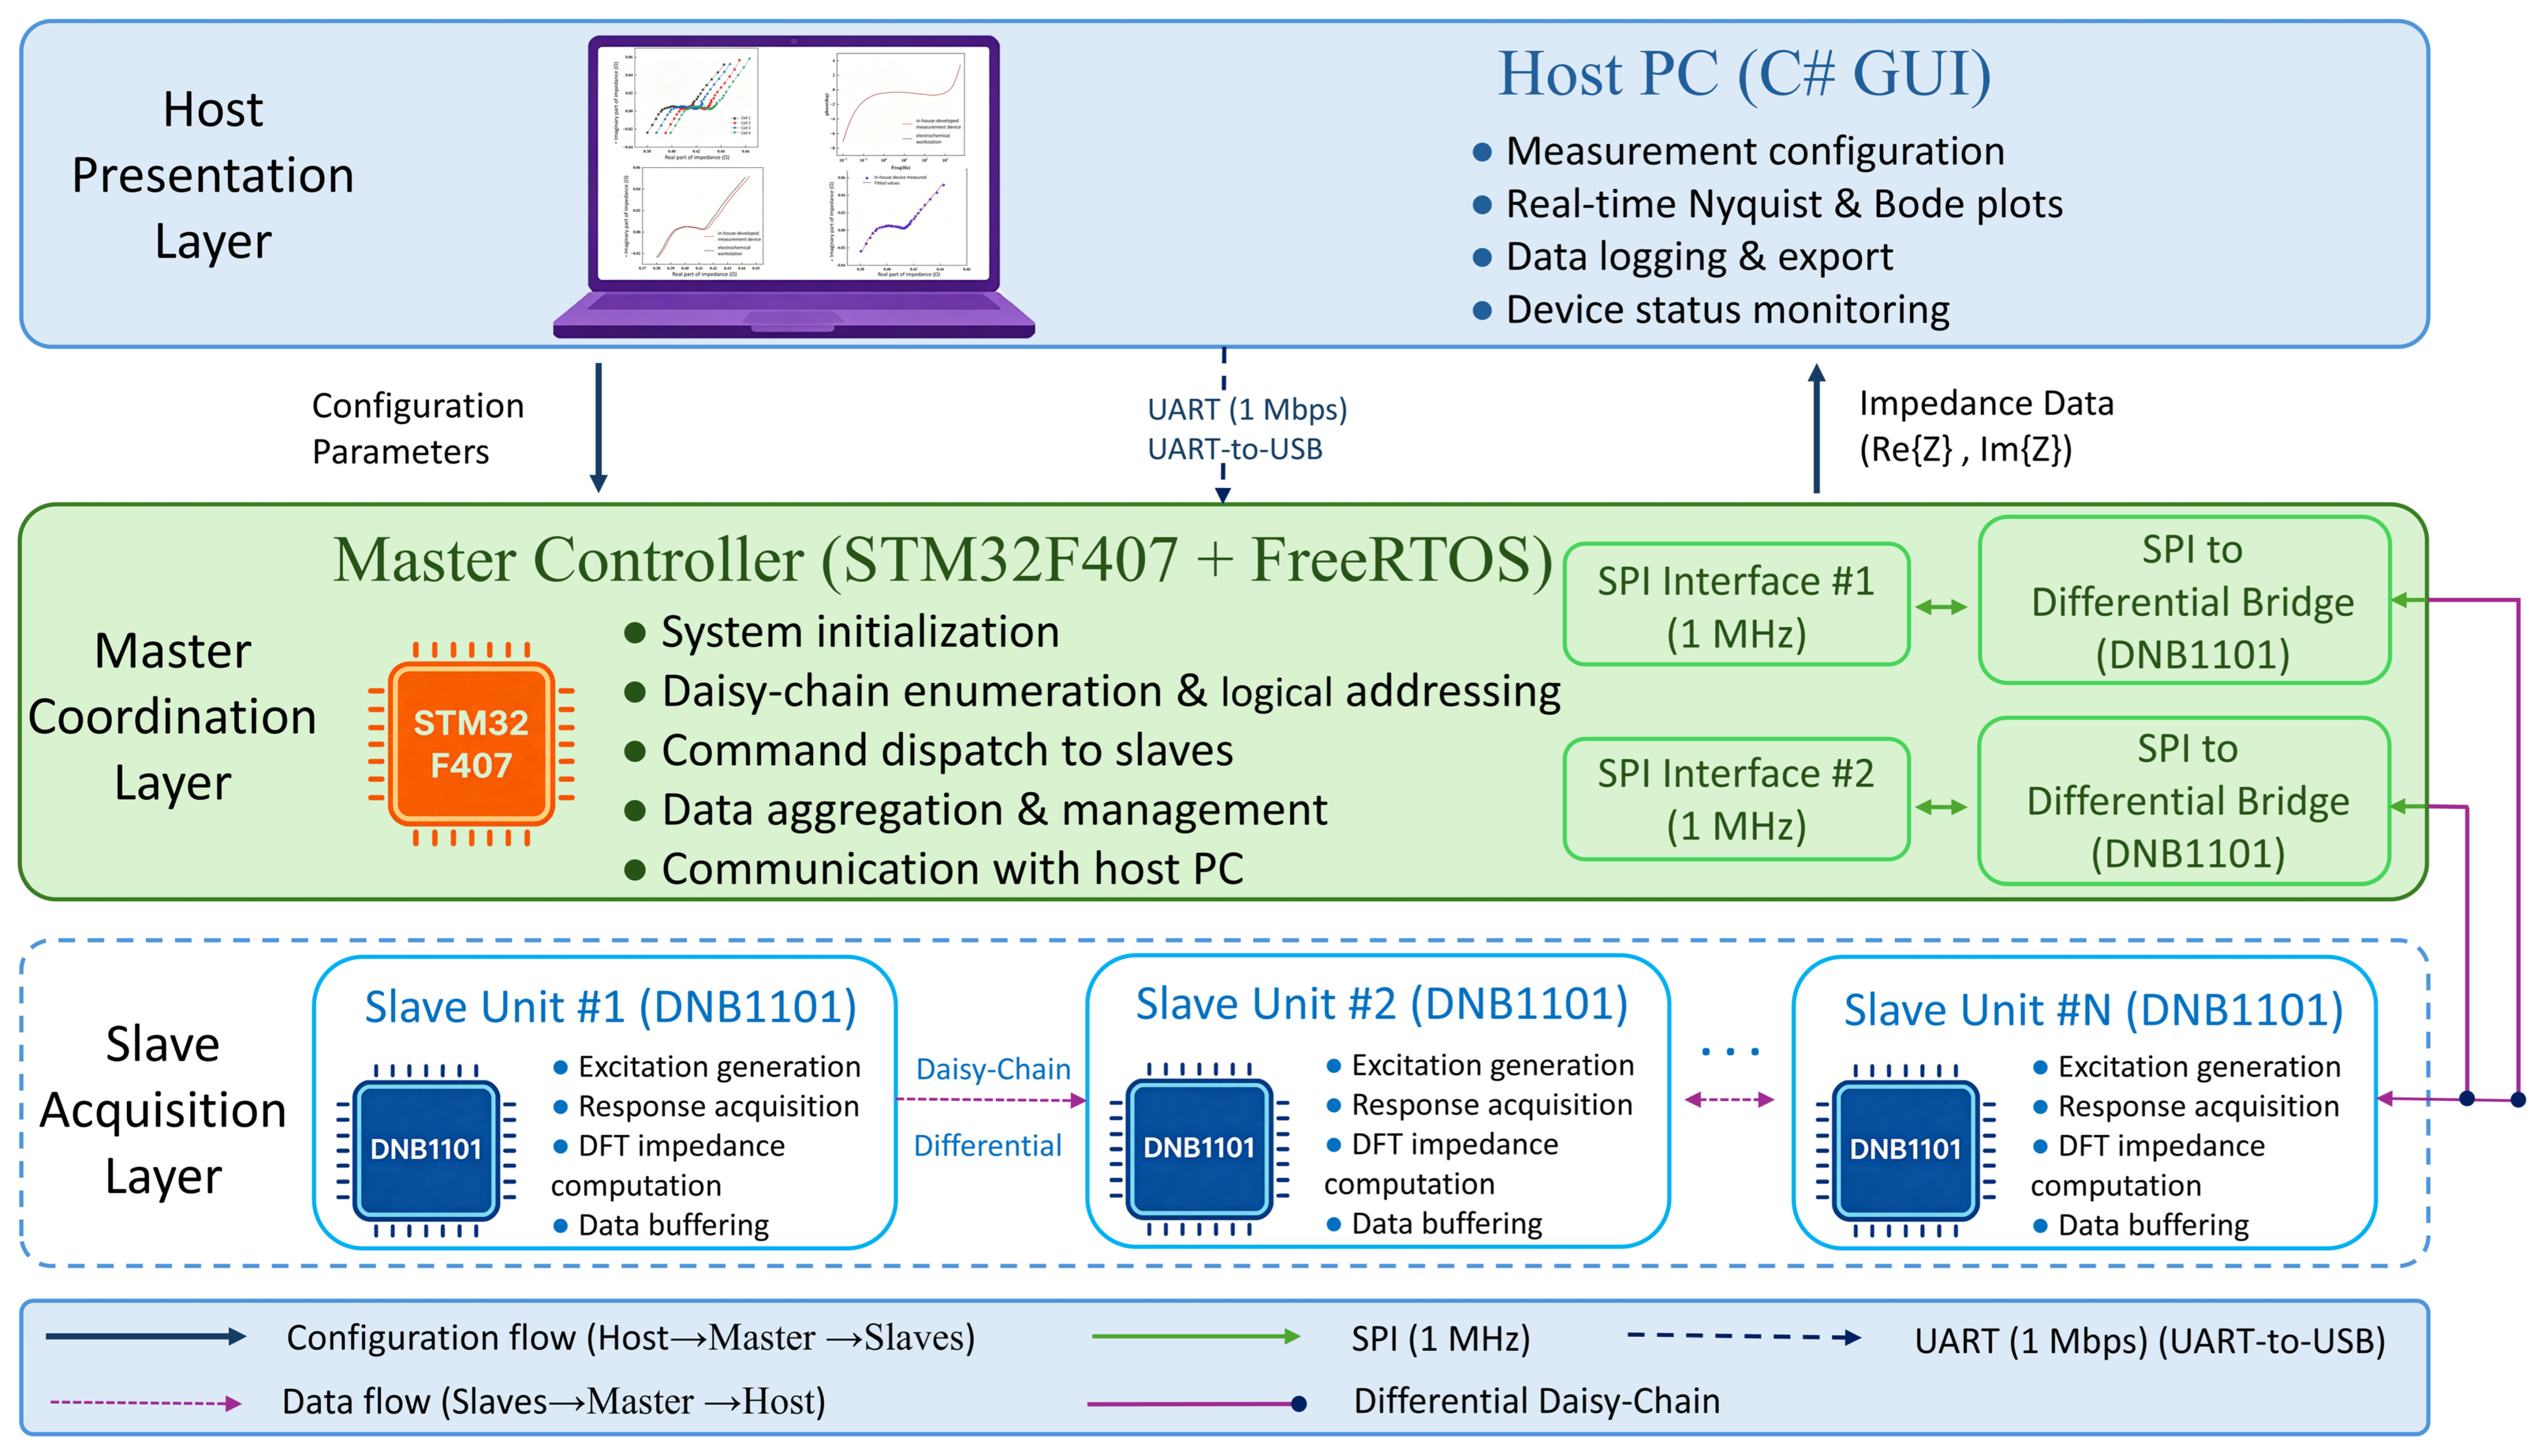
Figure 1 presents the overall architecture of the online EIS measurement system. The system adopts a master–slave distributed topology comprising three functional layers:
The slave acquisition layer consists of two complementary slave designs that address different validation requirements. The single-cell slave unit, built around one DNB1101 chip with a Kelvin four-wire configuration, is designed for high-precision laboratory validation. The multi-channel slave unit integrates four DNB1101 chips with 18,650 cell holders on a single PCB, communicating via a differential daisy-chain topology that allows a single serial peripheral interface (SPI) port on the master side to control multiple measurement nodes. Each slave unit performs autonomous excitation generation, response acquisition, DFT-based impedance computation, and local data buffering.
The master coordination layer is implemented on an STM32F407 microcontroller (ARM Cortex-M4 core, 168 MHz) which manages the entire measurement workflow under the FreeRTOS real-time operating system. Its functions include system initialization, daisy-chain node enumeration and logical addressing, command dispatching to addressed slaves, data aggregation from completed sweeps, and communication with the host computer. Two independent SPIs operating at 1 MHz connect to bridge DNB1101 chips that convert standard SPI signals to the differential daisy-chain physical layer.
The host presentation layer comprises a C# WinForms application that provides a graphical user interface for measurement configuration, real-time Nyquist and Bode plot visualization, data logging, and device status monitoring. Communication with the master unit uses a UART-to-USB bridge at 1 Mbps.
During a measurement sequence, the host computer sends swept-frequency parameters (start/stop frequencies, points per decade, excitation amplitude, averaging cycles) to the master. The master dynamically creates a measurement task, sequentially broadcasts frequency and configuration settings to the addressed slave units, and retrieves impedance data upon sweep completion. Each slave unit autonomously generates the AC excitation current, acquires voltage and current responses, performs on-chip DFT computation, and returns the real and imaginary impedance components. The master aggregates data from all channels and uploads them to the host for real-time display and storage. This hierarchical design decouples user interaction, high-level measurement control, and low-level signal acquisition, ensuring deterministic timing during multi-frequency, multi-channel operation.

2.2. Hardware Design

2.2.1. Slave Acquisition Unit

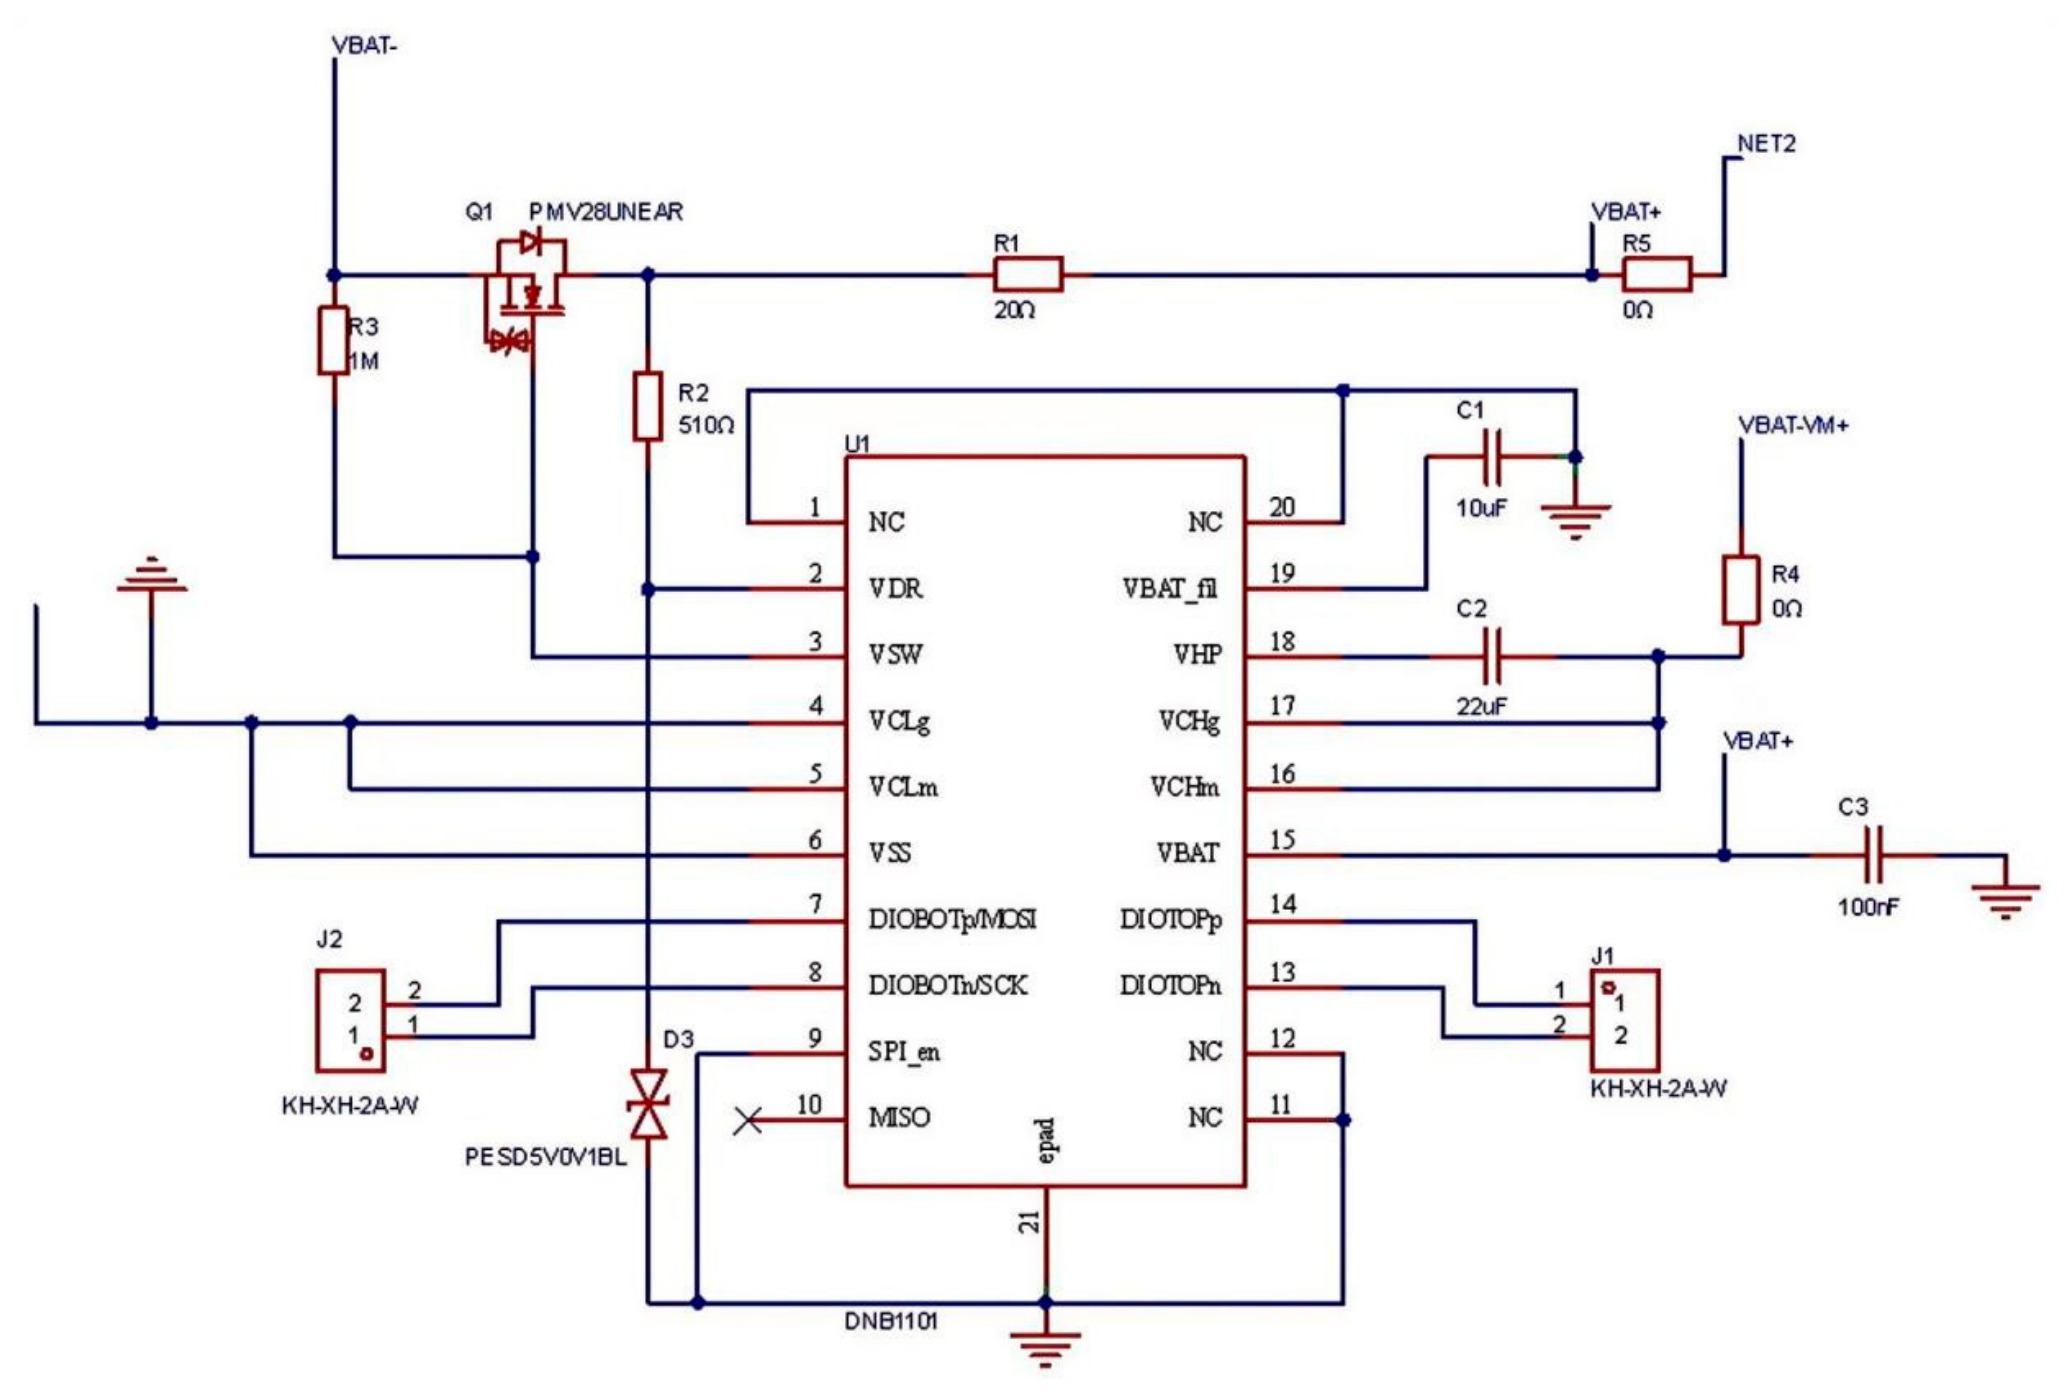
The core of each slave acquisition unit is the DNB1101 battery impedance measurement chip. The DNB1101 integrates the following functional blocks relevant to this application: a programmable AC current excitation source with a switching-type output stage; a 16-bit sigma-delta analog-to-digital converter (ΣΔ ADC) operating at a fixed oversampling rate of 4 MHz with an on-chip programmable gain amplifier; a digital DFT engine that computes the in-phase and quadrature components of the voltage and current signals at the programmed excitation frequency; a cell voltage monitoring input that directly accommodates DC voltages from 1.9 V to 5.5 V, eliminating the need for external DC-blocking capacitor networks; an integrated temperature sensor; and a differential daisy-chain-capable serial communication interface. The complete circuit schematic of the single-cell slave acquisition unit is provided in Figure A1.
Compared to general-purpose battery monitoring analog front-ends (e.g., LTC6811, BQ76952) that provide accurate DC cell voltage sensing but lack on-chip AC excitation and impedance computation, and compared to general-purpose impedance converter ICs (e.g., AD5933, AD5941) that require external DC-blocking networks for battery measurements, the DNB1101 uniquely meets the combined requirements of lithium-ion battery EIS: direct cell voltage interface, integrated AC perturbation generation, on-chip DFT demodulation, and multi-node daisy-chain communication.
In the single-cell slave unit, the DNB1101 is configured in a four-wire Kelvin sensing topology. The on-chip excitation switch driver (VSW) modulates an external N-channel MOSFET with low on-resistance in series with a 20 Ω precision sense resistor to inject a controlled AC perturbation current into the cell through the force leads (VCHG, VCLG). Simultaneously, the potential sense pairs (VCHM, VCLM) directly tap the battery terminal interfaces with high input impedance, measuring only the cell’s AC voltage response without the IR drop across the force leads. This architectural separation of the current and voltage paths is essential for achieving milliohm-level accuracy (Figure 2).

2.2.2. Multi-Channel Daisy-Chain Topology

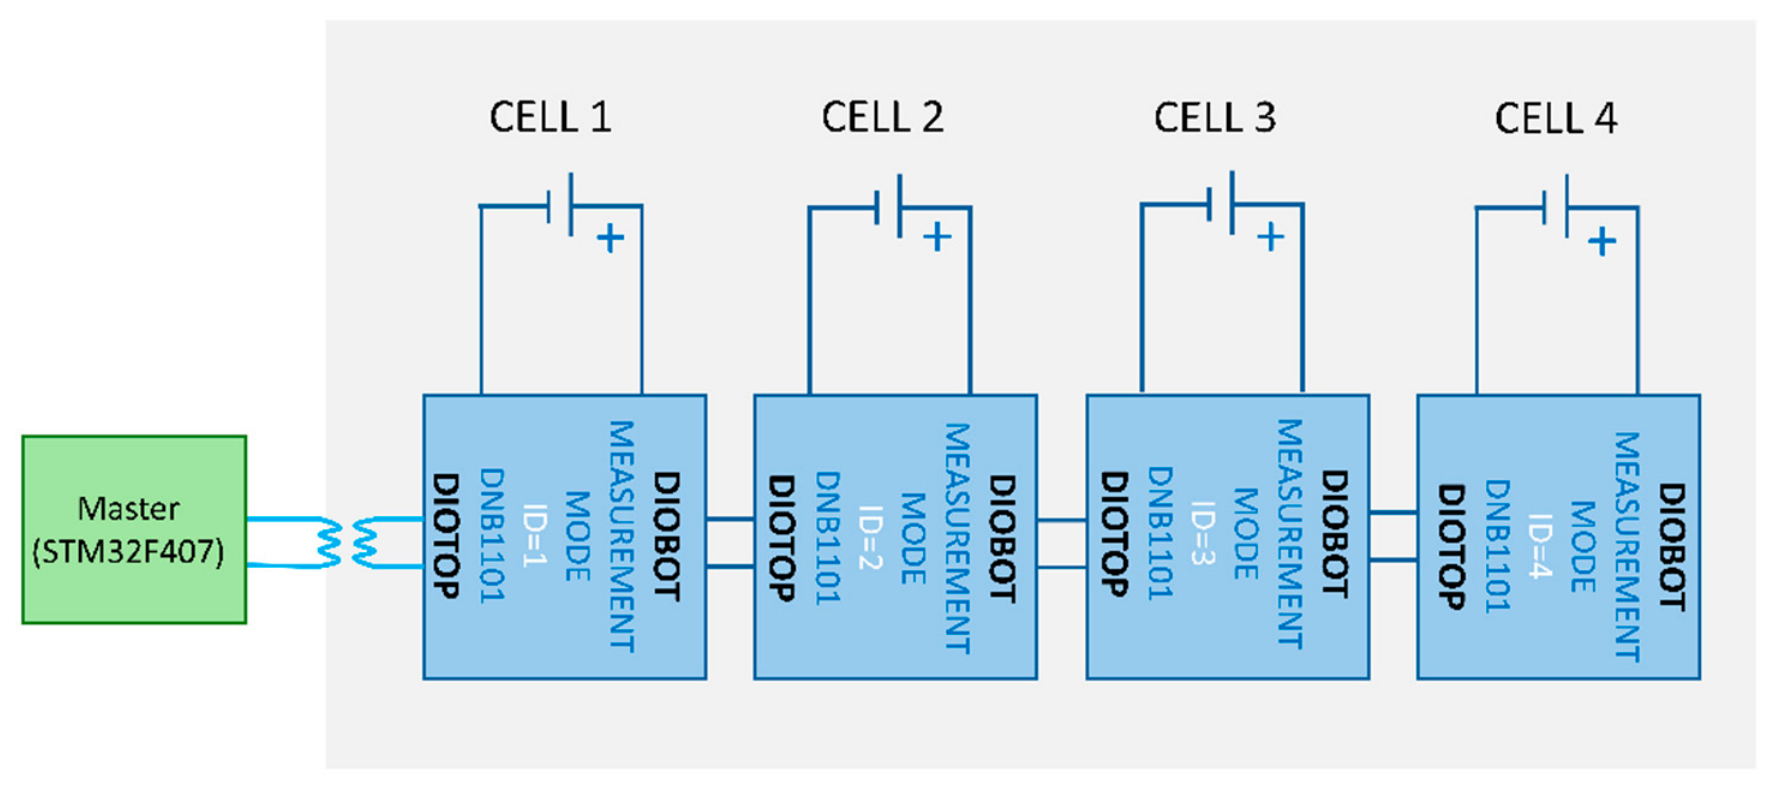
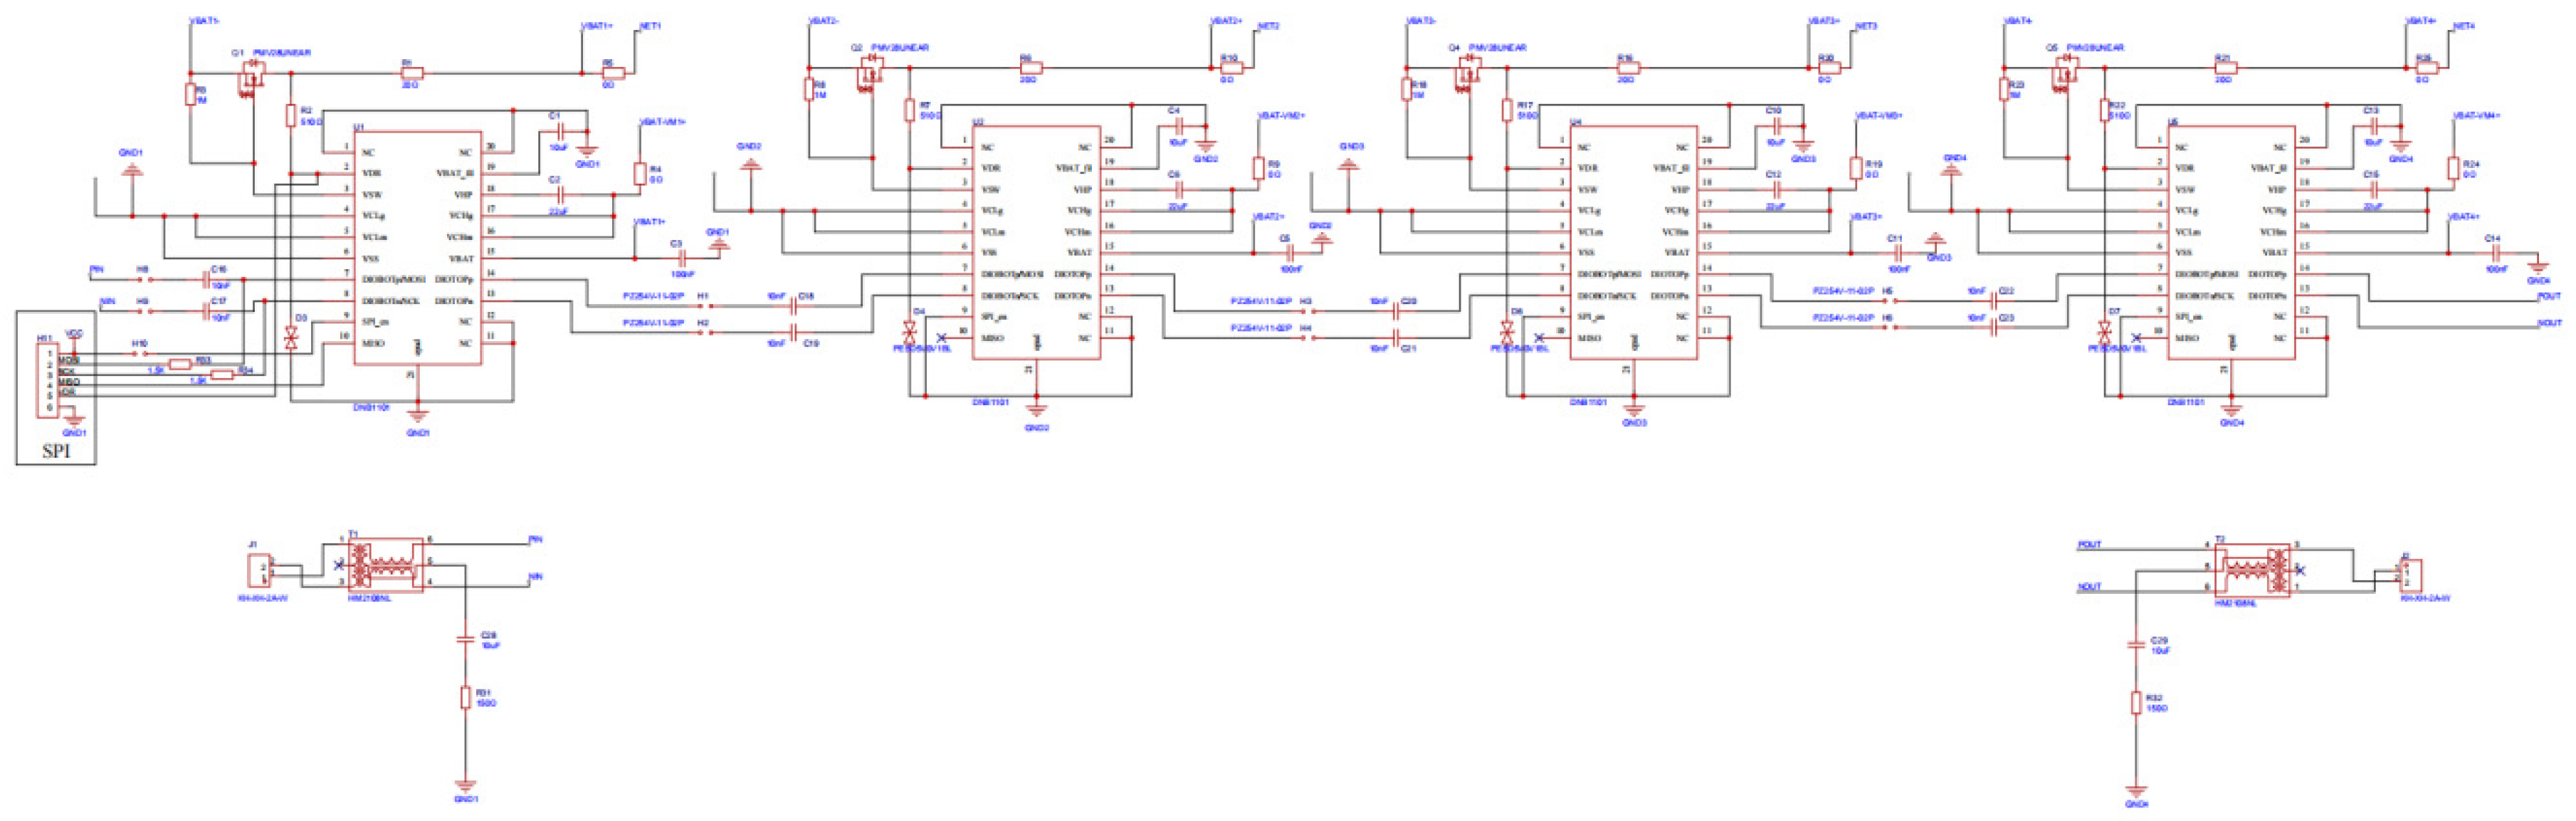
Multi-cell expansion employs a differential daisy-chain communication architecture (Figure 3). In this topology, slave units are connected in a serial chain: the master communicates exclusively with the first node (the bridge device) via standard four-wire SPI; subsequent nodes receive commands and return data through localized differential serial links. This architecture contrasts with a star topology, which would require a dedicated chip-select line from the master to each slave—an arrangement that becomes physically impractical as the channel count increases, particularly in the spatially distributed wiring environment of a battery pack. The full circuit schematic of the four-channel slave board is shown in Figure A2.
The physical layer of each inter-node link uses high-speed pulse transformers (HM2103NLT:(Pulse Electronics, San Diego, CA, USA)) to provide galvanic isolation rated at several thousand volts between adjacent nodes. This isolation is essential in multi-cell battery packs, where series-connected cells operate at different DC potentials, and a non-isolated communication bus would create common-mode voltage differences that could saturate receiver input stages or, in fault conditions, propagate destructive currents between cells.
Multi-channel synchronization employs a hardware broadcast trigger mechanism. When the master issues a global execution command—a specially formatted packet recognized by all nodes on the chain—all slave units concurrently activate their excitation engines and begin the frequency sweep using locally stored parameters that were pre-loaded during the configuration phase. Because each slave generates its own excitation and performs its own DFT processing, the measurement at each channel proceeds fully in parallel. The hardware clock distribution across the daisy chain ensures that the sampling instants at all nodes are phase-aligned, preserving the instantaneous phase relationship between channels. Data retrieval is subject to sequential propagation along the chain (each node transmits its buffered data to the next node in a shift-register fashion), but this does not affect the synchronicity of the measurement itself. For a daisy chain of 100 nodes, the cumulative packet transmission overhead is approximately 3.5 ms, which is negligible compared to the total sweep duration of approximately 12 min.

2.2.3. Physical Implementation

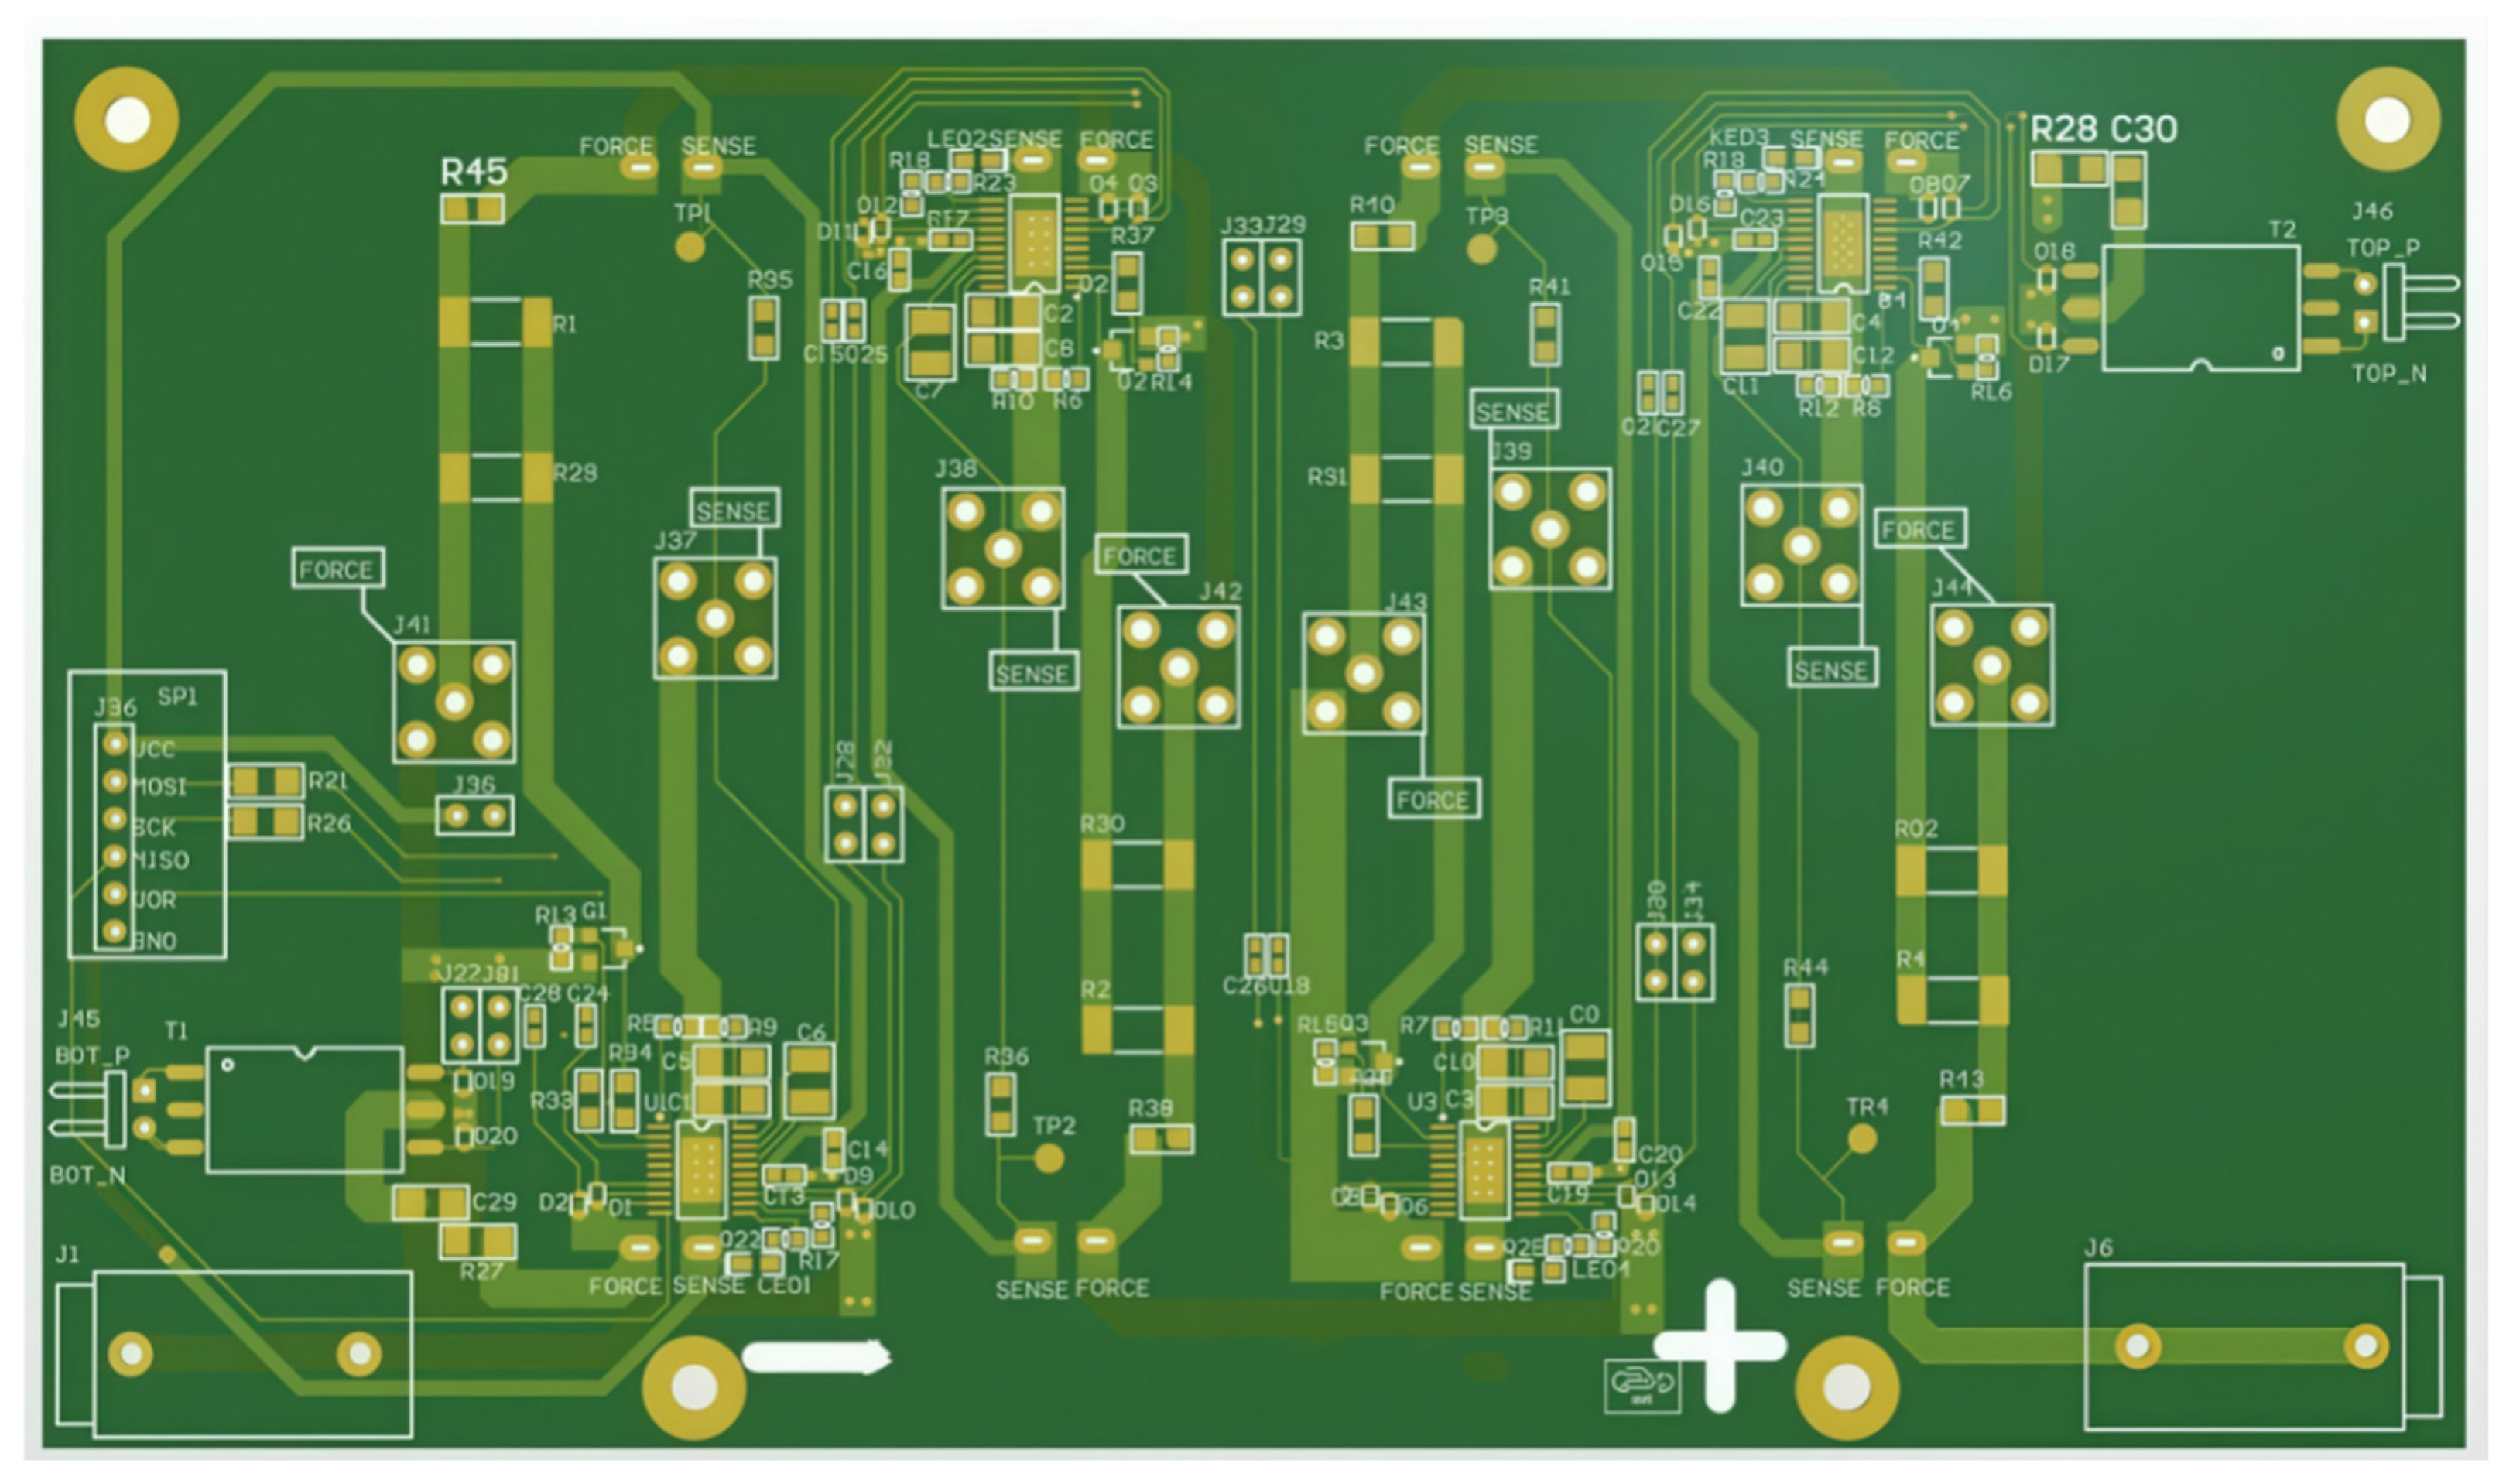
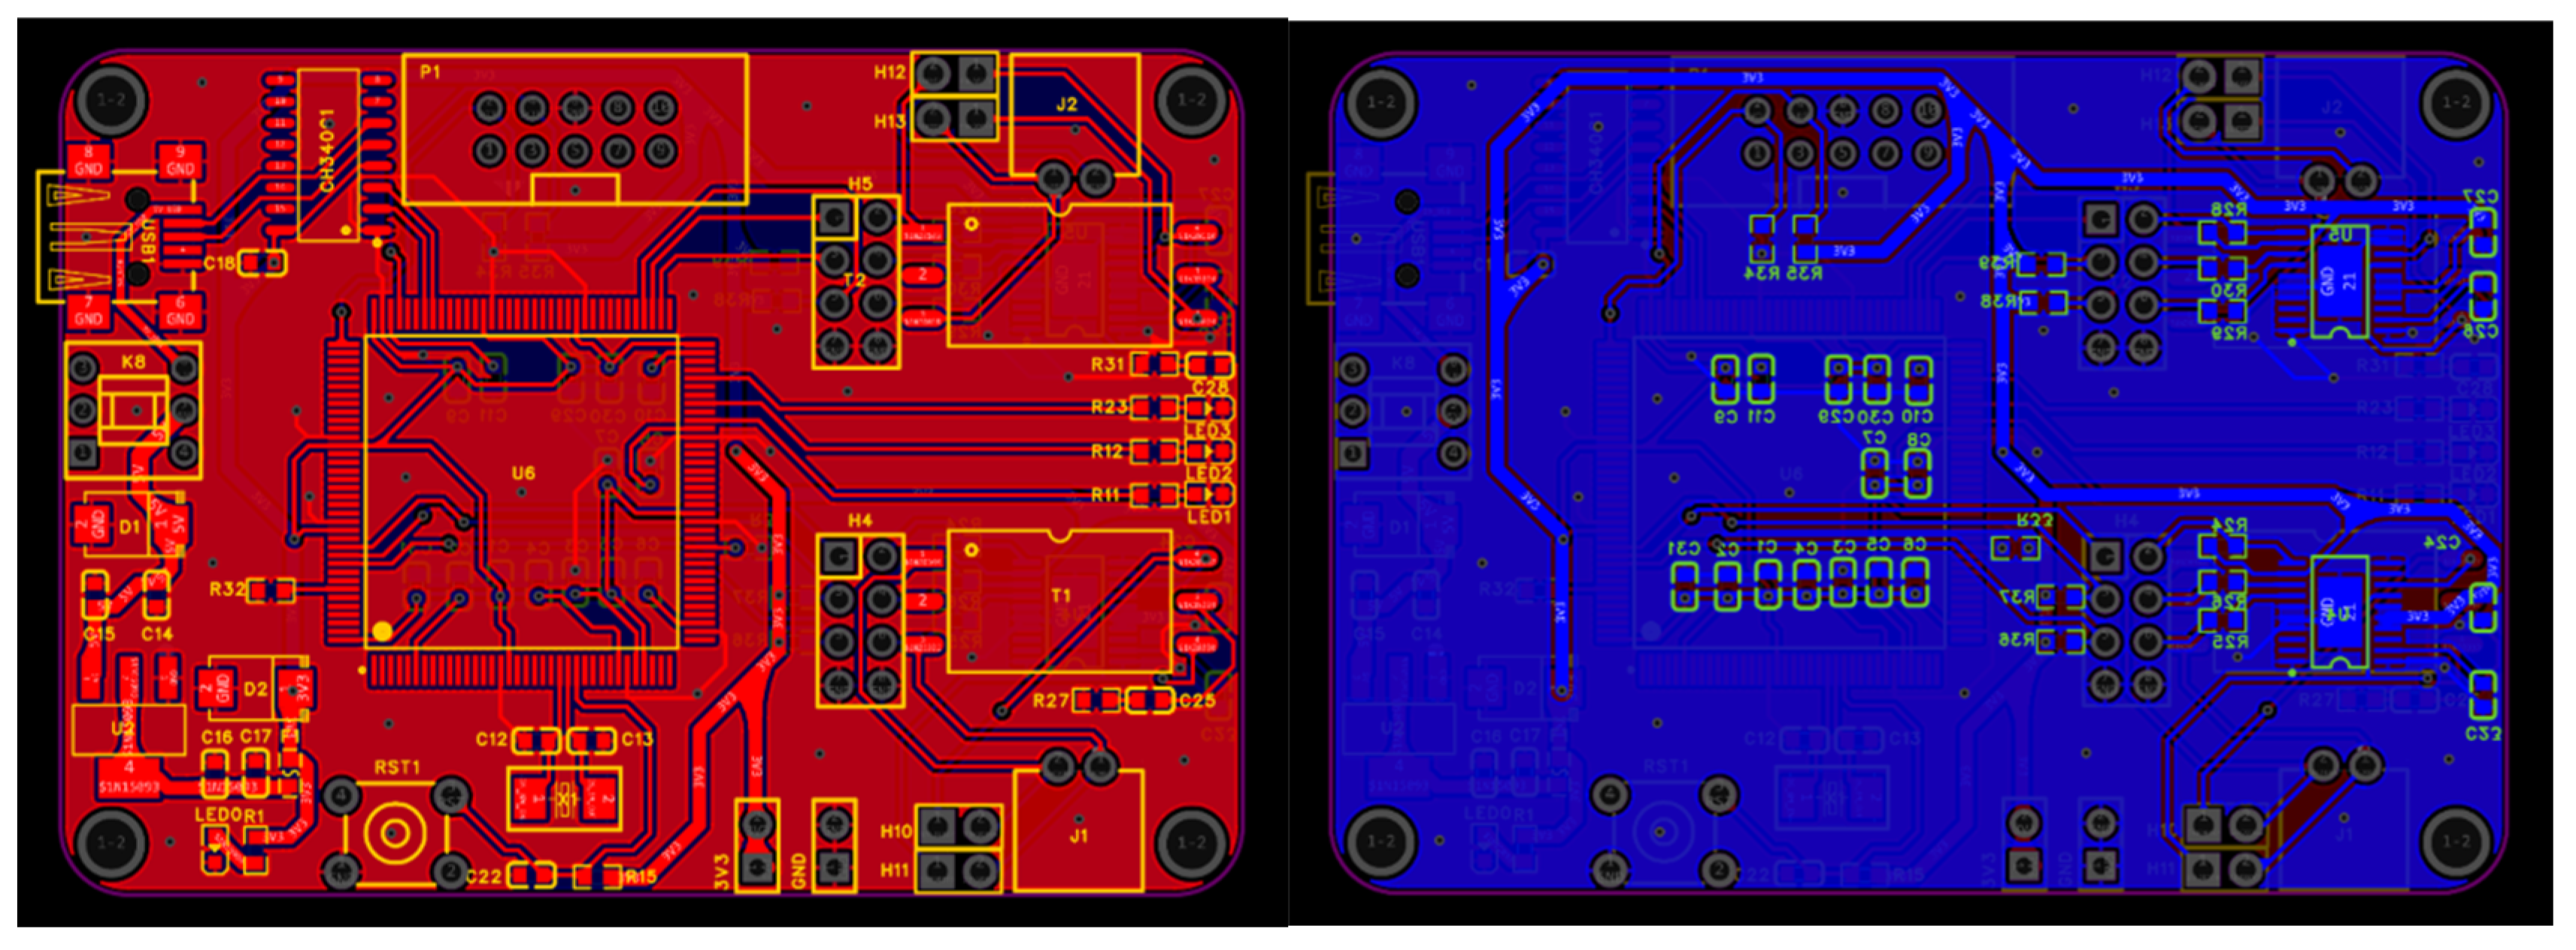
The multi-channel slave board is implemented on a four-layer printed circuit board (PCB). The excitation current loop—comprising the VSW switching MOSFET, the 20 Ω precision resistor, and the Kelvin connector—is routed on the top layer using wide, short traces to minimize parasitic self-inductance. The voltage sensing differential pairs are routed on the bottom layer, shielded from the excitation loops by internal ground and power planes. Each DNB1101 chip is locally decoupled with ceramic capacitors placed immediately adjacent to the supply pins. The complete PCB layout, four-layer stack-up configuration, and trace routing are shown in Figure A3. The two-layer PCB routing topology is provided in Figure A4.
Interconnection between the device and the battery terminals uses custom low-loss twisted-pair Kelvin cables terminated with gold-plated copper alligator clamps. The twisted-pair configuration, combined with grounded braided shielding sleeves, rejects external 50 Hz power-line interference and radiated electromagnetic noise from the environment. The contact resistance of the Kelvin clamps is below 0.5 mΩ.
The assembled device is shown in Figure 4. The system comprises a master control unit, a single-cell slave unit for high-precision validation, and a four-channel slave board with integrated 18,650 cell holders for multi-cell testing.

2.3. Software and Data Processing

2.3.1. Embedded Firmware

The master MCU firmware, implemented in C using the Keil μVision5 development environment, runs under the FreeRTOS real-time operating system (v10.4.3). Five concurrent tasks with statically assigned priorities manage the measurement workflow (Table 1). FreeRTOS performs task allocation in the master controller firmware.
The preemptive priority-based scheduler ensures that the measurement task (TaskLinxZMCh0) is not preempted by communication tasks (TaskUSART), guaranteeing deterministic timing for impedance data acquisition.
The frequency sweep employs a triple-nested loop structure: an outer scan-cycle loop (for repeated full-spectrum acquisitions), a middle frequency-step loop (iterating through logarithmically spaced frequency points), and an inner sampling-averaging loop (four repeated measurements per frequency point). An adaptive settling delay is applied at each frequency transition to allow the electrochemical interface to reach quasi-steady state before data acquisition begins.

2.3.2. On-Chip DFT Impedance Computation

For each frequency point, the DNB1101 performs on-chip DFT-based impedance computation. The digitized voltage sample streams of the battery response ( V B ) and the sense resistor ( V R ) are multiplied by internal orthogonal reference sine and cosine waveforms at the programmed excitation frequency to extract their respective in-phase ( I ) and quadrature ( Q ) components:
V B = V B , r e + j V B , i m , V R = V R , r e + j V R , i m
where V B represents the complex phasor of the battery terminal voltage response, and   V R represents the complex voltage phasor across the external precision sense resistor ( R sense = 20 Ω ) connected in series within the current excitation path.
Because the excitation current I exc   flows through both the cell and the sense resistor, it satisfies I exc   = V R / R sense . Consequently, the cell complex impedance Z cell ( j ω ) is determined by scaling the dimensionless voltage phasor ratio ( V B / V R ) by the calibrated value of the sense resistor R sense :
Z cell = V B I exc   = V B V R × R sense = ( V B , r e + j V B , i m ) ( V R , r e + j V R , i m ) · R sense
Role and Calibration of R sense : The precision resistor R sense serves as a transimpedance reference that converts the injected perturbation current into a proportional AC voltage signal suitable for simultaneous sampling by the internal A D C . To eliminate measurement errors caused by initial component tolerance (±0.5%), temperature coefficient drifts, and PCB trace parasitic resistance, the effective value of   R sense is calibrated prior to deployment. The calibration procedure is performed using a high-precision digital multimeter under 4-wire Kelvin resistance sensing mode at controlled room temperature (25 ± 0.1 ° C ). The precisely measured value of R sense is stored in the master controller’s non-volatile memory to scale all subsequent complex impedance calculations. This localized DFT processing—performed in hardware on each DNB1101—eliminates the need for computationally intensive Fast Fourier Transform (FFT) operations on the master MCU and reduces the data throughput requirement on the daisy-chain bus from raw ADC sample streams to complex impedance values at the pre-defined frequency points.

2.3.3. Host Application and Post-Processing

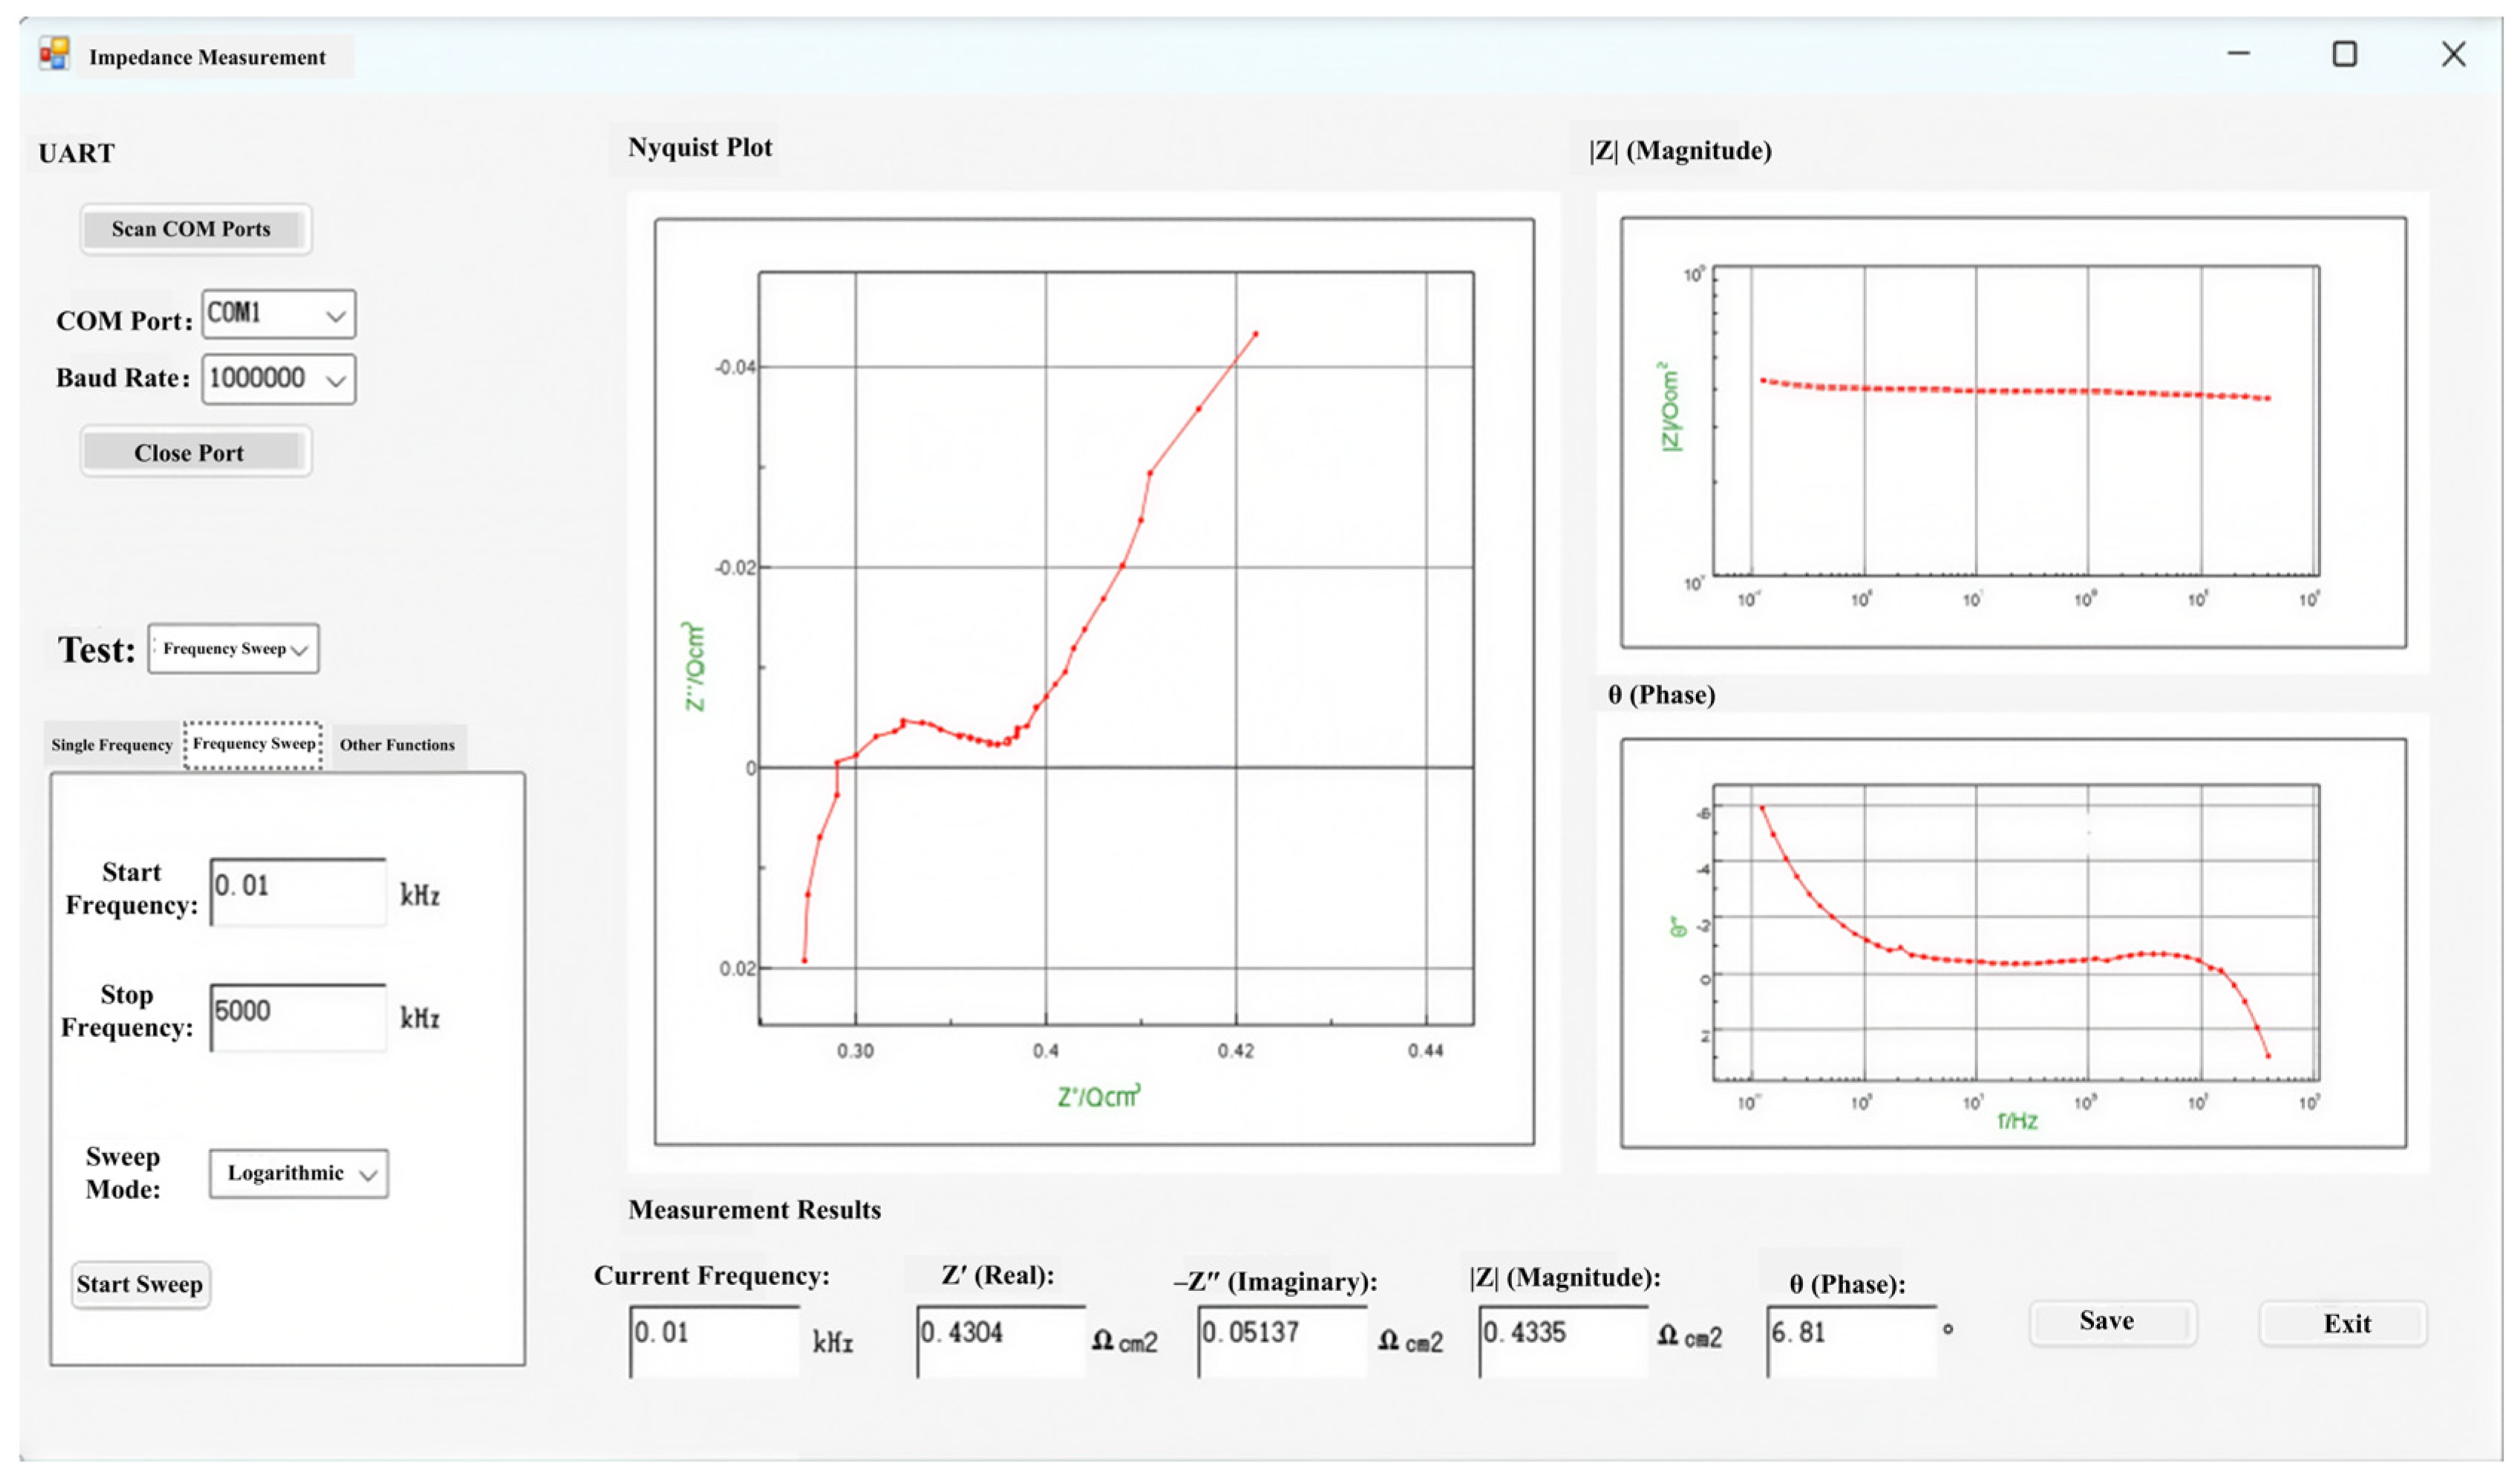
The PC-based host application was developed in C# using the .NET Framework 4.7.2 WinForms platform. It provides a graphical user interface for measurement parameter configuration (frequency range, sweep points, excitation amplitude, averaging options, channel selection), real-time Nyquist and Bode plot rendering, and data export in CSV format. A thread-safe first-in-first-out (FIFO) queue isolates the graphical user interface thread from the serial communication thread, preventing interface freezing during high-throughput data transfers. A screenshot of the graphical user interface during active multi-channel acquisition is shown in Figure A5.
Raw impedance data from the device are processed through a MATLAB-based (R2021a) post-processing pipeline comprising four sequential stages:
  • Magnitude boundary check: Frequency points with |Z| outside the physically plausible range of 0.1 mΩ to 2 Ω (based on lithium-ion cell characteristics) are flagged as transmission dropouts and removed.
  • Adjacent-point jump detection: The vector distance between consecutive frequency points is computed. If this distance exceeds 0.05 Ω—indicating a physically implausible discontinuity in the impedance spectrum—the later point is flagged as a transient acquisition fault.
  • Robust MAD filtering: The median absolute deviation (MAD) of the impedance magnitude across a 7-point sliding window is computed. Data points exceeding 3.5 × MAD from the local median are identified as statistical outliers and removed.
  • Savitzky–Golay smoothing: A third-order Savitzky–Golay filter with an 11-point moving window is applied to suppress residual high-frequency instrumentation noise while preserving the geometric features of the mid-frequency charge-transfer semicircle and the low-frequency Warburg diffusion line.
The cleaned impedance spectra are formatted for direct import into ZSimpWin (v3.60, AMETEK Scientific Instruments, Oak Ridge, TN, USA) for equivalent circuit model fitting. The same post-processing pipeline is applied to CS350 reference data to ensure fair comparison.

2.4. Experimental Setup and Protocol

2.4.1. Test Platform

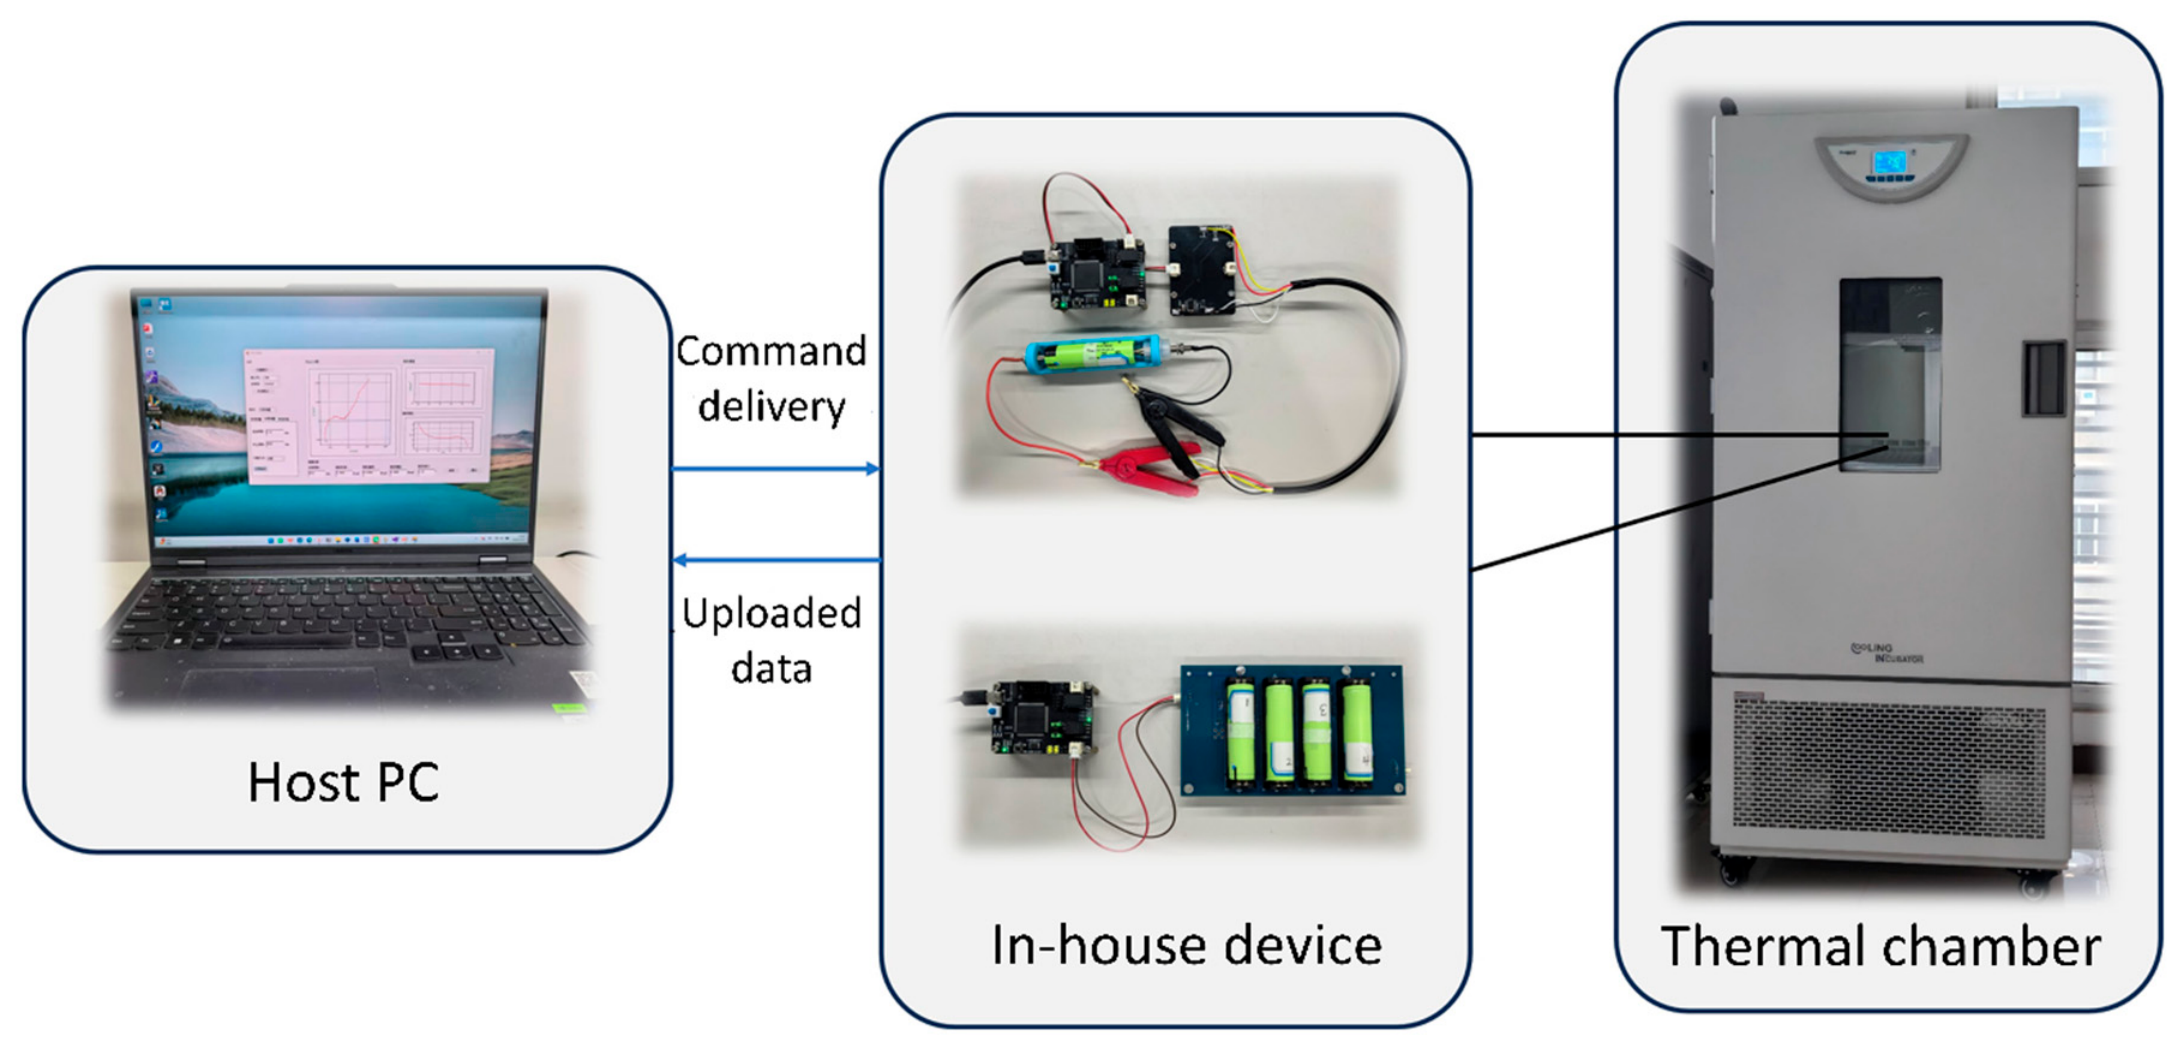
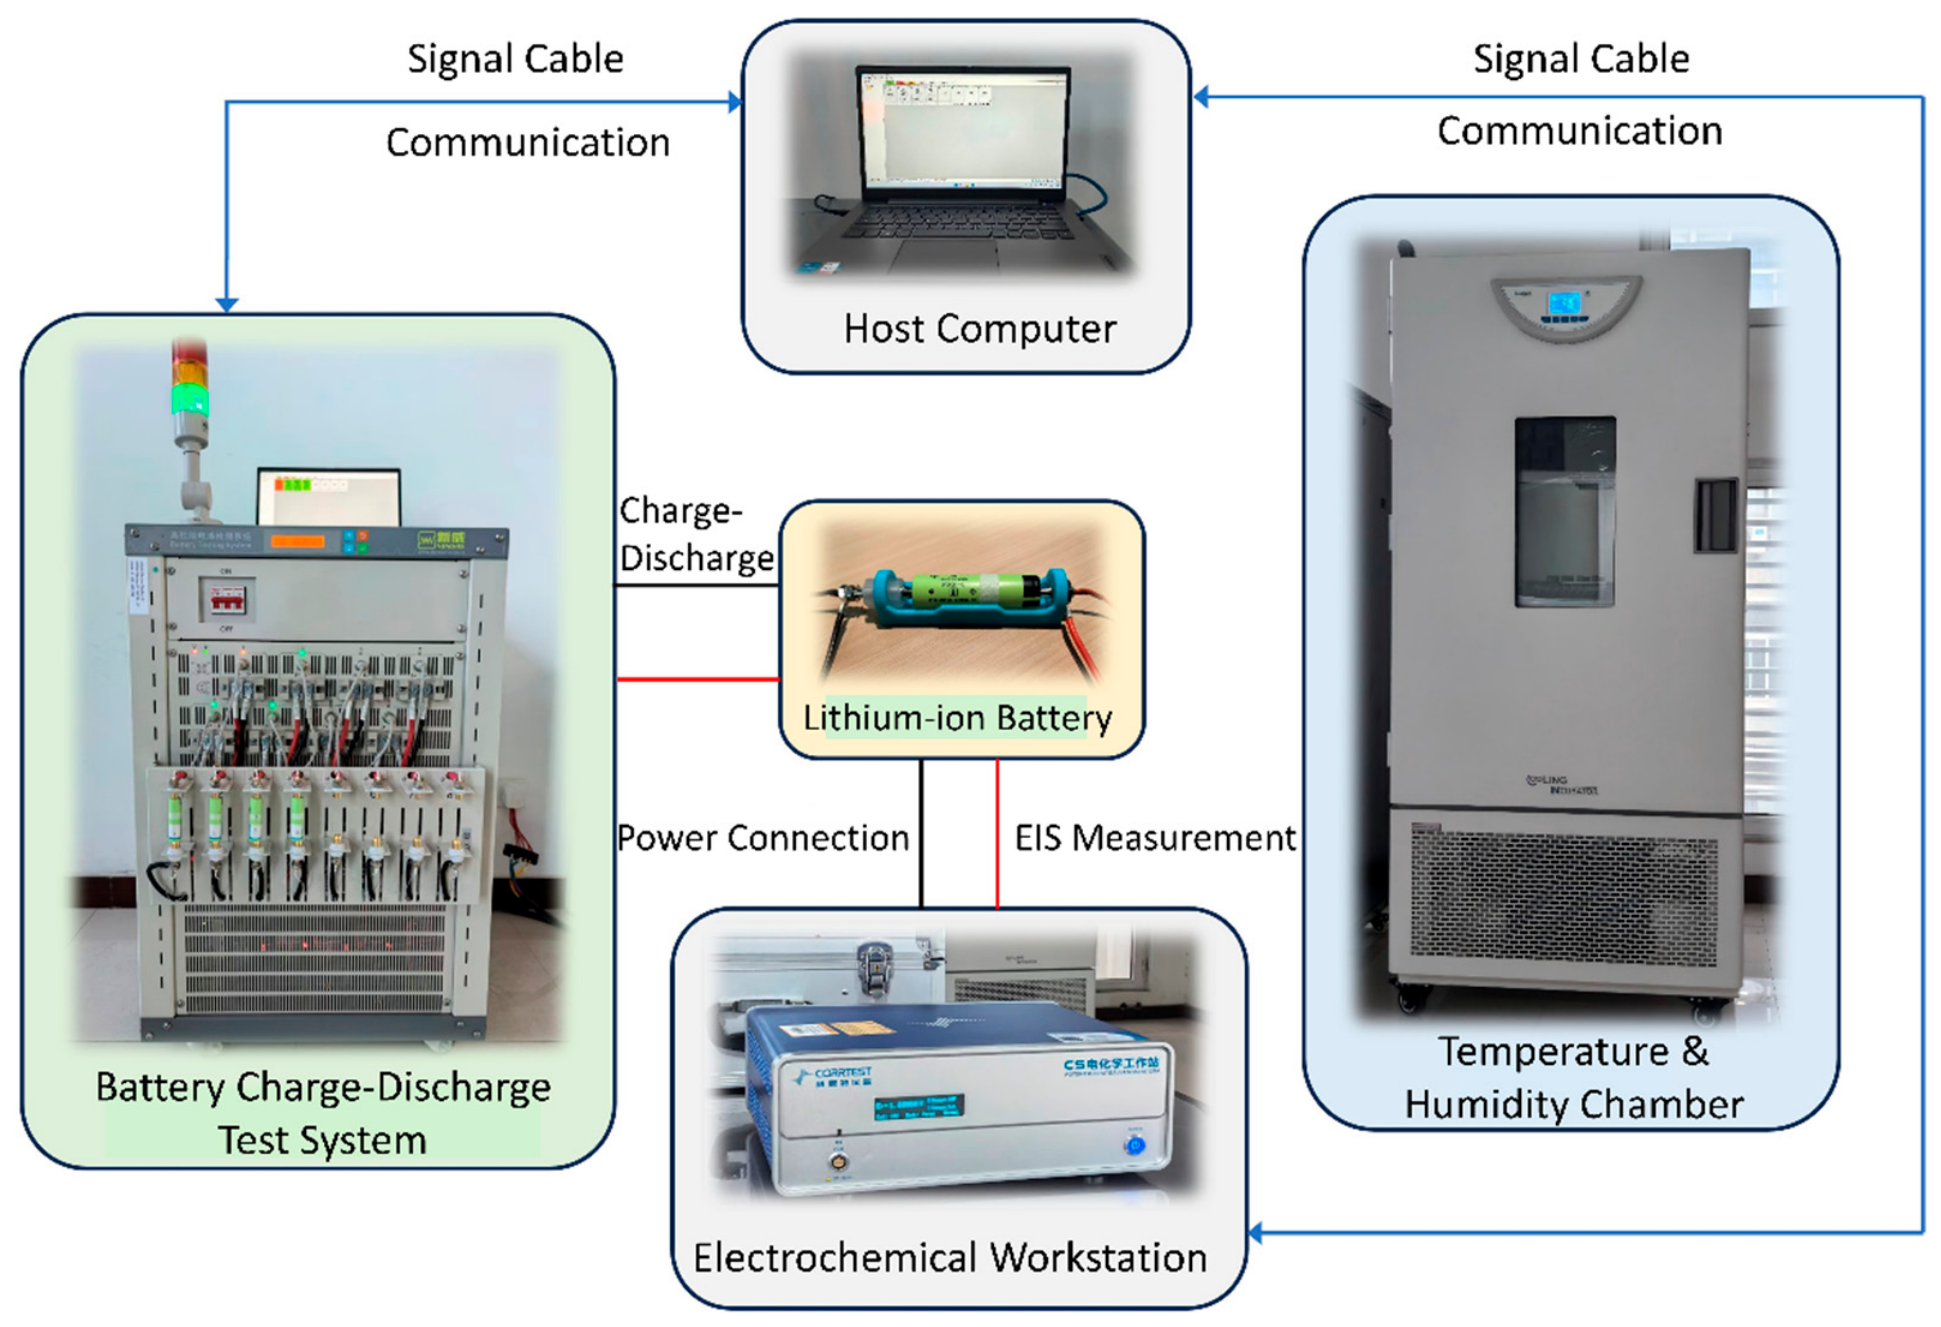
The experimental validation platform (Figure 5) comprised five subsystems: (i) the self-developed multi-channel EIS measurement device (one master unit, one single-cell slave unit, and one four-channel slave board); (ii) a CorrTest CS350 electrochemical workstation (frequency range: 10 µHz–1 MHz, AC amplitude: 1–2500 mV, specified distortion < 1%) operated in galvanostatic EIS mode as the reference instrument; (iii) a Neware BTS4000 battery charge/discharge test system (8 independent channels, 5 V/12 A per channel, current measurement accuracy ±0.02% of full scale) for SOC conditioning and capacity measurement; (iv) a high-precision thermal chamber maintaining 25.0 ± 0.1 °C; and (v) a host personal computer running the C# application and MATLAB.

2.4.2. Test Cells

Two types of commercial 18650-format lithium-ion cells were used as test specimens. Panasonic NCR18650 ternary cells (NCA cathode/graphite anode, rated capacity 3300 mAh, nominal voltage 3.6 V, charge cutoff 4.2 V, discharge cutoff 2.75 V, AC internal resistance at 1 kHz ≤ 35 mΩ per datasheet [28]) served as the primary test objects. LiFePO4 (LFP) 18,650 cells (rated capacity 1800 mAh, nominal voltage 3.2 V, charge cutoff 3.65 V, discharge cutoff 2.0 V, AC internal resistance at 1 kHz ≤ 20 mΩ per datasheet [29]) were used for cross-chemistry validation.

2.4.3. Measurement Protocol

Prior to EIS testing, the maximum available capacity Qmax of each cell was determined through three complete charge–discharge cycles at 0.2 C rate (constant-current constant-voltage (CC-CV) charge to cutoff voltage with 0.02 C termination current; 1 h rest; CC discharge to cutoff voltage at 0.2 C; 1 h rest). The mean of the three discharge capacity measurements was taken as Qmax for that cell. The capacity values for the four NCR cells ranged from 3220 to 3246 mAh, with a standard deviation below 1% across repeated cycles.
For EIS measurements, cells were first fully charged (CC-CV protocol), then discharged at 0.2 C to SOC = 40% based on the individually determined Qmax. Cells were then rested at open circuit in the thermal chamber (25.0 ± 0.1 °C) for 1 h to allow voltage relaxation and internal concentration gradient equilibration before EIS data acquisition.
All EIS measurements were performed in galvanostatic mode with an AC excitation current amplitude of 200 mA peak-to-peak. Across the tested cell specimens ( Z 0.040   Ω ), this excitation amplitude yielded a terminal voltage perturbation of 8.0–9.0 mV peak-to-peak ( V p - p ≤ 10 mV), maintaining strict compliance with the small-signal linearity condition. The frequency sweep covered 0.01 Hz to 5620 Hz with logarithmic spacing at 8 points per decade (45 frequency points per spectrum). At each frequency point, four consecutive measurements were acquired and averaged. The identical protocol—galvanostatic mode, identical frequency vector, identical thermal conditioning, and identical SOC preparation—was applied to both the CS350 workstation and the developed device to ensure that any observed differences reflect instrument characteristics rather than protocol variations.

2.4.4. Validation Test Configurations

Five complementary validation configurations were employed:
Single-cell accuracy (Configuration 1). A single NCR18650 cell (Cell 1) was measured using both the developed device and the CS350 workstation under the standard protocol. The resulting Nyquist and Bode spectra were compared quantitatively.
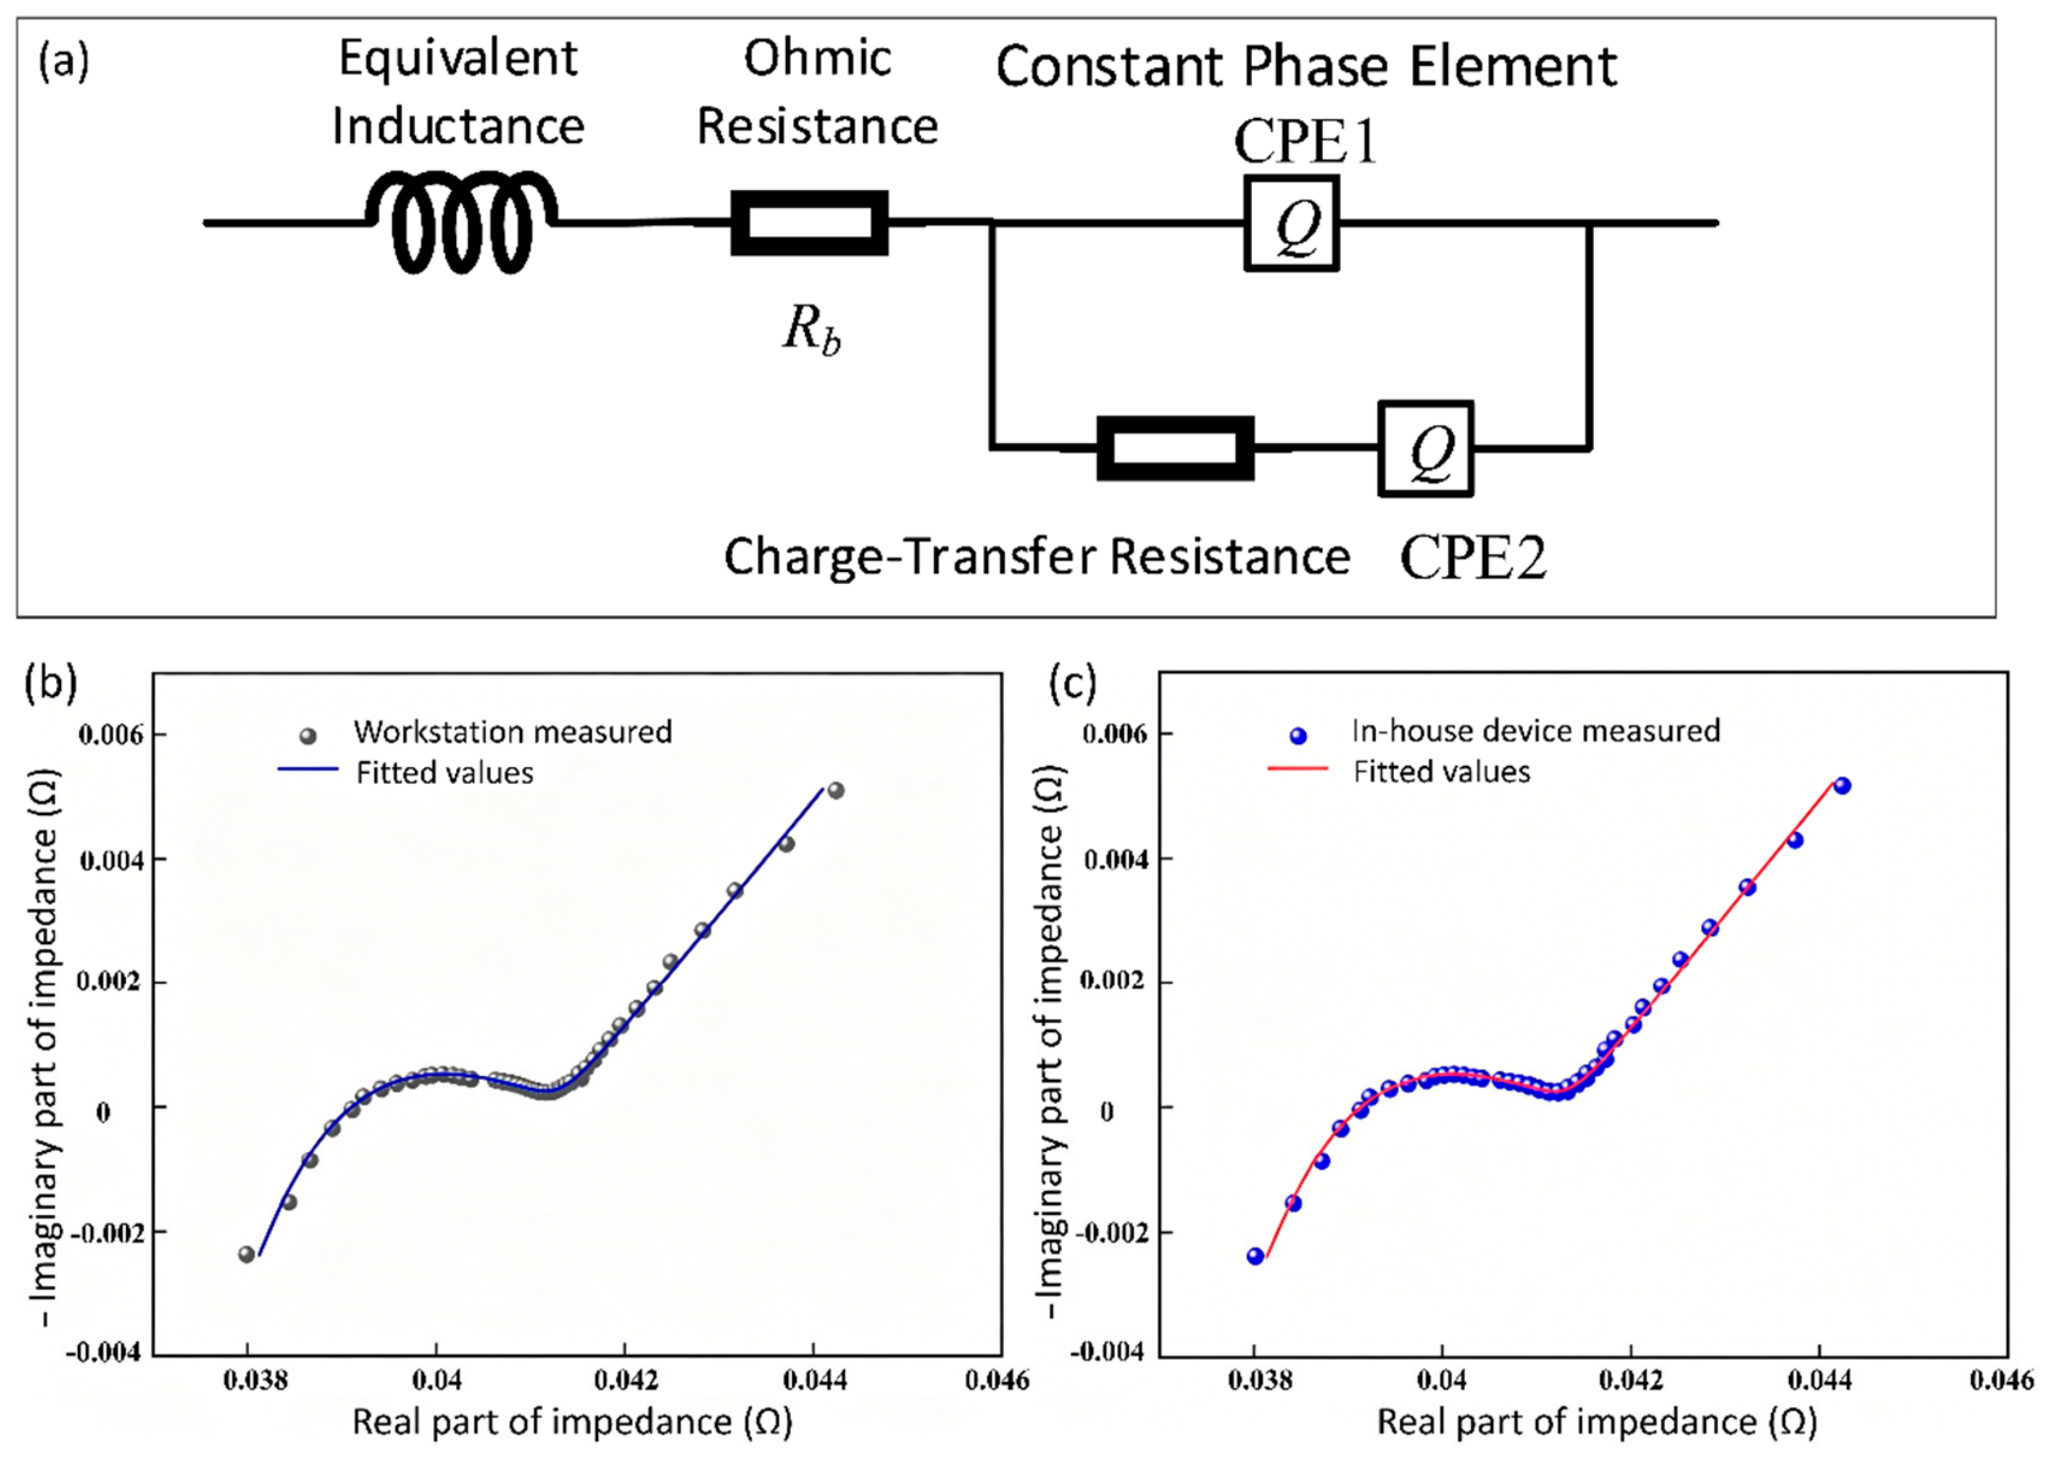
Equivalent circuit fitting (Configuration 2). The impedance spectra obtained from Configuration 1 were imported into ZSimpWin and fitted to a seven-parameter equivalent circuit model L + R b + C P E 1 ( R c t + C P E 2 ) . The physical elements of this model topology account for the primary high-frequency and interfacial electrochemical phenomena in the cell:
L represents the parasitic equivalent inductance originating from the cell terminal tabs and measurement leads; R b denotes the bulk ohmic resistance, encompassing the combined contributions of the electrolyte, separator, active materials, and current collector contact interfaces (corresponding to the high-frequency real-axis intercept); the parallel network consisting of constant phase elements ( C P E 1 and C P E 2 ) and charge-transfer resistance ( R c t ) captures the non-ideal interfacial double-layer capacitive behavior, charge-transfer kinetics, and interfacial reaction polarization. C P E 1 and C P E 2 are each defined by an admittance parameter ( y 1 , y 2 ) and a phase exponent ( n 1 , n 2 ). The fitting algorithm employed the simplex method followed by Levenberg–Marquardt refinement with modulus weighting (|Z|−1). Convergence was accepted when χ2 < 10−4.
Multi-channel synchronization (Configuration 3). Four NCR18650 cells (Cells 1–4) were prepared to SOC = 40% and connected to the four-channel slave board. All channels were triggered simultaneously via the hardware broadcast mechanism. After multi-channel acquisition, Cell 2 was transferred to the CS350 workstation for independent single-channel reference measurement.
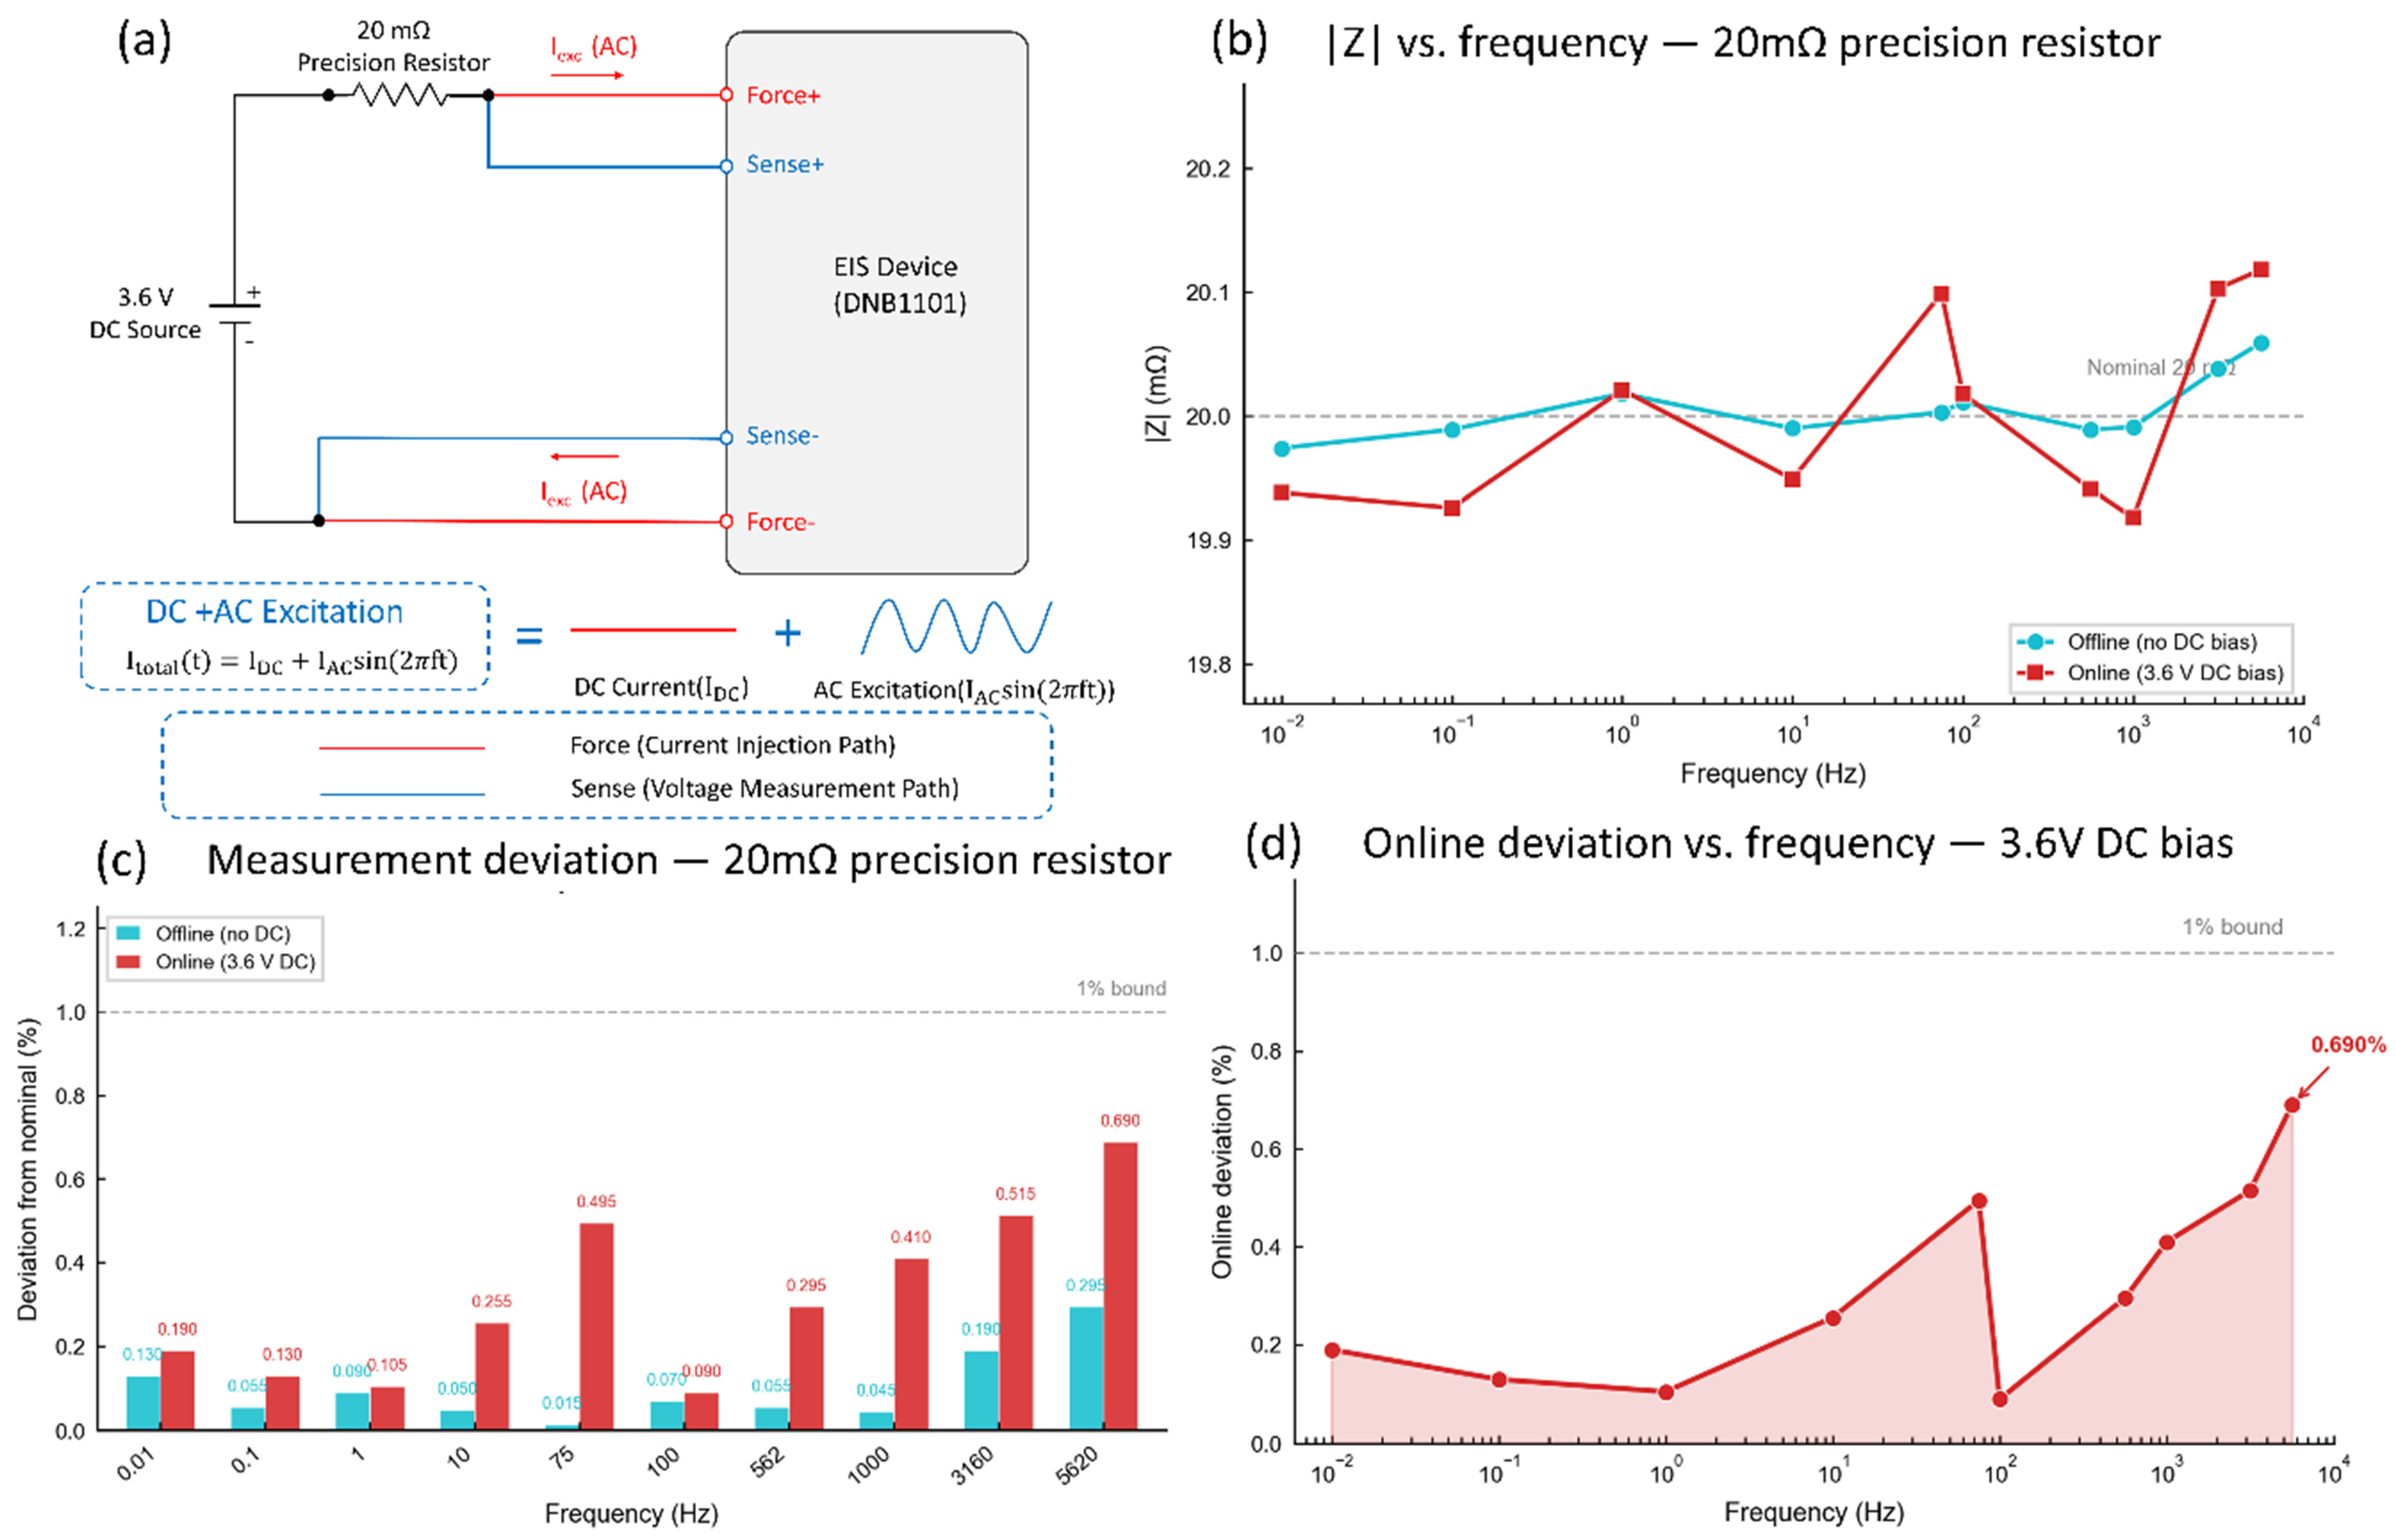
Online DC-bias validation (Configuration 4). A Vishay 4-terminal precision current-sense resistor (20 mΩ nominal, ±0.5% tolerance, temperature coefficient < 15 ppm/K) was used as a stable, frequency-independent impedance standard to isolate the device’s DC bias handling performance from battery electrochemical variables. Two measurement conditions were compared: offline—resistor connected directly to the device, no external DC voltage applied; and online—a Keithley 2400 SourceMeter operated as a constant-voltage source applied a regulated 3.6 V DC bias in series with the resistor, simulating the DC potential of an NCR18650 cell at approximately SOC = 40%. A 60 min warm-up period was observed for the DC source to reach thermal equilibrium before data acquisition.
Cross-chemistry validation (Configuration 5). A LiFePO4 18,650 cell was prepared to SOC = 40% using the same capacity-determination and conditioning protocol, and measured using both the developed device and the CS350 workstation under the standard EIS protocol. The resulting spectra were compared quantitatively.

3. Results

3.1. Single-Cell Measurement Accuracy

To establish the baseline measurement accuracy of the device, single-cell EIS measurements were performed on an NCR18650 ternary cell (Cell 1) at SOC = 40% and 25 °C, and the results were compared with those obtained from the CS350 electrochemical workstation under identical conditions.
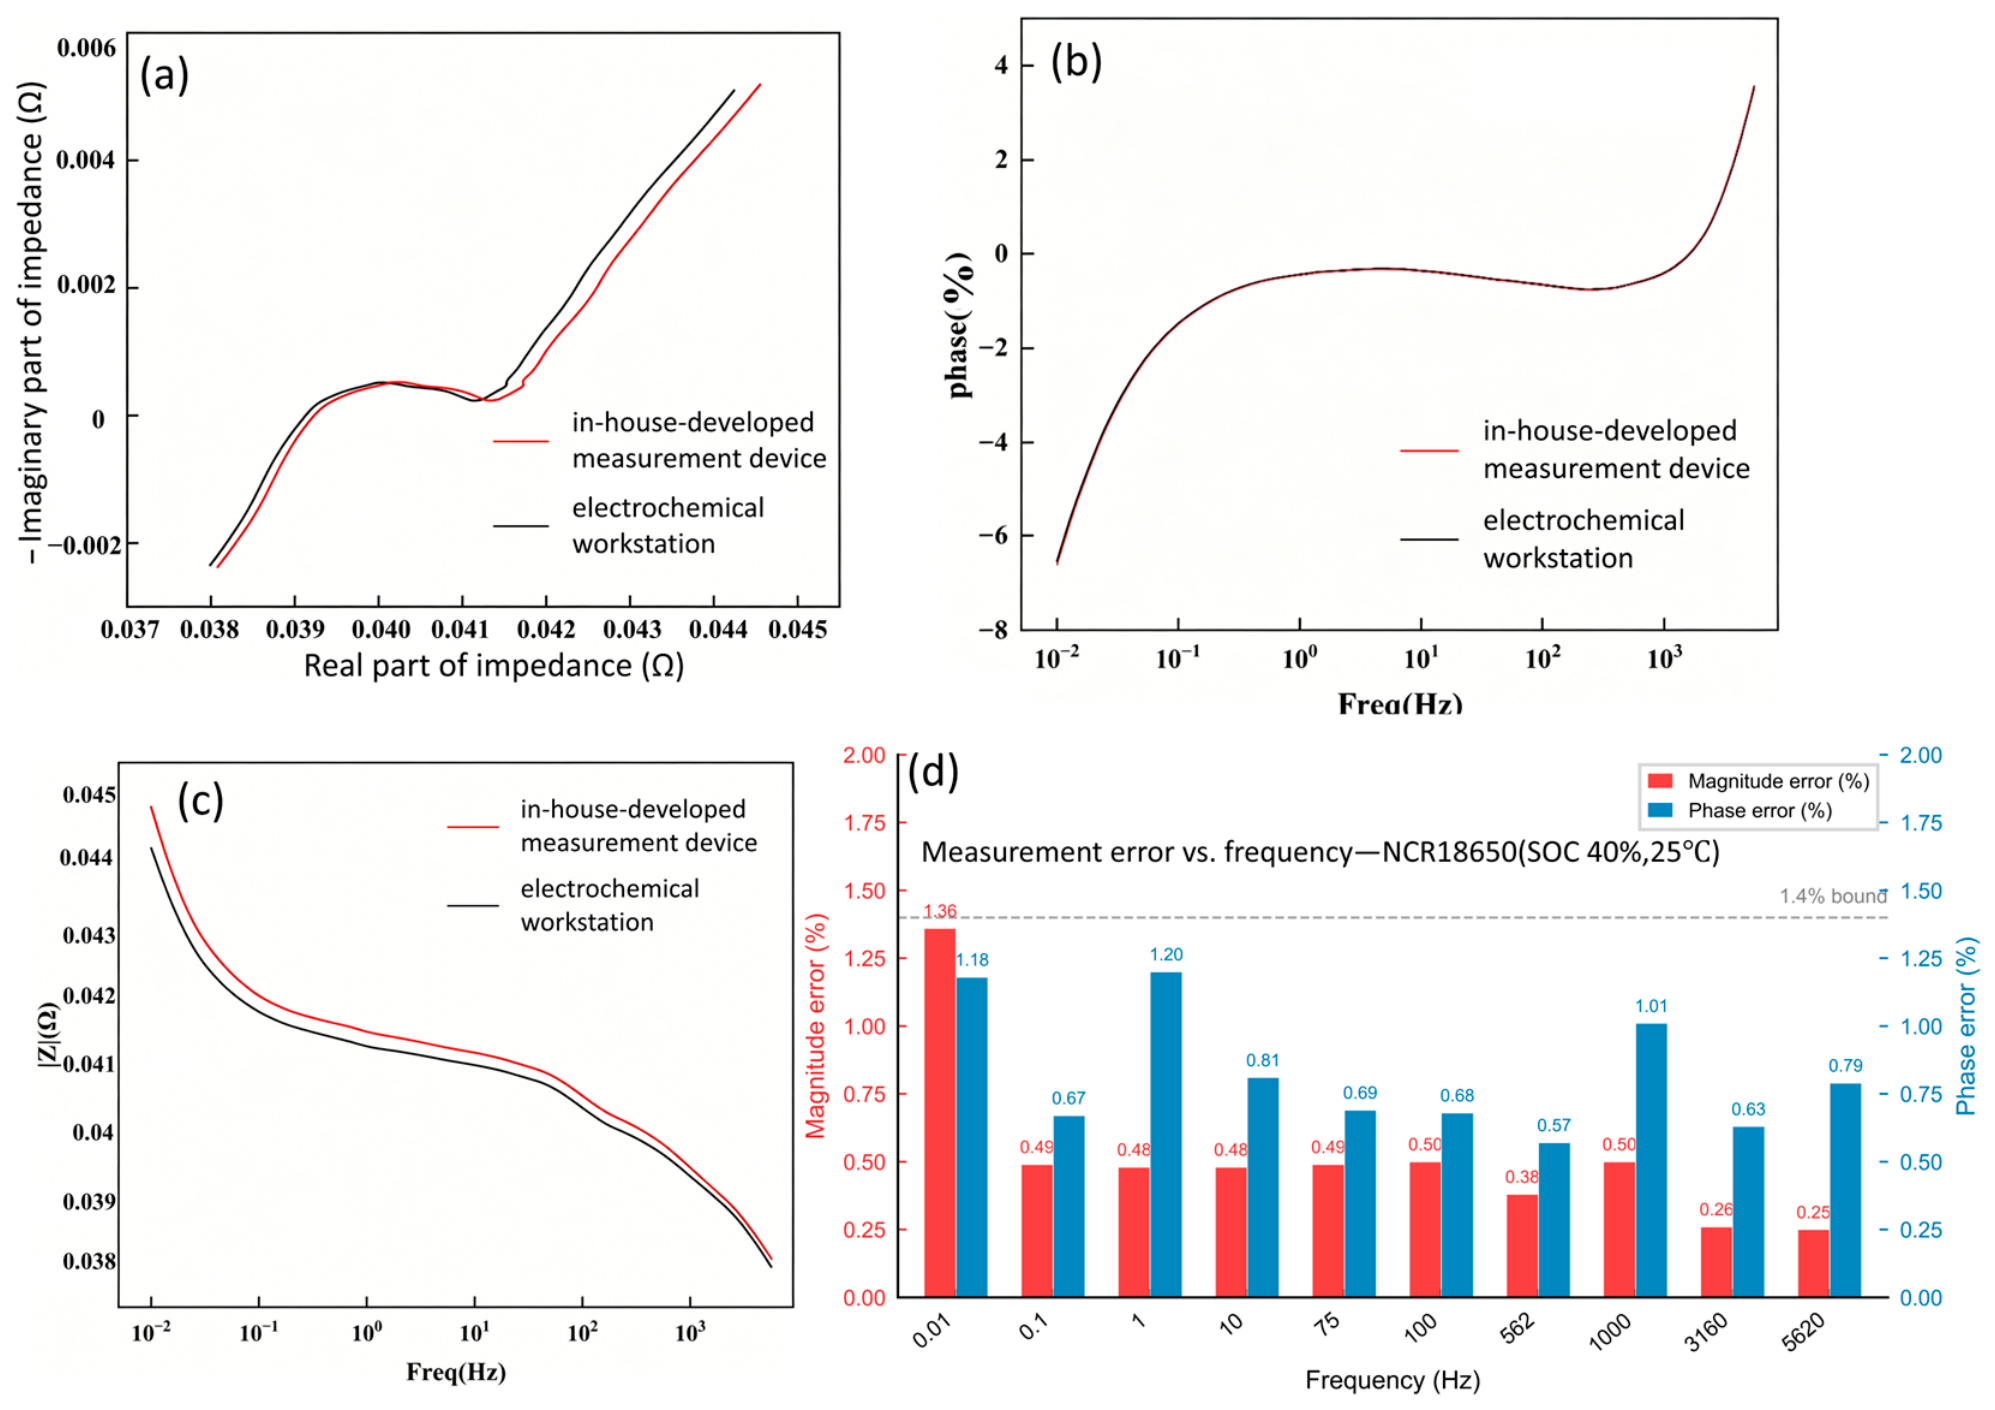
Figure 6a presents the Nyquist impedance spectra from both instruments. The two curves exhibit excellent agreement across the entire frequency range. The high-frequency intercept with the real axis—corresponding to the ohmic resistance Rb—is nearly identical (difference < 0.02 mΩ, within the measurement uncertainty). The mid-frequency region displays the characteristic depressed semicircle associated with the charge-transfer process, with closely matching arc diameter (proportional to Rct) and depression angle. The low-frequency region shows the Warburg diffusion tail with a slope of approximately 45° relative to the real axis, confirming that the device accurately captures the solid-state lithium diffusion process within the electrode particles.
Figure 6b,c present the Bode magnitude and phase representations. The quantitative comparison at ten representative frequency points is provided in Table 2. The maximum impedance magnitude error is 1.36%, occurring at 0.01 Hz—the lowest tested frequency, where the signal-to-noise ratio is intrinsically lowest due to the longer measurement dwell time and the greater influence of open-circuit voltage drift. The maximum absolute phase error is 1.20%at 1 Hz. In the mid-to-high frequency range (1 Hz–5.62 kHz), the magnitude error drops below 0.55%. The frequency-dependent error distribution (Figure 6d) follows a systematic trend: larger errors at the lowest frequencies, decreasing to a minimum in the 100 Hz–5 kHz range, and a slight increase at the highest frequency. This pattern is consistent with the combined effects of low-frequency voltage drift (dominant below 0.1Hz) and high-frequency parasitic reactive coupling in the test leads and Kelvin connectors (emerging above 3 kHz). Both effects are inherent to EIS measurement of low-impedance electrochemical cells and do not indicate a device-specific deficiency.
These results demonstrate that the developed device achieves workstation-comparable measurement accuracy across the full diagnostic frequency range, with all errors within a 1.4% envelope.

3.2. Equivalent Circuit Model Parameter Fitting

While impedance magnitude and phase comparisons provide a direct quantification of measurement fidelity, the practical diagnostic value of EIS lies in the extraction of physically meaningful electrochemical parameters through equivalent circuit model (ECM) fitting. To verify that spectra measured by the developed device yield the same ECM parameters as those measured by the reference workstation, both datasets were fitted using ZSimpWin with the seven-parameter L + R b + C P E 1 ( R c t + C P E 2 ) model.
As shown in Figure 7a, this model explicitly accounts for parasitic lead inductance ( L ), bulk ohmic resistance ( R b ), charge-transfer resistance ( R c t ), and non-ideal interfacial capacitive behavior represented by constant phase elements ( C P E 1 and C P E 2 ). Figure 7b,c present the fitted Nyquist curves overlaid on the experimental data points for the CS350 workstation and the developed device, respectively. The fitted curves closely track the experimental data, with goodness-of-fit values (χ2) below 10−4 for both datasets, confirming that the seven-parameter topology captures the complete physicochemical response without over-parameterization.
Table 3 lists the fitted parameter values, fitting uncertainties, and relative parameter differences between the datasets acquired by the two instruments. The relative parameter differences between the fitted values from both instruments are small across all components, ranging from 0.051% for R b to 1.893% for y1.
Specifically, the ohmic resistance R b shows a relative difference in only 0.051%, confirming that the Kelvin four-wire configuration effectively eliminates lead and contact resistance contributions to the measured impedance. The charge-transfer resistance   R c t differs by only 0.720%, demonstrating that the micro-perturbation current driver provides stable excitation without measurably disturbing the cell’s electrochemical equilibrium.
However, these small percentage-level differences should be interpreted within the context of the fitting uncertainties reported by ZSimpWin. In particular, y1 exhibits a fitting uncertainty of approximately 21%, indicating a degree of parameter interdependence inherent to multi-parameter equivalent circuit optimizations. Notably, n 2 is confirmed to be approximately 0.81, reflecting non-ideal capacitive dispersion in the lower-frequency response rather than an anomalous exponent. Within this specific L + R b + C P E 1 ( R c t + C P E 2 ) topology, R c t operates in series with C P E 2 inside the parallel branch, parameterizing the mid-to-low frequency transition region.
From a BMS application perspective, the sub-1% parameter matching across all seven components—especially R b and R c t —is particularly significant: R b serves as a key indicator of electrolyte degradation and structural contact aging, while R c t is sensitive to interfacial reaction kinetics and lithium plating onset. The demonstrated parameter fidelity confirms that the developed device can reliably supply high-quality ECM features for onboard SOC/SOH estimation and health diagnostics.

3.3. Multi-Channel Synchronous Measurement

To validate the multi-channel synchronous acquisition capability enabled by the daisy-chain architecture and hardware broadcast trigger mechanism, four NCR18650 cells were measured simultaneously at SOC = 40% and 25 °C.
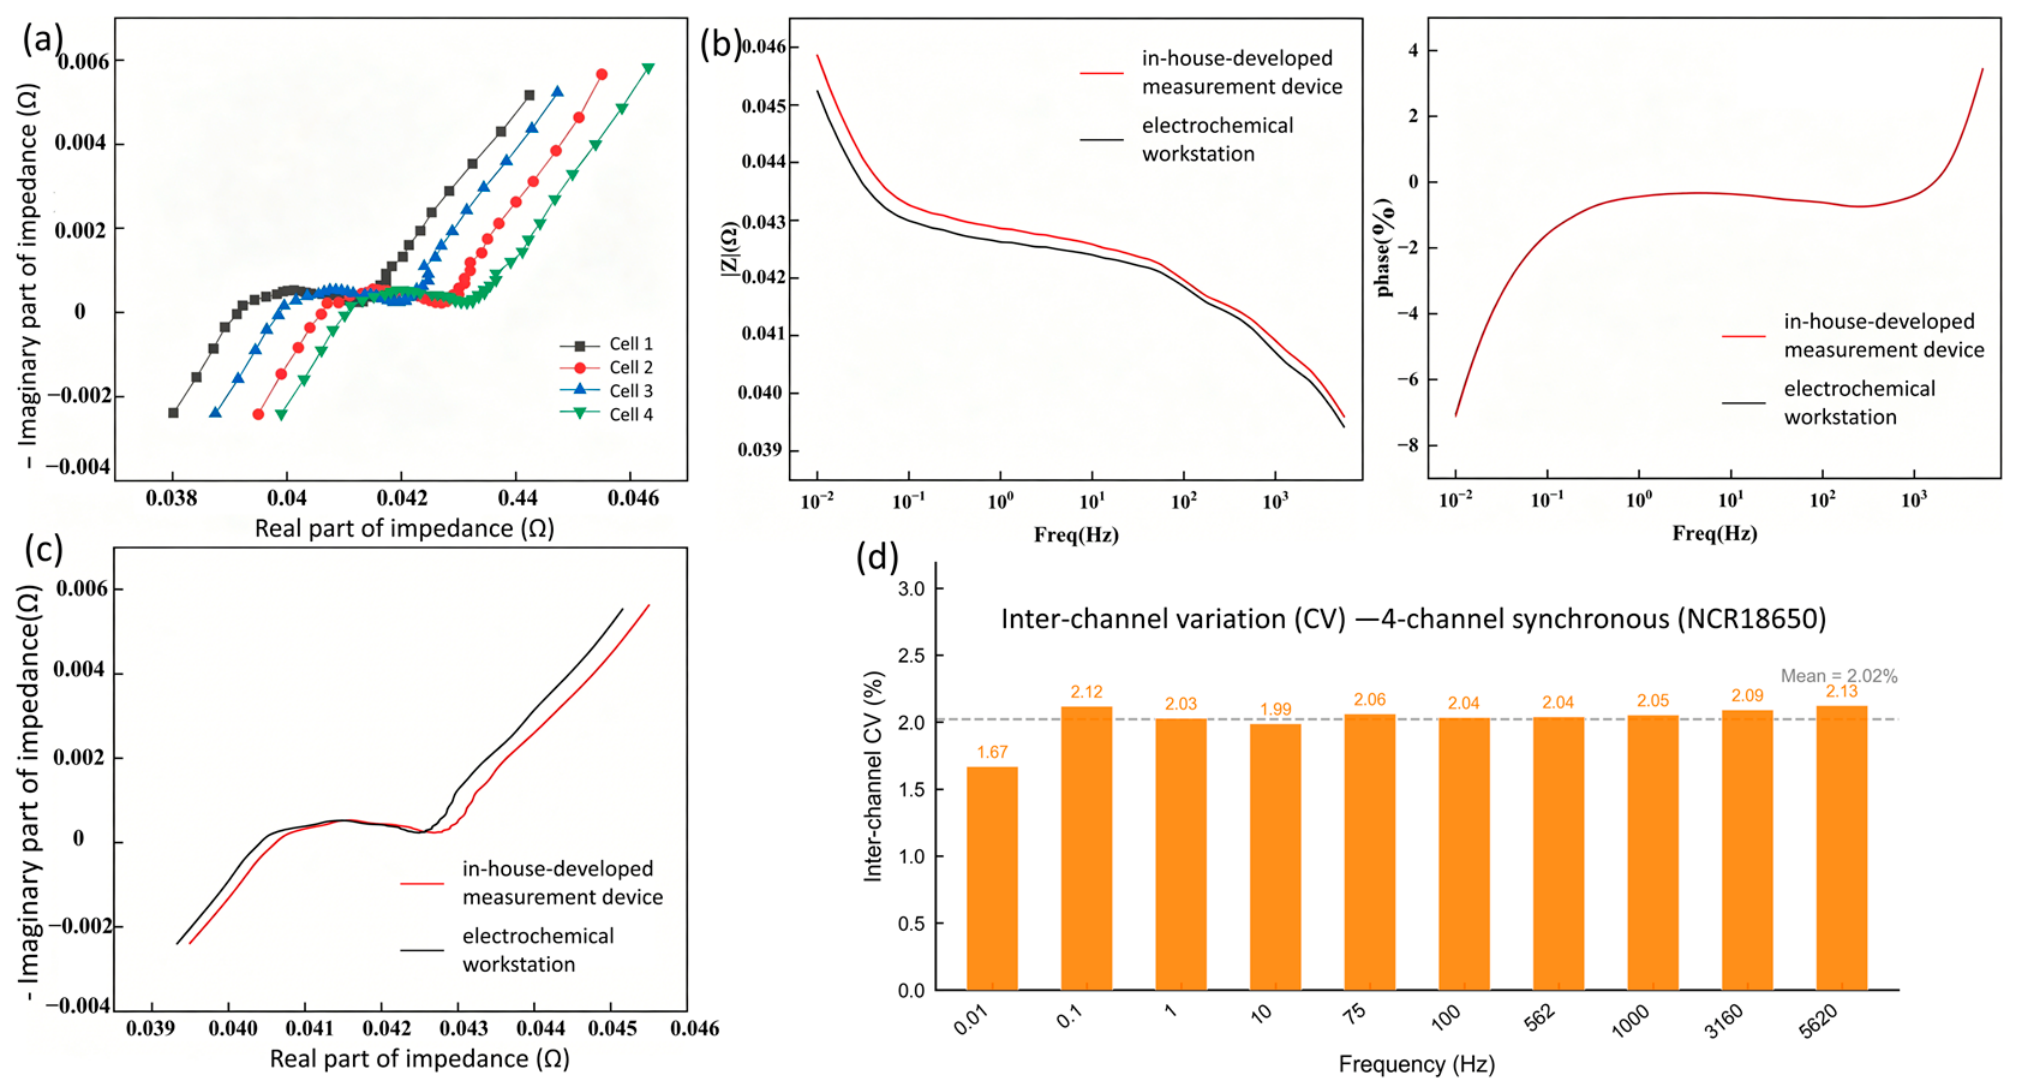
Figure 8a presents the Nyquist impedance spectra from all four channels. The four curves form a tightly clustered group. The high-frequency ohmic intercepts are nearly superimposed, and the charge-transfer semicircles exhibit congruent diameters and depression angles. The inter-channel coefficient of variation (CV = σ/μ) of the impedance magnitude is plotted as a function of frequency in Figure 8d. The CV remains below 2.13% across the full frequency range, with a mean value of 2.02%, demonstrating that the daisy-chain architecture introduces negligible channel-dependent systematic errors. This level of uniformity is comparable to or better than that achievable by sequentially measuring multiple cells with a single instrument, and is a direct consequence of maintaining an independent, physically local analog front-end (excitation source, sense amplifier, ADC, and DFT processor) for each channel.
To independently verify that multi-channel operation does not degrade individual channel accuracy, Cell 2 was subsequently measured using the CS350 workstation as a single-channel reference (Figure 8c). The comparison yields a maximum magnitude error of 1.35% and a maximum phase error of 1.22% (Table 4), numerically consistent with the single-channel results reported in Section 3.1. This confirms that the daisy-chain communication protocol and the FreeRTOS priority-based scheduler effectively coordinate parallel slave operation without introducing timing conflicts, data collisions, or electromagnetic cross-interference between adjacent channels.

3.4. Online Measurement Under DC Bias Conditions

The most stringent validation of a practical online EIS device is its ability to maintain measurement accuracy in the presence of the large DC voltage that exists across battery terminals during operation—a condition absent from conventional laboratory EIS measurements where cells are measured at open circuit. For lithium-ion cells, this DC potential ranges from approximately 2.5 V (fully discharged) to 4.2 V (fully charged), which is three to four orders of magnitude larger than the millivolt-level AC response signal that must be extracted for impedance computation.
To isolate the device’s DC bias handling capability from battery electrochemical variables, a 20 mΩ precision resistor was used as a stable, frequency-independent impedance standard. Measurements were performed under two conditions: offline (no DC bias, resistor connected directly to the device) and online (a regulated 3.6 V DC voltage applied in series with the resistor, simulating the nominal potential of an NCR18650 cell at approximately SOC = 40%).
Figure 9a illustrates the measurement configuration. Figure 9b presents the measured impedance magnitude as a function of frequency for both conditions. The offline measurement deviates from the nominal 20 mΩ by a maximum of 0.295% across the entire frequency range, confirming the intrinsic accuracy of the device on a known impedance standard. Under online conditions with the 3.6 V DC bias, the maximum deviation increases to 0.690% at 5620 Hz (Table 5). Critically, the online measurement error remains below 1% at all tested frequencies, demonstrating that the device’s DC blocking strategy—a combination of AC coupling at the DNB1101 analog front-end (enabled by the chip’s 1.9–5.5 V input range, which accommodates the DC offset without requiring external AC-coupling capacitors) and synchronous DFT demodulation (which acts as a narrowband filter at the excitation frequency, rejecting the DC component)—effectively suppresses the DC offset while preserving the AC response signal.
The frequency-dependent trend in online error (Figure 9d) shows increasing deviation at higher frequencies, from 0.105% at 1 Hz to 0.690% at 5620 Hz. This trend is attributable to the frequency-dependent impedance of the parasitic capacitive coupling between the DC source output and the measurement leads, which becomes a lower-impedance path at higher frequencies and consequently draws a larger fraction of the AC excitation current. This is a known characteristic of DC-biased impedance measurements on low-impedance standards and does not represent a device-specific design deficiency. The sub-1% error across the full frequency range confirms that the device can perform in-situ EIS measurements under realistic DC bias conditions—for example, during periodic diagnostic sweeps executed while cells remain connected in the pack configuration—without requiring disconnection or open-circuit resting.

3.5. Cross-Chemistry Validation with LiFePO4 Cells

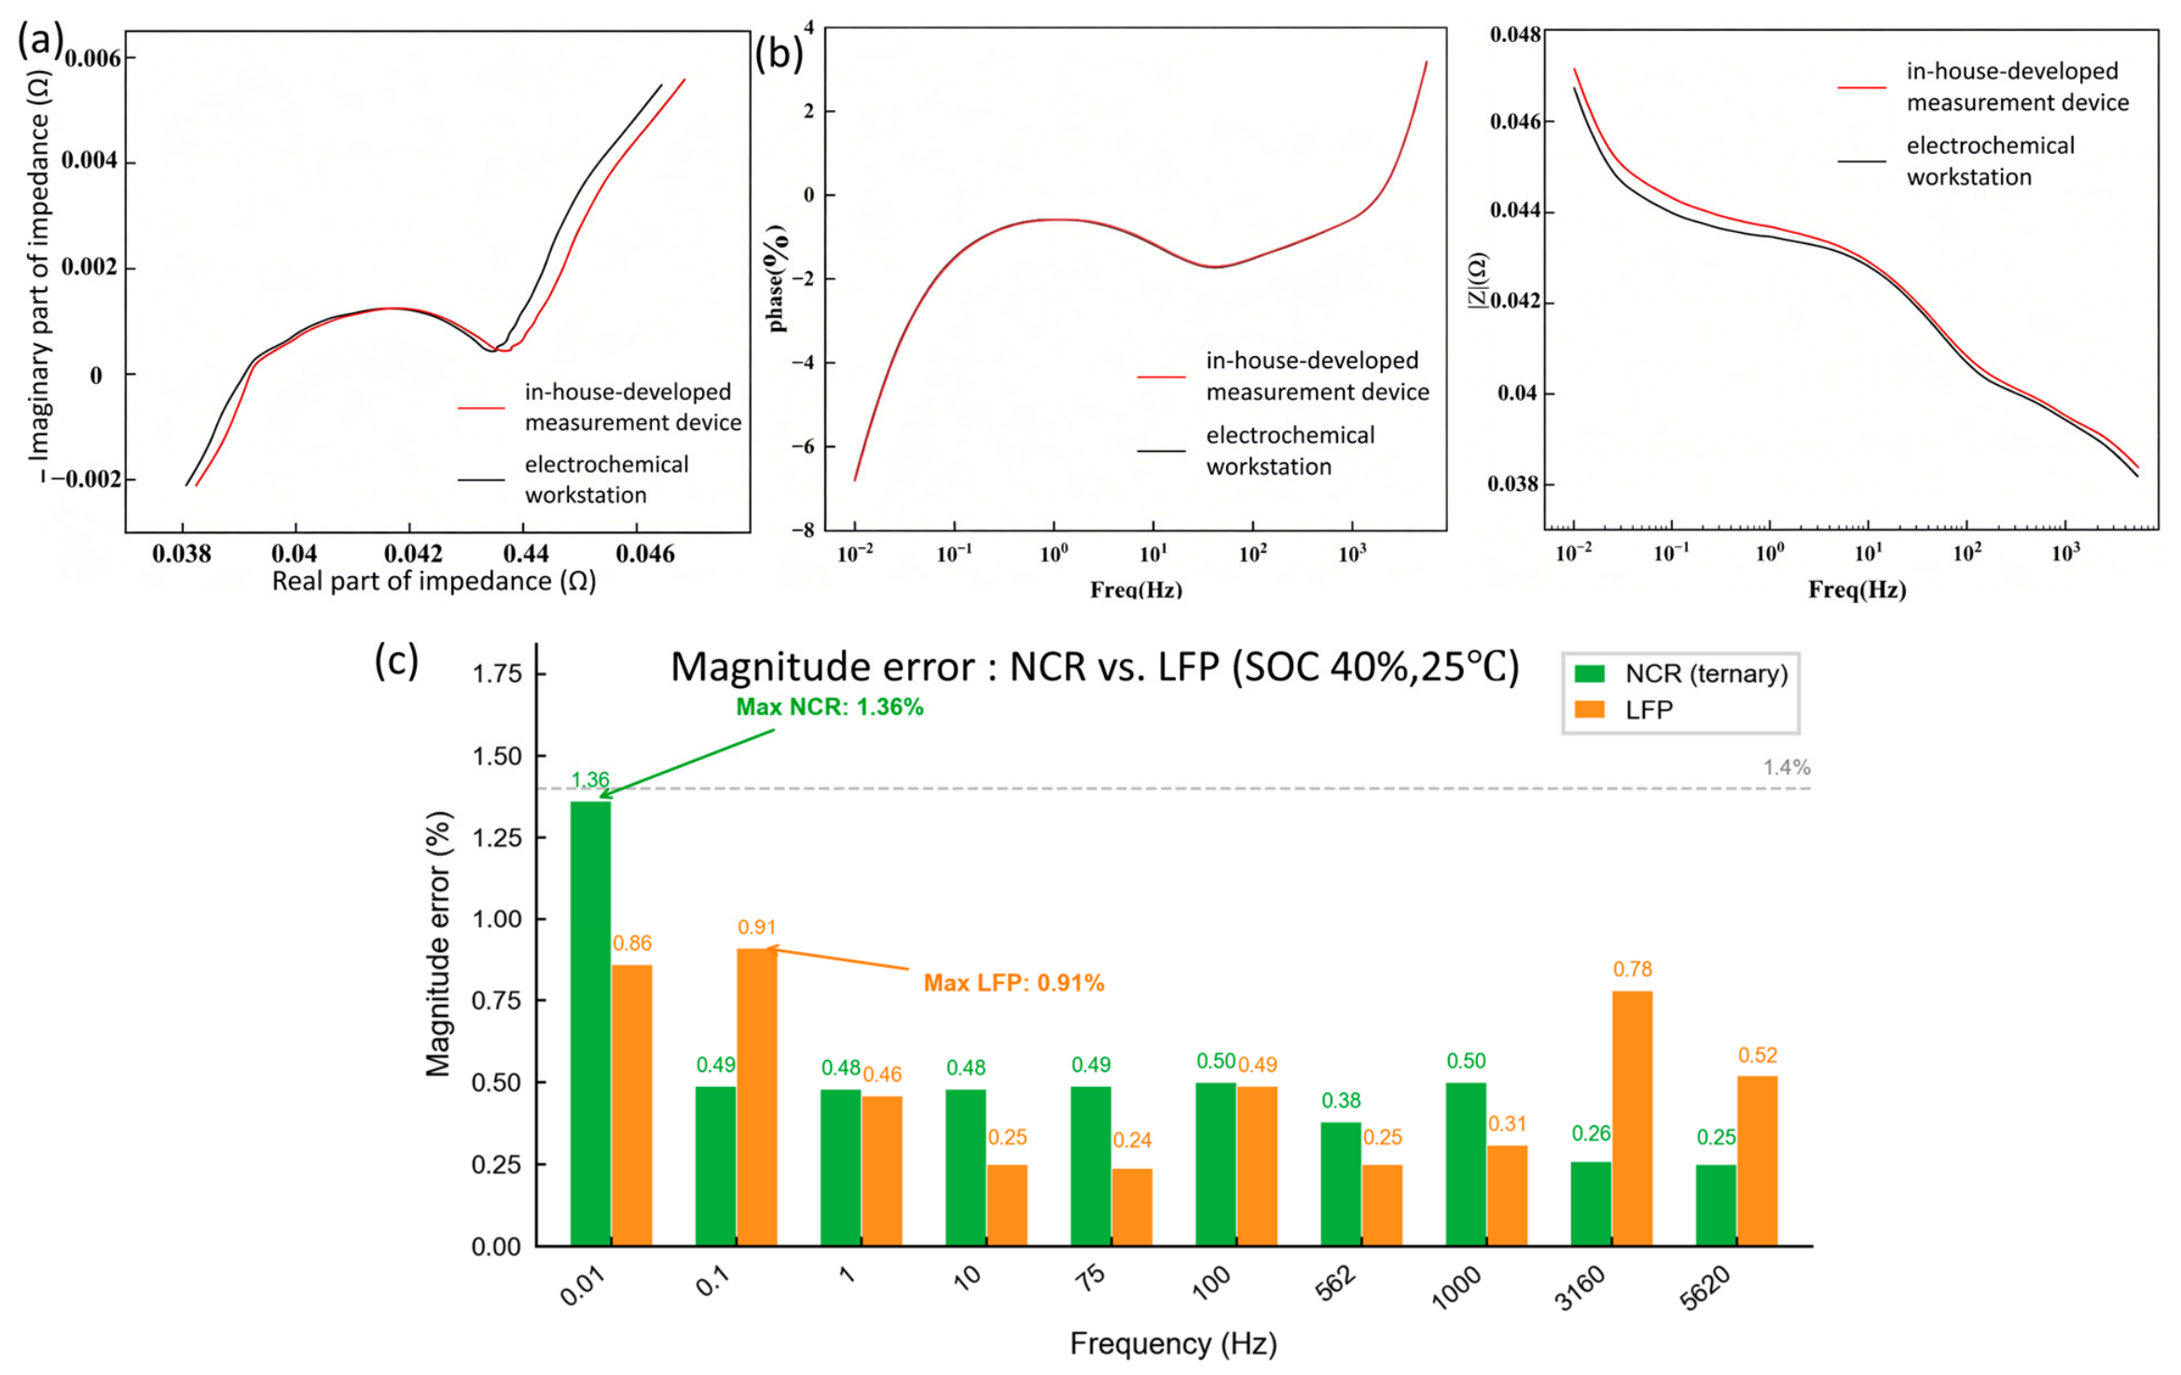
The two dominant cathode chemistries in commercial lithium-ion batteries—layered oxide (NCA/NMC, collectively termed “ternary”) and olivine phosphate (LiFePO4, LFP)—exhibit substantially different impedance characteristics. LFP cathodes operate via a two-phase lithium (de)intercalation mechanism that produces a characteristically flat open-circuit voltage plateau, and their charge-transfer kinetics differ from the single-phase behaviour of ternary cathodes. A practical EIS measurement device must therefore demonstrate accuracy across both chemistries. To this end, the full validation protocol was repeated using a commercial 18,650 LiFePO4 cell.
Figure 10a,b present the Nyquist and Bode comparisons between the device and the CS350 workstation. The agreement is again excellent. Table 6 provides the quantitative comparison at representative frequency points. The maximum impedance magnitude error is 0.89% at 0.01 Hz, and the maximum absolute phase error is 0.92°—both below 1%. The LFP cell exhibits slightly better agreement than the NCR cell (0.89% vs. 1.37% magnitude error). This improved accuracy is attributable to the exceptionally stable open-circuit voltage of LiFePO4 in the SOC = 40% region, which lies within the two-phase plateau where dV/d(SOC) ≈ 0. The near-zero slope of the OCV–SOC curve minimizes the low-frequency voltage drift that is the dominant error source for ternary cells at sub-hertz frequencies.
Figure 10c directly compares the magnitude error spectra for the two chemistries. Both exhibit the same characteristic frequency dependence—higher error at the lowest frequencies, minimum in the mid-frequency range—confirming a common error mechanism (low-frequency OCV drift) rather than a chemistry-specific artifact. The consistent sub-1.4% performance across both NCR ternary and LFP cells demonstrates that the device’s measurement principle—galvanostatic AC excitation with Kelvin four-wire sensing and DFT-based synchronous demodulation—is chemistry-agnostic, as expected from fundamental impedance measurement theory.

3.6. Performance Summary

Table 7 consolidates the key performance metrics across all five validation configurations. The maximum observed error across all test dimensions is 1.55%. All other error metrics fall below 1.22%. The device consistently achieves sub-1.6% accuracy—comparable to the inter-instrument variability reported between commercial electrochemical workstations from different manufacturers—while providing multi-channel synchronous, DC-bias-tolerant, and cross-chemistry capabilities that are absent from both commercial workstations and previously reported compact EIS systems.

4. Discussion

The experimental results presented above demonstrate that the proposed DNB1101-based master–slave EIS measurement architecture achieves laboratory-workstation-grade accuracy—impedance magnitude errors below 1.60% and phase errors below 1.22%—while simultaneously providing multi-channel synchronous acquisition, online operation under DC bias, and cross-chemistry generality. This combination of capabilities addresses the central bottleneck that has limited the translation of EIS-based battery diagnostics from controlled laboratory settings to practical field-deployed BMS.

4.1. Architectural Advantages

The device’s performance rests on three mutually reinforcing design choices whose collective effect exceeds the sum of their individual contributions.
First, adopting the battery-dedicated DNB1101 AFE resolves battery-specific measurement challenges directly at the hardware level, eliminating the need for external passive AC-coupling networks or attenuation dividers. The 1.9–5.5 V input voltage range directly accommodates lithium-ion cell voltages without the resistive divider networks (which attenuate the already-small AC signal) or AC-coupling capacitor banks (which introduce frequency-dependent parasitic impedances at low frequencies) required by general-purpose chips such as the AD5933 and AD5941. The on-chip DFT engine, clocked at 4 MHz, performs the computationally intensive impedance calculation locally on each slave unit, reducing the data throughput requirement on the daisy-chain bus from raw ADC sample streams (which would require >1 Mbps per channel for continuous streaming at the Nyquist rate) to complex impedance values at the pre-defined frequency points (a few kilobytes per complete sweep). This reduction is critical for daisy-chain scalability, as it prevents the communication bus from becoming the bottleneck as channel count increases.
Second, the daisy-chain expansion architecture is fundamentally more scalable and signal-integrity-preserving than the analog multiplexing approaches used in prior multi-cell EIS designs. Because each slave unit maintains an independent analog front-end—excitation source, programmable gain amplifier, anti-aliasing filter, ADC, and DFT processor—cross-channel interference is limited to the digital domain (bus contention during data retrieval), which is deterministically managed by the master’s command-response protocol. In contrast, analog multiplexing routes the low-level AC signals from multiple cells through shared amplifiers, filters, and ADC input stages, introducing parasitic coupling paths, inter-channel crosstalk, and the well-known trade-off between multiplexer on-resistance (which adds to the measured impedance) and off-isolation (which limits channel-to-channel rejection). The hardware broadcast trigger mechanism further ensures that the excitation and acquisition at all channels are truly simultaneous, rather than time-division-multiplexed—a distinction that is essential for capturing instantaneous cell-to-cell impedance variations in a dynamically operating pack.
Third, the Kelvin four-wire sensing method—long established in precision low-resistance metrology but not universally adopted in compact battery EIS designs—proves essential for achieving the sub-2% accuracy required for diagnostic-grade measurements in the milliohm regime. The ECM fitting results provide particularly direct evidence: the Rb parameter difference of 0.051% between the device and the CS350 workstation demonstrates that the Kelvin configuration eliminates not only the DC lead resistance (which can be calibrated out) but also the frequency-dependent lead impedance (which cannot, because it depends on the complex geometry of the current path and the magnetic permeability of surrounding materials).

4.2. Comparison with Prior Compact EIS Systems

Table 8 provides a quantitative comparison of the developed device against representative compact EIS architectures reported in the recent literature (2019–2026) and commercial solutions. The proposed DNB1101-based master–slave system is distinguished by a unique combination of performance metrics: workstation-comparable measurement fidelity (|Z|error < 1.6%), native DC-bias handling without passive blocking networks, scalable daisy-chain expansion up to 252 nodes with hardware-synchronized broadcast triggering, and AEC-Q100 automotive-grade qualification at a highly competitive bill-of-materials cost (~$25 per channel).

4.3. Practical Implications for BMS Integration

The online measurement capability validated through the precision resistor test under 3.6 V DC bias is the most practically consequential feature of the device. In a real battery system, the ability to measure cell impedance without disconnecting cells from the pack—and without requiring open-circuit resting—eliminates the need for dedicated offline diagnostic cycles that take the battery out of service. The sub-1% online error demonstrated here, combined with a sweep duration of approximately 12 min, suggests a practical deployment model in which the device executes one diagnostic sweep per charge cycle (for EV applications) or once daily (for stationary storage), drawing negligible energy. The impedance data thus acquired could feed into the growing body of model-based and data-driven SOC/SOH estimation algorithms that have been shown to achieve root-mean-square estimation errors below 2% when provided with periodic, high-fidelity EIS updates [9,10,11,12].
The multi-channel capability addresses a second practical requirement: cell-to-cell variation analysis. In a series-connected battery pack, individual cells age at different rates due to manufacturing variability, thermal gradients, and local current density inhomogeneities. Identifying the weakest cells before they become safety hazards requires per-cell characterization—a task for which sequential single-channel measurement is too slow (the thermal and SOC state of the pack drifts during the measurement window) and for which the daisy-chain architecture’s truly simultaneous acquisition provides a fundamental advantage.

4.4. Limitations and Future Work

Several limitations of the current proof-of-concept implementation warrant discussion and define explicit directions for our ongoing and future research:
First, the excitation frequency range (0.01–5620 Hz) is constrained by the hardware specifications of the DNB1101 AFE. While this range thoroughly covers the diagnostically relevant processes in conventional liquid-electrolyte cells—including ohmic resistance, charge-transfer kinetics, and solid-state diffusion—it inherently confines the direct applicability of the current prototype to liquid-electrolyte chemistries. Emerging solid-state and quasi-solid-state batteries feature key diagnostic mechanisms, such as bulk/grain-boundary ionic transport in solid electrolytes and solid–solid interfacial kinetics, that appear at frequencies spanning tens of kilohertz up to the megahertz regime. Consequently, characterization of solid-state cells lies beyond the frequency ceiling of the present device. To support next-generation solid-state battery diagnostics, future hardware iterations will explore upgrade paths involving high-speed wideband analog front-ends combined with high-frequency discrete Fourier transform engines or wideband excitation architectures.
Second, the single-sine frequency sweep duration (approximately 12 min) is dominated by low-frequency integration periods (e.g., 0.01 Hz requires >100 s per point for adequate SNR). While suitable for periodic diagnostic sweeps, it is too slow for tracking rapid transient dynamics. Future work will explore multi-sine excitation strategies—superimposing logarithmically spaced sinusoids deconvolved via fast Fourier transform—to accelerate acquisition speed while managing crest factor and inter-modulation distortion.
To transition from this proof-of-concept prototype to a fully qualified industrial system, our immediate research roadmap focuses on the following key tasks:
  • Real-BMS and Pack-Level Environment Validation: Expanding testing from isolated single cells and small modules to multi-cell series/parallel battery packs operating within real BMS environments, evaluating device performance under dynamic load profiles, high common-mode voltage stress, and traction inverter electromagnetic interference (EMI).
  • Multi-State SOC, Temperature, and Aging Matrix Testing: Extending validation beyond the single SOC (40%) and temperature (25 °C) baseline by conducting systematic matrix experiments across diverse SOC operating points (e.g., 20%, 60%, and 80%), broad temperature ranges (sub-zero to elevated conditions), and varying degradation states-of-health (SOH) to construct comprehensive reference maps for compensated BMS algorithms.
  • High-Channel-Count Daisy-Chain Expansion: Deploying the differential daisy-chain architecture across more than four slave channels (e.g., 12S/16S pack modules) to rigorously demonstrate the system’s modular scalability, signal integrity, and broadcast synchronization over extended node counts.
  • Repeatability and Long-Term Stability Evaluation: Executing systematic repeated measurement trials across continuous cycling runs to quantitatively evaluate long-term operational stability, thermal drift resistance, and hardware endurance.
  • Uncertainty Analysis and Statistical Error Representation: Incorporating formal uncertainty propagation analysis and explicit error bars ( ± σ ) into diagnostic charts and parameter tables across extended multi-run dataset batches to enhance the statistical rigor and reliability of experimental findings.”

4.5. Outlook

Looking forward, immediate priorities must focus on module-level validation under dynamic operating conditions to bridge the gap between laboratory-scale testing and real-world operational environments. Building upon this foundation, the most impactful system-level development will be the closed-loop integration of the online EIS device with BMS state estimation algorithms.
Recent work has demonstrated that EIS-derived features—particularly bulk resistance (Rb), charge-transfer resistance (Rct), and the Warburg coefficient—can serve as high-value input features for Gaussian process regression, long short-term memory (LSTM) recurrent neural networks, and electrochemical model-based observers, achieving SOC and SOH estimates with root-mean-square errors (RMSE) below 2%. The device presented in this work supplies the missing hardware layer required to deliver periodic, high-fidelity, multi-channel impedance data directly within active battery packs.
Beyond baseline SOC/SOH estimation, online EIS enables several emerging battery management functions, including early detection of lithium plating before irreversible damage occurs (manifested as a characteristic distortion of the mid-frequency impedance arc), identification of anomalous cells exhibiting accelerated ageing relative to their series-connected neighbours, and rapid health evaluation of second-life batteries upon automotive retirement—a task that traditionally relies on time-consuming full-capacity cycling and for which impedance-based screening can reduce testing time by >80%.
Finally, while the present master–slave platform successfully solves the challenges of online multi-channel EIS for state-of-the-art liquid-electrolyte batteries, transitioning toward future solid-state and quasi-solid-state chemistries will require expanding the system’s bandwidth into the megahertz range. Integrating high-speed AFE architectures with wideband excitation strategies represents a vital prospective upgrade path for extending onboard EIS diagnostics to next-generation solid-state battery systems.

5. Conclusions

This paper has presented the design, implementation, and comprehensive experimental validation of a multi-channel online electrochemical impedance spectroscopy measurement device for lithium-ion battery diagnostics. The device employs a master–slave distributed architecture that combines the DNB1101 battery-dedicated impedance measurement chip with Kelvin four-wire sensing, switching-type AC current excitation, and a differential daisy-chain multi-channel expansion topology with a hardware broadcast trigger for synchronous multi-cell acquisition.
Experimental validation against a CorrTest CS350 electrochemical workstation, using both Panasonic NCR18650 ternary and LiFePO4 18,650 cells across a 0.01 Hz–5620 Hz frequency range at SOC = 40% and 25 °C, yields the following conclusions:
  • Single-cell accuracy: The device achieves a maximum impedance magnitude error of 1.36% and a maximum phase error of 1.20%, with mean errors of 0.52% and 0.82%, respectively. These values are within the inter-instrument variability reported for commercial electrochemical workstations and meet the accuracy requirements for diagnostic-grade battery impedance measurement.
  • Electrochemical parameter fidelity: Equivalent circuit model fitting via ZSimpWin yields parameter differences below 1.90% for all seven ECM parameters, with the diagnostically most relevant parameters—ohmic resistance Rb (Δ = 0.051%) and charge-transfer resistance Rct (Δ = 0.720%)—differing by less than 0.75%. This confirms that the device can reliably supply the impedance-derived features required by model-based battery state estimators.
  • Multi-channel capability: Four-channel synchronous measurements demonstrate inter-channel amplitude variance below 1.6% across the full frequency range, with individual channel accuracy maintained at the single-channel level (1.36% magnitude error for Channel 2 vs. CS350). The daisy-chain architecture and hardware broadcast trigger mechanism provide truly parallel, rather than time-division-multiplexed, multi-cell acquisition.
  • Online DC-bias robustness: Under 3.6 V DC bias—simulating the nominal potential of an NCR18650 cell—the device measures a 20 mΩ precision resistor standard with a maximum deviation of 0.69% across the full frequency range, confirming that the DNB1101’s integrated DC blocking capability effectively suppresses the large DC offset while preserving the microvolt-level AC signal of interest.
  • Cross-chemistry generality: Validation with LiFePO4 cells yields magnitude errors below 0.89% and phase errors below 0.92%, with slightly better accuracy than NCR cells attributable to the OCV stability of LFP in the two-phase plateau region. The consistent sub-1.4% performance across both chemistries confirms that the device’s measurement principle is chemistry-agnostic.
The developed device bridges the gap between laboratory-grade EIS instrumentation and field-deployable battery diagnostics, providing a compact, scalable, and cost-effective platform for integrating electrochemical impedance spectroscopy into next-generation battery management systems. Future work will focus on extending the excitation frequency range, reducing sweep duration through multi-sine techniques, characterizing the device across the full SOC–temperature operating envelope, and validating performance under real-world automotive and grid-storage operating conditions.


Author Contributions

Conceptualization, C.Y., X.S., and S.Z.; methodology, C.Y., X.S., and H.Y.; software, X.S. and R.Z.; validation, C.Y., X.S., F.L., and Y.Z.; formal analysis, C.Y. and R.Z.; investigation, C.Y. and X.S.; resources, S.Z. and H.Y.; data curation, X.S. and R.Z.; writing—original draft preparation, C.Y. and X.S.; writing—review and editing, S.Z., H.Y., and F.L.; visualization, X.S. and R.Z.; supervision, S.Z.; project administration, S.Z. All authors have read and agreed to the published version of the manuscript.

Funding

This research was funded by Hebei Agricultural Science and Technology Achievement Transfor-mation Project, grant number 2025NZ-S19.

Data Availability Statement

The original contributions presented in this study are included in the article. Further inquiries can be directed to the corresponding author.

Acknowledgments

The authors would like to thank the laboratory staff for their technical assistance during the experimental setup. During the preparation of this manuscript, the authors used Google Gemini and GPT-5.5 for English translation, language polishing, and improving grammatical fluency. The authors carefully reviewed and edited all AI-generated content and take full responsibility for the content of this publication.

Conflicts of Interest

Author Hui Yang was employed by the company No. 704 Research Institute, CSSC. The remaining authors declare that the research was conducted in the absence of any commercial or financial relationships that could be construed as a potential conflict of interest.

Abbreviations

The following abbreviations are used in this manuscript:
ACAlternating Current
ADCAnalog-to-Digital Converter
AEC-Q100Automotive Electronics Council Q100
AFEAnalog Front-End
BMSBattery Management System
CC-CVConstant Current–Constant Voltage
CPEConstant-Phase Element
CSVComma-Separated Values
CVCoefficient of Variation
DCDirect Current
DDSDirect Digital Synthesis
DFTDiscrete Fourier Transform
DMADirect Memory Access
ECMEquivalent Circuit Model
EISElectrochemical Impedance Spectroscopy
EMCElectromagnetic Compatibility
EVElectric Vehicle
FFTFast Fourier Transform
FIFOFirst-In-First-Out
FPGAField-Programmable Gate Array
ICIntegrated Circuit
LFPLithium Iron Phosphate (LiFePO4)
LSTMLong Short-Term Memory
MADMedian Absolute Deviation
MCUMicrocontroller (Unit)
NCANickel Cobalt Aluminum (oxide)
NMCNickel Manganese Cobalt (oxide)
NRENon-Recurring Engineering (cost)
OCVOpen-Circuit Voltage
PCBPrinted Circuit Board
RctCharge-transfer Resistance
RbOhmic/Bulk Resistance
RMSRoot Mean Square
SEISolid-Electrolyte Interphase
SNRSignal-to-Noise Ratio
SOCState of Charge
SOHState of Health
SOPState of Power
SPISerial Peripheral Interface
UARTUniversal Asynchronous Receiver-Transmitter
USBUniversal Serial Bus

Appendix A

Figure A1. Complete circuit schematic of the single-cell slave acquisition unit based on the DNB1101 impedance monitoring front-end.
Batteries 12 00319 g0a1
Figure A2. Comprehensive circuit diagram of the four-channel multi-cell slave board.
Batteries 12 00319 g0a2
Figure A3. Physical PCB layout, four-layer stack-up configuration, and trace routing of the multi-channel slave board.
Batteries 12 00319 g0a3
Figure A4. Two-layer PCB routing topology and mixed-signal isolation boundary of the STM32F407 master controller.
Batteries 12 00319 g0a4
Figure A5. Screenshot of the host diagnostic software interface during active acquisition.
Batteries 12 00319 g0a5

References

  1. Tarascon, J.-M.; Armand, M. Issues and challenges facing rechargeable lithium batteries. Nature 2001, 414, 359–367. [Google Scholar] [CrossRef] [Scilit] [PubMed]
  2. Barsoukov, E.; Macdonald, J.R. Impedance Spectroscopy: Theory, Experiment, and Applications, 3rd ed.; Wiley: Hoboken, NJ, USA, 2018. [Google Scholar]
  3. Waag, W.; Fleischer, C.; Sauer, D.U. Critical review of the methods for monitoring of lithium-ion batteries in electric and hybrid vehicles. J. Power Sources 2014, 258, 321–339. [Google Scholar] [CrossRef] [Scilit]
  4. Feng, X.; Ouyang, M.; Liu, X.; Lu, L.; Xia, Y.; He, X. Thermal runaway mechanism of lithium ion battery for electric vehicles: A review. Energy Storage Mater. 2018, 10, 246–267. [Google Scholar] [CrossRef] [Scilit]
  5. Hannan, M.A.; Lipu, M.S.H.; Hussain, A.; Mohamed, A. A review of lithium-ion battery state of charge estimation and management system in electric vehicle applications: Challenges and recommendations. Renew. Sustain. Energy Rev. 2017, 78, 834–854. [Google Scholar] [CrossRef] [Scilit]
  6. Pastor-Fernández, C.; Uddin, K.; Chouchelamane, G.H.; Widanage, W.D.; Marco, J. A comparison between electrochemical impedance spectroscopy and incremental capacity-differential voltage as Li-ion diagnostic techniques to identify and quantify the effects of degradation modes within battery management systems. J. Power Sources 2017, 360, 301–318. [Google Scholar] [CrossRef] [Scilit]
  7. Andre, D.; Meiler, M.; Steiner, K.; Wimmer, C.; Soczka-Guth, T.; Sauer, D.U. Characterization of high-power lithium-ion batteries by electrochemical impedance spectroscopy. I. Experimental investigation. J. Power Sources 2011, 196, 5334–5341. [Google Scholar] [CrossRef] [Scilit]
  8. Zhuang, Q.; Qiu, X.; Xu, S.; Qiang, Y.; Sun, S. Diagnosis of electrochemical impedance spectroscopy in lithium-ion batteries. Prog. Chem. 2010, 22, 1044–1057. [Google Scholar]
  9. Huang, J.; Li, Z.; Zhang, J. Dynamic electrochemical impedance spectroscopy reconstructed from continuous impedance measurement of single frequency during charging/discharging. J. Power Sources 2015, 273, 1098–1102. [Google Scholar] [CrossRef] [Scilit]
  10. Schuster, S.F.; Brand, M.J.; Berg, P.; Gleissenberger, M.; Jossen, A. Lithium-ion cell-to-cell variation during battery electric vehicle operation. J. Power Sources 2015, 297, 242–251. [Google Scholar] [CrossRef] [Scilit]
  11. Eddahech, A.; Briat, O.; Bertrand, N.; Delétage, J.-Y.; Vinassa, J.-M. Behavior and state-of-health monitoring of Li-ion batteries using impedance spectroscopy and recurrent neural networks. Int. J. Electr. Power Energy Syst. 2012, 42, 487–494. [Google Scholar] [CrossRef] [Scilit]
  12. Chen, L.; Chen, H.; Liao, L.; Jiang, J.; Wang, L. Online measurement of impedance spectroscopy of lithium-ion batteries based on equalized current harmonic injection. J. Electrochem. Energy Convers. Storage 2025, 22, 021001. [Google Scholar] [CrossRef] [Scilit]
  13. Koseoglou, M.; Tsioumas, E.; Papagiannis, D.; Jabbour, N.; Mademlis, C. A novel on-board electrochemical impedance spectroscopy system for real-time battery impedance estimation. IEEE Trans. Power Electron. 2021, 36, 10776–10787. [Google Scholar] [CrossRef] [Scilit]
  14. Din, E.; Schaef, C.; Moffat, K.; Stauth, J.T. A scalable active battery management system with embedded real-time electrochemical impedance spectroscopy. IEEE Trans. Power Electron. 2017, 32, 5688–5698. [Google Scholar] [CrossRef] [Scilit]
  15. Lohmann, N.; Weßkamp, P.; Haußmann, P.; Melbert, J.; Musch, T. Electrochemical impedance spectroscopy for lithium-ion cells: A calibration-free approach. J. Power Sources 2015, 273, 613–623. [Google Scholar] [CrossRef] [Scilit]
  16. Cicioni, G.; De Angelis, A.; Janeiro, F.M.; Ramos, P.M.; Carbone, P. Battery Impedance Spectroscopy Embedded Measurement System. Batteries 2023, 9, 577. [Google Scholar] [CrossRef] [Scilit]
  17. Sun, W. Development of a Comprehensive Measurement and Control System for Electrochemical Impedance Spectroscopy Based on FPGA. Master’s Thesis, Harbin Institute of Technology, Harbin, China, 2018. [Google Scholar]
  18. Tan, Z.; Feng, Q.; Ma, T.; Zhang, J.; Liang, Y. Development of an AD5933-based impedance calibration and measurement technology using piezoceramic transducers. Measurement 2023, 210, 112527. [Google Scholar] [CrossRef] [Scilit]
  19. Farré Romera, M.D. Design, Implementation and Test of a Low-Cost Electrical Impedance Spectroscopy System Based on an AD5940. Bachelor’s Thesis, Universitat Politècnica de Catalunya, Barcelona, Spain, 2021. [Google Scholar]
  20. Wu, J.; Bai, W.; Zhang, L.; Zhang, X.; Lin, H.; Dai, H.; Liu, J.; Zhang, F.; Yang, Y. Design of a portable electrochemical impedance spectroscopy measurement system based on AD5941 for lithium-ion batteries. J. Energy Storage 2024, 84, 110856. [Google Scholar] [CrossRef] [Scilit]
  21. Datang NXP Semiconductors. DNB1101 Datasheet: Single-Cell Battery Management AFE with EIS. 2022. Available online: https://www.datangnxp.com (accessed on 8 May 2026).
  22. Geng, A.; Hu, H.; Peng, Y.; Zhao, Z.; He, Z.; Gao, S. Wideband measurement approach for EIS of lithium-ion batteries using low-frequency concentrated disturbance. IEEE Trans. Ind. Electron. 2024, 71, 4851–4860. [Google Scholar] [CrossRef] [Scilit]
  23. Huang, J.; Li, Z.; Zhang, J. Measurement, interpretation, and application of electrochemical impedance spectroscopy to lithium-ion batteries. Energy Environ. Sci. 2024, 17, 1248–1270. [Google Scholar]
  24. Tokyo Institute of Technology. Historical Developments of Electrochemical Impedance Spectroscopy. Available online: https://www.titech.ac.jp/english (accessed on 8 May 2026).
  25. Orazem, M.E.; Tribollet, B. Electrochemical Impedance Spectroscopy, 2nd ed.; Wiley: Hoboken, NJ, USA, 2017. [Google Scholar]
  26. Schönleber, M.; Klotz, D.; Ivers-Tiffée, E. A Method for Improving the Robustness of linear Kramers-Kronig Validity Tests. Electrochim. Acta 2014, 131, 20–27. [Google Scholar] [CrossRef] [Scilit]
  27. Howey, D.A.; Mitcheson, P.D.; Yufit, V.; Offer, G.J.; Brandon, N.P. Online measurement of battery impedance using motor controller excitation. IEEE Trans. Veh. Technol. 2014, 63, 2557–2566. [Google Scholar] [CrossRef] [Scilit]
  28. Panasonic Corporation. NCR18650B Datasheet: Lithium-Ion Battery Cells; Rev. 4.0; Panasonic: Osaka, Japan, 2018. [Google Scholar]
  29. Shenzhen EPT Battery Co., Ltd. EPT-18650-1800LFP Datasheet: Lithium Iron Phosphate Battery Cell; Rev. 2.1; EPT: Shenzhen, China, 2020. [Google Scholar]
Figure 1. Overall system architecture of the multi-channel online EIS measurement device, showing the master–slave distributed topology, the three functional layers, and the data flow during a measurement sequence.
Batteries 12 00319 g001
Figure 2. Kelvin four-wire measurement configuration and single-cell slave unit. (a) Schematic of the four-wire sensing principle. (b) Block diagram of the DNB1101-based slave unit.
Batteries 12 00319 g002
Figure 3. Differential daisy-chain communication topology with transformer isolation and hardware broadcast trigger for synchronous multi-node excitation.
Batteries 12 00319 g003
Figure 4. Photograph of the assembled device, showing the master unit, single-cell slave, four-channel slave board, and Kelvin test cables.
Batteries 12 00319 g004
Figure 5. Experimental validation platform integrating the self-developed device, CS350 workstation, Neware battery test system, thermal chamber, and host PC.
Batteries 12 00319 g005
Figure 6. Single-cell EIS accuracy validation for an NCR18650 cell (SOC 40%, 25 °C). (a) Nyquist spectra from the developed device and CS350. (b) Bode magnitude plot. (c) Bode phase plot. (d) Magnitude and phase errors vs. frequency.
Batteries 12 00319 g006
Figure 7. Equivalent circuit model fitting results. (a) Seven-parameter equivalent circuit model where L is equivalent terminal inductance, R b represents the value of ohmic resistance, y 1 and n 1 represent the parameters of constant phase element C P E 1 , y 2 and n 2 represent the parameters of constant phase element C P E 2 , and   R c t represents the value of charge-transfer resistance. (b) Nyquist plot comparison between experimental data measured by the CorrTest CS350 reference workstation and the fitted curve. (c) Nyquist plot comparison between experimental data measured by the self-developed device and the fitted curve.
Batteries 12 00319 g007
Figure 8. Multi-channel synchronous EIS measurement for four NCR18650 cells. (a) Nyquist spectra from all channels. (b) Bode magnitude and phase comparison for Cell 2 acquired under multi-channel operation vs. standalone CS350 workstation reference measurement. (c) Corresponding Nyquist comparison for Cell 2 under the same conditions. (d) Coefficient of variation vs. frequency.
Batteries 12 00319 g008
Figure 9. Online EIS measurement under 3.6 V DC bias using a 20 mΩ precision resistor. (a) Measurement schematic. (b) Impedance magnitude under offline and online conditions. (c) Deviation from nominal value. (d) Online deviation vs. frequency.
Batteries 12 00319 g009
Figure 10. Cross-chemistry validation with an LFP cell (SOC 40%, 25 °C). (a) Nyquist spectra from both instruments. (b) Bode plots. (c) Impedance magnitude error comparison between NCR and LFP cells.
Batteries 12 00319 g010
Table 1. FreeRTOS task allocation in the master controller firmware.
TaskPriorityResponsibility
TaskUSART5 (highest)Asynchronous UART communication with host computer and daisy-chain transceivers; DMA-based ring buffer management to prevent character loss at 1 Mbps
TaskLinxCtl4Command parsing, daisy-chain node enumeration, logical address assignment, system error diagnostics
TaskLinxZMCh03Swept-frequency measurement sequence execution across active channels; synchronous frequency hopping via hardware broadcast commands
TaskDataProc2Raw register-to-impedance conversion; data formatting and scheduling for host-bound transmission
TaskIdle0 (lowest)Background runtime statistics; stack high-water-mark monitoring; low-power sleep management
Table 2. Impedance measurement comparison between the developed device and the CS350 electrochemical workstation for a single NCR18650 cell at SOC = 40% and 25 °C.
Frequency (Hz)|Z| (mΩ)Mag. Error (%)θ (°)Phase Error (%)
CS350DeviceCS350Device
0.010.04420.04481.36−6.585−6.6631.18
0.10.04180.04200.49−1.484−1.4940.67
10.04130.04150.48−0.4466−0.45201.20
100.04110.04130.48−0.3559−0.35880.81
750.04060.04080.49−0.6053−0.60950.69
1000.04040.04060.50−0.6390−0.64340.68
5620.03980.03990.38−0.6172−0.62070.57
10000.03940.03960.50−0.4274−0.43171.01
31600.03870.03880.261.2671.2750.63
56200.03810.03820.253.5633.5910.79
Table 3. Equivalent circuit model fitting parameters from ZSimpWin analysis.
ParameterPhysical MeaningCS350 ValueCS350 Error (%)Device ValueDevice Error (%)Diff (%)
L (H)Terminal inductance1.046 × 10−64.6571.063 × 10−64.5691.625
Rb (Ω)Ohmic resistance3.919 × 10−20.2583.921 × 10−10.2760.051
y1 (CPE1)
( Ω 1 · s n )
CPE1 admittance5.334 × 10−120.615.435 × 10−121.171.893
n1 (CPE1)CPE1 exponent6.501 × 10−16.3286.431 × 10−16.6221.077
y2 (CPE2)
( Ω 1 · s n )
CPE2 admittance2.053 × 10−26.0082.072 × 10−26.3330.925
n2 (CPE2)CPE2 exponent8.072 × 10−12.2338.095 × 10−12.2770.285
Rct (Ω)Charge-transfer resistance6.671 × 10−21.1916.719 × 10−11.2110.720
Table 4. Impedance measurement comparison for Cell 2 under multi-channel operation vs. CS350 workstation reference.
Frequency (Hz)|Z| (mΩ)Mag. Error (%)θ(°)Phase Error (%)
CS350DeviceCS350Device
0.010.04520.04591.55−7.025−7.1071.15
0.10.04300.04320.47−1.569−1.5790.65
10.04270.04290.46−0.4296−0.43150.45
100.04240.04260.47−0.3608−0.36190.30
750.04210.04220.24−0.5510−0.55400.55
1000.04180.04190.23−0.5992−0.60170.42
5620.04120.04130.24−0.6233−0.62710.61
10000.04070.04090.49−0.3197−0.32361.22
31600.04000.04020.501.1851.1950.81
56200.03940.03960.513.4703.5091.12
Table 5. Offline vs. online (3.6 V DC bias) EIS measurement results for a 20 mΩ precision resistor.
Frequency (Hz)Offline |Z| (mΩ)Offline Error (%)Online |Z| (mΩ)Online Error (%)
0.0119.9740.13019.9380.190
0.119.9890.05519.9260.130
120.0180.09020.0210.105
1019.9900.05019.9490.255
7520.0030.01520.0990.495
10020.0110.07020.0180.090
56219.9890.05519.9410.295
100019.9910.04519.9180.410
316020.0380.19020.1030.515
562020.0590.29520.1180.690
Table 6. Impedance measurement comparison for a LiFePO4 18,650 cell at SOC = 40% and 25 °C.
Frequency (Hz)|Z| (mΩ)Mag. Error (%)θ(°)Phase Error (%)
CS350DeviceCS350Device
0.010.04680.04720.86−6.751−6.8130.92
0.10.04390.04430.91−1.467−1.4770.68
10.04350.04370.46−0.5828−0.58750.81
100.04280.04290.25−1.184−1.1890.42
750.04110.04120.24−1.615−1.6080.43
1000.04070.04090.49−1.517−1.5090.53
5620.03980.03990.25−0.8327−0.82940.39
10000.03930.03940.31−0.5783−0.57310.91
31600.03850.03880.781.0621.0700.75
56200.03810.03830.523.1873.1640.73
Table 7. Consolidated performance summary across all validation configurations.
Validation ConfigurationKey MetricValue
Single-cell accuracy (NCR)Max. |Z| error1.36%
Single-cell accuracy (NCR)Max. phase error1.20%
Single-cell accuracy (NCR)Mean |Z| error0.52%
ECM parameter fittingMax. parameter difference0.56%
ECM parameter fittingRb difference0.051%
ECM parameter fittingRct difference0.720%
Multi-channel sync (4 ch)Max. inter-channel CV2.13%
Multi-channel sync (Cell 2)|Z| error vs. CS3501.55%
Online DC bias (20 mΩ)Max. online deviation0.69%
Cross-chemistry (LFP)Max. |Z| error0.89%
Cross-chemistry (LFP)Max. phase error0.92%
Table 8. Performance comparison between the proposed device and representative compact EIS systems in the recent literature.
Feature/ParameterThis WorkAD5933-based [16]AD5941-based [18]DDS+MCU [14]Latest Integrated AFEs [19]CS350 Workstation
Core chipDNB1101AD5933AD5941AD9850+STM32High-Cell-Count EIS
Frequency range (Hz)0.01–56201–100,0000.015–200,0000.1–10,0000.1–10,00010−5–106
Max. channels4 (expandable to 252)111Multi-cell Pack Level1
|Z| error (vs. ref.)<1.6%~3% 1~2% 1~5% 1~1.5–2.0%<0.5% (reference)
Built-in DC bias handlingYes (1.9–5.5 V input)No (ext. AC coupling needed)PartialNoYesYes
Daisy-chain multi-channelYesNoNoNoDaisy-Chain/SPINo
On-chip DFT processingYesYesYesNo (MCU-based)YesYes
AEC-Q100 qualificationYes (DNB1101)NoNoNoYesNo
Approx. cost per channel 2~USD 25~USD 15~USD 25~USD 50High (Proprietary)>USD 30,000
1 Values as reported in or estimated from the cited references; direct cross-comparison limited by differing test conditions. 2 Bill-of-materials cost estimate for prototype quantities (10–100 units); excludes PCB fabrication, assembly, and NRE costs.
Disclaimer/Publisher’s Note: The statements, opinions and data contained in all publications are solely those of the individual author(s) and contributor(s) and not of MDPI and/or the editor(s). MDPI and/or the editor(s) disclaim responsibility for any injury to people or property resulting from any ideas, methods, instructions or products referred to in the content.