


Abstract
Over the past few years, laser structuring of electrodes has been shown as a powerful tool to significantly improve the rate capability and cycling ability of lithium-ion batteries. However, the impact of anode/cathode pattern combinations on electrochemical performance in full-cell configurations remains poorly understood. This work investigated for the first time the influence of laser structuring strategies and pattern combinations on the laser processing rate as well as the electrochemical performance of full cells containing NMC 811 cathodes and graphite anodes. Meanwhile, the mass losses due to laser ablation with different strategies were kept similar for cathodes and anodes. The line-patterning process exhibited a processing rate that was an order of magnitude higher than that for blind hole drilling. Moreover, line patterning of graphite anodes with an average laser power of 5.0 W showed a two to five times higher laser processing rate than with 2.5 W. Subsequently, the structured electrodes were cross-combined and assembled into full cells. All cells with laser-structured electrodes exhibited improved rate performance, reduced ionic resistance, and a shift in the onset of lithium plating to higher C-rates in comparison to the reference cells with unstructured electrodes. In particular, the cells with “Line 5 W” electrodes demonstrated excellent rate performance, delivering an increase of 72 mAh g−1 in discharge capacity compared to the reference cells at 5C and achieving 80% state of charge in 18 min. The results indicated that line patterns enhance rate performance more effectively than hole patterns. Furthermore, wider grooves in the electrodes were produced using higher average laser power, which may provide larger electrolyte reservoirs. This could support the rewetting processes of the electrolyte in the electrodes during electrochemical cycling and thus significantly improve rate performance and cell lifetime.
1. Introduction
The escalating demand for high-energy-density storage systems, driven by the rapid growth of electric vehicles (EVs) and grid storage, has positioned lithium-ion batteries (LIBs) at the forefront of energy research [1]. Modern EVs aim to achieve ranges exceeding 500 km after full charging, requiring batteries with energy densities of at least 235 Wh kg−1 and 500 Wh L−1 at battery-pack level [2].
One effective strategy to further increase the energy density of LIBs is to employ electrode active materials with high specific energy density. For example, using layered nickel-rich layered oxides such as Li(Ni0.8Mn0.1Co0.1)O2 (NMC 811) as the cathode active material has proven particularly promising due to their high specific capacity (>200 mAh g−1) and reduced cobalt content, which increase energy density, lower material costs, and alleviate supply chain concerns [3,4]. On the anode side, graphite is the most used state-of-the-art anode material in commercial LIBs [5]. Another strategy to achieve high energy density at the cell level is to apply thick-film electrodes. Thick-film electrode design (with areal capacities ≥ 4 mAh cm−2) is a practical strategy since it can benefit both reduced cell manufacturing cost and higher energy density [6,7]. However, thick-film electrodes face two major challenges: charge-transport limitations and mechanical deterioration [8,9]. First, increased electrodes thickness significantly lengthens the charge (electrons and ions) transfer pathway and hinders electrolyte penetration, resulting in slow lithium-ion diffusion kinetics, increased cell resistance, deteriorated rate performance, and elevated risk of lithium plating [9,10]. Furthermore, during conventional wet coating, thick electrodes require extended drying time, which might result in the migration of binders and additives towards the electrode surface, causing consequent deterioration of both mechanical and electrochemical performance [11]. Therefore, adapted to functional properties and reliable production, suitable 3D electrode architecture designs are essential for enabling and optimizing the application of thick-film electrodes in LIBs.
To achieve thick-film electrodes with low tortuosity, various methods have been explored, for example, the freeze-casting method [12], magnetic alignment method [13], and laser ablation [14,15]. Among these methods, laser structuring is a very promising approach to be established in battery manufacturing because it can be integrated into existing production lines and possesses the capability for process upscaling [16]. This method is based on laser ablation of active material/binder to generate defined microstructures based on pattern types such as lines, holes, or grids [17]. Hereby, laser-generated lines or grids can act as capillary microstructures which, in comparison to unstructured electrodes, significantly accelerate and homogenize the electrode wetting with liquid electrolyte. This in turn offers the great potential to reduce tremendously the processing time and production cost of LIBs [18,19,20]. Moreover, continuous electrolyte rewetting of the laser-structured electrodes during cell operation can be achieved owing to their three-dimensional (3D) architectures, which counteracts lithium plating and results in an increased cell lifetime [14]. In addition, laser structuring can also improve the lithium-ion transport kinetics [21], provide void space to accommodate volumetric changes and thereby enhance fast-charging capability and cycling stability, while suppressing lithium plating on the anodes [14,22,23].
Sterzl et al. [14] demonstrated that laser-structured graphite anodes (line, grid, and hole pattern) exhibit lower ionic resistance compared to unstructured ones. Line-structured electrodes showed the best electrochemical performance regarding fast-charging capability and the avoidance of lithium plating at high C-rates. Thus, in comparison to unstructured anodes, a boost in fast charging was enabled by a factor of two to three for thick-film electrodes (4 mAh/cm2).
Berhe et al. [24] structured commercial lithium iron phosphate (LFP) electrodes with four distinct geometries: line, grid, triangular, and rectangular end. They found that the line pattern significantly enhanced wettability and wetting rate relative to unstructured electrodes. Hille et al. [25] ablated both NMC 622 cathodes and graphite anodes in a hole pattern and investigated four different full-cell configurations: unstructured/structured anodes assembled with unstructured/structured cathodes. The results showed that ablating only one electrode can still improve the capacity at high C-rates ranging from 2C to 5C, while ablating both electrodes obtained the optimal rate capability.
In a previous study we investigated the impact of different laser-structuring strategies on electrochemical performance of aqueous processed NMC 622 cathodes in half cells [26]. The results indicated that the cells with NMC 622 electrodes structured at 5.0 W exhibited a 10 Ω cm2 lower ionic resistance compared to those using a laser power of 2.5 W. Furthermore, rate capability analyses demonstrated that the cells with 5.0 W structured electrodes had a higher specific discharge capacity relative to those with 2.5 W structured electrodes at 1C and 2C.
So far, no study has directly compared the electrochemical performance of full cells with line-patterned electrodes to those with hole-patterned electrodes. Furthermore, the effects of using different pattern types on the anode and cathode have not yet been explored. In this study, NMC 811 was employed as the cathode active material (CAM) and graphite as the anode active material (AAM). Firstly, to investigate the upscaling of the laser-structuring process, line-patterned electrodes were fabricated using average laser powers of 2.5 W and 5.0 W. The impact of these parameters on electrode morphology and electrochemical performance was analyzed. Coin cells with a full-cell configuration were assembled using a line pattern (either 2.5 W or 5.0 W) or a hole pattern on both anodes and cathodes. Moreover, to elucidate the impact of electrode pattern combinations on electrochemical performance, cathodes and anodes with line or hole patterns were paired alternately in full cells. Four different configurations were investigated: hole (anode)–hole (cathode), line (anode)–line (cathode), hole (anode)–line (cathode) and line (anode)–hole (cathode). Most importantly for this methodology, the areal capacities of laser-structured electrodes with different pattern types were kept similar. The full cells were characterized using rate capability analyses and long-term analyses. In addition, EIS analyses using symmetric cells were applied to investigate the ionic resistance of structured and unstructured NMC 811 cathodes and graphite anodes. Through the presented study, it is possible for the first time to determine the most suitable combination of anodes and cathodes with respect to their individual 3D pattern types to maximize the high rate capability and cycling ability of LIBs.
2. Materials and Methods
2.1. Electrode Preparation
The cathode slurry was prepared using polycrystalline NMC 811 (Gelon, Dongguan, China) with a median diameter (D50) of 9.3 µm as the active material, C-NERGY Super C65 (Imerys G and C, Willebroek, Belgium) and KS6L graphite (Imerys G and C, Bodio, Switzerland) as conductive agents, and polyvinylidene fluoride (PVDF, Solef® 5130, Solvay Specialty Polymers, Brussel, Belgium) as a binder, which was dissolved in N-methyl-2-pyrrolidone (NMP, Merck KGaA, Darmstadt, Germany) solvent with a weight ratio of 1:10 prior to the mixing process. NMC 811, Super C65, and KS6L powders were pre-mixed manually and then added into PVDF solution with a mass ratio of 92:3:2:3 (NMC 811:Super C65:KS6L:PVDF). The slurry was homogenized using a centrifugal mixer (SpeedMixer DAC 150 SP, Hauschild and Co., Hamm, Germany) with rotating speed ranging from 1000 to 3500 rpm for 78 min. The solid content of the cathode slurry was adjusted to 67 wt%.
As for the anode slurry preparation, flake-like graphite (Gelon, Dongguan, China) with a D50 of 17.6 µm was used as the active material, and Super C65 (MTI Corporation, Richmond, CA, USA) was used as the conductive agent. The graphite and conductive agent were mixed with a water-based 1.3 wt% sodium carboxymethyl cellulose (CMC, MTI Corporation, Richmond, CA, USA) solution with the same centrifugal mixer used for the cathode slurry. After 29 min mixing from 1000 to 3500 rpm, styrene butadiene rubber (SBR, 50 wt% solid content, MTI Corporation, Richmond, CA, USA) solution was added and further mixed at low rotational speed (60 s at 1000 rpm) due to the shear-sensitivity of SBR [27]. The mass ratio of each component of the anode slurry was set to graphite:Super C65:Na-CMC:SBR = 94:1.4:1.6:3, and the solid content was set to 45 wt%.
Both cathode and anode slurries were coated onto current collectors using a doctor blade ZUA 2000.100 (Proceq, Schwerzenbach, Switzerland). Cathode slurries were cast onto 20 µm thick aluminum foil, and anode onto copper foil with 9 µm thickness. The current collectors were fixed on a laboratory coater MSK-AFA-L800-LD (MTI Corporation, Richmond, CA, USA) equipped with a vacuum pump. A coating speed of 5 mm s−1 was applied, while the film thickness was adjusted by varying the gap of the doctor blade. The cathode slurries were dried at 90 °C for 2.5 h, while the anode slurries were dried at 25 °C for 2.5 h. Subsequently, the electrodes were calendered using an electric calendering machine MSK-2150 (MTI Corporation, Richmond, CA, USA) at 25 °C with a constant feeding speed of 35 mm s−1. The porosity of cathodes and anodes were adjusted to 35% and 40%, respectively. The porosity values of the anode and cathode were determined by weighing the samples and then calculated using the weight percentage and density of each component as described in detail elsewhere [28].
2.2. Laser Structuring of Electrodes
A pulsed fiber laser (Tangerine, Amplitude Systèmes, Pessac, France) operating at a wavelength of 515 nm with a maximum average power of 12 W and a pulse duration of 380 fs was employed for the structuring and cutting of NMC 811 cathodes and graphite anodes. A beam expanding telescope (Sill Optics GmbH, Wendelstein, Germany) with 4 times magnification was used to expand the laser beam, while a galvo-scanner (rhothor™, Newson NV., Dendermonde, Belgium) and an f-theta lens (Sill Optics GmbH, Wendelstein, Germany) with a scan area of 90 × 90 mm2 were applied to deflect and focus the laser beam, respectively. The laser and optical components were integrated in a micromachining system (PS450-TO, OPTEC S.A., Frameries, Belgium). The laser beam diameter at the focus plane was 29 µm.
This study investigated the impact of average laser power and different patterns on the electrochemical performance of the batteries. The mass loss of the laser-structured electrodes was maintained at comparable levels at different laser powers or pattern types by adjusting the pitch accordingly. Scanning electron microscopy (Phenom XL G2 Desktop, Thermo Fisher Scientific Inc., Schwerte, Germany) and cross-sectional analyses were performed to identify the suitable laser parameters. The applied laser parameters for electrodes with different pattern types are shown in Table 1. The laser burst times were adjusted to achieve percussion drilling of holes in cathodes and anodes without affecting the current collector. The holes were arranged in equilateral triangles with side lengths shown in Table 1. The laser scan speed for line structuring was kept constant at 500 mm s−1, while the laser repetition rate was 500 kHz and the average laser power was set to 2.5 W or 5.0 W. Graphite anodes and NMC 811 cathodes were cut into circular samples with diameters of 15 mm and 12 mm, respectively. All laser structuring and cutting processes were performed in ambient air.
Table 1.
Laser-structuring parameters for NMC 811 cathodes and graphite anodes used in cells.
2.3. Cell Assembly and Electrochemical Analyses
After laser cutting, graphite anodes and NMC 811 cathodes were dried at 100 °C and 120 °C in a vacuum oven (VT6025, Thermo Scientific, Germany) for 24 h, respectively. All 2032-type coin cell assemblies were carried out inside an argon-filled glove box LAB master pro sp (M. Braun, Garching, Germany) with H2O < 0.1 ppm and O2 < 0.1 ppm. Cells with unstructured electrodes served as the reference, while laser-structured electrodes produced using different laser parameters and pattern types were cross-combined and the details are summarized in Table 2. In cells A1, A2, and A3, the same type of laser-generated pattern was created on both cathodes and anodes, while in cells B1 and B2, hole and line patterns were generated on different electrode sides to investigate the impact of distinct electrode laser pattern types on the electrochemical performance at full-cell level. In addition, symmetric cells consisting of two identical electrodes with a diameter of 15 mm were prepared. A 25 µm thick polypropylene (PP) Celgard 2500 separator sheet (MTI Corporation, Richmond, CA, USA) was placed between electrodes. Each cell was filled with 120 µL electrolyte (Solvionic, Toulouse, France), which consisted of 1.3 M LiPF6 in ethylene carbonate (EC) and ethyl methyl carbonate (EMC) with EC:EMC = 3:7 (mass ratio) plus 5 wt% fluoroethylene carbonate (FEC) as an additive. An electric crimper MSK-160E (MTI Corporation, Richmond, CA, USA) was applied to press all of the cell components together and to seal the cells. Afterwards, full cells as well as symmetric cells were stored at 20 °C for 20 h to ensure a homogeneous wetting of separator and electrodes with the liquid electrolyte.
Table 2.
Six configurations of full cells with NMC 811 cathodes and graphite anodes. The pitches used for different electrode types are given in Table 1.
Rate capability analyses were performed using a battery cycler BT2000 (Arbin Instruments, College Station, TX, USA). C-rate describes the discharge or charge current relative to the battery’s nominal capacity [29]. A C-rate of 2C means the battery will be fully charged or discharged in half an hour. Full cells were charged using a constant current–constant voltage (CCCV) protocol and discharged using a constant current (CC) protocol at various C-rates within a voltage window of 2.8–4.2 V. Initially, three cycles were carried out at C/20 with a C/40 cutoff current during the CV phase as a formation step to electrochemically activate the cell and to form a protective solid electrolyte interphase (SEI), thereby ensuring the stable long-term performance and safety of the batteries [30].
To evaluate charge or discharge rate performance separately and to identify the onset of lithium plating on anodes, the CCCV protocol was implemented combining symmetric and asymmetric charge/discharge processes, as summarized in Table 3. In the symmetric charge/discharge process (termed as “S”), cells were charged and discharged at identical C-rates. In the asymmetric charge/discharge process (termed as “AS”), the cells were charged at varying C-rates (1C–7C) but discharged at a constant C-rate of C/5. For both processes, a 15 min rest period was applied between each charge and discharge step, as well as between each two cycles. Rate capability analyses were conducted as follows. From C/10 to C/2, cells were cycled for five cycles at each rate using the symmetric charge/discharge process. At 1C to 7C, cells were cycled at first for five cycles using the asymmetric process, followed by five cycles using the symmetric process at each rate. To specifically evaluate fast-charging performance and detect the onset of lithium plating, during the fifth cycle at C/10, 1C, 2C, 3C, 5C, and 7C, the CV phase was limited to 15 min instead of a cutoff current, followed by a 4 h rest for voltage relaxation analyses. Finally, five cycles at C/5 were carried out to determine a possible capacity loss after cycling at high current densities. After rate capability analyses, full cells were then cycled at C/2 to study their long-term cycling stability.
Table 3.
CCCV protocol of the rate capability analyses applied for all full cells. (“S” represents a symmetric charge/discharge process, while “AS” indicates an asymmetric charge/discharge process).
Furthermore, EIS analyses were carried out on symmetric cells using a battery cycling system BCS-810 (Biologic, Seyssinet, France) to determine the ionic resistance. The frequency range was set from 10 mHz to 10 kHz with a voltage amplitude of 10 mV. The EIS data were fitted using the software ZView 4 (Version 4.0i, Scribner Associates, Inc., Southern Pines, NC, USA).
3. Results and Discussion
3.1. Electrode and Laser-Structuring Parameters
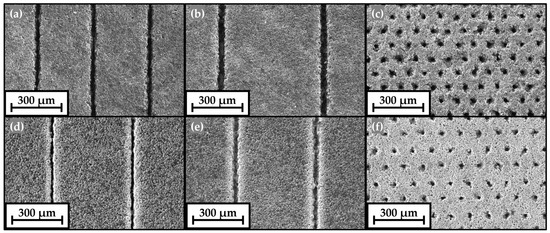
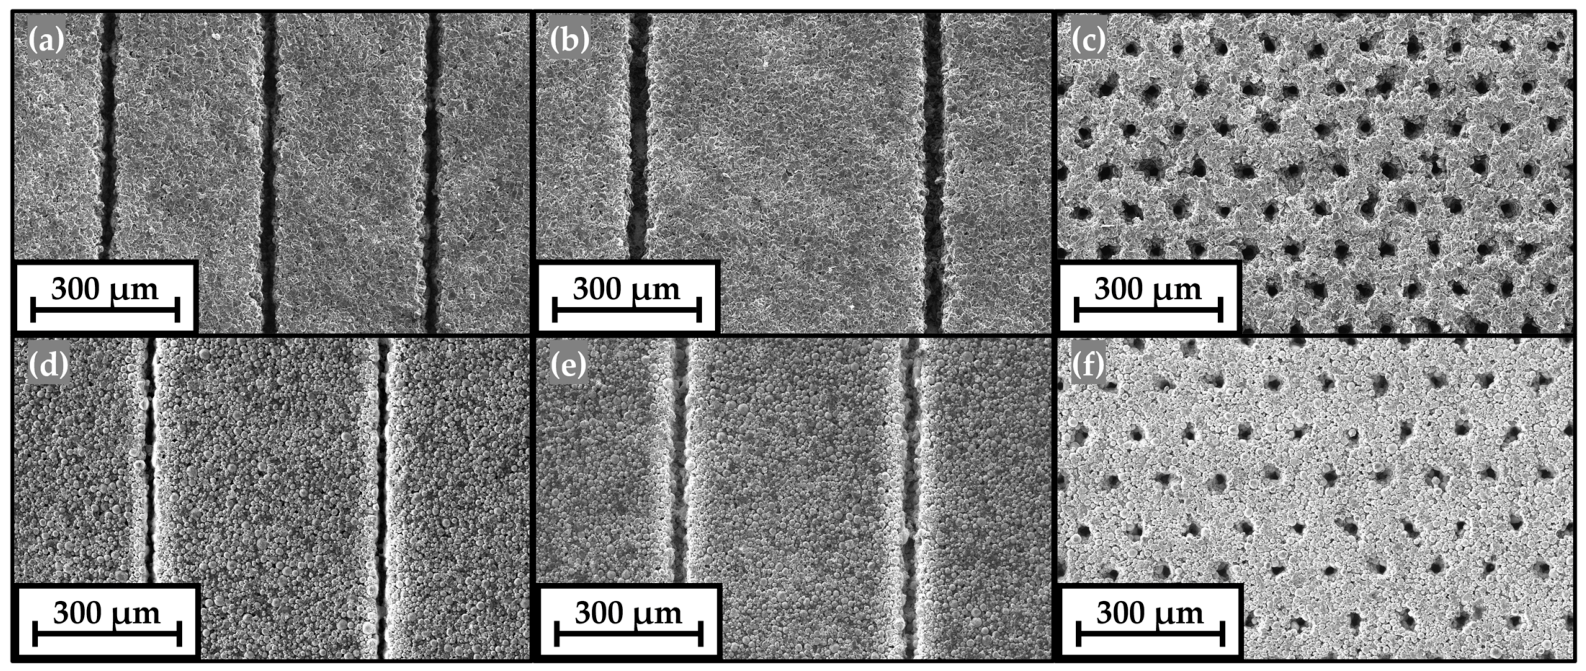
The top-view SEM images of laser-structured electrodes using different laser processing strategies are shown in Figure 1. No cracks or residual debris were observed on the laser-structured electrode surfaces or groove sidewalls after laser structuring. Figure 1a,b show line-patterned anodes fabricated using average laser powers of 2.5 W and 5.0 W, respectively. The maximum groove width of lines generated on anodes using 5 W (“Line 5.0 W”) was 64% wider than the groove width of lines generated using 2.5 W (“Line 2.5 W”), as shown in Table S1 and Figure S1a,b, indicating that the ablation volume increases with increasing average laser power. Figure 1d,e show the “Line 2.5 W” and “Line 5.0 W” cathodes, respectively. The maximum groove width in “Line 5.0 W” cathodes was 38% wider than that in “Line 2.5 W” cathodes, which are shown in Table S1 and Figure S1c,d. It is noteworthy that as the average laser power increased, the ablation volume (depth and width) in graphite anodes increased significantly faster than that in NMC 811 cathodes. Only less than 1/3 of the laser scan passes were needed to achieve the same ablation depth in graphite anodes when the average laser power was increased from 2.5 W to 5.0 W, while exactly half of the laser scan passes were required for the ablation of NMC 811 cathodes when the average laser power was doubled.
Figure 1.
Top-view SEM images of laser-structured graphite anodes (a) Line 2.5 W, (b) Line 5.0 W, and (c) Hole 5.0 W; and laser-structured NMC 811 cathodes (d) Line 2.5 W, (e) Line 5.0 W, and (f) Hole 5.0 W.
In Figure 1a,b, the active material near to the channel retained its flake-like structure, resulting in a clearly defined channel. In Figure 1d,e, several spherical active material particles near to the channel appeared to have been partially cut through by laser ablation. In addition, the local removal of the binder exposed the surface of the active material, leading to well-defined channels and porous sidewalls. Furthermore, no obvious melt formations were observed in either graphite anodes or NMC 811 cathodes.
Table 4 summarizes the active mass loading, areal capacity, mass loss, and areal processing rate of laser-structured electrodes with different pattern types. The unstructured graphite anodes exhibited an areal capacity of about 4.37 mAh cm−2, while the unstructured NMC 811 cathodes had an areal capacity of about 3.97 mAh cm−2. Mass loss was determined by the pattern type, pitch (line patterns), and structural dimensions (hole patterns), with laser parameters optimized accordingly [14]. For economic feasibility, the mass loss is targeted to be kept below 10%—particularly for cathodes, which dominate the overall cell cost [31]. In addition, to maintain a similar cell balancing factor of around 1.1, comparable mass losses in anodes and cathodes were required. Cathodes exhibited mass losses of 4.6–5.3%, while anodes showed mass losses of 4.8–5.5%. In addition, the areal loadings of structured electrodes with different laser strategies (various laser powers and generated patterns) were kept comparable to ensure electrochemical performance evaluation under similar current densities. Table 4 also presents the processing rates of electrodes using various laser strategies. Processing rate here refers to the effective electrode area modified per unit time, reflecting the efficiency of the material removal process under given conditions. They were obtained by taking the reciprocal of the actual time required to process a 1 cm2 sample using different laser parameters. The realistic processing times were recorded by the laser processing software (ProcessPower, version 3.9.1, OPTEC S.A., Frameries, Belgium). Compared to the hole pattern, the line pattern exhibited an order-of-magnitude higher processing efficiency using the same average laser power. In addition, the processing rate increased with increasing laser power.
Table 4.
Active mass loading, areal capacity, mass loss and areal processing rate for different types of laser-structured electrodes.
3.2. Symmetric Cells and EIS Analyses
Unstructured, “Line 2.5 W”, “Line 5 W”, and “Hole” electrodes were assembled in symmetric cells, respectively. The symmetric cells are under a blocking condition, where faradaic processes are suppressed, enabling evaluation of the ionic resistivity of porous electrodes [32]. Blocking conditions can be achieved using non-intercalating electrolyte salts or, in the case of lithium salt electrolytes, by setting the electrodes to a state of charge (SOC) of 0% or 100%, where lithium intercalation/deintercalation is suppressed [32,33]. The equivalent circuit used for fitting impedance data consists of a resistor and a generalized finite Warburg element. The generalized finite Warburg element is used to fit the lithium diffusion in porous electrodes, while the resistor presents the ionic resistances in the pores in electrodes [34]. The describes the impedance caused by mass transfer, as shown in Equation (1) [35]:
where [Ω] represents the polarization resistance of mass transport, is a constant usually between 0 and 0.5, and [s] is defined as ( [cm] the effective diffusion thickness and [cm2 s−1] the effective diffusion coefficient of lithium) [36]. The areal normalized ionic pore resistance [Ω cm2] (termed further as “ionic resistance” in the work) is given in Equation (2) [37].
where [Ω] is the resistance obtained originally from EIS analyses, [cm2] the total electrode area (a circle area with a diameter of 15 mm), [-] the electrode tortuosity, [cm] the electrode thickness, [-] the electrode porosity, and [S cm−1 or Ω−1 cm−1] the conductivity of the electrolyte.
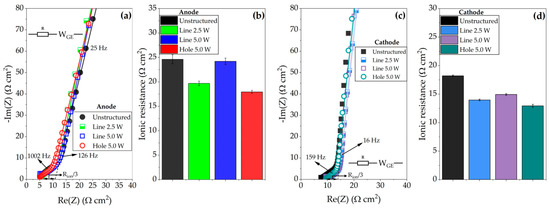
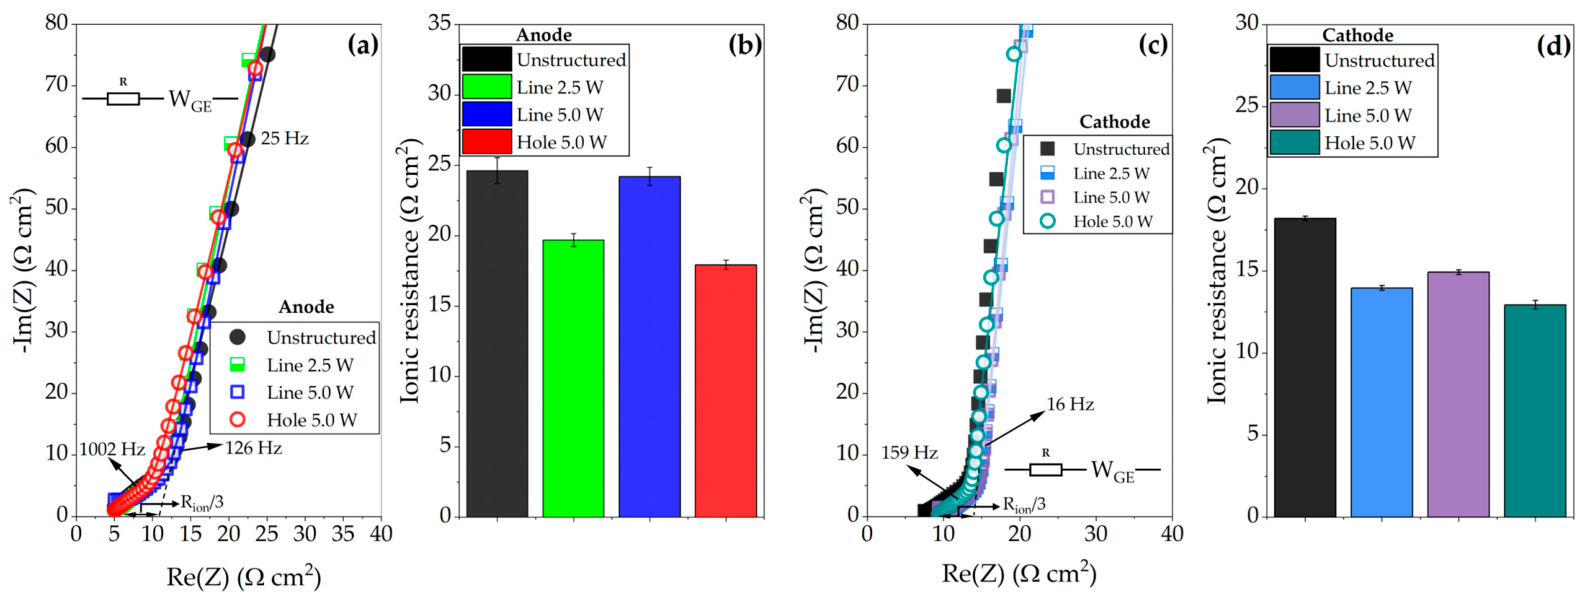
The EIS data obtained from the symmetric cells were fitted to the equivalent circuit shown in Figure 2a,c. The ionic resistance is calculated by dividing the resistance obtained from fitting in EIS analyses by the total electrode area (a circle with a diameter of 15 mm). The unstructured electrodes exhibited the highest ionic resistance, with values of 24.6 ± 0.9 Ω cm2 for anodes and 18.2 ± 0.1 Ω cm2 for cathodes (Figure 2b,c). “Line 2.5 W” anodes exhibited 20% lower ionic resistance (19.7 ± 0.5 Ω cm2) than “Line 5.0 W” anodes (24.2 ± 0.6 Ω cm2), while anodes with a hole pattern showed a slightly lower ionic resistance of 17.9 ± 0.3 Ω cm2. A similar trend is observed for cathodes, where “Hole” cathodes exhibited the lowest ionic resistance of 12.9 ± 0.3 Ω cm2 compared to other structured cathodes. “Line 2.5 W” cathodes showed 0.9 Ω cm2 lower ionic resistance than “Line 5.0 W” cathodes (14.9 ± 0.1 Ω cm2). Our results show that all investigated structured electrodes, either anodes or cathodes, exhibited lower ionic resistance compared to the unstructured electrodes.
Figure 2.
Nyquist plot of (a,c) EIS spectra (points) and corresponding fitted curves (lines) of the symmetric cells and (b,d) the ionic resistance of different types of electrodes.
Hille et al. [25] reported that, after laser structuring with hole patterns, the ionic resistance of graphite anodes (~3.5 mAh cm−2) decreased by approximately 44.9%. Furthermore, similar to our results, Sterzl et al. [14] also observed that graphite anodes (~4.3 mAh cm−2) with a hole pattern exhibited the lowest ionic resistance in contrast to electrodes with a grid or line structure.
3.3. Full Cells
3.3.1. Fast-Discharging Capability
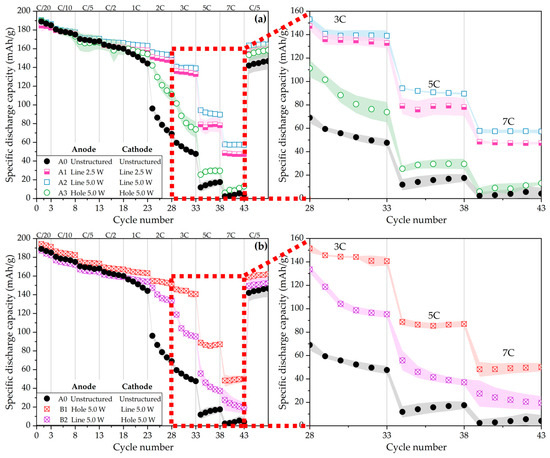
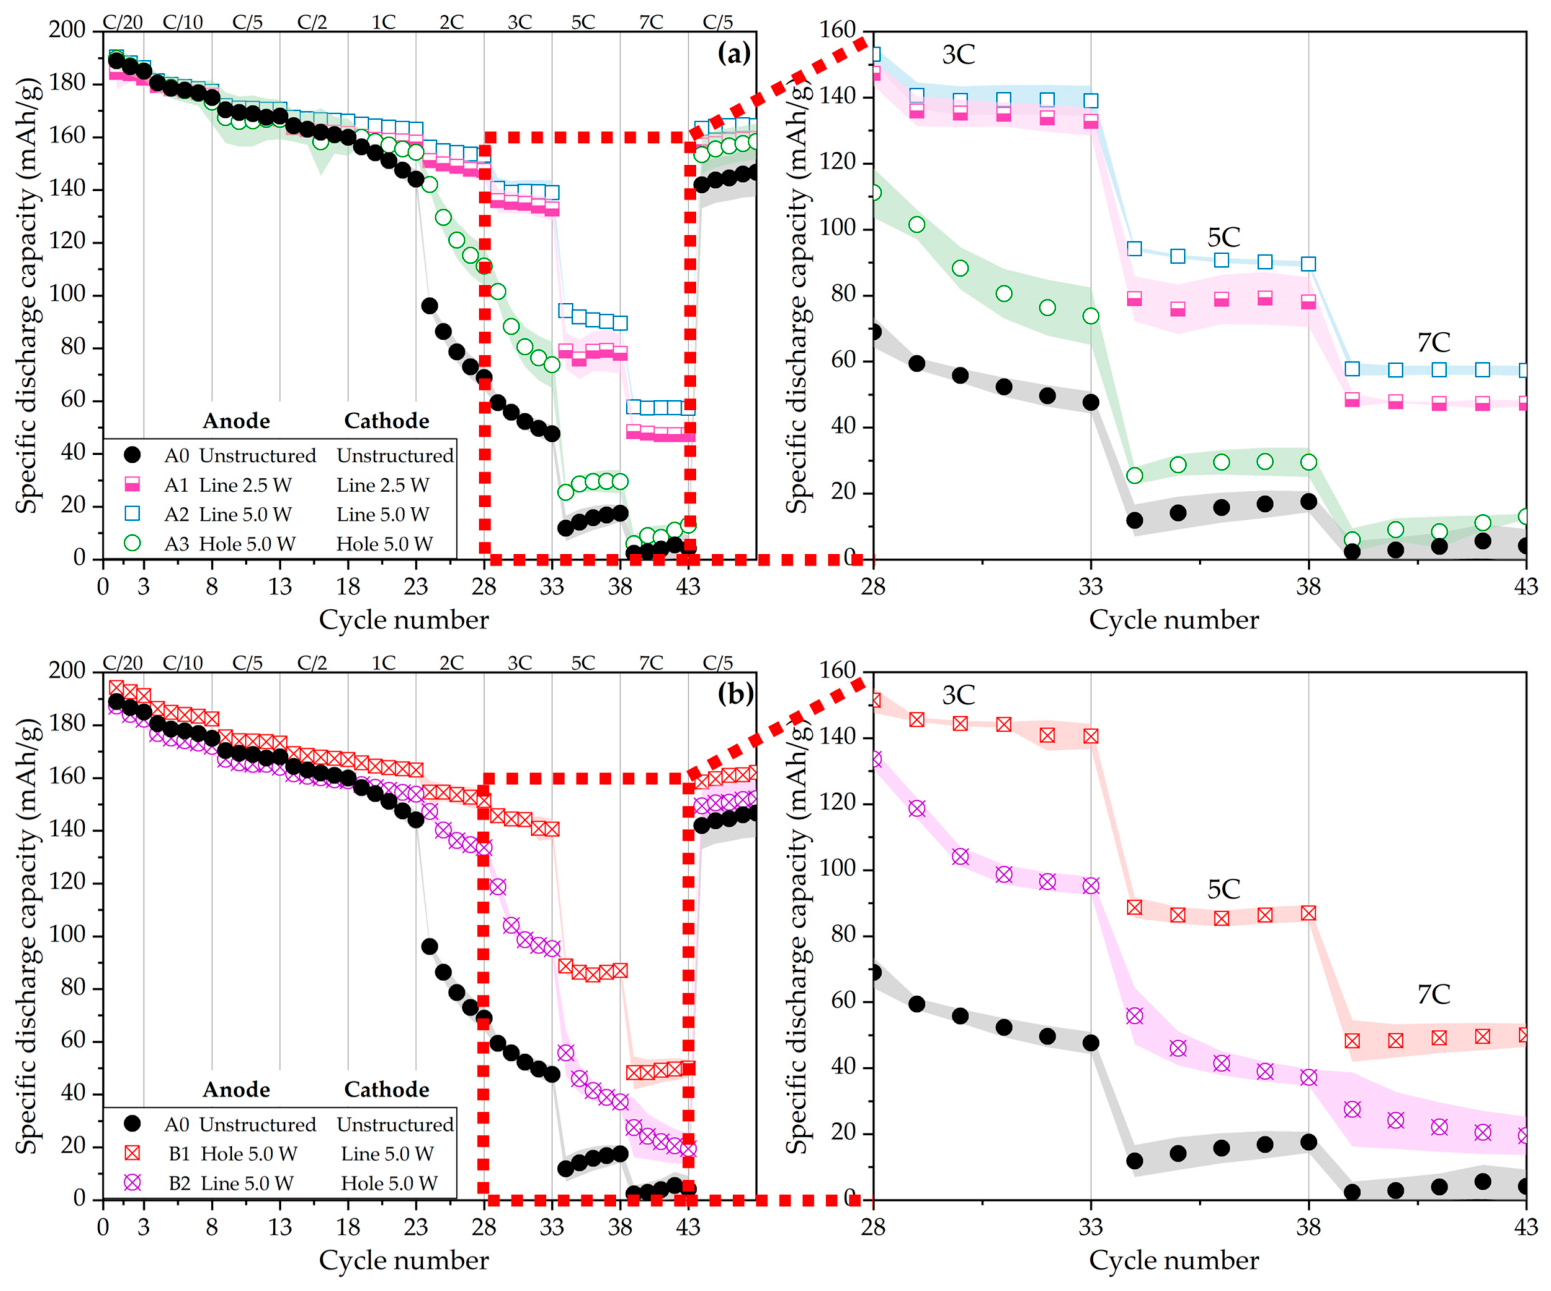
Figure 3 shows the specific discharge capacity of cells with unstructured electrodes and structured electrodes. The data was obtained from a symmetric charge/discharge process. Figure 3a shows the C-rate analyses of full cells with identical patterns on anodes and cathodes, namely A0–A3 cells. During the formation step (C-rate at C/20), all cells exhibited similar specific discharge capacities of 185–190 mAh g−1. As the C-rate increased from C/10 to C/2, A2 cells consistently showed the highest specific capacities, while the other cells displayed nearly identical values. From 1C to 2C, the reference A0 cells experienced a significant decrease in capacity, dropping from 156 mAh g−1 to 69 mAh g−1. In contrast, A1 and A2 cells maintained higher capacities than A3 cells. At 2C, the specific capacities of A2 and A3 cells were 153 mAh g−1 and 111 mAh g−1, respectively. At high C-rates from 3C to 7C, the reference A0 cells consistently exhibited the lowest specific capacity, whereas the cells with line-patterned electrodes outperformed those with hole-patterned electrodes. Moreover, the cells with “Line 5.0 W” electrodes achieved the highest rate performance. Even at 7C, where A0 and A3 cells had nearly lost all their capacities, A1 and A2 cells still retained 47 mAh g−1 and 57 mAh g−1, respectively.
Figure 3.
Rate capability analyses of full cells with unstructured and laser-structured electrodes using a symmetric charge/discharge process. The shading regions represent the range of standard deviation, calculated from three cells of the same cell configuration. In (a) only cells containing electrodes with the same type of pattern are displayed, whereas in (b), B1 and B2 cells containing electrodes with different types of pattern types are shown in comparison to other cells.
Figure 3b shows the rate capability of the cells with different pattern combinations on anodes and cathodes, namely B1 and B2 cells. B1 and A2 cells both had the “Line 5 W”-structured cathodes but differed in anodes. They showed almost the same discharge capacity during the rate analyses, only A2 cells exhibited 8 mAh g−1 higher capacity than B1 cells at 7C. Meanwhile, B2 and A3 cells had the “Hole 5.0 W” NMC 811 cathodes but different anodes. B2 cells demonstrated significantly higher discharge capacities than A3 cells at high current densities (2C–7C). Moreover, B1 cells delivered higher discharge capacities than B2 cells from 1C to 7C. This difference reflects their respective anode/cathode design: B1 cells have line-patterned cathodes, whereas B2 cells contain hole-patterned cathodes. These results indicate that the configuration using a line-patterned cathode is more suitable for high power applications that require fast discharging.
Although hole-patterned electrodes exhibited a lower ionic resistance obtained from symmetric cells under EIS measurement than line-patterned electrodes, the full cells with line-patterned electrodes generally exhibited a better rate capability than cells with hole-patterned electrodes. In full cells, electrochemical performance is governed by multiple factors beyond ionic resistance, including charge-transfer resistance, electrolyte wettability and retention, interfacial stability, and local current distribution [38,39,40,41,42]. Line-patterned electrodes likely benefit from more continuous electrolyte pathways, which likely enhance electrolyte uptake and retention within the electrode. This may promote a more uniform local current distribution across the electrodes compared to the isolated regions in the hole-patterned electrodes, which may therefore mitigate localized polarization and prevent local volume expansion. The difference in charge-transfer resistance among full cells with different pattern combinations remains unclear in this research, but it may also play an important role and warrants further investigation. Even though the “Line 5.0 W” electrodes did not exhibit the lowest ionic resistance among the laser-structured electrodes, their structural characteristics may promote improved electrolyte transport and more stable solid-electrolyte interfaces.
3.3.2. Voltage Profile During Charge and Discharge at Different C-Rates
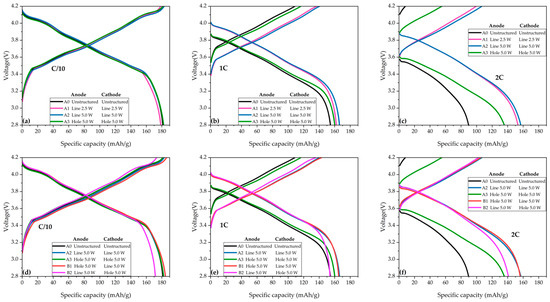
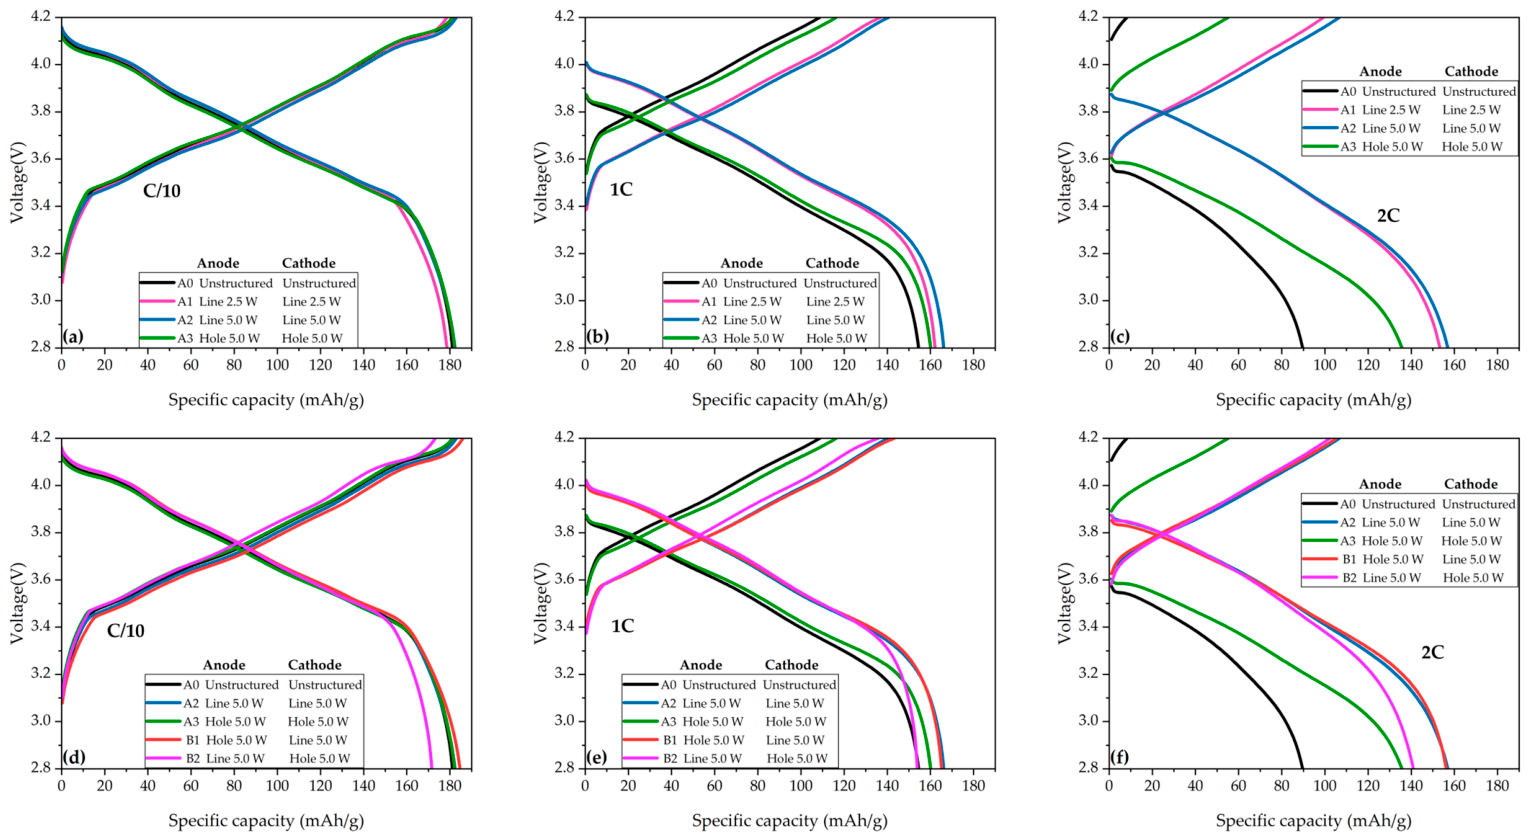
By analyzing the voltage curves at different C-rates as shown in Figure 4, the causes of the capacity loss at different C-rates can be elucidated. All cells reached a discharge capacity of about 180 mAh g−1 at a low C-rate (C/10) as shown in Figure 4a. However, the capacity decreased strongly as the C-rate increased. Starting from 1C, A0 and A3 cells began to exhibit higher cell polarization with lower curves compared to those with line-patterned electrodes (Figure 4b). At 2C, an increased overpotential and larger polarization can be observed for A0 and A3 cells in Figure 4c. The IR drop increased with increasing current density. For A0 cells, the IR drop rose from 0.06 V at C/10 to 0.6 V at 2C, and A3 cells showed a similar trend and comparable IR drop values. In contrast, A1 and A2 cells exhibited a smaller increase, from 0.04 V at C/10 to 0.3 Vat 2C. The impedance quantity Ri can be calculated by dividing the IR drop value by the applied current [43]. The Ri of A0 and A3 cells is 75 Ω, while A1 and A2 cells have an Ri of 41 Ω and 40 Ω, respectively. Cells with line-patterned electrodes showed smaller cell resistance than those with hole-patterned electrodes. Interestingly, B2 cells with hole-patterned cathode and line-patterned anode exhibited a lower discharge capacity at C/10 (Figure 4d) than other cells and a similar discharge capacity as the reference A0 cell at 1C as shown in Figure 4e. This indicates that at low C-rates ≤ 1C, using a line pattern on the anode and a hole pattern on the cathode results in an anti-synergistic effect. Especially when B2 cells were discharged below 3.4 V, a sudden increase in overpotential was observed at both C/10 and 1C. Conversely, using a line pattern on the cathode and a hole pattern on the anode leads to minimal cell polarization. Cells with this configuration (B1) reached similar maximum discharge capacity as those A2 cells with a line pattern on both electrodes, as shown in Figure 4d–f, while B1 cells had a higher overpotential than B2 at 2C. B1 and B2 cells showed a voltage drop of 0.35 V and 0.33 V, respectively, corresponding to Ri values of 43 Ω and 42 Ω at 2C. These values were between those of A0/A3 cells and A1/A2 cells.
Figure 4.
Voltage profiles (a–c) during charge and discharge of A0, A1, A2, and A3 cells at C/2, 1C, and 2C. Voltage profiles (d–f) of A0, A1, A2, B1, and B2 cells at C/2, 1C, and 2C. All data was obtained from the second cycle at each C-rate in Figure 3.
In summary, when the anode and cathode have the same pattern, cells with line-patterned electrodes have a lower overpotential than those with hole-patterned electrodes, especially when discharged at high currents. For cells with different pattern combinations on the anode and cathode, the implementation of a line pattern on the cathode can greatly reduce the cell polarization and enhance the discharge capacity compared to cells with a hole pattern on the cathode.
3.3.3. Fast-Charging Capability
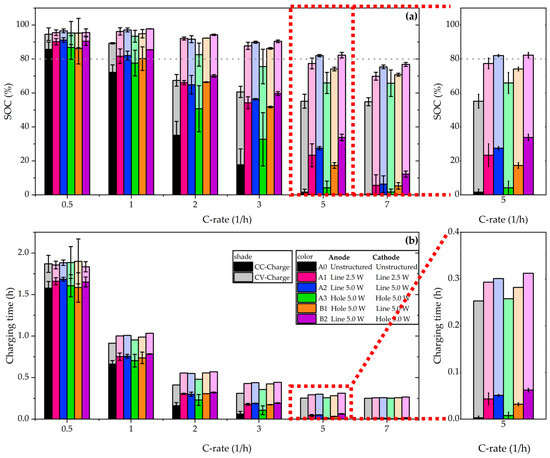
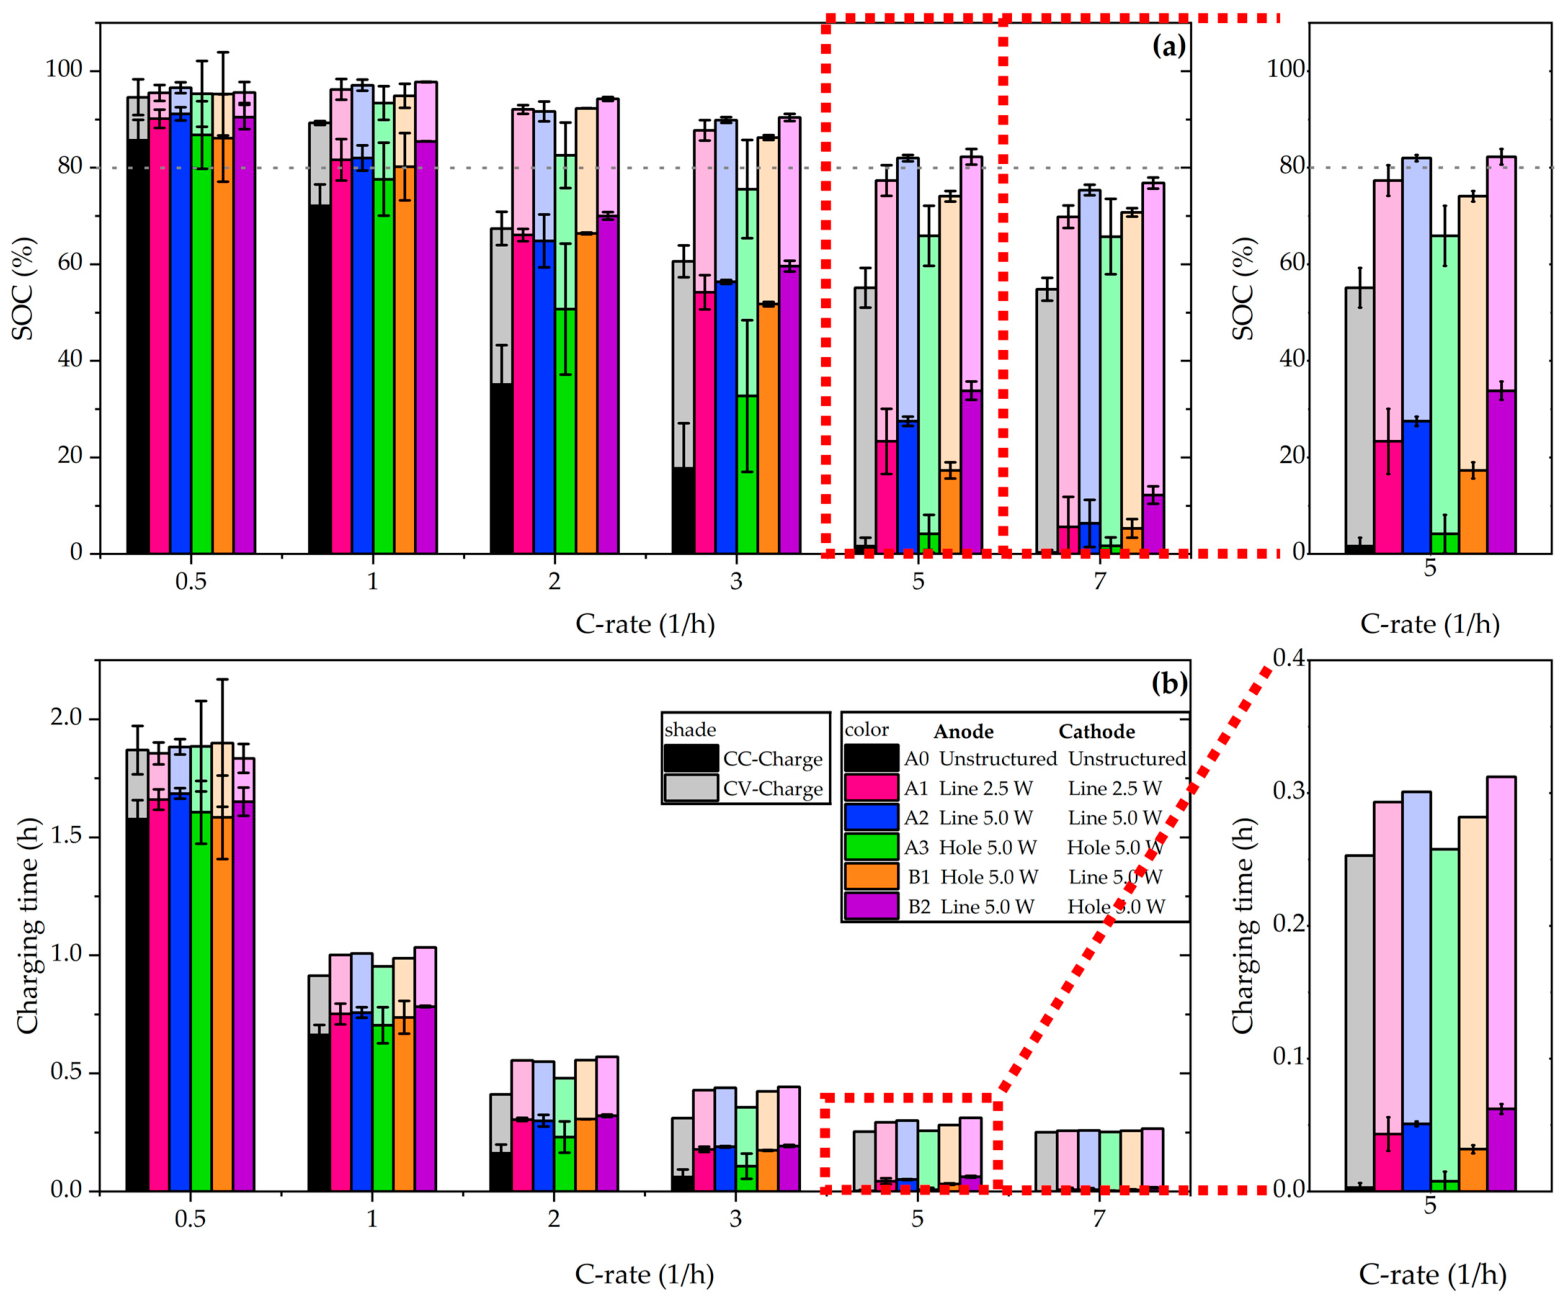
In the following, it will be evaluated how different cell configurations may affect the charging process. SOC is the maximum achievable capacity at currently applied C-rates divided by the initial maximum achievable capacity. In this work, the maximum capacity is calculated as the mean value derived from the five cycles at C/5. Figure 5a shows the SOC of cells during the CC phase and CV phase, and Figure 5b shows the corresponding charging time. The data was obtained from the fifth cycle at various C-rates, with each cell configuration comprising at least two cells. To detect the onset of lithium plating, the CV phase was limited to 15 min instead of a current limit. Furthermore, the U.S. Advanced Battery Consortium (US-ABC) targeted charging to 80% SOC in 15 min (equivalent to a 4C rate) [44]. Therefore, a dashed line of 80% SOC was used as a reference.
Figure 5.
Analyses of (a) the SOC after CCCV charging and (b) the corresponding charging time as a function of C-rate from the asymmetric charge/discharge processes. The standard deviation was calculated from at least two cells with the same cell configuration. The bars with deep colors represent the capacity (charging time) of cells from the CC-charge phase, while the bars with light colors belong to the contribution from the CV-charge phase.
At a low C-rate (C/5), all cells achieved an SOC of 80% during the CC phase. With increasing C-rate, the total SOC gradually decreased. Moreover, higher C-rates resulted in a larger proportion of capacity contributed by the CV phase. For example, at 1C, the reference A0 and A3 cells reached an SOC of 80% due to the CV phase. At 2C, the reference A0 cells could no longer reach an SOC of 80%, while the cells with laser-structured electrodes reached this, but only A3 cells obtained a larger portion of the total capacity from the CV phase. It is worth noting that the cells with line-structured electrodes, whether on the anode side or cathode side, exhibited a higher SOC than those with only hole-patterned electrodes. At 3C, A3 cells could no longer reach an SOC of 80%. At 5C, only A2 and B2 cells can reach an SOC of 80%, both of which had a “Line 5.0 W” anode. The time required to reach 80% SOC was 18 min for A2 cells and 19 min for B2 cells. Laser structuring enhanced the CC/CV ratio, significantly shortening the required time to reach the same SOC. For example, A0 cells required 55 min to reach 90% SOC, whereas A3 cells achieved the same SOC in 26 min. For cells with an identical pattern on the anode and cathode, cells with line-patterned electrodes were charged faster than cells with hole-patterned electrodes; moreover, cells with “Line 5.0 W” anodes exhibited better fast-charging capability than those with “Line 2.5 W” anodes. For cells with different patterns on the anode and cathode, whether line patterned on the anode or cathode, they exhibited reduced charging time compared to those with a “Hole 5.0 W” anode/cathode.
3.3.4. Voltage Relaxation and Lithium Plating
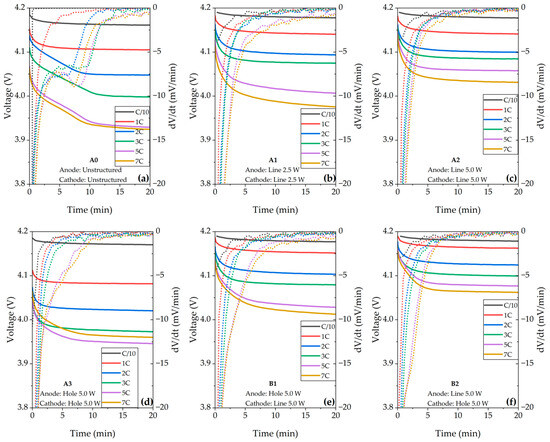
Fast charging can induce the deposition of metallic lithium on the graphite surface, a phenomenon usually referred to as “lithium plating” [45]. The deposited lithium may partially react with the electrolyte to form a passivation layer, thereby causing capacity loss of cells [46,47]. In severe cases, dendritic growth may eventually pierce the separator, resulting in short circuits and thermal runaway [48]. Lithium plating is a partially reversible process, wherein plated lithium can dissolve and re-intercalate into the anode [49]. Differential voltage analysis (DVA) is utilized as an easy-to-apply method to detect the onset of lithium plating and is used in this work to investigate the effects of laser structuring on fast-charging capability [50]. The time required to reach a peak in dV/dt serves as an indicator of the extent of lithium plating [51]. A longer re-intercalation period indicates that a greater amount of lithium was plated during charging.
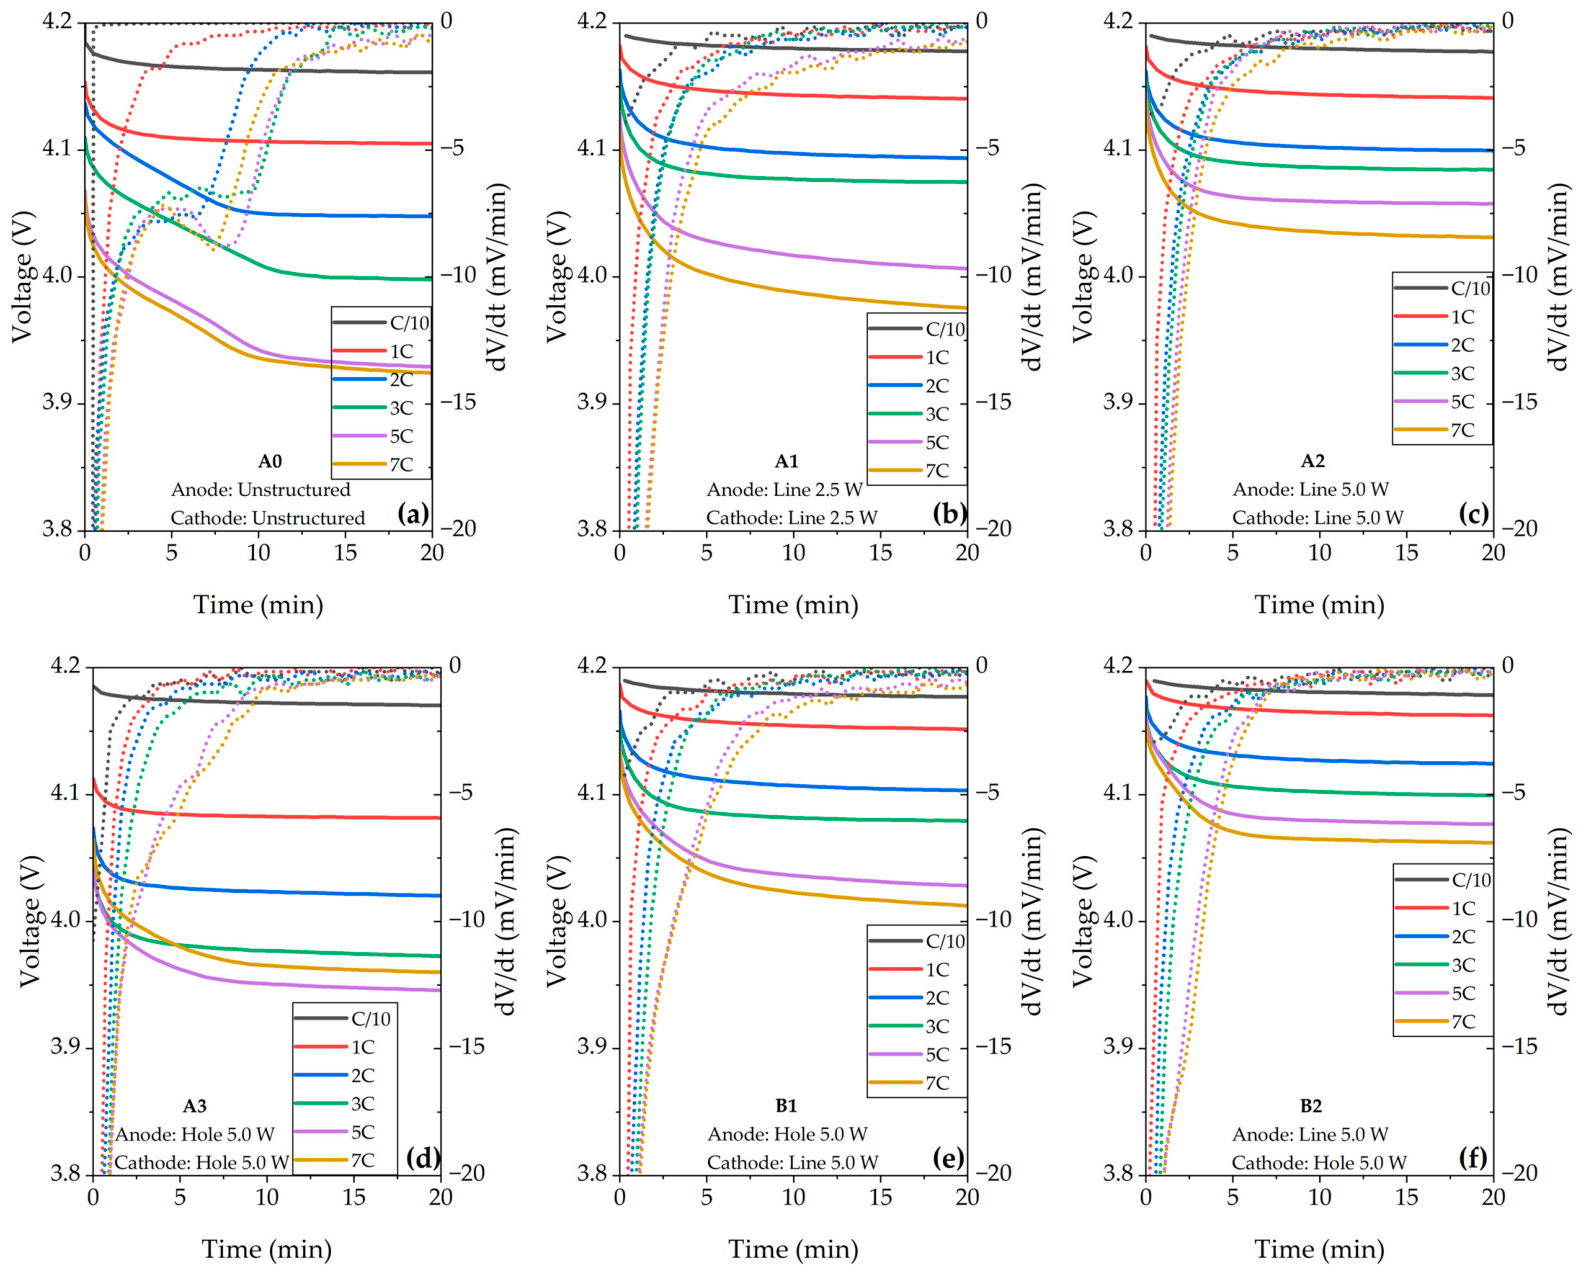
In Figure 6a, for the reference A0 cell, the onset of lithium plating occurred at 2C–7C, as indicated by the peaks in the dV/dt curve (dash lines) and voltage plateau in voltage relaxation (solid lines). This behavior aligns with the significantly capacity fading at 2C shown in Figure 3, where A0 cells also failed to reach 80% SOC at 2C. For the cells with the same line patterns on the anode and cathode (A1 and A2), there was no distinct local minimum observed in the differential curves at any C-rate, but a noticeable mitigation of voltage drop was observed. Furthermore, A2 cells having electrodes with wider groove structures showed the lowest voltage drop in comparison to A0 and A1 cells at C-rates above 1C. In contrast, A3 cells exhibited an inflection point in the differential curves at 5C and 7C, which could be attributed to lithium plating. As for B1 and B2 cells, lithium plating could appear at 5C and 7C. B1 cells exhibited a larger voltage drop than B2 cells, which can be attributed to the use of a hole-patterned anode in B1 compared to the line-patterned anode in B2.
Figure 6.
Voltage relaxation (solid line) and corresponding differential voltage relaxation (dashed line) of cells in six configurations (a–f) adapted from the asymmetric charge/discharge processes during the first 20 min of the 4 h rest period in the fifth cycle at each C-rate.
Other studies have also shown that the application of laser structuring can shift the onset of lithium plating to higher C-rates, for example, from 1C to 3C as reported by Sterzl et al. [14], and from 1C to 2C as reported by Sandherr et al. [52]. In our studies, lithium plating was observed on unstructured electrodes at 2C, while the laser-structured electrodes had not yet reached the critical point. Moreover, no lithium plating was observed for cells with line-patterned electrodes even at 7C. The difference between our studies and other studies is that we applied laser structuring not only on the anodes but also on the cathodes. When the anodes and cathodes are both designed with line patterns, lithium plating can be most effectively suppressed at high charging currents. Therefore, laser structuring can significantly mitigate safety risks at high charging current conditions and extend the lifetime of cells by suppressing lithium plating; moreover, line pattern design is promising for fast-charging applications.
3.3.5. Power Density and Energy Density
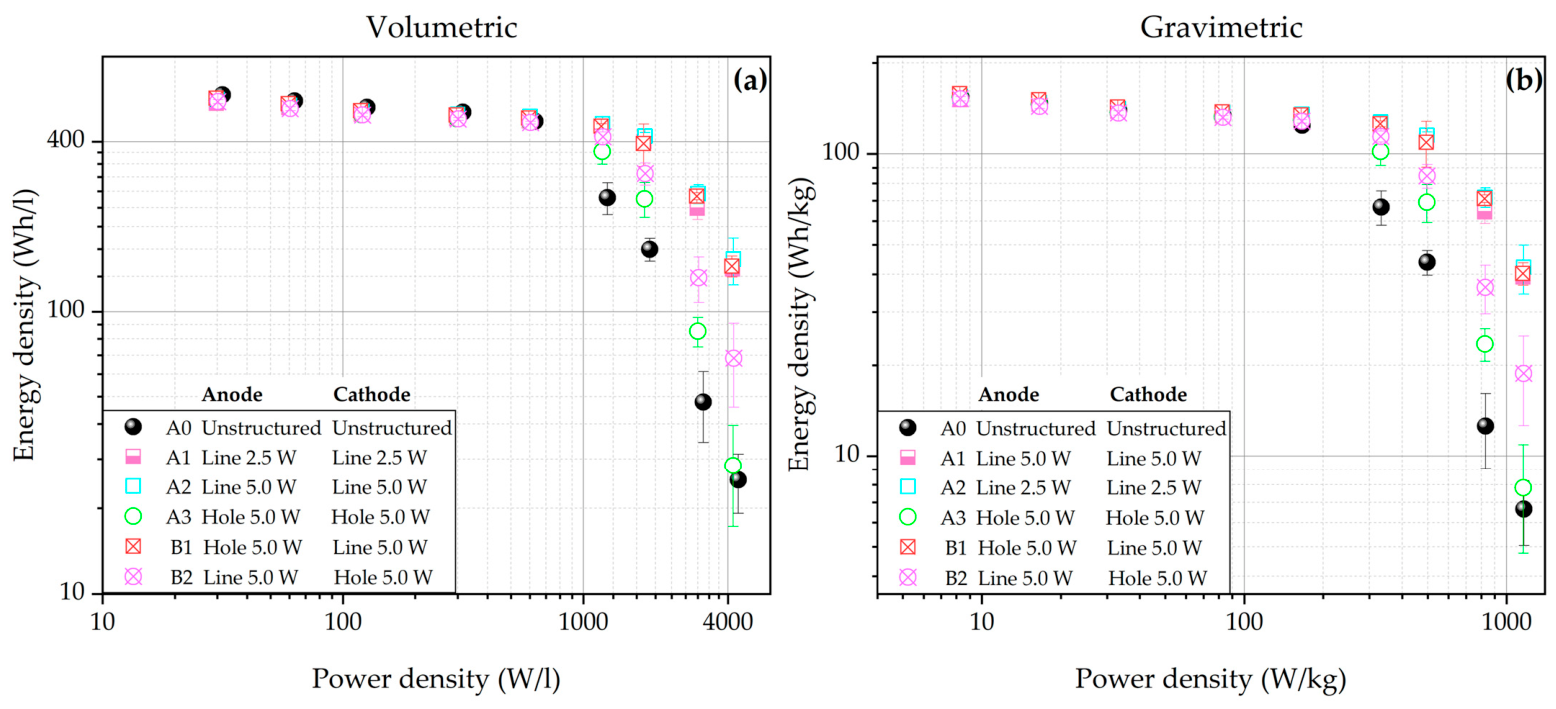
Ragone plots are widely used as a comparative framework for quantitatively analyzing the energy–power relationship of energy storage materials, devices, or systems [53]. Thus, it is applied to reveal the potential of laser structuring to overcome the limitation of current advanced electrode materials. Calculation of the energy density and power density of cells is demonstrated in Appendix A. Furthermore, to achieve Ragone plots that reflect more practical pilot-scale or industrial conditions, the amount of electrolyte for the calculation was determined as 10 mL Ah−1 instead of the redundant electrolyte amount 28 mL Ah−1 (120 µL per coin cell) used in this work [54]. The density of the used electrolyte is 1.06 g cm−3.
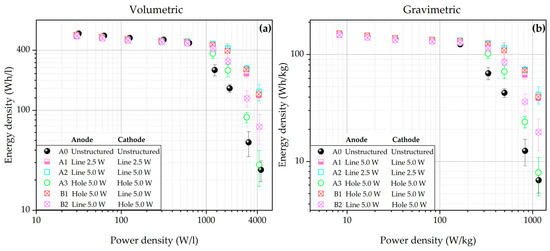
Figure 7a,b show the volumetric and gravimetric Ragone plots of cells in all configurations. At about 30–300 W L−1, the unstructured electrodes retained more active material, resulting in a slightly higher volumetric energy density compared to the structured electrodes (Figure 7a). Although the 3D structures generated by laser processing shorten Li-ion diffusion pathways, they are insufficient to fully compensate for the capacity loss at the cell level. However, in this study mass loss was kept below 6% to reduce the impact on capacity. At about 1200–4400 W L−1 (330–1160 W kg−1), cells with laser-structured electrodes showed a much higher volumetric/gravimetric energy density than the reference cells. For example, at the power density of around 1160 W kg−1, A2 cells exhibited the highest gravimetric energy density, 534% higher than that of the reference cells. The gravimetric energy density of A1 and B1 cells was 489% and 505%, respectively, higher than that of the reference cells. In comparison, the gravimetric energy density of A3 and B2 cells was only 18% and 183%, respectively, higher than that of the reference cells.
Figure 7.
Ragone plots showing (a) the volumetric and (b) gravimetric energy density as a function of the power density of full cells with six types of configuration.
3.3.6. Cycling Stability and Post-Mortem Analysis
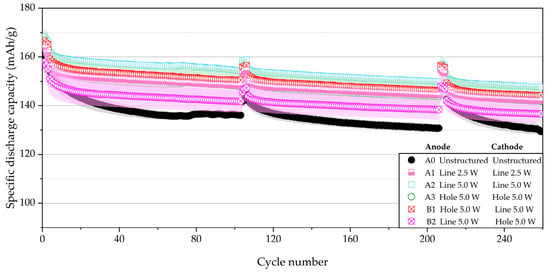
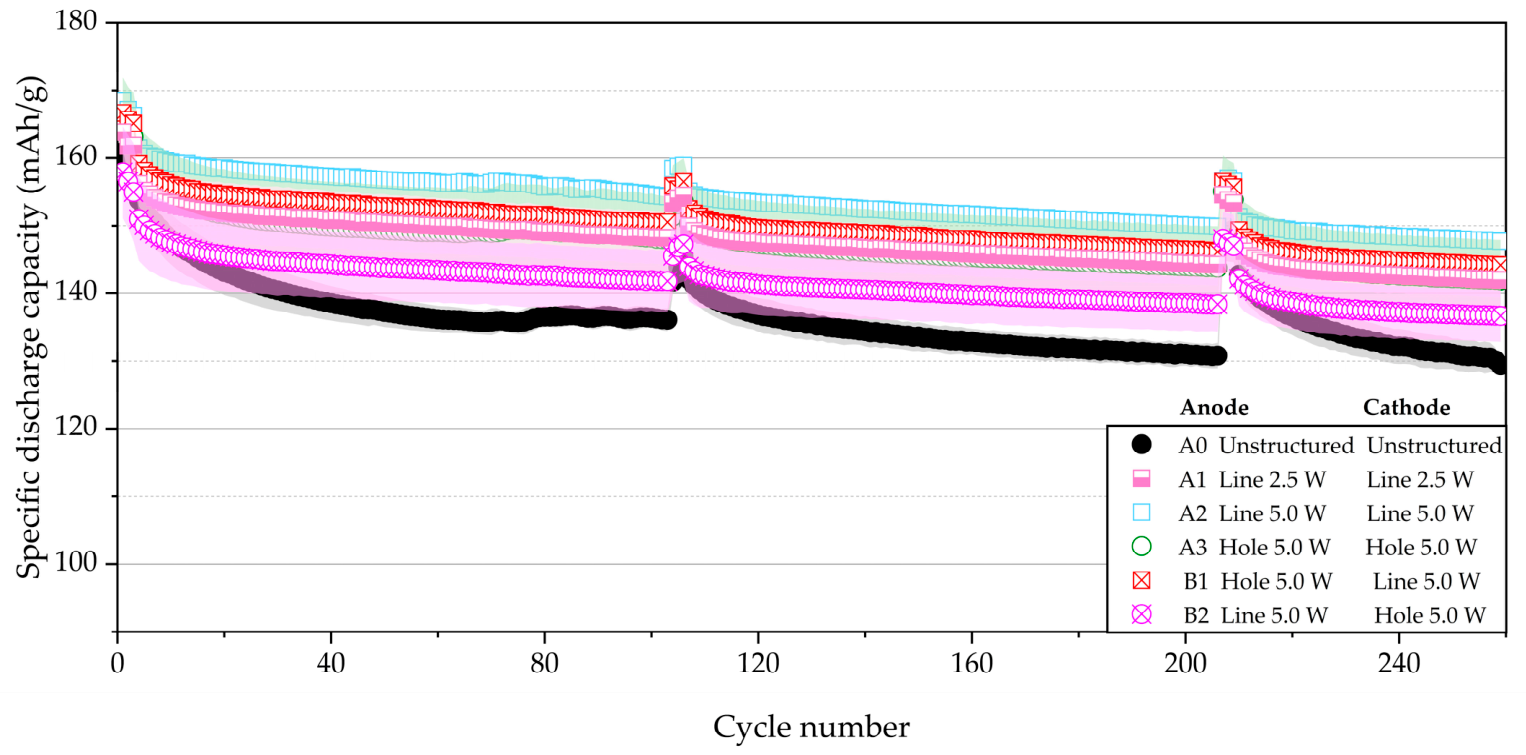
The long-term analyses were terminated after 250 cycles at C/2 because differences between the various cell configurations became apparent. After the first and second 100 cycles at C/2, the cells were cycled at C/5 for cycles to examine the capacity retention. In Figure 8, the reference A0 cells exhibited a decrease in specific discharge capacity from 154 to 129 mAh g−1, corresponding to a capacity retention of 85% after cycling. In contrast, A2 had the highest capacity of 148 mAh g−1 after cycling, with 92% capacity retention, while A1 and A3 cells demonstrated a retained capacity of 142 mAh g−1 and 142 mAh g−1, maintaining a capacity retention of 91% and 90%, respectively. B1 cells exhibited a similar capacity retention of 91%. It should be noted that although B2 cells exhibited the lowest capacity of 151 mAh g−1 among all cells at the beginning of the cycling, they maintained 91% capacity retention. These results indicate that regardless of which patterns were applied on which electrodes, laser structuring could effectively extend the cycling lifetime of cells by around 10%. However, compared to other cells with laser-structured electrodes, B2 cells with a hole pattern on the cathode and a line pattern on the anode exhibited the lowest capacities, even lower than those of A3 cells with hole patterns on both electrodes. Thus, the anti-synergistic effect generated using the B2 configuration must be taken into consideration and avoided when designing the electrode architectures of 3D batteries.
Figure 8.
Specific discharge capacities of full cells cycled at C/2. After the first and second 100 cycles at C/2, 3 cycles at C/5 were conducted to determine the capacity retention. The shading regions represent the range of standard deviation between cells with the same configuration.
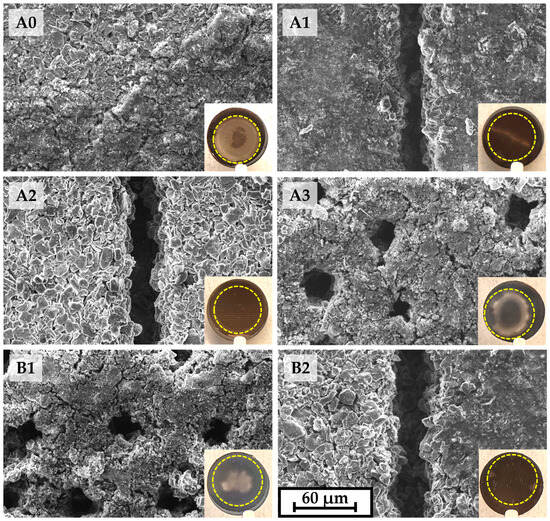
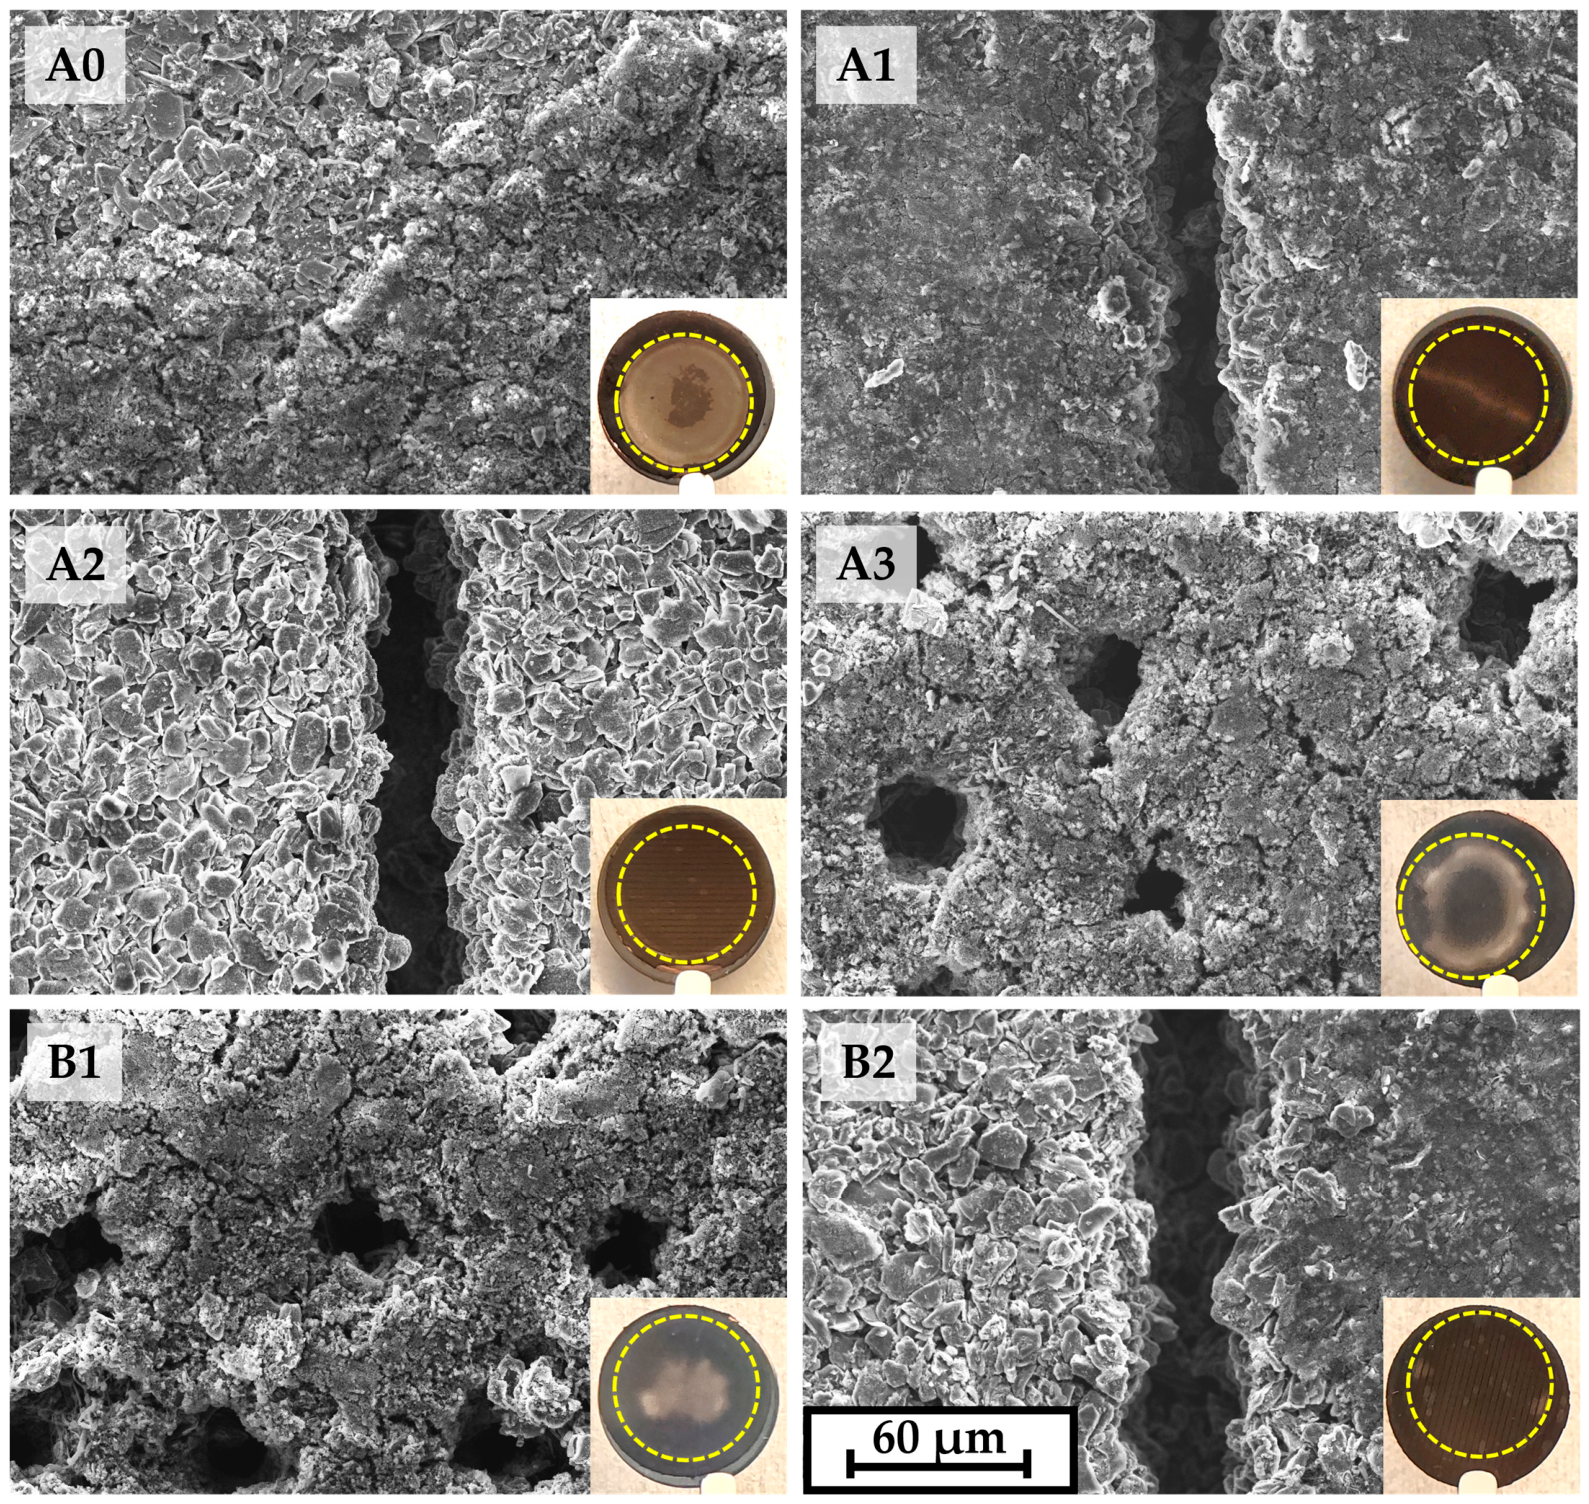
After long-term analyses, all cells were disassembled and the graphite anodes were collected and rinsed with dimethyl carbonate (DMC) for 40 min and then dried in an argon-filled glovebox, as shown in Figure 9. The yellow dashed circles indicate the regions of the anode surface that were covered by the cathode, confirming that all cells were well-aligned. For A0 cells, a large portion of the anode surface was coated with a continuous and dense layer. A dendritic structure was observed (highlighted by the red circle in Figure S2, which may indicate lithium plating. Furthermore, the graphite particle morphology on the lower right side of the SEM image of the A0 cell could no longer be distinguished. A narrow, line-shaped white region was observed on the anode surface obtained from the A1 cell. The SEM image of this area revealed that the graphite particles were covered with a deposit layer; however, no particles or deposits were blocking the grooves. Small dendritic structures were also identified in this region as shown in Figure S2. The anode from the A2 cell showed a clean anode surface with almost no deposit. For the A3 and B1 cells, part of the holes was covered with deposits, leading to a decreased hole diameter compared to the pristine hole-patterned electrodes shown in Figure 1c, and the dendritic structures were also observed as shown in Figure S2. In the B2 cell, small gray spots were observed near the edge of the anode surface and, as revealed by SEM images, the graphite surface was partially covered by deposits and a dendritic structure was also found.
Figure 9.
Images and SEM of the graphite anodes collected from disassembled coin cells with different configurations (A0 to B2). The yellow dashed circles indicate the regions of the anode surface that were covered by the cathode.
In summary, dendritic structures were observed on the anode surface of A0, A3, B1 and B2 cells (Figure S2), which may be attributed to lithium plating [47], and this is consistent with the results of DVA. However, it cannot be entirely ruled out that these dendrites might be some components of the dried electrolyte. In addition, the small amount of line-shaped deposition region presented on the graphite anode from A1 cell despite the absence of a lithium plating peak in the DVA might be attributed to two factors: On the one hand, the cells were disassembled after long-term analyses at C/2, during which degradation and additional lithium plating may have occurred. On the other hand, DVA has limited sensitivity for small amounts of lithium [55].
4. Conclusions
The NMC 811 cathodes and graphite anodes with areal capacities of 4 mAh cm−2 and 4.4 mAh cm−2, respectively, were laser structured using hole and line patterns. For line patterning, average laser powers of 2.5 W and 5.0 W were employed for laser processing. The mass loss resulting from the different laser-structuring strategies remained consistent below 6% to minimize capacity reduction. On the one hand, the groove width increased with increasing average laser power, especially in graphite anodes. Consequently, to maintain an equivalent areal loading across all laser-structured electrodes, the pitch was adjusted accordingly. On the other hand, the processing rate with line patterns increased by 436% and 82% for anodes and cathodes, respectively, when the laser power increased from 2.5 W to 5.0 W. Moreover, line patterning exhibited an order-of-magnitude higher processing rate than hole patterning with the percussion method. SEM analyses confirmed that no cracks or residual debris existed on the laser-structured electrode surfaces.
EIS analyses were performed on symmetric cells to study the impact of structure patterns on the ionic resistance of cells. After laser structuring, the anodes exhibited an ionic resistance reduction of 2–27%, whereas the cathodes showed an ionic resistance reduction of 18–29%, depending on the applied pattern and laser power. The unstructured and laser-structured electrodes were further assembled in six full-cell configurations.
This study is the first to investigate the pairing of different laser-generated patterns on different electrodes and their impact on the electrochemical performance at full-cell level. Cells with laser-structured electrodes showed a higher capacity at elevated C-rates (≥2C), faster charging and a shift in the onset of lithium plating from 2C to higher C-rates. The extent of these improvements depends on the laser strategy and cell configuration. The most significant enhancement was reached by A2 cells with “Line 5.0 W”-structured anodes and cathodes. At 5C, A2 cells delivered an increase in discharge capacity of 72 mAh g−1, 5 times higher than that of the reference cells. Moreover, these cells reached over 80% SOC within 18 min, while the reference cells required 55 min. Voltage relaxation analyses displayed that lithium plating in the reference cells initiated at 2C, while no evidence of lithium plating was observed even up to 7C for A2 cells with “Line 5.0 W”-structured anodes and cathodes.
Although the “Hole” electrodes exhibited slightly lower ionic resistance than the “Line 5 W” electrodes for both anodes and cathodes, cells with line-patterned electrodes demonstrated enhanced fast charge/discharge performance compared to cells with hole-patterned electrodes. This discrepancy may attributed to the capillary structure of the line pattern, which may facilitate enhanced wetting and rewetting of electrodes during electrochemical cycling [14]. When the anodes and cathodes have the same pattern, cells with line-patterned electrodes exhibit lower overpotentials than those with hole-patterned electrodes, particularly during high current discharge. As for cells that have different pattern combinations in their anodes and cathodes (B1 and B2), using a line pattern on the anode and a hole pattern on the cathode as in B1 cells results in an anti-synergistic effect at C-rates below 1C, since a sudden increase in overpotential was observed when cells were discharged below 3.4 V. Conversely, using a line pattern on the cathode and a hole pattern on the anode as in B2 cells leads to minimal cell polarization and increased discharge capacities, especially at high currents. Therefore, when designing the electrode structure of 3D batteries, it is essential to consider and avoid the anti-synergistic effects arising from the B2 configuration. Among all cell configurations, the best electrochemical performance was achieved when both electrodes were structured with high average laser power and a line pattern.
Ragone plots confirmed that laser structuring is beneficial to enhance energy density in the power density range of 1200–4400 Wh L−1 (330–1160 Wh kg−1). For example, when the power density is about 4400 W L−1 (1160 W kg−1), the gravimetric energy density of line-patterned electrodes (A2 cells) was 534% higher than the reference cells, while that of the hole-patterned electrode (A3 cells) was 18% higher than the reference cells. Moreover, the application of a line pattern on the cathode effectively improved the energy density; for example, at a power density of about 4400 W L−1 (1160 W kg−1), the gravimetric energy density of B1 cells was 505% higher than that of the reference cells.
Long-term cycling analyses showed that after 250 cycles at C/2, the SOH of reference cells was 85%, while the SOH of cells with laser-structured electrodes was 90–92%. In addition, post-mortem analyses found severe lithium plating on the anode surface in the reference A0 cell. For all hole-patterned anodes in different cell configurations, lithium plating took place and covered the anode surface, and the deposit partially blocked the hole structures. As for the “5.0 W” anodes paired with “Hole 5.0 W” cathodes, gray deposit spots were observed in localized areas on the anode surface, while the “5.0 W” anodes paired with “Line 5.0 W” cathodes showed almost no lithium plating on the anode surface.
Supplementary Materials
The following supporting information can be downloaded at: https://www.mdpi.com/article/10.3390/batteries12060194/s1. Figure S1. Cross-sectional view of (a,b) line-patterned graphite anode using laser power of 2.5 W and 5.0 W, respectively, and (c,d) line-patterned NMC811 cathode using laser power of 2.5 W and 5.0 W, respectively; Figure S2. SEM of the graphite anodes collected from disassembled coin cells with different configurations at high magnifications (A0 to B2); Table S1. The maximum width and full width at half maximum (FWHM) of grooves in different types of laser-structured electrodes; Table S2. The weight of anodes, cathodes, and electrolyte for all studied full cells.
Author Contributions
Conceptualization, W.L. and P.Z.; methodology, W.L., P.Z. and W.P., validation, W.L. and P.Z.; investigation, W.L. and P.Z.; resources, W.P.; data curation, W.L. and P.Z.; writing—original draft preparation, W.L. and P.Z.; writing—review and editing, W.L., P.Z. and W.P.; visualization, W.L. and P.Z.; supervision, W.P.; project administration, W.P.; funding acquisition, W.P. All authors have read and agreed to the published version of the manuscript.
Funding
This research was funded by the German Research Foundation (Deutsche Forschungsgemeinschaft, DFG), project HiLIB (Process upscaling of laser-structured thick-film electrodes in high-performance Li-ion batteries), project number 519141407.
Data Availability Statement
Data are included in this article and the Supplementary Materials. Further inquiries can be directed to the corresponding authors.
Acknowledgments
We gratefully acknowledge the support of our colleagues H. Besser and M. Kapitz for their continuous assistance in laser processing and A. Reif for her support in SEM analyses. We also thank Y. Sterzl for valuable discussions. We acknowledge support from the KIT-Publication Fund of the Karlsruhe Institute of Technology.
Conflicts of Interest
The authors declare no conflicts of interest.
Appendix A
The calculation of the energy density and power density of full cells to obtain the Ragone plot are presented in this chapter (Figure 7). The gravimetric energy density [Wh kg−1] and volumetric energy density [Wh l−1] are determined as follows:
where [Ah] is the total cell capacity, [V] the open-circuit voltage of the cell (3.6 V), [kg] the total mass, and [l] the volume of a unit cell. is obtained from the rate capability analyses at different C-rates as shown in Figure 3.
The gravimetric power density [W kg−1] and volumetric power density [W L−1] are described as follows:
where [A] is the applied current.
In this study, a single basic unit cell is considered. The total mass of a unit cell [kg] is given as:
where [kg] is the mass of the cathode without Al foil, [kg] the mass of the anode without Cu foil, [kg] the mass of the used separator, [kg] the mass of the total electrolyte, and [kg] and [kg] the mass of the Al and Cu current collector, respectively. The areal masses of the Al, Cu and separator are 0.0054 g cm−2, 0.0088 g cm−2, and 0.0011 g cm−2, respectively.
The measured weight of anodes, cathodes and electrolyte for each cell configuration is summarized in Table S2.
The total volume of a unit cell is calculated as:
where [cm2] is the footprint of the single basic unit cell with a diameter of 12 mm; [cm] and [cm] the film thickness of the cathode and anode without a current collector, respectively; [cm] the thickness of the separator, and [cm] and [cm] the thickness of the Al and Cu foil. is 0.0080 cm, is 0.0107 cm, is 0.0025 cm, is 0.0020 cm and is 0.0009 cm.
References
- Blomgren, G.E. The development and future of lithium ion batteries. J. Electrochem. Soc. 2016, 164, A5019. [Google Scholar] [CrossRef] [Scilit]
- Schmuch, R.; Wagner, R.; Hörpel, G.; Placke, T.; Winter, M. Performance and cost of materials for lithium-based rechargeable automotive batteries. Nat. Energy 2018, 3, 267–278. [Google Scholar] [CrossRef] [Scilit]
- Noh, H.-J.; Youn, S.; Yoon, C.S.; Sun, Y.-K. Comparison of the structural and electrochemical properties of layered Li[NixCoyMnz]O2 (x= 1/3, 0.5, 0.6, 0.7, 0.8 and 0.85) cathode material for lithium-ion batteries. J. Power Sources 2013, 233, 121–130. [Google Scholar] [CrossRef] [Scilit]
- Manthiram, A.; Knight, J.C.; Myung, S.T.; Oh, S.M.; Sun, Y.K. Nickel-rich and lithium-rich layered oxide cathodes: Progress and perspectives. Adv. Energy Mater. 2016, 6, 1501010. [Google Scholar] [CrossRef] [Scilit]
- Asenbauer, J.; Eisenmann, T.; Kuenzel, M.; Kazzazi, A.; Chen, Z.; Bresser, D. The success story of graphite as a lithium-ion anode material–fundamentals, remaining challenges, and recent developments including silicon (oxide) composites. Sustain. Energy Fuels 2020, 4, 5387–5416. [Google Scholar] [CrossRef] [Scilit]
- Patry, G.; Romagny, A.; Martinet, S.; Froelich, D. Cost modeling of lithium-ion battery cells for automotive applications. Energy Sci. Eng. 2015, 3, 71–82. [Google Scholar] [CrossRef] [Scilit]
- Zheng, J.; Xing, G.; Jin, L.; Lu, Y.; Qin, N.; Gao, S.; Zheng, J.P. Strategies and challenge of thick electrodes for energy storage: A review. Batteries 2023, 9, 151. [Google Scholar] [CrossRef] [Scilit]
- Kuang, Y.; Chen, C.; Kirsch, D.; Hu, L. Thick electrode batteries: Principles, opportunities, and challenges. Adv. Energy Mater. 2019, 9, 1901457. [Google Scholar] [CrossRef] [Scilit]
- Wu, J.; Zhang, X.; Ju, Z.; Wang, L.; Hui, Z.; Mayilvahanan, K.; Takeuchi, K.J.; Marschilok, A.C.; West, A.C.; Takeuchi, E.S. From fundamental understanding to engineering design of high-performance thick electrodes for scalable energy-storage systems. Adv. Mater. 2021, 33, 2101275. [Google Scholar] [CrossRef] [Scilit]
- Ju, Z.; Zhu, Y.; Zhang, X.; Lutz, D.M.; Fang, Z.; Takeuchi, K.J.; Takeuchi, E.S.; Marschilok, A.C.; Yu, G. Understanding thickness-dependent transport kinetics in nanosheet-based battery electrodes. Chem. Mater. 2020, 32, 1684–1692. [Google Scholar] [CrossRef] [Scilit]
- Chen, Y.; Zhao, B.; Yang, Y.; Cao, A. Toward high-areal-capacity electrodes for lithium and sodium ion batteries. Adv. Energy Mater. 2022, 12, 2201834. [Google Scholar] [CrossRef] [Scilit]
- Delattre, B.; Amin, R.; Sander, J.; De Coninck, J.; Tomsia, A.P.; Chiang, Y.-M. Impact of pore tortuosity on electrode kinetics in lithium battery electrodes: Study in directionally freeze-cast LiNi0.8Co0.15Al0.05O2 (NCA). J. Electrochem. Soc. 2018, 165, A388–A395. [Google Scholar] [CrossRef] [Scilit]
- Li, L.; Erb, R.M.; Wang, J.; Wang, J.; Chiang, Y.M. Fabrication of low-tortuosity ultrahigh-area-capacity battery electrodes through magnetic alignment of emulsion-based slurries. Adv. Energy Mater. 2019, 9, 1802472. [Google Scholar] [CrossRef] [Scilit]
- Sterzl, Y.; Pfleging, W. Optimizing Structural Patterns for 3D Electrodes in Lithium-Ion Batteries for Enhanced Fast-Charging Capability and Reduced Lithium Plating. Batteries 2024, 10, 160. [Google Scholar] [CrossRef] [Scilit]
- Pfleging, W. Recent progress in laser texturing of battery materials: A review of tuning electrochemical performances, related material development, and prospects for large-scale manufacturing. Int. J. Extrem. Manuf. 2020, 3, 012002. [Google Scholar] [CrossRef] [Scilit]
- Hille, L.; Noecker, M.P.; Ko, B.; Kriegler, J.; Keilhofer, J.; Stock, S.; Zaeh, M.F. Integration of laser structuring into the electrode manufacturing process chain for lithium-ion batteries. J. Power Sources 2023, 556, 232478. [Google Scholar] [CrossRef] [Scilit]
- Pfleging, W. A review of laser electrode processing for development and manufacturing of lithium-ion batteries. Nanophotonics 2018, 7, 549–573. [Google Scholar] [CrossRef] [Scilit]
- Habedank, J.B.; Günter, F.J.; Billot, N.; Gilles, R.; Neuwirth, T.; Reinhart, G.; Zaeh, M.F. Rapid electrolyte wetting of lithium-ion batteries containing laser structured electrodes: In situ visualization by neutron radiography. Int. J. Adv. Manuf. Technol. 2019, 102, 2769–2778. [Google Scholar] [CrossRef] [Scilit]
- Pfleging, W.; Pröll, J. A new approach for rapid electrolyte wetting in tape cast electrodes for lithium-ion batteries. J. Mater. Chem. A 2014, 2, 14918–14926. [Google Scholar] [CrossRef] [Scilit]
- Berhe, M.G.; Oh, H.G.; Park, S.-K.; Mondal, M.; Lee, D. Effect of laser-induced groove morphology on the wettability and performance of Lithium-ion batteries. Mater. Des. 2023, 231, 112020. [Google Scholar] [CrossRef] [Scilit]
- Mangang, M.; Seifert, H.; Pfleging, W. Influence of laser pulse duration on the electrochemical performance of laser structured LiFePO4 composite electrodes. J. Power Sources 2016, 304, 24–32. [Google Scholar] [CrossRef] [Scilit]
- Dunlap, N.; Sulas-Kern, D.B.; Weddle, P.J.; Usseglio-Viretta, F.; Walker, P.; Todd, P.; Boone, D.; Colclasure, A.M.; Smith, K.; de Villers, B.J.T. Laser ablation for structuring Li-ion electrodes for fast charging and its impact on material properties, rate capability, Li plating, and wetting. J. Power Sources 2022, 537, 231464. [Google Scholar] [CrossRef] [Scilit]
- Habedank, J.B.; Kriegler, J.; Zaeh, M.F. Enhanced fast charging and reduced lithium-plating by laser-structured anodes for lithium-ion batteries. J. Electrochem. Soc. 2019, 166, A3940. [Google Scholar] [CrossRef] [Scilit]
- Berhe, M.G.; Musse, D.; Oh, H.G.; Park, S.-K.; Lee, D. Development of laser structured three-dimensional patterns for improved wettability and performance of electrodes for lithium-ion batteries. Colloids Surf. A Physicochem. Eng. Asp. 2024, 697, 134393. [Google Scholar] [CrossRef] [Scilit]
- Hille, L.; Xu, L.; Keilhofer, J.; Stock, S.; Kriegler, J.; Zaeh, M.F. Laser structuring of graphite anodes and NMC cathodes–Proportionate influence on electrode characteristics and cell performance. Electrochim. Acta 2021, 392, 139002. [Google Scholar] [CrossRef] [Scilit]
- Zhu, P.; Sterzl, Y.; Pfleging, W. Impact of Laser Ablation Strategies on Electrochemical Performances of 3D Batteries Containing Aqueous Acid Processed Li(Ni0.6Mn0.2Co0.2)O2 Cathodes with High Mass Loading. Batteries 2024, 10, 354. [Google Scholar] [CrossRef] [Scilit]
- Dawson, H. Mechanical stability test for Hevea Latex. Anal. Chem. 1949, 21, 1066–1071. [Google Scholar] [CrossRef] [Scilit]
- Zhu, P.; Seifert, H.J.; Pfleging, W. The ultrafast laser ablation of Li(Ni0.6Mn0.2Co0.2)O2 electrodes with high mass loading. Appl. Sci. 2019, 9, 4067. [Google Scholar] [CrossRef] [Scilit]
- Saxena, S.; Xing, Y.; Kwon, D.; Pecht, M. Accelerated degradation model for C-rate loading of lithium-ion batteries. Int. J. Electr. Power Energy Syst. 2019, 107, 438–445. [Google Scholar] [CrossRef] [Scilit]
- Schomburg, F.; Heidrich, B.; Wennemar, S.; Drees, R.; Roth, T.; Kurrat, M.; Heimes, H.; Jossen, A.; Winter, M.; Cheong, J.Y. Lithium-ion battery cell formation: Status and future directions towards a knowledge-based process design. Energy Environ. Sci. 2024, 17, 2686–2733. [Google Scholar] [CrossRef] [Scilit]
- Kwade, A.; Haselrieder, W.; Leithoff, R.; Modlinger, A.; Dietrich, F.; Droeder, K. Current status and challenges for automotive battery production technologies. Nat. Energy 2018, 3, 290–300. [Google Scholar] [CrossRef] [Scilit]
- Landesfeind, J.; Hattendorff, J.; Ehrl, A.; Wall, W.A.; Gasteiger, H.A. Tortuosity determination of battery electrodes and separators by impedance spectroscopy. J. Electrochem. Soc. 2016, 163, A1373. [Google Scholar] [CrossRef] [Scilit]
- Ogihara, N.; Kawauchi, S.; Okuda, C.; Itou, Y.; Takeuchi, Y.; Ukyo, Y. Theoretical and experimental analysis of porous electrodes for lithium-ion batteries by electrochemical impedance spectroscopy using a symmetric cell. J. Electrochem. Soc. 2012, 159, A1034. [Google Scholar] [CrossRef] [Scilit]
- Lazanas, A.C.; Prodromidis, M.I. Electrochemical impedance spectroscopy—A tutorial. ACS Meas. Sci. Au 2023, 3, 162–193. [Google Scholar] [CrossRef] [Scilit]
- Leonide, A.; Sonn, V.; Weber, A.; Ivers-Tiffée, E. Evaluation and modeling of the cell resistance in anode-supported solid oxide fuel cells. J. Electrochem. Soc. 2008, 155, B36–B41. [Google Scholar] [CrossRef] [Scilit]
- Zhang, Y.; Chen, Y.; Yan, M.; Chen, F. Reconstruction of relaxation time distribution from linear electrochemical impedance spectroscopy. J. Power Sources 2015, 283, 464–477. [Google Scholar] [CrossRef] [Scilit]
- Dickmanns, J.L.; Reuter, L.; Morasch, R.; Maglia, F.; Jung, R.; Gasteiger, H.A. Changes in Structure and Ionic Resistance of Lithium-Ion Battery Graphite Electrodes—Part I: Impact of Formation and SEI. J. Electrochem. Soc. 2025, 172, 070513. [Google Scholar] [CrossRef] [Scilit]
- Xiao, J.; Adelstein, N.; Bi, Y.; Bian, W.; Cabana, J.; Cobb, C.L.; Cui, Y.; Dillon, S.J.; Doeff, M.M.; Islam, S.M. Assessing cathode–electrolyte interphases in batteries. Nat. Energy 2024, 9, 1463–1473. [Google Scholar] [CrossRef] [Scilit]
- Park, J.; Jeon, C.; Kim, W.; Bong, S.-J.; Jeong, S.; Kim, H.-J. Challenges, laser processing and electrochemical characteristics on application of ultra-thick electrode for high-energy lithium-ion battery. J. Power Sources 2021, 482, 228948. [Google Scholar] [CrossRef] [Scilit]
- Wu, Y.; Ge, G.; Wang, S.; Xiong, L.; He, Z. Formation mechanisms of solid electrolyte interphase and its influence on lithium battery performance. Mater. Today Energy 2025, 54, 102124. [Google Scholar] [CrossRef] [Scilit]
- Morasch, R.; Keilhofer, J.; Gasteiger, H.A.; Suthar, B. Methods—Understanding porous electrode impedance and the implications for the impedance analysis of li-ion battery electrodes. J. Electrochem. Soc. 2021, 168, 080519. [Google Scholar] [CrossRef] [Scilit]
- Kisu, K.; Aoyagi, S.; Nagatomo, H.; Iwama, E.; Reid, M.T.H.; Naoi, W.; Naoi, K. Internal resistance mapping preparation to optimize electrode thickness and density using symmetric cell for high-performance lithium-ion batteries and capacitors. J. Power Sources 2018, 396, 207–212. [Google Scholar] [CrossRef] [Scilit]
- Xu, L.; Yang, Y.; Xiao, Y.; Cai, W.-L.; Yao, Y.-X.; Chen, X.-R.; Yan, C.; Yuan, H.; Huang, J.-Q. In-situ determination of onset lithium plating for safe Li-ion batteries. J. Energy Chem. 2022, 67, 255–262. [Google Scholar] [CrossRef] [Scilit]
- Weiss, M.; Ruess, R.; Kasnatscheew, J.; Levartovsky, Y.; Levy, N.R.; Minnmann, P.; Stolz, L.; Waldmann, T.; Wohlfahrt-Mehrens, M.; Aurbach, D. Fast charging of lithium-ion batteries: A review of materials aspects. Adv. Energy Mater. 2021, 11, 2101126. [Google Scholar] [CrossRef] [Scilit]
- Sieg, J.; Schmid, A.U.; Rau, L.; Gesterkamp, A.; Storch, M.; Spier, B.; Birke, K.P.; Sauer, D.U. Fast-charging capability of lithium-ion cells: Influence of electrode aging and electrolyte consumption. Appl. Energy 2022, 305, 117747. [Google Scholar] [CrossRef] [Scilit]
- Klett, M.; Svens, P.; Tengstedt, C.; Seyeux, A.; Swiatowska, J.; Lindbergh, G.; Wreland Lindström, R. Uneven film formation across depth of porous graphite electrodes in cycled commercial Li-ion batteries. J. Phys. Chem. C 2015, 119, 90–100. [Google Scholar] [CrossRef] [Scilit]
- Uhlmann, C.; Illig, J.; Ender, M.; Schuster, R.; Ivers-Tiffée, E. In situ detection of lithium metal plating on graphite in experimental cells. J. Power Sources 2015, 279, 428–438. [Google Scholar] [CrossRef] [Scilit]
- Harris, S.J.; Timmons, A.; Baker, D.R.; Monroe, C. Direct in situ measurements of Li transport in Li-ion battery negative electrodes. Chem. Phys. Lett. 2010, 485, 265–274. [Google Scholar] [CrossRef] [Scilit]
- Lin, X.; Khosravinia, K.; Hu, X.; Li, J.; Lu, W. Lithium plating mechanism, detection, and mitigation in lithium-ion batteries. Prog. Energy Combust. Sci. 2021, 87, 100953. [Google Scholar] [CrossRef] [Scilit]
- Adam, A.; Knobbe, E.; Wandt, J.; Kwade, A. Application of the differential charging voltage analysis to determine the onset of lithium-plating during fast charging of lithium-ion cells. J. Power Sources 2021, 495, 229794. [Google Scholar] [CrossRef] [Scilit]
- Yang, X.-G.; Ge, S.; Liu, T.; Leng, Y.; Wang, C.-Y. A look into the voltage plateau signal for detection and quantification of lithium plating in lithium-ion cells. J. Power Sources 2018, 395, 251–261. [Google Scholar] [CrossRef] [Scilit]
- Sandherr, J.; Bolsinger, M.; Kleefoot, M.-J.; Knoblauch, V. A combined electrochemical and microscopical analysis on the effect of laser structuring on Li plating of graphite anodes for lithium-ion batteries. J. Energy Storage 2024, 102, 114187. [Google Scholar] [CrossRef] [Scilit]
- Beyers, I.; Bensmann, A.; Hanke-Rauschenbach, R. Ragone plots revisited: A review of methodology and application across energy storage technologies. J. Energy Storage 2023, 73, 109097. [Google Scholar] [CrossRef] [Scilit]
- Smith, A.; Stüble, P.; Leuthner, L.; Hofmann, A.; Jeschull, F.; Mereacre, L. Potential and limitations of research battery cell types for electrochemical data acquisition. Batter. Supercaps 2023, 6, e202300080. [Google Scholar] [CrossRef] [Scilit]
- Petzl, M.; Danzer, M.A. Nondestructive detection, characterization, and quantification of lithium plating in commercial lithium-ion batteries. J. Power Sources 2014, 254, 80–87. [Google Scholar] [CrossRef] [Scilit]

Disclaimer/Publisher’s Note: The statements, opinions and data contained in all publications are solely those of the individual author(s) and contributor(s) and not of MDPI and/or the editor(s). MDPI and/or the editor(s) disclaim responsibility for any injury to people or property resulting from any ideas, methods, instructions or products referred to in the content. |
© 2026 by the authors. Licensee MDPI, Basel, Switzerland. This article is an open access article distributed under the terms and conditions of the Creative Commons Attribution (CC BY) license.