1. Introduction
Lithium-ion batteries (LIBs) can combust rapidly and generate significant gaseous emissions when they experience thermal runaway (TR), a process in which the cell’s energy is released through uncontrolled combustion [
1,
2]. Emitted gases can be toxic, corrosive, flammable, and pose significant risks to human health and nearby property [
3,
4,
5]. Many studies have reported gaseous emissions of failing LIB cells, but cell chemistry, energy capacity, failure trigger, gas detectors, and observed results vary significantly [
1,
6]. The dependence of gas emissions on state of charge (SOC) and combustion behavior is also underrepresented in the literature [
6].
Hazardous gas emissions from failing LIB cells are of specific concern due to their immediate and acute risks to nearby people, including first responders [
5]. These emissions can also be transported over distances, potentially causing further harm. The most concerning species are acidic gases such as hydrogen fluoride (HF), hydrogen chloride (HCl), and hydrogen cyanide (HCN). Other toxic air pollutants include carbon monoxide (CO), nitrogen dioxide (NO
2), and sulfur dioxide (SO
2). Flammable gases such as light hydrocarbons, evaporated electrolyte solvents, and hydrogen gas (H
2) are also released [
1]. Of great concern are HF emissions by the dissociation and hydrolyzation of the electrolyte lithium hexafluorophosphate (LiPF
6) salt through the following sequences [
6]:
Bugryniec et al. synthesizes gas emission composition, total volume, and toxicity for different LIB types and sizes from over 60 studies [
1]. Rappsilber et al. focuses on heat release and total gas emission amounts from 37 studies [
6]. Total emission amounts depend on the number and size of LIBs burned, which necessitates the normalization of emissions to the cell’s nominal energy capacity [
5]. Gas emission factors (EFs) are therefore reported in mg/Wh to allow for comparison between experiments.
Complementing the particle compositions and size distributions presented by Claassen et al. [
7,
8], the objectives of this paper are to (1) evaluate gas concentration evolution during cell combustion, including peak concentrations of toxic and flammable compounds; (2) quantify gas EFs; and (3) evaluate the dependence of peak gas concentrations and EFs on cell chemistry, combustion behavior, and SOC. This study improves upon existing studies by examining detailed emission characteristics, correlation with combustion behavior and cell SOC, and how aggregated emissions compare to peak concentrations.
2. Materials and Methods
Experimental methods and data analysis have been described in the companion papers [
7,
8], with a brief overview given here. Two LIB types were tested: a cylindrical 18650-style lithium iron phosphate (LFP) cell and a pouch-style lithium cobalt oxide (LCO) cell [
9,
10]. The nominal energy capacities for the two cell types were 3.63 Wh and 9.25 Wh, respectively. Combustion tests of the two cell types were conducted in an ~8 m
3 burn chamber [
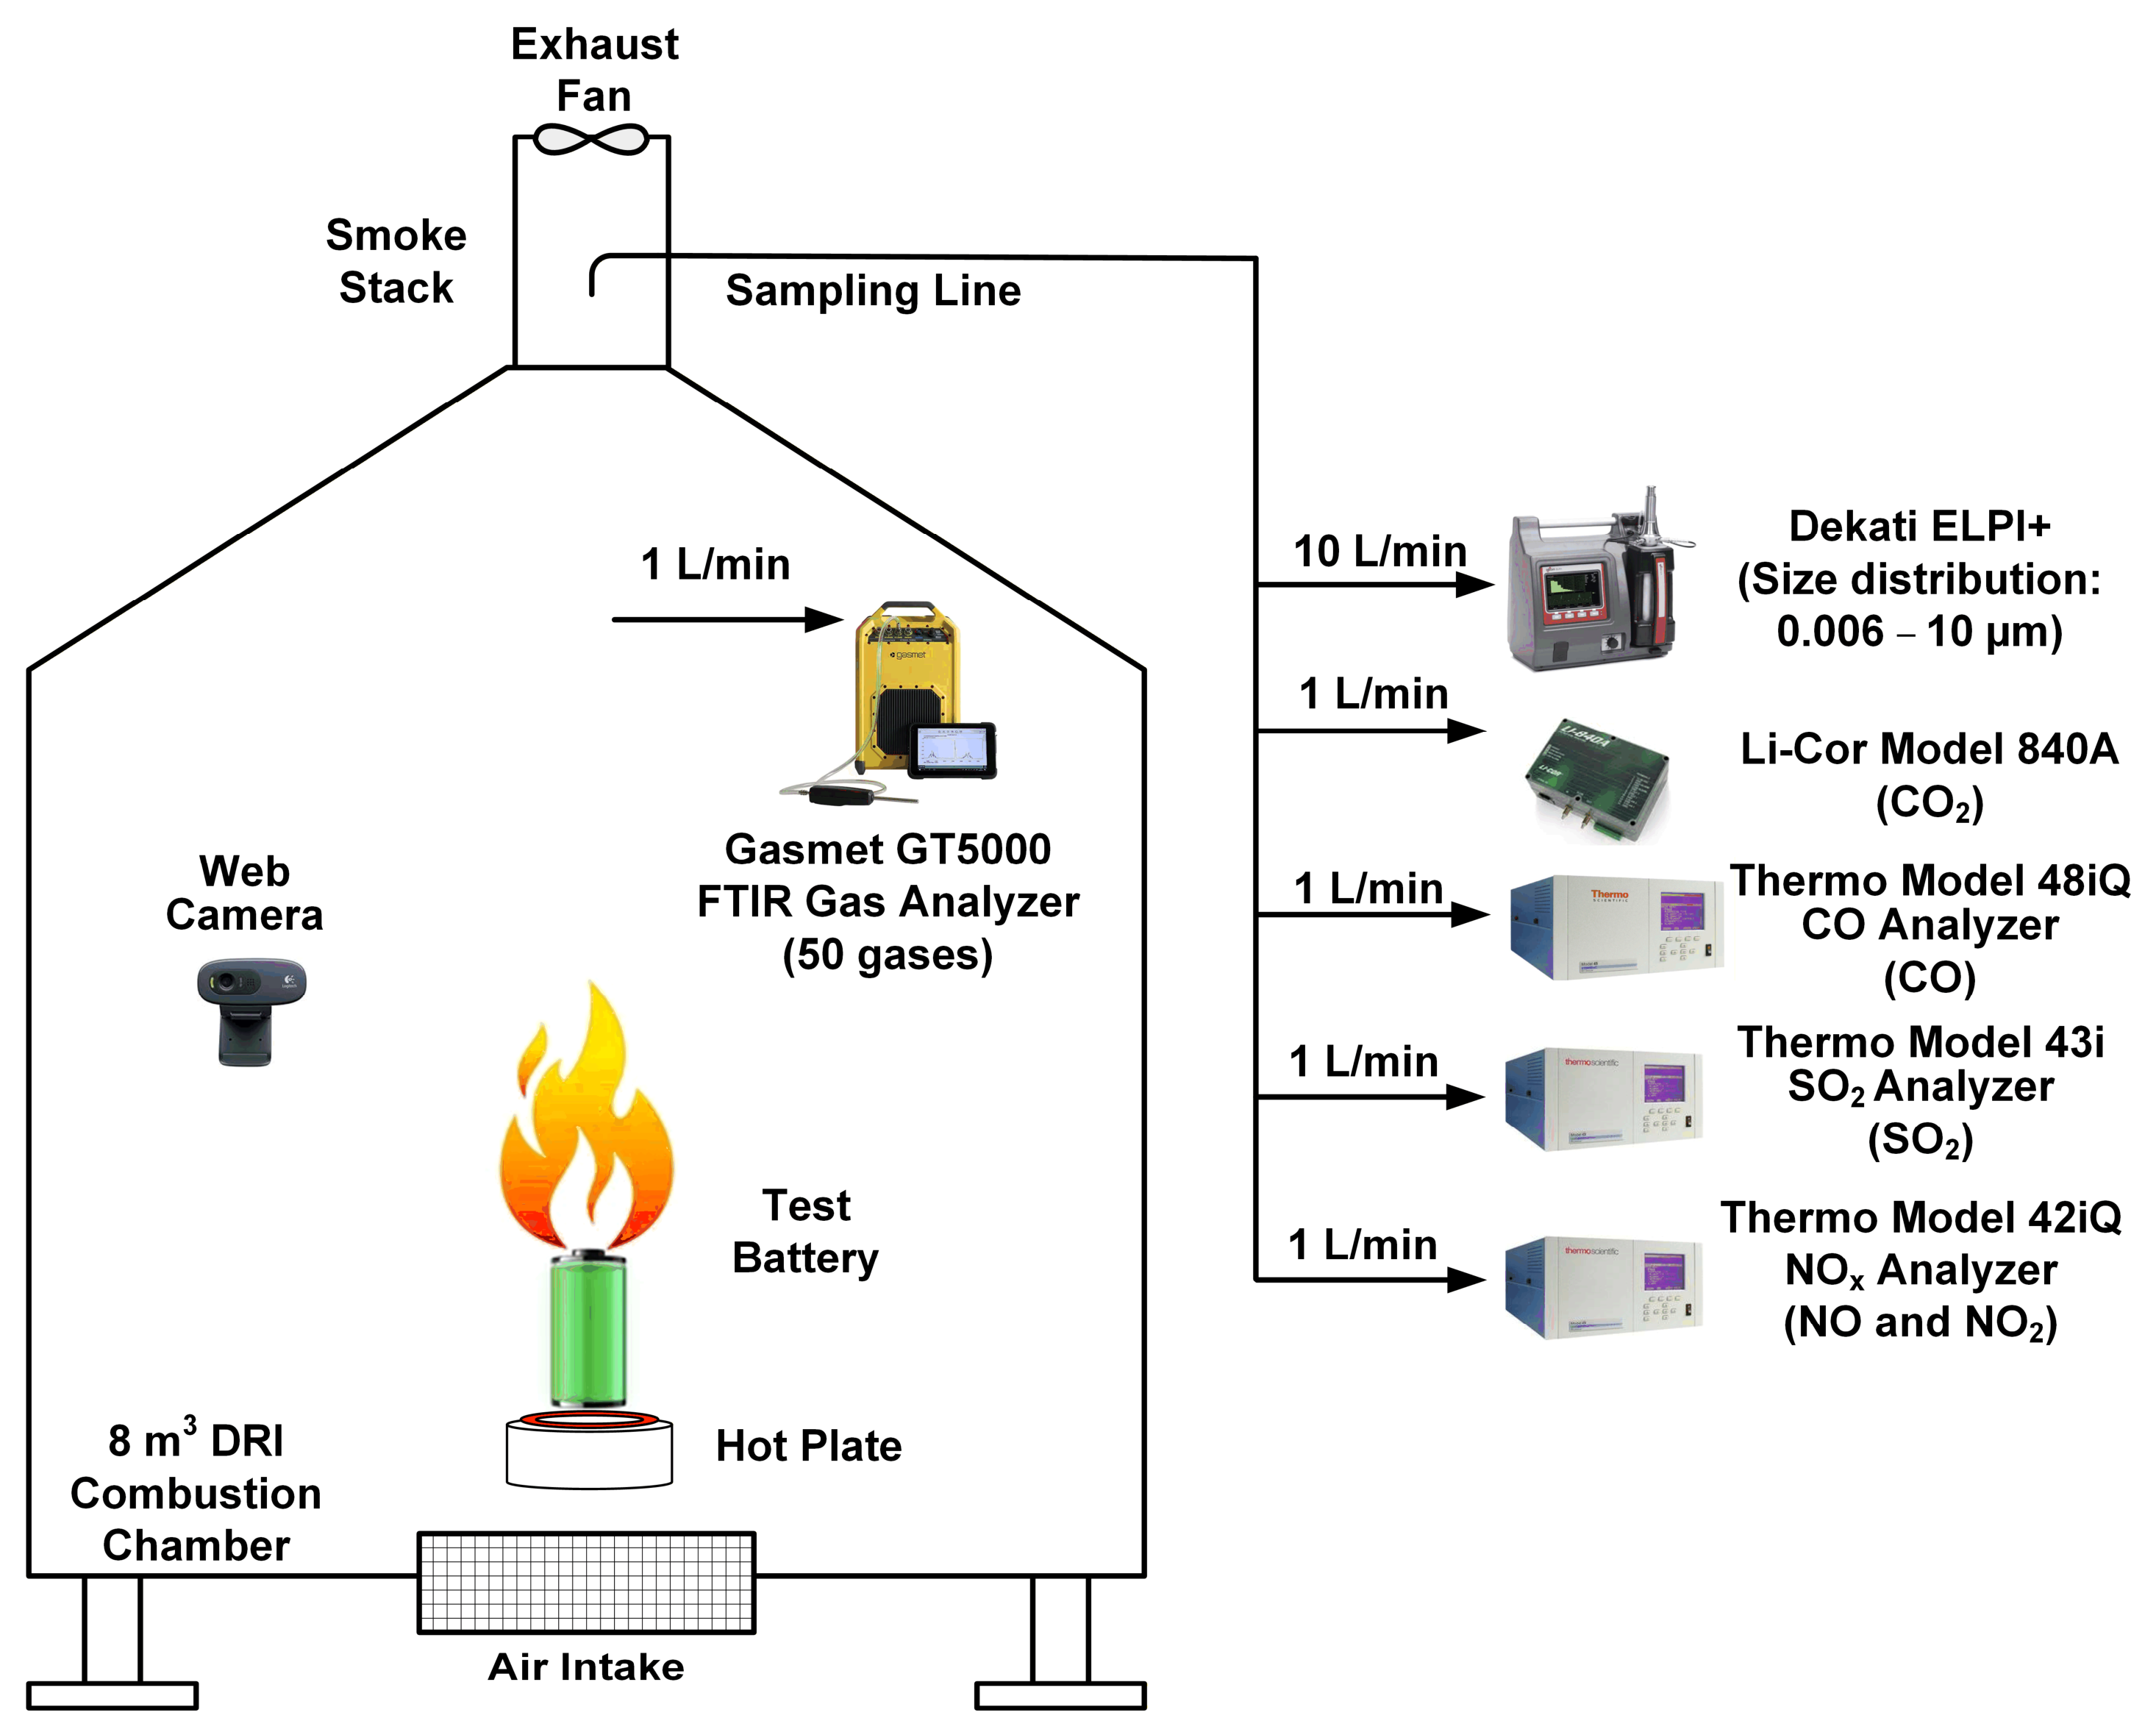
11] with an exhaust flow rate (Q) of ~3300 L/min, corresponding to ~25 air changes per hour (ACH). The air supplied to the chamber consisted of conditioned room air at a typical temperature of 26 °C and a relative humidity (RH) of 20%. The chamber and instrument layout is shown in
Figure 1. Each LIB cell was charged to the desired SOC (5 levels between 0 and 100%) by a programable charger before being placed in a ceramic crucible and heated to cell failure and TR by an electric hot plate. A type K thermocouple was placed adjacent to the vent port for LFP cells, and on the cell face for LCO cells, to measure emitted flame temperatures. Each cell type and SOC combination was tested at least three times. A total of 16 and 18 tests were performed for LFP and LCO cells, respectively.
LIB combustion emissions were sampled from the chamber exhaust duct and directed to a suite of gas analyzers. Airborne particulates were filtered from the gas sampling stream by placing Teflon filters upstream of all instrument inlets. The sampling stream was not conditioned or diluted in any other way. The sampling line inlet was positioned roughly 2.5 m above the tested LIBs, and far enough from the stack bottom to ensure uniform flow. The distance from the sampling inlet to the instruments was 2.5–4 m. All instruments were set to a 1 Hz sampling frequency, although not all instruments used are able to make measurements at this rate. CO
2 was measured by a nondispersive infrared analyzer (Model 840A; LI-COR Environmental, Lincoln, NE, USA), while CO, SO
2, and NO
x were measured by U.S. Environmental Protection Agency (EPA) Federal Equivalent Method (FEM) analyzers (Model 48iQ, 43i, and 42iQ, respectively; Thermo Fisher Scientific, Waltham, MA, USA). The NO
x instrument measured NO
x and NO directly and calculated NO
2 from the difference between these two measurements. Number concentrations of emitted 6 nm–10 µm particles were measured by an electrical low-pressure impactor (ELPI+; Dekati Ltd., Kangasala, Finland) [
8].
A portable Fourier transform infrared (FTIR) spectroscopic gas analyzer (Model GT5000 Terra; Gasmet, Vantaa, Finland) was used to measure toxic and combustible gases. This analyzer was placed closer to the tested LIBs to limit emissions condensation prior to measurement. The distance from the test LIB to the FTIR measurement cell was roughly 2 m. Combustible gases were grouped into two distinct categories, electrolyte solvents and total hydrocarbons (THC). These groupings are useful as whole-spectrum FTIR analysis poses challenges in differentiating the IR absorption patterns of similar gases, making the exact composition and relative concentrations less certain than their aggregated total.
The hydrocarbons most closely matching the observed IR absorption were methane (CH4), propane (C3H8), hexane (C6H14), and styrene (C8H8). All electrolyte solvents with available reference spectra were included in the analysis, consisting of ethylene carbonate (EC), diethyl carbonate (DEC), dimethyl carbonate (DMC), and ethyl methyl carbonate (EMC). These four species may not be present in both cell chemistries; however, due to similar absorption spectra, a much lower spectral residual was obtained by including them. Likely, DEC was absent from LFP cell tests and DMC was absent from LCO cell tests due to the species being detected only occasionally. Detailed cell chemical composition information is proprietary and not available.
3. Results
3.1. Combustion Behavior
Modified combustion efficiency (MCE) can be used to describe the combustion intensity and phase (i.e., smoldering or flaming) throughout each test:
where ΔCO
x represents the concentration above background levels [
12]. ΔCO, ΔCO
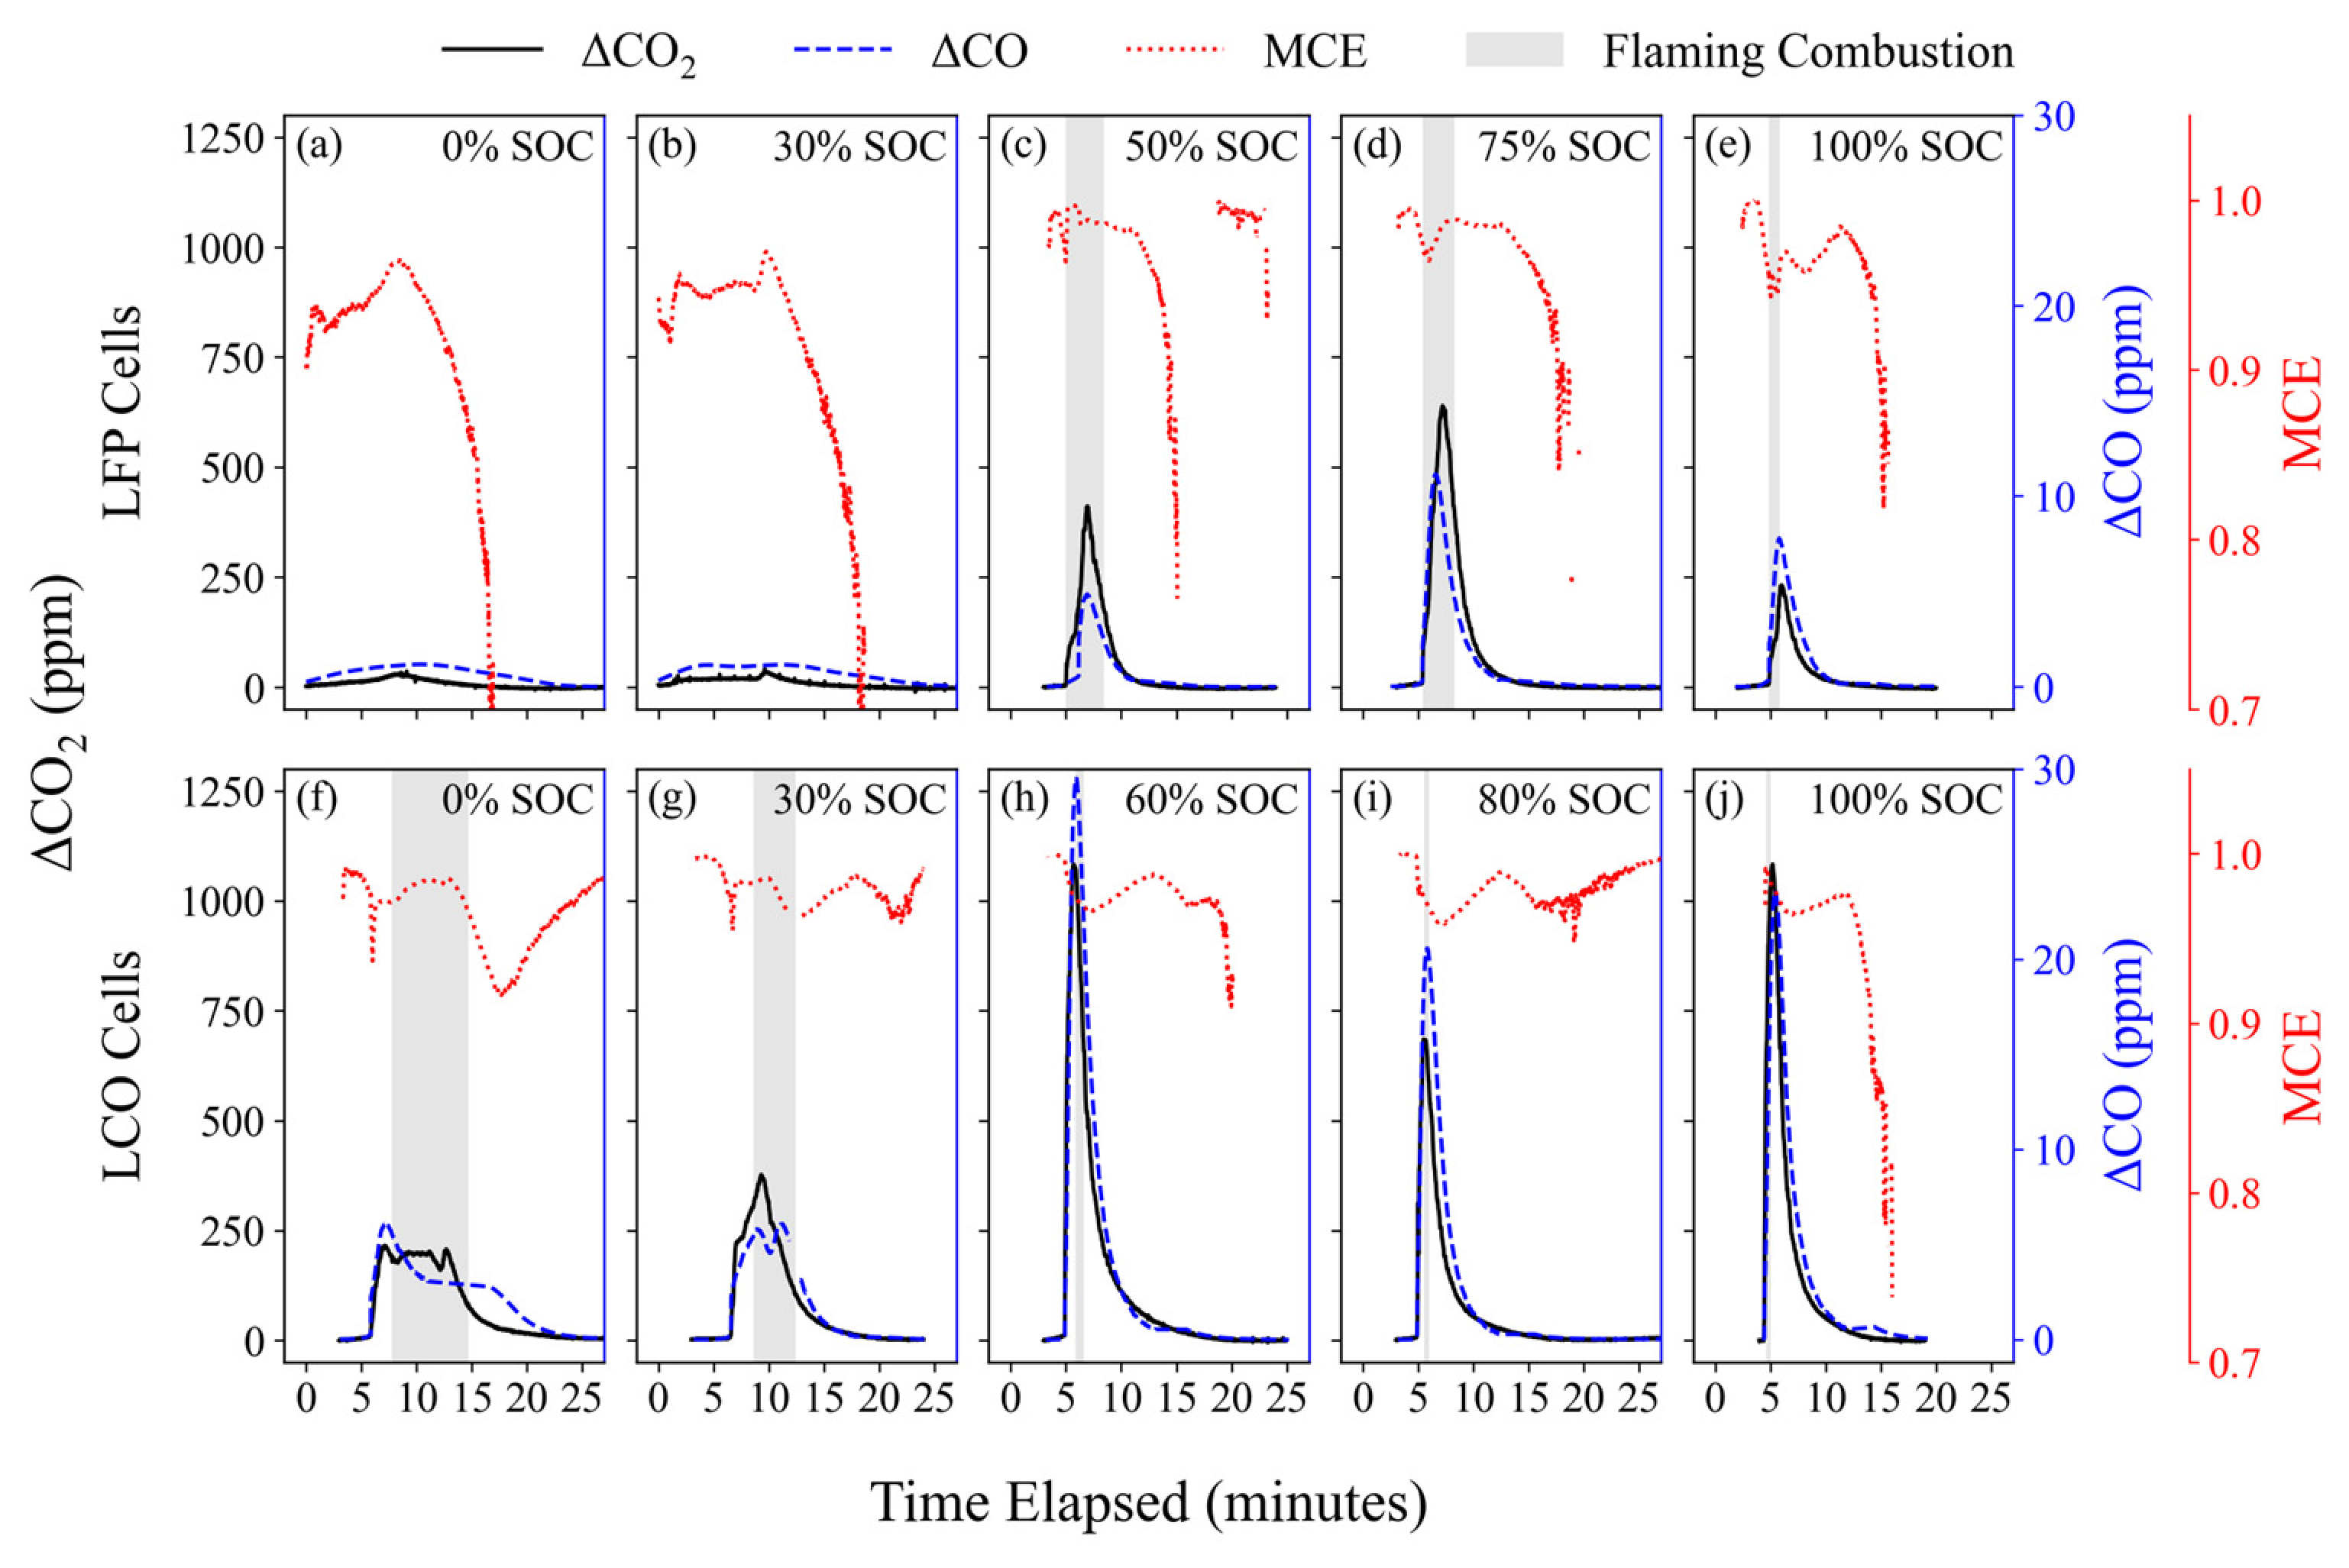
2, and MCE time series, as well as the portions of each test with visually observed flaming combustion, are shown in
Figure 2 for each LIB type and SOC.
Combustion and resulting emissions in low-SOC (0 and 30%) tests were less vigorous and more prolonged than for higher-SOC (50–100%) tests. LFP tests with 0% and 30% SOCs resulted in CO and CO2 concentrations barely above background due to a lack of flaming combustion. On the other hand, LCO tests at the same SOCs had visible flaming and generated higher emission peaks.
As expected, flaming combustion corresponded to higher MCEs, generally exceeding 0.9 during the primary emissions phase of each test. However, flames were observed for shorter periods than elevated MCEs were. This indicates that either the large amount of emissions released during flaming combustion took time to be vented from the chamber, or that combustion efficiency was still high within the cell despite no visible flaming. MCE values began to drop as CO and CO2 concentrations returned to background levels, most notably in LFP tests, indicating prolonged smoldering combustion.
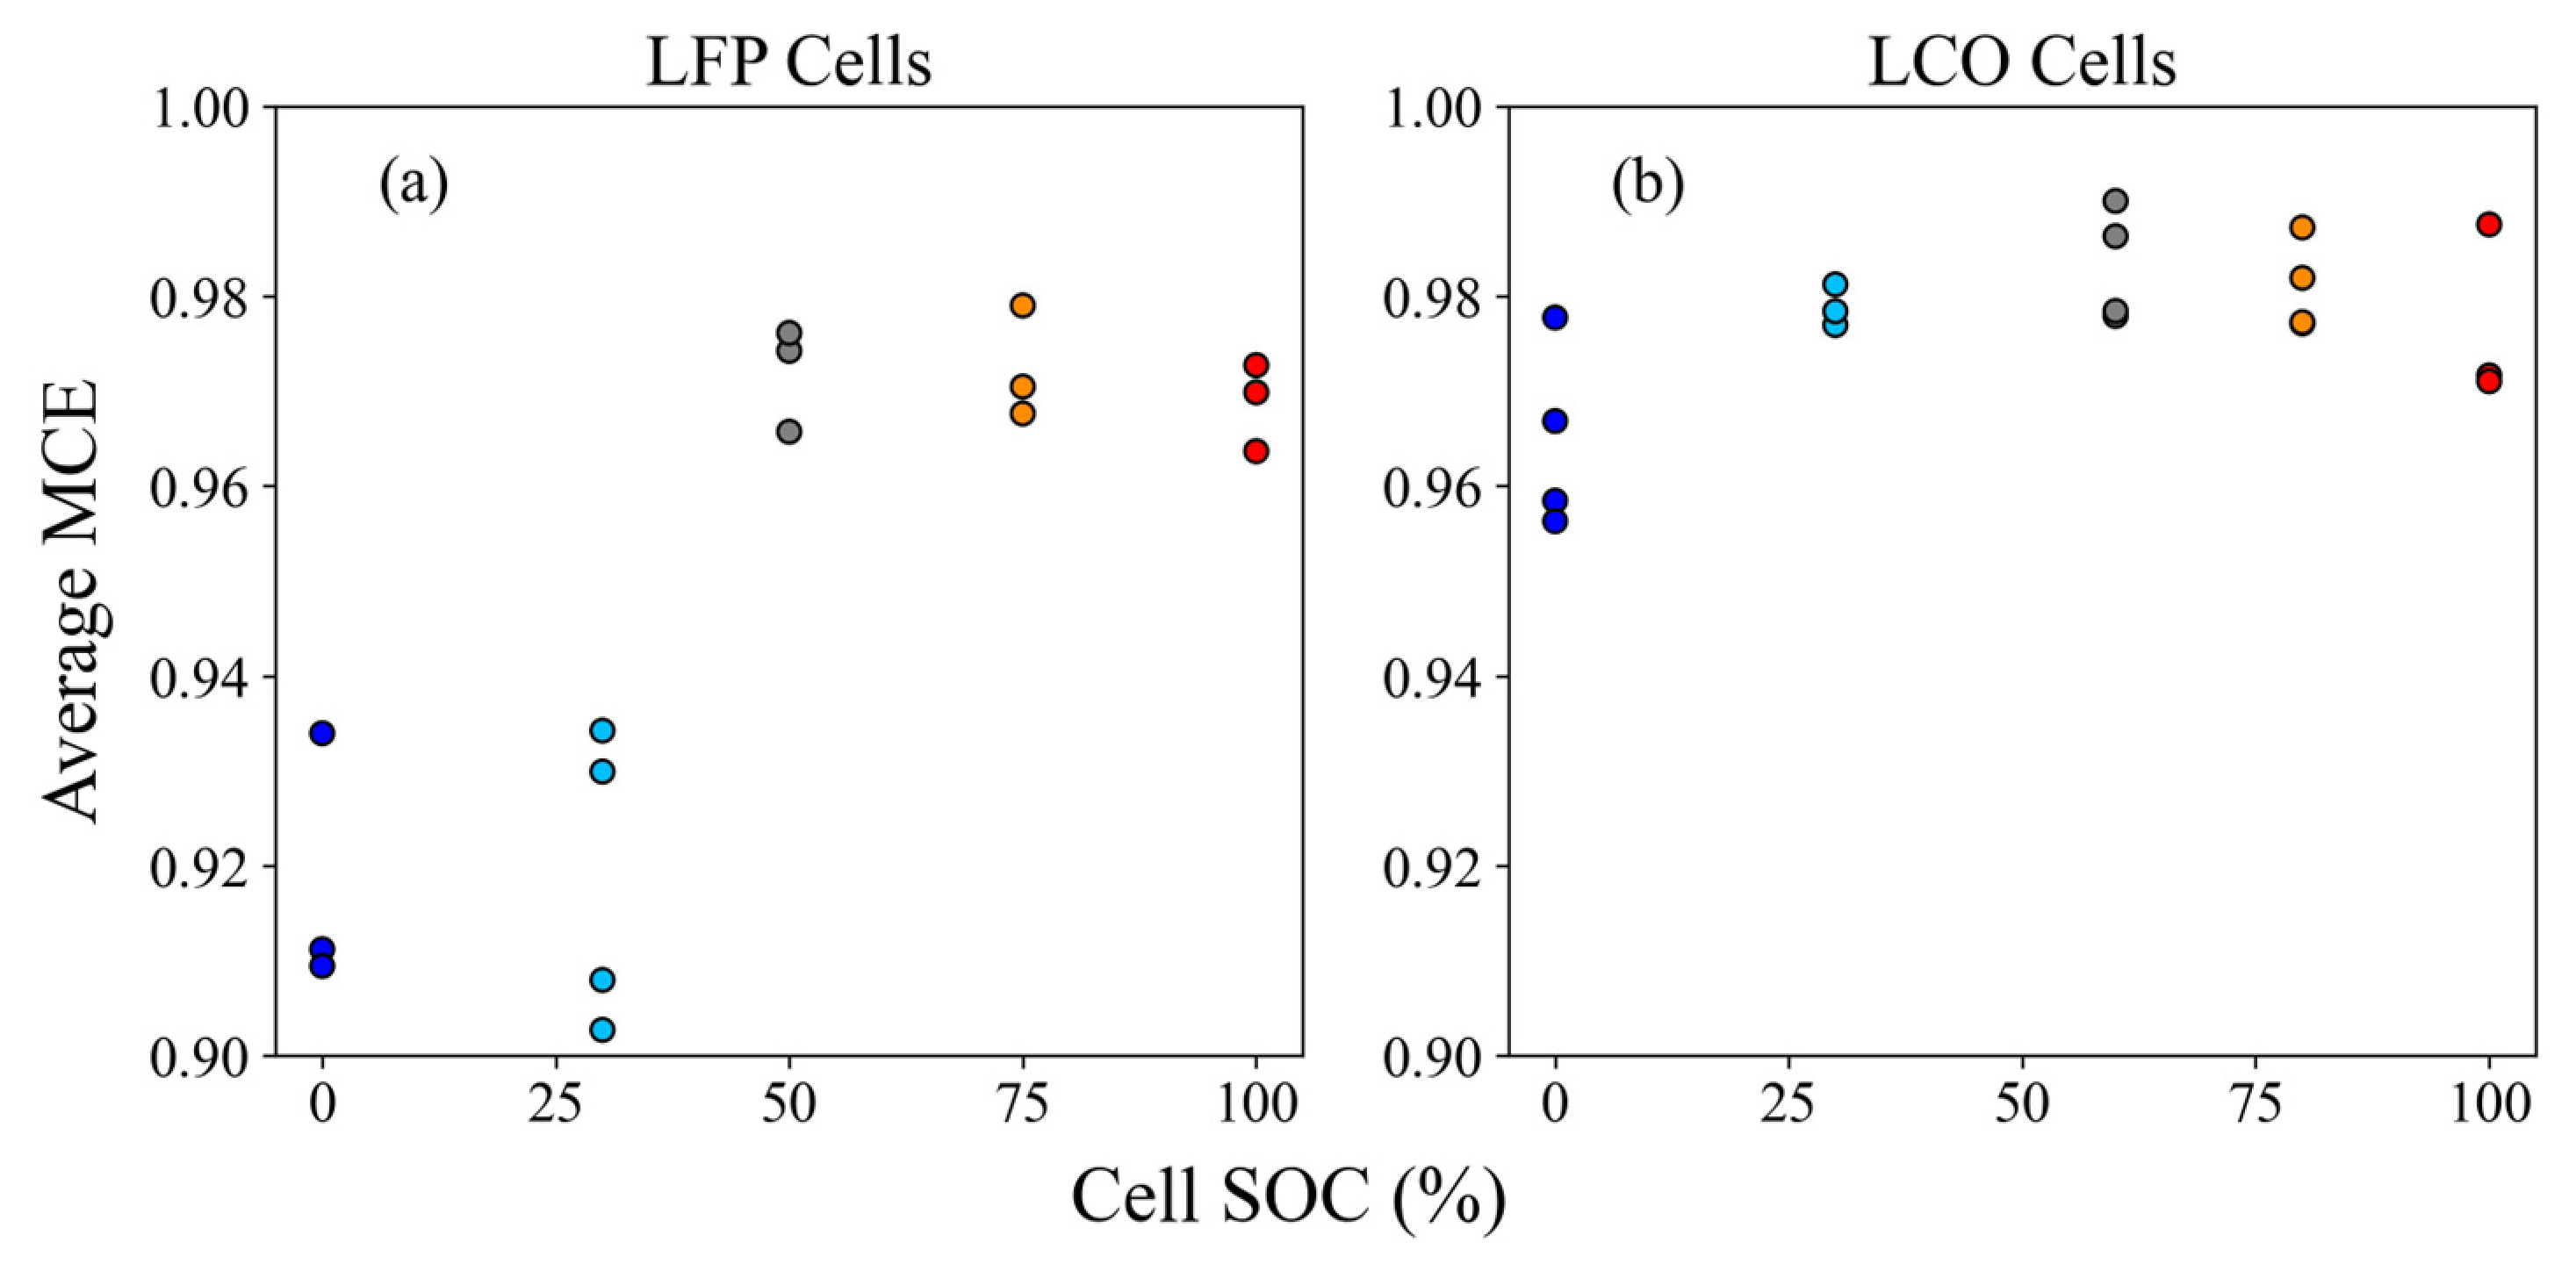
MCE was averaged for each test during the period where CO
2 values were >1% of their maximum. As shown in
Figure 3, the average MCE for LFP tests remained under 0.94 for SOCs below 50%, then increased to above 0.96 at higher SOCs. In contrast, MCE values for LCO tests exceeded 0.95 across all SOCs. These results align with visual observations that LFP tests did not flame for SOCs below 50%, whereas LCO tests flamed at all SOCs. This difference is likely due to the higher thermal stability of LFP chemistry and the sealed cylindrical casing, which limits atmospheric O
2 ingress.
3.2. Toxic Gas Emissions
Table 1 lists recommended exposure limits (RELs) and Immediate Danger to Life and Health (IDLH) concentrations published by the U.S. National Institute for Occupational Safety and Health (NIOSH) [
13], the permissible exposure limits (PELs) by the Occupational Safety and Health Administration (OSHA) [
14], the three tiers of Acute Exposure Guideline Levels (AEGLs) by the U.S. EPA [
15], and the three tiers of exposure limits from the Emergency Response Planning Guidelines (ERPGs) by the American Industrial Hygiene Association (AIHA) [
16] for selected toxic gases emitted from LIB combustion.
Both CO
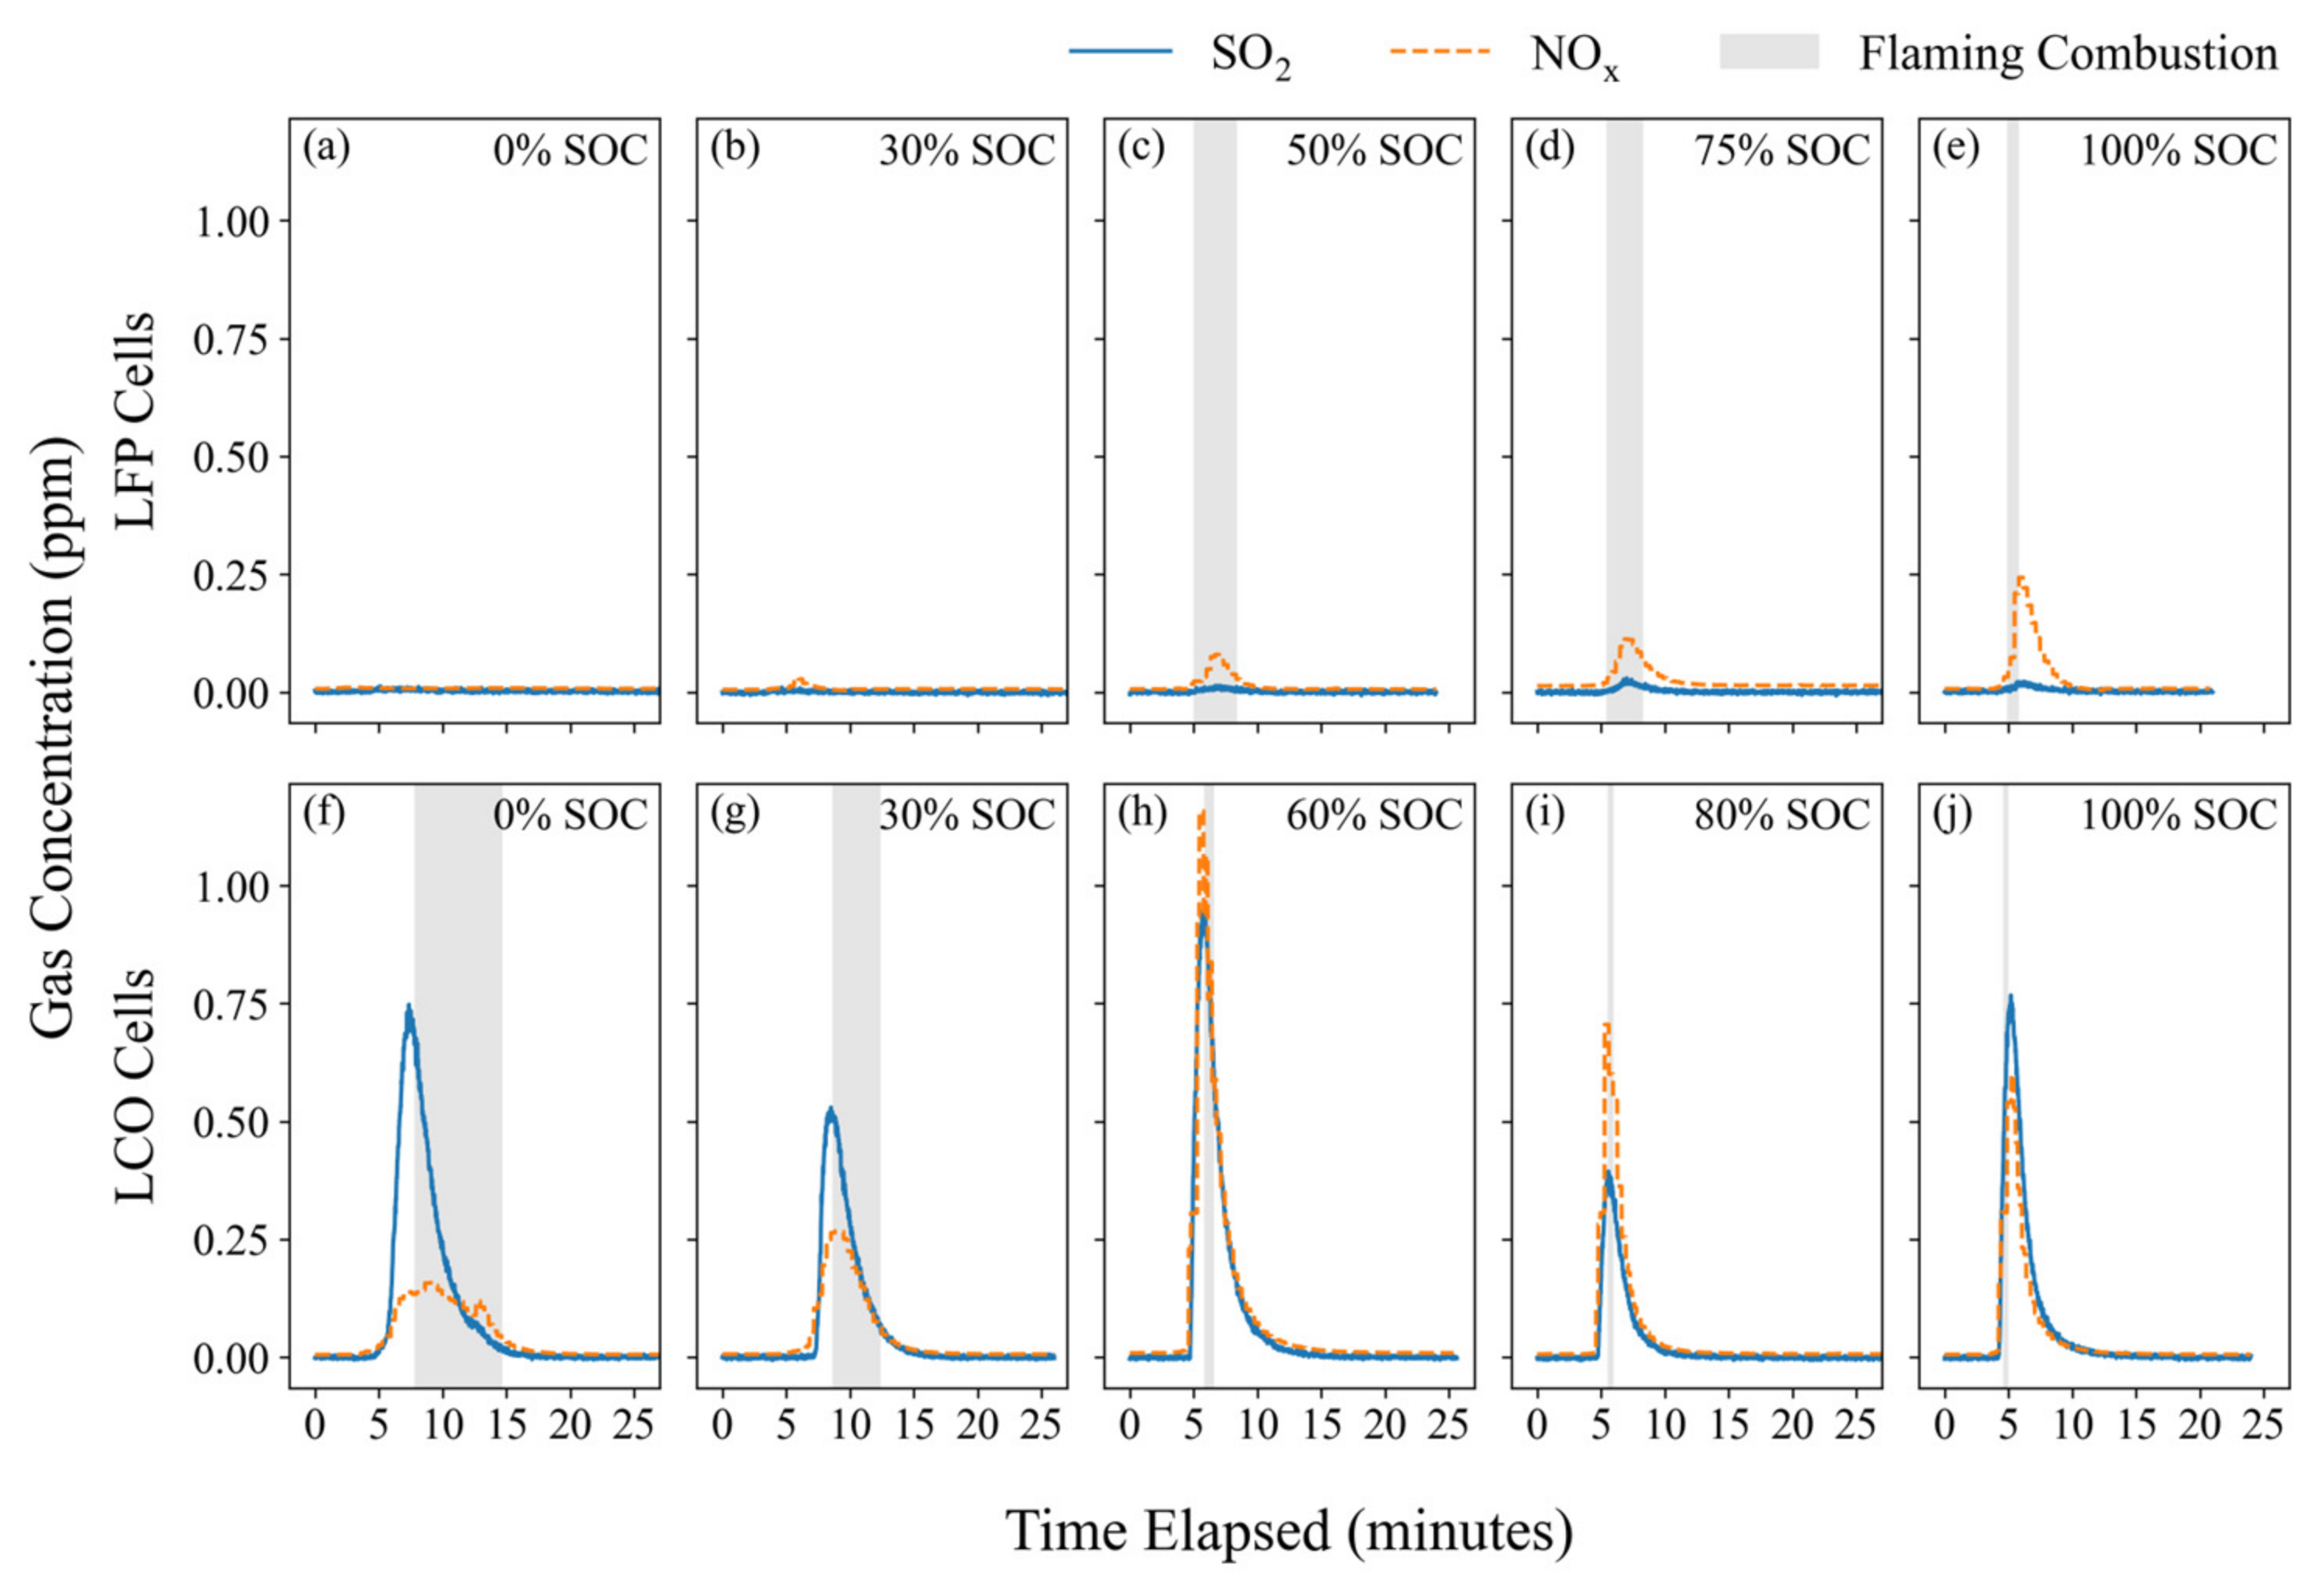
2 and CO levels stayed below their respective RELs of 5000 and 35 ppm, respectively, for all tests, with only one test showing CO concentrations reaching 30 ppm. Similarly, as shown in
Figure 4, SO
2 remained below its REL of 2 ppm, while neither NO nor NO
2 exceeded their RELs. However, the rapid rise in concentrations, especially for LCO tests, where significant emissions occurred for all SOCs, from the combustion of individual, small LIB cells indicates that larger battery packs could quickly emit hazardous levels of these species, especially in enclosed spaces with limited ventilation.
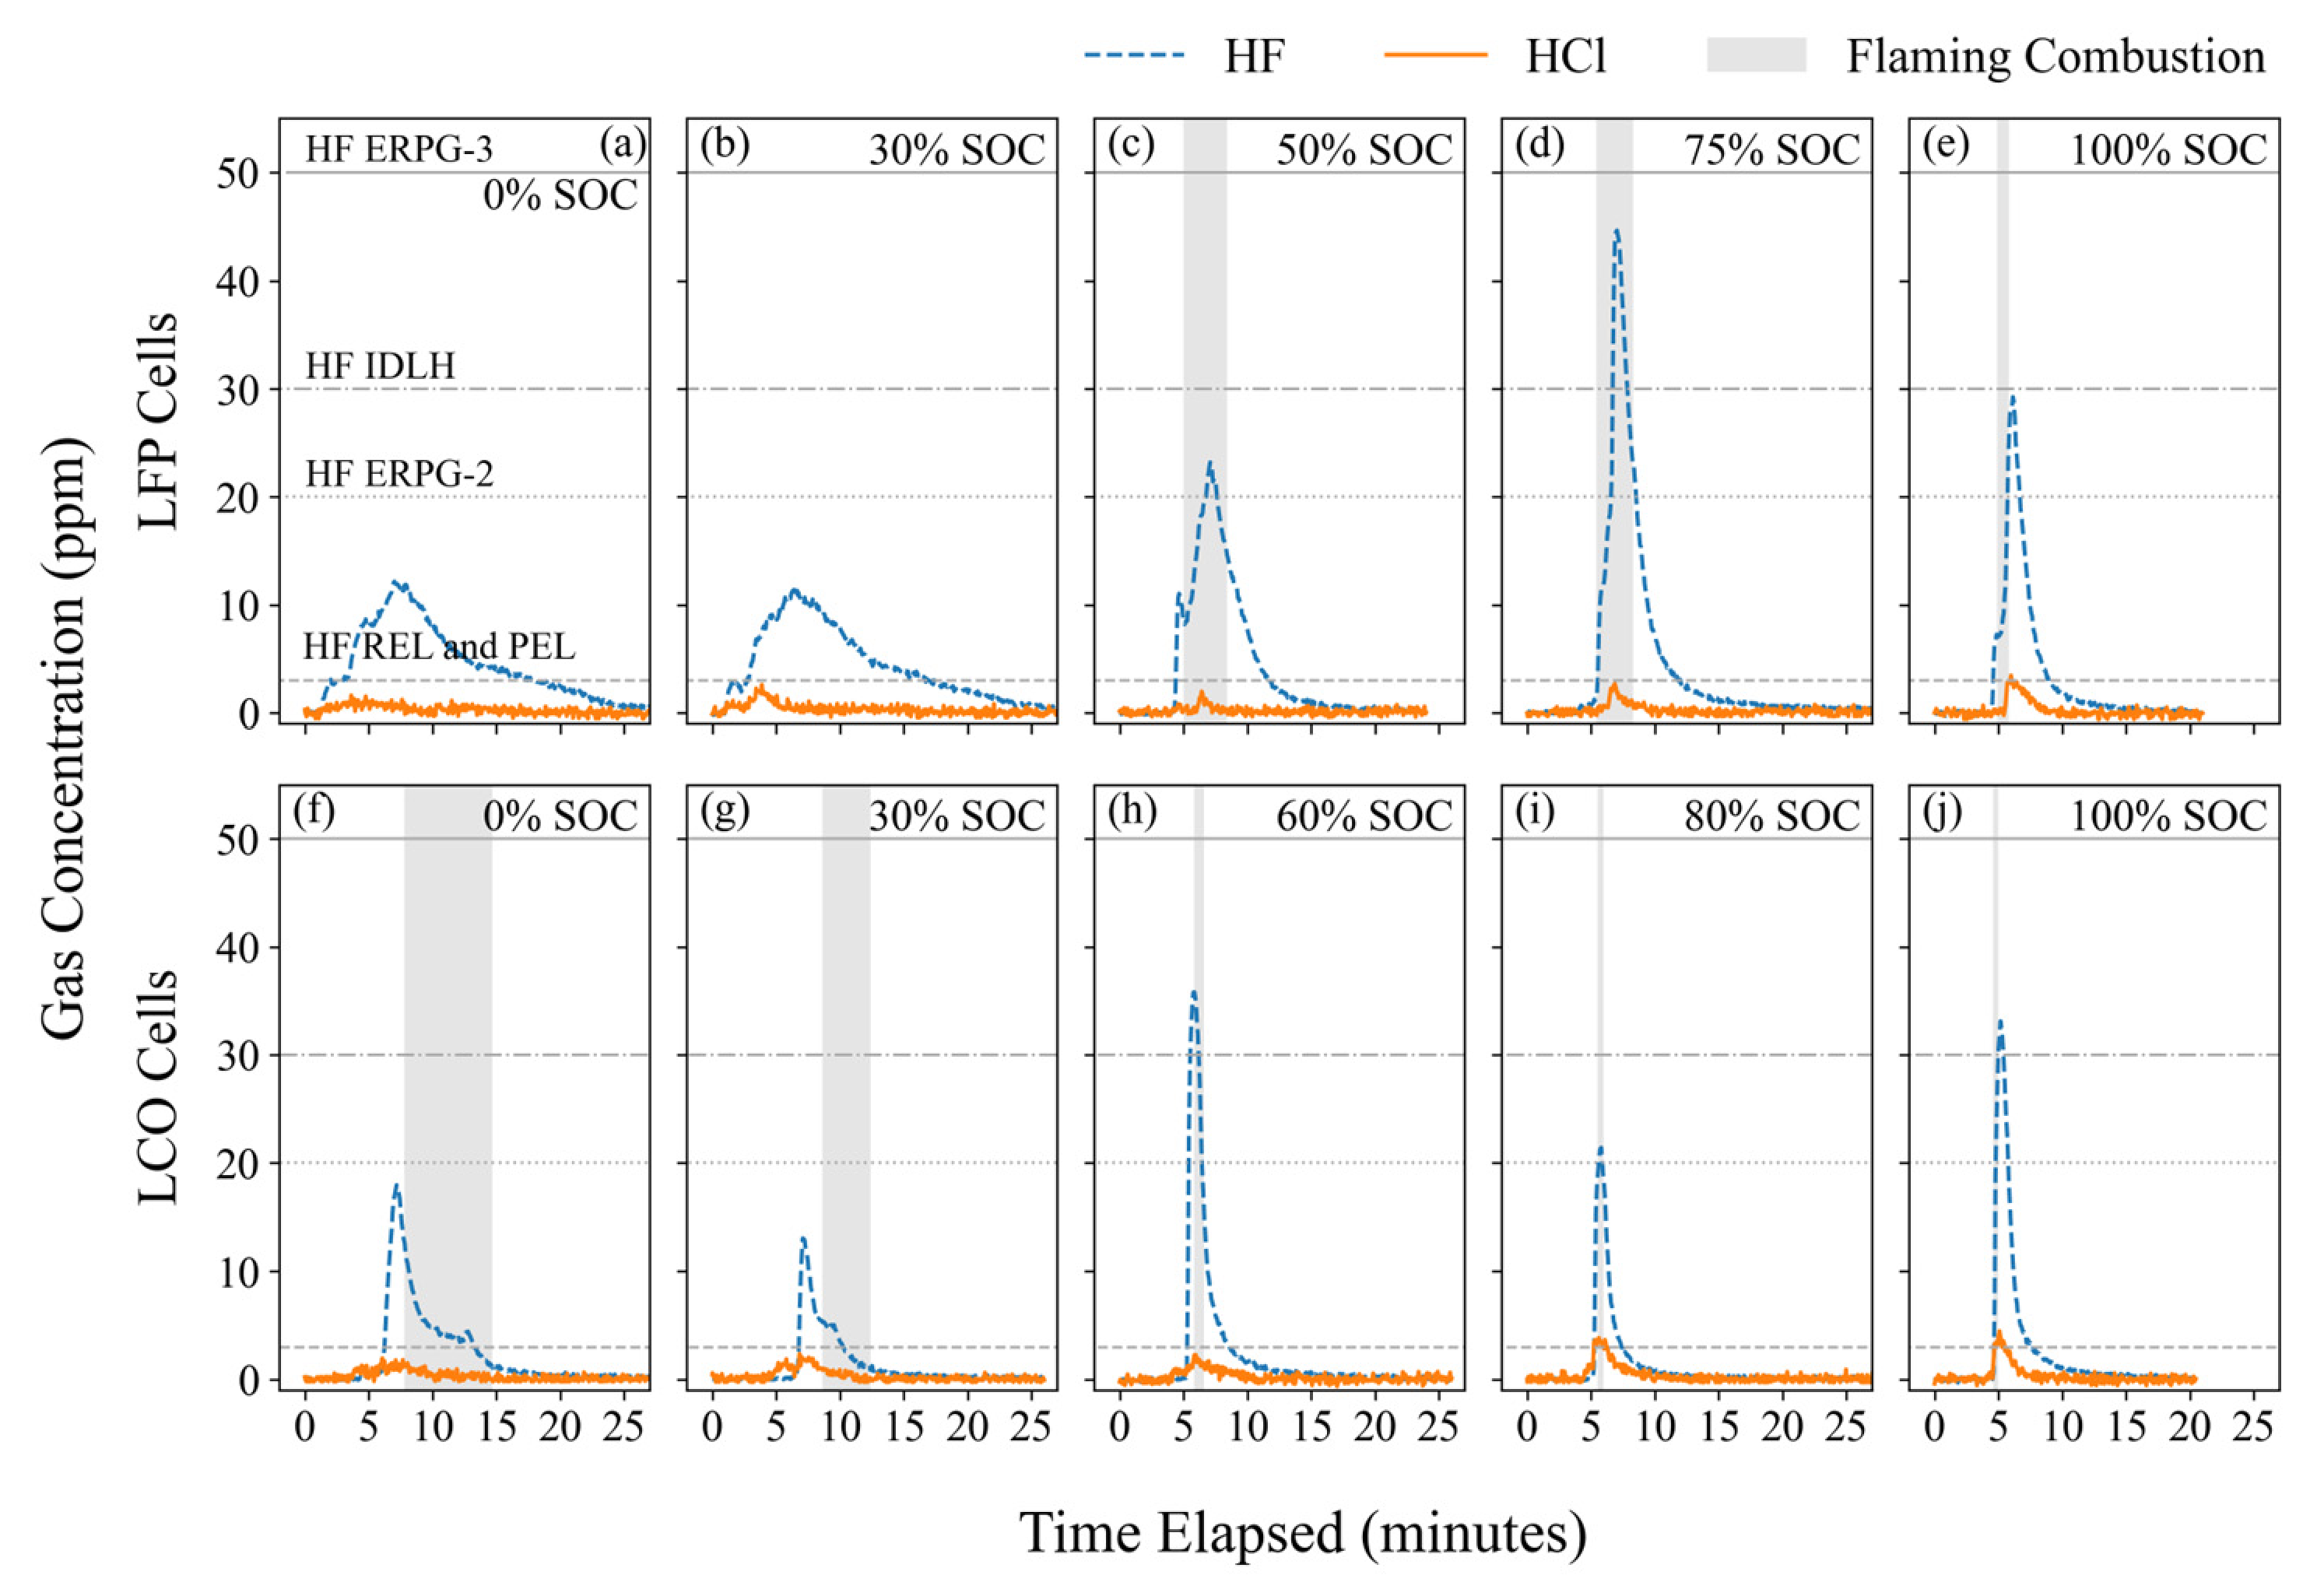
Significant emissions of acidic gases are a major concern in LIB fire safety. Concentration time series for HF and HCl are shown in
Figure 5, while HCN concentrations remained below detection limits for all tests. Peak HF concentrations exceeded the REL and PEL (3 ppm) in all tests. The 1 h ERPG-2 (20 ppm), 1 h AEGL-2 (24 ppm), and 30 min IDLH limits (30 ppm) were exceeded in 57%, 45%, and 36% of tests, respectively.
All three 75% SOC LFP tests reached the AEGL-3 of 44 ppm, at which life-threatening health effects are expected. The fact that every 75% SOC LFP test had higher peak HF concentrations than any other test condition is critical, indicating significant differences in HF exposure can result from relatively small SOC differences. HF emission peaks during LCO tests were generally narrower than those in LFP tests, likely indicating more intense combustions, and had the highest HF concentrations occurring at 60% SOC. All but two LFP and LCO tests had HCl concentration peaks below the REL and PEL of 5 ppm, and 30% of tests reached the ERPG-1 of 3 ppm. As previously discussed, these concentrations resulted from the combustion of individual, small LIB cells in a well-ventilated chamber. Combustion involving multiple and/or larger LIB cells in an enclosed area would produce substantially higher, and possibly lethal, HF concentrations and harmful HCl concentrations.
3.3. Flammable Gas Emissions
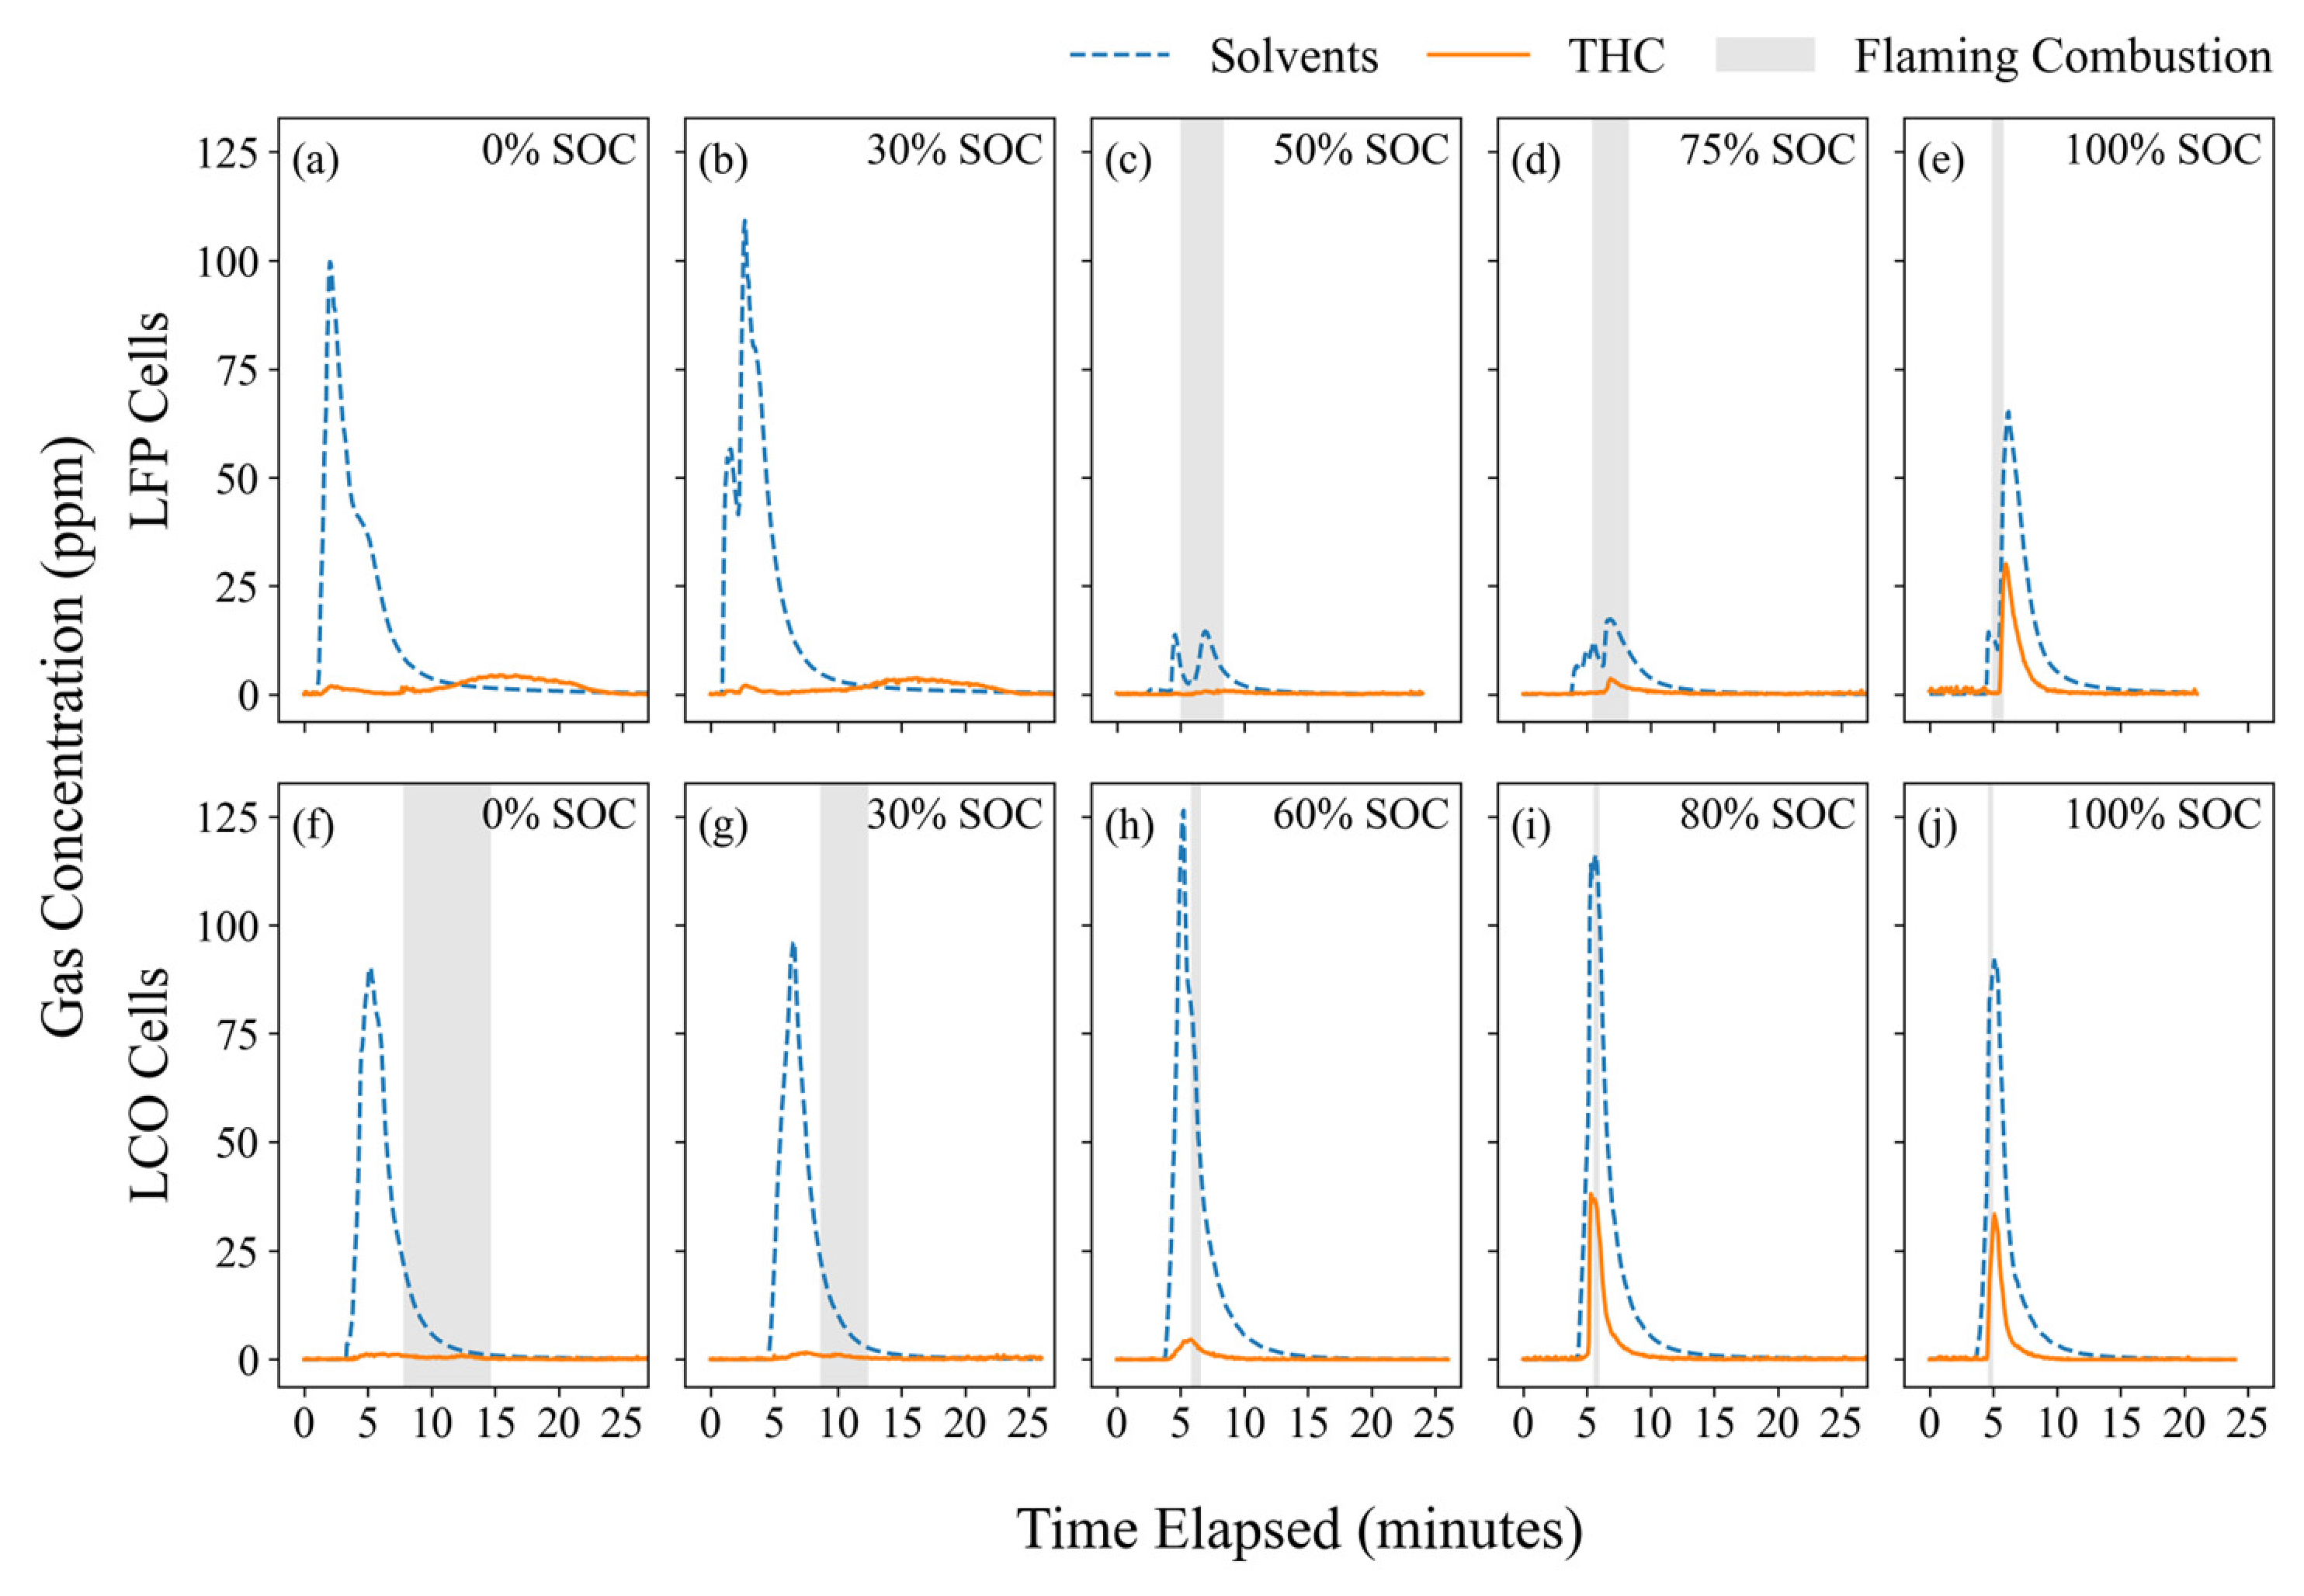
Evaporated electrolyte solvents were abundant in LIB emissions, as shown in
Figure 6. For LFP tests, solvent concentrations were highest at low SOCs and dropped substantially at 50–75% SOCs. This pattern is likely due to increased solvent combustion at higher SOCs compared to lower SOCs, where flaming combustion did not occur. In contrast, LCO tests showed consistent solvent concentrations across SOCs, with all tests except one exceeding 50 ppm. This behavior is likely attributable to the absence of a solid casing, which allowed evaporating solvents to escape without combusting.
THC concentrations were lower than those of evaporated solvents, but they can pose a greater fire and explosion risk due to their higher flammability. Among the THC components, propane had the highest concentration peaks, while styrene was detected sporadically and mostly in LCO tests. Propane was also detected earliest among the four hydrocarbons, being emitted alongside electrolyte solvents. THC concentrations were variable, reaching 38 ppm for one LCO test (80% SOC); however, three-quarters of all tests recorded maximum concentrations below 9 ppm. These concentrations do not represent an immediate explosion hazard (
Supplementary Table S1) [
17] but indicate that flammable gases could build up in confined areas if many LIB cells undergo TR. THC concentrations were generally higher in LCO tests, possibly due to more venting routes. The commonly reported H
2 gas was not measured in this study but can represent the largest explosion risk during TR [
18].
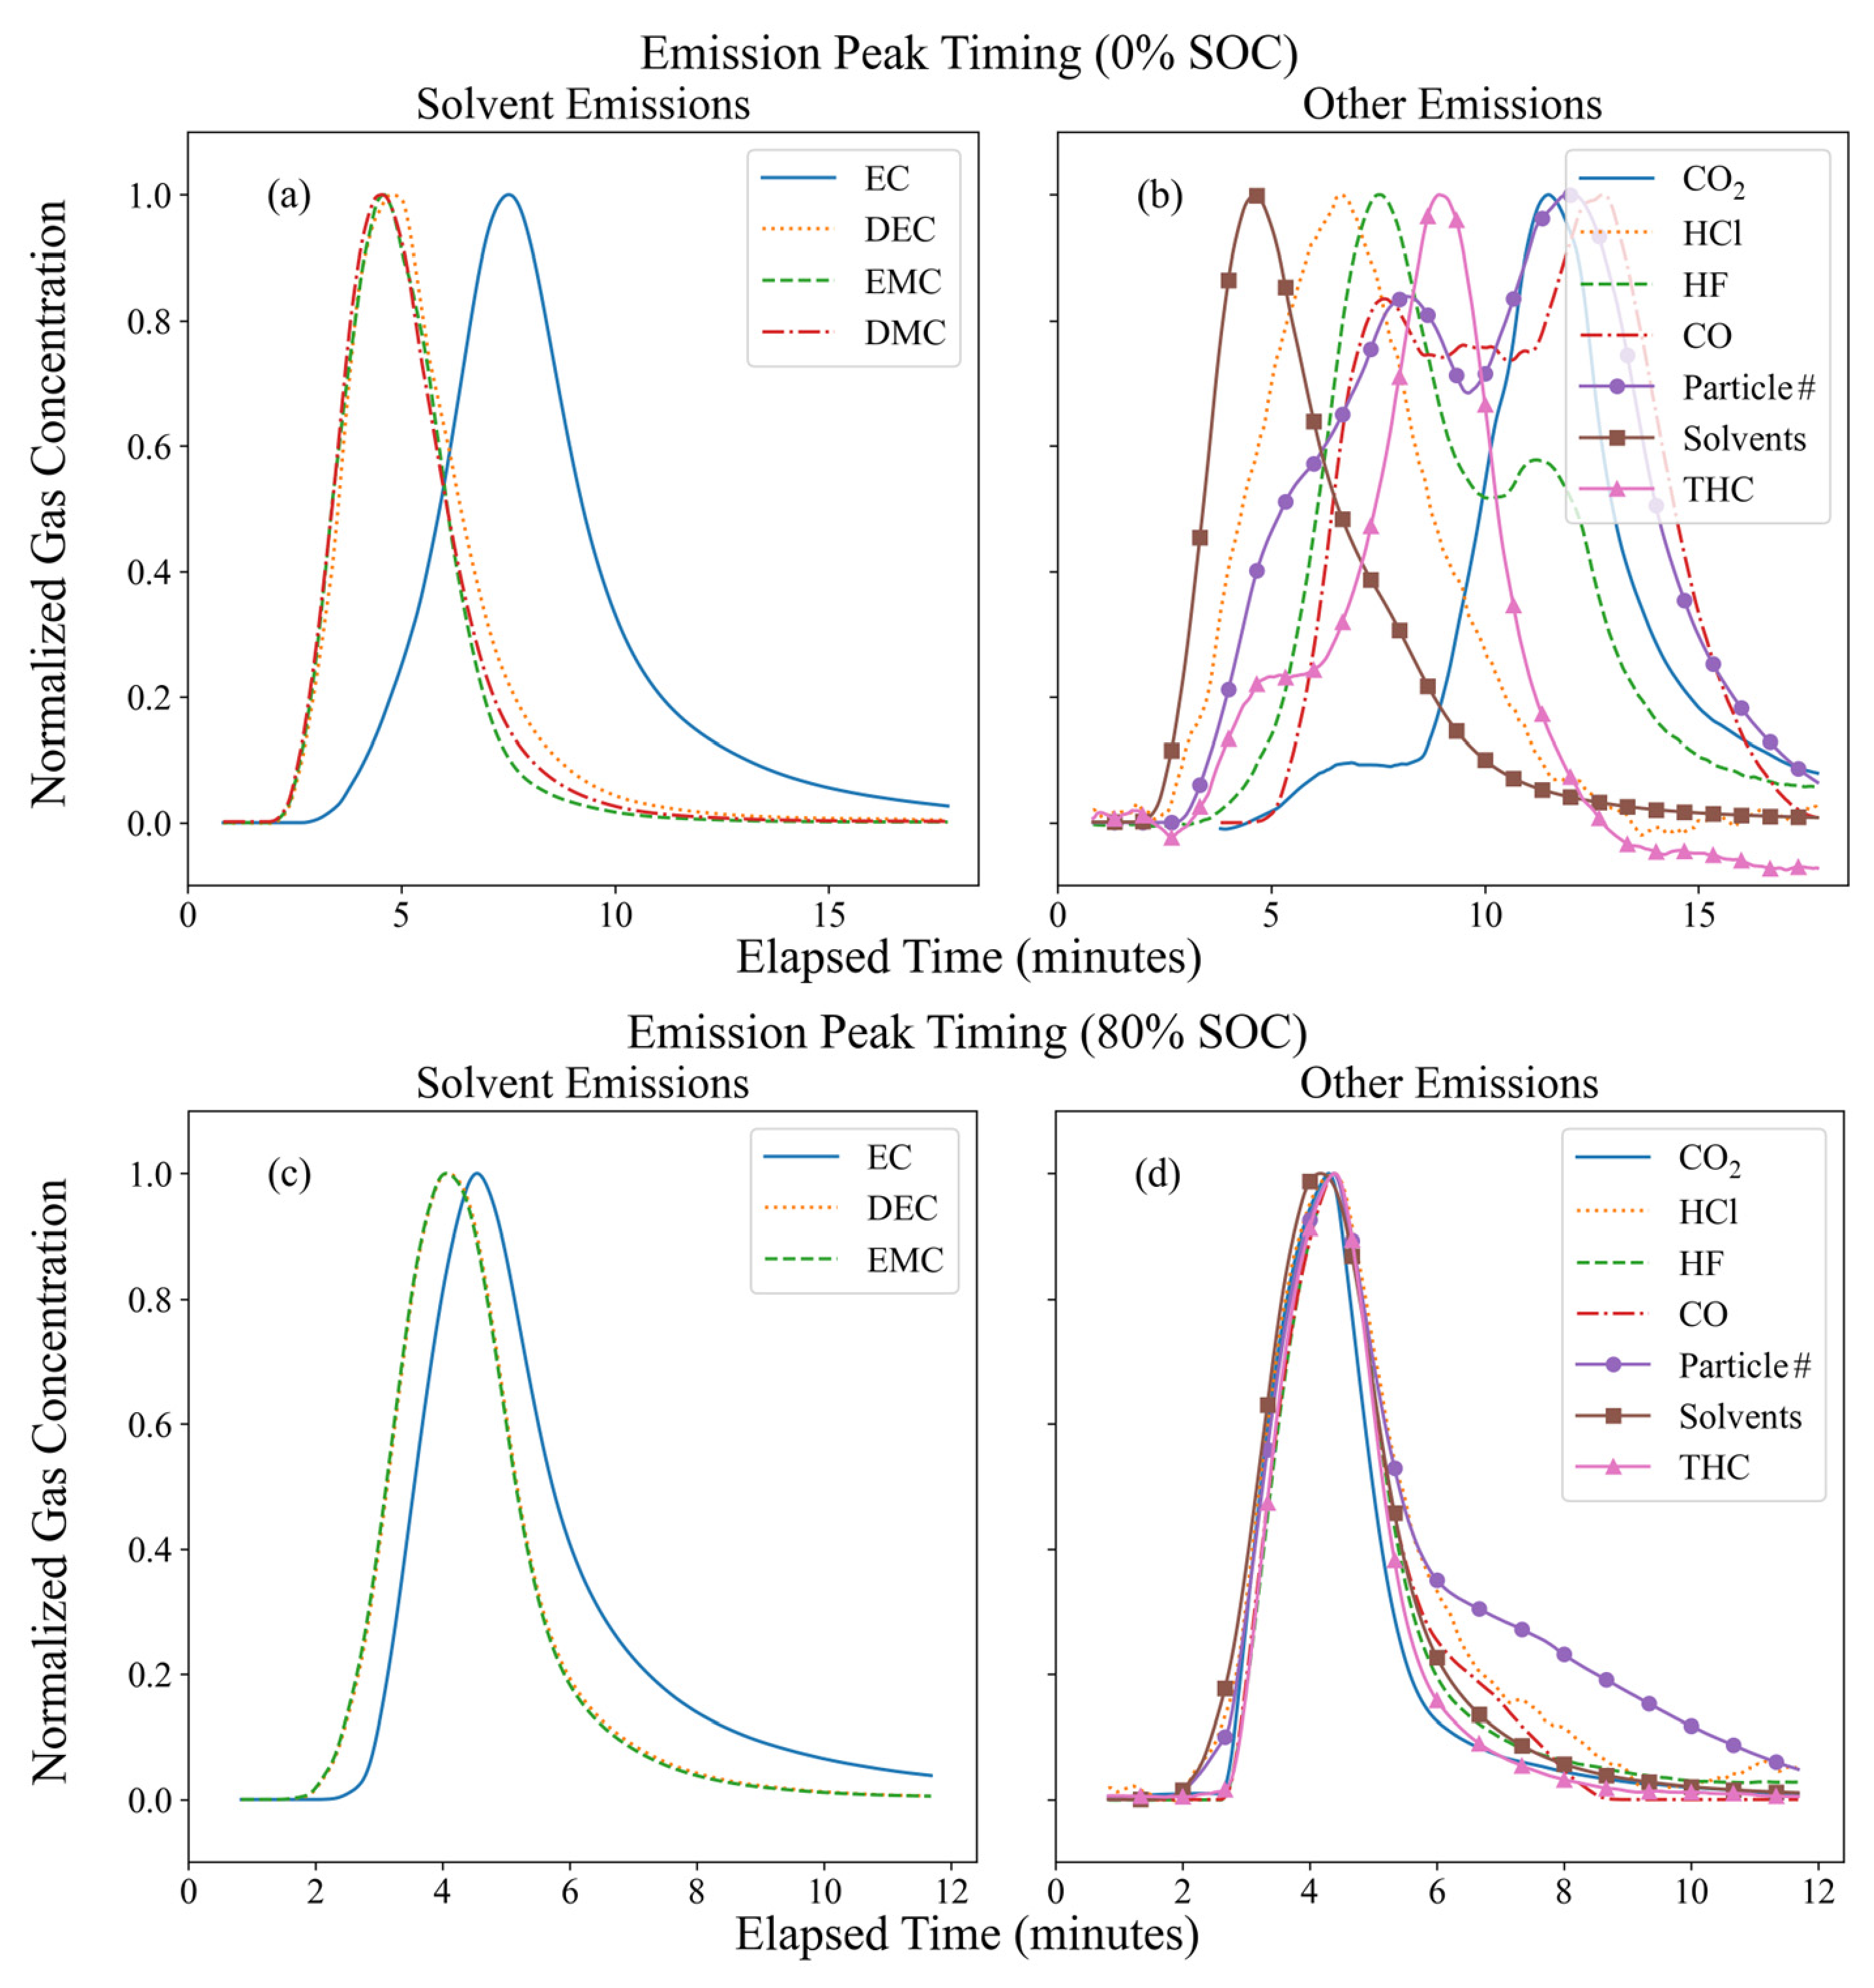
Figure 7 shows the timing of individual solvent species (a and c) and other species (b and d) emitted from 0% and 80% LCO tests. Solvent emissions were detected earlier than other species, occurring during the initial outgassing phase prior to TR. The four solvent species (EC, DEC, EMC, and DMC) also exhibited different onset times, with the less volatile EC released later than the other three. This observation is consistent with the findings of Bertilsson et al. [
19], who reported that cyclic carbonates such as EC are substantially less volatile than non-cyclic carbonates such as DMC, with evaporation onset temperatures of 140 and 28 °C, respectively. Clear differences in the release timing of other species were also seen for the 0% SOC LCO test (
Figure 7b), with emissions occurring in the following order: total solvents, HCl, HF, THC, CO, and CO
2. Particle emissions followed the CO emission profile. At higher SOCs, peaks occurred more simultaneously (
Figure 7d); however, solvent, HCl, and particle emissions started rising earlier than other species.
3.4. SOC Effect on Concentration
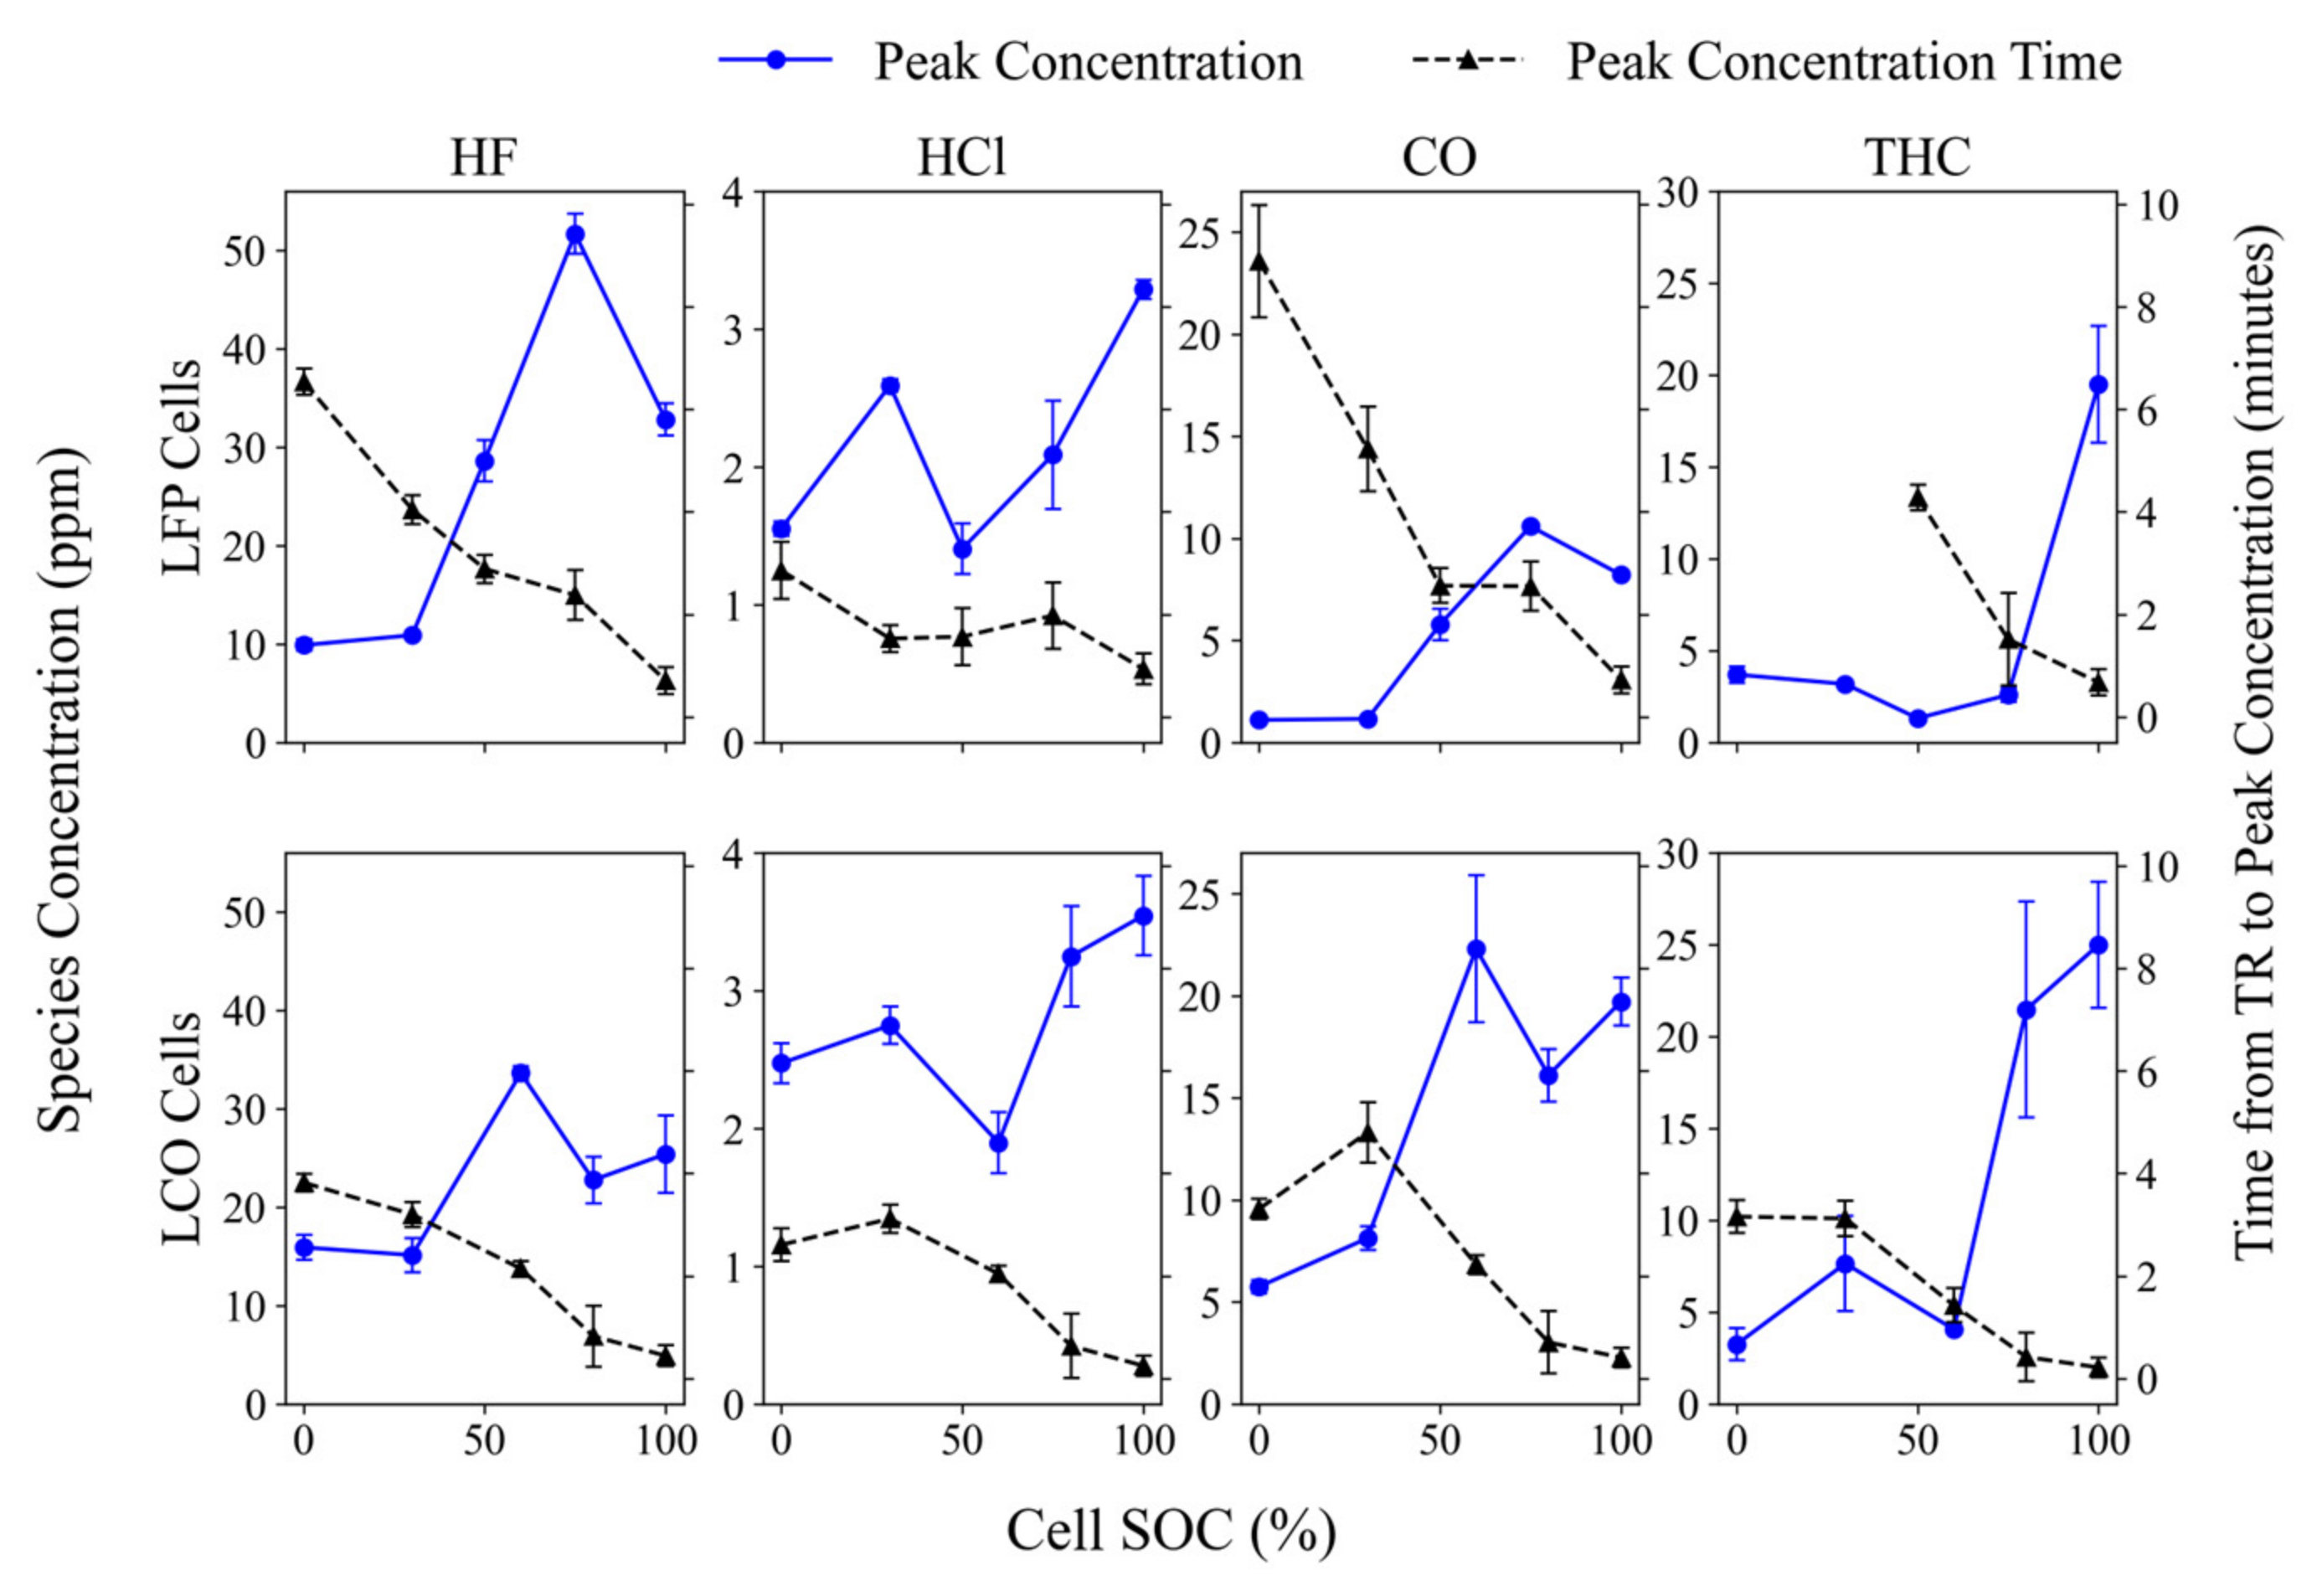
Figure 8 shows that peak concentrations and the timing of these peaks depend on cell SOC. With increasing SOC, peak concentrations often increased and occurred sooner after TR was triggered. When cell SOC increased from 0% to 100%, HF concentration peaks increased by 23 and 10 ppm for LFP and LCO tests, with the peak occurring 6 and 3 min sooner after TR start, respectively. The reduction in time between TR starting and peak emission concentrations is important as it leaves less time to extinguish a combusting cell, vent combustion emissions, or evacuate the area before potentially lethal concentrations of HF are present. HCl and CO also had increased peak concentrations at high SOCs and had peak concentrations occurring 2–8 min sooner after TR start. NO
x and SO
2 concentration peaks occurred 3–4 min sooner after TR start, but only NO
x showed increased peak concentrations. Peak THC concentrations increased five- to eight-fold from 0% to 100% SOC and occurred 3–4 min sooner after TR start, increasing the risk of ignition or explosion.
3.5. Gas Emission Factors
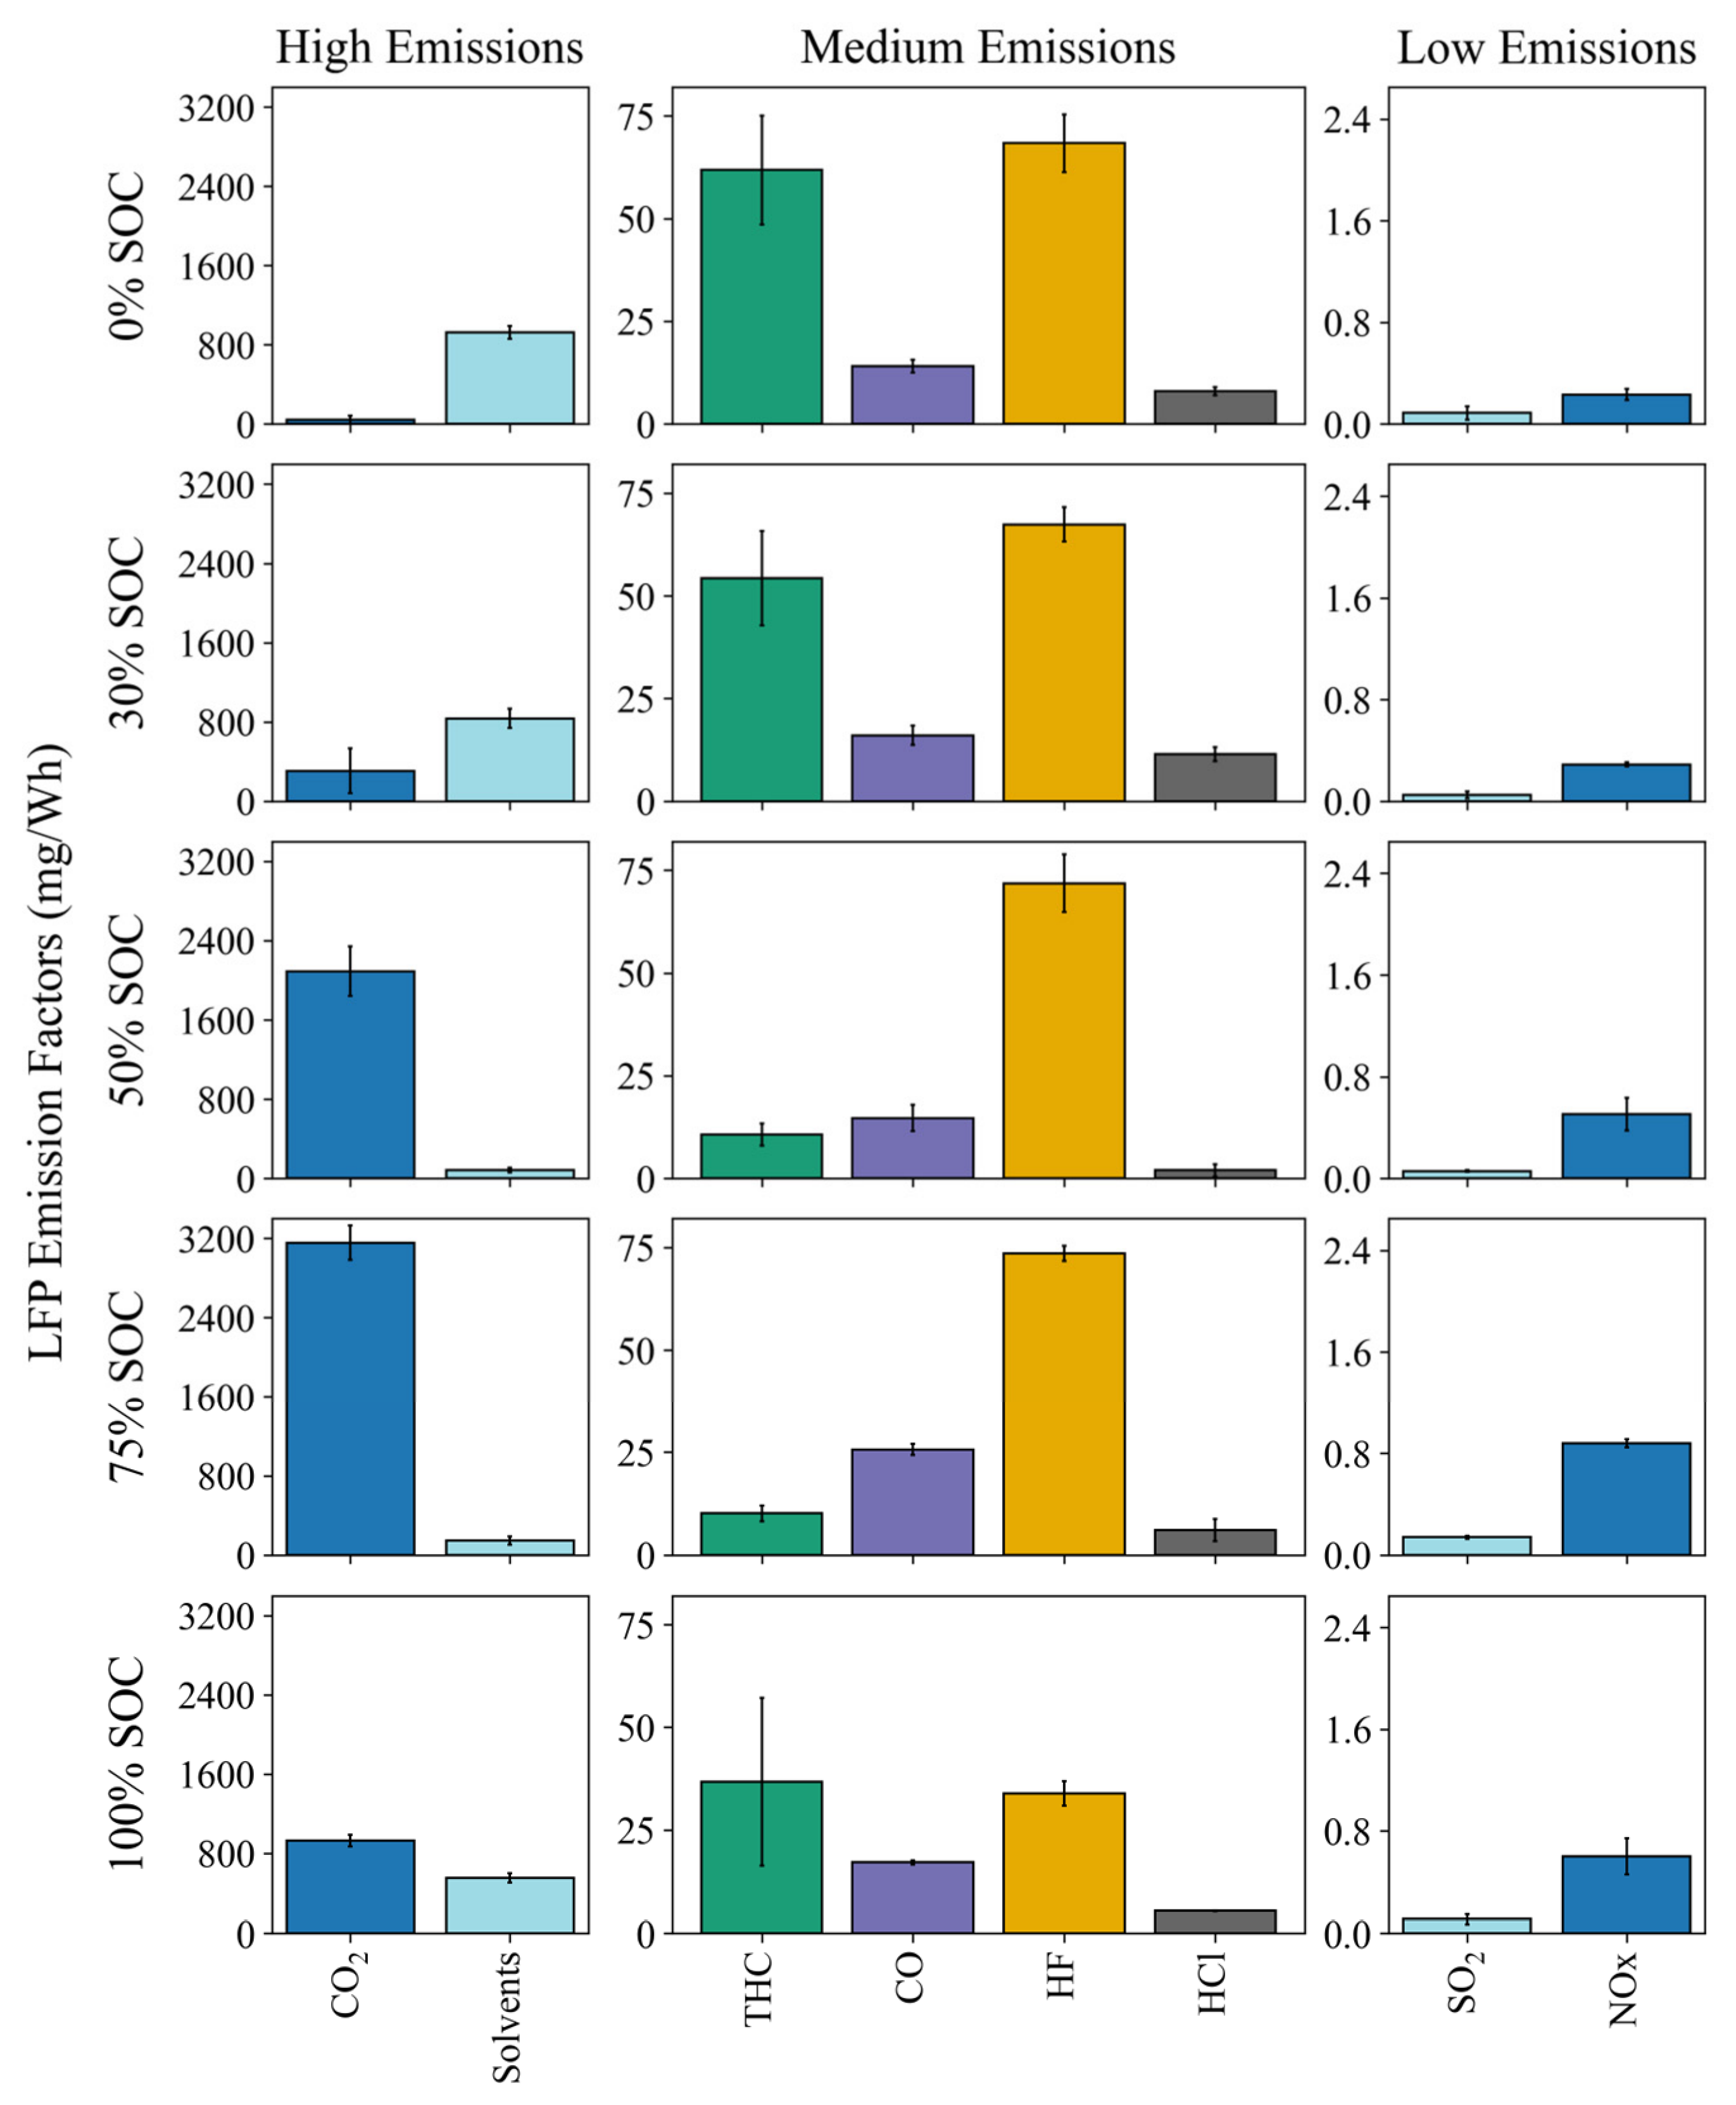
While peak concentrations and emissions evolution are useful when determining local and acute impacts, EFs allow for easier extrapolation, comparison, and evaluation of overall plume impacts. EFs for selected gas species from LFP tests are shown in
Figure 9 and are also reported in
Supplementary Table S2. CO
2 EFs varied considerably for LFP tests, ranging from 42 mg/Wh at 0% SOC to 3157 mg/Wh at 75% SOC. Solvent EFs were lower for 50% and 75% SOCs but were consistently higher at 555–924 mg/Wh for other SOCs. Among the detected solvents, EC and DMC had the highest EFs, followed by EMC and then DEC. THC EFs were also lower at 50% and 75% SOCs, with larger within-SOC variability. Overall, solvent EFs were 4–40 times higher than THC EFs. HF EFs ranged from 67 to 73 mg/Wh at all SOCs except 100% SOC, which showed a lower EF of 34 mg/Wh. This consistency indicates that a large fraction of the available LiPF
6 is converted to HF via Equations (1)–(3) at most SOCs. HCl EFs were below 12 mg/Wh for all SOCs and showed the lowest EFs at 50% SOC. CO EFs were consistent (14–26 mg/Wh) across SOCs. SO
2 and NO
x EFs were minimal due to their small and short-lived emission peaks, reaching up to 0.2 and 1 mg/Wh in individual tests, respectively.
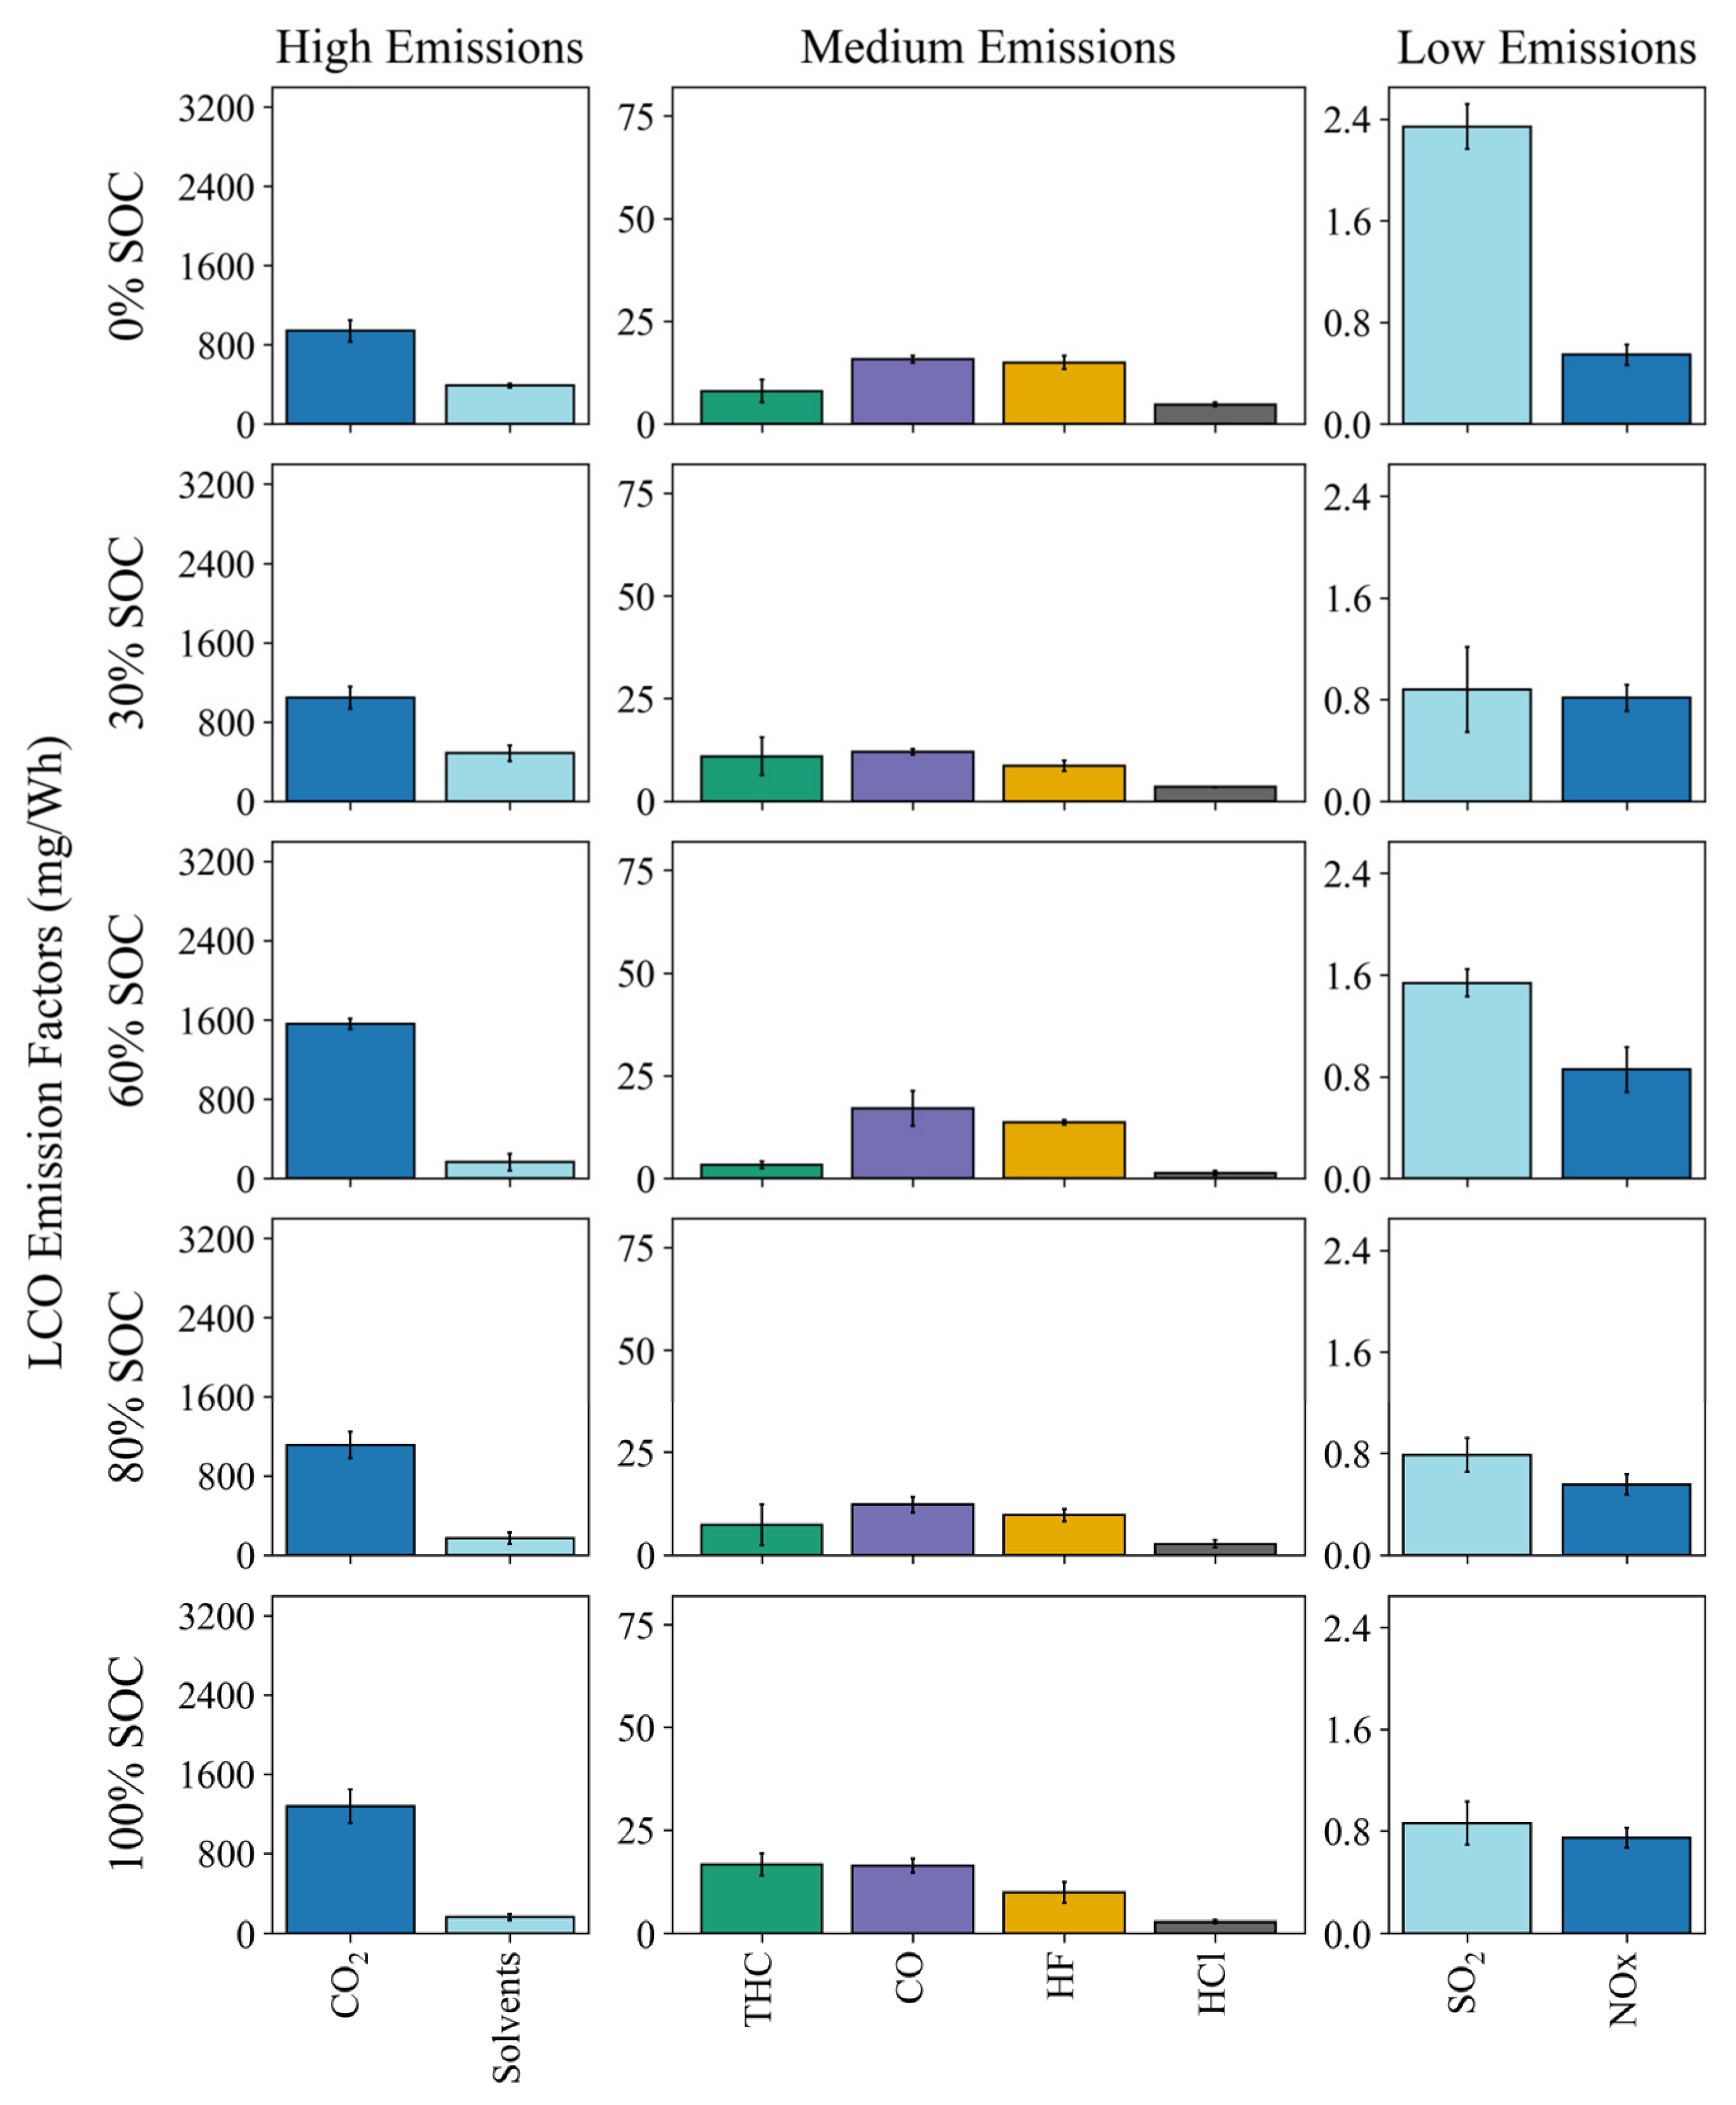
EFs for LCO tests are shown in
Figure 10. Compared to LFP tests, LCO tests exhibited fewer variabilities across SOCs and generally had lower EFs for all species except SO
2, NO
x, and CO
2 at some SOCs. LCO solvent EFs dropped at SOCs above 60%, although SOC averages were more similar to one another than in LFP tests. Solvent EFs ranged from 160 to 485 mg/Wh and were up to 100 times higher than THC EFs. HF EFs were consistent at 9–15 mg/Wh, and HCl EFs ranged from 1 to 5 mg/Wh. HF, HCl, and THC EFs were lower than those observed in LFP tests at all comparable SOCs, with LFP EFs being higher by 3–8-, 1.5–3-, and 1.4–8-fold, respectively. Therefore, although LFP cells are thermally more stable than LCO cells, they exhibit higher EFs for HF, consistent with an earlier study [
20]. CO EFs were similar between the two cell types. In contrast, average SO
2 and NO
x EFs were higher than LFP tests for most comparable SOCs, with SO
2 increasing by 9–23-fold and NO
x increasing by up to 3-fold.
Acidic gas emissions may be affected by ambient RH due to reactions between the species. For example, Zhou et al. found that increased RH limited the diffusion of gaseous HF [
21].
Figure S4 shows that HF emissions increased with H
2O emissions in most tests. It is not known, however, whether this is a causal relationship or the result of generally increased emissions.
Table 2 compares the EFs in
Figure 9 and
Figure 10 with aggregated literature values from Bugryniec et al. [
1], including three LFP SOC categories and overall LCO EFs. Because of the wide spread in published data, literature values are reported as the medians, with the inter-quartile range shown in parenthesis. For LFP tests, CO EFs from this study agree reasonably well with the literature; however, literature CO EFs for LCO tests are substantially higher than those measured here. CO
2 EFs in this study are generally higher than literature values. Notably, the literature reports higher CO
2 EFs at 0% SOC but lower EFs for 50 and 100% SOC in LFP tests, which is unexpected as the smoldering of 0% SOC tests should produce less CO
2. HF EFs measured in this study are within the range reported in the literature, while literature values for HCl, NO
x, and SO
2 were much higher than our findings. Solvent emissions compare well for LCO tests but were much higher in this study for LFP tests. The opposite is true for THC emissions, with LFP tests comparing much better than LCO tests.
3.6. Emission Factor Correlations
Gas EFs vary with cell SOC, MCE, and other combustion metrics.
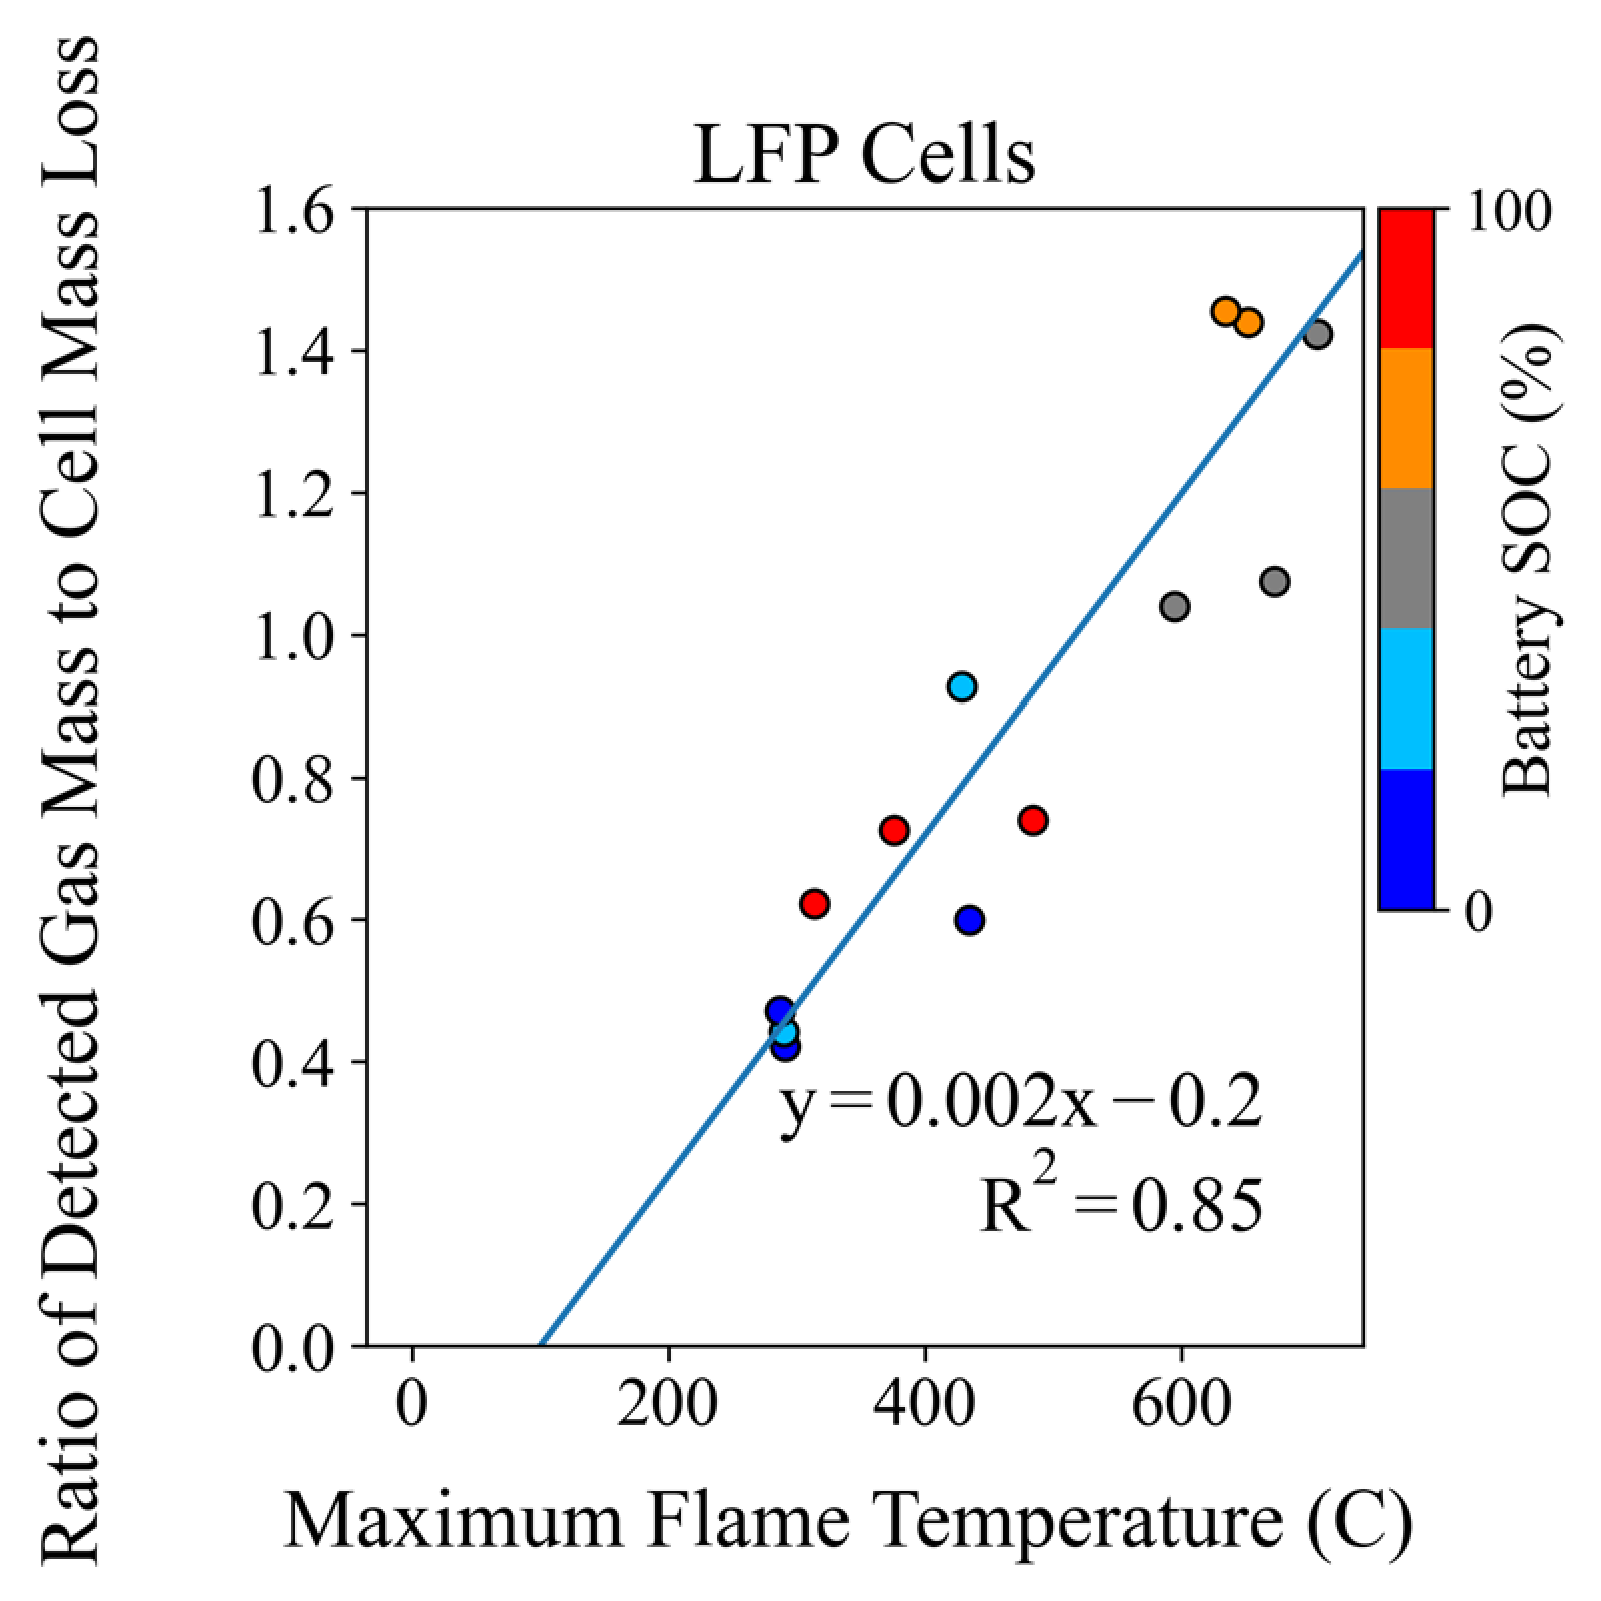
Figure 11 shows the relationship between the ratio of detected gas mass to cell mass loss and flame temperature for LFP tests. The proportion of mass released as gaseous emissions increased from approximately 40% to 140% of total cell mass loss as flame temperature increased. This trend indicates that, although total cell mass loss during combustion remains relatively consistent [
8], a greater fraction of that mass is converted to gaseous rather than particulate emissions as temperature increases. Total gas emissions also increased with maximum detected temperature for LFP tests, increasing fivefold to ~5 g/Wh with an R
2 of 0.64 (
Supplementary Figure S3c). LCO tests did not show these relationships, likely due to challenges in accurately measuring flame temperatures for those tests.
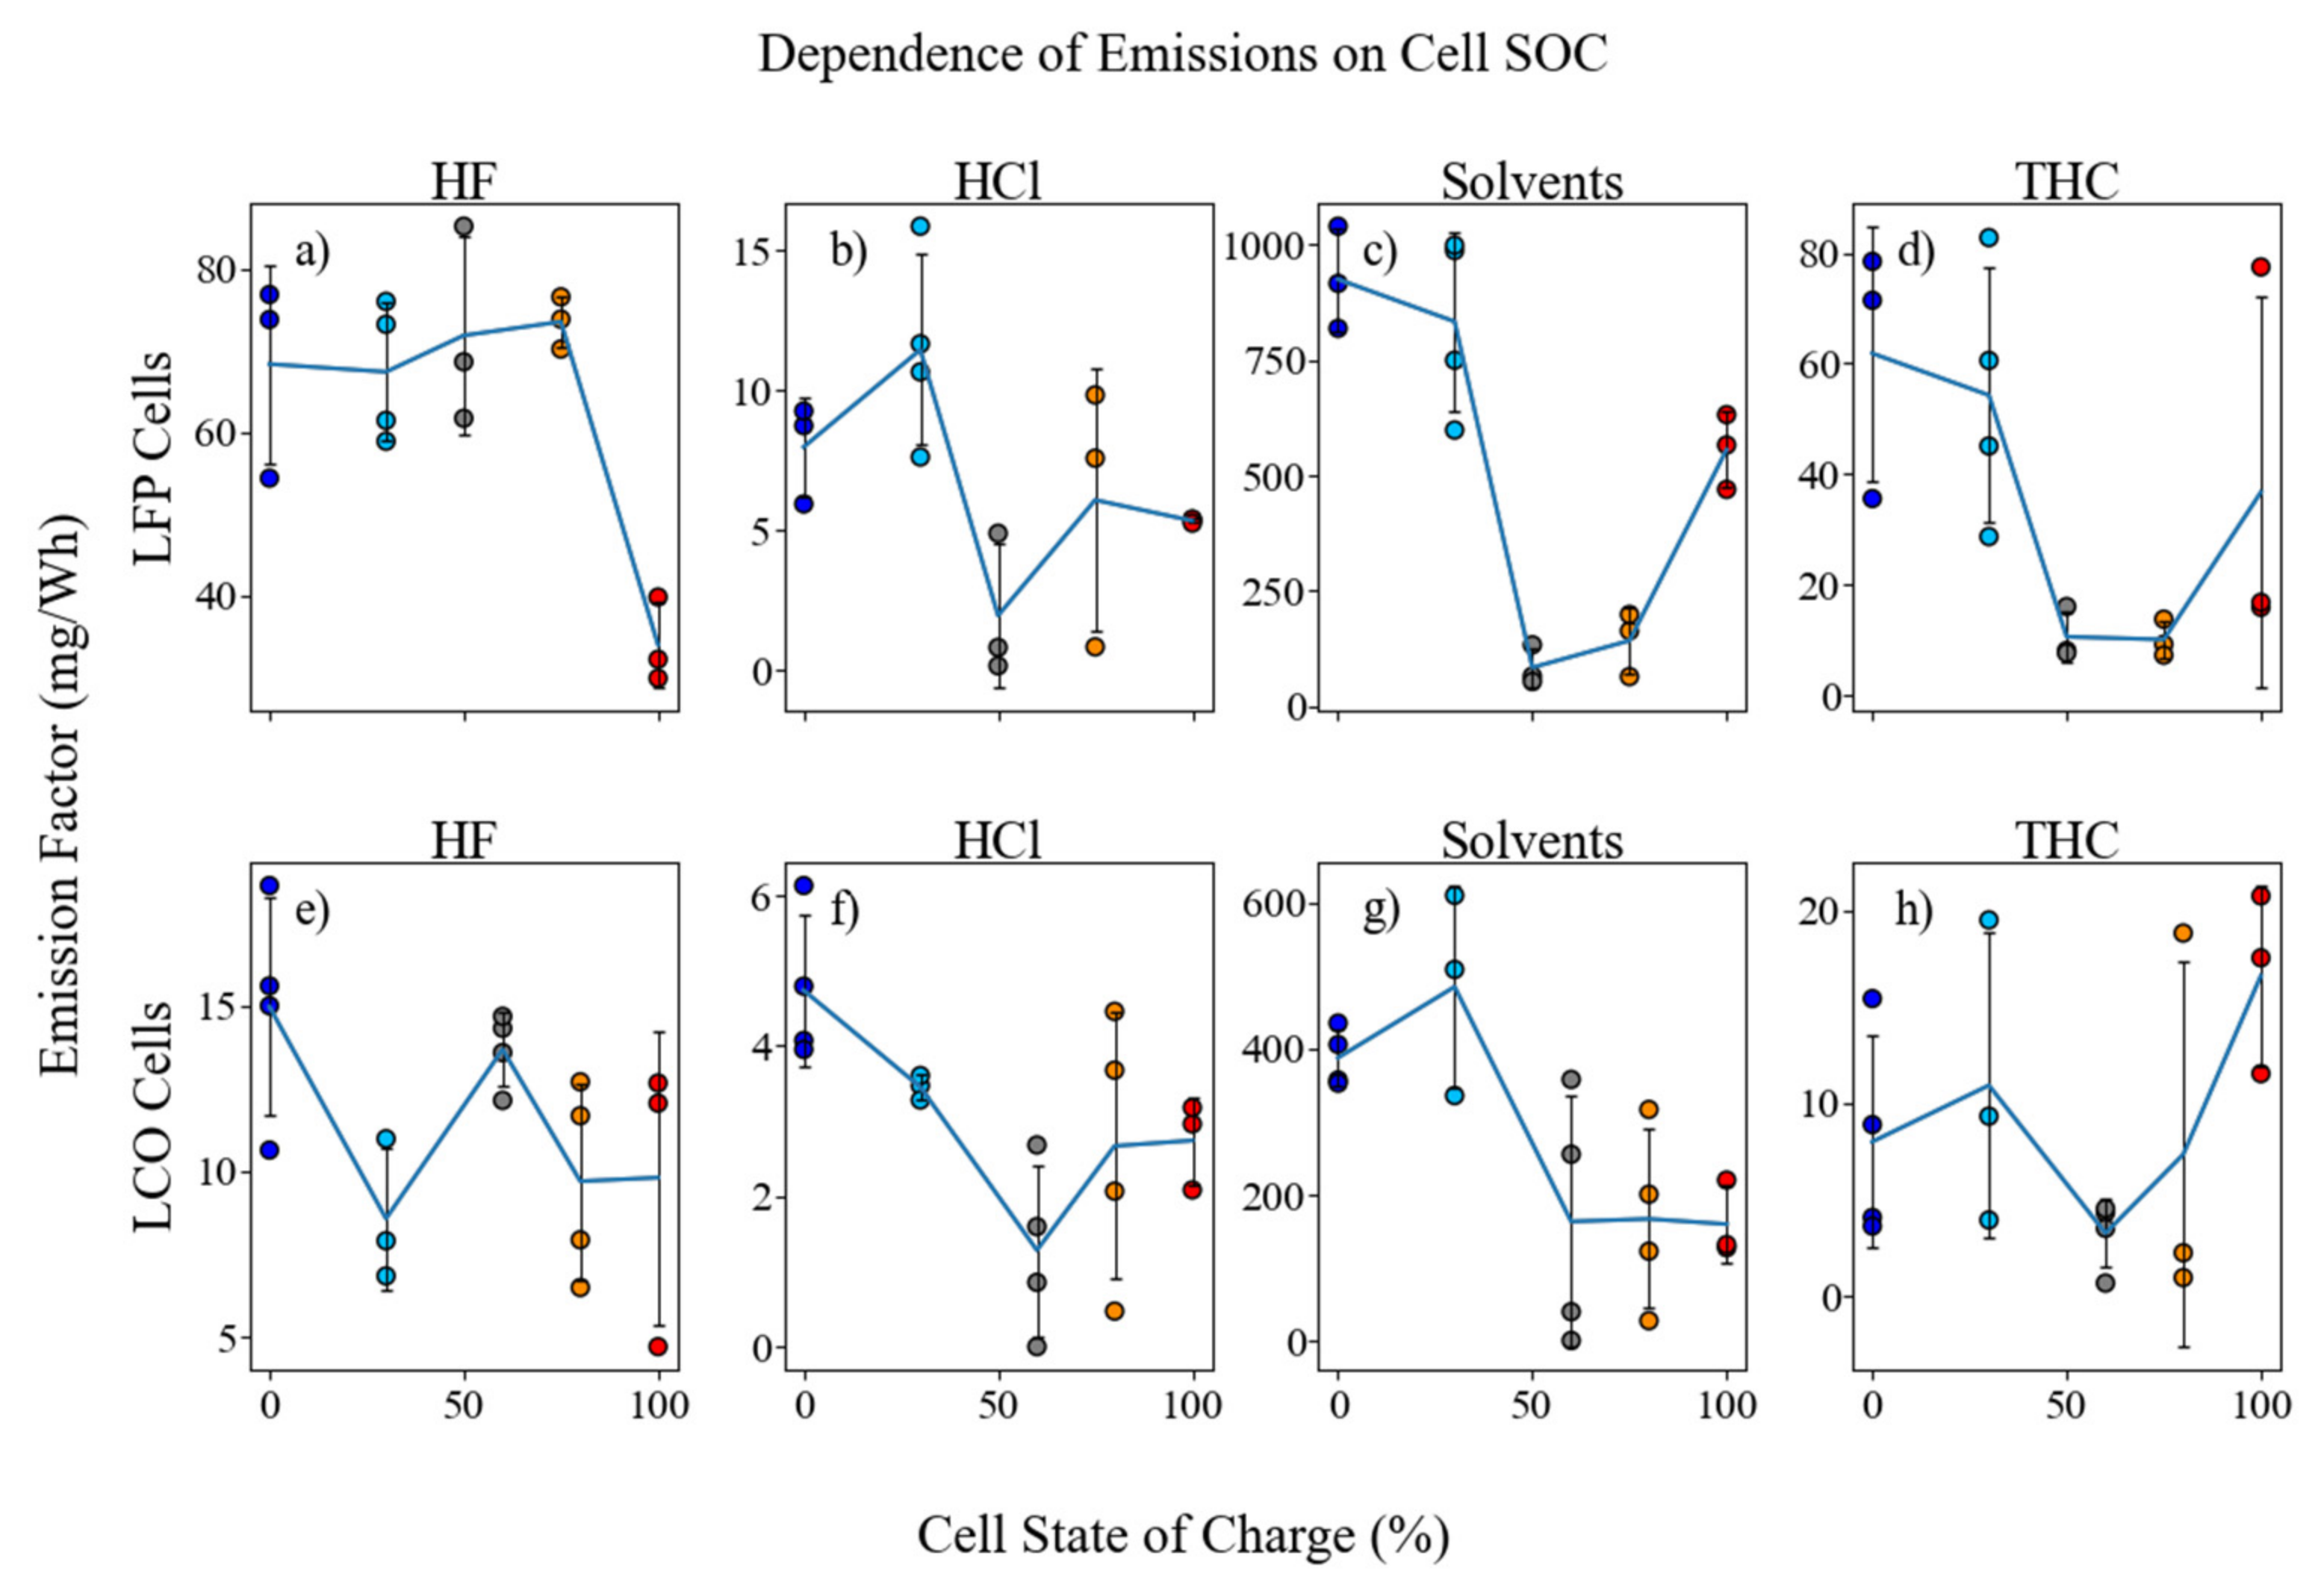
Figure 12 shows EF variation with cell SOC for selected gases. For LFP tests, HF, solvent, and THC EFs were highest at low SOCs and decreased at mid or high SOCs. HF EFs declined by ~50% at 100% SOC, while solvent and THC EFs decreased by more than 80% at 50% and 75% SOCs, before increasing again at 100% SOC. HCl EFs were also lowest at 50% SOC but showed less variation with SOC. EFs for LCO tests showed less SOC-dependent variability than LFP tests, with HF, HCl, and solvent EFs generally decreasing as SOC increased. The HF trend is particularly notable: although HF concentrations were lower at low SOCs (
Figure 5), HF EFs did not follow the same trend. The decrease in HF EF at high SOCs is consistent with several earlier studies [
22,
23,
24], although one study reported the opposite trend [
25]. This suggests that storing LIB cells at a lower SOC, a common safety practice, may reduce HF concentrations only in well-ventilated areas, where emissions do not accumulate. Conversely, storing LIB cells at 100% SOC may lead to more vigorous combustion, potentially limiting HF formation or promoting rapid neutralizing reactions upon release. Total gas emissions increased at mid-range SOCs for both cell types (
Supplementary Figure S3a,e) and more dramatically for LFP tests, matching results from earlier studies [
20,
24].
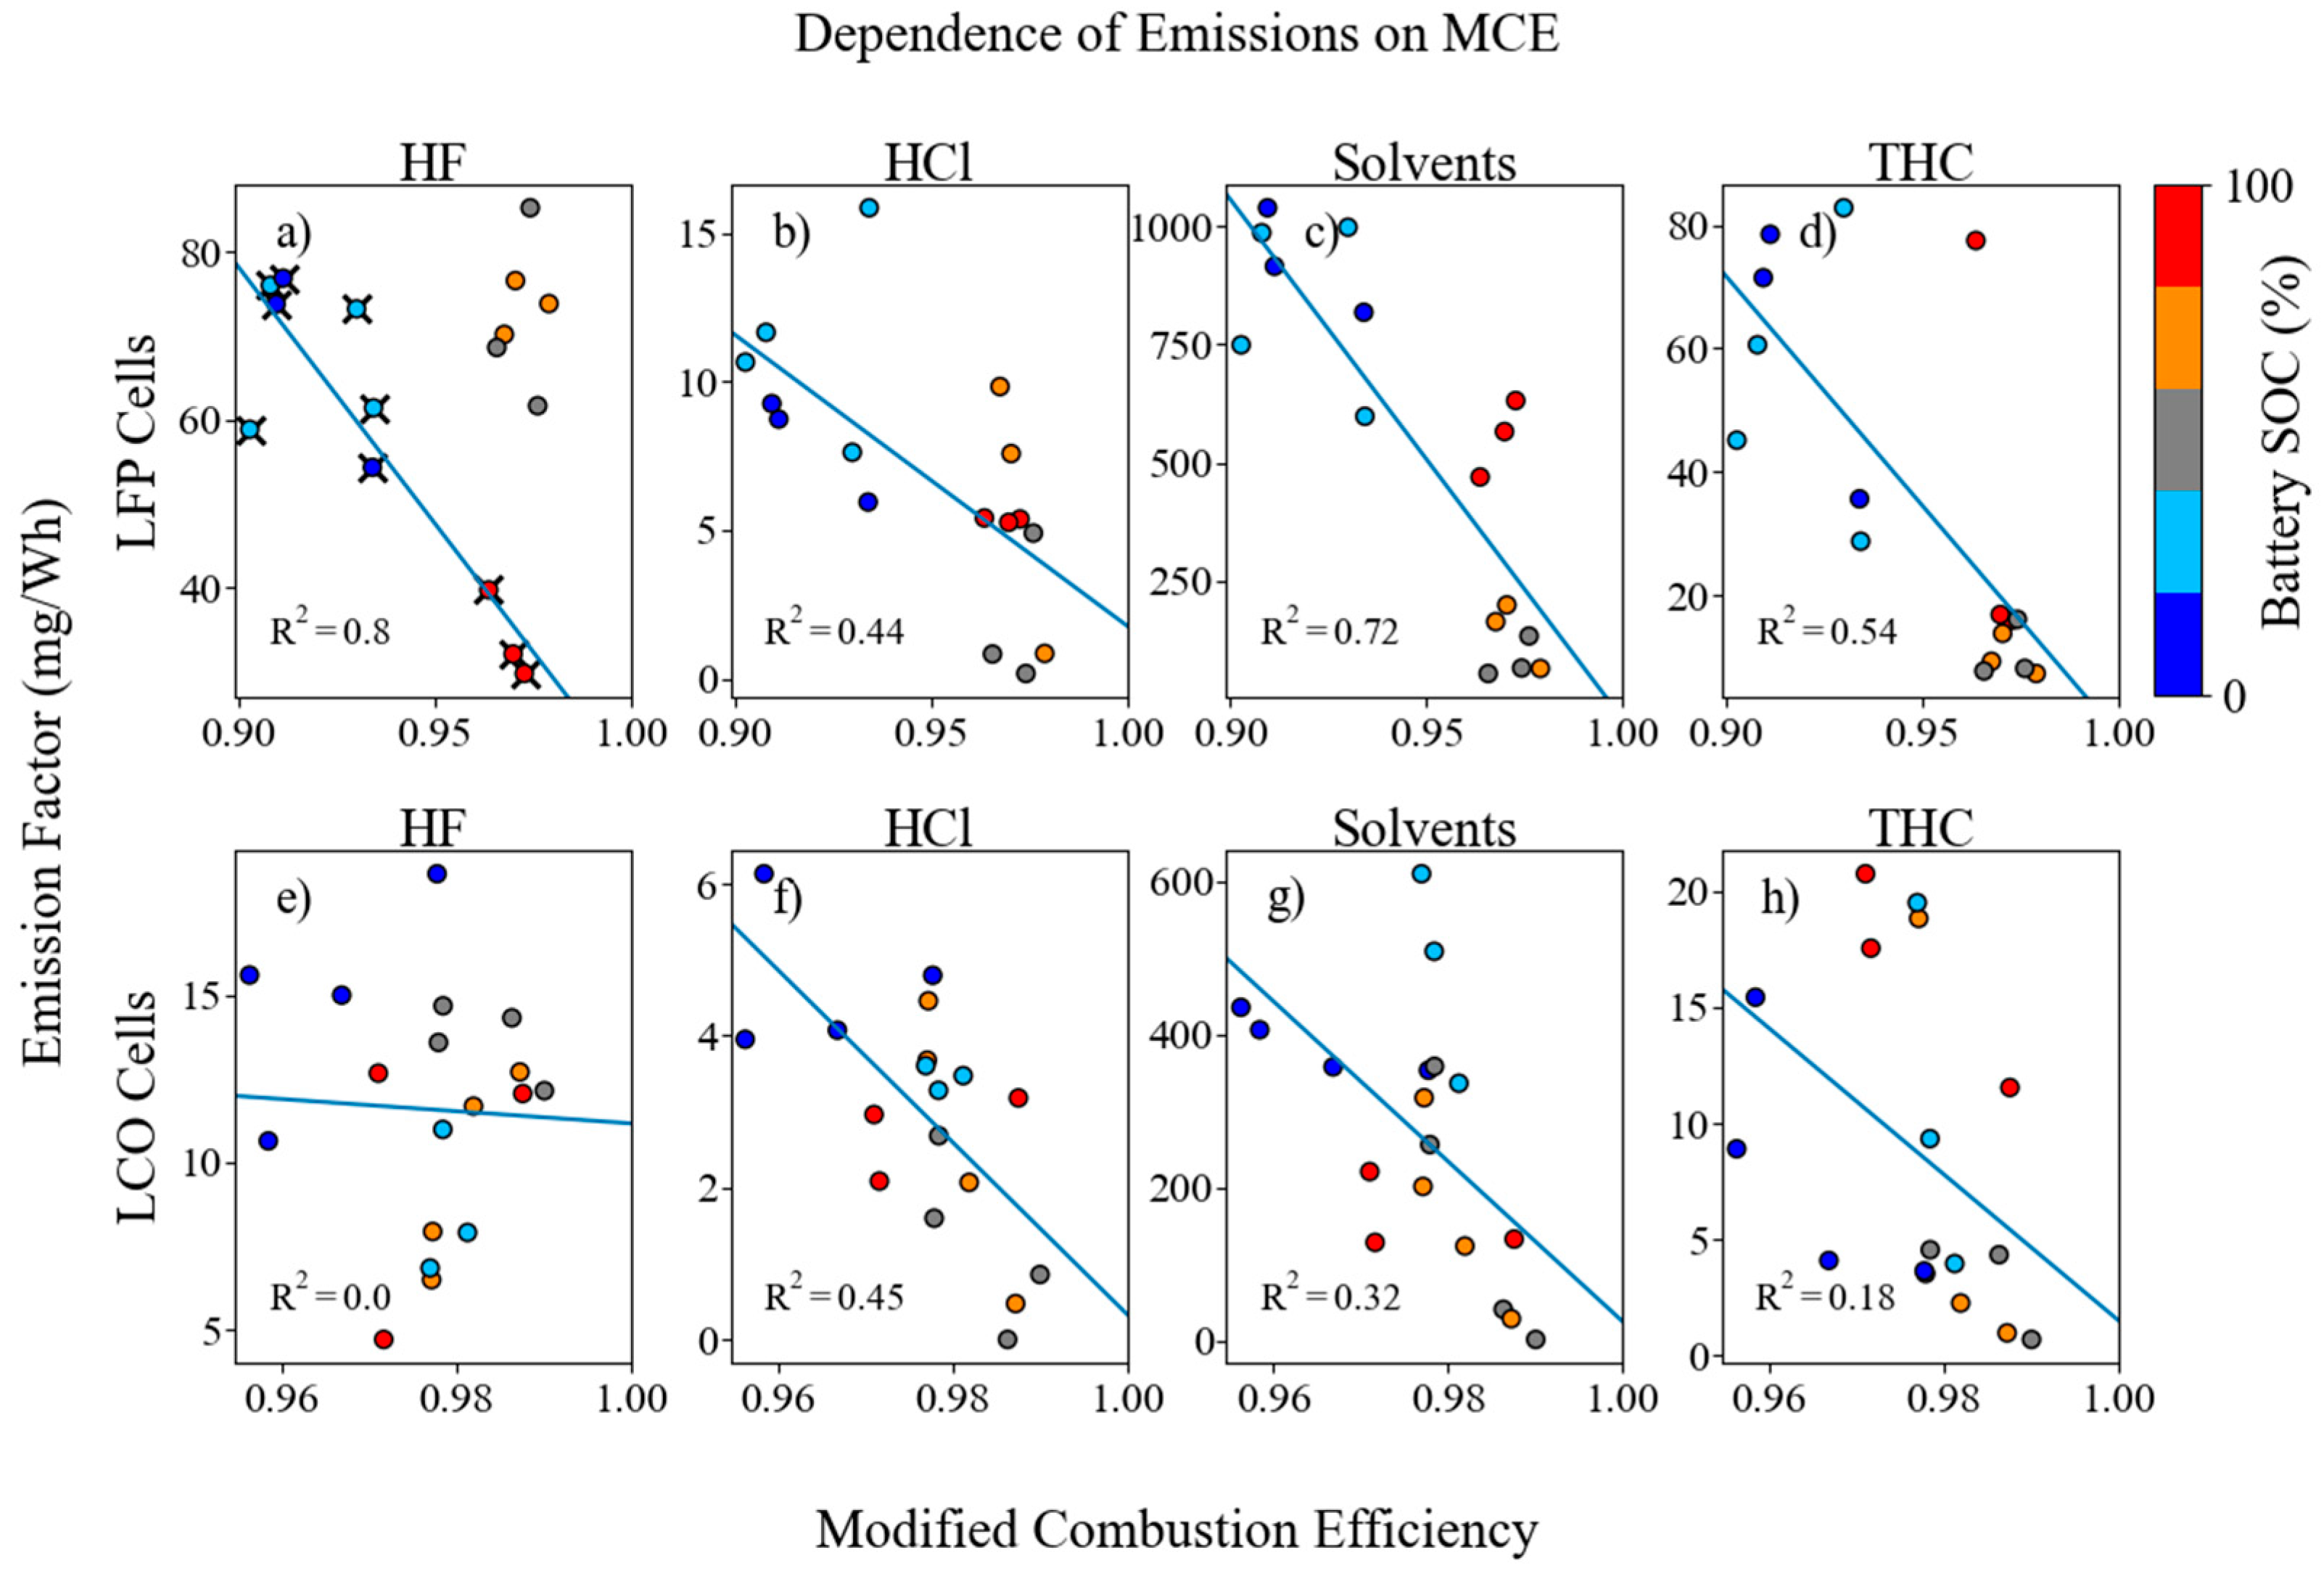
Figure 13 shows EF variation with MCE, providing insights into the dependence of emissions on combustion conditions. HF did not show a clear overall correlation with MCE; however, when 50% and 75% SOC data were excluded, a trend of decreasing EF with increasing MCE became apparent for LFP tests. HCl, solvent and THC EFs all decreased with increasing MCE for both cell types, suggesting that these species are consumed through combustion or other reactions during hotter, more complete combustion. Solvent EFs also showed strong negative correlation with the proportion of emissions from flaming combustion (
Figure S2), with R
2 values of ~0.9 for both cell types. This indicates that evaporated solvents were not released during flaming combustion and were instead completely combusted. Total gas emissions increased with MCE for both cell types (
Supplementary Figure S3d,h).
4. Limitations and Discussion
Several limitations of this study should be acknowledged:
First, only two cell types—a cylindrical LFP cell and a pouch-style LCO cell—were evaluated, with TR initiated by overheating. Emissions are expected to vary with cell chemistry, form factor, capacity, and failure trigger. Systematic testing across a broader range of conditions is needed to establish more comprehensive emission characteristics.
Second, caution is warranted when extrapolating data from single-cell tests to multi-cell or full LIB pack configurations. As HF exceeded inhalation limits in some tests, more severe toxic conditions would likely arise if larger LIB packs were to combust in enclosed environments. However, combustion behavior and emissions from enclosed LIB packs may differ significantly from open burning of individual cells due to variations in heat transfer, confinement, and oxygen availability. Direct measurements of LIB pack combustion under realistic configurations, such as those used in electric vehicles, would provide more representative emissions data.
Third, several important gases, including hydrogen and other potentially toxic fluoride- or phosphate-containing species beyond HF, were not measured. More comprehensive quantification of these species would improve assessments of toxicity, fire, and explosion hazards.
5. Conclusions
TR of LIBs is an important fire safety risk. LFP cells only outgassed and smoldered at lower SOCs (0 and 30%), while LCO cells had more vigorous flaming combustions at all SOCs, indicating that LFP cell chemistries are safer than LCO. Peak concentrations, time between TR start and maximum concentrations, and EFs depended on cell SOC, especially for LFP tests. These SOC-dependent changes can be linked back to combustion efficiency, which increased with SOC for both cell types, causing combustible species to be converted to CO and CO2.
Both LFP and LCO cell combustion released significant amounts of hazardous gases. Among the measured gases, HF presents the highest toxicity risk, and reached lethal concentration levels during some tests. Even though LFP cells do not combust as vigorously as LCO cells, HF EFs were higher than those of LCO tests by a factor of four to eight among the tested SOCs. LFP tests also had higher EFs for HCl, solvents, and THC than LCO tests, while LCO tests had higher EFs for NOx and SO2. However, these measured toxic or flammable gases were below their respective inhalation or explosion limits.
Gas and particle emissions showed different onset and peak times. For lower SOC tests, electrolyte solvents, particularly DEC, EMC, and DMC, were emitted during the outgassing phase before TR, followed by HCl, HF, THC, particulate matter, CO, and CO2. Less peak separation was detected during flaming combustion; however, solvent and particle emissions onset still preceded other emissions. The fact that solvent and particle emission occurred up to one minute before other species suggests that these species should be targeted for early detection of LIB failure.
This study seeks to provide a detailed analysis of gaseous LIB combustion emissions in companion with previous publications on particulate emissions [
7,
8]. This analysis will assist first-responders, LIB manufacturers, and civic authorities to plan for and respond to LIB fires by allowing for a better understanding of released emissions characteristics, concentrations, and EFs, as well as associations among SOC, combustion behavior, and peak concentrations.
Author Contributions
Conceptualization, X.W.; Methodology, M.C. and X.W.; Software, M.C.; Validation, M.C. and X.W.; Formal Analysis, M.C.; Investigation, M.C., B.B., J.A. and X.W.; Resources, X.W.; Data Curation, M.C.; Writing—Original Draft Preparation, M.C. and X.W.; Writing—Review & Editing, X.W., J.C.C., J.G.W. and Y.W.; Visualization, M.C.; Supervision, X.W. and Y.W.; Project Administration, X.W.; Funding Acquisition, X.W. All authors have read and agreed to the published version of the manuscript.
Funding
This research was funded by the U.S. National Aeronautics and Space Administration’s Established Program to Stimulate Competitive Research, CAN Grant No. 80NSSC19M0152, Nevada Space Grant No. 80NSSC20M0043 22–24, and NSF Futures Engine in the Southwest NSF-2315479.
Data Availability Statement
The raw data supporting the conclusions of this article will be made available by the authors on request. Calculated emission factors for all measured species are included in the
Supplementary Material.
Acknowledgments
The authors thank Hans Moosmüller for the use of the burn chamber where experiments were performed and DRI personnel for support and filter analysis. We thank Gasmet Technologies, including Jim Cornish, for helpful discussions on FTIR data processing.
Conflicts of Interest
The authors declare no conflicts of interest.
References
- Bugryniec, P.J.; Resendiz, E.G.; Nwophoke, S.M.; Khanna, S.; James, C.; Brown, S.F. Review of gas emissions from lithium-ion battery thermal runaway failure—Considering toxic and flammable compounds. J. Energy Storage 2024, 87, 111288. [Google Scholar] [CrossRef]
- Nilsson, E.J.K.; Ahlberg Tidblad, A. Gas Emissions from Lithium-Ion Batteries: A Review of Experimental Results and Methodologies. Batteries 2024, 10, 443. [Google Scholar] [CrossRef]
- Nedjalkov, A.; Meyer, J.; Köhring, M.; Doering, A.; Angelmahr, M.; Dahle, S.; Sander, A.; Fischer, A.; Schade, W. Toxic Gas Emissions from Damaged Lithium Ion Batteries—Analysis and Safety Enhancement Solution. Batteries 2016, 2, 5. [Google Scholar] [CrossRef]
- Amano, K.O.; Hahn, S.-K.; Butt, N.; Vorwerk, P.; Gimadieva, E.; Tschirschwitz, R.; Rappsilber, T.; Krause, U. Composition and Explosibility of Gas Emissions from Lithium-Ion Batteries Undergoing Thermal Runaway. Batteries 2023, 9, 300. [Google Scholar] [CrossRef]
- Larsson, F.; Andersson, P.; Blomqvist, P.; Mellander, B.-E. Toxic fluoride gas emissions from lithium-ion battery fires. Sci. Rep. 2017, 7, 10018. [Google Scholar] [CrossRef] [PubMed]
- Rappsilber, T.; Yusfi, N.; Krüger, S.; Hahn, S.-K.; Fellinger, T.-P.; von Nidda, J.K.; Tschirschwitz, R. Meta-analysis of heat release and smoke gas emission during thermal runaway of lithium-ion batteries. J. Energy Storage 2023, 60, 106579. [Google Scholar] [CrossRef]
- Claassen, M.; Bingham, B.; Chow, J.C.; Watson, J.G.; Wang, Y.; Wang, X.L. Characterization of Lithium-ion Battery Fire Emissions—Part 1: Chemical Composition of Fine Particles (PM2.5). Batteries 2024, 10, 301. [Google Scholar] [CrossRef]
- Claassen, M.; Bingham, B.; Chow, J.C.; Watson, J.G.; Wang, Y.; Wang, X.L. Characterization of Lithium-ion Battery Fire Emissions—Part 2: Particle Size Distributions and Emission Factors. Batteries 2024, 10, 366. [Google Scholar] [CrossRef]
- AA Portable Power Corp. Model 544792 Polymer Lithium-Ion Battery Product Specification; AA Portable Power Corp.: Richmond, CA, USA, 2026; Available online: https://www.batteryspace.com/prod-specs/3175.pdf (accessed on 24 March 2021).
- LithiumWerks. APR18650m1B Power Cells Nanophosphate® Technology Data Sheet; LithiumWerks: Austin, TX, USA, 2026; Available online: https://lithiumwerks.com/products/lithium-ion-18650-cells/ (accessed on 10 July 2022).
- Tian, J.; Chow, J.C.; Cao, J.; Han, Y.; Ni, H.; Chen, L.-W.A.; Wang, X.; Huang, R.; Moosmu, H.; Watson, J.G. A biomass combustion chamber: Design, evaluation, and a case study of wheat straw combustion emission tests. Aerosol Air Qual. Res. 2015, 15, 2104–2114. [Google Scholar] [CrossRef]
- Wang, X.L.; Firouzkouhi, H.; Chow, J.C.; Watson, J.G.; Carter, W.; De Vos, A.S. Characterization of gas and particle emissions from open burning of household solid waste from South Africa. Atmos. Chem. Phys. 2023, 23, 8921–8937. [Google Scholar] [CrossRef]
- NIOSH. NIOSH Pocket Guide to Chemical Hazards; National Institute for Occupational Safety and Health (NIOSH), Centers for Disease Control and Prevention (CDC), Department of Health and Human Services (DHHS): Cincinnati, OH, USA, 2007.
- OSHA. 29 CFR 1910.1000. Occupational Safety and Health Standards-Toxic and Hazardous Substances-Air Contaminants; U.S. Department of Labor, Occupational Safety and Health Administration (OSHA): Washington, DC, USA, 2006. Available online: https://www.osha.gov/pls/oshaweb/owadisp.show_document?p_table=STANDARDS&p_id=9991 (accessed on 1 October 2023).
- U.S. EPA. About Acute Exposure Guideline Levels (AEGLs); U.S. Environmental Protection Agency: Washington, DC, USA, 2025. Available online: https://www.epa.gov/aegl/about-acute-exposure-guideline-levels-aegls (accessed on 4 December 2025).
- AIHA. ERPGs (Emergency Response Planning Guidelines™); The American Industrial Hygiene Association (AIHA): Falls Church, VA, USA, 2025; Available online: https://www.aiha.org/get-involved/aiha-guideline-foundation/erpgs (accessed on 4 December 2025).
- Zabetakis, M.G. Flammability Characteristics of Combustible Gases and Vapors; US Department of the Interior, Bureau of Mines: Washington, DC, USA, 1965; Volume 627.
- Baird, A.R.; Archibald, E.J.; Marr, K.C.; Ezekoye, O.A. Explosion hazards from lithium-ion battery vent gas. J. Power Sources 2020, 446, 227257. [Google Scholar] [CrossRef]
- Bertilsson, S.; Larsson, F.; Furlani, M.; Albinsson, I.; Mellander, B.-E. Lithium-ion battery electrolyte emissions analyzed by coupled thermogravimetric/Fourier-transform infrared spectroscopy. J. Power Sources 2017, 365, 446–455. [Google Scholar] [CrossRef]
- Diaz, F.; Wang, Y.; Weyhe, R.; Friedrich, B. Gas generation measurement and evaluation during mechanical processing and thermal treatment of spent Li-ion batteries. Waste Manag. 2019, 84, 102–111. [Google Scholar] [CrossRef] [PubMed]
- Zhou, Z.; Liu, Y.; Jiang, H.; Bai, Z.; Sun, L.; Liu, J.; Zhao, W. The effects of ambient temperature and atmospheric humidity on the diffusion dynamics of hydrogen fluoride gas leakage based on the computational fluid dynamics method. Toxics 2024, 12, 184. [Google Scholar] [CrossRef] [PubMed]
- Lecocq, A.; Eshetu, G.G.; Grugeon, S.; Martin, N.; Laruelle, S.; Marlair, G. Scenario-based prediction of Li-ion batteries fire-induced toxicity. J. Power Sources 2016, 316, 197–206. [Google Scholar] [CrossRef]
- Andersson, P.; Blomqvist, P.; Loren, A.; Larsson, F. Investigation of Fire Emissions from Li-Ion Batteries; SP Technical Research Institute of Sweden: Borås, Sweden, 2013; Available online: https://www.diva-portal.org/smash/get/diva2:962743/FULLTEXT01.pdf (accessed on 9 April 2026).
- Gully, B.; Helgesen, H.; Skogtvedt, J.; Kostopoulos, D. Technical Reference for Li-Ion Battery Explosion Risk and Fire Suppression, 4th ed.; No. 2019-1025; DNV GL AS Maritime, Partner Group: Høvik, Norway, 2019; Available online: https://www.dnv.com/Publications/technical-reference-for-li-ion-battery-explosion-risk-and-fire-suppression-165062 (accessed on 4 December 2025).
- Liu, P.; Liu, C.; Yang, K.; Zhang, M.; Gao, F.; Mao, B.; Li, H.; Duan, Q.; Wang, Q. Thermal runaway and fire behaviors of lithium iron phosphate battery induced by over heating. J. Energy Storage 2020, 31, 101714. [Google Scholar] [CrossRef]
Figure 1.
Burn chamber and instrument layout.
Figure 1.
Burn chamber and instrument layout.
Figure 2.
CO and CO2 concentrations and MCE from representative tests for (a–e) LFP cells and (f–j) LCO cells at each SOC. Periods of visually observed flaming combustion from video recordings are shaded in grey.
Figure 2.
CO and CO2 concentrations and MCE from representative tests for (a–e) LFP cells and (f–j) LCO cells at each SOC. Periods of visually observed flaming combustion from video recordings are shaded in grey.
Figure 3.
Average MCE as a function of cell SOC for (a) LFP tests and (b) LCO tests.
Figure 3.
Average MCE as a function of cell SOC for (a) LFP tests and (b) LCO tests.
Figure 4.
SO2 and NOx concentrations from representative tests for (a–e) LFP cells and (f–j) LCO cells at each SOC. Periods of visually observed flaming combustion are shaded in grey. NOx values were averaged over 20 s due to NO and NOx being measured sequentially by the analyzer.
Figure 4.
SO2 and NOx concentrations from representative tests for (a–e) LFP cells and (f–j) LCO cells at each SOC. Periods of visually observed flaming combustion are shaded in grey. NOx values were averaged over 20 s due to NO and NOx being measured sequentially by the analyzer.
Figure 5.
Acidic gas concentrations from representative tests for (a–e) LFP cells and (f–j) LCO cells at each SOC. The horizontal lines indicate REL, PEL, IDLH, ERPG-2 and ERPG-3 limits for HF. Periods of visually observed flaming combustion are shaded in grey.
Figure 5.
Acidic gas concentrations from representative tests for (a–e) LFP cells and (f–j) LCO cells at each SOC. The horizontal lines indicate REL, PEL, IDLH, ERPG-2 and ERPG-3 limits for HF. Periods of visually observed flaming combustion are shaded in grey.
Figure 6.
Solvent and THC concentrations from representative tests for (a–e) LFP cells and (f–j) LCO cells at each SOC. Periods of visually observed flaming combustion are shaded in grey.
Figure 6.
Solvent and THC concentrations from representative tests for (a–e) LFP cells and (f–j) LCO cells at each SOC. Periods of visually observed flaming combustion are shaded in grey.
Figure 7.
Emission timing of different species for (
a,
b) 0% SOC LCO and (
c,
d) 80% SOC LCO tests. Similar plots for representative LFP tests are in
Supplementary Figure S1.
Figure 7.
Emission timing of different species for (
a,
b) 0% SOC LCO and (
c,
d) 80% SOC LCO tests. Similar plots for representative LFP tests are in
Supplementary Figure S1.
Figure 8.
Average concentration and timing of maximum species emission peaks for each LFP and LCO SOC. THC peak timing for low-SOC LFP tests is considered suspect and is omitted. Error bars represent the standard error within each SOC group.
Figure 8.
Average concentration and timing of maximum species emission peaks for each LFP and LCO SOC. THC peak timing for low-SOC LFP tests is considered suspect and is omitted. Error bars represent the standard error within each SOC group.
Figure 9.
Gas emission factors by SOC in mg/Wh of abundant gaseous species for LFP tests. Error bars represent the standard error within each SOC group.
Figure 9.
Gas emission factors by SOC in mg/Wh of abundant gaseous species for LFP tests. Error bars represent the standard error within each SOC group.
Figure 10.
Gas emission factors by SOC in mg/Wh of abundant gaseous species for LCO tests. Error bars represent the standard error within each SOC group.
Figure 10.
Gas emission factors by SOC in mg/Wh of abundant gaseous species for LCO tests. Error bars represent the standard error within each SOC group.
Figure 11.
Correlation between the ratio of detected gas mass to cell mass loss and measured flame temperature for LFP tests. Each test is colored by cell SOC for reference.
Figure 11.
Correlation between the ratio of detected gas mass to cell mass loss and measured flame temperature for LFP tests. Each test is colored by cell SOC for reference.
Figure 12.
Relationship between gas EFs and cell SOC for LFP (
a–
d) and LCO (
e–
h) tests. The symbol color indicates cell SOC, as in
Figure 11.
Figure 12.
Relationship between gas EFs and cell SOC for LFP (
a–
d) and LCO (
e–
h) tests. The symbol color indicates cell SOC, as in
Figure 11.
Figure 13.
Correlations between gas EFs and MCE for LFP (a–d) and LCO (e–h) tests. Each test is colored by cell SOC for reference. Tests fit by the regression in panel (a) are marked with an “x”.
Figure 13.
Correlations between gas EFs and MCE for LFP (a–d) and LCO (e–h) tests. Each test is colored by cell SOC for reference. Tests fit by the regression in panel (a) are marked with an “x”.
Table 1.
Exposure limits for selected air pollutants.
Table 1.
Exposure limits for selected air pollutants.
| Limit a | CO b (ppm) | CO2 c (ppm) | SO2 (ppm) | NO (ppm) | NO2 d (ppm) | HF
(ppm) | HCl
(ppm) | HCN
(ppm) |
|---|
| REL | 35 | 5000 | 2 | 2 | 1 STEL | 3 | 5 C | 4.7 STEL |
| IDLH | 1200 | 40,000 | 100 | 100 | 13 | 30 | 50 | 50 |
| PEL | 50 | 5000 | 5 | 2 | 5 C | 3 | 5 C | 10 |
| AEGL-1 | NR | NA | 0.2 | NR | 0.5 | 1 | 1.8 | 2 |
| AEGL-2 | 83 | NA | 0.75 | NR | 12 | 24 | 11 | 7.1 |
| AEGL-3 | 330 | NA | 30 | NR | 20 | 44 | 26 | 15 |
| ERPG-1 | 200 | NA | 0.3 | NA | 1 | 2 | 3 | NA |
| ERPG-2 | 350 | NA | 3 | NA | 15 | 20 | 20 | 10 |
| ERPG-3 | 500 | NA | 25 | NA | 30 | 50 | 150 | 25 |
Table 2.
Comparison of EFs in mg/Wh from this study and aggregated literature values. Literature values are reported as medians, with the inter-quartile range in parentheses.
Table 2.
Comparison of EFs in mg/Wh from this study and aggregated literature values. Literature values are reported as medians, with the inter-quartile range in parentheses.
| Test | CO | CO2 | HCl | HF | NOx | SO2 | Solvents | THC |
|---|
| This study | | | | | | | |
| 0% LFP | 14 | 42 | 8 | 68 | 0.2 | 0.1 | 924 | 62 |
| 50% LFP | 15 | 2089 | 2 | 72 | 0.5 | 0.1 | 84 | 11 |
| 100% LFP | 17 | 930 | 5 | 34 | 0.6 | 0.1 | 555 | 37 |
| LCO | 12–17 | 939–1557 | 1–5 | 9–15 | 0.5–0.9 | 0.8–2.3 | 164–484 | 3–17 |
| Bugryniec et al. [1] | | | | | | | |
| 0% LFP | 35
(23–46) | 1435
(1101–1768) | NA | 103
(55–110) | NA | 50 | NA | NA |
| 50% LFP | 28
(3–69) | 195
(39–685) | 68
(42–94) | 79
(13–125) | 82
(78–85) | 36 | NA | NA |
| 100% LFP | 19
(6–72) | 84
(24–629) | 149
(7–591) | 52
(37–128) | 183
(38–477) | 30 | 11 | 10 |
| LCO | 189
(128–207) | 475
(294–744) | NA | 15
(10–15) | NA | NA | 279
(228–319) | 161 |
| Disclaimer/Publisher’s Note: The statements, opinions and data contained in all publications are solely those of the individual author(s) and contributor(s) and not of MDPI and/or the editor(s). MDPI and/or the editor(s) disclaim responsibility for any injury to people or property resulting from any ideas, methods, instructions or products referred to in the content. |




 ,
,