


Abstract
A concentration-dependent investigation of Fe-doped anatase TiO2 was performed using the full-potential linearized augmented plane wave method implemented in WIEN2k, combined with GGA, GGA+U, and physics-informed neural network (PINN) modeling. Fe concentrations of 3.125%, 6.25%, 12.5%, and 25% were examined using 2 × 2 × 2 anatase TiO2 supercells. Fe incorporation systematically expands the anatase lattice, with the equilibrium volume increasing from 17.14 Å3/f.u. for pristine TiO2 to 18.49 Å3/f.u. within GGA and up to 18.91 Å3/f.u. using Hubbard-corrected treatments at 25% Fe. The bulk modulus decreases from 179.2 GPa to 160.5 GPa in GGA, indicating concentration-driven lattice softening, while the formation energy becomes more negative, reaching −10.91 eV/f.u. for GGA+UTi+UFe at 25% Fe. Electronically, Fe doping introduces localized Fe-3d impurity states within the forbidden gap, narrowing the band gap from 2.18 eV for pristine TiO2 to 1.23 eV in GGA and to 1.59 eV in GGA+UTi+UFe at 25% Fe. The ferromagnetic magnetic moment increases with Fe concentration, reaching 4.41 μB/f.u. for the combined Hubbard correction. Optical calculations reveal enhanced dielectric, conductivity, absorption, reflectivity, and loss responses in the visible-to-near-UV range due to Fe-3d/O-2p/Ti-3d hybridization. The PINN model closely reproduces the FP-LAPW/GGA+U trends, including band gaps from 2.25 eV at 3.125% Fe to 1.48 eV at 25% Fe, demonstrating its usefulness as an efficient surrogate for correlated-property prediction. These results establish Fe doping as an effective route for multifunctional tuning of anatase TiO2 for photocatalytic, photovoltaic, optoelectronic, and spintronic applications.
1. Introduction
Titanium dioxide (TiO2) is a widely studied transition-metal oxide owing to its chemical stability, low cost, low toxicity, and promising functionality in photocatalysis, optoelectronics, sensing, and spin-related applications. Among its crystalline polymorphs, anatase TiO2 is of particular interest because of its high photocatalytic activity. However, its wide band gap of approximately 3.2 eV restricts optical absorption mainly to the ultraviolet region, limiting its efficiency under visible-light irradiation [1,2,3]. Therefore, electronic-structure engineering through transition-metal doping has become an important strategy for improving the visible-light response and functional performance of anatase TiO2.
Fe doping is especially attractive because Fe-3d states can strongly hybridize with Ti-3d and O-2p orbitals, generating impurity levels within or near the forbidden gap. These dopant-induced states can narrow the effective band gap, enhance visible-light absorption, and introduce spin-polarized electronic behavior. Experimental studies have shown that Fe can be incorporated into the anatase lattice while preserving the host phase, producing red-shifted absorption edges and improved photocatalytic activity under visible light [4,5]. In addition, defect- and dopant-assisted magnetic responses have been reported in Fe-doped anatase TiO2 nanostructures, supporting its potential relevance for dilute magnetic semiconductor and magneto-functional oxide applications [6].
From the theoretical perspective, density functional theory has played a central role in clarifying the microscopic origin of Fe-induced modifications. Standard PBE-GGA provides reliable structural trends but commonly underestimates semiconductor band gaps and over-delocalizes localized d electrons. This limitation is particularly important for TiO2, where the conduction band is dominated by Ti-3d states, and becomes more pronounced when Fe-3d impurity states are introduced [7,8]. Hubbard-corrected GGA+U calculations have therefore been widely employed to improve the treatment of localized Ti-3d and Fe-3d orbitals. Previous studies reported that Fe incorporation narrows the band gap, enhances impurity-state formation, modifies spin-dependent density of states, and strengthens visible-light optical absorption through Fe-3d/O-2p/Ti-3d hybridization [9,10,11,12].
The full-potential linearized augmented plane wave method provides an accurate all-electron framework for investigating crystalline solids. As implemented in WIEN2k, the FP-LAPW/APW+lo formalism is well suited for structural optimization, equation-of-state analysis, band-structure calculations, density of states, charge-density mapping, magnetic properties, and optical spectra [13]. In this work, PBE-GGA is used as the base exchange-correlation functional [14], while GGA+U corrections are applied to localized Ti-3d and Fe-3d states to improve the description of electronic correlation in Fe-doped anatase TiO2 [9,10,15,16].
In parallel with conventional first-principles calculations, physics-informed neural networks (PINNs) are employed as a complementary predictive framework. PINNs combine data-driven learning with physical constraints and can efficiently reproduce complex materials-property trends when trained using reliable simulation data and known physical behavior [17,18]. Here, PINN-assisted modeling is used to reproduce and interpolate concentration-dependent structural, electronic, magnetic, density-of-states, band-structure, and optical-property trends obtained from GGA and GGA+U calculations.
Although Fe-doped anatase TiO2 has been investigated experimentally and theoretically, a systematic FP-LAPW comparison across Fe concentrations combined with GGA, GGA+U, and PINN-assisted analysis remains valuable. The present study aims to clarify how Fe concentration controls lattice distortion, band-gap narrowing, impurity-state formation, spin polarization, and optical response, while evaluating the role of Hubbard corrections and PINN modeling in predicting the functional properties of Fe-doped anatase TiO2.
2. Materials and Methods
The structural, electronic, magnetic, density-of-states, band-structure, and optical properties of pure and Fe-doped anatase TiO2 were investigated using first-principles density functional theory. All calculations were performed with the full-potential linearized augmented plane wave method, as implemented in the WIEN2k package [13,19]. The FP-LAPW formalism is an all-electron method that treats the crystal potential without shape approximation, providing high accuracy for transition-metal oxides and localized d-electron systems [20].
The exchange-correlation potential was described using the Perdew–Burke–Ernzerhof generalized gradient approximation (PBE-GGA) [14]. Because semilocal GGA commonly underestimates the band gap of TiO2 and over-delocalizes Ti-3d and Fe-3d states, Hubbard-corrected GGA+U calculations were also performed [15,16]. On-site Coulomb corrections were applied to Ti-3d and Fe-3d orbitals using U(Ti) = 4.5 eV and U(Fe) = 4.5 eV, with exchange parameters J(Ti) = 0.8 eV and J(Fe) = 0.9 eV. The effective interaction was evaluated as Ueff = U − J, giving values within the commonly used 3–5 eV range for transition-metal d states [21].
A 2 × 2 × 2 anatase TiO2 supercell containing 96 atoms was constructed from the tetragonal anatase structure with space group I41/amd. Fe-doped systems were modeled by substituting Ti atoms with Fe atoms at concentrations of 3.125%, 6.25%, 12.5%, and 25%. Pure anatase TiO2 was calculated as the reference system.
The muffin-tin radii were set to RMT(Ti) = 1.90 Bohr, RMT(O) = 1.60 Bohr, and RMT(Fe) = 1.95 Bohr. The plane-wave cutoff was controlled using RKmax = 7.5, and Brillouin-zone integrations were performed with a 6 × 6 × 6 k-point mesh. Structural optimization was continued until the total-energy and charge-convergence criteria reached 10−6 Ry and 10−4 e, respectively. Nonmagnetic and ferromagnetic spin configurations were considered to evaluate magnetic stability and spin-dependent electronic behavior.
After structural relaxation, electronic band structures and total/partial density of states were calculated to determine the band gap, Fermi-level states, and orbital contributions from Ti-3d, Fe-3d, and O-2p states. Optical properties were derived from the complex dielectric function and included ε1(ω), ε2(ω), refractive index, extinction coefficient, absorption coefficient, reflectivity, energy-loss function, and optical conductivity.
Physics-informed neural networks were further employed as a complementary predictive framework. The PINN model was used to reproduce and smooth concentration-dependent trends from the WIEN2k electronic and optical datasets while preserving physical consistency. This approach follows the general strategy of incorporating physical constraints into neural-network learning to improve data efficiency, interpolation quality, and interpretability [17,18].
The PINN framework was developed to reproduce selected properties obtained from WIEN2k FP-LAPW calculations. Model performance was assessed using direct DFT–PINN comparisons and the mean absolute error (MAE), root-mean-square error (RMSE), and coefficient of determination (R2). Comparisons at reported compositions quantify agreement with the reference dataset; predictive performance requires evaluation on compositions or structural configurations excluded from training and model selection. Where implemented, the input and output vectors are expressed as [17]
where XFe denotes the substitutional Fe concentration, (V) represents the sampled volume, and (U) and (J) specify the Hubbard parameters. These vectors must contain only variables actually used by the corresponding model. Spectral predictions additionally require a documented representation of photon energy or the output energy grid. Inputs and outputs were normalized [], with normalization parameters determined exclusively from the training dataset. The optimization objective function was defined as
where ℓdata measures disagreement with the WIEN2k reference values, ℓphysics enforces, and ℓreg represents. The weights λd, λp, λr were. For (Ns) evaluated samples, the performance metrics were calculated as [17]
and
where yi, and y denote the DFT reference value, PINN prediction, and mean reference value, respectively.
x = (xFe, V, UTi, UFe, JTi, JFe, …)
ℓtotal = λdℓdata + λpℓphysics + λrℓreg
3. Results and Discussion
3.1. Structural and Magnetic Properties
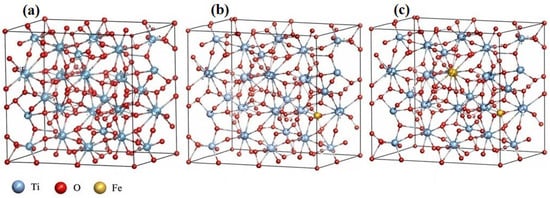
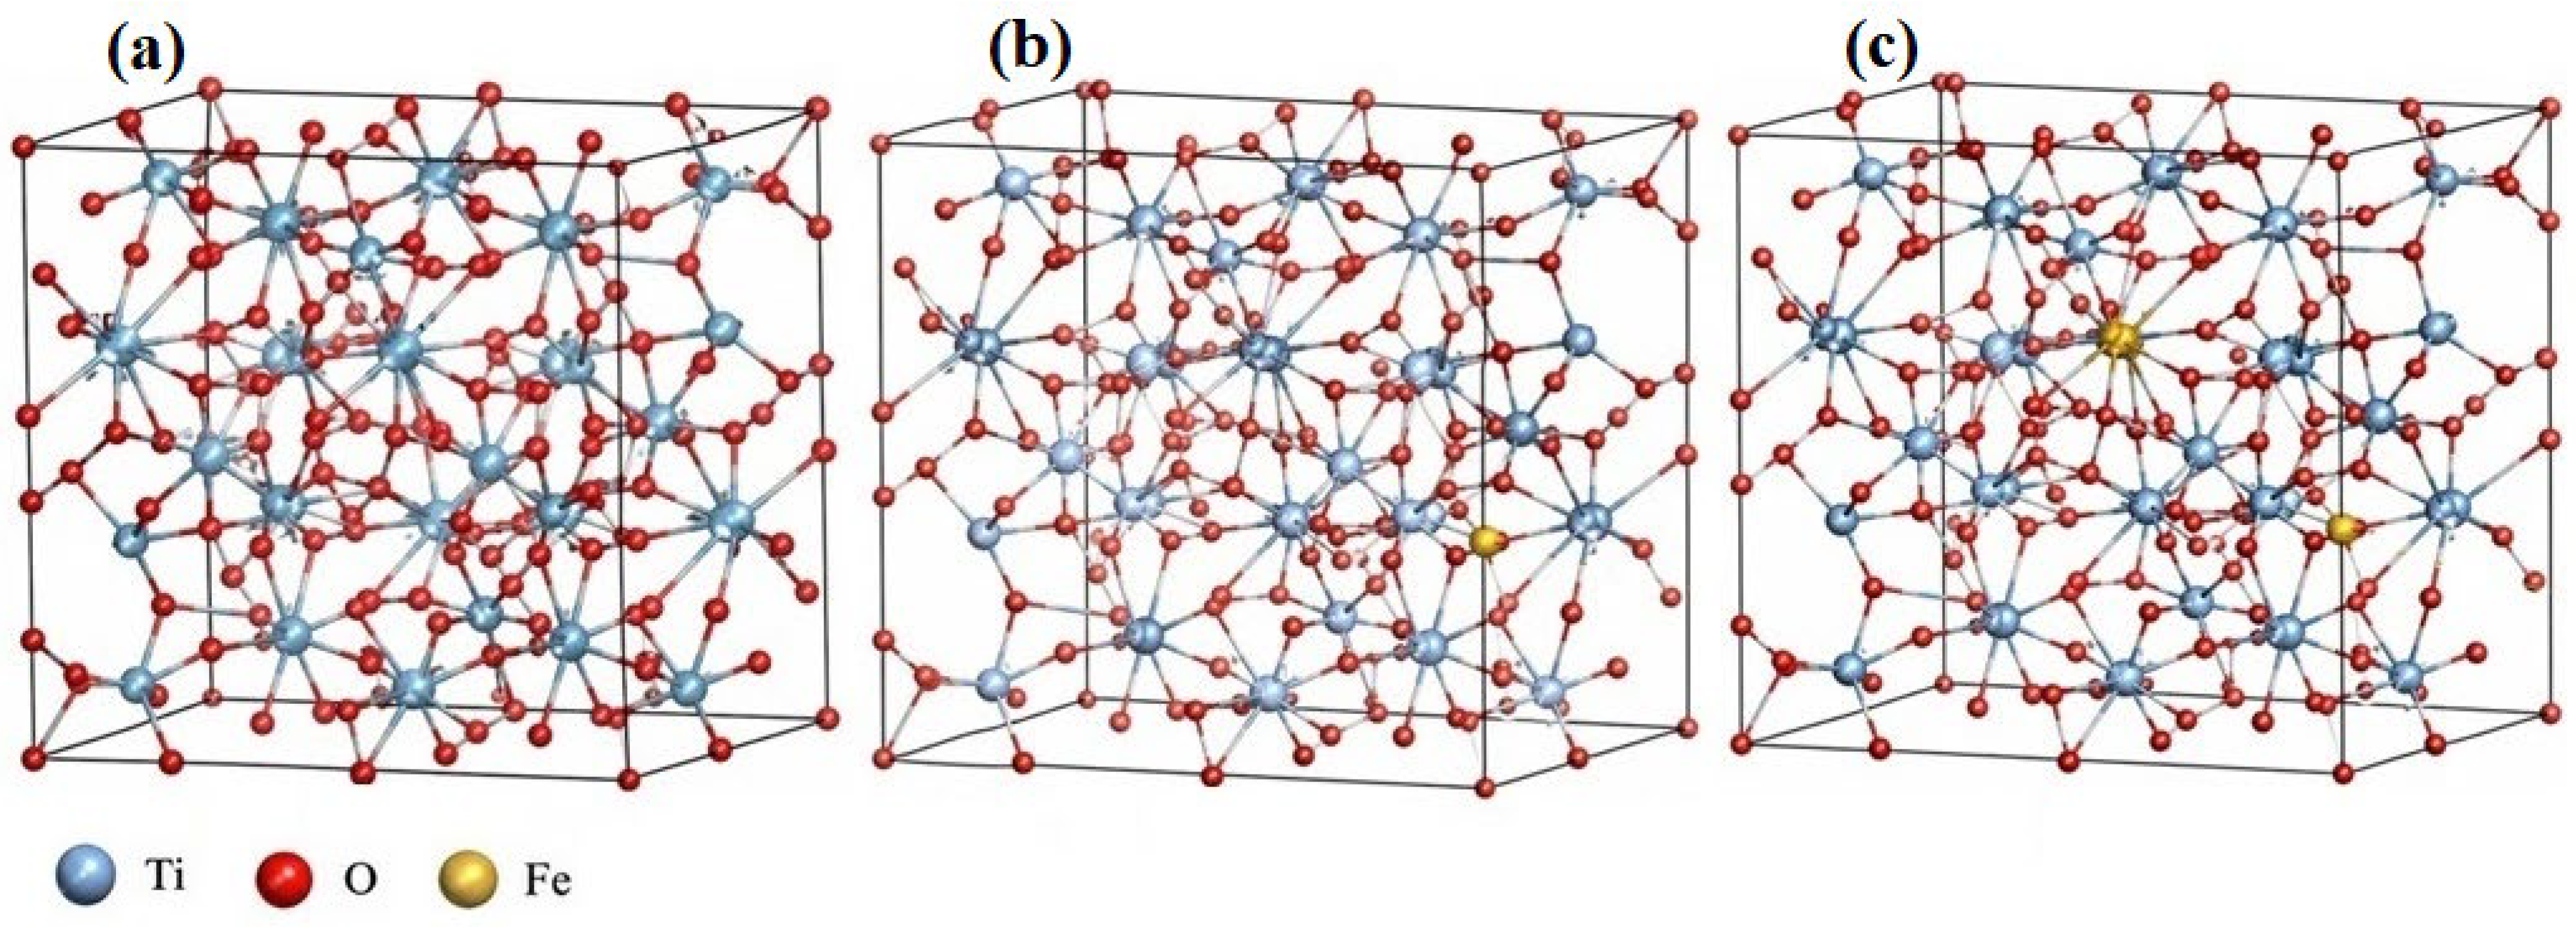
The anatase TiO2 supercell was constructed by expanding the primitive tetragonal cell (141/amd) by 2 × 2 × 2 along the a, b, and c directions, containing 32 Ti (gray) and 64 O (red) atoms (96 atoms in total). Ti atoms occupy the 16c Wyckoff sites, each coordinated by six O atoms forming distorted TiO, octahedra, while O atoms lie at the 32e sites. The substitutional doping configurations of Fe-doped at different concentrations (3.125%, 6.25%, 12.5%, and 25%) are illustrated. These correspond respectively to replacing 1, 2, 4, and 8 Ti atoms out of the 32 Ti sites in the 96-atom supercell:
Ti32−nFenO64; n = 1, 2, 4, 8.
Thus, the investigated compositions were
Fe1Ti31O64; Fe2Ti30O64; Fe4Ti28O64; Fe8Ti24O64.
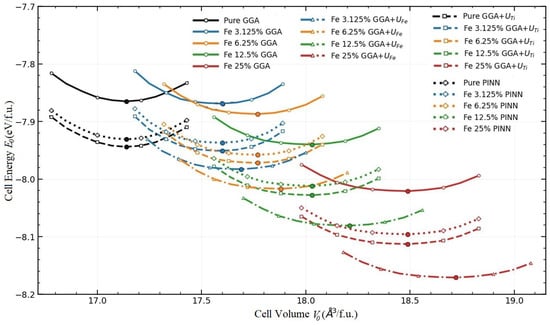
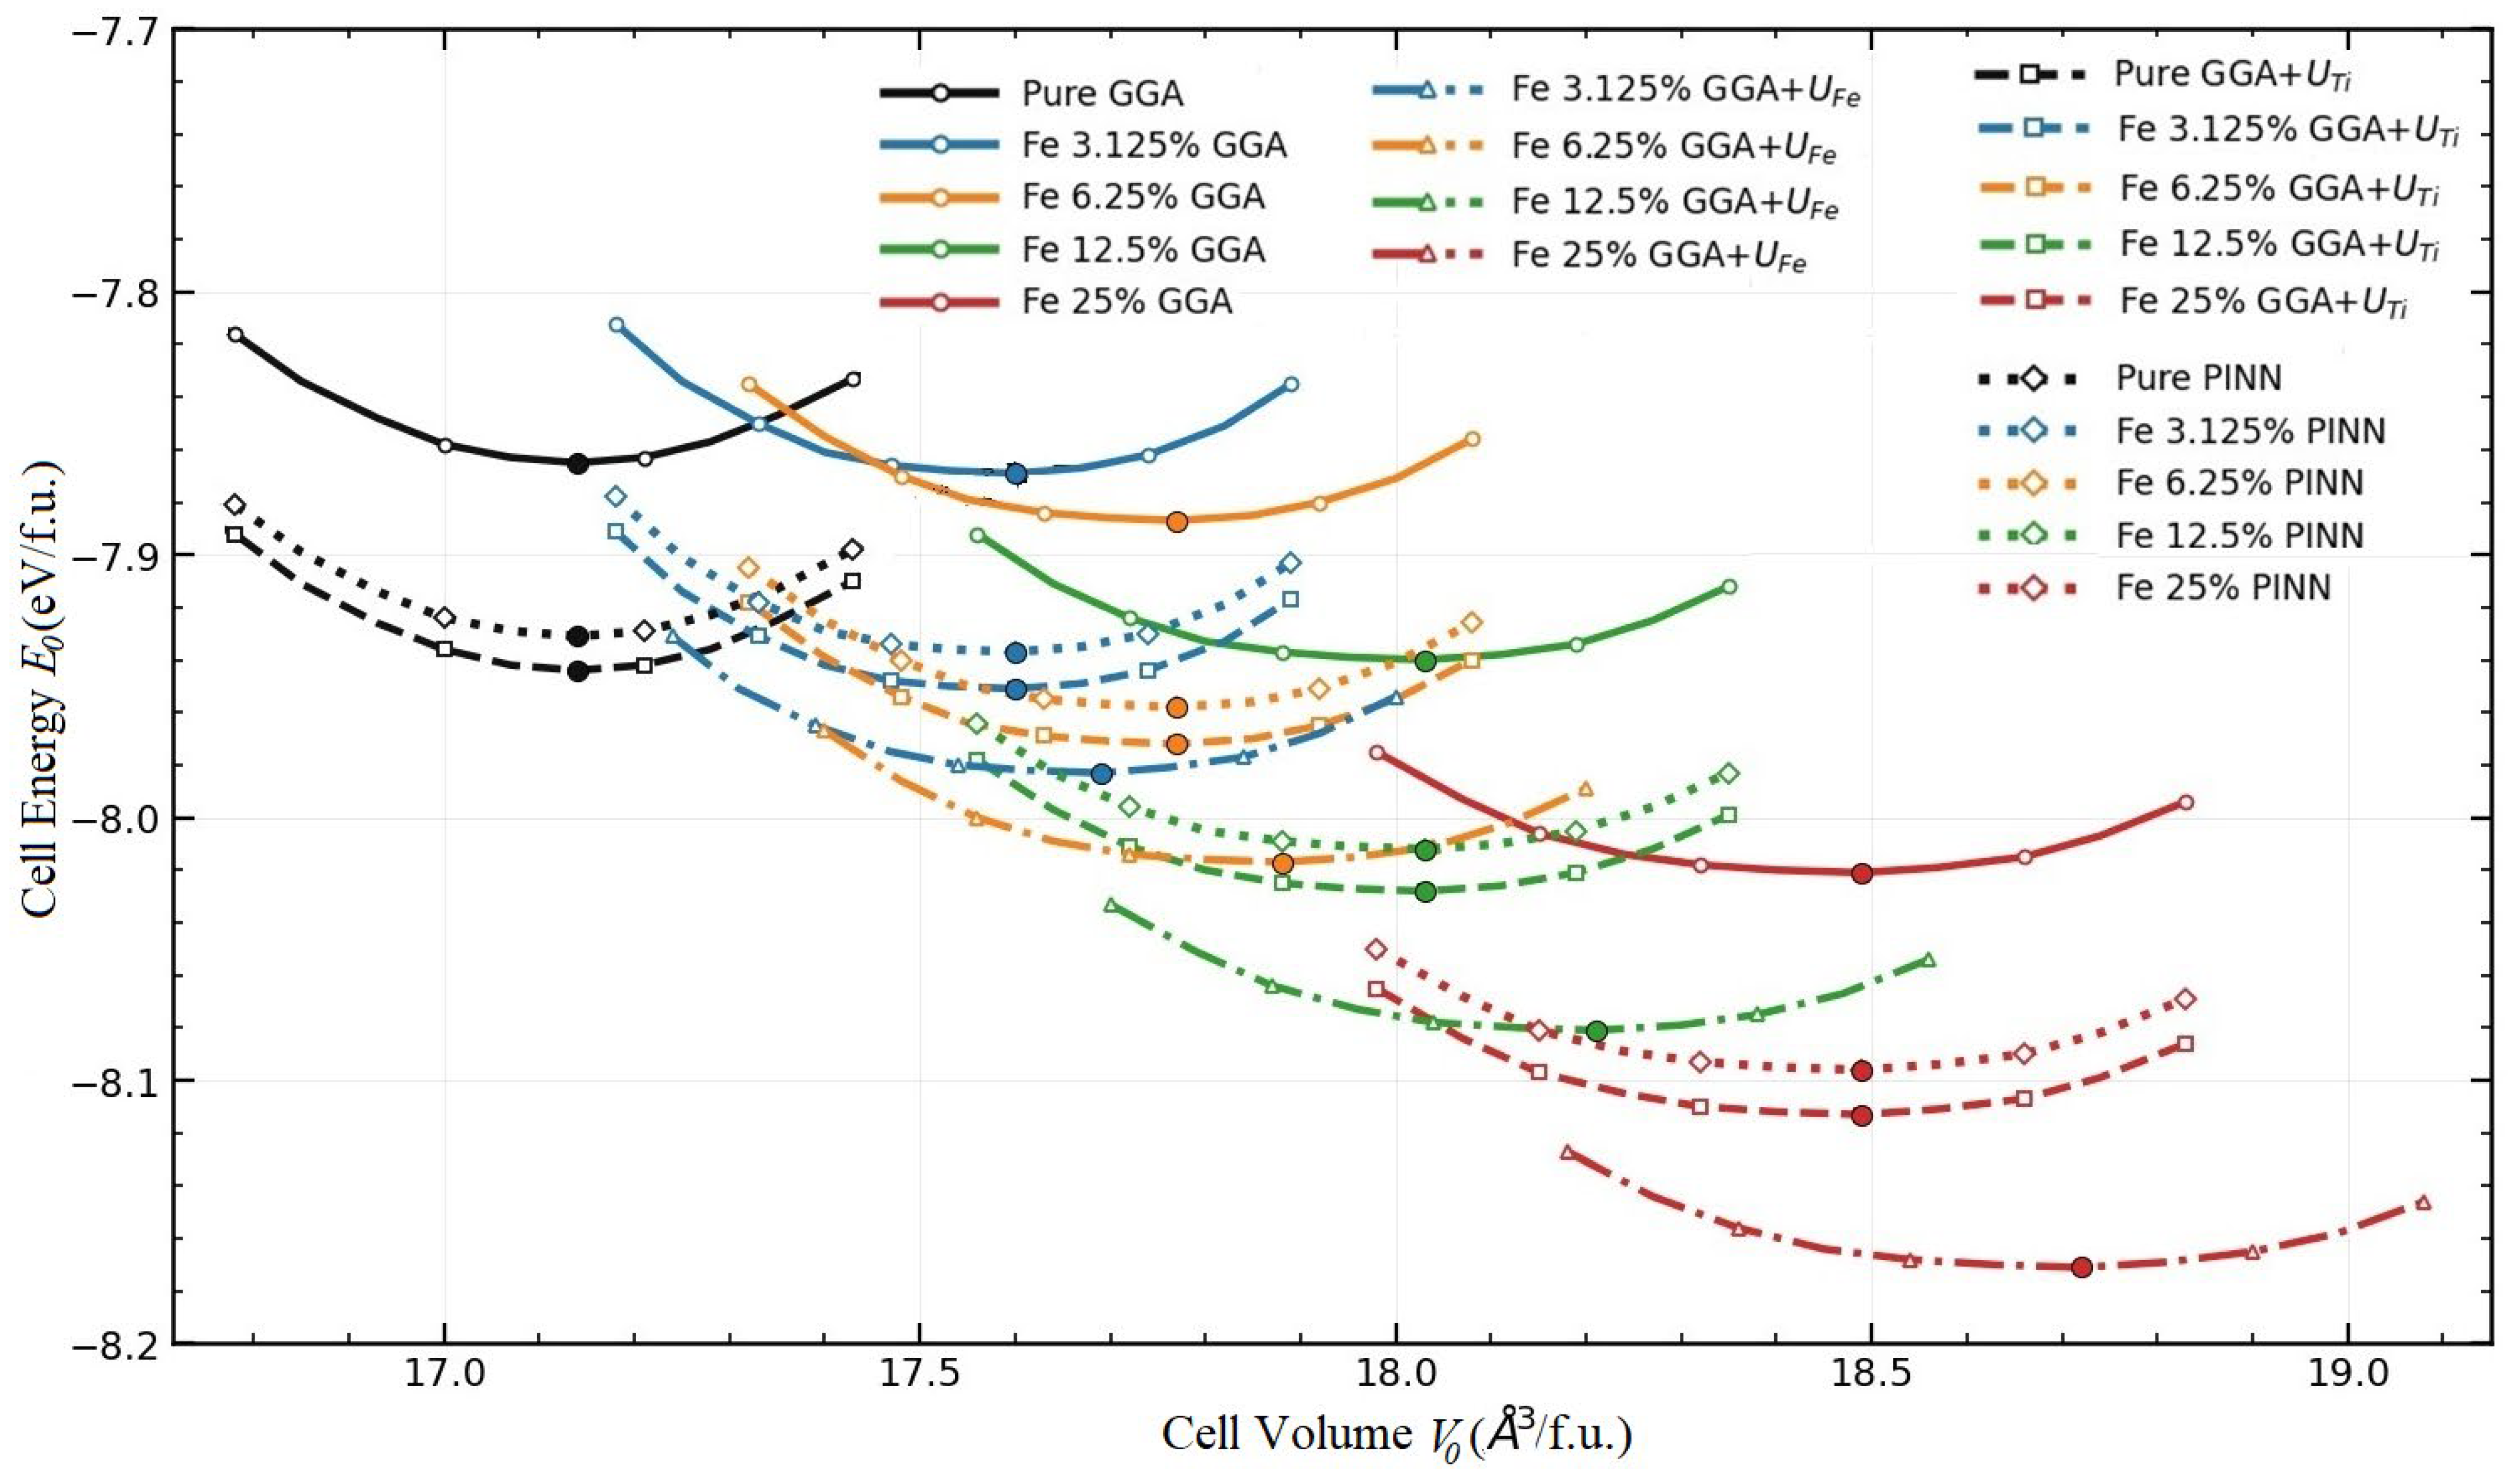
Figure 1 illustrates the optimized pure and Fe-doped anatase TiO2 supercells. The chosen supercell size reduces artificial dopant-dopant interactions at low Fe concentrations and allows a systematic comparison between dilute and higher dopant regimes. The local FeO6 distortion reflects the structural relaxation induced by replacing Ti with Fe and is expected to influence the electronic, magnetic, and optical behavior of the doped systems. Figure 2 shows the calculated equation-of-state curves. The equilibrium volume shifts progressively toward larger values with increasing Fe concentration, indicating lattice expansion caused by Fe substitution and local relaxation around the dopant sites. Pure anatase TiO2 has an equilibrium volume near 17.14 Å3/f.u., while Fe-doped systems increase from approximately 17.60 Å3/f.u. at 3.125% Fe to 18.49 Å3/f.u. at 25% Fe within GGA, GGA+UTi, and PINN. The Fe-site Hubbard correction produces a stronger expansion, with the 25% Fe system reaching about 18.72 Å3/f.u. The equilibrium energy becomes progressively more negative with increasing Fe content and with Hubbard correction, demonstrating enhanced energetic stabilization of the doped lattice. The deepest energy minimum is obtained for 25% Fe using GGA+UFe, approximately −8.171 eV/f.u. The PINN curves closely reproduce the GGA+UTi equation-of-state behavior, confirming their reliability for describing concentration-dependent structural trends in Fe-doped anatase TiO2.
Figure 1.
Optimized 2 × 2 × 2 anatase TiO2 supercells: (a) pristine, (b) 3.125% Fe-doped, and (c) 6.25% Fe-doped TiO2. Fe concentrations correspond to the fraction of Ti sites substituted by Fe.
Figure 2.
Energy–volume curves for pristine and Fe-doped anatase TiO2 obtained using GGA, GGA+UTi, GGA+UFe, and PINN. Energy and volume are reported per formula unit. Hubbard parameters are UTi = UFe = 4.5 eV, JTi = 0.8 eV, and JFe = 0.9 eV, where applicable. Filled symbols indicate the equilibrium energy minima.
Table 1, Table 2, Table 3, Table 4 and Table 5 summarize the structural, mechanical, energetic, electronic, and magnetic properties of pristine and Fe-doped anatase TiO2. Table 1 presents pure anatase TiO2, whereas Table 2, Table 3, Table 4 and Table 5 correspond to Fe concentrations of 3.125%, 6.25%, 12.5%, and 25%, respectively. For pristine anatase TiO2, the calculated equilibrium volume is 17.14 Å3/f.u., in good agreement with reported experimental and theoretical values [22,23]. The GGA+UTi correction slightly increases both the equilibrium volume and bulk modulus, indicating moderate lattice expansion and stiffening associated with improved Ti-3d localization [24]. The pressure derivative, B′0, remains close to 4, confirming a mechanically stable equation-of-state response. In addition, GGA+UTi lowers the total energy relative to GGA, while the PINN results closely reproduce the DFT energy–volume behavior. Pristine anatase TiO2 remains nonmagnetic, with a total magnetic moment of 0 μB [22,23,24,25].
Fe incorporation produces a clear concentration-dependent structural response. The equilibrium volume increases systematically with Fe content, reaching approximately 18.72–18.91 Å3/f.u. at 25% Fe, depending on the Hubbard treatment. This expansion is attributed to substitutional Fe incorporation and local structural relaxation around FeO6 octahedra. In contrast, the bulk modulus decreases with increasing Fe concentration, indicating progressive lattice softening and enhanced compressibility caused by dopant-induced distortion. Fe substitution also induces ferromagnetic ordering. The strongest spin polarization is obtained using the combined GGA+UTi+UFe treatment, where the magnetic moment reaches 4.41 μB/f.u. at 25% Fe. The PINN predictions reproduce the corresponding DFT+U structural, energetic, and magnetic trends with high accuracy [26,27,28,29,30,31].
The electronic band gap and formation energy are also strongly influenced by Fe concentration and correlation effects. Standard PBE-GGA underestimates the band gap of pristine TiO2, giving 2.18 eV because of self-interaction error and excessive Ti-3d delocalization [32]. The GGA+UTi correction increases the band gap to 3.07 eV, while PINN predicts 3.19 eV, close to experimental observations of 3.2 eV [32]. Fe doping introduces localized Fe-3d impurity states within the forbidden gap, progressively narrowing the band gap and enhancing visible-light absorption. The PINN band gap decreases from 2.25 eV at 3.125% Fe to 1.48 eV at 25% Fe close to previous studies [26,27,28,29]. Formation energies are negative for all compositions and become increasingly negative with Fe concentration, indicating favorable substitutional incorporation. The dual GGA+UTi+UFe treatment provides the strongest energetic stabilization, with PINN formation energies decreasing from −9.77 to −10.69 eV/f.u. and agreeing with GGA+U values within 0.3%. Overall, these results demonstrate that Fe doping effectively tunes the structural, mechanical, magnetic, electronic, and thermodynamic properties of anatase TiO2, supporting its potential for photocatalytic and optoelectronic applications [26,29,30,33].
Table 1.
Equilibrium volume, bulk modulus, bulk modulus derivative, total energy, band gap, formation energy, and magnetic moment of pristine anatase TiO2 obtained from WIEN2k FP-LAPW calculations using GGA and GGA+UTi, alongside PINN predictions. Available experimental and previous theoretical values are included for comparison.
Table 2.
Equilibrium volume, bulk modulus, total energy, band gap, formation energy, and ferromagnetic magnetic moment of 3.125% Fe-doped anatase TiO2 obtained from WIEN2k FP-LAPW calculations using GGA, GGA+UTi, GGA+UFe, and GGA+UTi+UFe, alongside PINN predictions. Available experimental and previous theoretical values are included for comparison.
Table 3.
Equilibrium volume, bulk modulus, total energy, band gap, formation energy, and ferromagnetic magnetic moment of 6.25% Fe-doped anatase TiO2 obtained from WIEN2k FP-LAPW calculations using GGA, GGA+UTi, GGA+UFe, and GGA+UTi+UFe, alongside PINN predictions. Available experimental and previous theoretical values are included for comparison.
Table 4.
Equilibrium volume, bulk modulus, total energy, band gap, formation energy, and ferromagnetic magnetic moment of 12.5% Fe-doped anatase TiO2 obtained from WIEN2k FP-LAPW calculations using GGA, GGA+UTi, GGA+UFe, and GGA+UTi+UFe, alongside PINN predictions. Available experimental and previous theoretical values are included for comparison.
Table 5.
Equilibrium volume, bulk modulus, total energy, band gap, formation energy, and ferromagnetic magnetic moment of 25% Fe-doped anatase TiO2 obtained from WIEN2k FP-LAPW calculations using GGA, GGA+UTi, GGA+UFe, and GGA+UTi+UFe, alongside PINN predictions. Available experimental and previous theoretical values are included for comparison.
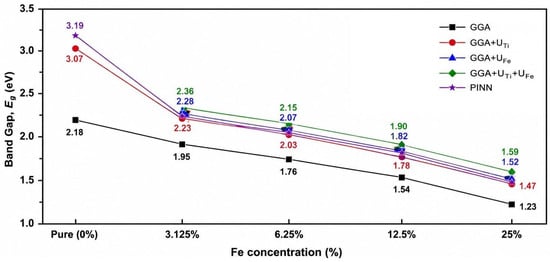
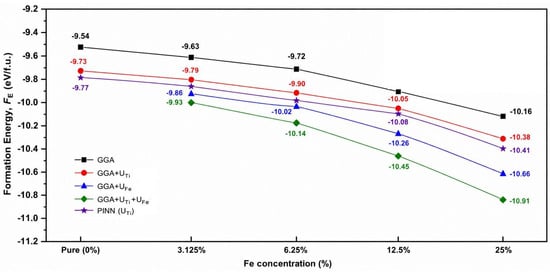
Figure 3, Figure 4 and Figure 5 present the concentration-dependent band gap, equilibrium total cell energy, and formation energy of pure and Fe-doped anatase TiO2. As shown in Figure 3, the band gap decreases monotonically with increasing Fe concentration for all computational approaches, confirming the formation of Fe-induced impurity states within the forbidden gap. For pristine TiO2, GGA predicts a band gap of 2.18 eV, whereas Hubbard-corrected and PINN calculations yield wider gaps of approximately 3.07–3.19 eV, in reasonable agreement with the experimental value of about 3.2 eV [32] and previous theoretical reports [34,35]. At 25% Fe, the band gap decreases to 1.23, 1.47, 1.52, 1.59, and 1.48 eV for GGA, GGA+UTi, GGA+UFe, GGA+UTi+UFe, and PINN, respectively. The combined GGA+UTi+UFe treatment gives the largest gap among the doped systems, indicating improved localization of Ti-3d and Fe-3d states.
Figure 3.
Band gap, Eg, versus Fe concentration in pristine and Fe-doped anatase TiO2 obtained using GGA, GGA+UTi, GGA+UFe, GGA+UTi+UFe, and PINN. Hubbard parameters are UTi = UFe = 4.5 eV, JTi = 0.8 eV, and JFe = 0.9 eV, where applicable.
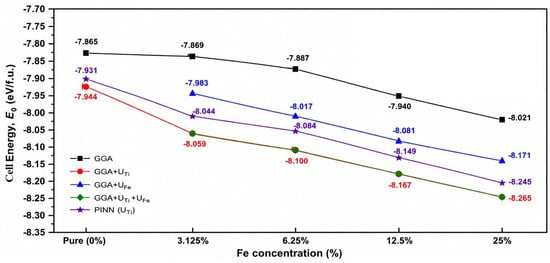
Figure 4.
Equilibrium total energy, E0, versus Fe concentration in pristine and Fe−doped anatase TiO2 obtained using GGA, GGA+UTi, GGA+UFe, GGA+UTi+UFe, and PINN. Hubbard parameters are UTi = UFe = 4.5 eV, JTi = 0.8 eV, and JFe = 0.9 eV, where applicable.
Figure 5.
Formation energy, FE, versus Fe concentration in pristine and Fe−doped anatase TiO2 obtained using GGA, GGA+UTi, GGA+UFe, GGA+UTi+UFe, and PINN. Hubbard parameters are UTi = UFe = 4.5 eV, JTi = 0.8 eV, and JFe = 0.9 eV, where applicable.
Figure 4 shows that the equilibrium total cell energy also decreases with increasing Fe concentration, indicating enhanced energetic stability of the doped structures. Within GGA, E0 decreases from −7.865 eV/f.u. for pure TiO2 to −8.021 eV/f.u. at 25% Fe, whereas Hubbard-corrected calculations reach −8.265 eV/f.u. at the same concentration. The PINN predictions closely follow the correlated DFT trend, with deviations of only 0.013–0.020 eV/f.u., demonstrating their reliability for reproducing the concentration-dependent energy landscape. Figure 5 further shows that the formation energies are negative for all systems and become progressively more negative with increasing Fe content. The lowest value is obtained for the GGA+UTi+UFe treatment at 25% Fe, reaching −10.91 eV/f.u. This trend indicates favorable substitutional Fe incorporation and increasing stabilization of the anatase lattice. The calculated behavior agrees with previous experimental and DFT+U studies [10,36,37], confirming that Fe doping stabilizes anatase TiO2 while narrowing its band gap, which is beneficial for visible-light-driven photocatalytic and optoelectronic applications.
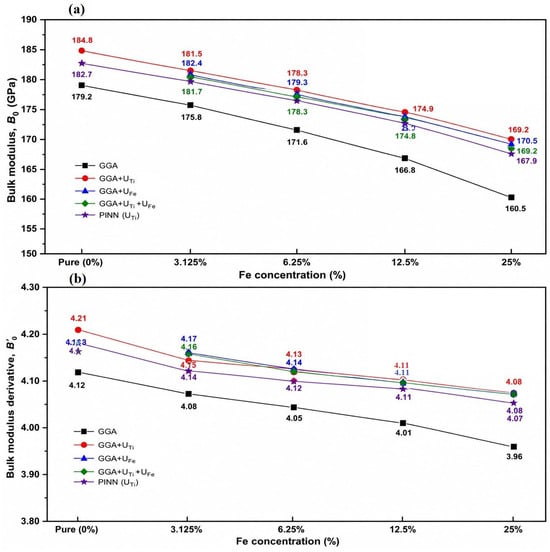
Figure 6 presents the variation in the equilibrium bulk modulus, B0, and its pressure derivative, B′0, as a function of Fe concentration in anatase TiO2. For all computational approaches, B0 decreases monotonically with increasing Fe content, indicating progressive lattice softening and enhanced compressibility induced by substitutional Fe incorporation. Within GGA, B0 decreases from 179.2 GPa for pristine TiO2 to 160.5 GPa at 25% Fe. The Hubbard-corrected approaches predict higher B0 values over the full concentration range, with GGA+UTi decreasing from 184.8 to 169.2 GPa, GGA+UFe from 182.4 to 170.5 GPa, and GGA+UTi+UFe from 181.7 to 169.2 GPa. The PINN results closely follow the GGA+UTi trend, decreasing from 182.7 to 167.9 GPa. These values are in good agreement with reported experimental results of 179–183 GPa [23,32] and theoretical values of 177.5–188 GPa [22,24,26,29].
Figure 6.
(a) Equilibrium bulk modulus, B0, and (b) its pressure derivative, B′0, versus Fe concentration in pristine and Fe-doped anatase TiO2 obtained using GGA, GGA+UTi, GGA+UFe, GGA+UTi+UFe, and PINN. Hubbard parameters are UTi = UFe = 4.5 eV, JTi = 0.8 eV, and JFe = 0.9 eV, where applicable.
The pressure derivative, B′0, shows a slight decrease with increasing Fe concentration, indicating a moderate reduction in the equation-of-state curvature. GGA predicts a decrease from 4.12 for pristine TiO2 to 3.96 at 25% Fe, whereas the Hubbard-corrected and PINN results remain slightly higher, mainly within the range of 4.07–4.21. The calculated B′0 values agree well with previous experimental and theoretical reports of approximately 3.7–4.5 [22,24,25,26,29,31,32]. This agreement confirms the physical reliability of the EOS fitting and shows that Fe doping gradually softens the anatase lattice while preserving mechanical stability.
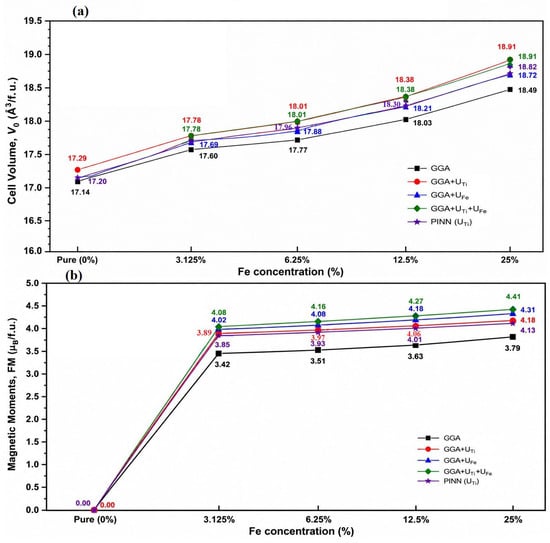
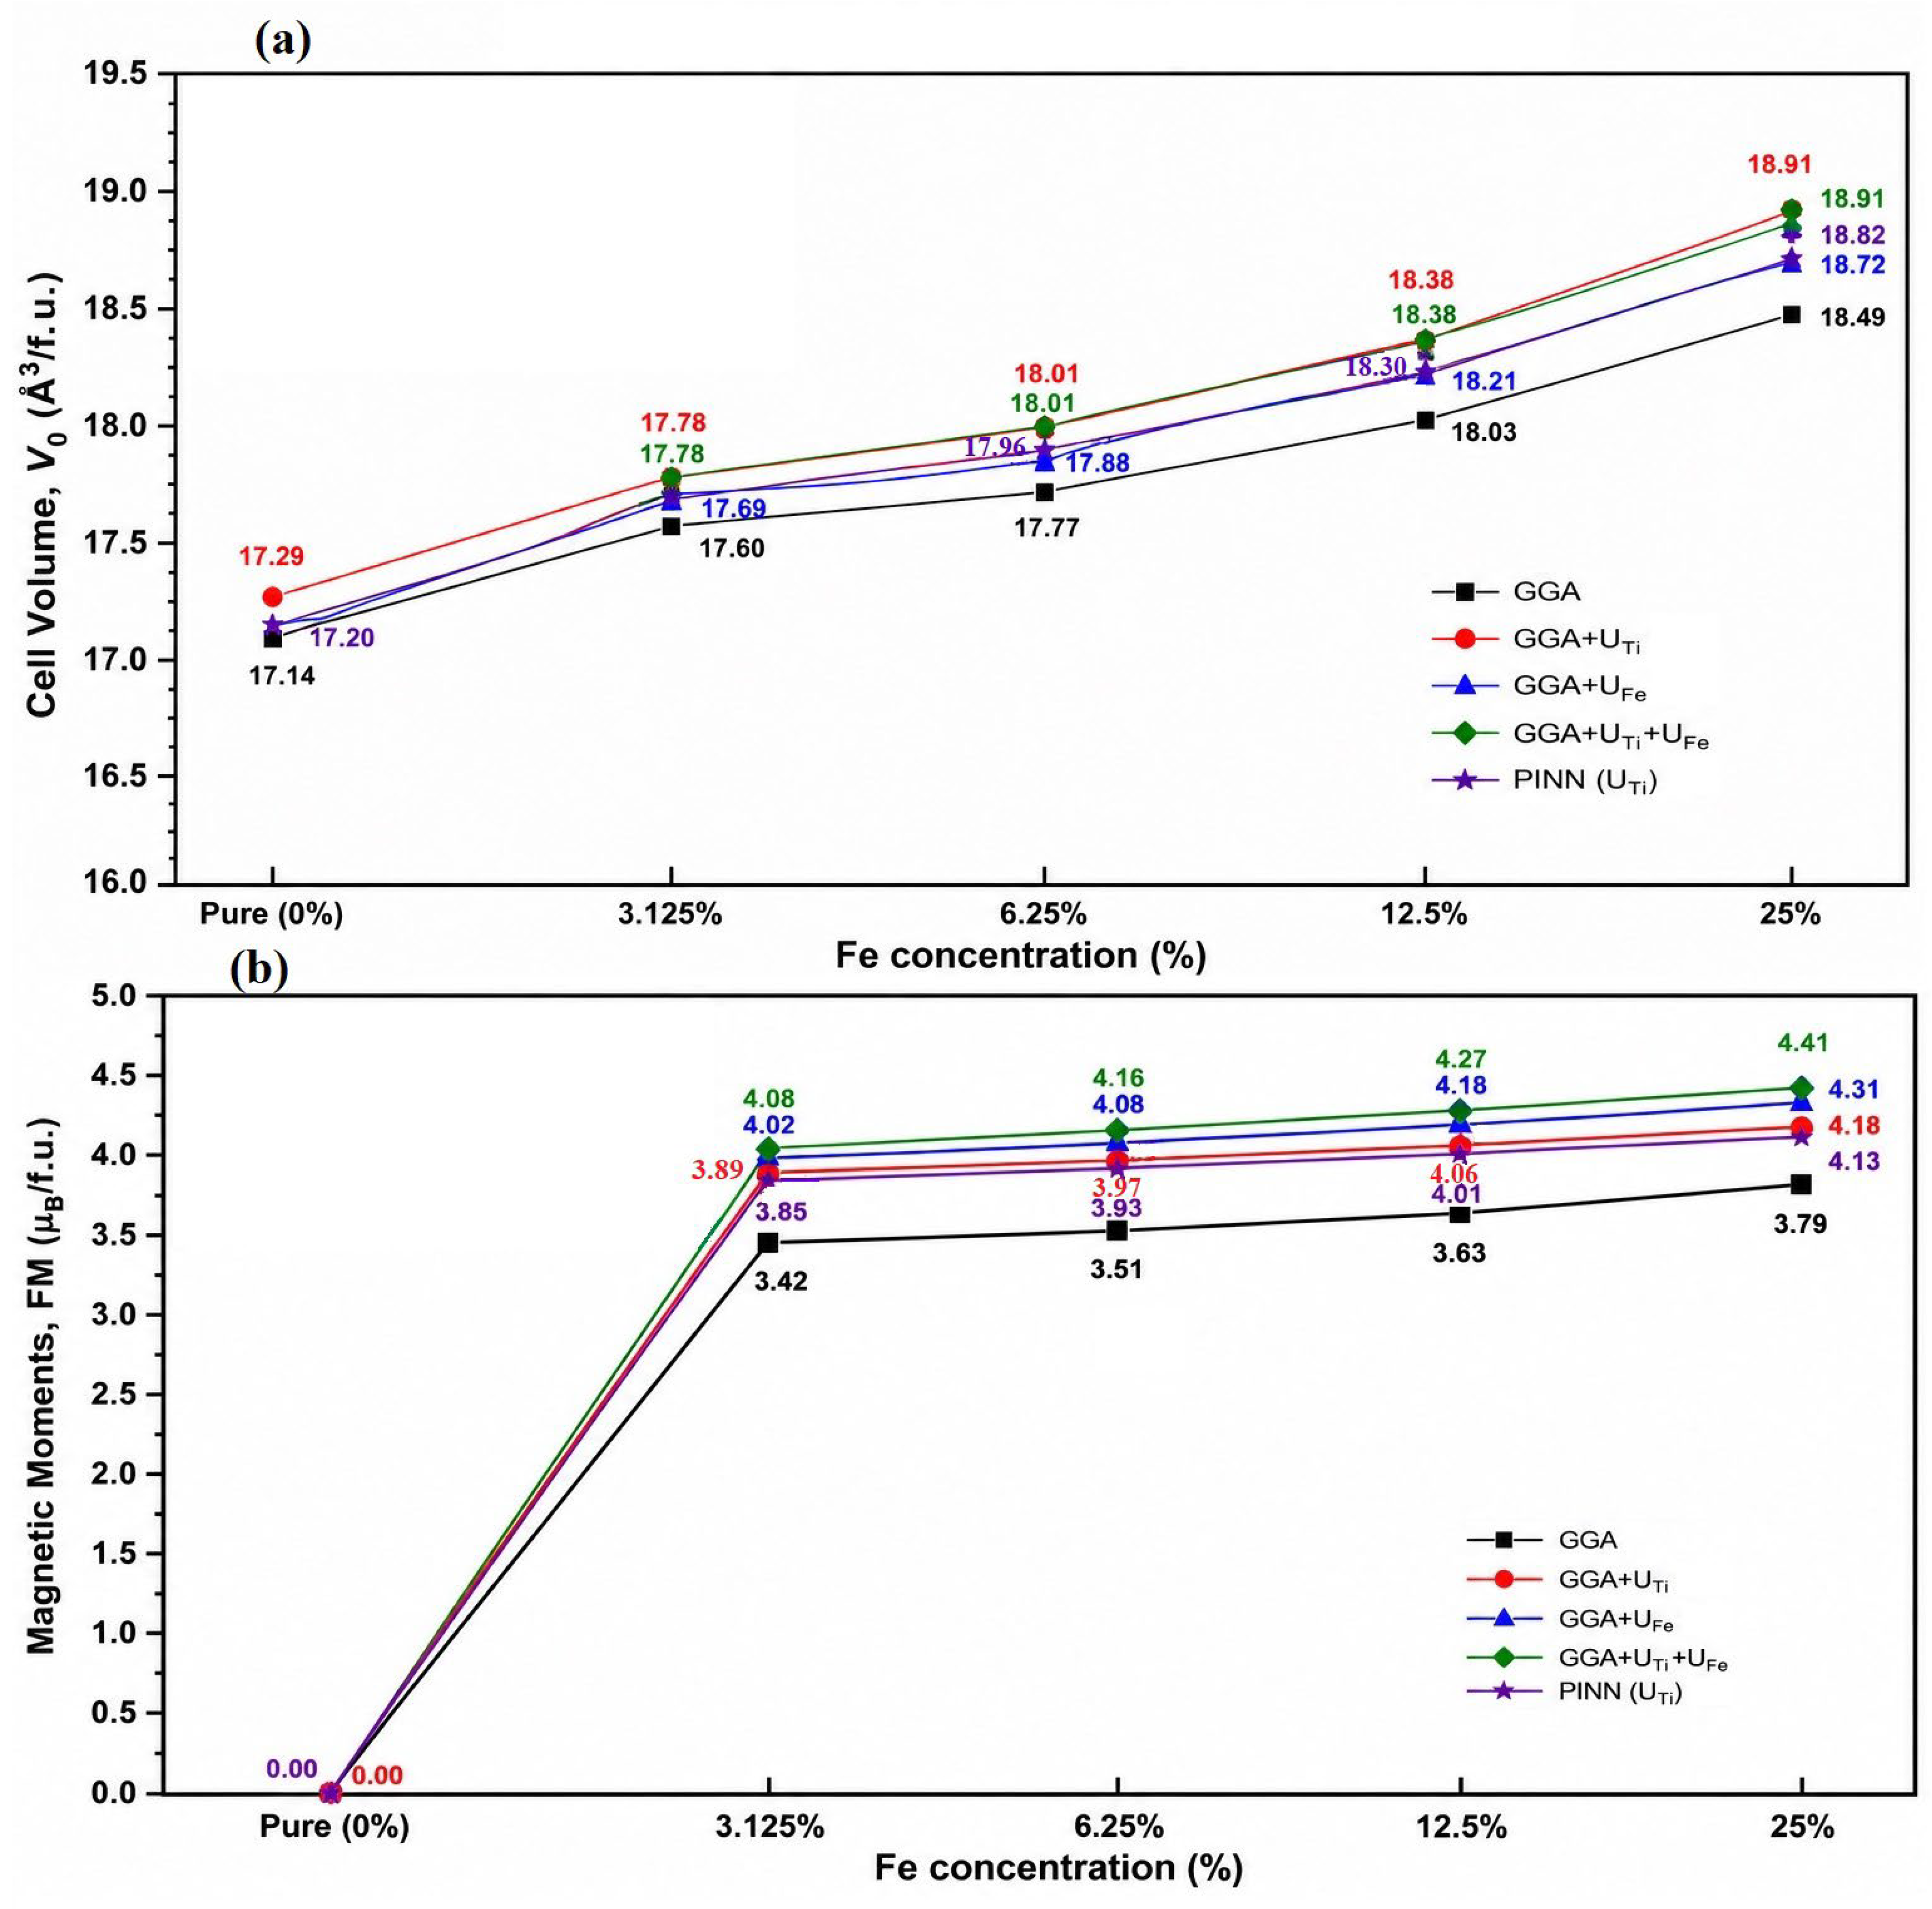
Figure 7 presents the variation in the equilibrium cell volume, V0, and ferromagnetic magnetic moment, MFM, as a function of Fe concentration in anatase TiO2. The equilibrium volume increases monotonically with increasing Fe content for all computational approaches, indicating lattice expansion induced by substitutional Fe incorporation. Within GGA, V0 increases from 17.14 Å3/f.u. for pristine TiO2 to 18.49 Å3/f.u. at 25% Fe. The Hubbard-corrected methods predict larger equilibrium volumes, reaching 18.91 Å3/f.u. for both GGA+UTi and GGA+UTi+UFe, while GGA+UFe gives 18.72 Å3/f.u. at the same concentration. The PINN results closely follow the GGA+UTi trend and yield 18.82 Å3/f.u. at 25% Fe. This expansion is mainly attributed to the larger ionic radius of high-spin Fe3+ compared with Ti4+, together with local structural relaxation around Fe substitutional sites. The calculated values are in good agreement with previous experimental and theoretical results [29,32].
Figure 7.
(a) Equilibrium volume, V0, and (b) ferromagnetic magnetic moment, MFM, versus Fe concentration in pristine and Fe-doped anatase TiO2 obtained using GGA, GGA+UTi, GGA+UFe, GGA+UTi+UFe, and PINN. Hubbard parameters are UTi = UFe = 4.5 eV, JTi = 0.8 eV, and JFe = 0.9 eV, where applicable.
Fe substitution also produces pronounced ferromagnetic behavior. Pristine anatase TiO2 remains nonmagnetic, whereas MFM increases systematically with Fe concentration. Within GGA, the magnetic moment increases from 3.42 μB/f.u. at 3.125% Fe to 3.79 μB/f.u. at 25% Fe. The Hubbard-corrected methods yield larger moments, increasing from 3.89 to 4.18 μB/f.u. for GGA+UTi, from 4.02 to 4.31 μB/f.u. for GGA+UFe, and from 4.08 to 4.41 μB/f.u. for GGA+UTi+UFe. The combined Hubbard correction therefore gives the strongest spin polarization. The PINN predictions reproduce the GGA+UTi trend, increasing from 3.85 to 4.13 μB/f.u. The enhancement of magnetism with Fe content is associated with stronger localization of Fe-3d states and increased exchange interactions at higher dopant concentrations, consistent with previous experimental and theoretical studies [6,36,38,39].
3.2. Quantitative Validation and Computational Performance of the PINN
The predictive performance of the PINN was quantitatively assessed against the corresponding WIEN2k FP-LAPW reference data for the equilibrium volume V0, bulk modulus B0, pressure derivative B′0, equilibrium energy E0, electronic band gap Eg, formation energy FE, and ferromagnetic magnetic moment MFM. The calculated dataset results cover pristine TiO2 and Fe concentrations of 3.125%, 6.25%, 12.5%, and 25%, thereby providing a concentration-dependent basis for evaluating the surrogate model. The underlying first-principles calculations employ a 96-atom 2 × 2 × 2 anatase supercell and GGA/GGA+U treatments of localized Ti-3d and Fe-3d states.
Using the rounded values in Table 1, Table 2, Table 3, Table 4 and Table 5 and GGA+UTi as the comparison reference, the tabulated band gaps exhibit an MAE of 0.038 eV, an RMSE of 0.056 eV, and R2 of 0.989. For the four Fe-doped compositions alone, the corresponding values are 0.0175 eV, 0.0180 eV, and 0.996. However, formation-energy agreement is weaker against this reference, with an MAE of 0.168 eV/f.u. and an RMSE of 0.194 eV/f.u. across the five compositions.
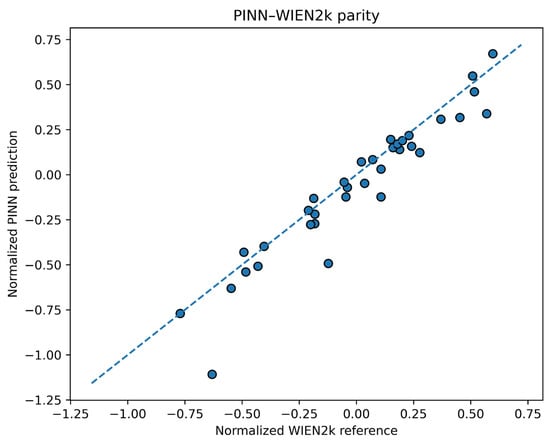
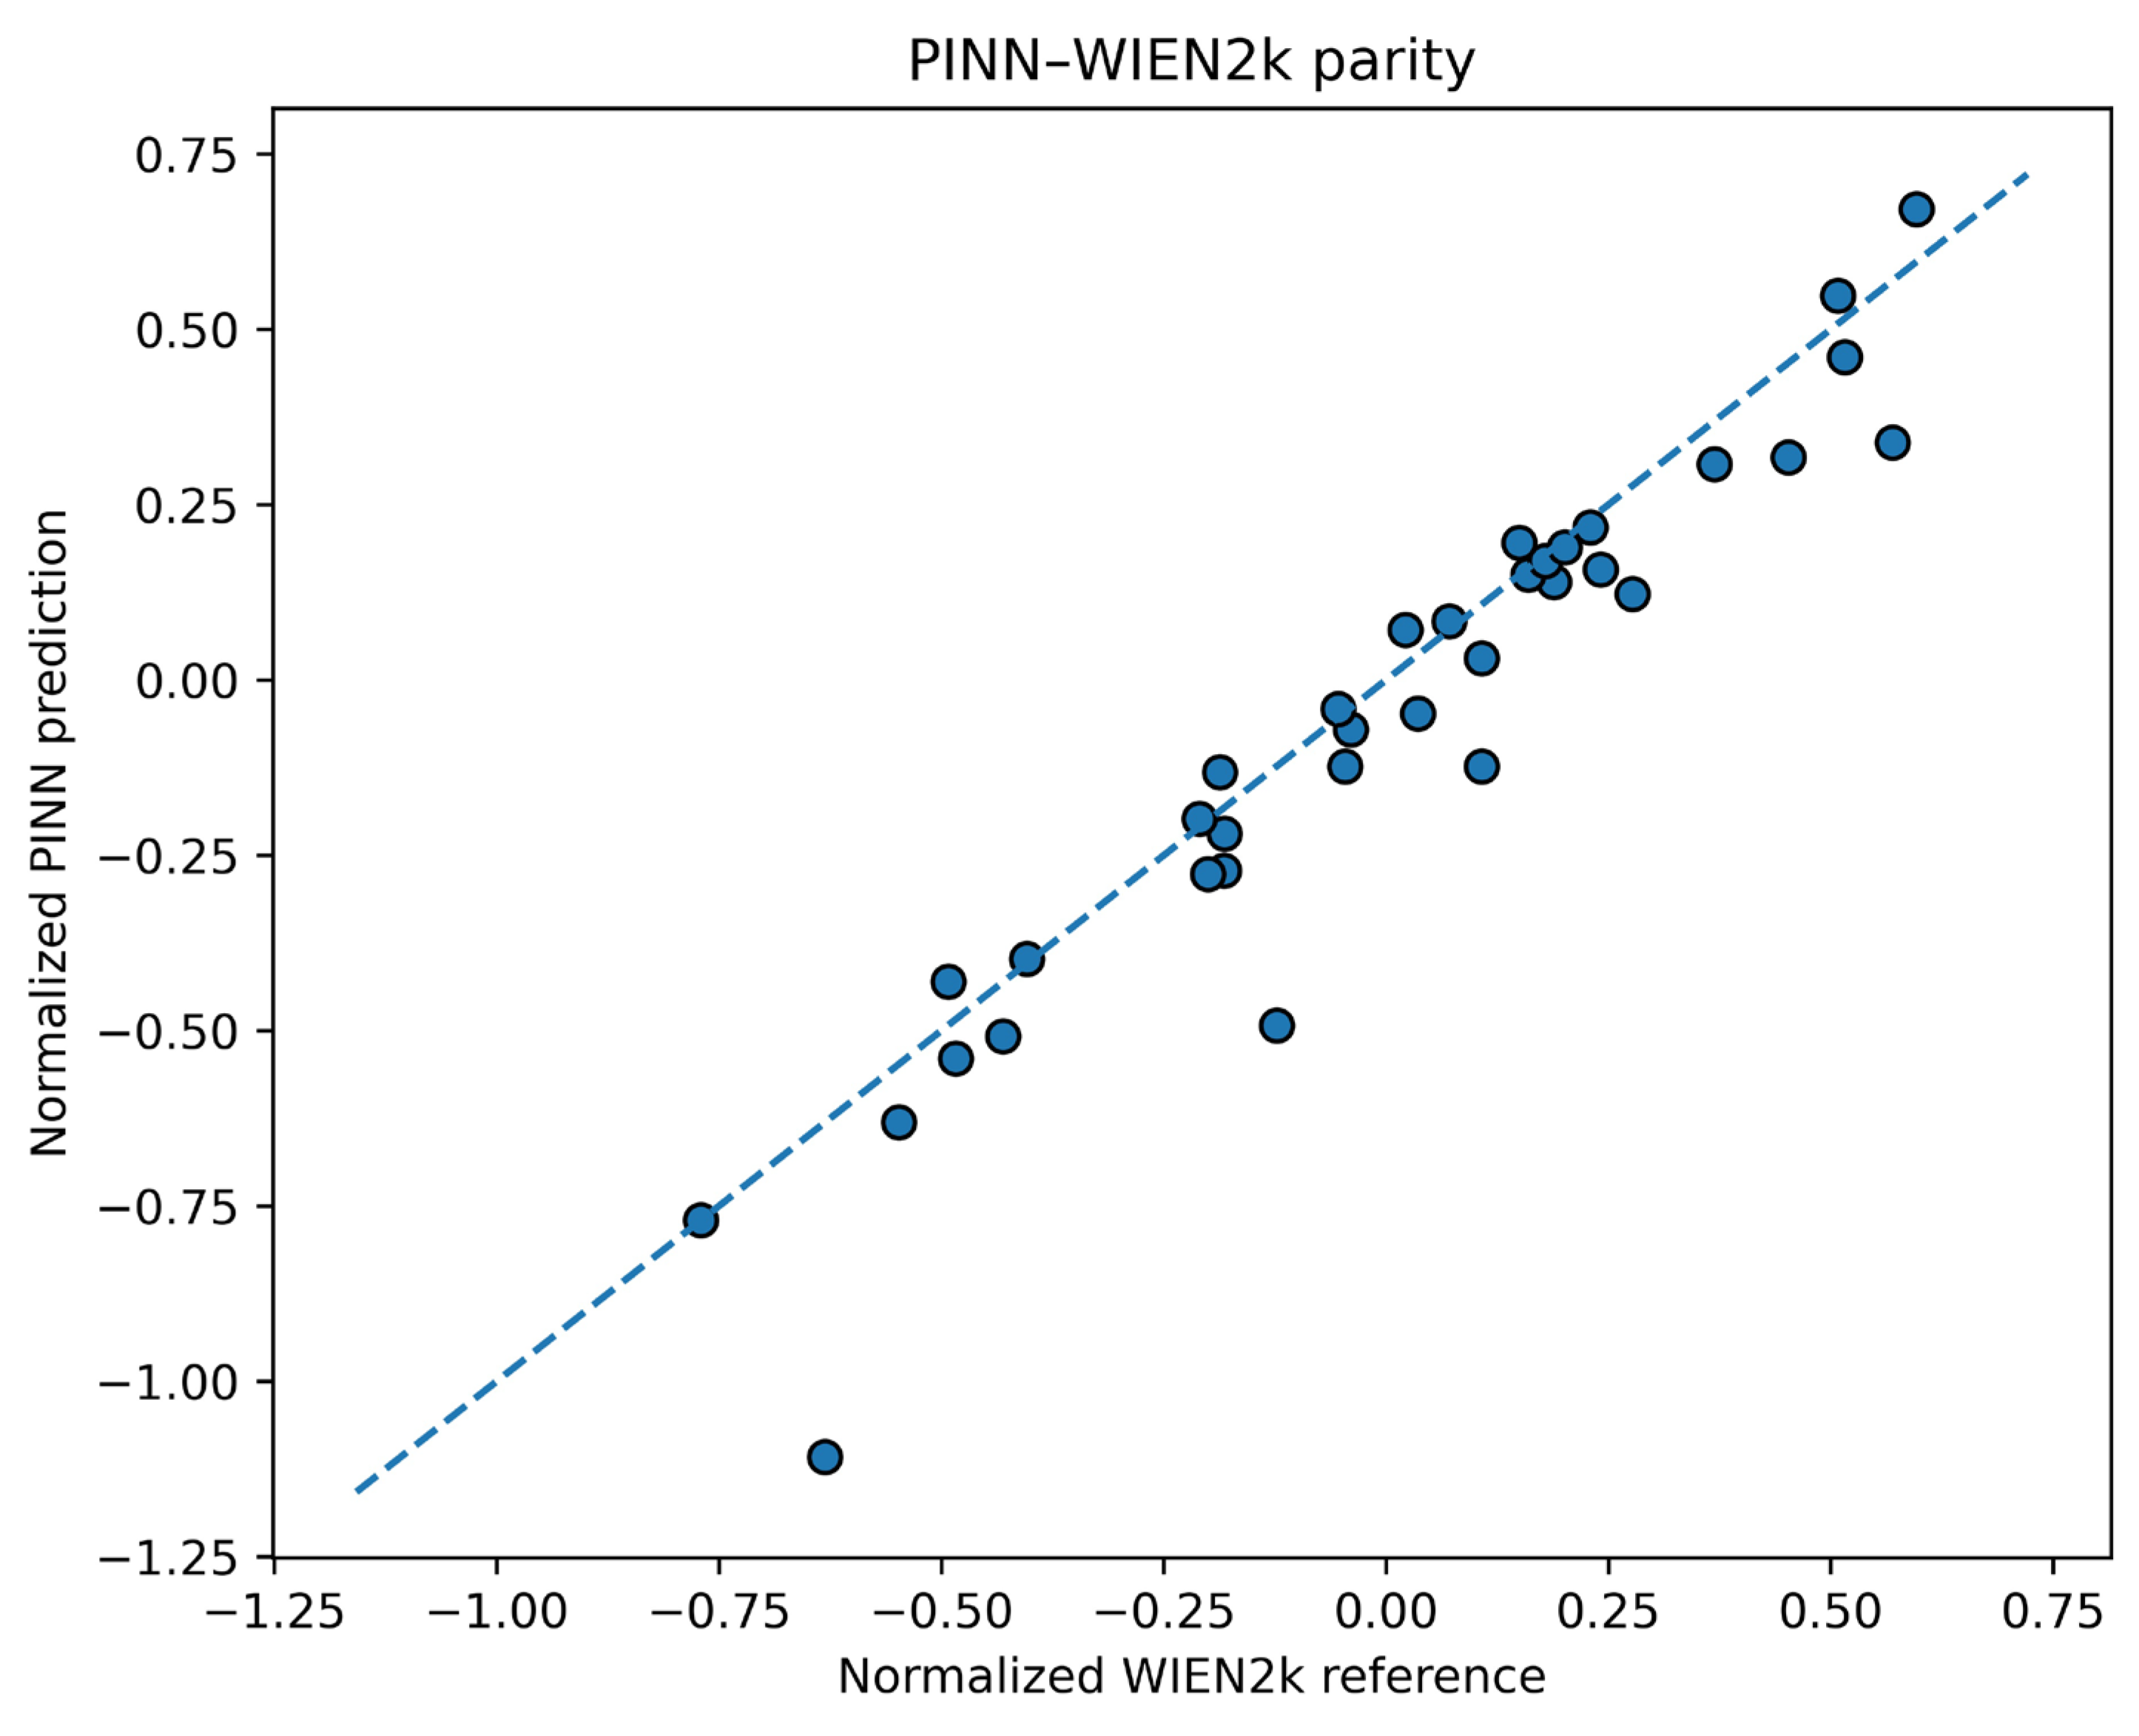
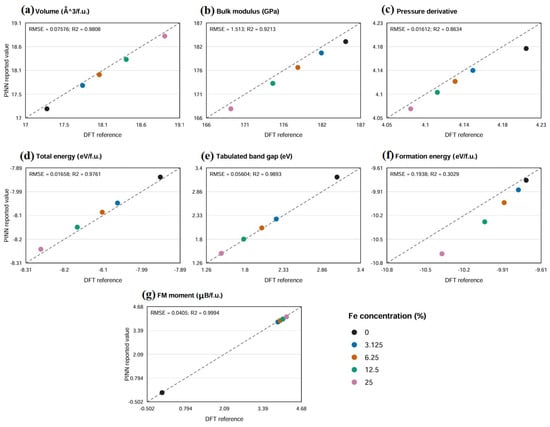
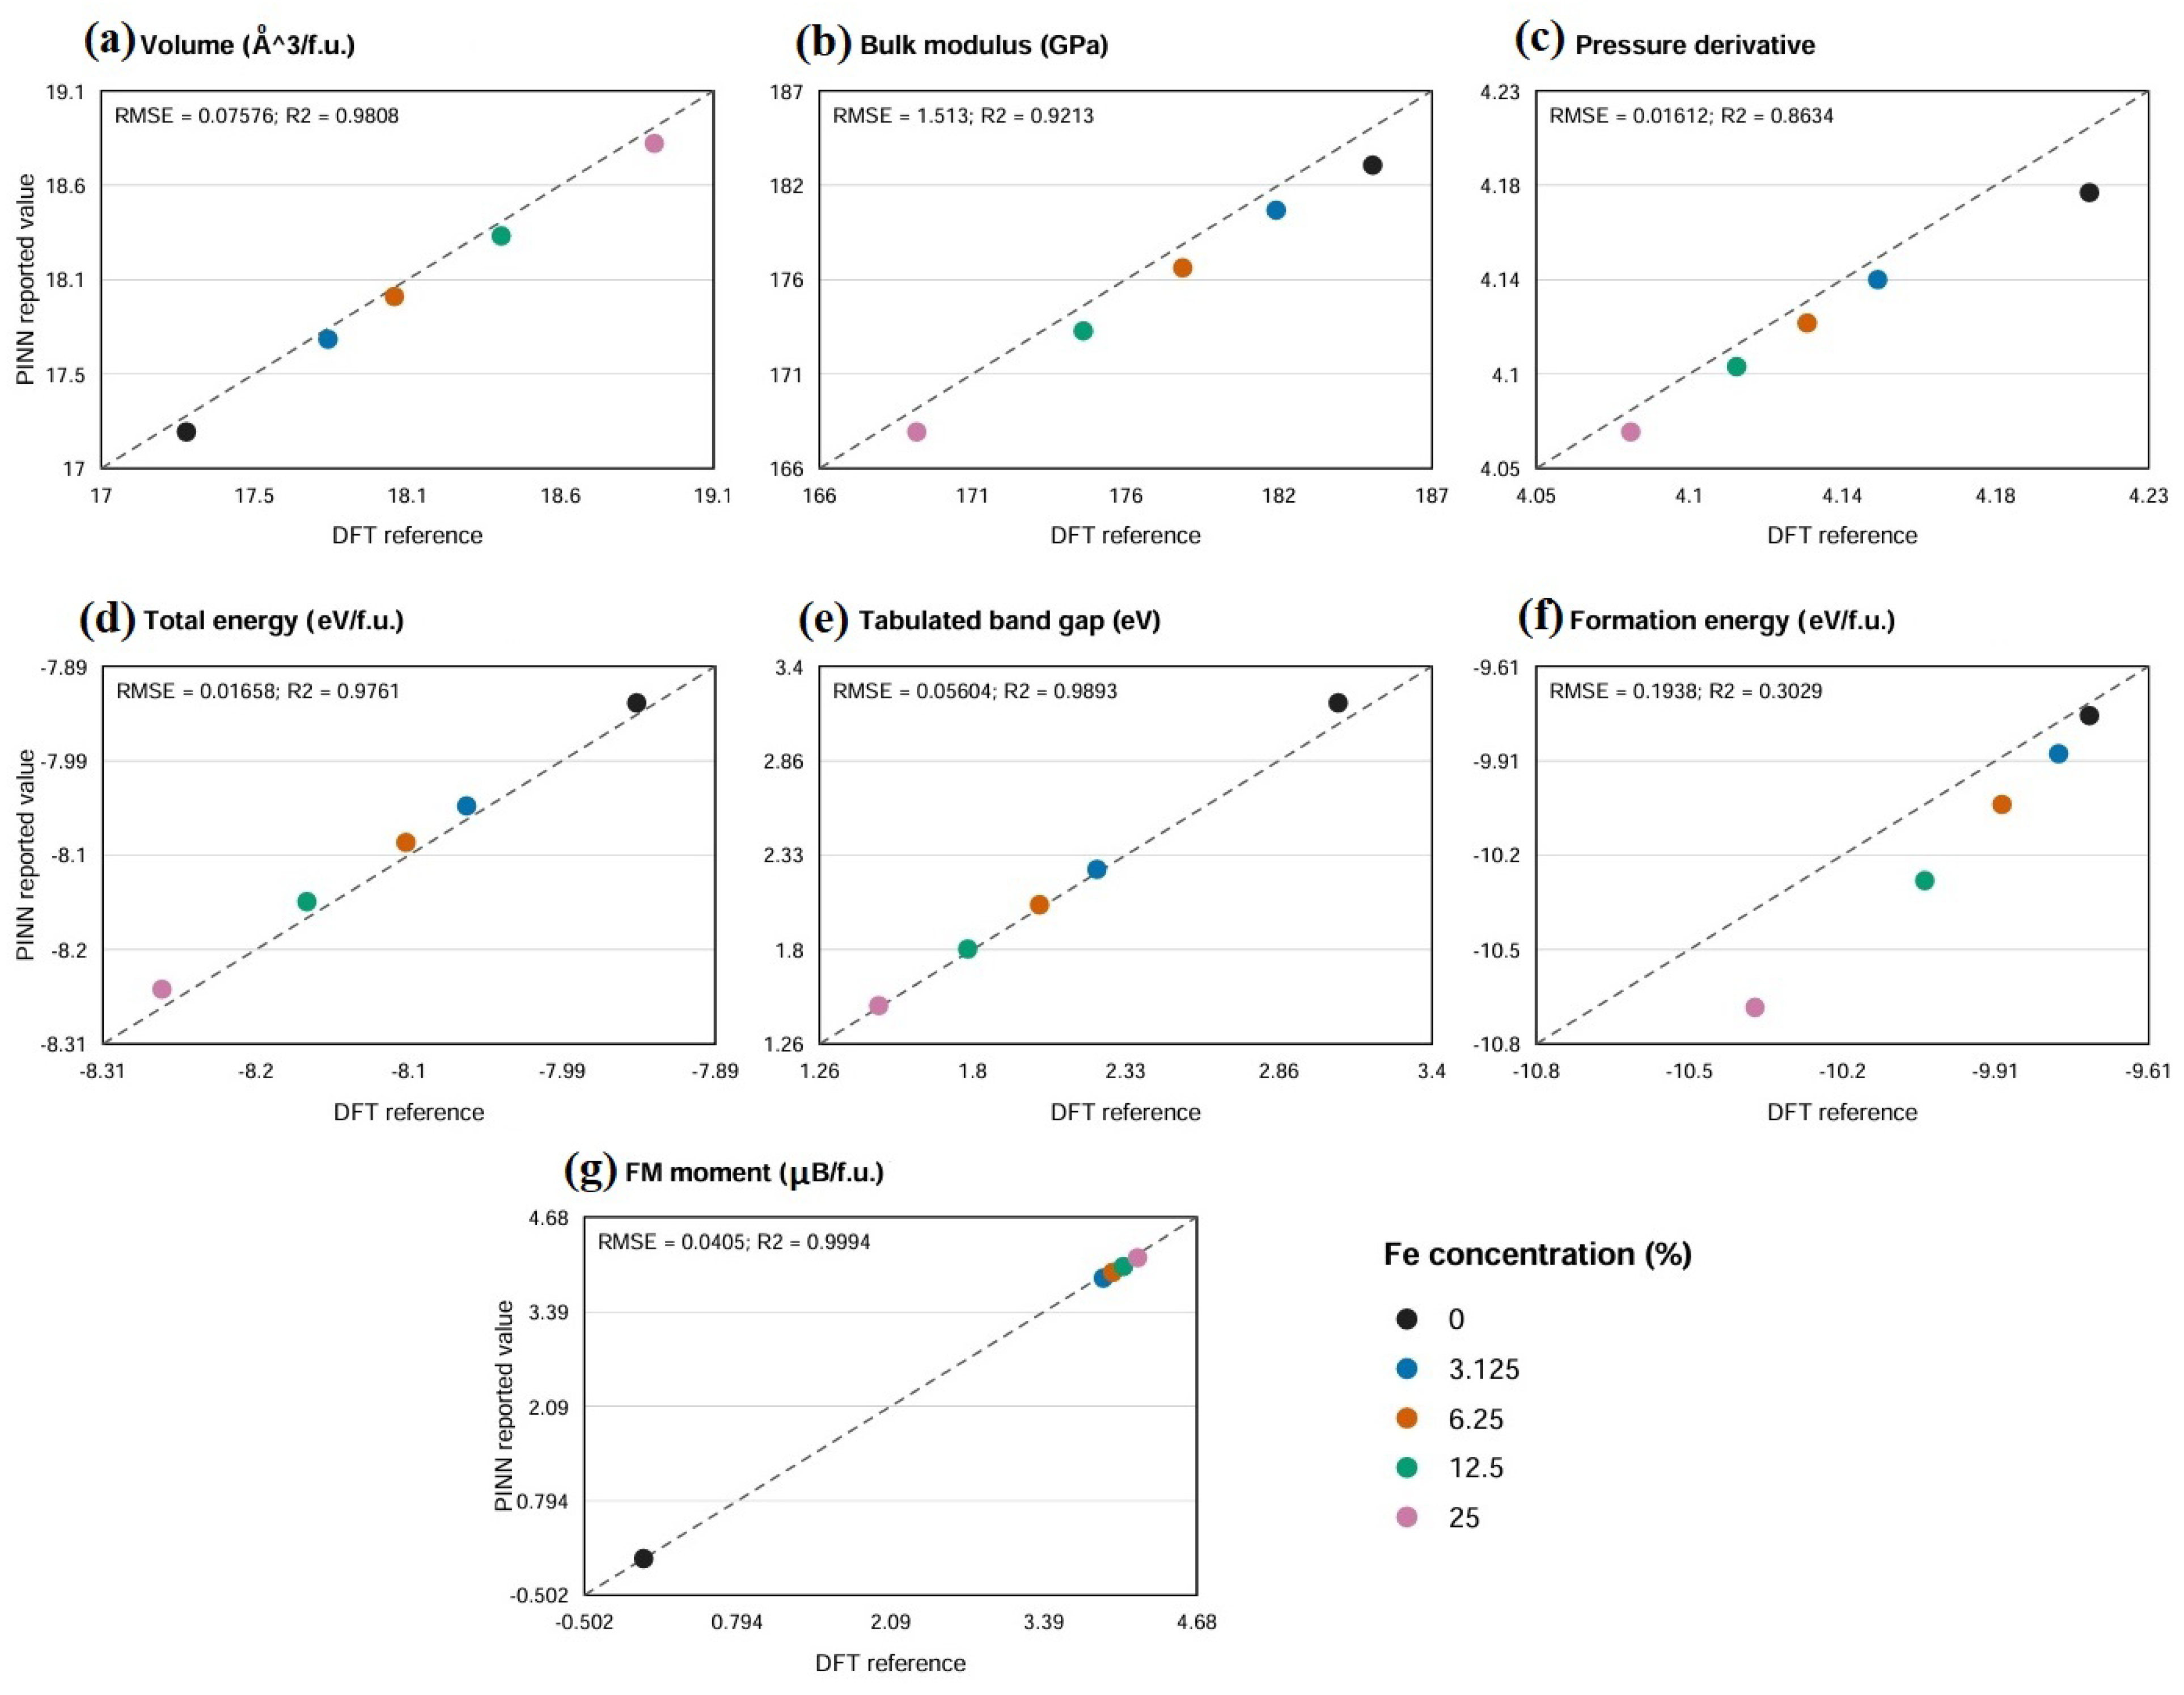
Figure 8 compares the reported PINN predictions with the corresponding GGA+UTi WIEN2k values for the structural, energetic, electronic, and magnetic properties. This comparison assesses agreement with the Ti-site Hubbard-corrected series; it does not establish predictive accuracy for unseen compositions because training and test membership are not documented.
Figure 8.
Parity comparison of property-wise normalized PINN predictions and WIEN2k FP-LAPW reference values for the structural, mechanical, energetic, electronic, and magnetic properties of pristine and Fe-doped anatase TiO2. The dashed diagonal denotes ideal agreement, yPINN = yWIEN2k.
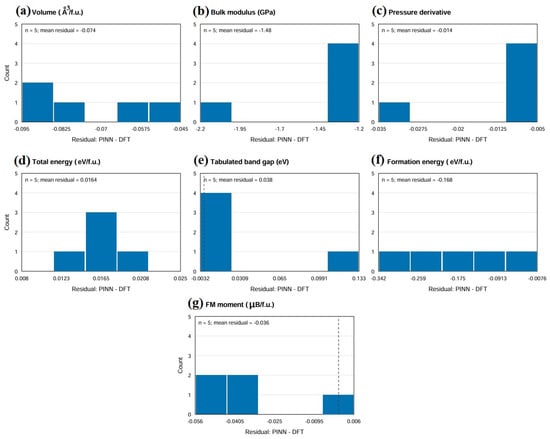
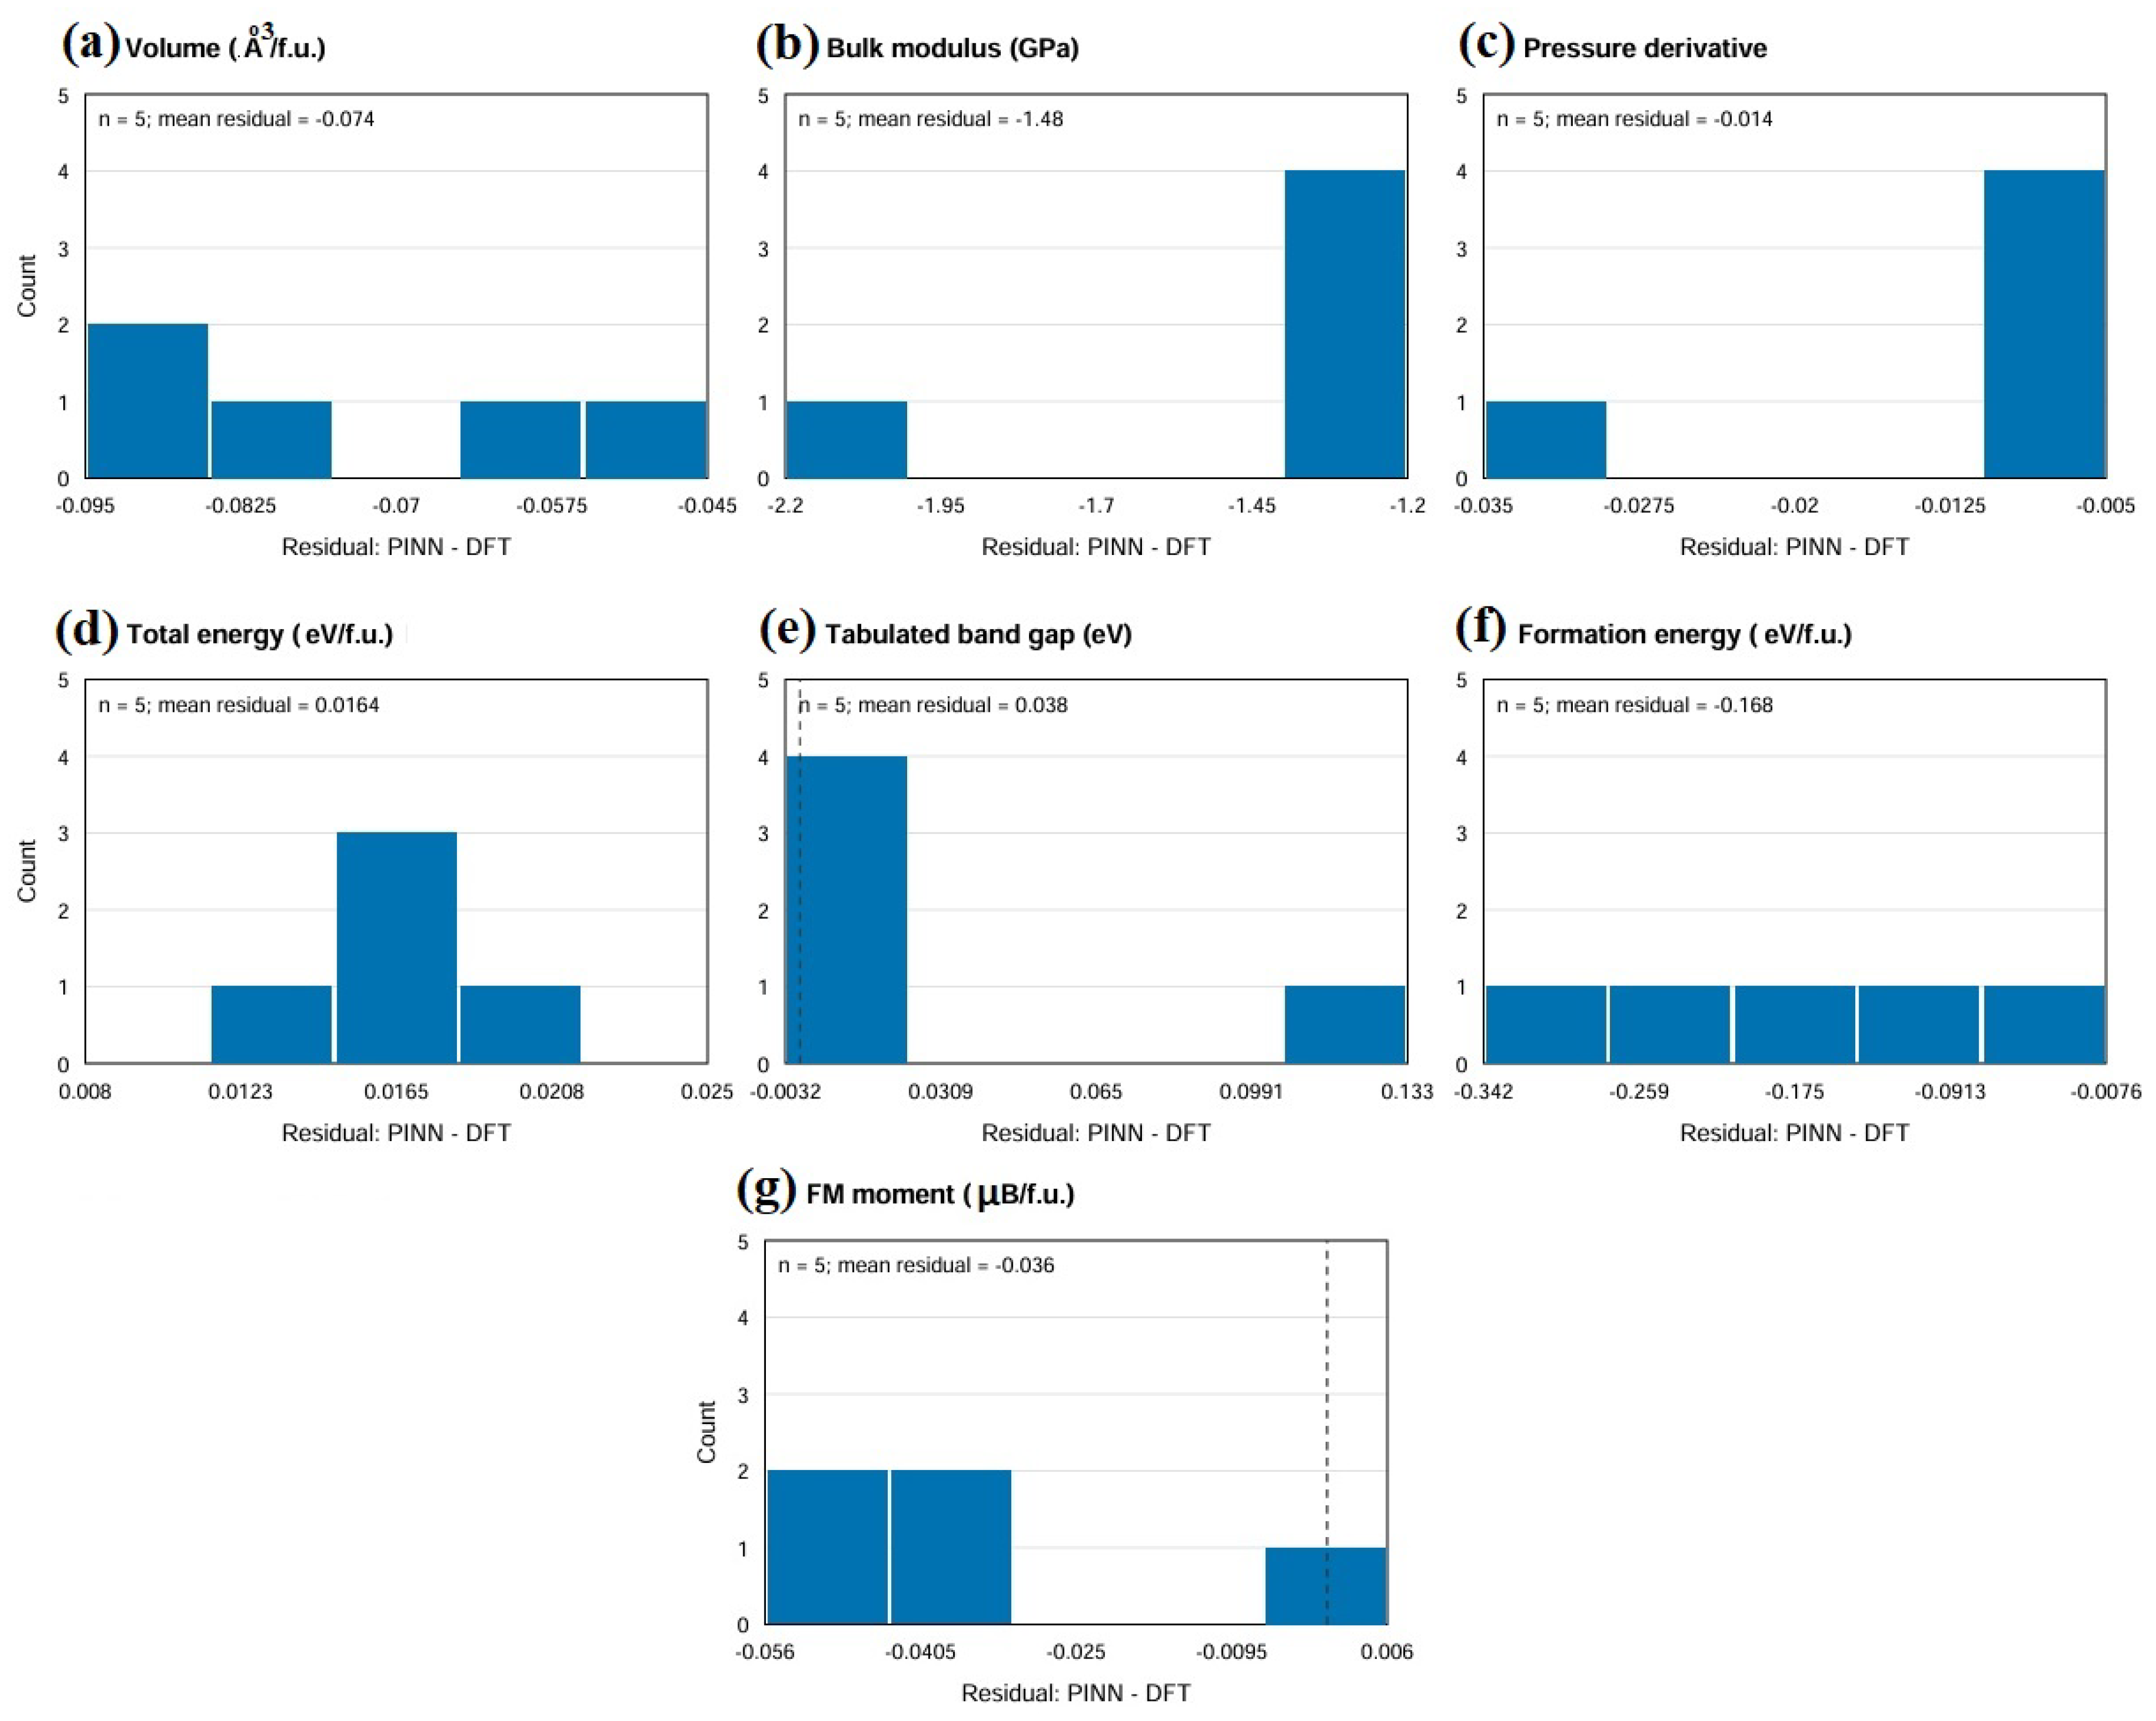
Although the parity plots indicate close agreement for several properties, the concentration-dependent residuals in Figure 9 reveal systematic deviations. Defining the residual as the PINN prediction minus the DFT reference, equilibrium volumes, bulk moduli, pressure derivatives, and nonzero magnetic moments are consistently underestimated, whereas total energies are overestimated. The largest band-gap deviation occurs for pristine TiO2, at 0.12 eV, compared with 0.01–0.02 eV for the Fe-doped compositions. The formation-energy residual becomes increasingly negative with Fe concentration, reaching −0.31 eV/f.u. at 25% Fe. Consequently, high R2 values should be interpreted alongside absolute errors and systematic bias rather than as evidence of uniformly negligible deviations.
Figure 9.
Parity plots comparing reported PINN and GGA+UTi values from Table 1, Table 2, Table 3, Table 4 and Table 5 for five compositions: (a) equilibrium volume, (b) bulk modulus, (c) its pressure derivative, (d) total energy, (e) band gap, (f) formation energy, and (g) magnetic moment. Colors indicate Fe concentration; dashed lines denote exact agreement. The plots assess reported-point agreement rather than independent−test performance.
Figure 10 presents the residual distributions, complementing the parity plots by revealing the direction and spread of the discrepancies. Each property contains only five reported composition points; therefore, these distributions are descriptive and cannot establish a statistical error model or generalization capability. Independent validation requires compositions or configurations excluded from training and model selection, together with property-specific error metrics and clearly documented DFT reference targets.
Figure 10.
Distribution of PINN residuals relative to WIEN2k FP−LAPW reference values, defined as yPINN−yWIEN2k and normalized by the range of each reference property. The vertical dashed line denotes zero residual.
The parity analysis demonstrates close agreement between PINN and the corresponding Hubbard-corrected FP-LAPW results for most of the investigated properties. Particularly strong agreement is obtained for the ferromagnetic magnetic moment R2 = 0.9994, band gap R2 = 0.9893, equilibrium volume R2 = 0.9808, and equilibrium energy R2 = 0.9761. The corresponding RMSE values are 0.0405 μB/f.u., 0.0560 eV, 0.0758 Å3/f.u., and 0.0166 eV/f.u., respectively. The equilibrium-energy error is consistent with the small PINN–DFT deviations already observed across the concentration series in the original calculations.
The bulk modulus also exhibits satisfactory correspondence R2 = 0.9213, RMSE = 1.51 GPa, showing that the PINN captures the concentration-induced lattice softening observed in the FP-LAPW calculations. The pressure derivative is less strongly correlated R2 = 0.8634, although its absolute RMSE remains only 0.016 because B′0 varies over a narrow numerical interval. This distinction illustrates why both absolute-error metrics and R2 should be reported when assessing properties with restricted dynamic ranges. Formation energy shows substantially weaker agreement under the present reference pairing R2 = 0.3029, RMSE = 0.194 eV/f.u., despite reproducing the overall concentration-dependent stabilization trend. This result indicates that formation energy requires either further PINN optimization or a clearer definition of the DFT target used during training.
Table 6 summarizes the agreement between the PINN predictions and GGA+UTi values reported in Table 1, Table 2, Table 3, Table 4 and Table 5 for Fe concentrations of 0%, 3.125%, 6.25%, 12.5%, and 25%. GGA+UTi was selected because the manuscript identifies it as the principal comparison reference for structural, energetic, and magnetic properties. Error metrics were calculated directly from the tabulated values rather than estimated from the figures. Because training and test membership are not documented, these metrics quantify reported-point agreement rather than predictive performance on unseen compositions. The quantitative comparison indicates property-dependent agreement between PINN predictions and the GGA+UTi reference values. Agreement is strongest for the tabulated band gap, equilibrium volume, total energy, and magnetic moment, while larger relative deviations occur for the bulk modulus and its pressure derivative. However, the high R2 for the magnetic moment is strongly influenced by the nonmagnetic pristine composition and should be considered alongside the errors for the doped systems. Formation-energy agreement is substantially weaker against GGA+UTi. The values in Table 1, Table 2, Table 3, Table 4 and Table 5 do not support a uniform deviation below 0.3% relative to this reference. The claim should therefore be revised, and the DFT training target for each predicted property explicitly identified. These results emphasize the importance of reporting absolute errors and systematic bias alongside R2, rather than describing all PINN predictions as uniformly accurate.
Corresponding comparisons for B0, B′0, E0, Eg, FE, and MFM can be viewed in Table 6 to limit repetition in the main text. Table 7 presents a concentration-resolved comparison of equilibrium volumes, V0, obtained from WIEN2k FP-LAPW GGA+UTi calculations and PINN predictions. The reported total-energy deviations of 0.013–0.020 eV/f.u. are consistent with the RMSE of approximately 0.0166 eV/f.u. in Table 6. These comparisons quantify agreement at the reported compositions rather than independent-test performance.
Table 7.
Comparison of WIEN2k FP-LAPW GGA+UTi reference values and PINN predictions for Fe-doped anatase TiO2.
These results support the use of PINN as a surrogate for interpolating several concentration-dependent properties, but agreement with points used during model construction alone does not establish generalization. A rigorous assessment therefore requires separation of training, validation, and independent test data. Previous physically informed neural-network studies in materials modeling have similarly used cross-validation, DFT–PINN parity analysis, residual distributions, and independent configurations outside the training/validation dataset to establish predictive performance [17,40].
3.3. Electronic Properties, DOS and Band Structure
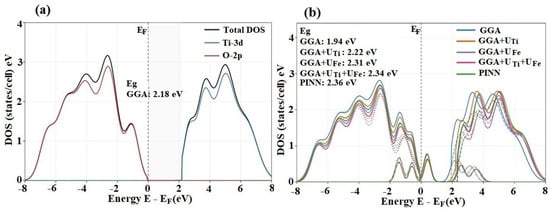
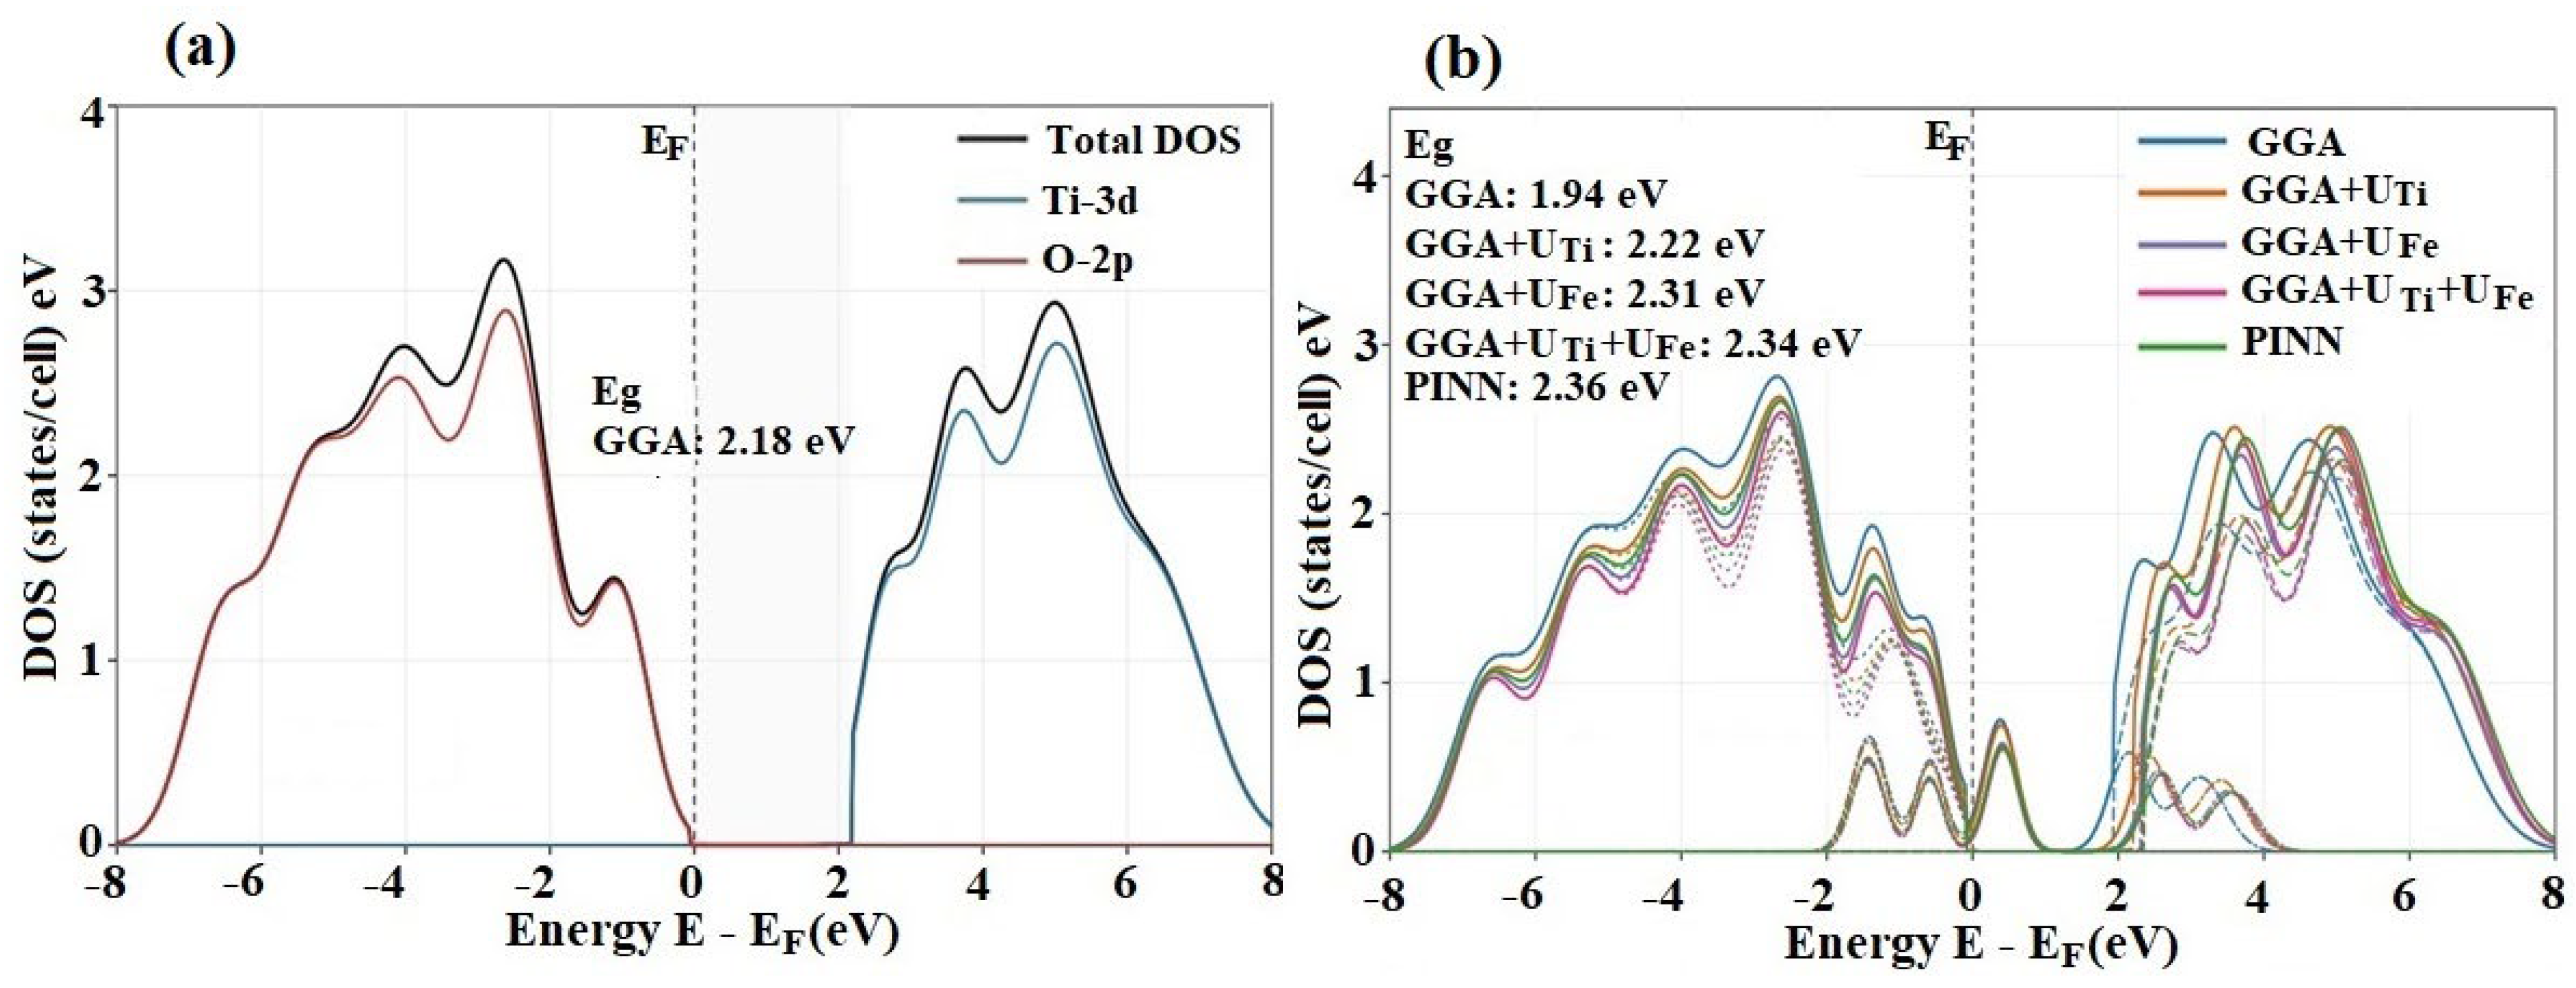
Figure 11 and Figure 12 present the density of states (DOS) of pristine and Fe-doped anatase TiO2. As shown in Figure 11, pristine anatase TiO2 exhibits the characteristic electronic structure of the anatase phase. The valence band, extending from approximately −7.5 to 0 eV, is dominated by O-2p states, with a smaller Ti-3d contribution arising from Ti-O hybridization. In contrast, the conduction-band edge is mainly composed of Ti-3d states. The total DOS vanishes at the Fermi level, confirming the semiconducting nature of pristine anatase TiO2. The GGA band gap of about 2.18 eV is smaller than the experimental value near 3.2 eV [32], reflecting the well-known band-gap underestimation of semilocal exchange-correlation functionals.
Figure 11.
Density of states (DOS) and band gaps of (a) pristine and (b) 3.125% Fe−doped anatase TiO2 obtained using GGA, GGA+UTi, GGA+UFe, GGA+UTi+UFe, and PINN, where applicable. Solid, dashed, dotted, and dash−dotted lines represent the total DOS, Ti−3d, O−2p, and Fe−3d contributions, respectively.
Figure 12.
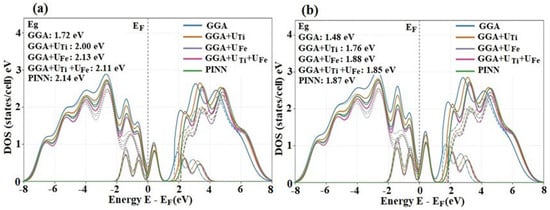
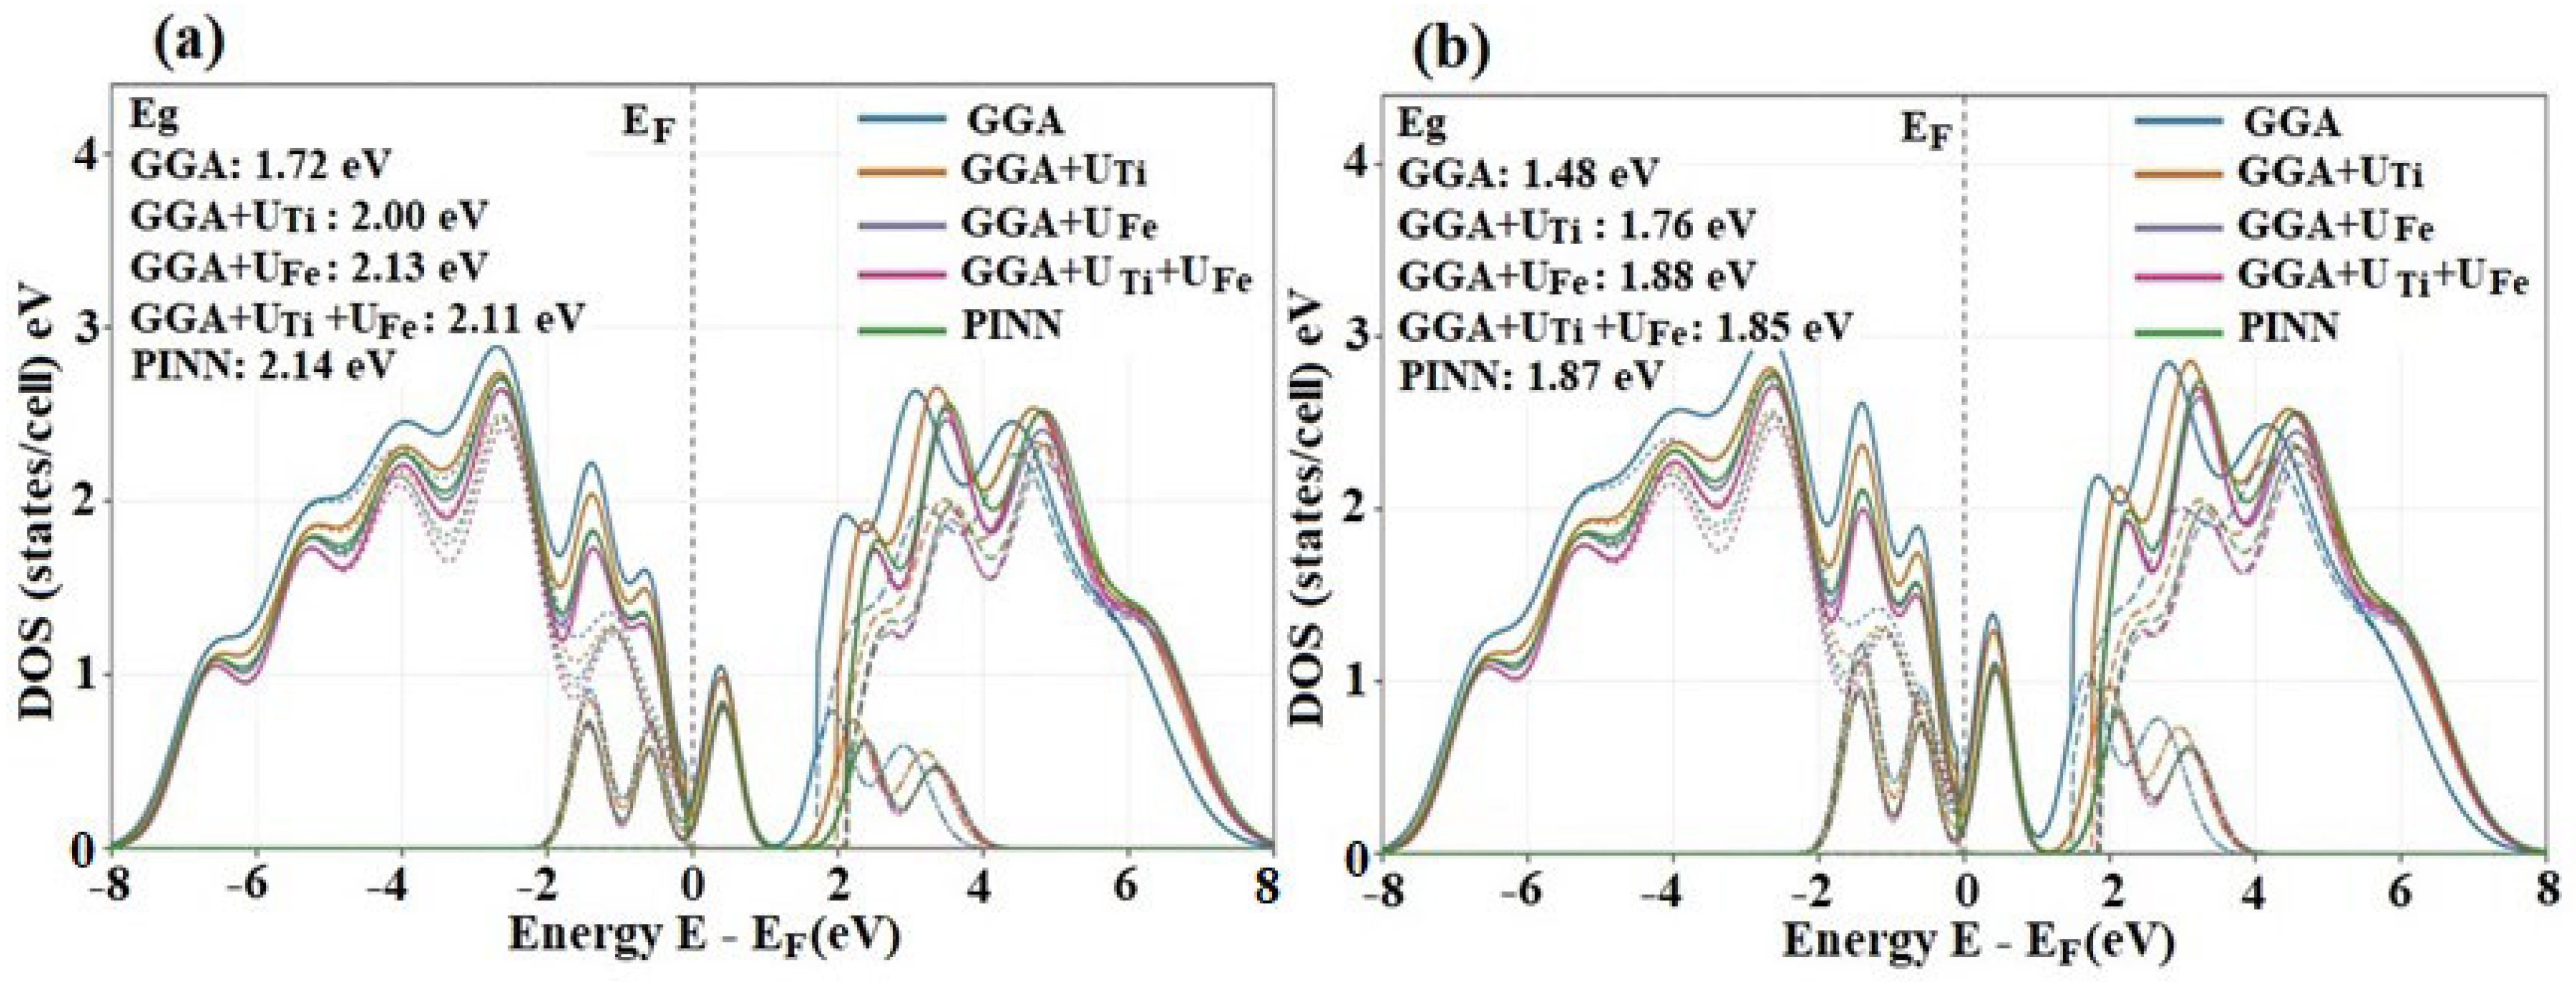
Density of states (DOS) and band gaps of (a) 6.25% and (b) 12.5% Fe−doped anatase TiO2 obtained using GGA, GGA+UTi, GGA+UFe, GGA+UTi+UFe, and PINN. Solid, dashed, dotted, and dash−dotted lines represent the total DOS, Ti−3d, O−2p, and Fe−3d contributions, respectively.
Figure 12 presents the DOS of 6.25% and 12.5% Fe-doped anatase TiO2. For 6.25% Fe substitution, the Fe-3d impurity contribution near the Fermi level becomes stronger than in the more dilute Fe-doped case, indicating enhanced dopant-induced electronic modification. The valence-band region remains dominated by O-2p states, whereas the conduction-band edge is mainly composed of Ti-3d states with clear Fe-3d hybridization. Within GGA, the narrowest band gap of approximately 1.72 eV is obtained. The inclusion of Hubbard corrections increases the separation between occupied and unoccupied states, giving band gaps of about 2.00, 2.13, and 2.11 eV for GGA+UTi, GGA+UFe, and GGA+UTi+UFe, respectively. The PINN prediction closely follows the correlated DFT trend and gives an estimated band gap of approximately 2.14 eV. For 12.5% Fe substitution, the Fe-3d impurity contribution near the Fermi level becomes more pronounced, accompanied by stronger Fe-3d/Ti-3d hybridization around the conduction-band edge. The valence band is still mainly governed by O-2p states, while the conduction-band edge exhibits increased Fe-3d character. The GGA calculation yields the smallest band gap, approximately 1.48 eV, whereas GGA+UTi, GGA+UFe, and GGA+UTi+UFe increase the gap to about 1.76, 1.88, and 1.85 eV, respectively. The PINN-estimated value of about 1.87 eV agrees closely with the correlated DFT results [29].
Overall, the increasing Fe-3d contribution near the Fermi level confirms progressive impurity-band formation with increasing Fe concentration. This behavior explains the continued band-gap narrowing relative to pristine anatase TiO2 and supports the expected enhancement of visible-light absorption. The Ti-site Hubbard correction shifts Ti-derived conduction states upward, while the Fe-site correction localizes and separates Fe-derived impurity features. The combined UTi+UFe treatment provides a more correlated description of the localized d states, and the close agreement of PINN with the GGA+U trends supports its use as an efficient surrogate for interpolating DOS behavior in Fe-doped anatase TiO2.
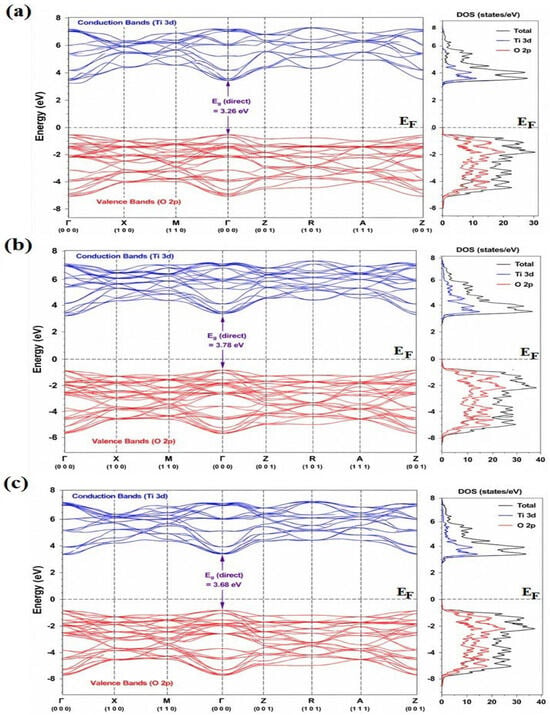
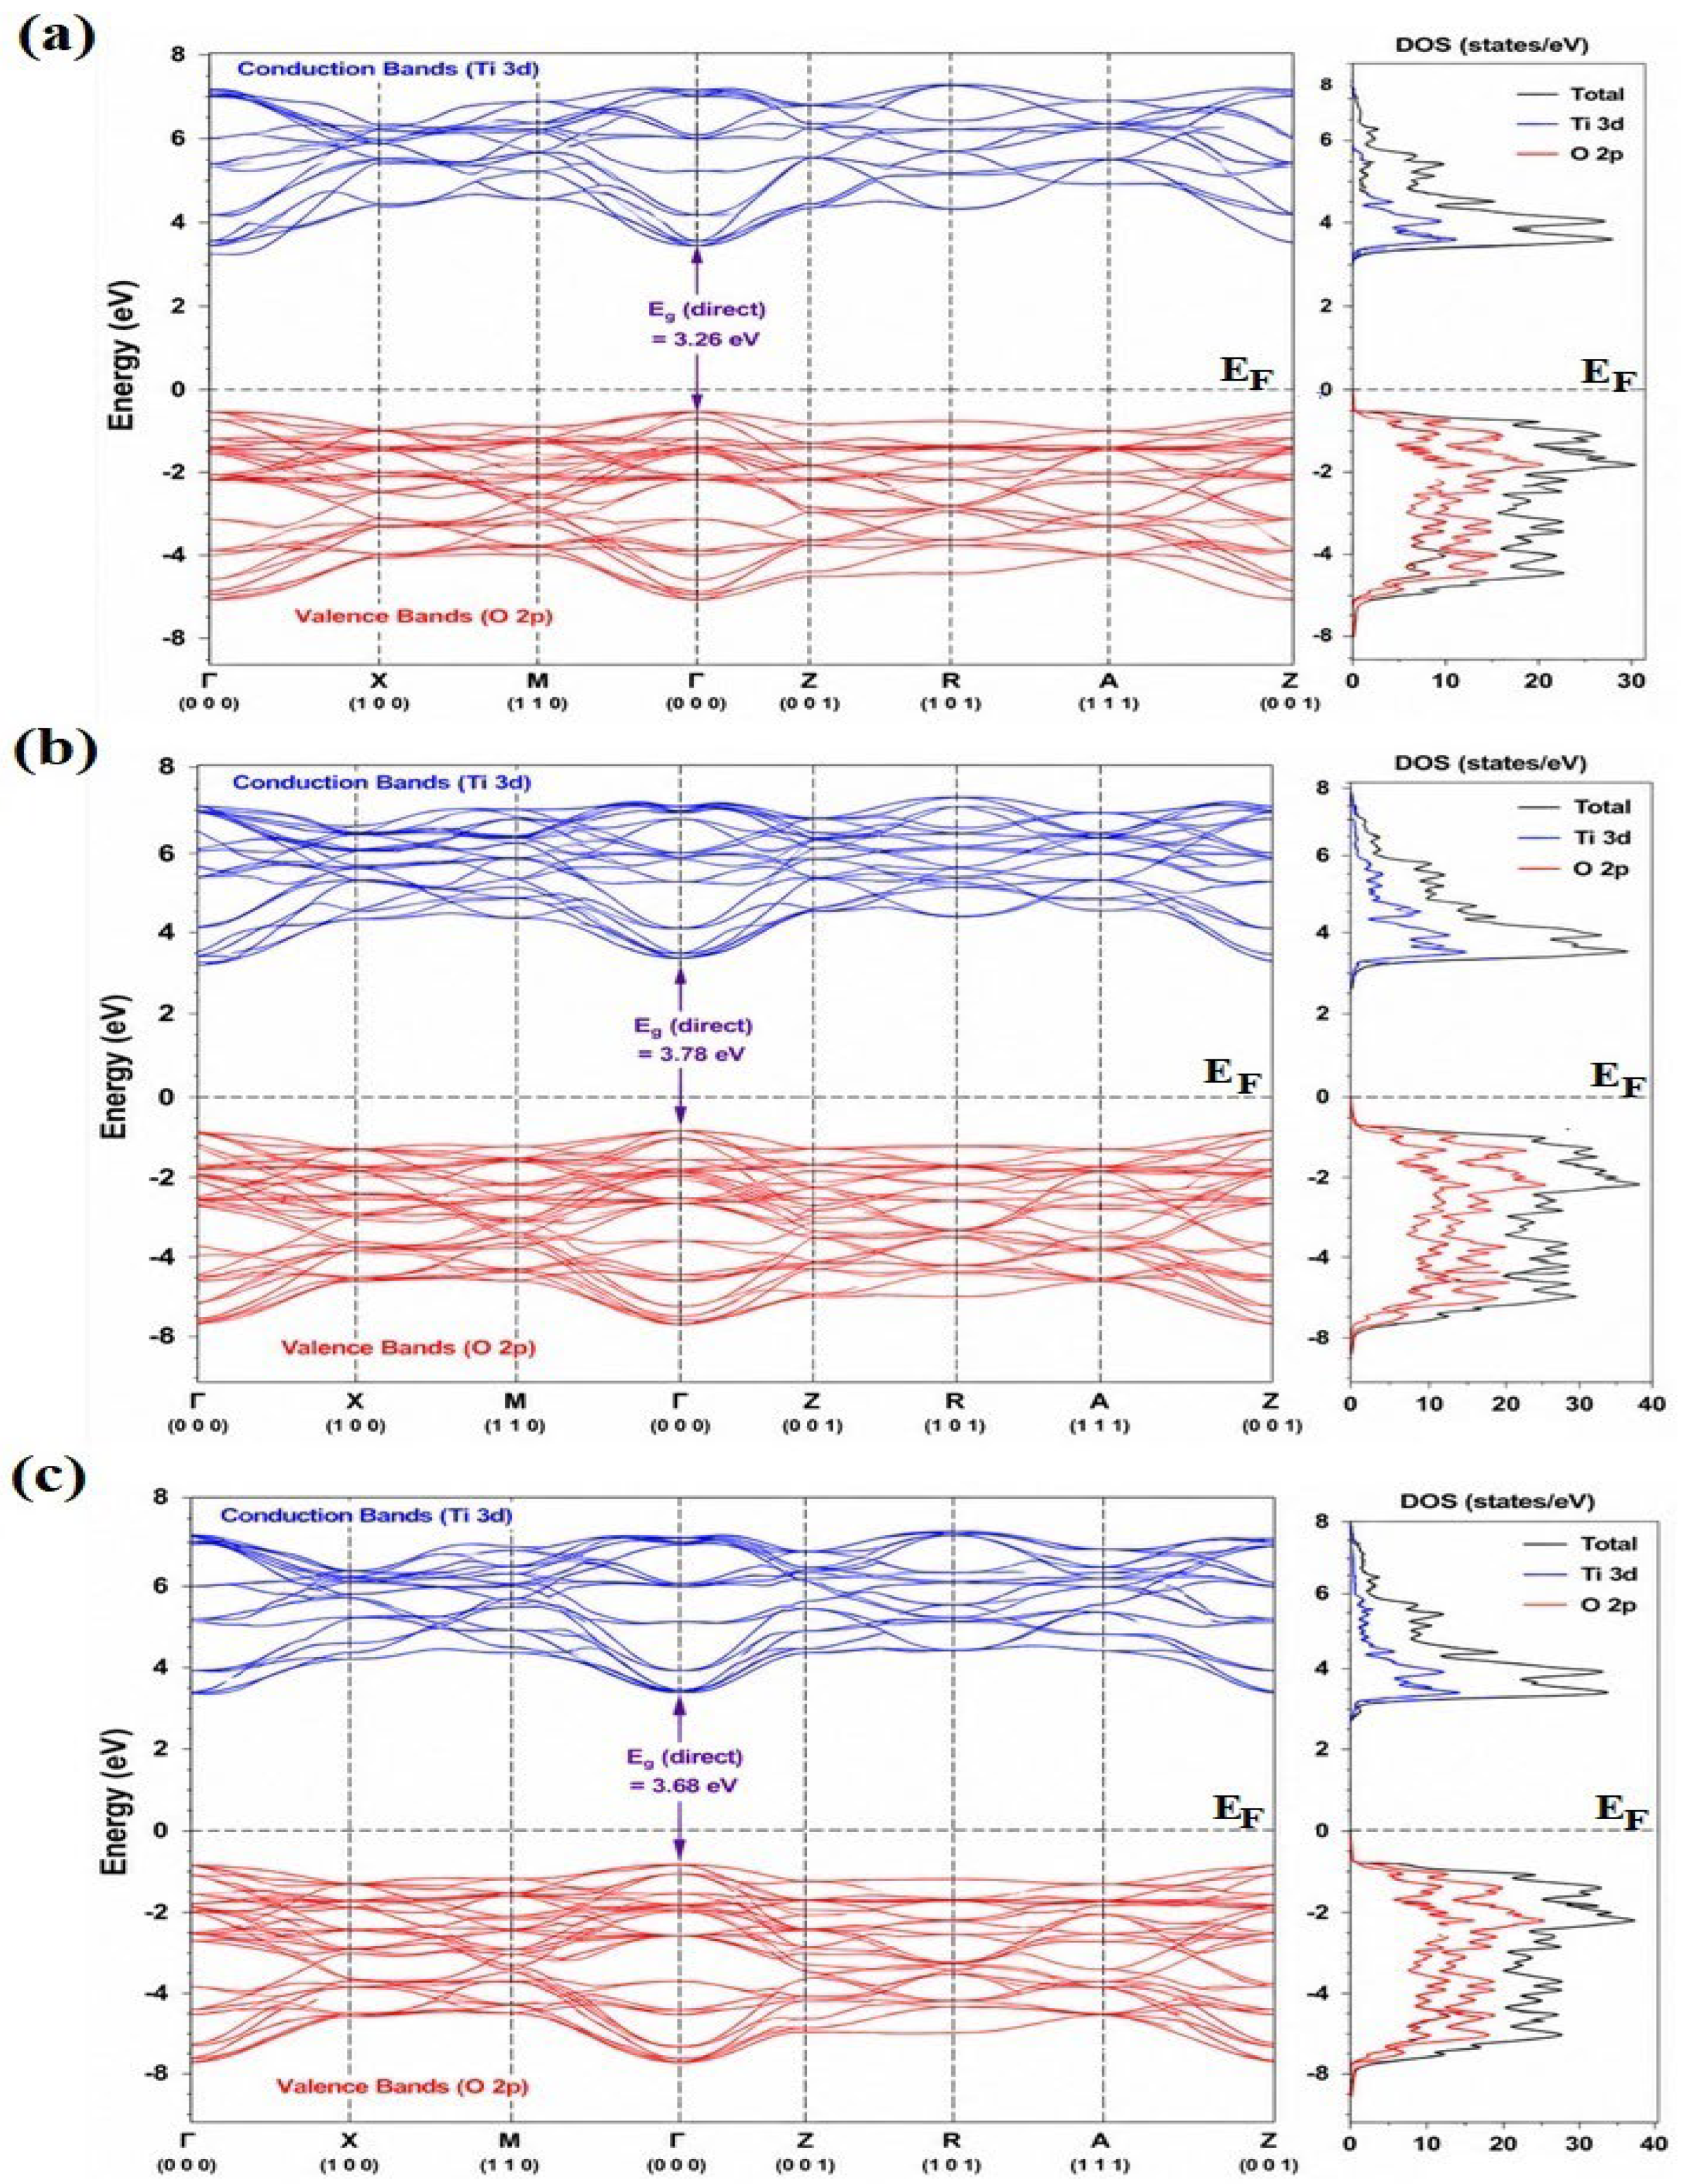
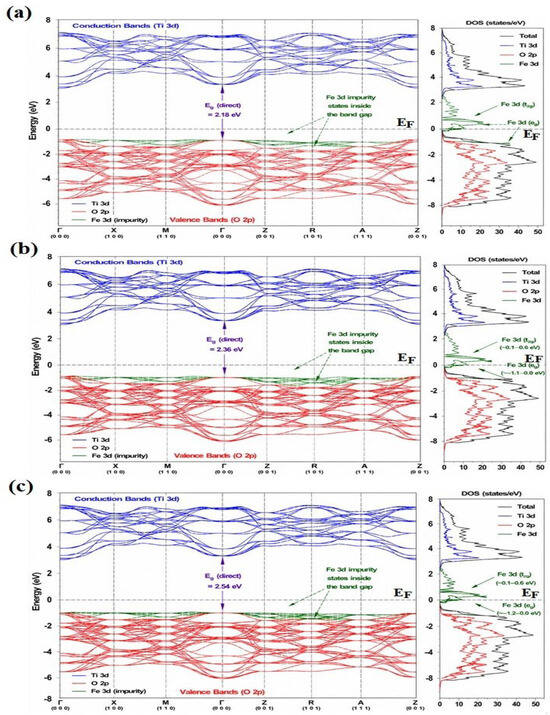
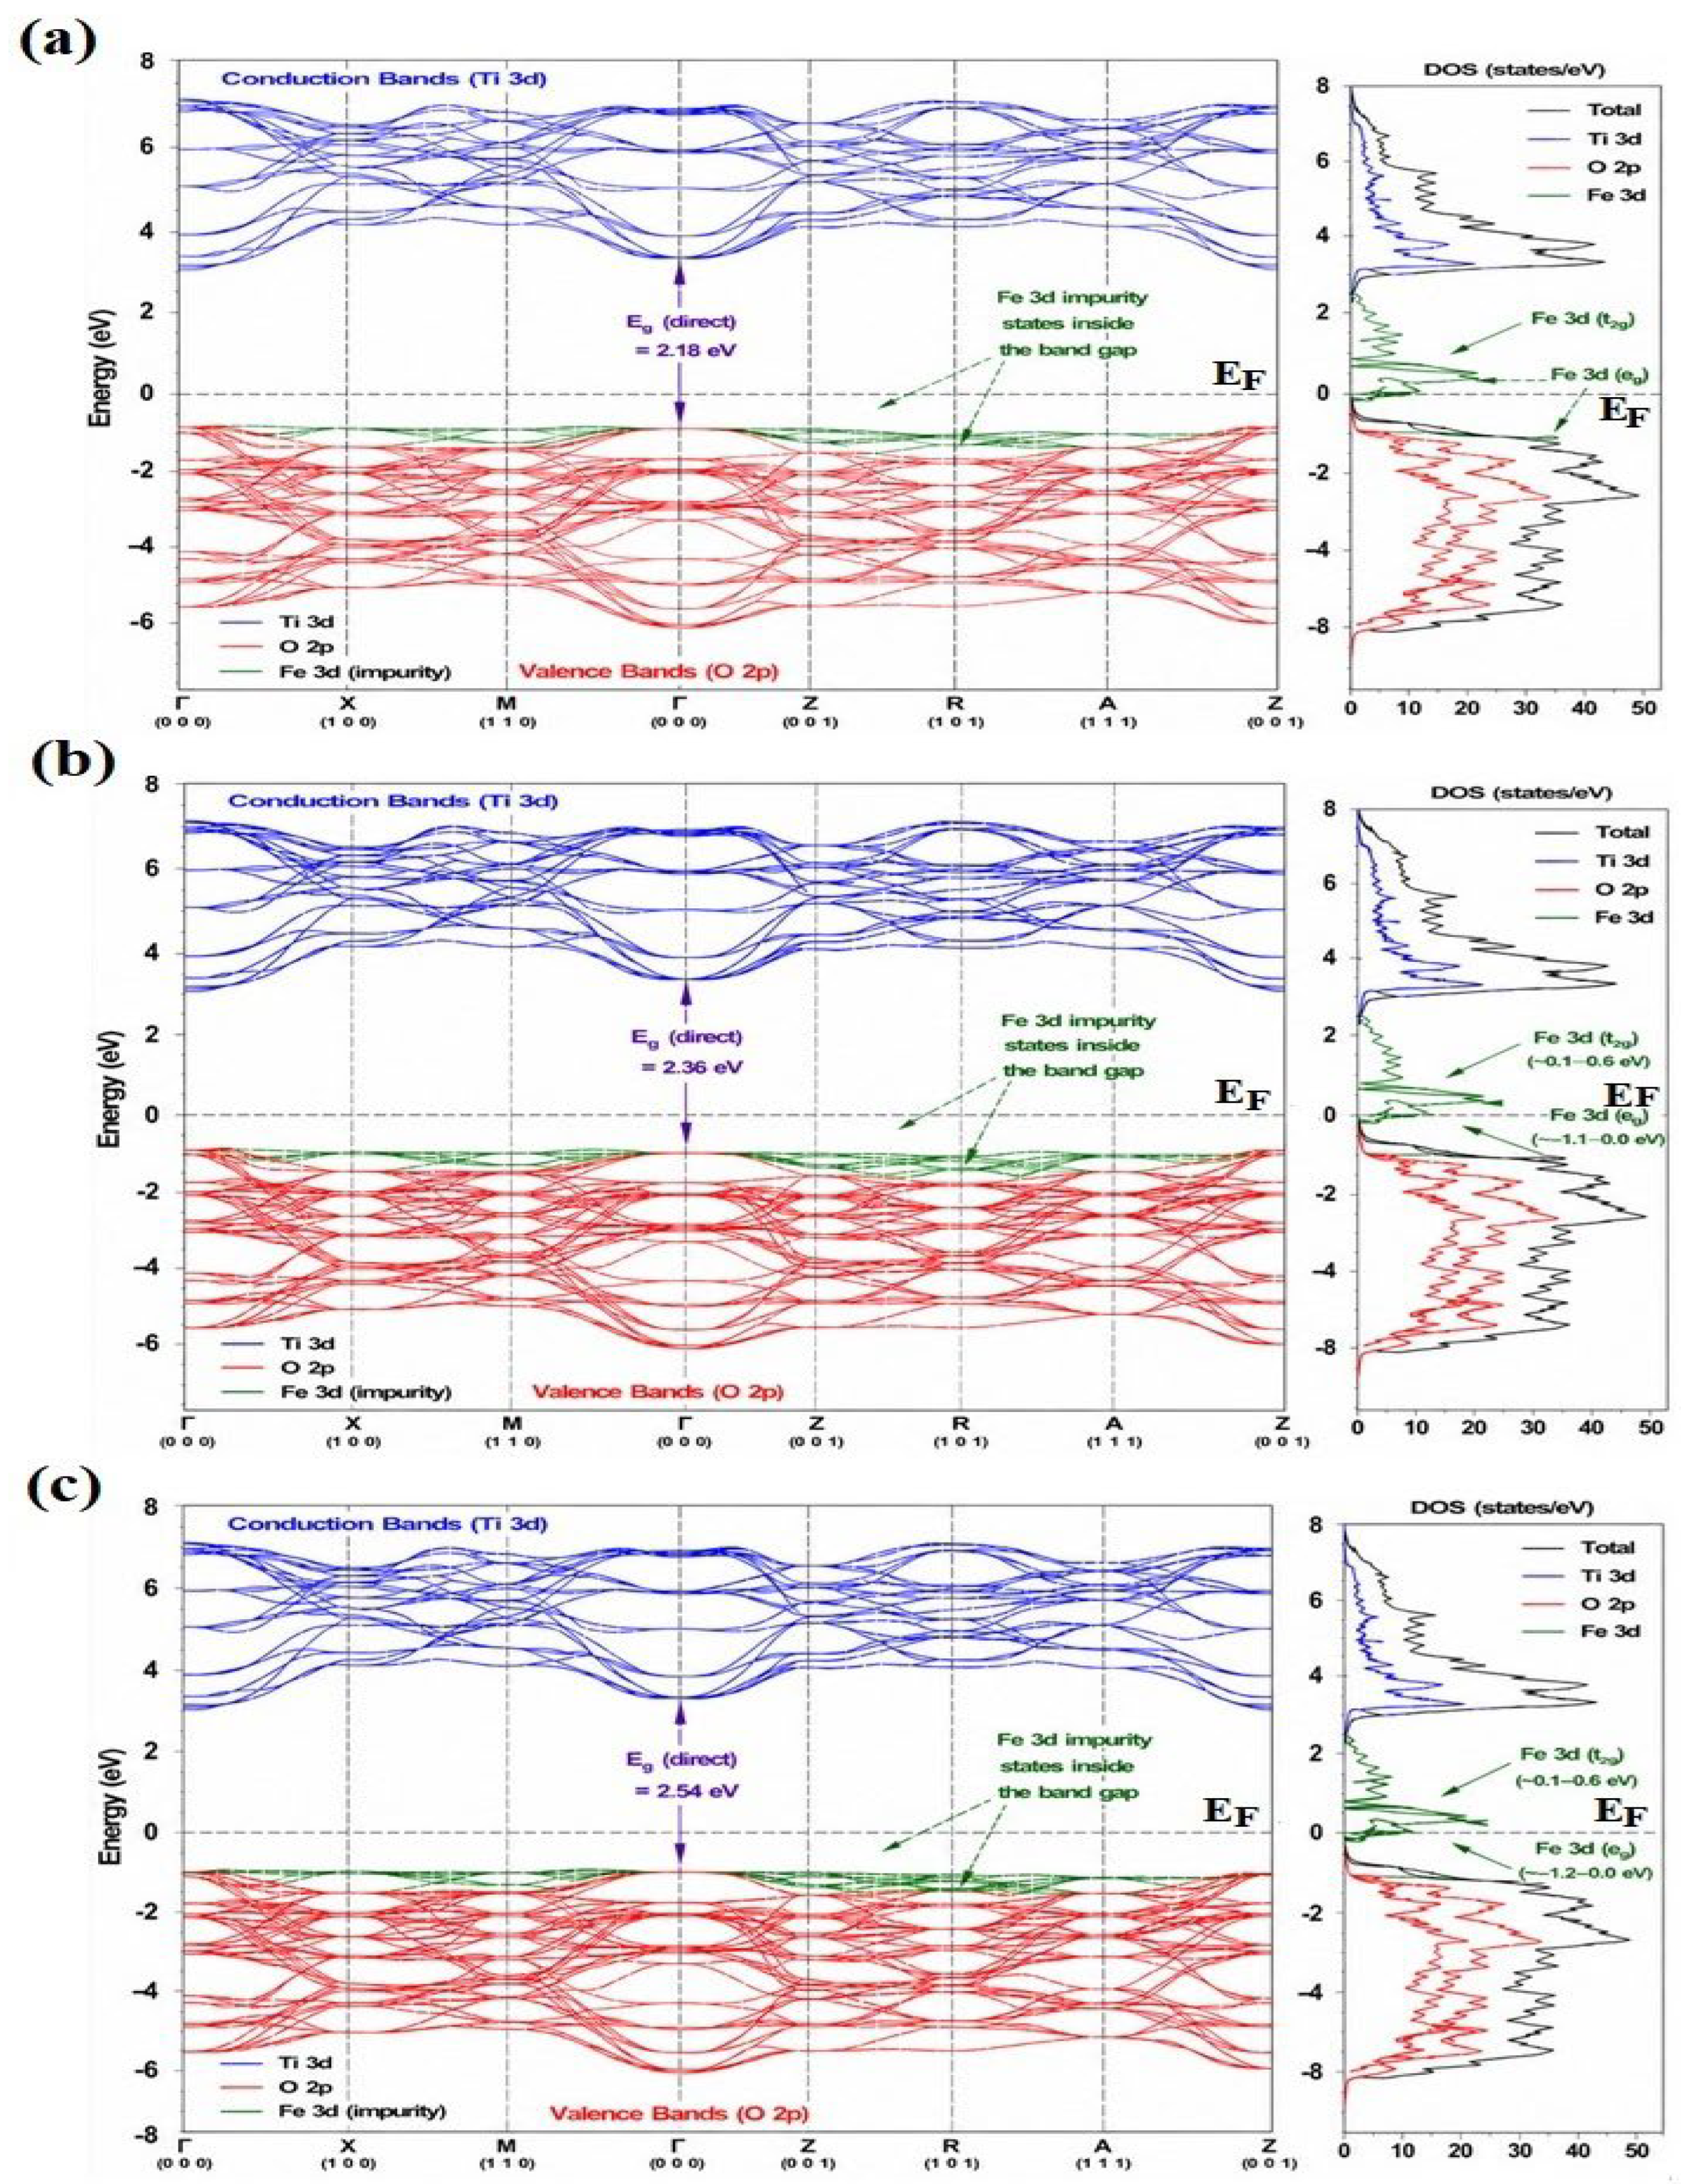
Figure 13, Figure 14 and Figure 15 present the electronic band structures and density of states (DOS) of pristine and Fe-doped anatase TiO2 along the Γ-X-M-Γ-Z-R-A-Z high-symmetry path. As shown in Figure 13, pristine anatase TiO2 exhibits clear semiconducting behavior, with no bands crossing the Fermi level and a vanishing DOS at EF. The valence-band maximum is dominated mainly by O-2p states, whereas the conduction-band minimum is primarily composed of Ti-3d states, reflecting the mixed ionic-covalent character of Ti-O bonding. The GGA calculation gives a direct Γ-point band gap of 3.26 eV. Applying the GGA+UTi correction shifts the Ti-3d conduction states upward and increases the gap to 3.78 eV. The PINN model predicts a direct gap of 3.68 eV and reproduces the main DFT band-structure and DOS features, in agreement with previous studies [41].
Figure 13.
Band structures and density of states (DOS) of pristine anatase TiO2 obtained using (a) GGA, (b) GGA+UTi (UTi = 4.5 eV, JTi = 0.8 eV), and (c) PINN. Direct Γ−point gaps are 3.26, 3.78, and 3.68 eV, respectively. The valence and conduction bands are predominantly O−2p and Ti−3d in character, respectively.
Figure 14.
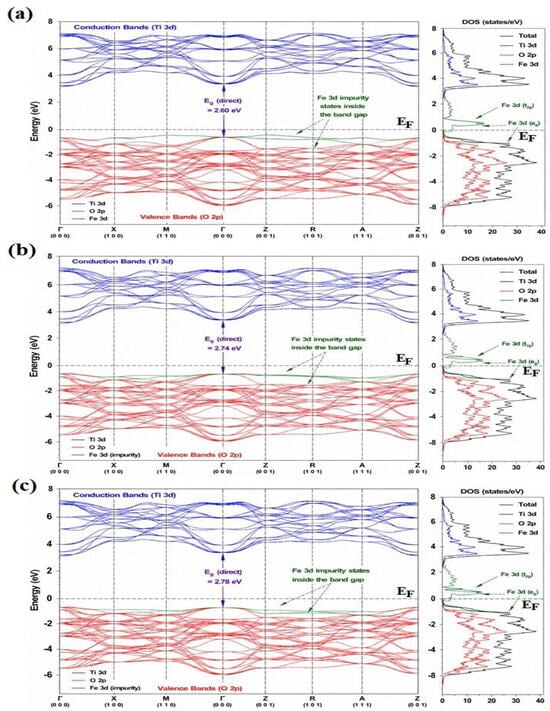
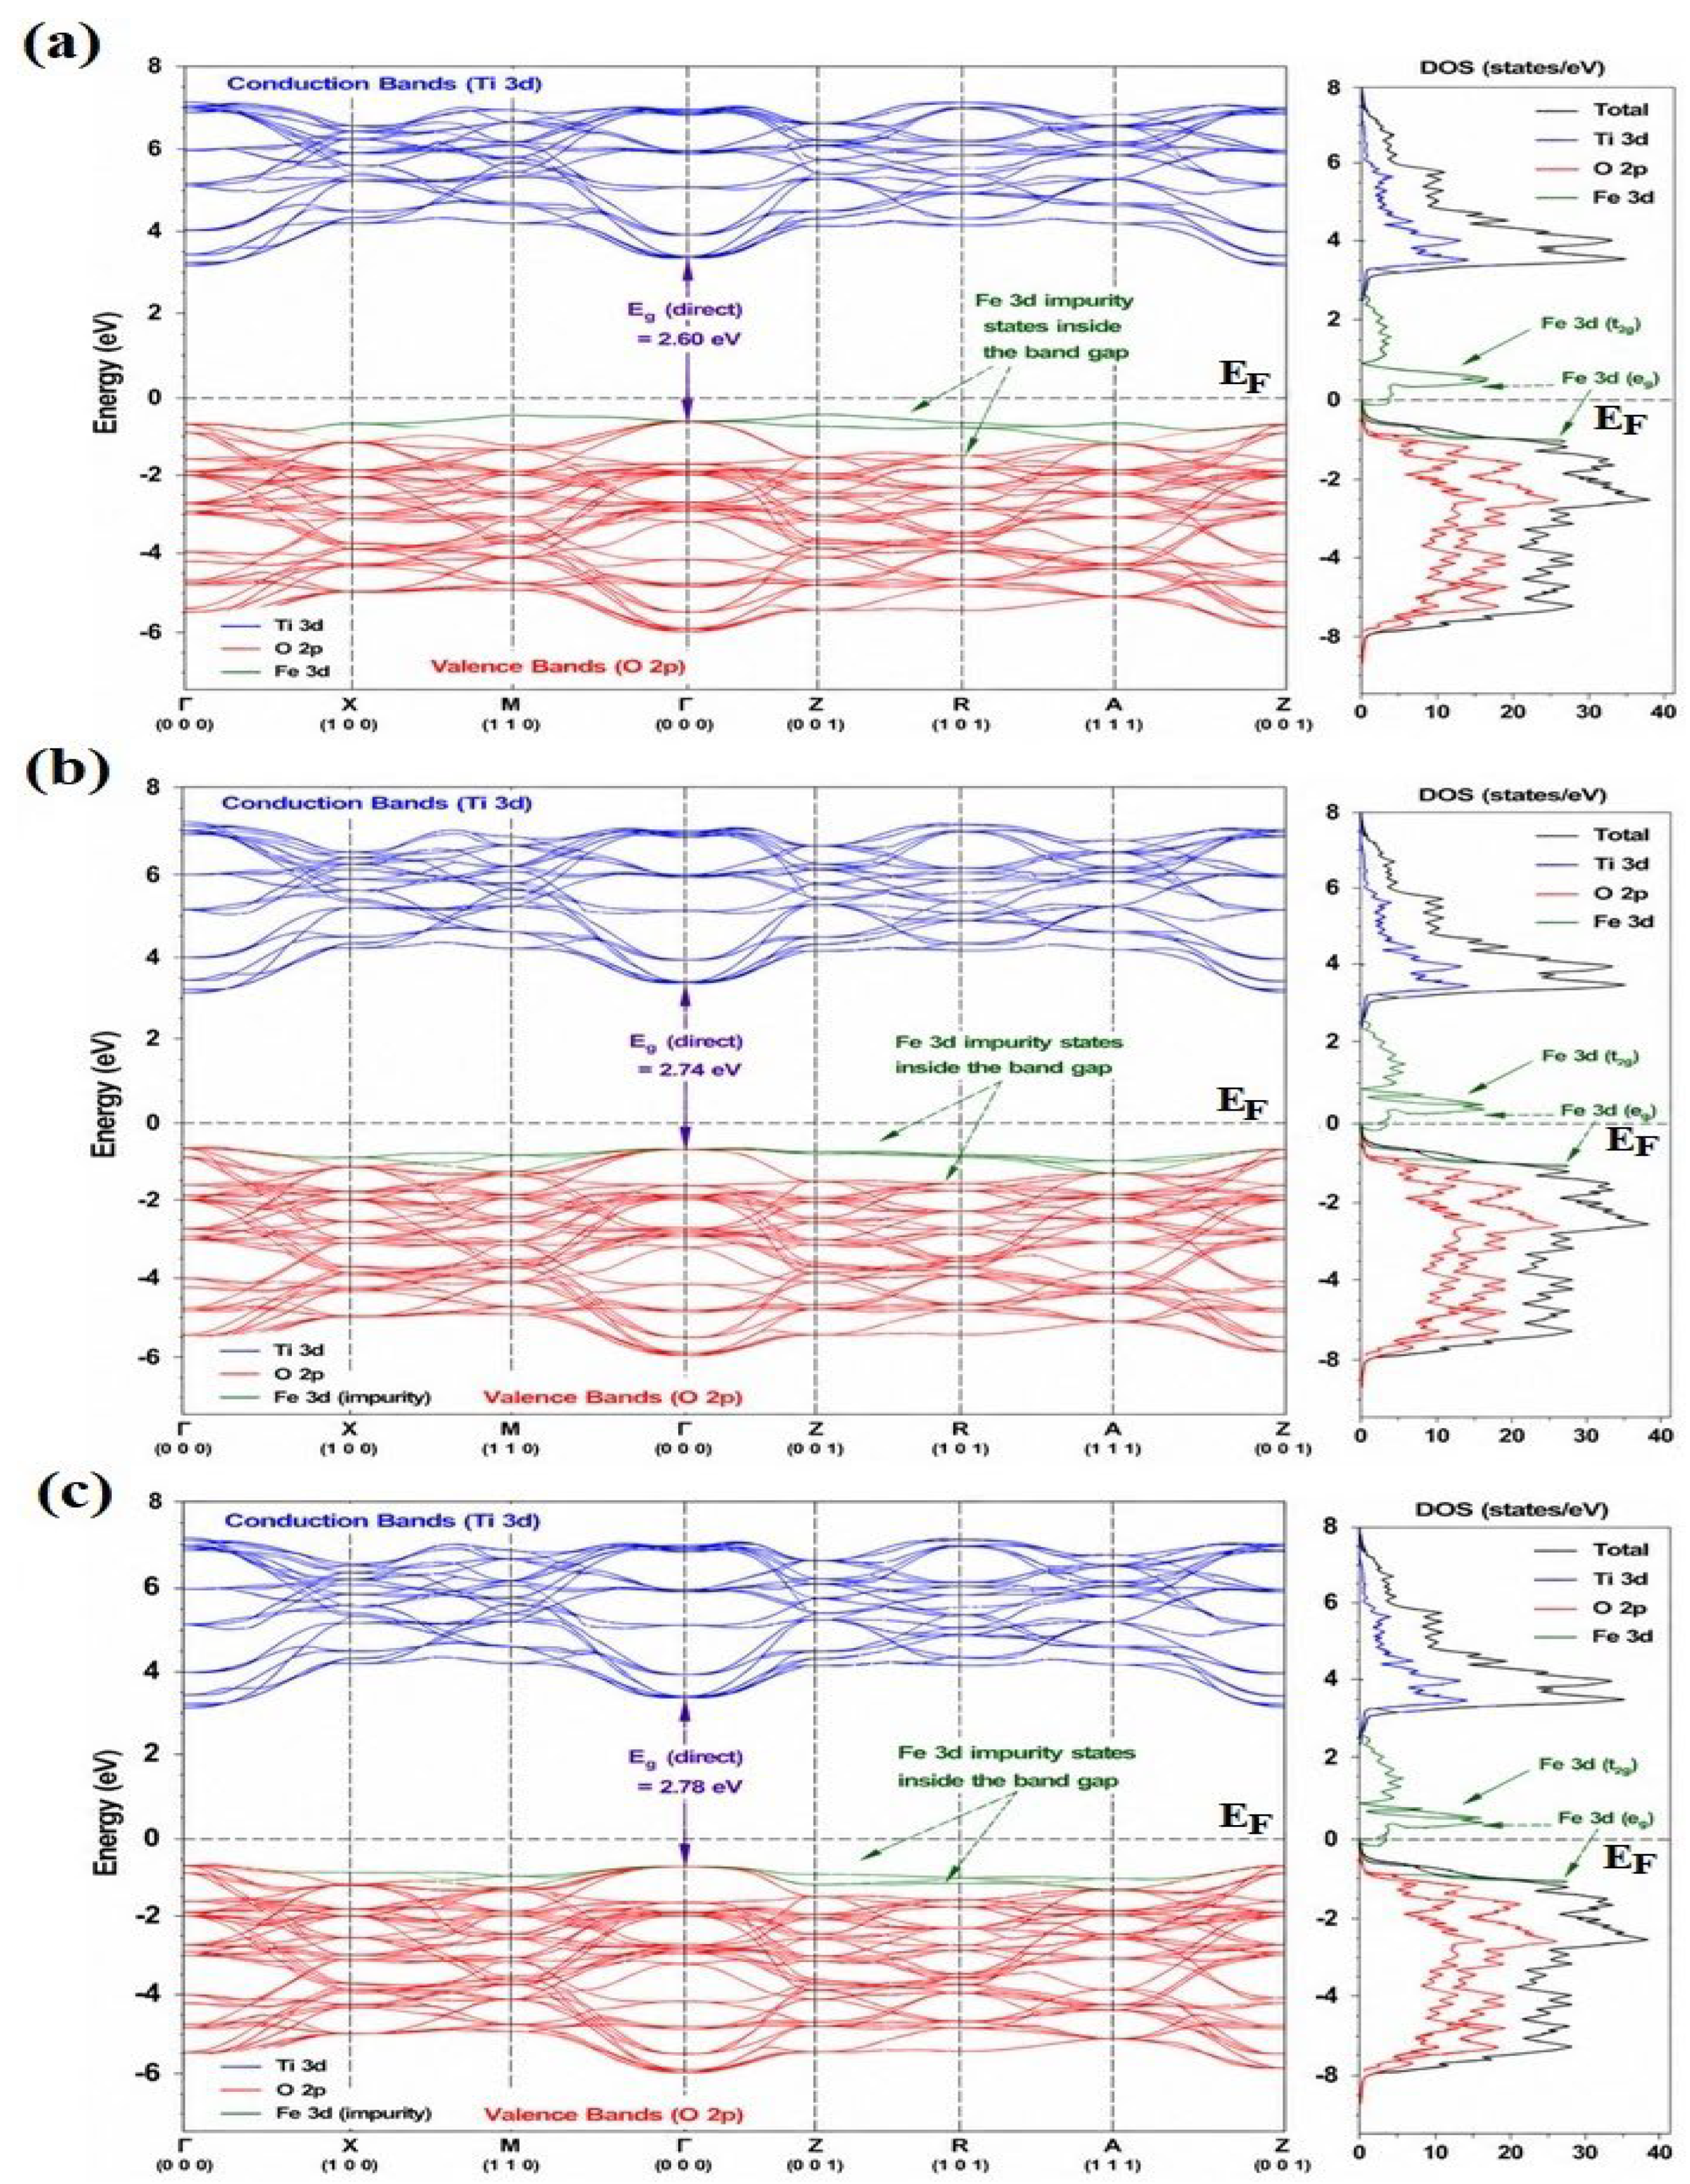
Band structures and density of states (DOS) of 6.25% Fe−doped anatase TiO2 obtained using (a) GGA, (b) GGA+UFe (UFe = 4.5 eV, JFe = 0.9 eV), and (c) PINN. Direct Γ−point gaps are 2.60, 2.74, and 2.78 eV, respectively. The valence bands are predominantly O−2p, while the conduction bands are mainly Ti−3d with Fe−3d contributions. Fe−3d impurity states occur within the gap.
Figure 15.
Band structures and density of states (DOS) of 25% Fe−doped anatase TiO2 obtained using (a) GGA+UTi, (b) GGA+UFe, and (c) GGA+UTi+UFe, with direct Γ−point gaps of 2.18, 2.36, and 2.54 eV, respectively. Hubbard parameters are UTi = UFe = 4.5 eV, JTi = 0.8 eV, and JFe = 0.9 eV, where applicable. Valence and conduction bands are predominantly O−2p and Ti−3d, respectively, with Fe−3d contributions and in−gap impurity states.
Fe substitution introduces Fe-3d impurity states within the band gap, reducing the gap relative to pristine anatase TiO2 and enhancing visible-light activity. At 6.25% Fe, Figure 14 shows direct band gaps of 2.60, 2.74, and 2.78 eV for GGA, GGA+UFe, and PINN, respectively [42]. For 25% Fe, Figure 15 shows that GGA+UTi, GGA+UFe, and GGA+UTi+UFe yield direct gaps of 2.18, 2.36, and 2.54 eV, respectively. The Fe-3d states split into t2g and eg components under the octahedral crystal field, forming donor-like impurity levels near the band edges. These impurity states narrow the effective band gap, promote charge separation, and support n-type ferromagnetic semiconducting behavior. Among the correlated treatments, the dual GGA+UTi+UFe approach provides the most physically consistent description of localized Ti- and Fe-derived d states. Meanwhile, PINN successfully reproduces the main DFT trends at reduced computational cost, supporting its use as a surrogate model for Fe-doped anatase TiO2 [43,44,45].
3.4. Optical Properties
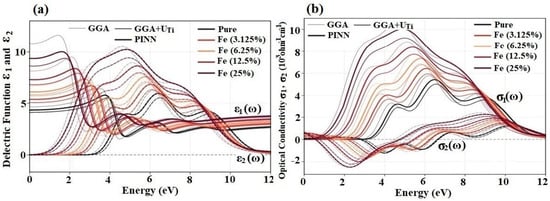
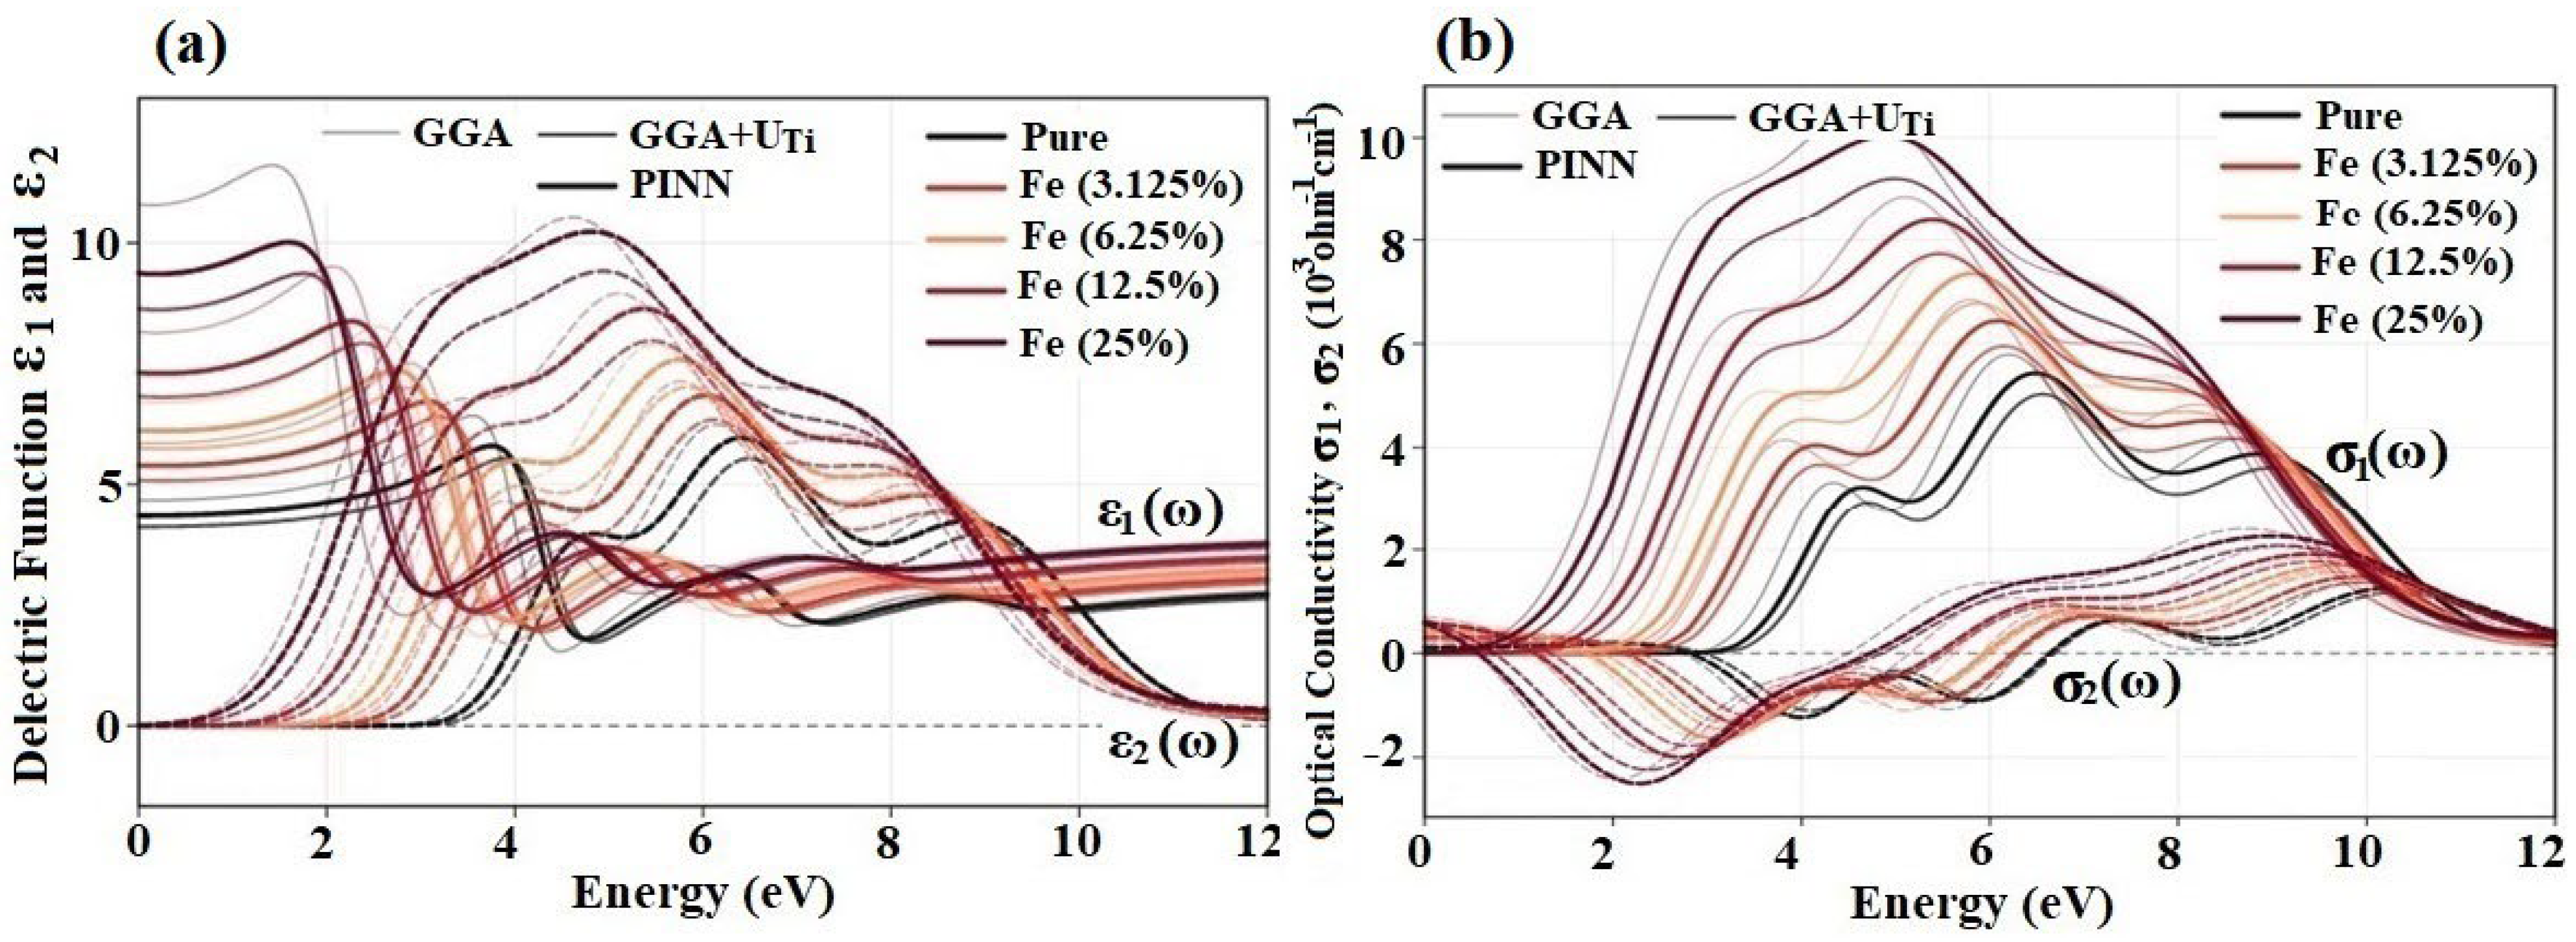
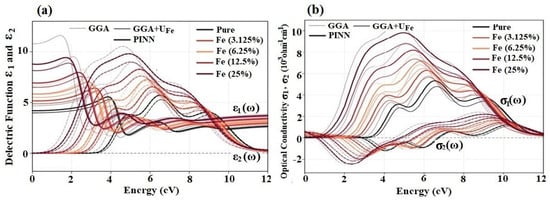
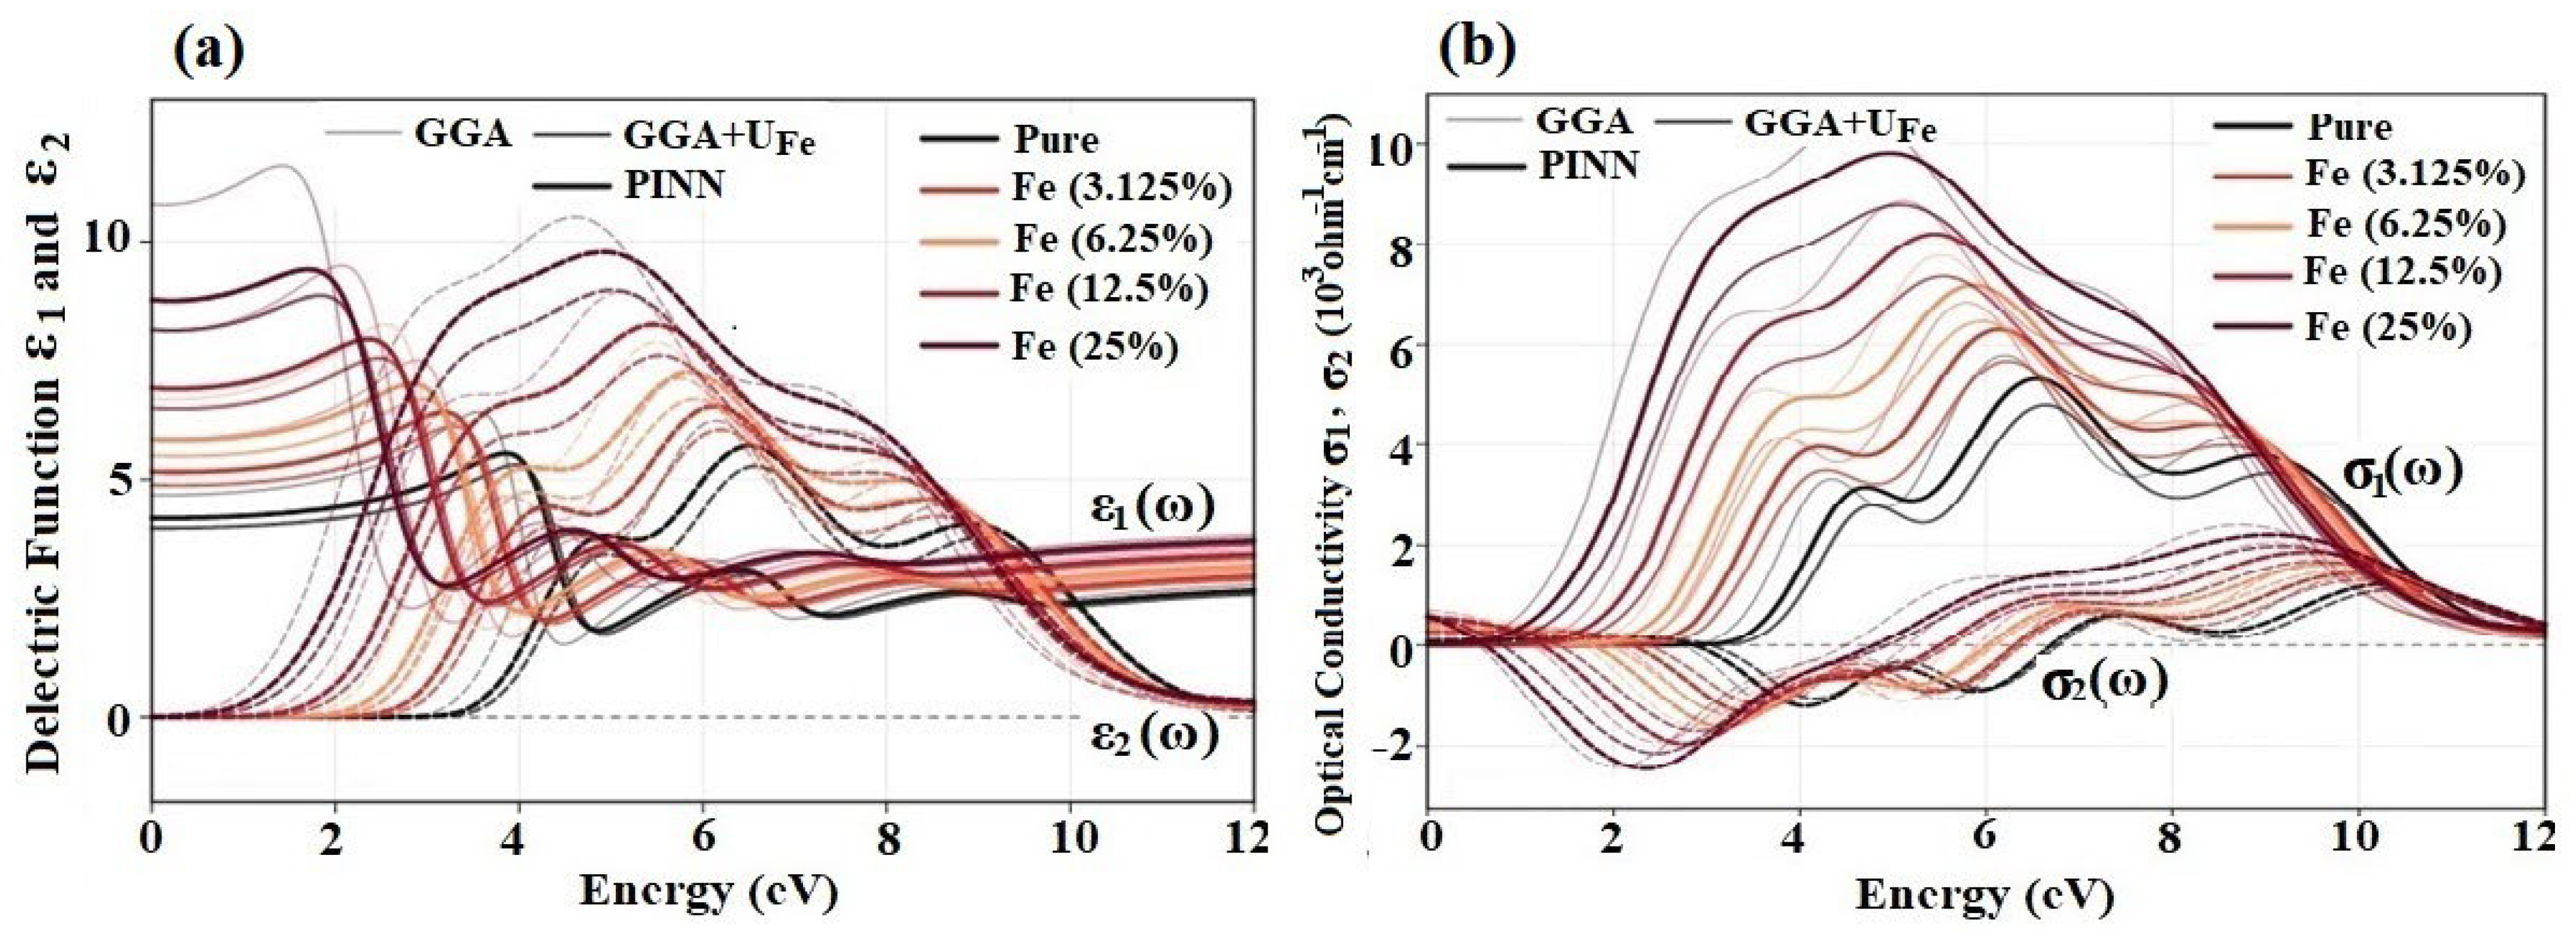
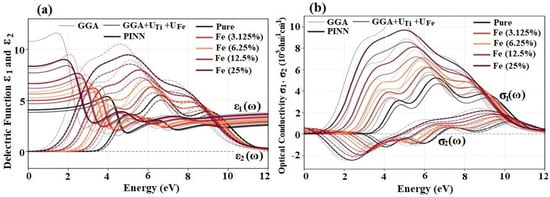
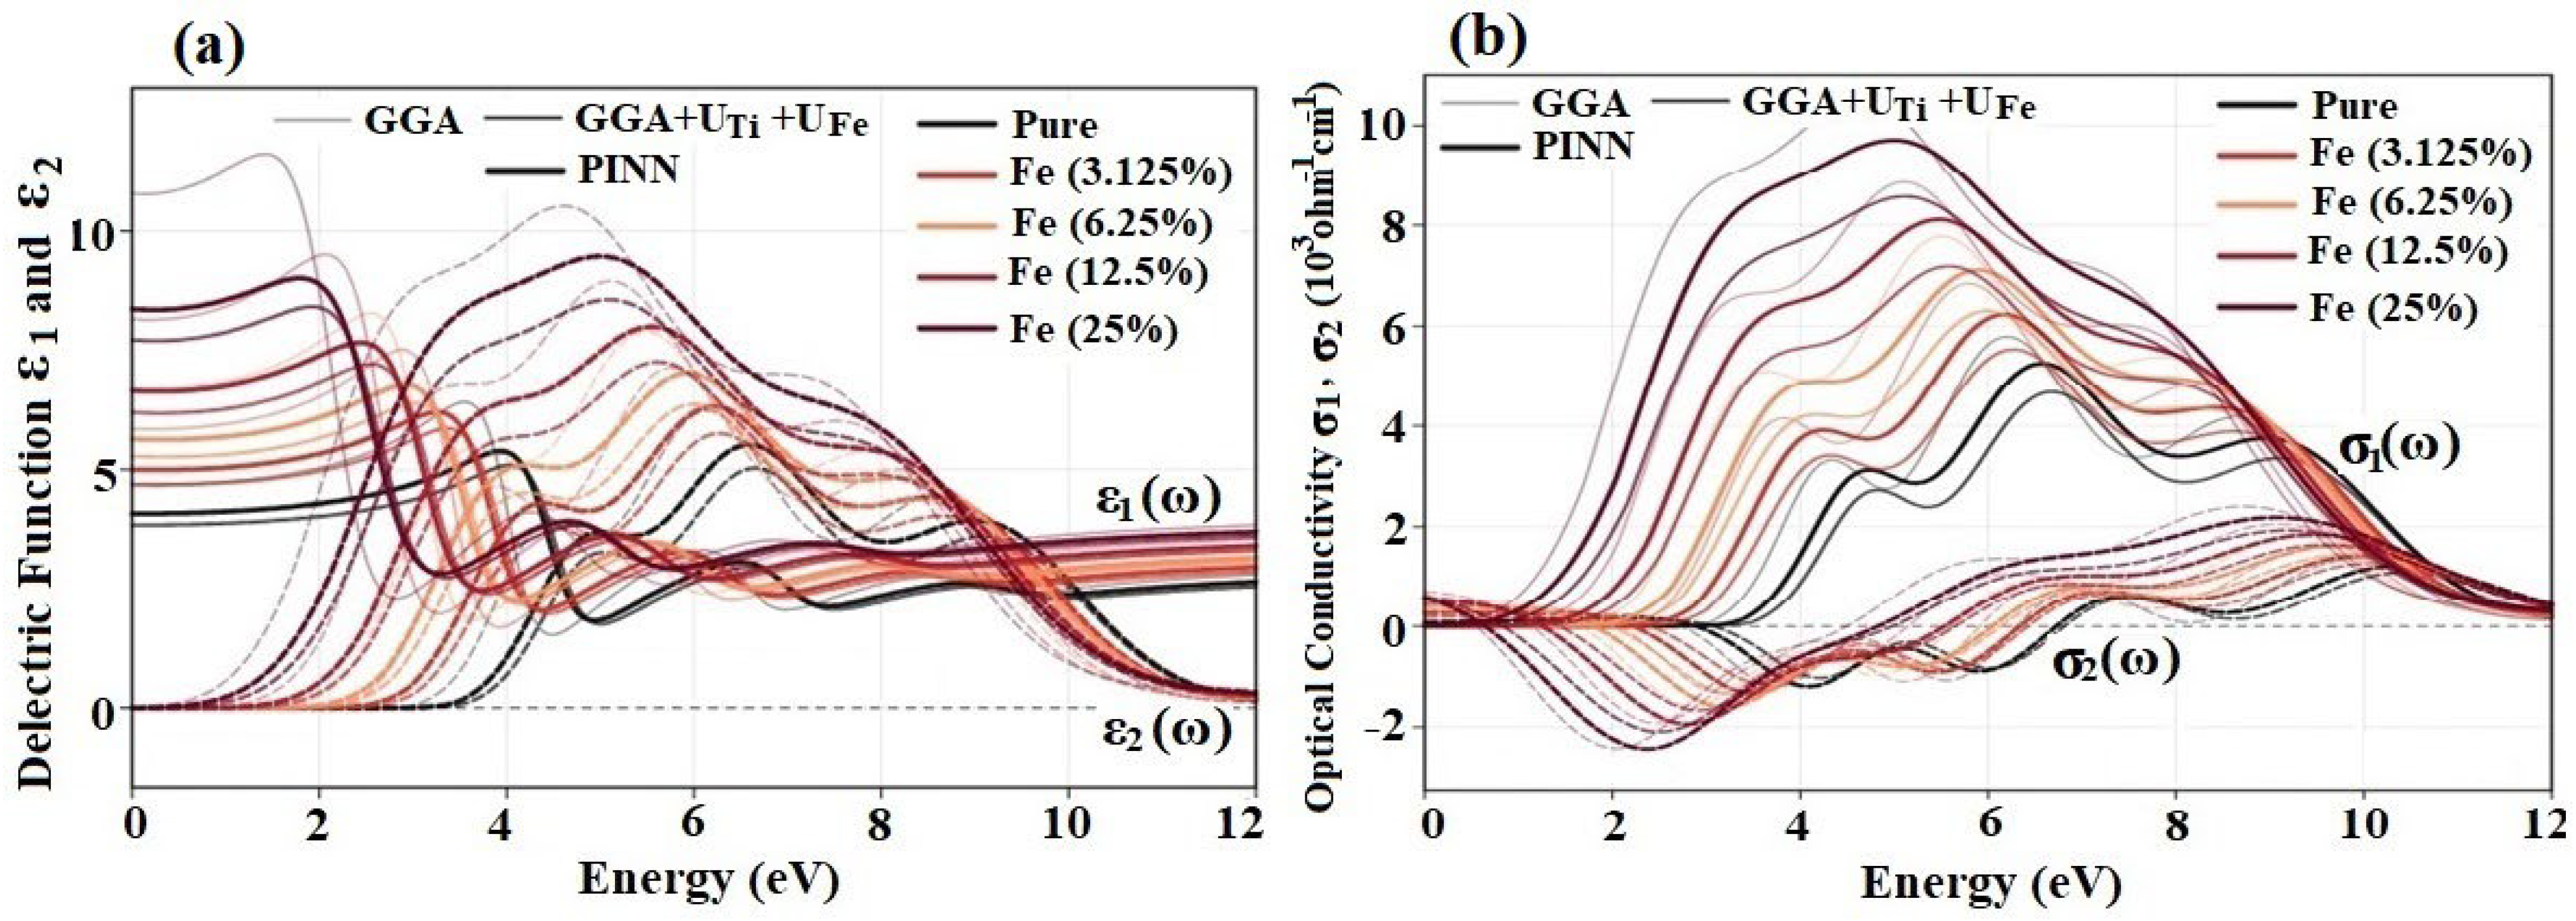
Figure 16, Figure 17 and Figure 18 present the dielectric response and optical conductivity of pristine and Fe-doped anatase TiO2. Standard GGA produces stronger low-energy optical features and red-shifted spectra, especially at higher Fe concentrations. This behavior is mainly associated with the well-known band-gap underestimation of GGA and the excessive delocalization of Ti- and Fe-derived d states. Introducing Hubbard corrections shifts the main dielectric and optical-conductivity features toward higher photon energies and reduces the artificial low-energy response. As shown in Figure 16, the Ti-site Hubbard correction primarily localizes the host Ti-3d conduction states. Figure 17 shows that the Fe-site correction localizes Fe-related impurity states, while Figure 18 demonstrates that the combined UTi+UFe treatment provides the most correlated description of the electronic and optical response.
Figure 16.
(a) Dielectric function, ε1(ω) and ε2(ω), and (b) optical conductivity, σ1(ω) and σ2(ω), of pristine and Fe-doped anatase TiO2 (3.125–25% Fe), comparing GGA, GGA+UTi (UTi = 4.5 eV, JTi = 0.8 eV), and PINN. Solid and dashed curves represent the real and imaginary components, respectively.
Figure 17.
(a) Dielectric function, ε1(ω) and ε2(ω), and (b) optical conductivity, σ1(ω) and σ2(ω), of pristine and Fe−doped anatase TiO2 (3.125−25% Fe), comparing GGA, GGA+UFe (UFe = 4.5 eV, JFe = 0.9 eV), and PINN. Solid and dashed curves represent the real and imaginary components, respectively.
Figure 18.
(a) Dielectric function, ε1(ω) and ε2(ω), and (b) optical conductivity, σ1(ω) and σ2(ω), of pristine and Fe-doped anatase TiO2 (3.125–25% Fe), comparing GGA, GGA+UTi+UFe, and PINN. Hubbard parameters are UTi = UFe = 4.5 eV, JTi = 0.8 eV, and JFe = 0.9 eV. Solid and dashed curves represent the real and imaginary components, respectively.
Fe incorporation enhances both the dielectric function and optical conductivity compared with pristine anatase TiO2, with the strongest response obtained at 25% Fe. This enhancement is attributed to Fe−induced impurity levels and increased Fe−3d/O−2p/Ti−3d hybridization, which introduce additional interband transitions, increase polarizability, and broaden the optical spectral weight in the visible−to−near−UV region. These effects indicate that Fe doping improves the visible−light activity of anatase TiO2 and may enhance its usefulness in photocatalytic and optoelectronic applications. The PINN−assisted spectra closely reproduce the corresponding GGA+U trends, including the concentration−dependent peak shifts and spectral broadening. This agreement confirms the reliability of PINN as an efficient surrogate for predicting correlated optical properties. The present optical trends are consistent with previous theoretical and experimental reports on transition−metal−doped TiO2 systems [46,47].
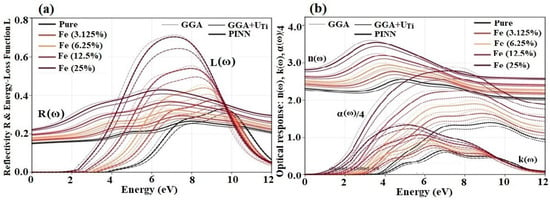
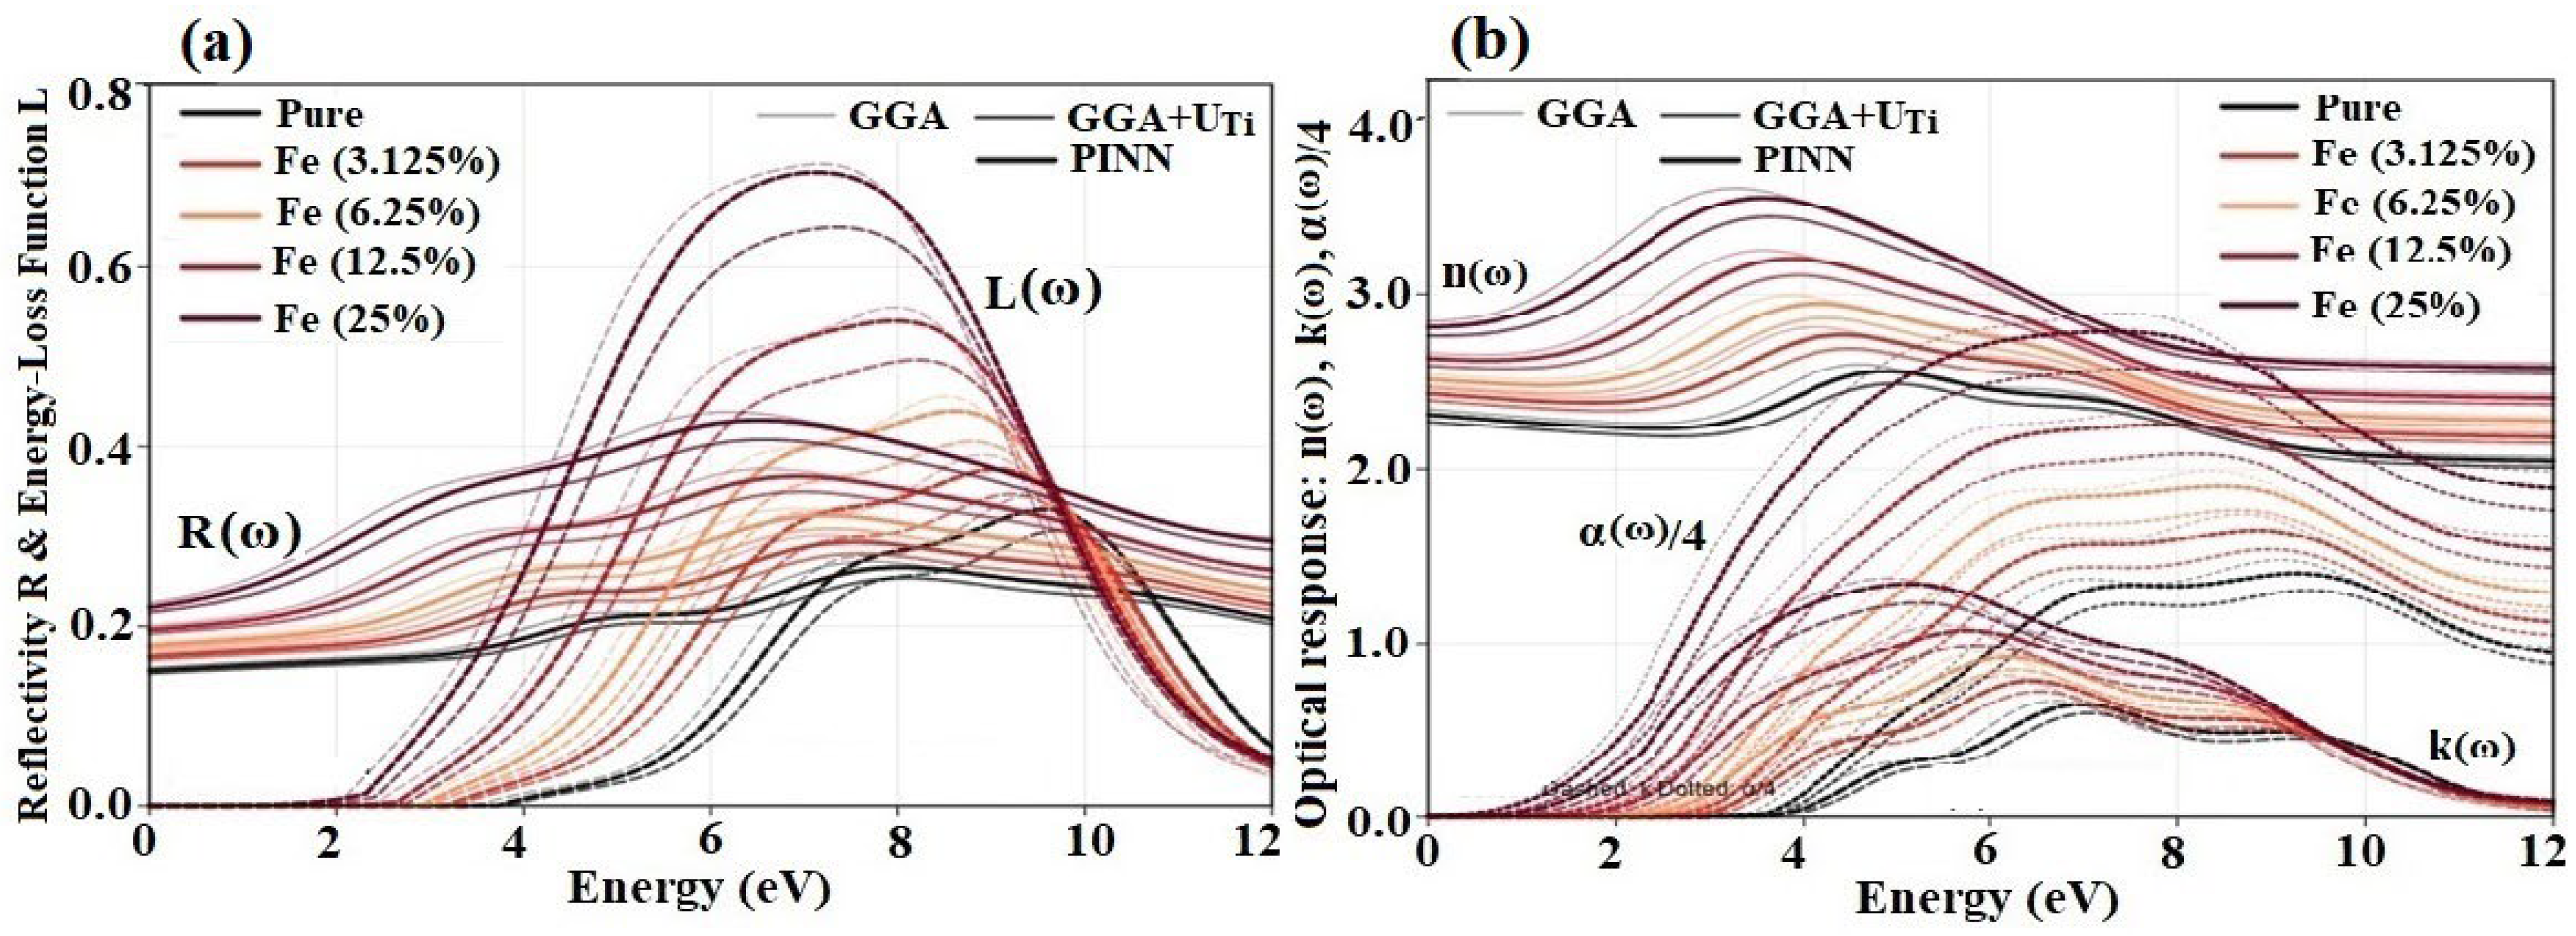
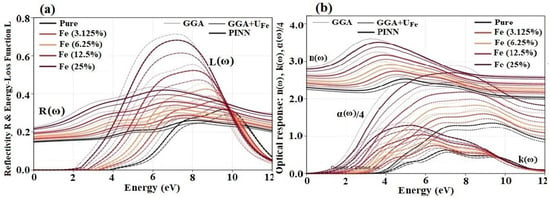
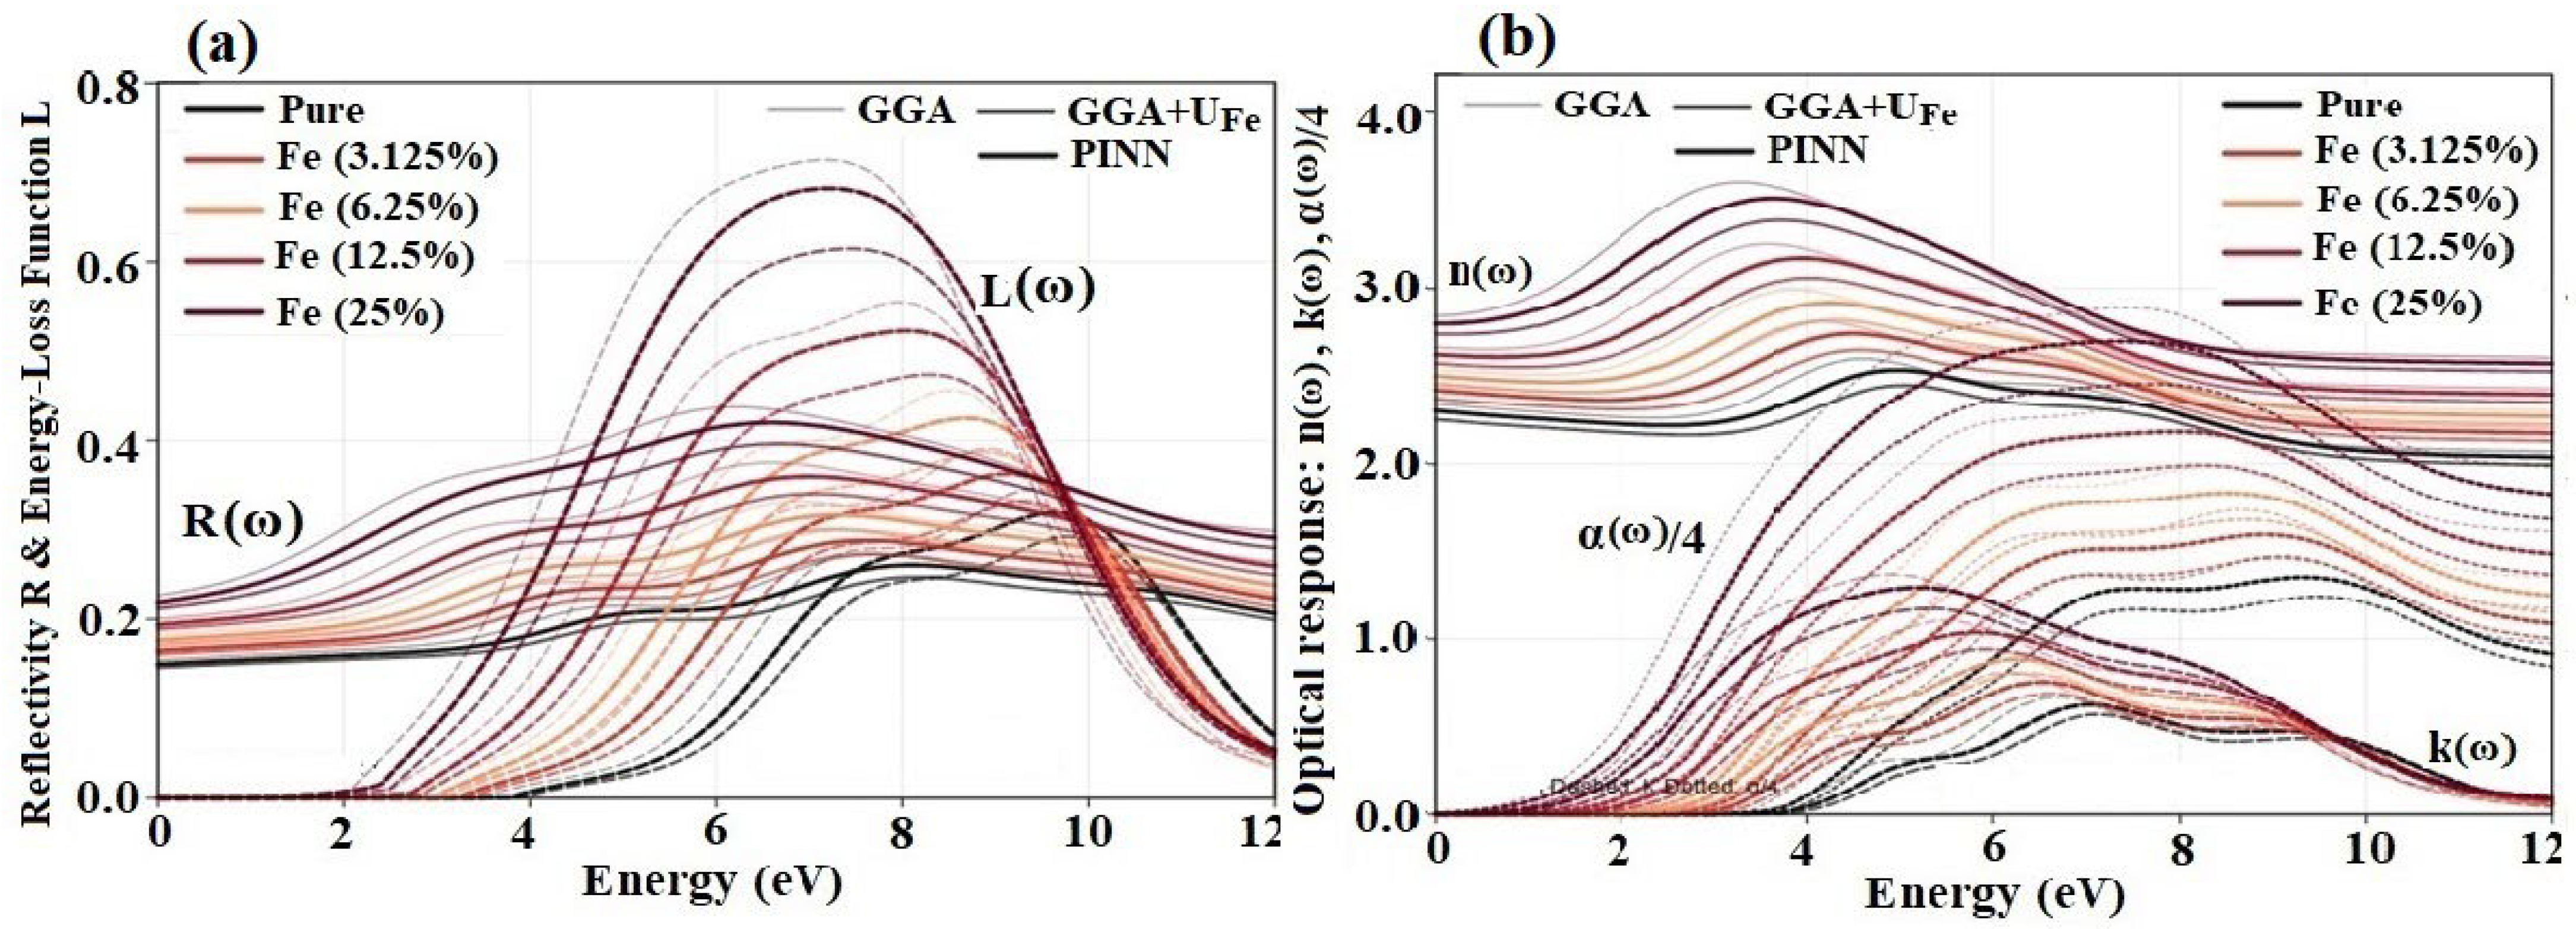
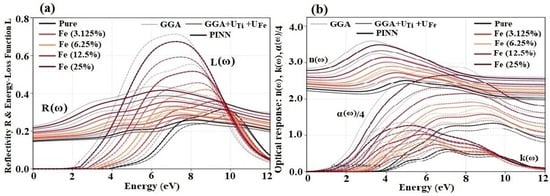
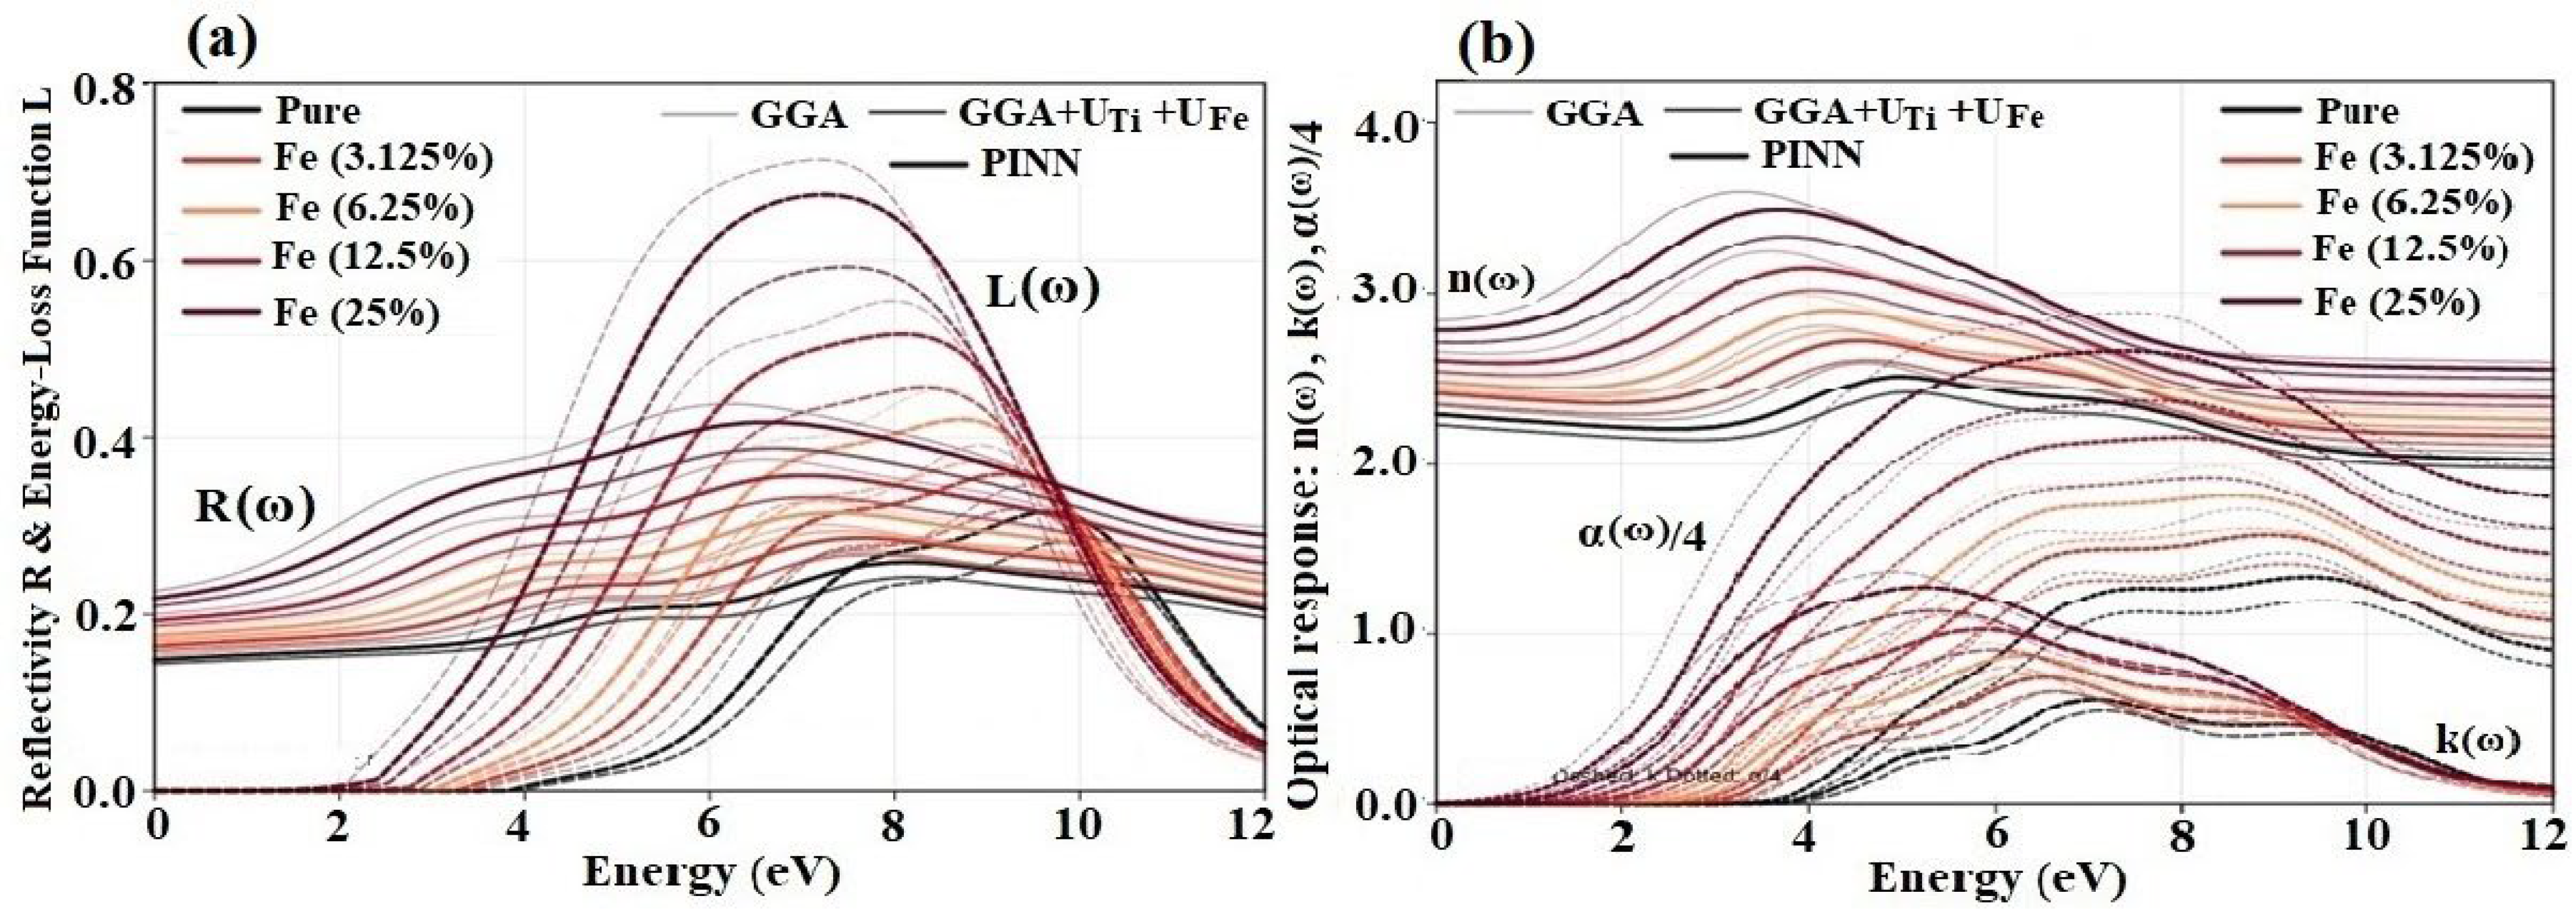
Figure 19, Figure 20 and Figure 21 present the calculated reflectivity, energy-loss function, refractive index, extinction coefficient, and absorption coefficient of pristine and Fe-doped anatase TiO2. Standard GGA produces a stronger low-energy optical response because it underestimates the band gap and over-delocalizes Ti- and Fe-derived electronic states. Introducing Hubbard corrections shifts the main R(ω), L(ω), n(ω), k(ω), and α(ω) features toward higher photon energies and reduces the excessive low-energy reflectivity, extinction, and absorption predicted by GGA. As shown in Figure 19, the Ti-site Hubbard correction improves the localization of host Ti-3d conduction states, whereas Figure 20 shows that the Fe-site correction localizes Fe-3d impurity states. Accordingly, Figure 21 demonstrates that the combined UTi+UFe treatment provides the most correlated optical description.
Figure 19.
(a) Reflectivity, R(ω), and energy-loss function, L(ω), and (b) refractive index, n(ω), extinction coefficient, k(ω), and absorption coefficient, α(ω), of pristine and Fe-doped anatase TiO2 (3.125–25% Fe), comparing GGA, GGA+UTi (UTi = 4.5 eV and JTi = 0.8 eV), and PINN. Solid curves denote R and n; dashed curves denote L and k. Dotted curves show α/4, scaled for common-axis plotting.
Figure 20.
(a) Reflectivity, R(ω), and energy-loss function, L(ω), and (b) refractive index, n(ω), extinction coefficient, k(ω), and absorption coefficient, α(ω), of pristine and Fe-doped anatase TiO2 (3.125–25% Fe), comparing GGA, GGA+UFe (UFe = 4.5 eV and JFe = 0.9 eV), and PINN. Solid curves denote R and n; dashed curves denote L and k. Dotted curves show α/4, scaled for common-axis plotting.
Figure 21.
(a) Reflectivity, R(ω), and energy-loss function, L(ω), and (b) refractive index, n(ω), extinction coefficient, k(ω), and absorption coefficient, α(ω), of pristine and Fe-doped anatase TiO2 (3.125–25% Fe), comparing GGA, GGA+UTi+UFe, and PINN. Hubbard parameters are UTi = UFe = 4.5 eV, JTi = 0.8 eV, and JFe = 0.9 eV. Solid curves denote R and n; dashed curves denote L and k. Dotted curves show α/4, scaled for common-axis plotting.
Fe incorporation enhances the reflectivity, loss intensity, refractive index, extinction coefficient, and absorption coefficient compared with pristine anatase TiO2. This enhancement increases systematically from 3.125% to 25% Fe, indicating stronger Fe-3d/O-2p/Ti-3d hybridization and additional dopant-assisted interband transitions. The 25% Fe-doped system exhibits the strongest low-energy optical response, consistent with its increased density of Fe-derived impurity states and narrowed band gap. The PINN spectra closely reproduce the corresponding GGA+U peak shifts and spectral broadening, confirming the ability of PINN to serve as an efficient surrogate for correlated optical-property prediction. Overall, the calculated optical trends are in good agreement with previous studies of doped TiO2 systems [45,46,47].
4. Conclusions
This study investigated Fe-doped anatase TiO2 at concentrations of 3.125%, 6.25%, 12.5%, and 25% using WIEN2k FP-LAPW calculations within GGA and GGA+U, complemented by PINN modeling. Its principal contribution is the integration of correlated all-electron calculations with physics-informed predictions to examine concentration-dependent structural, mechanical, energetic, electronic, magnetic, and optical properties.
Fe incorporation produces systematic lattice expansion and mechanical softening. Within GGA, the equilibrium volume increases from 17.14 to 18.49 Å3/f.u., while the bulk modulus decreases from 179.2 to 160.5 GPa between pristine TiO2 and 25% Fe. At 25% Fe, GGA+UTi predicts a volume of 18.91 Å3/f.u. and a bulk modulus of 169.2 GPa, compared with PINN values of 18.82 Å3/f.u. and 167.9 GPa. Formation energies become increasingly negative, reaching −10.42 eV/f.u. within GGA and −10.91 eV/f.u. with the combined Ti- and Fe-site corrections. These trends indicate more favorable formation relative to the adopted chemical-potential references, although stability against competing phases requires further assessment.
Fe-3d impurity states and their hybridization with O-2p and Ti-3d orbitals progressively narrow the band gap. The GGA gap decreases from 2.18 eV for pristine TiO2 to 1.23 eV at 25% Fe. Hubbard corrections increase the pristine gap to 3.07 eV, while the combined GGA+UTi+UFe treatment yields 1.59 eV at 25% Fe. PINN predicts 3.19 eV for pristine TiO2 and a decrease from 2.25 to 1.48 eV across the investigated Fe concentrations. Pristine TiO2 remains nonmagnetic, whereas Fe substitution enhances spin polarization, with the largest reported magnetic moment reaching 4.41 μB/f.u. under the combined Hubbard treatment.
The optical calculations indicate enhanced visible-to-near-ultraviolet response through dopant-assisted interband transitions. Hubbard corrections shift the principal spectral features toward higher photon energies and moderate the excessive low-energy response obtained with GGA. PINN reproduces the principal correlated trends, supporting its potential for interpolating properties within the modeled concentration range.
These findings establish Fe concentration and electronic-correlation treatment as complementary controls for tuning anatase TiO2. Experimental validation, competing-phase analysis, magnetic-ordering comparisons, and independent PINN testing remain necessary to assess its prospects for photocatalytic, optoelectronic, and spintronic applications.
Funding
This research was funded by Qassim University, grant number QU-APC-2026. The APC was funded by Qassim University.
Institutional Review Board Statement
Not applicable.
Informed Consent Statement
Not applicable.
Data Availability Statement
The data used to support the findings of this study are available from the corresponding author upon reasonable request.
Acknowledgments
The researchers would like to thank the Deanship of Graduate Studies and Scientific Research at Qassim University (https://www.qu.edu.sa) for financial support (QU-APC-2026).
Conflicts of Interest
The author declare no conflicts of interest.
References
- De Angelis, F.; Di Valentin, C.; Fantacci, S.; Vittadini, A.; Selloni, A. Theoretical studies on anatase and less common TiO2 phases: Bulk, surfaces, and nanomaterials. Chem. Rev. 2014, 114, 9708–9753. [Google Scholar] [CrossRef] [Scilit] [PubMed]
- Serpone, N.; Emeline, A.V.; Kuznetsov, V.N.; Ryabchuk, V.K. Second generation visible-light-active photocatalysts: Preparation, optical properties, and consequences of dopants on the band gap energy of TiO2. In Environmentally Benign Photocatalysts: Applications of Titanium Oxide-Based Materials; Springer: Berlin/Heidelberg, Germany, 2010; pp. 35–111. [Google Scholar]
- Asahi, R.; Taga, Y.; Mannstadt, W.; Freeman, A.J. Electronic and optical properties of anatase TiO2. Phys. Rev. B 2000, 61, 7459. [Google Scholar] [CrossRef] [Scilit]
- Zhao, T.-X.; Feng, Y.-J.; Huang, J.-H.; He, J.-F.; Liu, Q.-H.; Pan, Z.-Y.; Wu, Z.-Y. Local structure and optical absorption characteristic investigation on Fe doped TiO2 nanoparticles. Chin. Phys. C 2015, 39, 028001. [Google Scholar] [CrossRef] [Scilit][Green Version]
- Wan, L.; Gao, Y.; Xia, X.-H.; Deng, Q.-R.; Shao, G. Phase selection and visible light photo-catalytic activity of Fe-doped TiO2 prepared by the hydrothermal method. Mater. Res. Bull. 2011, 46, 442–446. [Google Scholar] [CrossRef] [Scilit]
- Akshay, V.; Arun, B.; Mandal, G.; Chanda, A.; Vasundhara, M. Significant reduction in the optical band-gap and defect assisted magnetic response in Fe-doped anatase TiO2 nanocrystals as dilute magnetic semiconductors. New J. Chem. 2019, 43, 6048–6062. [Google Scholar] [CrossRef] [Scilit]
- Kapilashrami, M.; Zhang, Y.; Liu, Y.-S.; Hagfeldt, A.; Guo, J. Probing the optical property and electronic structure of TiO2 nanomaterials for renewable energy applications. Chem. Rev. 2014, 114, 9662–9707. [Google Scholar] [CrossRef] [Scilit] [PubMed]
- Thaines, E.H.; Oliveira, A.C.; Pocrifka, L.A.; Duarte, H.A.; Freitas, R.G. Influence of Fe-doping on the structural and electronic properties of the TiO2 anatase: Rutile. J. Phys. Chem. C 2023, 127, 22518–22529. [Google Scholar] [CrossRef] [Scilit]
- Shao, G. Red shift in manganese-and iron-doped TiO2: A DFT + U analysis. J. Phys. Chem. C 2009, 113, 6800–6808. [Google Scholar] [CrossRef] [Scilit]
- Wu, H.-C.; Li, S.-H.; Lin, S.-W. Effect of Fe Concentration on Fe-Doped Anatase TiO2 from GGA + U Calculations. Int. J. Photoenergy 2012, 2012, 823498. [Google Scholar]
- Baghsiyahi, F.B.; Yeganeh, M. The theoretical investigation of the electronic and optical properties of Fe-doped anatase TiO2. Solid State Commun. 2025, 396, 115758. [Google Scholar] [CrossRef] [Scilit]
- Toprek, D.; Koteski, V.; Belošević-Čavor, J.; Ivanovski, V.; Umićević, A. Ab initio study of electronic and optical properties of Fe doped anatase TiO2 (1 0 1) surface. Comput. Theor. Chem. 2017, 1120, 17–23. [Google Scholar] [CrossRef] [Scilit]
- Blaha, P.; Schwarz, K.; Tran, F.; Laskowski, R.; Madsen, G.K.H.; Marks, L.D. WIEN2k: An APW+ lo program for calculating the properties of solids. J. Chem. Phys. 2020, 152, 074101. [Google Scholar] [CrossRef] [Scilit] [PubMed]
- Perdew, J.P.; Burke, K.; Ernzerhof, M. Generalized gradient approximation made simple. Phys. Rev. Lett. 1996, 77, 3865. [Google Scholar] [CrossRef] [Scilit] [PubMed]
- Anisimov, V.I.; Zaanen, J.; Andersen, O.K. Band theory and Mott insulators: Hubbard U instead of Stoner I. Phys. Rev. B 1991, 44, 943. [Google Scholar] [CrossRef] [Scilit] [PubMed]
- Dudarev, S.L.; Botton, G.A.; Savrasov, S.Y.; Humphreys, C.J.; Sutton, A.P. Electron-energy-loss spectra and the structural stability of nickel oxide: An LSDA + U study. Phys. Rev. B 1998, 57, 1505. [Google Scholar] [CrossRef] [Scilit]
- Raissi, M.; Perdikaris, P.; Karniadakis, G.E. Physics-informed neural networks: A deep learning framework for solving forward and inverse problems involving nonlinear partial differential equations. J. Comput. Phys. 2019, 378, 686–707. [Google Scholar] [CrossRef] [Scilit]
- Michaloglou, A.; Papadimitriou, I.; Gialampoukidis, I.; Vrochidis, S.; Kompatsiaris, I. Physics-informed neural networks in materials modeling and design: A review. Arch. Comput. Methods Eng. 2026, 33, 5223–5260. [Google Scholar] [CrossRef] [Scilit]
- Blaha, P.; Schwarz, K.; Madsen, G.K.; Kvasnicka, D.; Luitz, J. Wien2k. User’s Guide 2001, 60, 155–169. [Google Scholar]
- LAGHZAOUI, S. First-Principles Study of the Electronic, Magnetic, Optical, and Thermoelectric Properties of Sn1-2xMnxAxO2 (A= Mo/Tc), Double Perovskites, and Zn1-xTMxO Nanosheets: Promising Half-Metallic Materials for Energy Conversion; Faculté des Sciences: Rabat, Morocco, 2024. [Google Scholar]
- Han, X.; Amrane, N.; Murat, A.; Zhang, Z.; Benkraouda, M. A GGA + U study of electron localization and oxygen vacancy clustering in rutile TiO2-x. J. Alloys Compd. 2021, 855, 157395. [Google Scholar] [CrossRef] [Scilit]
- Lazzeri, M.; Vittadini, A.; Selloni, A. Structure and energetics of stoichiometric TiO2 anatase surfaces. Phys. Rev. B 2001, 63, 155409. [Google Scholar] [CrossRef] [Scilit]
- Wyckoff, R. Rocksalt Crystal Structures, 2nd ed.; Interscience Publishers: New York, NY, USA, 1963. [Google Scholar]
- Da Silva, J.L.; Ganduglia-Pirovano, M.V.; Sauer, J.; Bayer, V.; Kresse, G. Hybrid functionals applied to rare-earth oxides: The example of ceria. Phys. Rev. B 2007, 75, 045121. [Google Scholar] [CrossRef] [Scilit]
- Dong, C.; Li, X.; Qi, J. First-principles investigation on electronic properties of quantum dot-sensitized solar cells based on anatase TiO2 nanotubes. J. Phys. Chem. C 2011, 115, 20307–20315. [Google Scholar] [CrossRef] [Scilit]
- Morgan, B.J.; Watson, G.W. A DFT + U description of oxygen vacancies at the TiO2 rutile (1 1 0) surface. Surf. Sci. 2007, 601, 5034–5041. [Google Scholar]
- Matsumoto, Y.; Murakami, M.; Shono, T.; Hasegawa, T.; Fukumura, T.; Kawasaki, M.; Ahmet, P.; Chikyow, T.; Koshihara, S.-Y.; Koinuma, H. Room-temperature ferromagnetism in transparent transition metal-doped titanium dioxide. Science 2001, 291, 854–856. [Google Scholar] [CrossRef] [Scilit] [PubMed]
- Xu, J.-P.; Li, L.; Lv, L.-Y.; Zhang, X.-S.; Chen, X.-M.; Wang, J.-F.; Zhang, F.-M.; Zhong, W.; Du, Y.-W. Structural and magnetic properties of Fe-doped anatase TiO2 films annealed in vacuum. Chin. Phys. Lett. 2009, 26, 097502. [Google Scholar] [CrossRef] [Scilit]
- Begna, W.B.; Gurmesa, G.S.; Zhang, Q.; Geffe, C.A. A DFT + U study of site dependent Fe-doped TiO2 diluted magnetic semiconductor material: Room-temperature ferromagnetism and improved semiconducting properties. AIP Adv. 2022, 12, 025002. [Google Scholar] [CrossRef] [Scilit]
- Tolea, F.; Grecu, M.N.; Kuncser, V.; Constantinescu, S.G.; Ghica, D. On the role of Fe ions on magnetic properties of doped TiO2 nanoparticles. Appl. Phys. Lett. 2015, 106, 142404. [Google Scholar] [CrossRef] [Scilit]
- Zavatski, S.; Neilande, E.; Bandarenka, H.; Popov, A.; Piskunov, S.; Bocharov, D. Density functional theory for doped TiO2: Current research strategies and advancements. Nanotechnology 2024, 35, 192001. [Google Scholar] [CrossRef] [Scilit] [PubMed]
- Arlt, T.; Bermejo, M.; Blanco, M.A.; Gerward, L.; Jiang, J.Z.; Olsen, J.S.; Recio, J.M. High-pressure polymorphs of anatase TiO2. Phys. Rev. B 2000, 61, 14414. [Google Scholar] [CrossRef] [Scilit]
- Chase, M.W. NIST-JANAF thermochemical tables. J. Phys. Chem. Ref. Data 1998, 25, 551–603. [Google Scholar]
- Mahmood, T.; Cao, C.; AhMEd, R.; AhMEd, M.; Saeed, M.A.; Zafar, A.A.; Husain, T.; Kamran, M.A. Pressure induced structural and electronic bandgap properties of anatase and rutile TiO2. Sains Malays. 2013, 42, 231–237. [Google Scholar]
- Tang, H.; Berger, H.; Schmid, P.; Lévy, F.; Burri, G. Photoluminescence in TiO2 anatase single crystals. Solid State Commun. 1993, 87, 847–850. [Google Scholar] [CrossRef] [Scilit]
- Chen, Q.; Cao, H.-H. Ab initio calculations of electronic structure of anatase TiO2. Chin. Phys. 2004, 13, 2121–2125. [Google Scholar] [CrossRef] [Scilit]
- Patrick, C.E.; Giustino, F. GW quasiparticle bandgaps of anatase TiO2 starting from DFT + U. J. Phys. Condens. Matter 2012, 24, 202201. [Google Scholar] [CrossRef] [Scilit] [PubMed]
- Asahi, R.; Morikawa, T.; Ohwaki, T.; Aoki, K.; Taga, Y. Visible-light photocatalysis in nitrogen-doped titanium oxides. Science 2001, 293, 269–271. [Google Scholar] [CrossRef] [Scilit] [PubMed]
- Santara, B.; Giri, P.K.; Dhara, S.; Imakita, K.; Fujii, M. Oxygen vacancy-mediated enhanced ferromagnetism in undoped and Fe-doped TiO2 nanoribbons. J. Phys. D. Appl. Phys. 2014, 47, 235304. [Google Scholar] [CrossRef] [Scilit]
- Purja Pun, G.P.; Batra, R.; Ramprasad, R.; Mishin, Y. Physically informed artificial neural networks for atomistic modeling of materials. Nat. Commun. 2019, 10, 2339. [Google Scholar] [CrossRef] [Scilit] [PubMed]
- Mo, S.-D.; Ching, W. Electronic and optical properties of three phases of titanium dioxide: Rutile, anatase, and brookite. Phys. Rev. B 1995, 51, 13023. [Google Scholar] [CrossRef] [Scilit] [PubMed]
- Landmann, M.; Rauls, E.; Schmidt, W. The electronic structure and optical response of rutile, anatase and brookite TiO2. Energy 2012, 24, 195503. [Google Scholar] [CrossRef] [Scilit] [PubMed]
- Hossain, F.M.; Sheppard, L.; Nowotny, J.; Murch, G.E. Optical properties of anatase and rutile titanium dioxide: Ab initio calculations for pure and anion-doped material. J. Phys. Chem. Solids 2008, 69, 1820–1828. [Google Scholar] [CrossRef] [Scilit]
- Li, J.; Meng, S.; Qin, L.; Lu, H. Optical properties of anatase and rutile TiO2 studied by GGA + U. Chin. Phys. B 2017, 26, 087101. [Google Scholar] [CrossRef] [Scilit]
- Glassford, K.M.; Chelikowsky, J.R. Optical properties of titanium dioxide in the rutile structure. Phys. Rev. B 1992, 45, 3874. [Google Scholar] [CrossRef] [Scilit] [PubMed]
- Foyshal, M.; Ferdousy, J.; Mahbubur, M.; Rachona, A.M.; Kabir, M.F.; Shahid, M.H.; Rahman, M. Iron-doped titanium dioxide nanoparticles with enhanced ferromagnetic properties for spintronic applications. BioNanoScience 2025, 15, 344. [Google Scholar] [CrossRef] [Scilit]
- Mohamad, M.; Haq, B.U.; Ahmed, R.; Shaari, A.; Ali, N.; Hussain, R. A density functional study of structural, electronic and optical properties of titanium dioxide: Characterization of rutile, anatase and brookite polymorphs. Mater. Sci. Semicond. Process. 2015, 31, 405–414. [Google Scholar] [CrossRef] [Scilit]

Disclaimer/Publisher’s Note: The statements, opinions and data contained in all publications are solely those of the individual author(s) and contributor(s) and not of MDPI and/or the editor(s). MDPI and/or the editor(s) disclaim responsibility for any injury to people or property resulting from any ideas, methods, instructions or products referred to in the content. |
© 2026 by the author. Licensee MDPI, Basel, Switzerland. This article is an open access article distributed under the terms and conditions of the Creative Commons Attribution (CC BY) license.