


Abstract
Pollination is the rate-limiting reproductive step in dioecious fruit crops. However, the developmental pathway through which pollination interventions translate into fruit weight remains unclear. Here, we tested whether seed set was the dominant pathway linking three pollination methods, namely, artificial pollination (AP), pollen dispenser-assisted bee pollination (BTD), and bee-only pollination (BT), to fruit weight and soluble solids content (SSC) in gold kiwifruit (Actinidia chinensis cv. ‘Haegeum’). A total of 2940 individually measured fruits were collected across two orchards in southern Korea (2018–2025), comprising 2022 main experiment (n = 1800), supporting trials (2018–2020, N = 540, including a six-treatment factorial design in 2020), and a 2025 replication of 600 fruits. Across the calibration range (seed number 100–700), each additional seed contributed 0.063–0.072 g of fruit weight (R2 = 0.68–0.72). The slopes were statistically indistinguishable among AP, BTD, and BT. Mediation analysis was triangulated through three estimators: partial correlation (49.8–63.1% mediation), product-of-coefficients with 10,000 bootstrap resamples (70.3–77.4% indirect-effect mediation), and model-free stratification that converged on the same conclusion. When seed number was matched (500–700 range), treatment differences in fruit weight collapsed to non-significance (F = 0.34, p = 0.714). The two mediation percentages reflect different denominators, that is, standardised association vs. unstandardised total effect, and both estimators agree qualitatively. SSC was not mediated by the seed number (<8%). The small residual SSC pattern may reflect block-level confounding rather than a method-intrinsic effect. A random-effects meta-analysis across six-year site combinations returned pooled Hedges’ g = +0.43 (95% CI: −0.02 to +0.89, I2 = 95.1%), with two years in which BTD significantly exceeded AP. In 2025, BTD achieved the Ferguson (1984) ≥1000-seed commercial standard in 79% of fruits. These findings identify the seed set as a method-independent reproductive bottleneck, reframing pollination system evaluation around pollen deposition-to-seed set conversion rather than around the delivery mechanism and support an efficiency-focused approach to orchard pollination management.
1. Introduction
Gold kiwifruit (Actinidia chinensis) is a high-value horticultural crop. Its global production has expanded rapidly over the past two decades, driven by consumer demand for its distinctive yellow flesh and high nutritional content [1,2]. Kiwifruit is a functionally dioecious crop that requires the cross-pollination of male vines, making pollination management critical for commercial production [3,4]. Inadequate pollination results in reduced fruit size, low seed counts, and irregular fruit shape, all of which diminish the market value [5]. Two primary strategies are used commercially, namely, artificial pollination (AP), involving manual collection and application of pollen, and bee-mediated pollination using managed honeybee colonies [6,7]. The third approach combines bee pollination with supplementary pollen distribution using mechanical dispensers attached to hive entrances [8,9].
Numerous studies have compared these strategies, but the results vary with the geographic and experimental contexts. Abbate et al. [10] reported that AP fruit set (97.4%) exceeded insect-mediated pollination (3.1%) in Alabama, USA. Meanwhile, Sáez et al. [11] found that bee pollination produced a 40% higher fruit set and 34% more seeds than AP in Argentina. This likely reflects differences in cultivars (gold vs. green), AP methodology (dry powder vs. spray), the local climate during blooms, and bee management intensity [3,12]. A key limitation of prior comparisons is that they conflate the method and efficiency of pollen delivery. AP apply large quantities of viable pollen to stigmas, ensuring high fertilisation rates. Meanwhile, bee pollination depends on forager behaviour, pollen load, and environmental conditions, which often result in variable outcomes [4]. If the treatment effects on fruit quality are attributable to differences in seed set, then the apparent superiority of any method would be a consequence of pollination efficiency rather than an intrinsic advantage of the delivery mechanism.
The positive linear relationship between seed number and fruit weight in kiwifruit has been documented since the work of Pyke and Alspach [13]. Subsequent studies have reported regression slopes of 0.058–0.080 g per seed across cultivars and species [14,15]. Each seed produces auxins and gibberellins that stimulate localised pericarp expansion, creating a direct relationship between seed number and fruit growth [16,17]. However, to our knowledge, no prior study has tested whether seed number completely mediates the effect of pollination method on fruit weight, that is, whether fruits with equal seed counts but produced by different methods are statistically indistinguishable in weight. A second, less-explored question concerns soluble solids content (SSC). Nardozza et al. [18] showed that carbohydrate metabolism in kiwifruit responds to complex source–sink dynamics. Seal et al. [15,19] demonstrated pollen parent effects on fruit composition. However, whether the pollination method per se affects SSC independently of seed number has not been tested.
In Korea, AP is the dominant pollination practice. However, it requires approximately 15–20 person-h per hectare during a narrow 3–5 d flowering window [20]. With an ageing farming population and a declining rural workforce [21], the sustainability of labour-dependent AP has been increasingly questioned. Developed by the Rural Development Administration and most used in domestic production, the ‘Haegeum’ cultivar is the focus of growing interest in bee-based alternatives [22,23]. However, the biological basis for comparing AP- and bee-based systems, specifically, the mechanism through which pollination methods affect fruit quality, has not been established for this cultivar or for Korean production conditions.
In the present study, we addressed these gaps through a multi-year (2018–2025), multi-site (Wando and Boseong) evaluation of pollination methods for ‘Haegeum’ gold kiwifruit. The primary dataset comprised 1800 fruits from a balanced 2022 experiment with three treatments × two sites × 300 fruits. This was supplemented by 540 fruits from three years of supporting experiments (2018–2020). This included a six-treatment factorial decomposition and 600 fruits from a 2025 replication experiment designed to test temporal reproducibility and assess seed-weight dynamics in the high-seed-number range (>1000 seeds per fruit). We did not aim to declare a single best pollination method but rather to disentangle the contributions of pollination efficiency and pollination method to fruit quality outcomes. The specific objectives were (i) to quantify the effects of AP, BTD, and BT on fruit weight, seed number, and SSC across two geographically distinct sites; (ii) to determine whether seed number mediates the treatment effect on fruit weight, using partial correlation and stratified analysis, with SSC examined as a contrasting response variable to assess pathway specificity; (iii) to evaluate pollination uniformity and its consequences for premium fruit proportion; (iv) to assess the multi-year consistency of treatment rankings through meta-analytic synthesis; and (v) to quantify the marginal contributions of individual pollination components through factorial decomposition. By formally testing whether seed set mediates the method–weight relationship, we identified a method-independent reproductive bottleneck in gold kiwifruit and provided a parametric basis for evaluating any pollination system through a single physiological currency: seed-to-weight conversion.
2. Materials and Methods
2.1. Study Sites
Field experiments were conducted using two commercial gold kiwifruit (Actinidia chinensis cv. ‘Haegeum’) orchards in southern Korea (Jeollanam-do province) from 2018 to 2025 (Figure 1). The Wando site (34.31° N, 126.76° E) is located on Wando Island in a warm coastal zone, with an annual mean temperature of 14.0 °C and annual precipitation of 1485 mm. The Boseong site (34.77° N, 127.08° E) is approximately 55 km northeast of Wando in an inland valley, with an annual mean temperature of 13.5 °C and annual precipitation of 1517 mm. Both sites have a humid subtropical climate (Köppen Cfa) [24], with the kiwifruit bloom period typically occurring between mid-May and early June.
Figure 1.
Location of experimental sites (Wando and Boseong) in Jeollanam-do province, southern Korea. The Wando site (34.31° N, 126.76° E) is located on Wando Island in a warm coastal zone; the Boseong site (34.77° N, 127.08° E) is approximately 55 km northeast in an inland valley. Both sites have a humid subtropical climate (Köppen Cfa).
2.2. Experimental Design
In four experimental years (2018, 2019, 2022, 2025), we used a three-treatment design comparing artificial pollination (AP), pollen dispenser-assisted bee pollination (BTD), and bee-only pollination (BT), with a six-treatment factorial conducted in 2020 to decompose individual component contributions (Table 1). The 2022 main experiment (n = 300 fruits per treatment per site, total N = 1800) was conducted simultaneously at both the Wando and Boseong sites. Supporting experiments performed in 2018–2020 (Wando only) and 2025 replications (Wando only, n = 200 per treatment) were designed to test multi-year reproducibility and high-seed-number behaviour. All the treatments were applied to spatially separate orchard blocks within the same vineyard, with alternating treatment blocks to minimise spatial bias. Across all the experimental years (2018, 2019, 2020, 2022, and 2025), the pollen supplied for AP and loaded into the BTD dispenser was the same ‘Daehong’ cultivar. Therefore, the paternal source of the supplied-pollen treatments was held constant throughout the study and is not a confounder in the multi-year comparison. Only the natural pollen foraged by bees in the BT treatment from interplanted ‘Daehong’ and ‘Okcheon’ pollinizer vines could vary in paternal composition.
Table 1.
Summary of experimental design across all study years.
Artificial pollination (AP): Pollen was collected from ‘Daehong’ male vines during the bloom period, dried at 25 °C for 12 h, and stored at −20 °C until use. Pollen was applied to female flowers using a hand-held electrostatic duster within 24 h of stigma opening. Pure pollen was applied at the standard rate for kiwifruit in Korea, that is, approximately 3 g of pure pollen per 10 a (≈30 g ha−1), typically diluted 1:10–1:15 with lycopodium spores as a carrier. This corresponded to approximately 0.1 mg of pure pollen per flower, delivered across 2–3 application passes during the 3–5 d bloom window.
Pollen dispenser-assisted bee pollination (BTD): Honeybee (Apis mellifera) hives (n = 4–6 per ha) were placed within the orchard at the blooming onset. Each hive was equipped with a mechanical pollen dispenser at the entrance and refilled twice daily with the same stored ‘Daehong’ pollen used for artificial pollination. This ensured that returning foragers passed through a pollen-coated tunnel. Compatible pollinizer vines of ‘Daehong’ and ‘Okcheon’ were also interplanted at a 1:8 male-to-female ratio as a supplementary natural pollen source.
Bee-only pollination (BT): Same hive density as BTD, but without a pollen dispenser. Pollination relies solely on bee visitation and naturally available pollen from interplanted male vines.
Pollen source across treatments: AP and BTD used the identical stored ‘Daehong’ pollen applied manually in AP and dispensed at the hive entrance in BTD. This meant that these two treatments share the same paternal source. Therefore, any difference between them cannot be attributed to pollen origin. BT received no supplied pollen and relied on bees foraging from the interplanted ‘Daehong’ and ‘Okcheon’ pollinizer vines. Because AP and BTD are paternally matched, the seed-mediated weight pathway compared across these treatments is not confounded by the pollen source. The only treatment with a potentially different paternal composition is BT, which is considered in the SSC discussion (Section 4.7).
2020 factorial design: Six treatments were applied at the Wando site (n = 50/treatment): (1) bees only (control), (2) bees + pollinator trees (1:8 ratio), (3) bees + pollinator trees + AP supplementation, (4) BTD (bees + pollinator + dispenser), (5) BTD + AP supplementation, and (6) AP only. This design enabled the stepwise quantification of the marginal effect of each supplementary component.
2.3. Fruit Quality Measurements
Fruits were harvested at commercial maturity (Brix > 6.5°) and individually measured within 48 h of harvest. The following parameters were recorded.
Fruit weight (g): Individual fresh weight was measured using a precision balance (±0.01 g; Ohaus Explorer, Ohaus Corporation, Parsippany, NJ, USA).
Fruit dimensions (mm): Longitudinal diameter (LD) and transverse diameter (TD) were measured using digital callipers (±0.01 mm; Mitutoyo CD-15CPX, Mitutoyo Corporation, Kawasaki, Japan).
Seed number: The fruits were bisected equatorially, extracted, rinsed under running water, air-dried at room temperature for 24 h, and counted manually. All the seeds, including undeveloped ovules, were counted to estimate total fertilisation.
Firmness (kgf): Flesh firmness was measured at two equatorial positions using a texture analyser (TA-XT Plus, Stable Micro Systems, Godalming, UK) fitted with a 7.9 mm cylindrical probe at a penetration speed of 1.0 mm s−1. The mean of the two measurements was recorded. In the 2018–2019 supporting experiments, firmness was measured using a handheld penetrometer; these values are not directly comparable to the 2022 texture-analyser data, and cross-year firmness comparisons were therefore avoided.
Soluble solids content (SSC, °Brix): A longitudinal wedge of equatorial flesh of approximately 5 g was homogenised and measured using a digital refractometer (PAL-1, Atago Co., Tokyo, Japan) at 20–25 °C. In the main experiment (2022), SSC was measured at harvest maturity (6–9 °Brix). In the 2018–2019 supporting experiments and 2025 replications, SSC was measured after extended post-harvest storage and ripening (14–18 °Brix). Therefore, absolute cross-year SSC comparisons were avoided; only within-year treatment comparisons have been reported for SSC.
Titratable acidity (% citric acid): Ten millilitres of juice was titrated with 0.1 N NaOH to pH 8.1 using an automatic titrator.
Dry matter content (2022 main experiment only): A fresh sample of approximately 10–15 g was weighed (fresh weight), dried at 65 °C for 72 h in a forced air oven, and weighed (dry weight). The dry matter percentage was calculated as follows: (dry weight/fresh weight) × 100.
2.4. Statistical Analysis
2.4.1. Treatment and Site Effects
Treatment and site effects on fruit quality were evaluated using a two-way ANOVA (treatment × site) on the main experimental dataset (N = 1800). Where treatment effects were significant, Bonferroni-corrected pairwise t-tests were performed (three comparisons per site, α′ = 0.017). The effect sizes for all pairwise comparisons were calculated using Cohen’s d [25] and interpreted as small (0.20), medium (0.50), or large (0.80).
2.4.2. Seed Number–Fruit Weight Regression
Seed number–fruit weight relationships were modelled using ordinary least squares regression, fitted separately per treatment–site combination, and pooled within each site. The slope homogeneity across treatments was assessed by comparing the 95% confidence intervals of the slope estimates. A pooled regression equation was derived from the full dataset to provide a general predictive model applicable across pollination methods and sites. Slope estimates from this study were compared with published values for other kiwifruit cultivars [13,14,15] to evaluate the cross-cultivar generalisability of the seed–weight relationship.
2.4.3. Mediation Analysis
Three independent mediation estimators, namely, partial correlation [26], product-of-coefficients with 10,000 bootstrap resamples [27], and model-free seed-number stratification, were applied to test whether the seed set mediates the pollination method–outcome relationship. The estimators differ in the denominator (standardised association vs. unstandardised total effect) and, therefore, yield numerically distinct mediation percentages. Agreement on direction and significance across all three is the inferential target. The Baron–Kenny [26] partial-correlation framework codes pollination treatment as an ordinal variable (AP = 2, BTD = 1, BT = 0). This represents the gradient of pollination efficiency, and computes three correlation paths: path a (treatment → seed number), path b (seed number → quality variable), and path c (treatment → quality variable; total effect). The direct effect (c′) is estimated as the partial correlation between treatment and the quality variable after controlling for seed number:
rc′ = (rc − ra·rβ)/√[(1 − ra2)(1 − rβ2)]
The proportion of the treatment effect mediated by seed number was calculated as 1 − (c′/c). Instead, the product-of-coefficients framework computes the indirect effect as ab (unstandardised) and expresses mediation as ab/c in unstandardised units. The results are reported in Supplementary Table S1. As a complementary model-free test, fruits were stratified into seed number ranges (100–300, 300–500, and 500–700), and a one-way ANOVA was performed within each range to test for residual treatment effects after approximate seed number matching. A nonsignificant within-range treatment effect was interpreted as evidence of complete mediation, that is, the treatment effect on fruit quality is entirely attributable to differences in seed number [5]. The bootstrap test of the indirect effect followed Preacher and Hayes [27]. For each site and outcome variable, 10,000 bootstrap resamples were drawn with replacement. In each resample, paths a and b were estimated using ordinary least squares, and the indirect effect (ab = a × b) was computed. The 95% percentile confidence interval and bias-corrected confidence intervals [28] were derived from the empirical bootstrap distribution. An indirect effect was considered significant when a 95% confidence interval was excluded.
2.4.4. Pollination Uniformity Analysis
Pollination uniformity was assessed using the coefficient of variation (CV = SD/mean × 100%) of seed number for each treatment–site combination. The equality of variance across treatments was tested using Levene’s test. The proportions of premium-grade (≥100 g) and undersized (<70 g) fruits were calculated for each treatment–site combination. These thresholds correspond to standard Korean kiwifruit grading categories, namely, premium grade (≥100 g) commands a price premium of approximately 30–40% over the standard grade (70–99 g). Meanwhile, undersized fruits (<70 g) are typically diverted to processing markets at substantially reduced prices [22].
2.4.5. Multi-Year Effect Size Synthesis
To synthesise AP–BTD treatment effects across the heterogeneous experimental designs of 2018–2025, standardised effect sizes (Hedges’ g) with 95% confidence intervals were calculated for each year–site combination [29]. Hedges’ g applies a small-sample correction factor to Cohen’s d, reducing the bias in estimates from small samples (n = 40–50). A random-effects meta-analysis was performed using the DerSimonian–Laird estimator [30] to obtain a pooled effect size and between-study variance (τ2). Heterogeneity was quantified using the Q statistic and I2 index, where I2 > 75% indicated high heterogeneity [31]. The results are presented as a forest plot (Figure 2).
Figure 2.
Forest plot of standardised effect sizes (Hedges’ g) for the AP–BTD fruit weight comparison across six-year site combinations. Positive values indicate AP heavier than BTD; negative values indicate BTD heavier. The diamond represents the pooled random-effects estimate (g = +0.43, 95% CI: −0.02 to +0.89). Heterogeneity: Q = 101.5, df = 5, p < 0.001; I2 = 95.1%; τ2 = 0.295.
2.4.6. 2020. Factorial Analysis
For the 2020 factorial experiment, a one-way ANOVA with six treatment levels was performed for each response variable. This was followed by Bonferroni-corrected pairwise comparisons. The marginal effect of each supplementary pollination component was estimated as the difference in mean fruit weight between consecutive treatments in the additive sequence, for example, the dispenser effect was estimated as Treatment 4 [BTD] minus Treatment 2 [+pollinator tree]. Effect sizes for selected contrasts were calculated as Hedges’ g. The critical test of pollination saturation was the contrast between Treatment 5 (BTD + AP) and Treatment 4 (BTD). A non-significant difference with a near-zero effect size would indicate that additional pollen input beyond the optimised BTD system yields no marginal quality benefit.
2.4.7. Software and Significance Level
All the statistical analyses were performed in Python 3.12 using scipy.stats (v1.13) for parametric tests, numpy (v1.26) for numerical computations, pandas (v2.2) for data management, and matplotlib (v3.9) for figure production. The significance level was set at α = 0.05 throughout unless otherwise specified (Bonferroni correction). The reproducibility code and data are described in the Data Availability Statement.
2.5. Economic Context
To contextualise the practical implications of these biological findings, published economic estimates for Korean gold kiwifruit pollination systems were compiled from extension service reports [22,23]. Based on field trial data from Jeollanam-do, these estimates provided cost–benefit comparisons among the AP, BT, and BTD systems under typical Korean production conditions Table 2). These were cited as independent published estimates, and no primary economic data were collected in the present study. Exchange rates are approximate (1 USD ≈ 1350 KRW, 2022 average).
Measured: fruit weight, dimensions, seed number, firmness, SSC, and titratable acidity. Dry Matter (2022). Total across all years: N = 2940.
Table 2.
Economic comparison of pollination systems (per 1000 m2; Lee 2021, 2022 [22,23]).
3. Results
3.1. Treatment and Site Effects on Fruit Quality
Both pollination method and site had significant effects on fruit quality parameters in the main experiment (N = 1800). Two-way ANOVA (Type II) showed highly significant treatment effects on fruit weight (F = 143.88, p < 0.001), seed number (p < 0.001), and soluble solids content SSC (F = 138.36, p < 0.001; Table 3). The site effect was large for fruit weight (F = 547.55, p < 0.001) but not for SSC (F = 0.73, p = 0.393). This indicated that different physiological processes influenced these two quality attributes [18]. The treatment × site interaction was not significant for fruit weight (F = 2.00, p = 0.137). This indicated that the AP > BTD > BT ranking was consistent across the two sites but was significant for seed number (F = 3.95, p = 0.019) and SSC (F = 3.40, p = 0.033), suggesting site-specific modulation of pollination outcomes for these traits.
Table 3.
Fruit quality parameters (mean ± SD) by treatment and site (2022 main experiment, n = 300/group).
At the Wando site, AP produced the heaviest fruits (99.5 ± 10.8 g), followed by BTD (97.0 ± 10.8 g) and BT (87.1 ± 14.1 g). An identical ranking was observed at Boseong: AP (86.0 ± 13.1 g) > BTD (80.9 ± 12.5 g) > BT (73.6 ± 15.8 g; Table 3). Within each treatment, Wando consistently produced heavier fruits than Boseong by 13.5–16.1 g (all p < 0.001). This likely reflects differences in soil fertility, vine management, and coastal microclimate between the two orchards [4].
The magnitude of the AP–BTD weight difference was small at both sites: 2.5 g at Wando (Cohen’s d = 0.23) and 5.1 g at Boseong (d = 0.40; Table 4). In contrast, the BTD–BT gap was substantially larger: 9.9 g at Wando (d = 0.79) and 7.3 g at Boseong (d = 0.51). Therefore, the pollen dispenser reduced approximately 59–80% of the AP–BT weight gap. This indicated that mechanical pollen redistribution substantially improved bee pollination outcomes (Figure 3a).
Table 4.
Pairwise comparisons between treatments (Bonferroni-corrected). d = Cohen’s d.
Figure 3.
Effect of pollination treatment on fruit quality parameters in the 2022 main experiment (n = 300/group). (a) Fruit weight (g), (b) seed number, and (c) soluble solids content (°Brix) for artificial pollination (AP, blue), pollen dispenser-assisted bee pollination (BTD, green), and bee-only pollination (BT, pink) at Wando and Boseong sites. Bars show group means, and error bars represent the standard error of the mean. All treatment effects within sites were significant (Bonferroni-corrected p < 0.017; see Table 4 for pairwise contrasts).
Seed number followed a pattern closely paralleling fruit weight: AP (473 ± 152 and 329 ± 172 at Wando and Boseong, respectively) > BTD (443 ± 153 and 281 ± 164) > BT (313 ± 171 and 202 ± 154), with highly significant treatment effects at both sites (Table 3, Figure 3b). SSC followed the same AP > BTD > BT ranking (Table 3). However, the absolute differences were small (AP–BT: 0.39–0.54 °Bx; Figure 3c). Fruit firmness and titratable acidity showed relatively small and inconsistent treatment differences across sites (Table 3). The dry matter content did not differ among the treatments at either site (p > 0.30). This confirmed that the pollination method affected fresh fruit composition rather than carbon partitioning.
3.2. Seed Number as a Universal Predictor of Fruit Weight
Across the pooled 2022 dataset (N = 1800), seed weight regression yielded
Weight (g) = 0.072 × Seed number + 62.87 (R2 = 0.723, N = 1800, p < 0.001)
The regression slopes were similar between sites (Wando: 0.063 g per seed; Boseong: 0.071 g per seed). This indicated that each additional seed contributed to approximately 6–7 g of fruit weight, regardless of the location. This is consistent with the established role of seeds as auxin and gibberellin sources that stimulate pericarp expansion [16,17]. The intercept of 62.87 g represents the baseline parthenocarpic fruit weight, which is consistent with values reported for other Actinidia chinensis cultivars [15].
The regression slopes did not differ significantly among the pollination treatments at each site (Table 5). At Wando, the slope estimates ranged from 0.054 (BTD) to 0.068 g per seed (BT), with AP at 0.056. At Boseong, the slope estimates ranged from 0.062 (AP and BTD) to 0.084 g per seed (BT). The 95% confidence intervals overlapped broadly at both sites. The near-parallel regression lines across treatments showed that the seed–weight relationship was the same irrespective of how pollination was achieved. A seed formed by bee visitation had the same weight-generating potential as that formed by manual pollen application (Figure 4).
Figure 4.
Seed number–fruit weight regression by pollination treatment at (a) Wando and (b) Boseong sites. Near-parallel regression lines across treatments indicate method-independence of the seed–weight relationship. Site-pooled slopes are 0.063 g/seed at Wando and 0.071 g/seed at Boseong; across-site pooled slope = 0.072 g/seed (R2 = 0.72, N = 1800; Table 5).
Table 5.
Seed–weight regression slopes: this study compared with published values.
Our slope estimates for ‘Haegeum’ of 0.063–0.071 g per seed fall within the range reported for other kiwifruit cultivars: 0.080 for ‘Hayward’ (A. deliciosa) [13], 0.065 [14], and 0.058 for ‘Hort16A’ (A. chinensis) [15] (Table 5). The consistency of this parameter across species, cultivars, and ploidy levels suggests that the seed–weight conversion ratio is a conserved trait in the genus Actinidia, with practical implications for pollination management across production systems worldwide.
3.3. Seed Number Mediates the Treatment Effect on Weight but Not on SSC
The three independent mediation estimators converge to the same conclusion (Table S1). The total partial correlation between pollination treatment and fruit weight was r = 0.386 for Wando and r = 0.343 for Boseong. After controlling for seed number, these correlations dropped to r = 0.143 and r = 0.172, yielding partial correlation mediation proportions of 63.1% and 49.8% in Wando and Boseong, respectively (Table 6). The bootstrap product-of-coefficients estimator (Table S1) yielded indirect-effect proportions of 77.4% at Wando (ab = 4.81, 95% CI: 3.99–5.67) and 70.3% at Boseong (ab = 4.36, 95% CI: 3.44–5.28). Both percentages quantify the same phenomenon under different denominators. The partial-correlation framework reports a proportional reduction in standardised association. Meanwhile, the product-of-coefficients framework reports an indirect effect as a fraction of the total unstandardised effect. Both indicate that seed number accounts for most of the treatment effect on fruit weight. The numerical gap between the two sites in the partial correlation estimate (63.1% at Wando vs. 49.8% at Boseong) was larger than that in the product-of-coefficients estimate (77.4% vs. 70.3%). This reflects the greater sensitivity of the standardised partial correlation metric to between-site differences in the residual variance rather than a difference in the mediating mechanism. At both sites and under both estimators, seed number accounted for most of the treatment effect. The high-seed stratified analysis (below) independently confirmed complete mediation at each site. Therefore, we interpreted the site difference as a modulation of a shared seed-mediated pathway. This is consistent with the substantial between-study heterogeneity captured by random-effects synthesis (I2 = 95.1%; Section 3.5), rather than as evidence of site-specific mediation mechanisms.
Table 6.
Mediation analysis of treatment effect through seed number (partial-correlation framework).
The practical importance of this mediation was confirmed by comparing fruit weights across treatments within narrow seed number ranges (Table 7; Figure 5). This stratified analysis provided model-free evidence of mediation that did not rely on parametric assumptions [5]. At Wando, when seed number was restricted to the 500–700 range, the treatment effect on fruit weight became non-significant (F = 0.34, p = 0.714): AP, BTD, and BT produced fruits of virtually identical weight (105.6, 105.0, and 104.4 g, respectively). A similar convergence was observed at Boseong in both the 300–500 m range (F = 1.14, p = 0.320) and the 500–700 m range (F = 0.68, p = 0.511; Table 7). The progressive disappearance of treatment significance from the low-seed range (p < 0.001) through the medium range (p = 0.003) to the high range (p = 0.714) highlights that seed number fully mediates the treatment–weight relationship when pollination efficiency is equalised (Figure 5).
Table 7.
Fruit weight by treatment within seed number ranges (mean ± SD, sample size in parentheses).
Figure 5.
Fruit weight by pollination treatment within stratified seed number ranges. (a) Wando and (b) Boseong. Treatment differences diminish progressively from low seed range (100–300: p < 0.001) through medium range (300–500: p = 0.003) to high range (500–700: p = 0.714), constituting model-free evidence for complete mediation of the treatment–weight relationship by seed number. p-values are from one-way ANOVA comparing AP, BTD, and BT within each seed-number stratum. Any significance markers denote among-treatment differences within that stratum, not against a single reference group. Error bars represent ± 1 SE. Numbers in parentheses indicate sample size per group. ** p < 0.01, *** p < 0.001; ns, not significant.
In contrast, the SSC showed minimal mediation by seed number. The total treatment–SSC correlation was r = 0.325 at Wando and r = 0.388 at Boseong. After controlling for seed number, partial correlations remained largely unchanged at r = 0.300 and 0.381, with mediation proportions of 7.7% and 1.7%, respectively (Table 6). For SSC, the bootstrap indirect effect was non-significant at both sites (Wando: ab = 0.002, 95% CI: −0.014 to 0.018; Boseong: ab = −0.008, 95% CI: −0.021 to 0.005). This confirmed that seed number does not mediate the treatment–SSC association. However, because AP, BTD, and BT treatments were applied to separate orchard blocks, the observed 0.4–0.6 °Brix treatment differences in SSC may reflect block-level environmental variation rather than a pollination-method effect. AP and BTD shared an identical ‘Daehong’ pollen source, so the AP–BTD SSC difference cannot be paternal in origin and most plausibly reflects block-level variation. Only the BT treatment, relying on naturally foraged pollen of mixed paternal composition, could, in principle, carry a metaxenic effect. Controlled single-pollen-source experiments within the same block are required to determine whether the residual SSC pattern represents a genuine metaxenic effect [15,19] or environmental confounding [18]. This interpretation was reinforced by the significant treatment × site interaction for SSC observed in the two-way ANOVA (F = 3.40, p = 0.033; Section 3.1), in contrast to the non-significant interaction for fruit weight (p = 0.137). This suggests that the SSC pattern was more sensitive to site-specific block conditions than to pollination method per se. The conceptual distinction between the seed-mediated weight pathway and the SSC observations is reflected in these contrasting mediation results. The convergence of the Baron–Kenny parametric mediation, model-free stratified ANOVA, and distribution-free bootstrap analysis across two independent sites provided strong triangulated evidence for the seed-mediated pathway for fruit weight and its absence for SSC.
Path coefficients were reported as standardised correlations following the Baron–Kenny [26] framework. Mediation proportion calculated as 1 − (c′/c). The bootstrap product-of-coefficients framework yielded convergent but distinct mediation percentages (77.4% for Wando and 70.3% for Boseong; Supplementary Table S1).
At SN ≥ 500, treatment differences are non-significant at both sites and direct evidence for complete mediation when seed counts are equalised.
3.4. Pollination Uniformity and Premium Fruit Probability
Beyond the mean quality, the distribution of pollination outcomes is of practical importance for commercial kiwifruit production, where fruit grading determines market value [32]. The coefficient of variation (CV) of seed number differed substantially among the treatments (Table 8 and Figure 6). At Wando, AP and BTD had comparable seed number CVs (32.1% and 34.4%, respectively). Meanwhile, BT showed higher variation (54.6%; Levene’s test, F = 3.05, p = 0.048). This pattern was amplified in Boseong, where the BT reached a CV of 76.0%.
Table 8.
Pollination uniformity and quality distribution by treatment and site.
Figure 6.
Seed number distribution by pollination treatment at (a) Wando and (b) Boseong. Violin plots show full distribution; horizontal bars indicate group means. BTD compressed the coefficient of variation (CV) of seed number to AP-comparable levels (34% vs. 32%), whereas BT exhibited higher variability (CV = 55–76%).
The difference in uniformity is directly translated into a quality distribution. In Wando, AP and BTD achieved similar premium rates (≥100 g: 48.0% and 41.0%, respectively) with zero undersized fruits (<70 g). Meanwhile, BT produced only 16.7% premium fruits with 11.0% undersized fruits (Table 8). At Boseong, where the pollination efficiency was lower, BT’s poor uniformity of BT was particularly costly: 42.0% of fruits fell below the 70 g threshold, compared with 12.0% for AP and 20.3% for BTD.
The pollen dispenser increased the mean seed count and reduced the variance of pollination outcomes across the orchard. This dual benefit, that is, raising the mean while narrowing the distribution, is particularly relevant for commercial operations. Here, the consistency of fruit size within a pack is as important as the average fruit size [13,33]. Orchards targeting minimum seed counts of 400–500 per fruit can expect a premium-grade probability of 61–78% in Wando, providing an actionable benchmark for pollination management.
3.5. Multi-Year Consistency of the AP–BTD Comparison
The AP > BTD > BT ranking observed in the main experiment was consistent with the results from earlier years at the Wando site (Table 9). In 2018, AP (93.5 ± 17.6 g) exceeded BTD (67.9 ± 17.4 g; Hedges’ g = +1.45), and a similar pattern was observed in 2019 (g = +1.72). However, the magnitude of the AP–BTD gap diminished substantially over the study period, declining to g = +0.23 at Wando and +0.40 at Boseong in the main experiment (Table 9, Figure 2). This narrowing likely reflects the progressive refinement of the BTD system over four years, including improved dispenser designs, optimised pollinator tree ratios, and better hive management [8,9].
Table 9.
Multi-year AP–BTD fruit weight comparison and effect sizes.
One exception was the 2020 experiment, in which BTD (106.0 ± 17.8 g) significantly exceeded AP (92.1 ± 18.9 g; Hedges’ g = −0.75; Figure 2). Examination of the 2020 AP data showed indicators consistent with reduced stored-pollen viability. Seed count was low (493 ± 208, vs. 762 ± 153 for BTD), titratable acidity was anomalously high (0.73 ± 0.14%), and SSC was the lowest among all six treatments (12.13 °Brix; Table 10). Suboptimal pollen viability and pollination timing have been recognised as failure modes in manual AP operations [5,34]. Rather than dismissing this result as anomalous, we interpret the 2020 reversal as evidence of execution-dependent vulnerability inherent to manual pollination systems. AP performance depends critically on pollen quality, application timing relative to stigma receptivity, and operator skill, all of which are subject to year-to-year variation.
Table 10.
Factorial decomposition of pollination components (2020, n = 50/treatment).
The random-effects meta-analytic pooled estimate across all six-year site combinations yielded a weighted Hedges’ g = +0.43 (95% CI: −0.02 to +0.89). This indicated a non-significant AP advantage at the 5% level (Table 9, Figure 2). However, heterogeneity was extreme (I2 = 95.1%, Q = 101.5, p < 0.001), indicating that the AP–BTD performance gap is not a fixed quantity but varies strongly with year, site, and system optimisation [30,35]. This context dependence has practical implications. Management recommendations should be adaptive rather than prescriptive, guided by seasonal pollination monitoring rather than fixed-method selection.
Random-effects meta-analysis (DerSimonian–Laird) across all six-year site combinations: pooled Hedges’ g = +0.43 (95% CI: −0.02 to +0.89); Q = 101.5, df = 5, p < 0.001; I2 = 95.1%; τ2 = 0.295. A positive g indicates that the AP is heavier than the BTD.
3.6. Temporal Replication and BTD Commercial Standard Achievement (2025)
The 2025 replicate experiment confirmed the convergence trend of BTD toward AP fruit weight observed across the study period. BTD (94.7 ± 15.6 g) significantly exceeded AP (91.4 ± 15.7 g) in fruit weight (Δ = −3.2 g, Hedges’ g = −0.21, 95% CI: −0.40 to −0.01, p = 0.038). Seed number was higher for BTD (1167.4 ± 185.9) than AP (1137.5 ± 204.0). However, the difference was not significant (p = 0.125), with BTD achieving the Ferguson [36] commercial standard of ≥1000 seeds per fruit in 79.0% of sampled fruits (158/200). This represents the first year in which the BTD met this commercial benchmark, showing that an optimised bee-based pollination system can achieve an AP-equivalent seed set under favourable conditions. BT achieved 889.6 ± 214.9 seeds with 30.0% meeting the commercial standard. This confirmed that the pollen dispenser remains essential for commercial-grade pollination efficiency. The overall narrowing of the AP–BTD gap is supported by the ordered sequence of annual effect sizes at Wando: Hedges’ g declined from +1.45 (2018) and +1.72 (2019), through +0.23 (2022), to −0.21 (2025) (Table 9), that is, a broad reduction in the AP advantage from its 2018–2019 peak to near-parity by 2025 across the comparable Wando years. This is an observational trend across non-identical annual designs rather than a controlled time series. The 2020 reversal (g = −0.75) reflects a distinct stored-pollen-viability failure (Section 4.5). Therefore, the trend should be read as consistent with, rather than definitive proof of, improving relative BTD performance as the system was optimised.
The 2025 results represent a statistically significant reversal of the AP–BTD ranking under the 2025 conditions. We interpret this finding with caution: the effect is small in absolute terms (Δ = −3.2 g, g = −0.21), the upper 95% CI bound (−0.01) approaches zero, and the mean seed counts of both AP (1138) and BTD (1167) fell within the saturation zone where the within-group seed–weight slope attenuates to 0.001–0.008 g per seed (next paragraph). Therefore, the 2025 reversal reinforces, rather than contradicts, the mediation conclusion. At high seed counts (SN > 1000), method differences become biologically inconsequential because both methods exceed the saturation threshold.
Within-group seed–weight regression slopes in 2025 were attenuated compared to those in 2022: AP 0.001, BTD 0.002, and BT 0.008 g per seed (all R2 < 0.02) versus 0.054–0.084 g per seed in the 2022 main experiment. This near-zero slope at high seed numbers (mean SN > 1000) suggests diminishing marginal returns of additional seeds for fruit weight in the high-fertility range. The physiological interpretation is that assimilation competition increases as more seeds develop per fruit, reducing the per-seed weight contribution. This saturation is consistent with the suppression effect observed in the mediation analysis (Section 3.3) and has implications for predictive frameworks. A linear seed–weight assumption is appropriate within the observed seed range (SN ≈ 30–880) but may overestimate fruit weight at SN > 1000. Disentangling biological saturation from year-specific climate effects would require a climate-explicit modelling approach, which was not pursued in the present study. SSC in the 2025 experiment, measured at the eating-ripe stage (mean 17.66 ± 0.80 °Brix), showed no significant treatment effect (AP 17.63, BTD 17.70, BT 17.65 °Brix; F = 0.44, p = 0.64, η2 = 0.15%). This is consistent with the minimal SSC mediation observed in the 2022 main experiment (Section 3.3).
3.7. Factorial Decomposition of Supplementary Pollination Components
The 2020 factorial experiment enabled the quantification of the marginal contribution of each pollination component through a stepwise supplementation design (Table 10, Figure 7). Starting from the control (bee only: 82.8 ± 17.5 g, 388 seeds), the addition of a pollinator tree increased fruit weight by 10.8 g (Hedges’ g = 0.74) and seed number by 274. This was the single largest individual component effect, confirming that pollen availability is the primary limiting factor for bee-mediated pollination in orchards without dedicated pollen sources [6]. Adding a pollen dispenser on top of the pollinator tree produced a further 12.4 g increase (g = 0.84, seed number +100). This demonstrated that mechanical pollen redistribution can enhance pollination efficiency beyond that achieved by natural pollen foraging alone.
Figure 7.
Stepwise additive effects of supplementary pollination components on fruit weight (2020 factorial, n = 50/treatment). Starting from bee-only control (82.8 g), sequential addition of pollinator tree (+10.8 g), pollen dispenser (+12.4 g), and manual AP (−0.6 g) indicates pollination saturation. Dashed line indicates AP-only reference (92.1 g). Error bars represent ± 1 SD.
The most practically important finding was that adding manual AP on top of the complete BTD system yielded zero marginal weight gain (−0.6 g; Hedges’ g = −0.04), despite a modest increase in seed count (+71 seeds; Table 10, Figure 7). This saturation effect indicated that the BTD system had already achieved maximum pollination efficiency, which translated into commercially relevant fruit sizes, and further pollen input via manual application was redundant. The additional seeds generated by supplementary AP, increasing the mean from 762 to 833 seeds, had no detectable effect on fruit weight. This suggests that the seed–weight relationship may approach an asymptote above approximately 750 seeds under the tested orchard conditions. Mechanistically, this asymptote is consistent with the saturation of seed-derived hormonal signalling. Once the number of viable seeds exceeds the level at which the surrounding pericarp tissue can be fully mobilised for cell expansion, additional seeds contribute to diminishing auxin and gibberellin gradients per unit of fruit tissue. Therefore, further increments in seed number no longer translate into measurable weight gain [16,17,18]. This interpretation is independently supported by the near-zero within-group seed-weight slopes observed in the high-seed 2025 replication (0.001–0.008 g per seed; Section 3.6). This places the inflexion of the seed-weight curve near the seed counts reached by the optimised BTD system.
AP alone (92.1 g, 493 seeds) was significantly inferior to that of the BTD system (106.0 g, 762 seeds; Table 10). This shows that optimised bee-based systems can match or exceed manual pollination when supplementary components are properly deployed [7,9]. The factorial structure further indicated that the BT + pollinizer + AP treatment (98.6 g) fell between BTD and AP alone. This suggests that the dispenser was more effective at spatially distributing pollen across the orchard canopy than manual spraying [8].
Key contrast: BTD + AP (Trt 5) yielded no gain over BTD alone (Trt 4), indicating pollination saturation. Wt, fruit weight; SN, seed number; SSC, soluble solids content; Acid, titratable acidity (% citric acid); ΔWt, marginal weight gain over the preceding step; Hedges’ g, standardised effect size vs. the preceding step.
3.8. Economic Context (Background)
The following economic figures are not derived from the present study’s primary data. They are drawn entirely from published extension-service estimates [22,23] and are provided solely as a background context for interpreting biological results. Accordingly, they should be interpreted as indicative rather than quantitative outcomes of this work. Based on field trial data from Jeollanam-do, the BTD system generated an estimated net benefit of approximately 3.17 million KRW (USD 2350) per 1000 m2, relative to AP (Table 2). This net benefit comprises eliminated AP labour costs (955,000 KRW) and increased yield revenue of approximately 1.98 million KRW. However, this was partially offset by additional costs for hive rental (80,000 KRW), pollinator tree establishment (200,000 KRW one-time), and supplementary pollen for the dispenser (111,000 KRW).
The labour dimension is particularly important in the Korean context. Manual AP requires approximately 15–20 person-h per hectare during a narrow 3–5 d flowering window. This represents one of the largest single labour inputs in the annual production cycle [20]. With the average kiwifruit farmer age exceeding 60 years and a declining rural workforce [21], the labour dependency of AP is becoming increasingly unsustainable. Once established, BTD systems require minimal additional labour beyond routine hive management, effectively decoupling pollination success from labour availability. Even the simpler BT system generated a substantial net benefit of 2.41 million KRW per 1000 m2 (Table 2). However, these are published independent estimates rather than primary economic data from this study. Formal cost–benefit analysis with sensitivity modelling would strengthen these preliminary assessments.
4. Discussion
4.1. The Seed–Weight Relationship: A Universal, Method-Independent Pathway
The central finding was that seed number mediates 50–63% (partial correlation) to 70–77% (product of coefficients) of the pollination treatment effect on fruit weight in gold kiwifruit. When the seed number is equalised, treatment differences in weight become non-significant. This result has a clear physiological basis: kiwifruit seeds act as localised sources of auxins and gibberellins, which stimulate pericarp cell division and expansion in an additive manner [16,17]. Each additional seed contributed approximately 6–7 g to the fruit weight, with no evidence of saturation within the observed range of approximately 30–880 seeds. The consistency of this linear relationship across both sites, all three treatments, and multiple years shows that the mechanism by which pollen reaches the stigma is irrelevant to fruit development once fertilisation has occurred.
The seed–weight slopes for ‘Haegeum’ (0.063–0.071 g per seed; Table 5) fall within the range reported across species and ploidy levels (0.058–0.080) [5,13,14,15], suggesting a conserved trait in the genus Actinidia. This conservation has a key practical implication: the seed–weight relationship can form a universal currency for evaluating pollination systems across cultivars and production regions.
What is novel in our findings is the demonstration of method independence through parametric mediation analysis and model-free stratified comparisons. Previous studies compared pollination methods but did not formally test whether the treatment effect persisted after controlling for seed number [5,6]. The stratified analysis within seed number ranges (Table 7, Figure 5) provides particularly compelling evidence. The progressive disappearance of treatment significance from the low range (p < 0.001) through the medium range (p = 0.003) to the high range (p = 0.714) constituted a dose–response pattern for mediation strength. This convergence occurred independently at both sites, ruling out site-specific artefacts.
The key implication is that the often-reported superiority of AP over bee pollination in fruit size [5,6,10,37] is not an intrinsic advantage of the manual method but rather a consequence of higher pollination efficiency. AP delivers more pollen more uniformly to more flowers, resulting in more seeds. This reframing shifts the management question from which method is best to how each method can be optimised to maximise seed set. The question was addressed by factorial decomposition in Section 3.7.
4.2. An Observation on Soluble Solids Content
In contrast to the clear seed-mediated pathway for fruit weight, SSC showed minimal mediation by seed number (<8%; Table 6). The inclusion of SSC as a contrasting response variable strengthens the specificity of the mediation finding. Had SSC also been fully mediated by seed number, the result would have been less informative about the pathway architecture. Treatment differences in SSC persisted, including when seed counts were matched in the 300–500 range (AP: 8.84 vs. BT: 8.43 °Brix at Wando), suggesting that SSC may respond to factors beyond simple seed set. Several mechanisms are plausible, including metaxenic effects, whereby the pollen parent genotype influences flesh biochemistry [15,19,38], differential pollination timing creating variations in fruit maturity at harvest [5], and source–sink differences at the whole-plant level between bee-excluded AP blocks and bee-accessible BTD/BT blocks [18].
However, these observations should be interpreted with caution. Our experimental design applied pollination treatments to separate orchard blocks with AP and BTD sharing an identical ‘Daehong’ pollen source. This meant that any AP–BTD difference is non-paternal. The 0.4–0.6 °Brix between-treatment difference falls within a range that could plausibly be generated by block-level environmental variation alone. The consistency of the pattern across two independent sites provides partial evidence against site-specific confounding but does not rule out differences inherent to the bee-excluded block design. Controlled experiments using defined pollen genotype crosses applied to emasculated flowers within the same block, combined with metabolomic profiling, are required to determine whether the observed SSC pattern reflects a genuine metaxenic effect or environmental confounding factors. Pending such evidence, the SSC observation is presented as a hypothesis-generating finding rather than as a confirmed pathway (Figure 8).
Figure 8.
Conceptual dual-pathway model linking pollination method to fruit quality outcomes. Blue solid pathway (confirmed): seed number mediates 50–63% of the treatment effect on fruit weight in the partial-correlation framework (Table 6), and 70–77% in the bootstrap product-of-coefficients framework (Table S1); the indirect effect is bootstrap-significant at both sites. Red dashed pathway (observed; requires confirmation): the treatment–SSC association is mediated by seed number to a smaller extent (≤8%). The residual direct association may reflect block-level environmental confounding rather than a method-intrinsic effect.
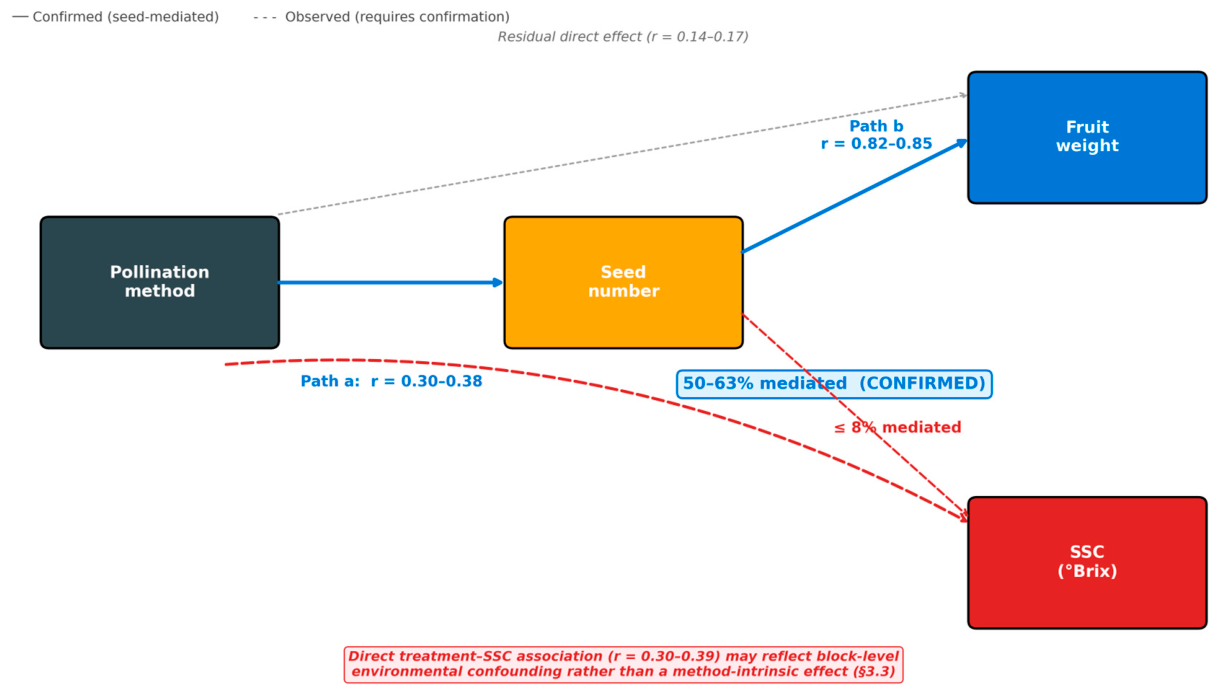
A methodological note on SSC measurements is warranted. The 2022 main experiment, conducted in collaboration with the Jeollanam-do Fruit Research Institute, measured SSC at harvest (mean 8.6 °Brix) before postharvest starch-to-sugar conversion. All the other experimental years (2018–2020, 2025) followed our standard protocol, in which SSC was measured at the eating-ripe stage after cold storage and room-temperature ripening (mean, 14–18 °Brix) [32]. The 2025 experiment confirmed that SSC remained independent of pollination treatment at the eating-ripe stage (η2 = 0.15%; Section 3.6), ruling out the possibility that the 2022 finding was an artefact of early measurement timing. The broader implication is that pollination methods affect fruit quality through the seed-mediated weight pathway (50–63% mediation by partial-correlation framework; 70–77% by product-of-coefficients bootstrap framework; Table 6 and Table S1), but not through the SSC pathway.
4.3. Pollen Dispenser-Assisted Bee Pollination as a Practical Alternative to Manual AP
Pollen dispensers are the most effective single components for enhancing bee-mediated pollination. In the main experiment, BTD achieved 94–97% of AP fruit weight, with residual differences of 2.5–5.1 g (Cohen’s d = 0.23–0.40; Table 4). However, the practical significance of these differences remains debatable. In commercial packing operations, individual fruit weight classes are defined in 10–20 g increments [32], making a 2.5 g average difference virtually invisible in terms of grade distribution. The within-treatment variability (SD = 10.8 g for both AP and BTD at Wando) far exceeded the between-treatment difference, indicating a substantial distributional overlap.
The 2020 factorial experiment provides a mechanistic explanation for why BTD approaches AP-level performance. The pollen dispenser contributed the largest marginal weight gain (+12.4 g; Hedges’ g = 0.84), exceeding the pollinator tree effect (+10.8 g; Table 10, Figure 7). The critical finding was the zero marginal return from adding manual AP to an optimised BTD system (−0.6 g; g = −0.04). This saturation effect shows that the BTD system had already achieved the maximum biologically attainable pollination efficiency under the tested conditions and that further pollen input was redundant [7]. The practical implication is immediate: labour investment in manual pollination yields no measurable quality benefit when a well-optimised BTD system is in place.
This economic case reinforces these biological findings. Published estimates indicate a BTD net benefit of approximately USD 2350 per 1000 m2 relative to AP (Table 2) [22,23], primarily through eliminated labour costs. With Korea’s ageing farming population and declining rural workforce [21], decoupling pollination success from labour availability through BTD adoption addresses structural constraints in the Korean kiwifruit industry.
4.4. Pollination Uniformity: The Overlooked Dimension
Most prior pollination studies have focused on mean quality. However, the commercial kiwifruit value depends heavily on fruit size uniformity within a pack [32,33]. Our analysis showed a previously underappreciated function of the pollen dispenser as a variance-reduction device. At Wando, BT had a seed number CV of 54.6%, translating to 16.7% premium-grade fruits (≥100 g). BTD reduced the CV to 34.4%, comparable to AP (32.1%), raising the premium rate to 41.0% with zero undersized fruits (Table 8, Figure 6). This compression of the distribution is likely more valuable than a small increase in the mean, because pack-out efficiency is determined by the proportion of fruits within the target size range. This is consistent with cultivar-specific premium-fruit criteria established for bee-pollinated ‘Haegeum’ [39].
The dispenser is likely to achieve uniformity improvement through two complementary mechanisms. It supplements the natural pollen load on the bee bodies, ensuring that even bees that have depleted their pollen through multiple flower visits deliver sufficient pollen [4]. It provides a continuous, spatially distributed pollen source within the orchard, reducing dependence on pollinator trees that may flower asynchronously with the main cultivar [6]. These mechanisms reduce the probability of an individual flower receiving inadequate pollination, thus narrowing the seed number distribution. Seed number threshold analysis suggests that orchards targeting a minimum of 400–500 seeds per fruit can expect a 61–78% premium probability in Wando, providing an actionable management benchmark.
4.5. Context-Dependence and the 2020 Reversal
The meta-analytic synthesis indicated extreme heterogeneity in the AP–BTD effect size (I2 = 95.1%; Figure 2), demonstrating that the AP–BTD performance gap is not a fixed quantity but varies strongly with year, site, and system optimisation [35]. This heterogeneity is an important finding, as it invalidates universal method recommendations and supports adaptive season-specific pollination management.
The 2020 reversal (BTD > AP by 13.9 g; Hedges’ g = −0.75) warrants attention. Examination of the AP treatment data showed indicators consistent with reduced stored-pollen viability: low seed count (493 vs. 762 for BTD), high titratable acidity (0.73%), and the lowest SSC among all six treatments (12.13 °Brix; Table 10). These indicators are consistent with the recognised failure modes of manual AP, including pollen viability degradation during storage and suboptimal application timing relative to stigma receptivity [5,34]. We term this phenomenon the ‘frozen pollen paradox’. AP was formally executed, but the stored pollen’s reduced viability severely limited its effectiveness, yielding outcomes inferior to the bee-based alternative. The paradox reflects that AP performance is contingent on pollen quality, which degrades with storage duration [40], with viability below 50% after 12 months at −20 °C. This suggests that bloom-period climate conditions affect pollen germination, and bee foraging warrants treatment as an independent predictor of fruit weight in future predictive frameworks. AP performance depends on pollen quality, application timing, and operator skill, all of which vary seasonally. BTD systems, by contrast, BTD systems benefit from the innate ability of bees to adjust their foraging to flower receptivity and weather conditions, thus conferring greater operational robustness across variable conditions [3,4]. This finding parallels reports from New Zealand, where optimised bee pollination systems matched or exceeded AP under favourable weather conditions [9].
The progressive narrowing of the AP–BTD gap from 2018 (g = +1.45) to 2022 (g = +0.23) also merits further discussion. This trend likely reflects the progressive refinement of the BTD system over four years, including improved dispenser designs, optimised pollinator tree ratios, and better hive management [8]. This implies that the residual AP–BTD gap reported here may represent an upper bound that could be narrowed further with continued optimisation.
4.6. Implications for Predictive Frameworks
These findings have implications for predictive frameworks that link pollination efficiency with fruit quality outcomes. The seed-mediated pathway confirmed here (50–63% mediation by partial-correlation framework; 70–77% by bootstrap product-of-coefficients; Table 6 and Table S1) and the seed–weight slopes (0.063–0.072 g per seed; Table 5) provide an empirical foundation for future cascade prediction models to translate pollination indices into fruit weight outcomes. The minimal SSC mediation by seed number (<8%) is likewise consistent with treating SSC as a separately driven variable, supporting an architectural separation of quantitative (seed → weight) and qualitative (climate → Brix) pathways in such frameworks.
4.7. Limitations
This study had several limitations. First, the mediation analysis is observational. While the stratified comparison provides model-free evidence for complete mediation of the treatment–weight relationship (Table 7), formal causal inference would require experimental manipulation of seed number, for example, manual seed removal, or structural equation modelling with bootstrapped indirect effects [27]. However, the stratified ANOVA, which provides distribution-free, assumption-agnostic evidence by comparing the fruits of matched seed counts, complements the parametric mediation approach and yields convergent conclusions at both independent sites. The strong physiological plausibility of the seed → auxin/gibberellin → pericarp expansion mechanism [16] further supports the mediation interpretation. However, statistical evidence alone does not exclude confounding by unmeasured variables such as within-canopy fruit position or localised crop load. Because the fruits were harvested and pooled at the treatment level, vine-level identifiers were not retained. Therefore, individual fruits could not be treated as strictly independent biological replicates. To assess whether non-independence could affect the conclusions, we conducted a sensitivity analysis (Supplementary Method S1) in which fruits were assigned to hypothetical vine clusters. The treatment test was re-evaluated using cluster-robust standard errors, a variance-inflation simulation with an intra-class correlation of up to 0.5, and a vine-level cluster bootstrap. Across all assumptions, the global treatment effect remained highly significant (p < 1 × 10⁻⁵), the seed-weight slope was unchanged (bootstrap mean 0.072, 95% CI 0.069–0.075), and the high-seed complete-mediation result (Wando, 500–700 seeds; p = 0.71) was preserved. This indicates that the reported conclusions are robust to plausible within-vine clustering.
Second, SSC observations are based on a design in which pollination methods are applied to separate blocks and are not randomised within blocks. Block-level environmental differences may contribute to the observed 0.4–0.6 °Brix treatment differences. AP and BTD shared an identical ‘Daehong’ pollen source, so the AP–BTD SSC difference cannot reflect a paternal (metaxenic) effect. Only BT, which relied on naturally foraged pollen of mixed paternal composition, could, in principle, carry such an effect. A controlled single-pollen-source, within-block design is required to separate any residual metaxenic contribution from environmental confounding factors for BT comparison. Third, absolute SSC values differed between the supporting experiments (14–16 °Bx after extended storage) and the main experiment (8–9 °Bx at harvest), precluding cross-year SSC comparison. Future studies should standardise SSC measurements at a defined post-harvest stage.
Fourth, the multi-year component used heterogeneous designs (n = 40–300 per treatment, 1–2 sites, 3–6 treatments). The resulting I2 value of 95.1% indicates that the pooled effect size should be interpreted cautiously. Fifth, this study was conducted exclusively on the ‘Haegeum’ cultivar in southern Korea. Whether the seed–weight parameters extend to other gold kiwifruit cultivars, for example, ‘Sungold’/G3, or green kiwifruit (‘Hayward’) remains to be tested, though the consistency with published slopes (Table 5) suggests broad generalisability. Sixth, the economic analysis is based on extension service estimates rather than primary data. Formal cost–benefit analysis with sensitivity modelling strengthens economic recommendations.
5. Conclusions
This multi-year (2018–2025), multi-site study of pollination methods in gold kiwifruit, which encompassed 2940 individually assessed fruits, yielded six principal conclusions.
First, within the calibration seed-number range (100–700), fruit weight is determined by seed number through a method-independent linear relationship (0.063–0.072 g per seed, R2 = 0.68–0.72), with diminishing returns above 1000 seeds documented in the 2025 replication. When the seed number was equalised across treatments within the calibration range, the fruits produced by AP, BTD, and BT were statistically indistinguishable in weight. The apparent superiority of AP in producing heavier fruits is a consequence of its higher pollination efficiency and is not an intrinsic advantage of manual pollen application.
Second, BTD achieved 94–97% AP fruit weight and comparable pollination uniformity (seed CV 32–34% vs. 55% for BT), with zero marginal weight gain from adding manual AP to an optimised BTD system. The pollen dispenser functions as both a mean-raising and variance-reducing device, thereby providing dual commercial benefits.
Third, the AP–BTD performance gap is highly context-dependent (I2 = 95%), with evidence that the gap narrows as BTD systems are refined and that AP is vulnerable to execution failures in suboptimal years. Pollination management decisions should be adaptive and guided by seasonal monitoring, with a seed number target of ≥400–500 per fruit associated with a 61–78% premium probability.
Fourth, SSC may respond to pollination-associated factors through a pathway largely independent of seed number (mediation < 8%). However, this observation cannot be attributed to a specific mechanism based on the present design. Controlled pollen source experiments are required to determine whether the pattern reflects a genuine metaxenic effect, plausible only for BT, or block-level environmental confounding factors.
Fifth, published economic estimates indicate that BTD generates a net benefit of approximately 3.17 million KRW (USD 2350) per 1000 m2 relative to AP under Korean production conditions, primarily through labour savings [22,23]. This economic advantage, combined with the chronic labour shortage in rural Korean agriculture, supports the transition from labour-intensive manual pollination to optimised bee-based systems.
Sixth, the 2025 replication demonstrated that BTD could achieve the Ferguson [36] commercial standard of ≥1000 seeds per fruit in 79.0% of sampled fruits (mean SN = 1167.4 ± 185.9), matching AP-level seed set for the first time and significantly exceeding AP fruit weight (94.7 vs. 91.4 g, p = 0.038). Concurrently, the near-zero within-group seed weight slope at SN > 1000 shows diminishing marginal returns. This indicates that seed number maximisation does not translate proportionally into weight gain above the commercial threshold. These findings identify seed set as the dominant developmental pathway connecting any pollination intervention to fruit weight in gold kiwifruit, and bind this relationship by a saturation regime above approximately 1000 seeds per fruit. Reframing pollination system evaluation around the pollen deposition-to-seed set conversion provides a transferable currency for comparing methods across cultivars, sites, and seasons. It also supports the practical shift toward efficiency-focused, integrated pollination management, in which the objective is to maximise and homogenise the seed set through the most resource-efficient combination of available tools.
Supplementary Materials
The following supporting information can be downloaded at: https://www.mdpi.com/article/10.3390/horticulturae12060739/s1, Supplementary Methods S1. Pseudoreplication/non-independence sensitivity analysis. Table S1. Bootstrap mediation analysis results (10,000 resamples) using unstandardized regression coefficients and the product-of-coefficients estimator. Table S2. Sensitivity of the fruit-weight treatment effect to assumed within-vine clustering (2022 main experiment, N = 1800). Figure S1. Bootstrap distribution of the indirect effect (a × b) for fruit weight (top row) and SSC (bottom row) at Wando (left) and Boseong (right).
Author Contributions
Conceptualization, S.-H.M. and K.-Y.L.; methodology, S.-H.M.; software, S.-H.M.; validation, S.-H.M., S.L., and Y.-B.L.; formal analysis, S.-H.M.; investigation, S.-H.M. and S.L.; resources, Y.-B.L. and K.-Y.L.; data curation, S.-H.M.; writing—original draft preparation, S.-H.M.; writing—review and editing, K.-Y.L.; visualisation, S.-H.M.; supervision, Y.-B.L. and K.-Y.L.; project administration, Y.-B.L. and K.-Y.L.; funding acquisition, K.-Y.L. All authors have read and agreed to the published version of the manuscript.
Funding
This research was supported by the Cooperative Research Program for Agriculture Science and Technology Development (Project No. PJ015878) of the Rural Development Administration, Republic of Korea.
Institutional Review Board Statement
Not applicable. This study only involved field measurements of cultivated plants and managed honeybee colonies; no vertebrate animals or human subjects were involved.
Data Availability Statement
Restrictions apply to the public availability of individual-fruit raw data, which were collected as part of the Rural Development Administration’s research program (RDA Project PJ015878) and are held under the data management policy of the National Institute of Agricultural Science (NIAS). Group-level summary statistics (means, standard deviations, ANOVA tables, regression coefficients, mediation coefficients) are fully reported in Table 3, Table 4, Table 5, Table 6, Table 7, Table 8, Table 9, Table 10 and Table 2 and Supplementary Table S1 of this manuscript. The complete reproducibility package, comprising all four individual-fruit datasets (N = 2940), the analysis code, a reference output file, and detailed documentation, has been deposited on Zenodo under Restricted Access with a permanent DOI: https://doi.org/10.5281/zenodo.20544882. The deposit includes a single Python script (Ch2_Analysis.py) that reproduces all manuscript Table 3, Table 4, Table 5, Table 6, Table 7, Table 8, Table 9, Table 10 and Table 2 and Table S1 and Figure 3, Figure 4, Figure 5, Figure 6, Figure 2, Figure 7 and Figure 8 and Figure S1, with 89 numerical checks against a supplied reference output. During peer review, anonymous access is provided to reviewers through a time-limited secret-link URL transmitted via the journal submission system, preserving reviewer anonymity. Upon acceptance, the authors will consult with NIAS regarding the possibility of moving this record to Public/Open Access. For all other inquiries, contact the corresponding author (ultrataro@korea.kr). The authors thank the Wando and Boseong kiwifruit orchard cooperatives for field access and the Korea Meteorological Administration for providing the climate datasets. During the preparation of this manuscript, the authors used Anthropic Claude code for language editing of author-written English drafts, writing of the Python (matplotlib) plotting code used to render the figures from the authors’ own measured data. No generative-image model was used to synthesise any figure, and all data analysis, scientific content, and interpretation were performed independently by the authors. The authors reviewed and edited the manuscript and take full responsibility for its content. The tool was not used for data analysis, the generation of scientific content, or the generation of figures. All statistical analyses, results, interpretations, conclusions, and figures were produced independently by the authors, as described in Section 2.4.
Conflicts of Interest
The authors declare no conflicts of interest. The funders had no role in the study design; collection, analyses, or interpretation of data; writing of the manuscript; or decision to publish the results.
References
- Richardson, A.C.; Boldingh, H.L.; McAtee, P.A.; Gunaseelan, K.; Luo, Z.; Atkinson, R.G.; Dayatilake, G.A.; Macrae, E.A.; Schaffer, R.J. Fruit development of the diploid kiwifruit, Actinidia chinensis ‘Hort16A’. BMC Plant Biol. 2011, 11, 182. [Google Scholar] [CrossRef] [Scilit]
- Ferguson, A.R. Kiwifruit in the world—2014. Acta Hortic. 2015, 1096, 33–46. [Google Scholar] [CrossRef] [Scilit]
- Craig, J.L.; Stewart, A.M.; Pomeroy, N.; Heath, A.C.G.; Goodwin, R.M. A review of kiwifruit pollination: Where to next? N. Z. J. Exp. Agric. 1988, 16, 385–399. [Google Scholar] [CrossRef] [Scilit]
- Goodwin, R.M. Pollination of Crops in Australia and New Zealand; Rural Industries Research and Development Corporation: Canberra, Australia, 2012. [Google Scholar]
- Gonzalez, M.V.; Coque, M.; Herrero, M. Influence of pollination systems on fruit set and fruit quality in kiwifruit (Actinidia deliciosa). Ann. Appl. Biol. 1998, 132, 349–355. [Google Scholar] [CrossRef] [Scilit]
- Howpage, D.; Spooner-Hart, R.N.; Vithanage, V. Influence of honey bee (Apis mellifera) on kiwifruit pollination and fruit quality under Australian conditions. N. Z. J. Crop Hortic. Sci. 2001, 29, 51–59. [Google Scholar] [CrossRef] [Scilit]
- Pomeroy, N.; Fisher, R.M. Pollination of kiwifruit (Actinidia deliciosa) by bumble bees (Bombus terrestris): Bee density and patterns of flower visitation. N. Z. J. Crop Hortic. Sci. 2002, 30, 169–176. [Google Scholar] [CrossRef] [Scilit]
- Tacconi, G.; Michelotti, V.; Cacioppo, O.; Vittone, G. Kiwifruit pollination: The interaction between pollen quality, pollination systems and flowering stage. J. Berry Res. 2016, 6, 417–426. [Google Scholar] [CrossRef] [Scilit]
- Goodwin, R.M.; McBrydie, H.M.; Taylor, M.A. Wind and honey bee pollination of kiwifruit (Actinidia chinensis ‘Hort16A’). N. Z. J. Bot. 2013, 51, 229–240. [Google Scholar] [CrossRef] [Scilit]
- Abbate, A.P.; Campbell, J.W.; Williams, G.R. Artificial pollination of kiwifruit (Actinidia chinensis Planch. var. chinensis) results in greater fruit set compared to flowers pollinated by managed bees (Apis mellifera and Bombus impatiens). J. Econ. Entomol. 2023, 116, 674–685. [Google Scholar] [CrossRef] [Scilit] [PubMed]
- Sáez, A.; Negri, P.; Viel, M.; Aizen, M.A. Pollination efficiency of artificial and bee pollination practices in kiwifruit. Sci. Hortic. 2019, 246, 1017–1021. [Google Scholar] [CrossRef] [Scilit]
- Broussard, M.A.; Mas, F.; Howlett, B.; Pattemore, D.; Joshi, N.K. Pollination requirements of kiwifruit (Actinidia chinensis var. deliciosa) differ between cultivars. N. Z. J. Crop Hortic. Sci. 2021, 49, 337–360. [Google Scholar] [CrossRef] [Scilit]
- Pyke, N.B.; Alspach, P.A. Inter-relationships of fruit weight, seed number and seed weight in kiwifruit. N. Z. J. Agric. Res. 1986, 20, 153–156. [Google Scholar]
- Woolley, D.J.; Lawes, G.S.; Cruz-Castillo, J.G. The growth and competitive ability of Actinidia deliciosa ‘Hayward’ fruit: Carbohydrate availability and response to the cytokinin-active substance CPPU. Acta Hortic. 1992, 297, 467–473. [Google Scholar] [CrossRef] [Scilit]
- Seal, A.G.; Dunn, J.K.; Jia, Y. Pollen parent effects on fruit attributes of diploid Actinidia chinensis ‘Hort16A’ kiwifruit. N. Z. J. Crop. Hortic. Sci. 2013, 41, 219–229. [Google Scholar] [CrossRef] [Scilit]
- Hopping, M.E. Effect of exogenous auxins, gibberellins, and cytokinins on fruit development in Chinese gooseberry (Actinidia chinensis Planch.). N. Z. J. Bot. 1976, 14, 69–75. [Google Scholar] [CrossRef] [Scilit]
- Lai, R.; Woolley, D.J.; Lawes, G.S. The effect of inter-fruit competition, type of fruiting lateral and time of anthesis on the fruit growth of kiwifruit (Actinidia deliciosa). J. Hortic. Sci. 1990, 65, 87–96. [Google Scholar] [CrossRef] [Scilit]
- Nardozza, S.; Boldingh, H.L.; Kashuba, M.P.; Feil, R.; Jones, D.; Thrimawithana, A.H.; Ireland, H.S.; Philippe, M.; Wohlers, M.W.; McGhie, T.K.; et al. Carbon starvation reduces carbohydrate and anthocyanin accumulation in red-fleshed fruit via trehalose 6-phosphate and MYB27. Plant Cell Environ. 2020, 43, 819–835. [Google Scholar] [CrossRef] [Scilit] [PubMed]
- Seal, A.G.; Dunn, J.K.; De Silva, H.N.; McGhie, T.K. Choice of pollen parent affects red flesh colour in seedlings of diploid Actinidia chinensis (kiwifruit). N. Z. J. Crop Hortic. Sci. 2013, 41, 207–218. [Google Scholar] [CrossRef] [Scilit]
- Lee, K.Y.; Cho, H.; Yoon, H.J.; Lee, S.; Ko, H. Comparison of the foraging activity and pollination effects of honeybees (Apis mellifera L.) and bumblebees (Bombus terrestris L.) in gold kiwi (Actinidia chinensis P. ‘Haegeum’). J. Apic. 2019, 34, 295–304. [Google Scholar] [CrossRef] [Scilit]
- Korea Rural Economic Institute. Agricultural Labor Market Trends and Outlook; KREI: Naju, Republic of Korea, 2022. (In Korean) [Google Scholar]
- National Institute of Horticultural and Herbal Science. Kiwifruit Cultivation Manual, Revised ed.; NIHHS: Wanju, Republic of Korea, 2018. (In Korean) [Google Scholar]
- Lee, K.Y. Utilization of Honeybees for Pollination of Open-Field Gold Kiwifruit; Agricultural Technology Information, National Institute of Agricultural Sciences: Wanju, Republic of Korea, 2021. (In Korean) [Google Scholar]
- Korea Meteorological Administration. Climate Normals of Korea (1991–2020); KMA: Seoul, Republic of Korea, 2023. (In Korean)
- Cohen, J. Statistical Power Analysis for the Behavioral Sciences, 2nd ed.; Lawrence Erlbaum Associates: Hillsdale, NJ, USA, 1988. [Google Scholar]
- Baron, R.M.; Kenny, D.A. The moderator–mediator variable distinction in social psychological research: Conceptual, strategic, and statistical considerations. J. Pers. Soc. Psychol. 1986, 51, 1173–1182. [Google Scholar] [CrossRef]
- Preacher, K.J.; Hayes, A.F. Asymptotic and resampling strategies for assessing and comparing indirect effects in multiple mediator models. Behav. Res. Methods 2008, 40, 879–891. [Google Scholar] [CrossRef] [Scilit] [PubMed]
- Efron, B. Better bootstrap confidence intervals. J. Am. Stat. Assoc. 1987, 82, 171–185. [Google Scholar] [CrossRef]
- Hedges, L.V. Distribution theory for Glass’s estimator of effect size and related estimators. J. Educ. Stat. 1981, 6, 107–128. [Google Scholar] [CrossRef] [Scilit]
- DerSimonian, R.; Laird, N. Meta-analysis in clinical trials. Control. Clin. Trials 1986, 7, 177–188. [Google Scholar] [CrossRef] [Scilit]
- Higgins, J.P.T.; Thompson, S.G.; Deeks, J.J.; Altman, D.G. Measuring inconsistency in meta-analyses. BMJ 2003, 327, 557–560. [Google Scholar] [CrossRef] [Scilit]
- Burdon, J.; McLeod, D.; Lallu, N.; Gamble, J.; Petley, M.; Gunson, A. Consumer evaluation of ‘Hayward’ kiwifruit of different at-harvest dry matter contents. Postharvest Biol. Technol. 2002, 25, 245–255. [Google Scholar] [CrossRef] [Scilit]
- Patterson, K.J.; Burdon, J.N.; Lallu, N. Kiwifruit: Orchard management. In Encyclopedia of Plant and Crop Science; Goodman, R.M., Ed.; Marcel Dekker: New York, NY, USA, 2004; pp. 639–642. [Google Scholar]
- Vaissière, B.E.; Freitas, B.M.; Gemmill-Herren, B. Protocol to Detect and Assess Pollination Deficits in Crops: A Handbook for Its Use; Food and Agriculture Organization of the United Nations: Rome, Italy, 1996. [Google Scholar]
- Borenstein, M.; Hedges, L.V.; Higgins, J.P.T.; Rothstein, H.R. Introduction to Meta-Analysis; Wiley: Chichester, UK, 2009. [Google Scholar] [CrossRef] [Scilit]
- Ferguson, A.R. Kiwifruit: A botanical review. In Horticultural Reviews; AVI Publishing Company: Westport, CT, USA, 1984; Volume 6, pp. 1–64. [Google Scholar] [CrossRef] [Scilit]
- Abbate, A.P.; Campbell, J.W.; Vinson, E.L.; Williams, G.R. The pollination and fruit quality of two kiwifruit cultivars (Actinidia chinensis var. chinensis ‘AU Golden Sunshine’ and ‘AU Gulf Coast Gold’) (Ericales: Actinidiaceae) grown in the southeastern United States. J. Econ. Entomol. 2021, 114, 1234–1241. [Google Scholar] [CrossRef] [Scilit]
- Denney, J.O. Xenia includes metaxenia. HortScience 1992, 27, 722–728. [Google Scholar] [CrossRef] [Scilit]
- Lee, S.M. Optimal Flower Bud Number for Premium Fruit Production in Bee-Pollinated Gold Kiwifruit ‘Haegeum’; Jeollanamdo Agricultural Research and Extension Service: Naju, Republic of Korea, 2022; (In Korean with English abstract). [Google Scholar]
- Borghezan, M.; Clauman, A.D.; Steinmacher, D.A.; Guerra, M.P.; Orth, A.I. In vitro viability and preservation of pollen grain of kiwi (Actinidia chinensis var. deliciosa (A. Chev.) A. Chev). Crop. Breed. Appl. Biotechnol. 2011, 11, 338–344. [Google Scholar] [CrossRef] [Scilit]
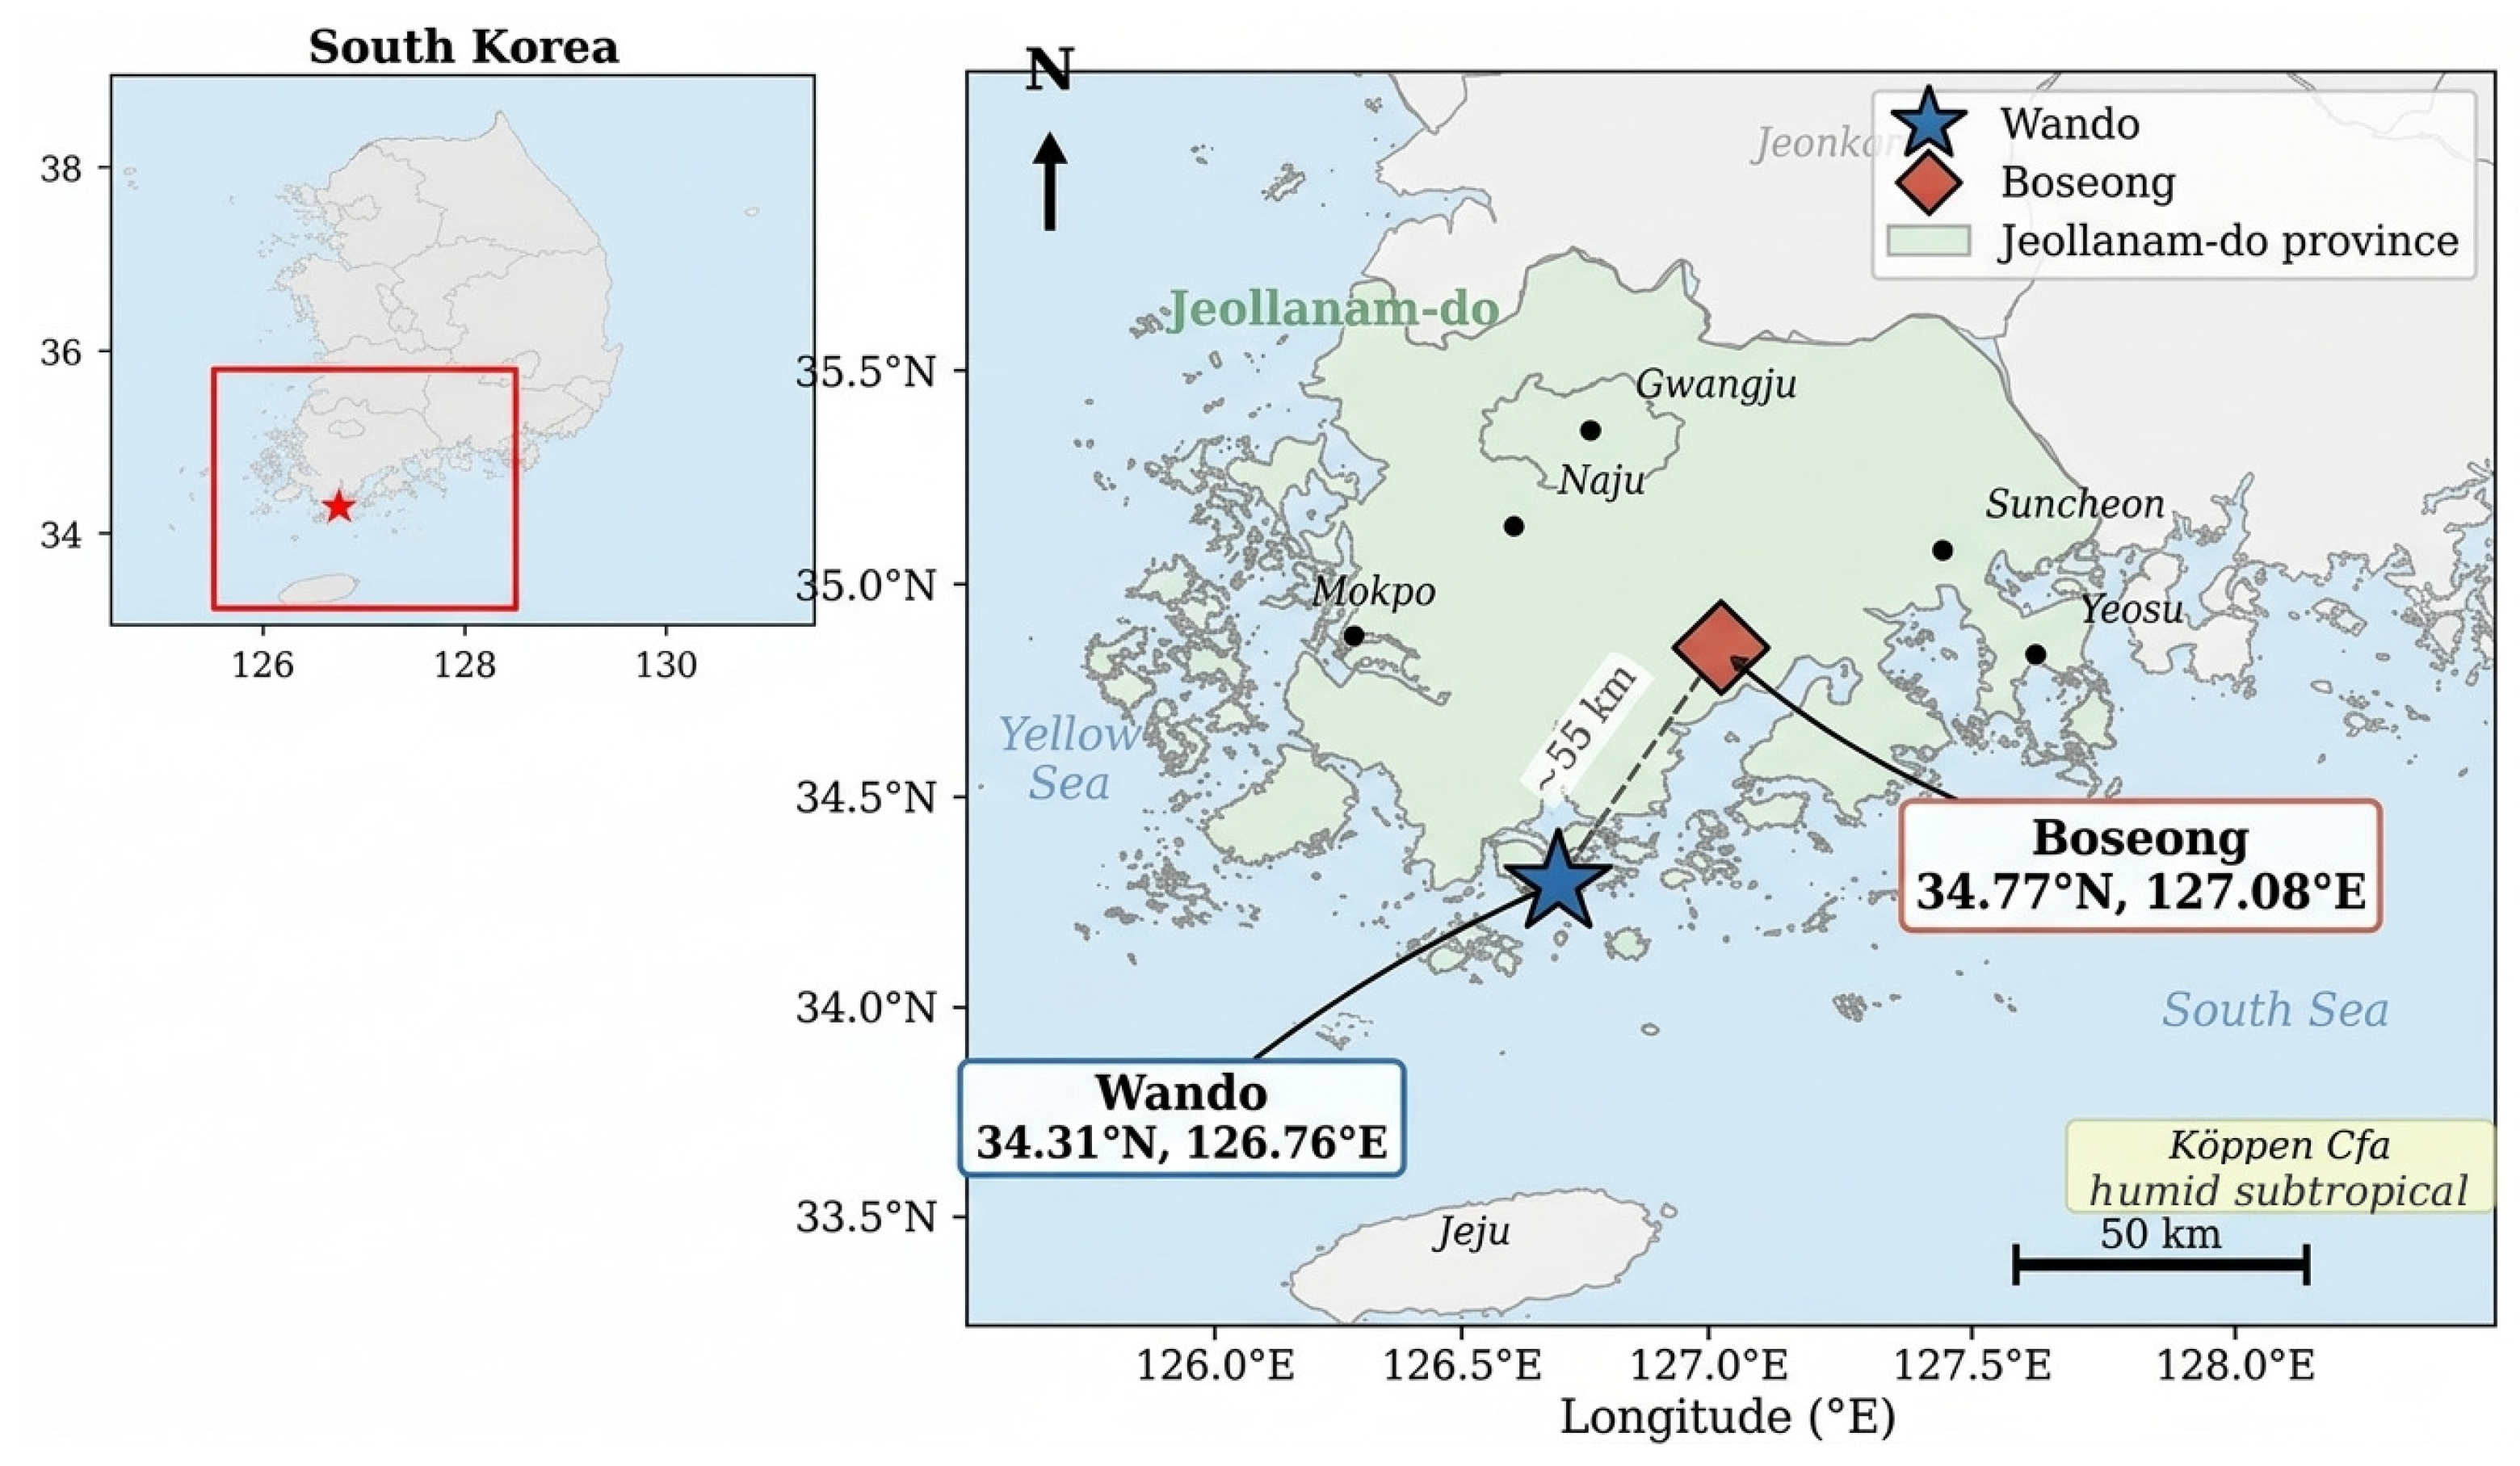
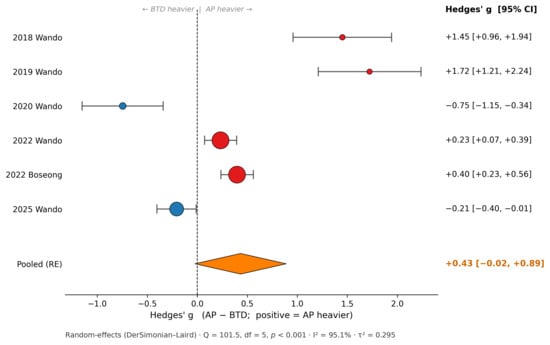
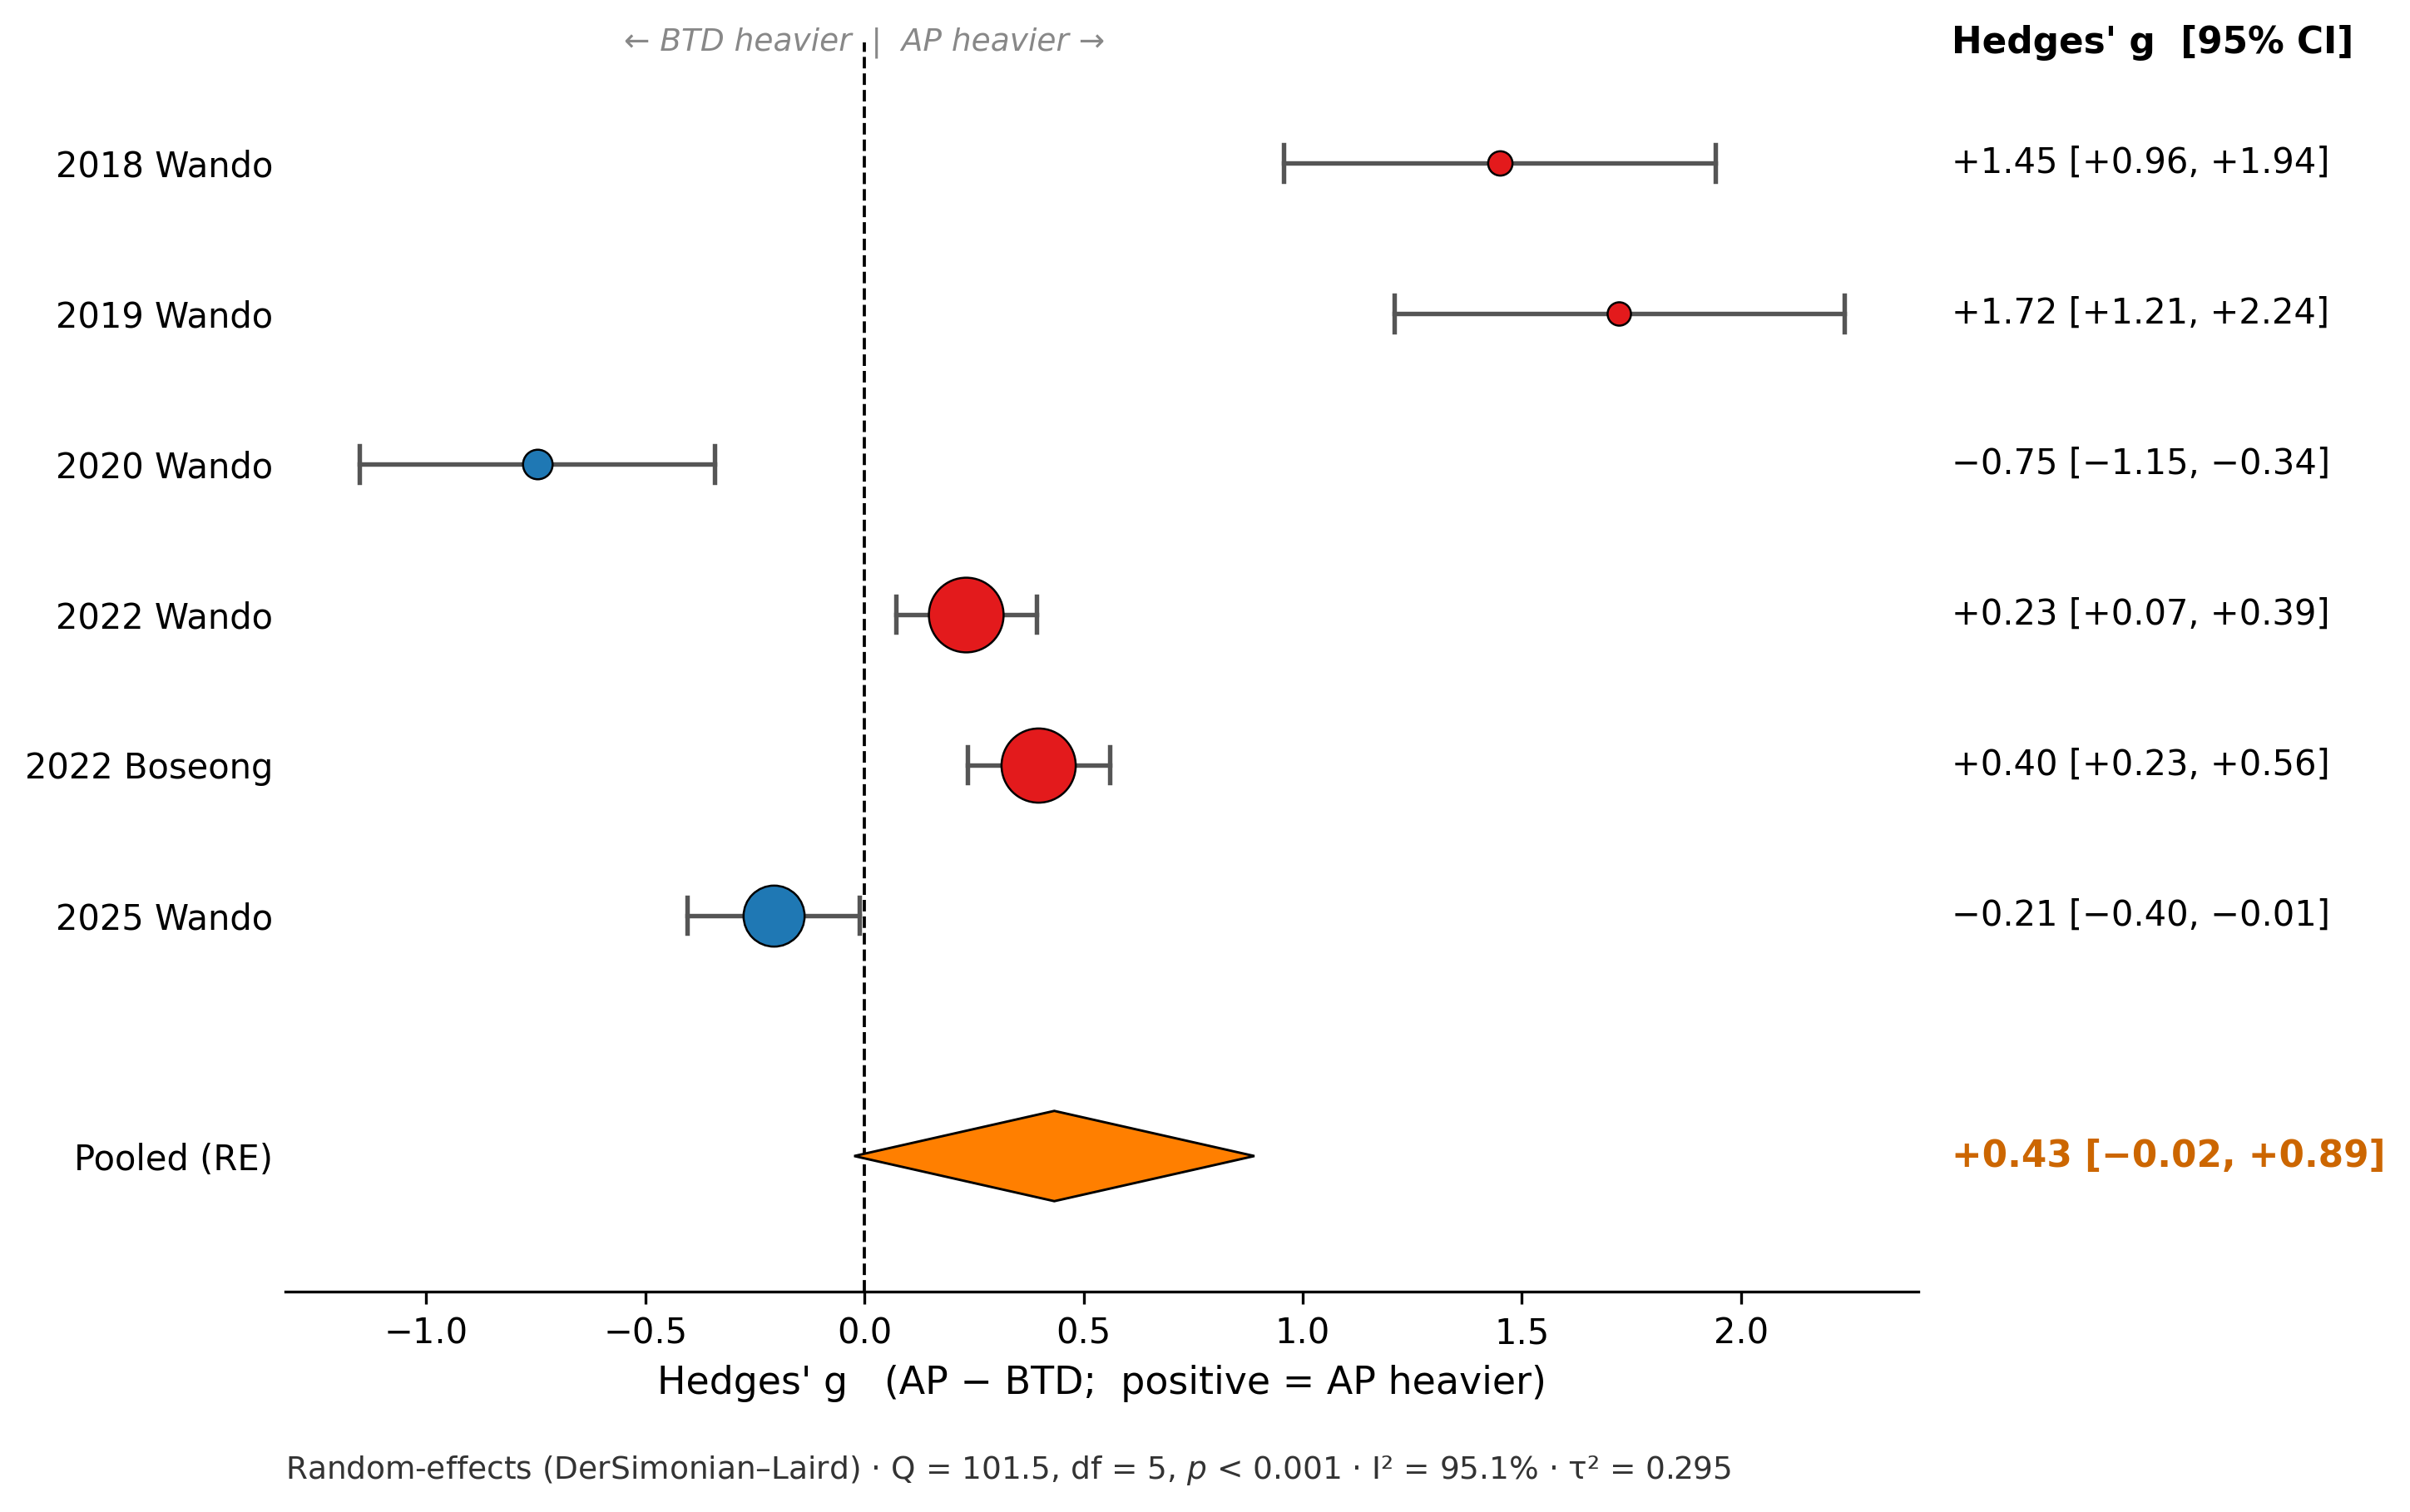
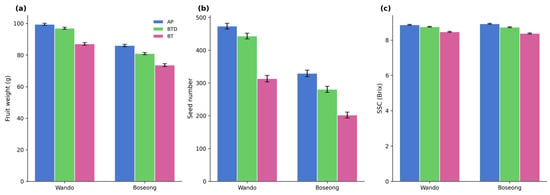
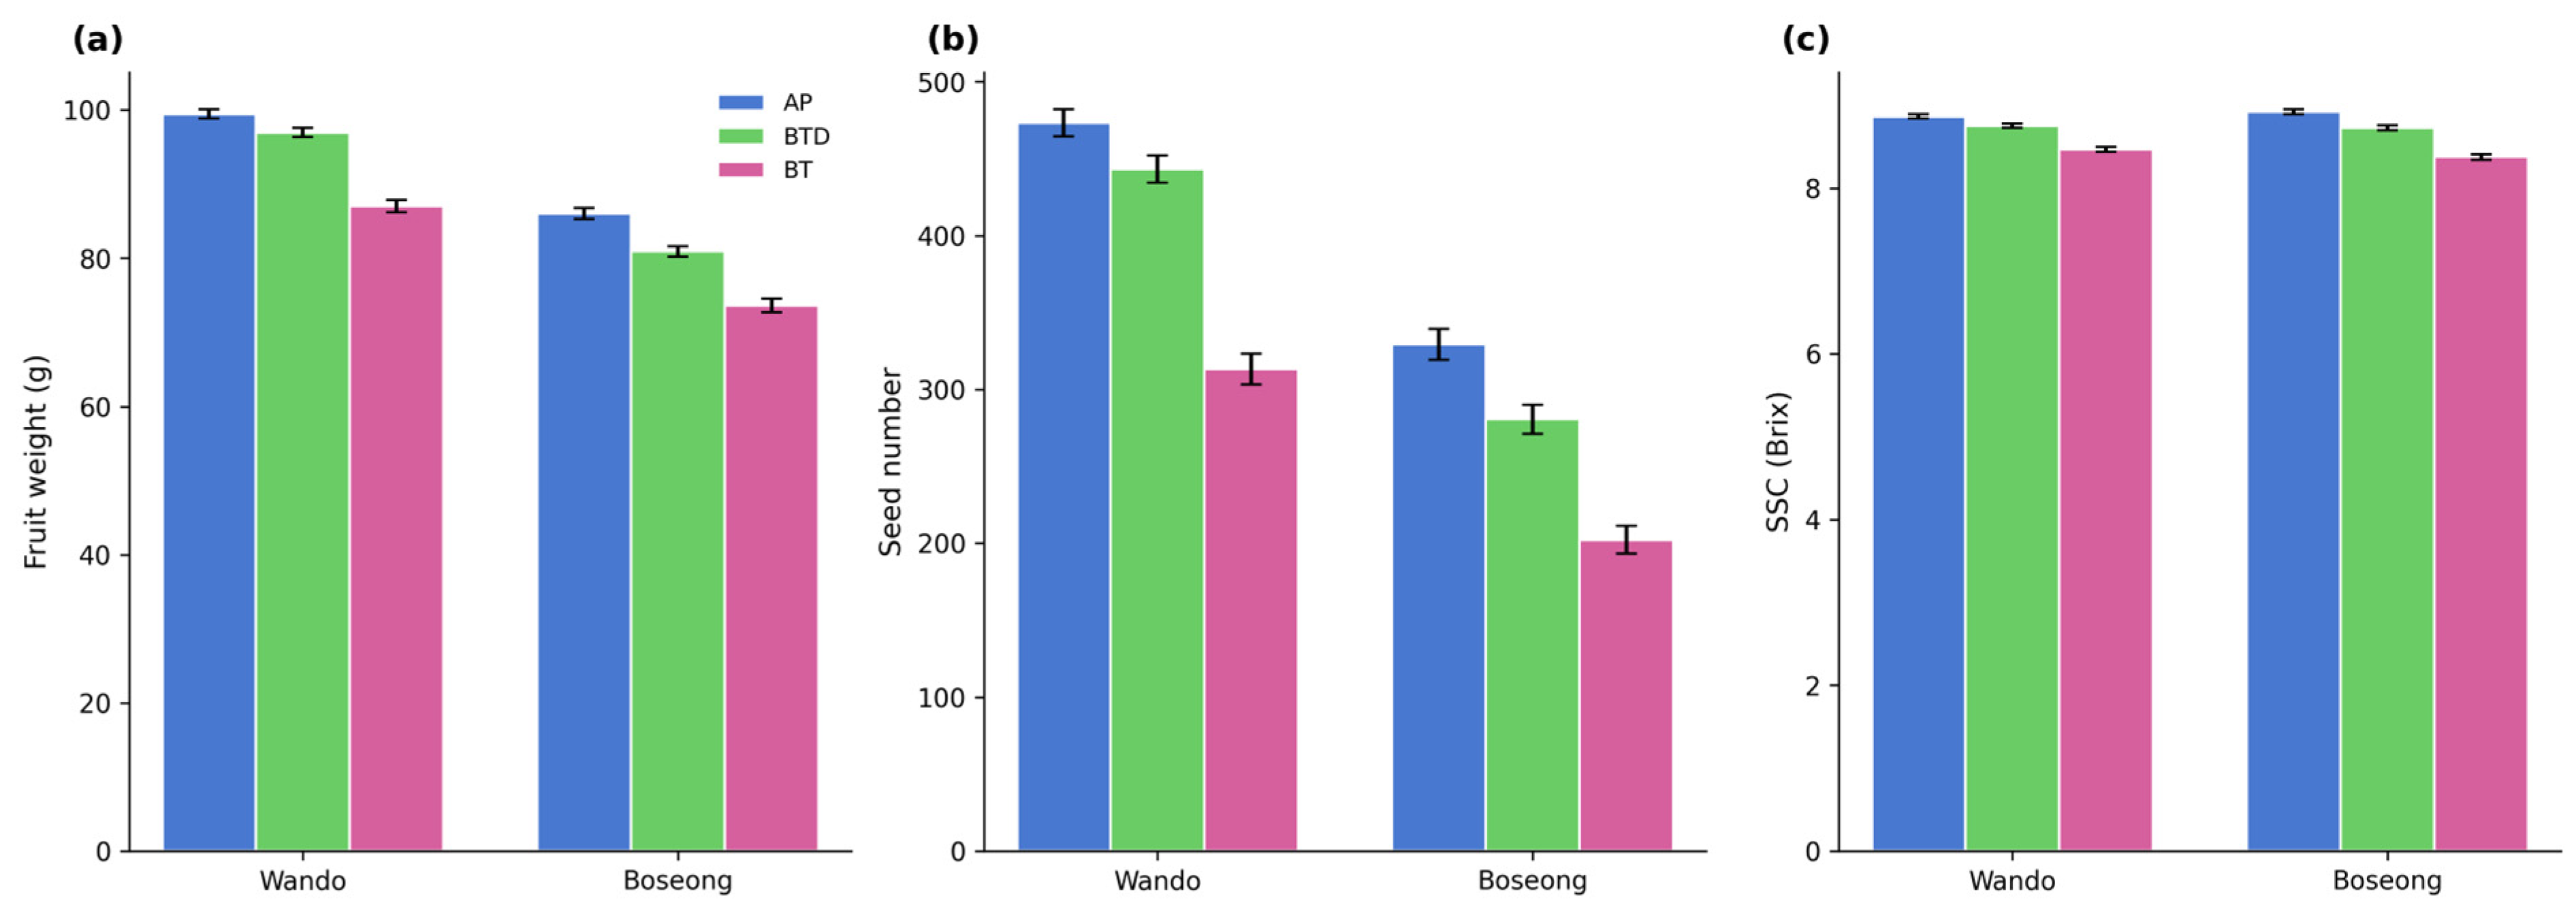
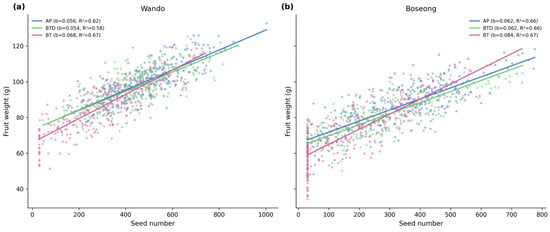
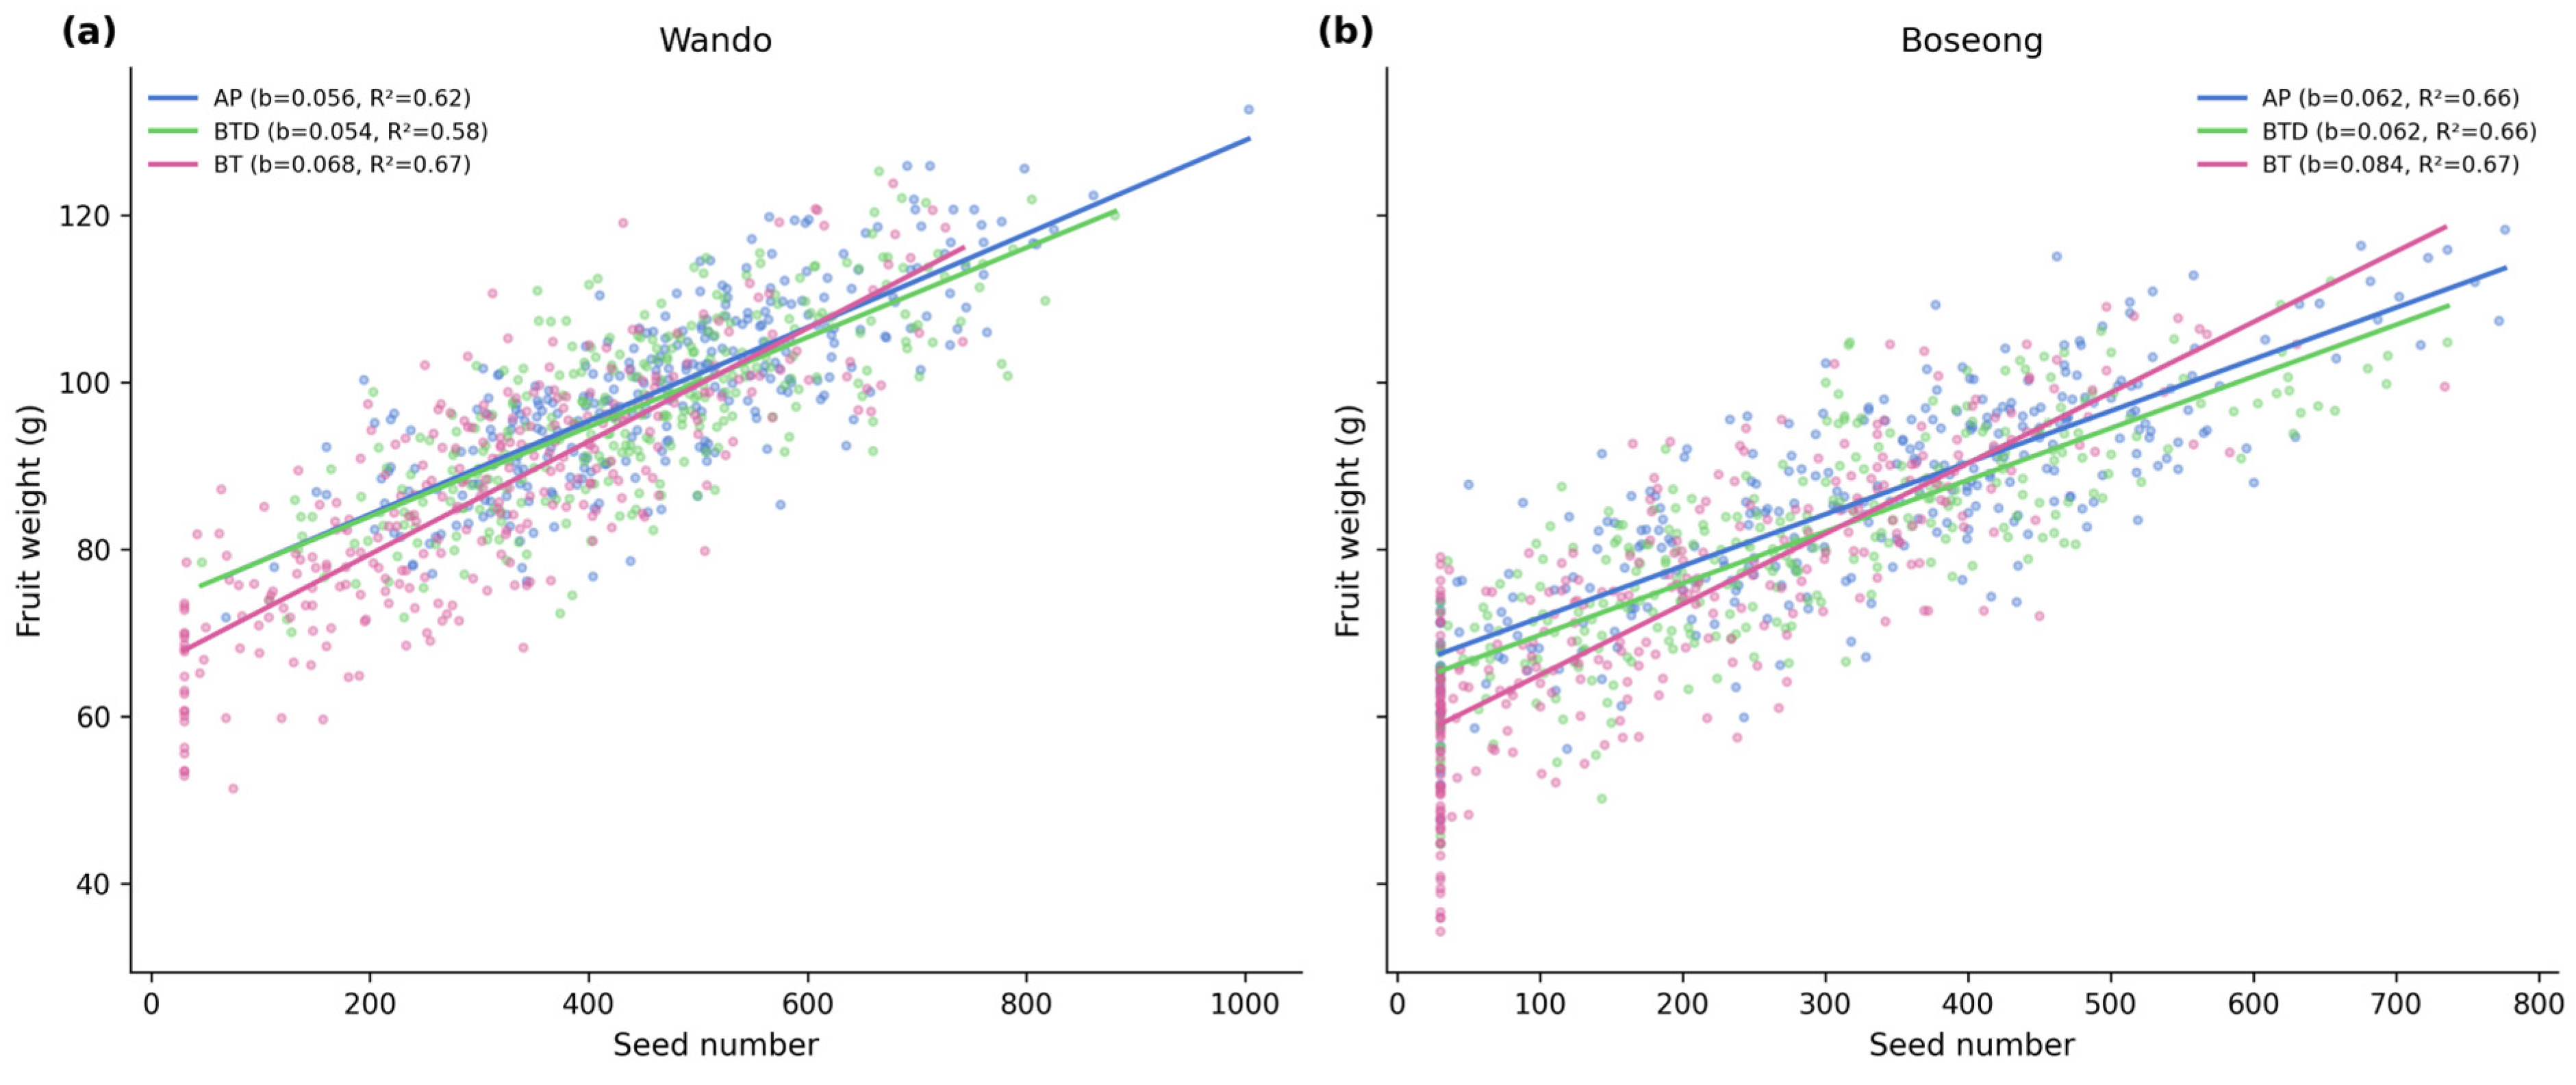
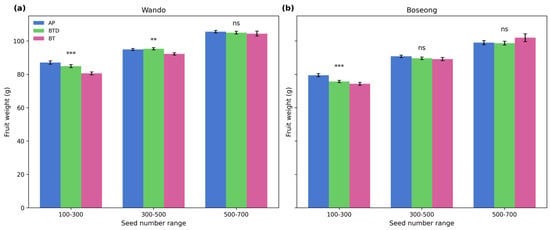
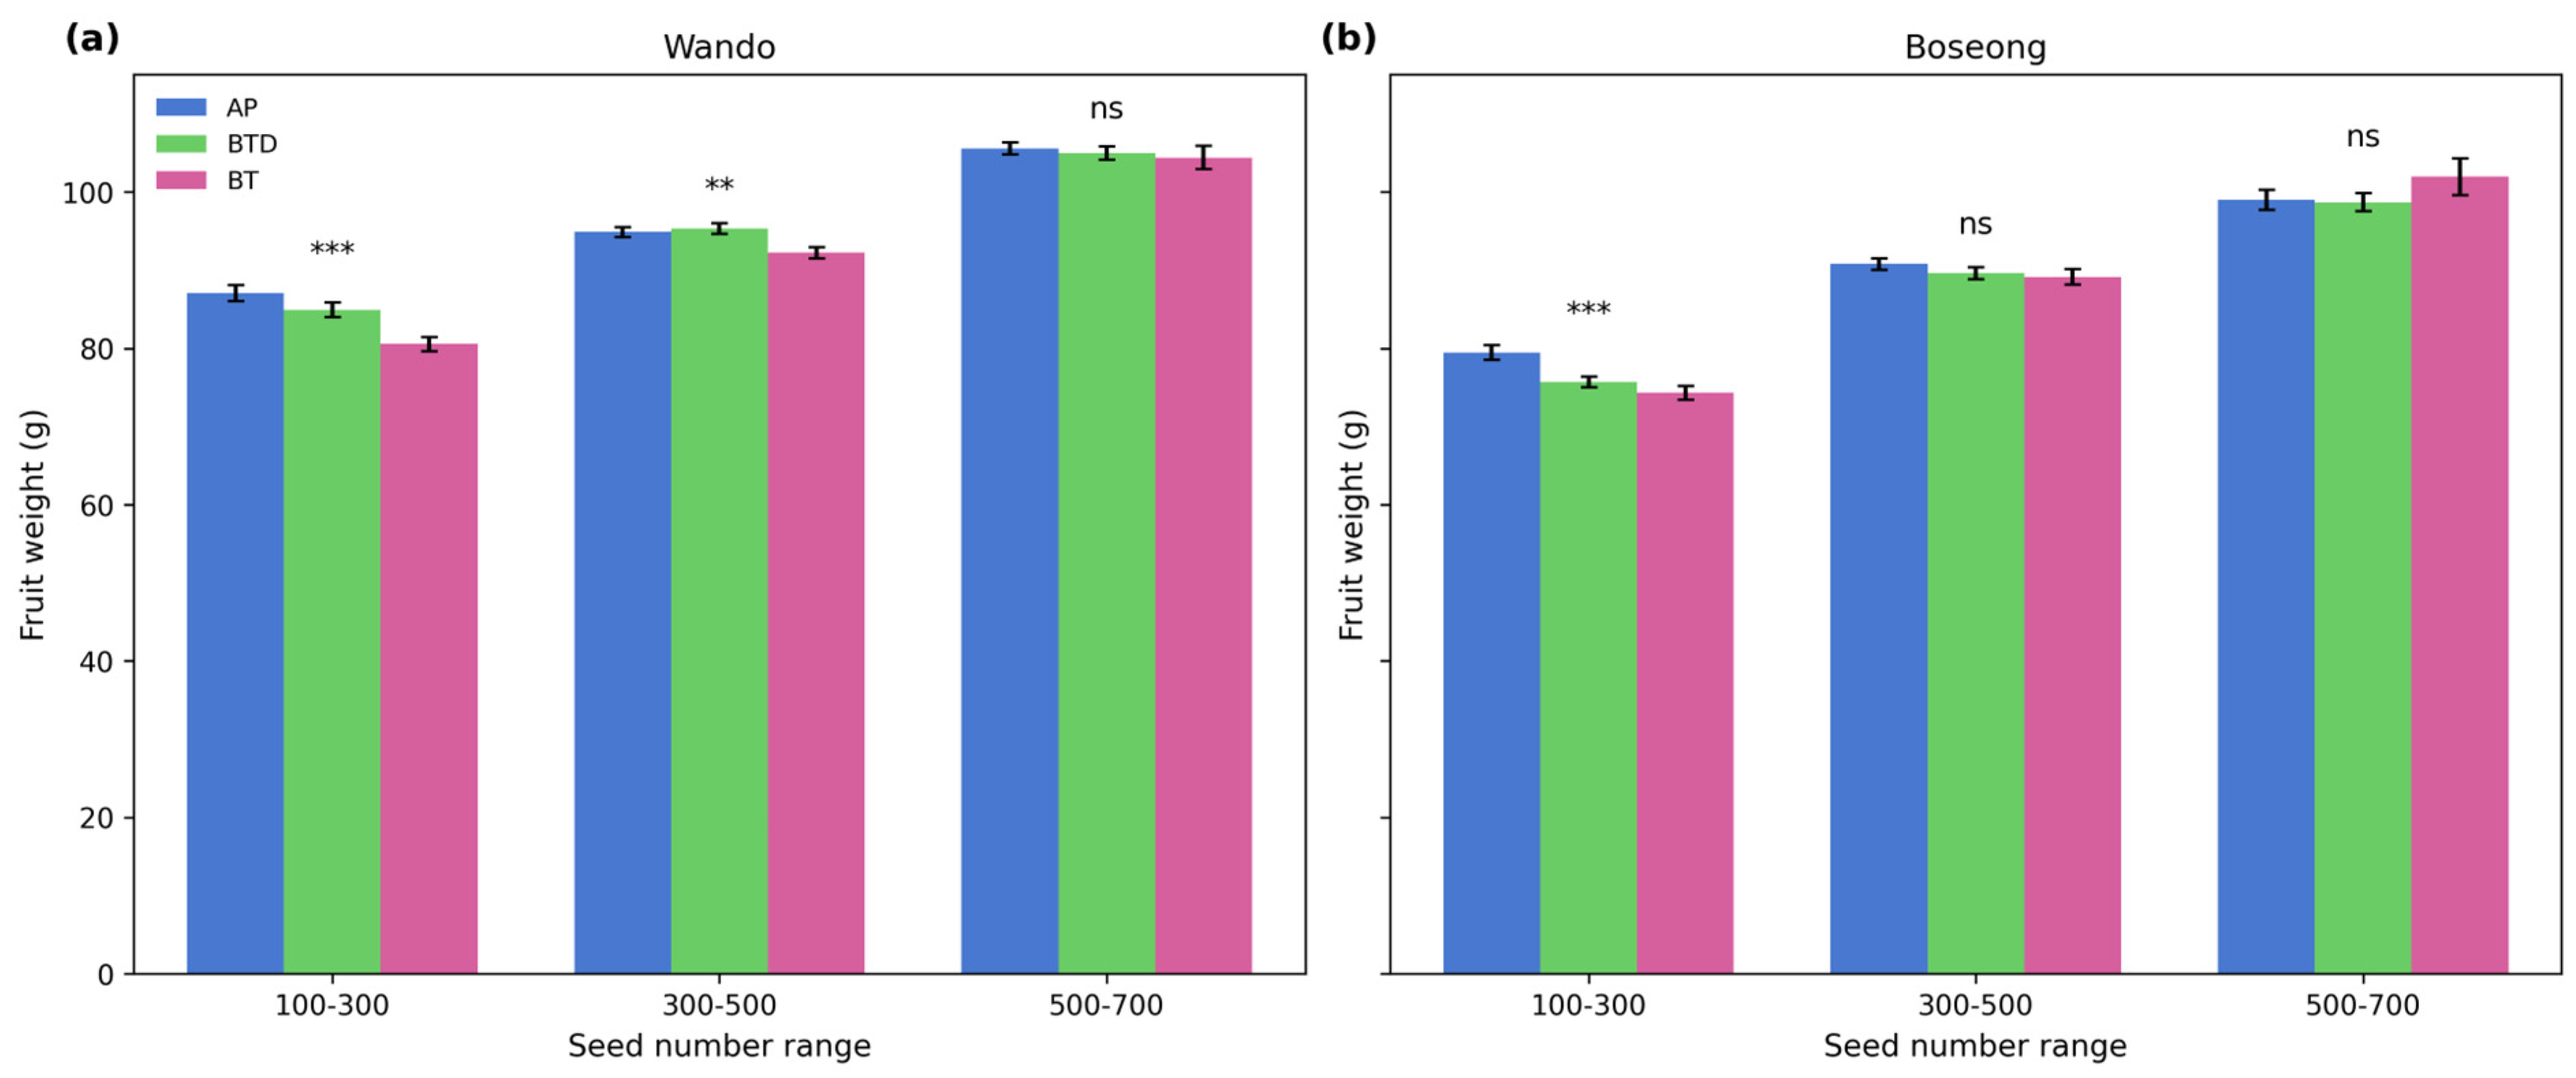
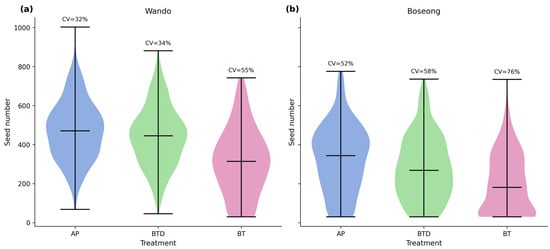
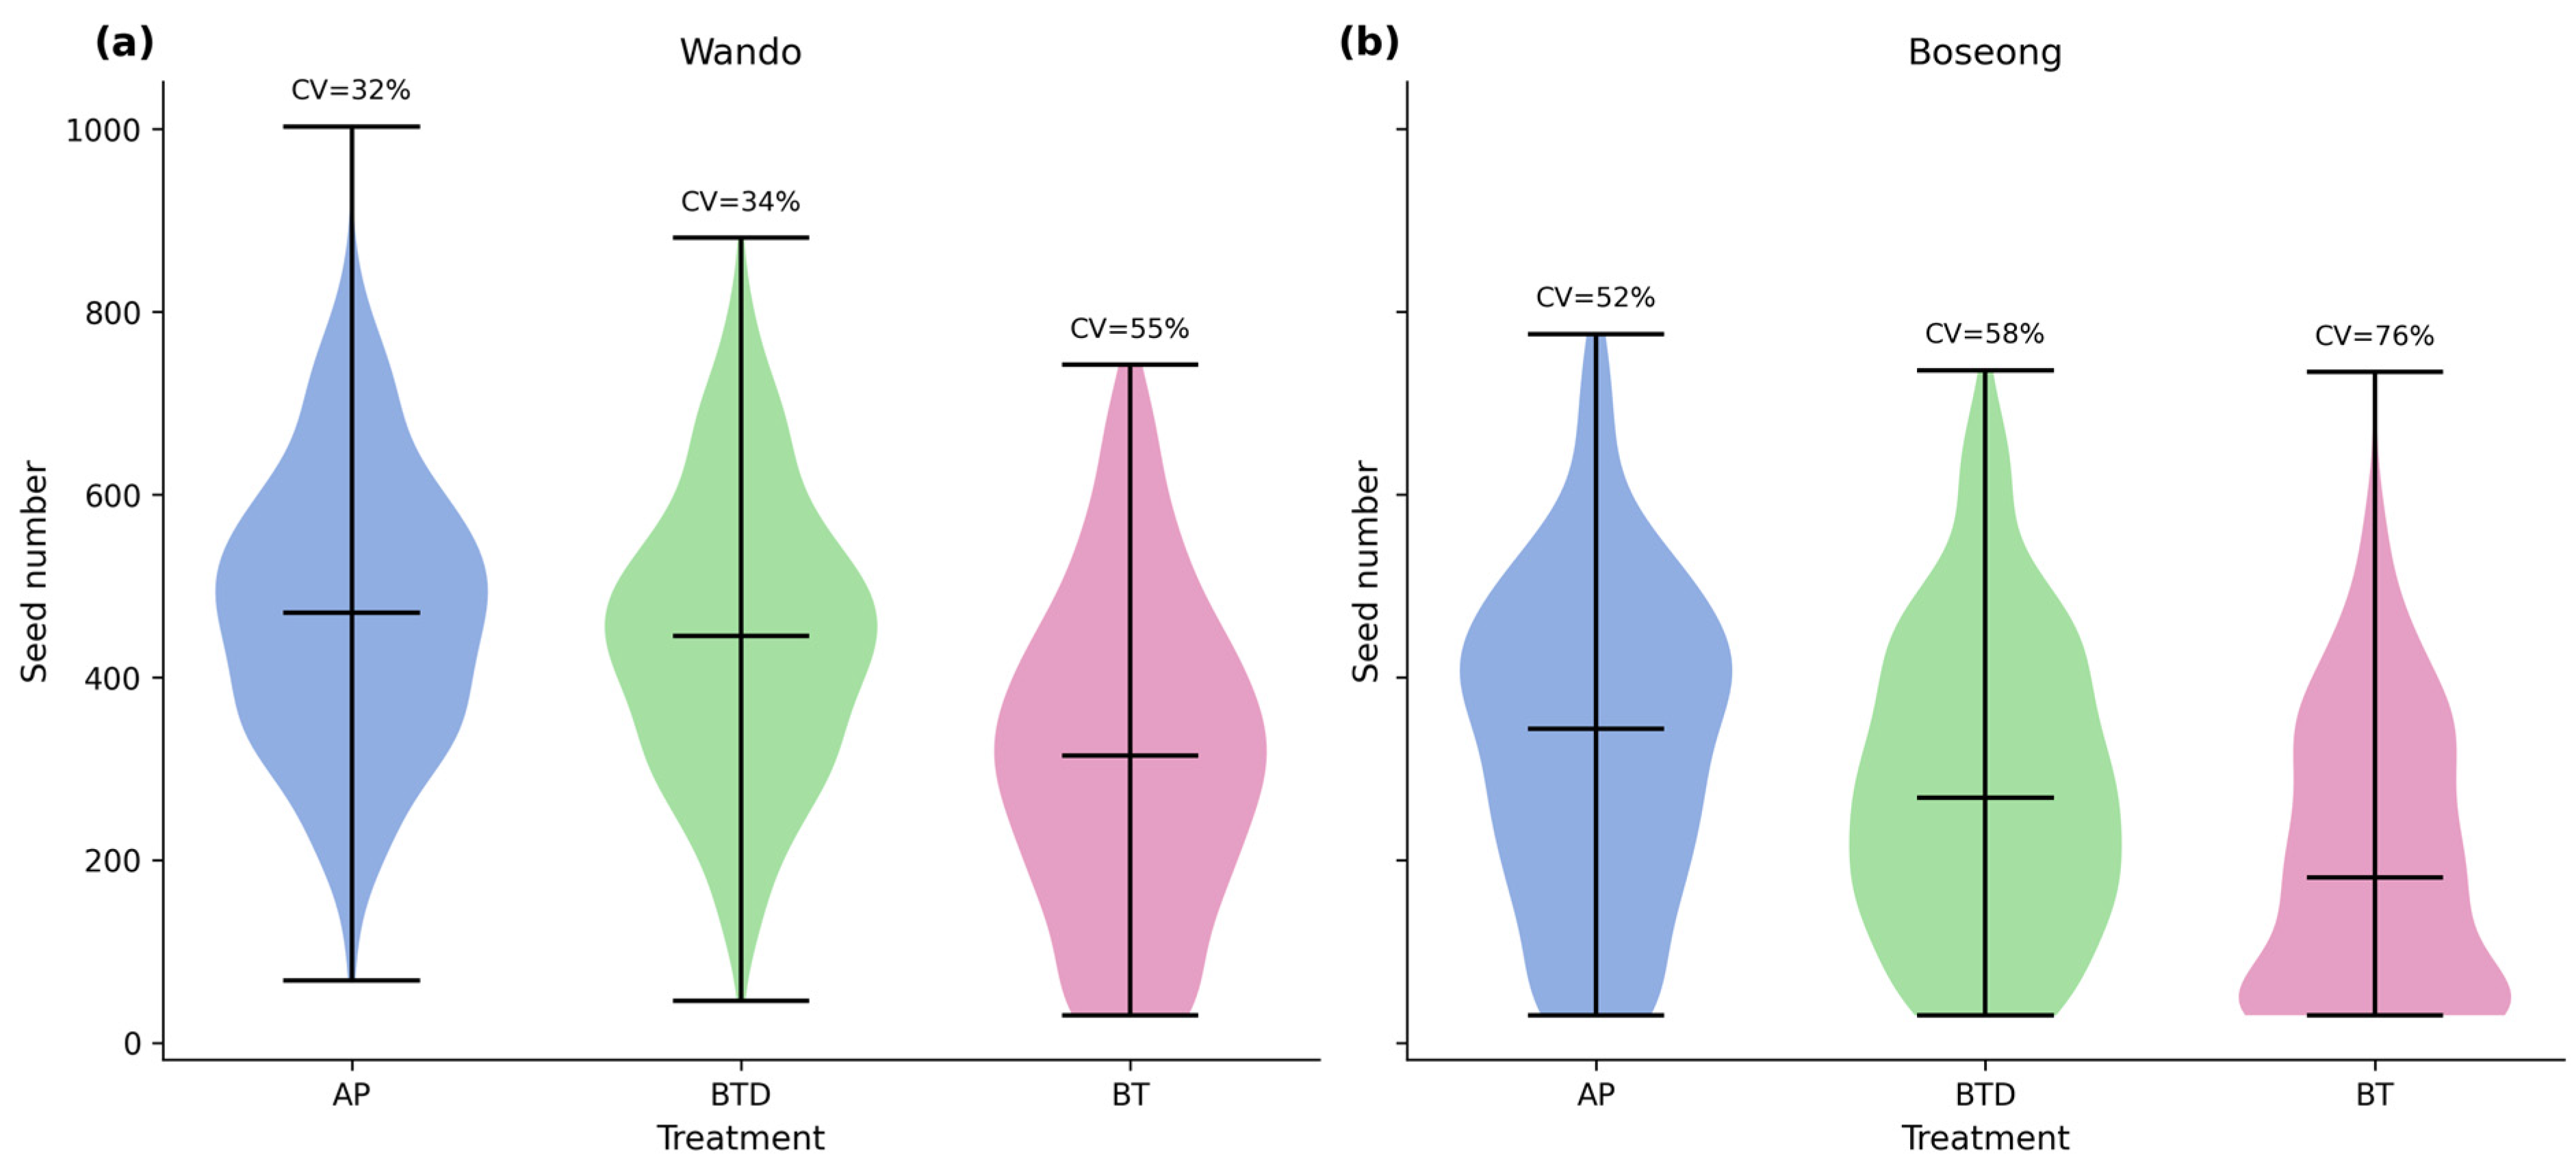
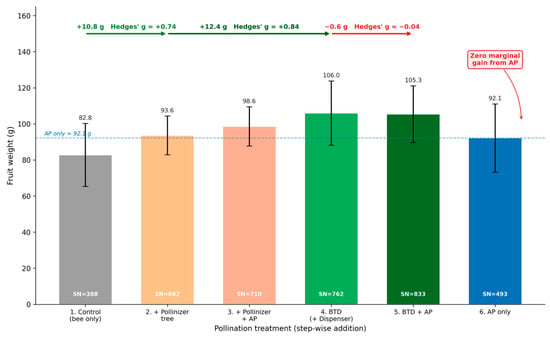
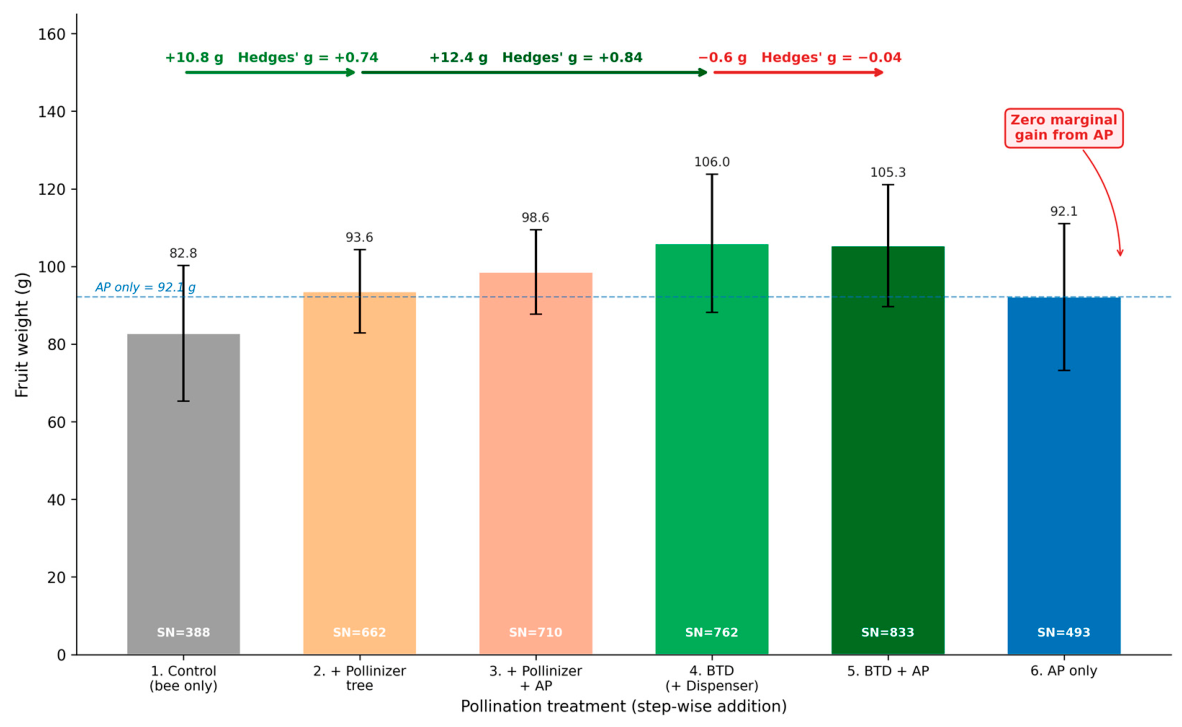

Disclaimer/Publisher’s Note: The statements, opinions and data contained in all publications are solely those of the individual author(s) and contributor(s) and not of MDPI and/or the editor(s). MDPI and/or the editor(s) disclaim responsibility for any injury to people or property resulting from any ideas, methods, instructions or products referred to in the content. |
© 2026 by the authors. Licensee MDPI, Basel, Switzerland. This article is an open access article distributed under the terms and conditions of the Creative Commons Attribution (CC BY) license.