


Abstract
Anaerobic digestion under a Waste-to-Energy (WtE-AD) framework represents a sustainable alternative for managing organic waste and generating bioenergy in developing countries. However, most life cycle assessment (LCA) studies implicitly assume stable operation, overlooking the environmental implications of process instability. In practice, large-scale WtE-AD plants are frequently affected by methanogenic inhibition events that reduce methane production and compromise their technical, economic, and environmental performance. This study—Part 2 of a two-paper series—addresses this gap by quantifying, from a life cycle perspective, the environmental consequences of recurrent methanogenic inhibition events in large-scale WtE-AD systems, complementing the techno-economic analysis presented in Part 1. Large-scale WtE-AD plants were modeled using design equations based on treatment capacity (60–200 t d−1), considering scenarios with up to ten inhibition events over a 25-year operational period. The LCA was conducted in accordance with ISO 14040:14044 standards, defining as the functional unit one ton of co-digested fruit and vegetable residues with meat industry wastes, under an attributional approach with system boundary expansion and evaluating midpoint indicators through the ReCiPe 2016 method. Results show that inhibition events increase greenhouse gas emissions by up to 400% (from 28.1 to 138.6 kg CO2 eq t−1 of waste treated), while plants with capacities above 125 t d−1 exhibit environmental credits (negative emission balances), demonstrating greater environmental resilience. Electricity substitution from the Mexican grid generated savings of up to 0.624 kg CO2 eq kWh−1, although the magnitude of the benefits strongly depends on the regional electricity mix. This dependency was further explored through comparative electricity mix scenarios representative of different levels of power sector decarbonization, allowing the sensitivity of WtE-AD environmental performance to regional grid characteristics to be assessed. Compared to landfill disposal (1326 kg CO2 eq t−1), WtE-AD plants significantly reduce impacts across all assessed categories. By explicitly integrating operational instability into an industrial-scale LCA framework, this work highlights the importance of evaluating methanogenic inhibition events from a life cycle perspective, providing key insights for the design of more sustainable and resilient WtE-AD processes within a Latin American context.
1. Introduction
The management of organic solid waste in Latin America through final disposal sites (FDS), such as sanitary landfills (SL) and open dumps, presents serious environmental and public health concerns related to the generation of greenhouse gases (GHGs), leachates, disease propagation, and threats to human health. In Mexico, these disposal technologies are responsible for generating between 736 and 867 kg CO2-eq per ton of organic waste managed [1,2]. An alternative to FDS is Waste-to-Energy (WtE) processes, which implement technologies such as anaerobic digestion (AD) that, in addition to treating organic waste, produce biogas (composed of 60% CH4 and 40% CO2) and digestate—co-products that can be used to generate clean electricity and biofertilizer.
The environmental potential of WtE-AD as an organic waste management system depends on the variability and composition of the feedstock, as well as on the operating conditions [3] and the transport distance from the waste source to the treatment facility [4]. Miramontes-Martínez et al. [4] assessed the management of fruit and vegetable waste (FVW) through WtE-AD in a Latin American context and reported GHGs mitigation of −71.12 kg CO2 eq t−1. Tsydenova et al. [2] analyzed the management of the organic fraction of municipal solid waste through WtE-AD plants in Mexico City and reported GHG emissions of 4.01 kg CO2 eq t−1 of waste. Tian et al. [5] estimated GHG mitigation ranging from −728 to −814 kg CO2 eq t−1 of food waste treated via WtE-AD processes in Singapore. In both studies, biogas and digestate were utilized for electricity generation and biofertilizer production, respectively.
The final use of WtE-AD co-products has a significant effect on the overall GHG performance of the system. Woon et al. [6] evaluated WtE-AD technology for the management of food waste in Hong Kong and reported GHG mitigation ranging from −34.08 to −58.08 kg CO2 eq t−1 of waste when the generated biogas was used as a vehicle fuel substitute, compared to emissions of 23.98 and 67.54 kg CO2 eq t−1 when biogas was used for electricity generation or natural gas substitution, respectively. Briones-Cristerna et al. [7] compared different end uses of biogas in WtE-AD processes for the treatment of FVW in Mexico and determined GHG mitigation of −98.92 and −171.34 kg CO2 eq t−1 for natural gas and electricity substitution, respectively. The previously cited environmental feasibility studies assume a constant, homogeneous, and unchanging waste flow. This assumption rarely reflects the operational reality of large-scale WtE-AD systems. Factors such as geographic location, collection source [8], seasonal variations, collection methods, and consumption patterns [9,10] influence the waste stream and its composition, potentially compromising the environmental performance of WtE-AD processes by inducing operational instability. Table 1 summarizes the main characteristics of the studies mentioned.
Table 1.
Main characteristics of large-scale WtE-AD processes reported in the literature.
Alvarado-Reina et al. [11] evaluated biogas productivity and process stability in a laboratory-scale continuous stirred-tank reactor (CSTR) under controlled feedstock disturbance. The authors reported a productivity of 2.45 L L−1d−1 under stable feeding conditions, with reductions of up to 93% when the bromatological characteristics of the feedstock were altered.
Process instability can be attributed to multiple factors, including increased concentrations of inhibitory compounds due to insufficient knowledge and improper substrate handling; a limited understanding of the degradation characteristics of organic waste; inadequate process monitoring—particularly of volatile fatty acids (VFAs); limited storage capacity and poor mixing of waste in storage tanks; foam formation; and inefficient feeding strategies in the reactor [12].
In Part 1 of this study [13], the impact of methanogenic inhibition on the technical and economic feasibility of large-scale WtE-AD processes was assessed. First, the effect of methanogenic inhibition on process stability and specific methane production was quantified under laboratory-scale conditions. Subsequently, the experimental results were integrated into mathematical models to scale up the WtE-AD process and evaluate its energy viability under both inhibited and non-inhibited scenarios. Finally, a cost engineering analysis was conducted to assess the economic impact of inhibition events and identify the conditions that could mitigate these effects, with the aim of developing more resilient WtE-AD plants. The scientific literature supports the use of laboratory-scale biogas and methane yields as input parameters for the assessment of anaerobic digestion processes at larger scales, provided that comparable operating conditions are maintained. Fiore et al. [14] compared semi-pilot reactors (3 L working volume) with pilot-scale reactors (240 L) operated under identical conditions, reporting that rice husk digestion at pilot scale achieved a methane yield of 312 m3 t−1 VS, corresponding to 81% of the yield obtained at semi-pilot scale (386 m3 t−1 VS). Similarly, Lüdtke et al. [15] evaluated the transferability of methane yields in wastewater treatment across BMP assays (0.4 L), laboratory-scale semi-continuous digesters (1.8 L), and full-scale processes (4300–7600 m3), finding differences below 5% between BMP and laboratory-scale methane yields. The authors conclude that laboratory-scale reactors can be used to predict full-scale methane production with high accuracy, and that the controlled operating conditions of semi-continuous laboratory experiments can substantially reduce uncertainty in methane yield estimation. In this context, the use of experimentally derived methane yields as inputs to the industrial-scale LCA model adopted in this study is methodologically consistent.
This two-part study aims to determine the impact of methanogenic inhibition on the technical, economic, and environmental viability of large-scale WtE-AD processes. The present second part builds upon the methane yields obtained in Part 1 from semi-continuous reactors fed with FVW and MW. These experimental results were integrated into mathematical scale-up models of the WtE-AD process to quantify electricity and biofertilizer production under both stable and inhibited operating conditions. Finally, the environmental viability of the process was quantified and interpreted through a rigorous LCA of different organic waste management scenarios and electricity substitution pathways, comparing conventional energy mixes with electricity generated from biogas under both inhibited and non-inhibited conditions. The overarching objective is to support the development of more resilient large-scale WtE-AD systems. The findings provide policymakers and sector stakeholders with clear guidance for informed decision-making, highlighting the techno-economic and environmental factors that shape the competitiveness and sustainability of these systems.
2. Materials and Methods
The methodology is structured into three main sections: the environmental evaluation, the life cycle inventory, and the landfill impact assessment. Each of these sections is detailed in the following subsections to provide a comprehensive understanding of the study’s approach.
2.1. Environmental Evaluation: Life Cycle Assessment Implementation
2.1.1. Goal and Scope Definition
The LCA followed the methodology of ISO 14040-14044:2006 [16,17] to ensure consistency across the environmental impact assessment. The standard provides a robust framework for setting system boundaries, defining the functional unit, and maintaining methodological rigor, which is critical for accurately quantifying the environmental performance of WtE-AD plants. The purpose of the LCA was to quantify the environmental impacts associated with inhibition events (IEs) in large-scale WtE-AD processes, using the management of fruit and vegetable and meat waste (FVW and MW) in Mexico as a case study.
The functional unit (FU) was defined as one ton of organic waste (FVW + MW) managed in a large-scale WtE-AD plant. This definition allows for consistent comparison across scenarios and aligns with the per-ton basis used for environmental impact indicators in this study. The reference flow (RF) varied according to the total amount of waste managed within that time horizon, which changed depending on the occurrence of IEs in each scenario, as described in Section 2.1.3 and Section 2.1.4.
There is no prominent presence in Mexico of waste valorization schemes based on anaerobic digestion strategies at an industrial scale, and among those that do exist (1259), only 13% focus on biomethane production (essentially covered anaerobic lagoons with low biogas productivities: 0.05 ± 0.04 m3 m−3 d−1); the remainder are oriented toward effluent management, mainly in the livestock industry [18]. In addition, this study aims to evaluate the environmental impacts associated with methanogenic inhibition in industrial-scale WtE processes. For these reasons, it is appropriate to adopt an attributional approach with system expansion as a strategy for life cycle environmental impact assessment.
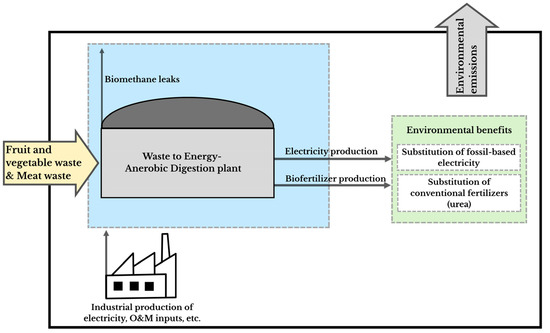
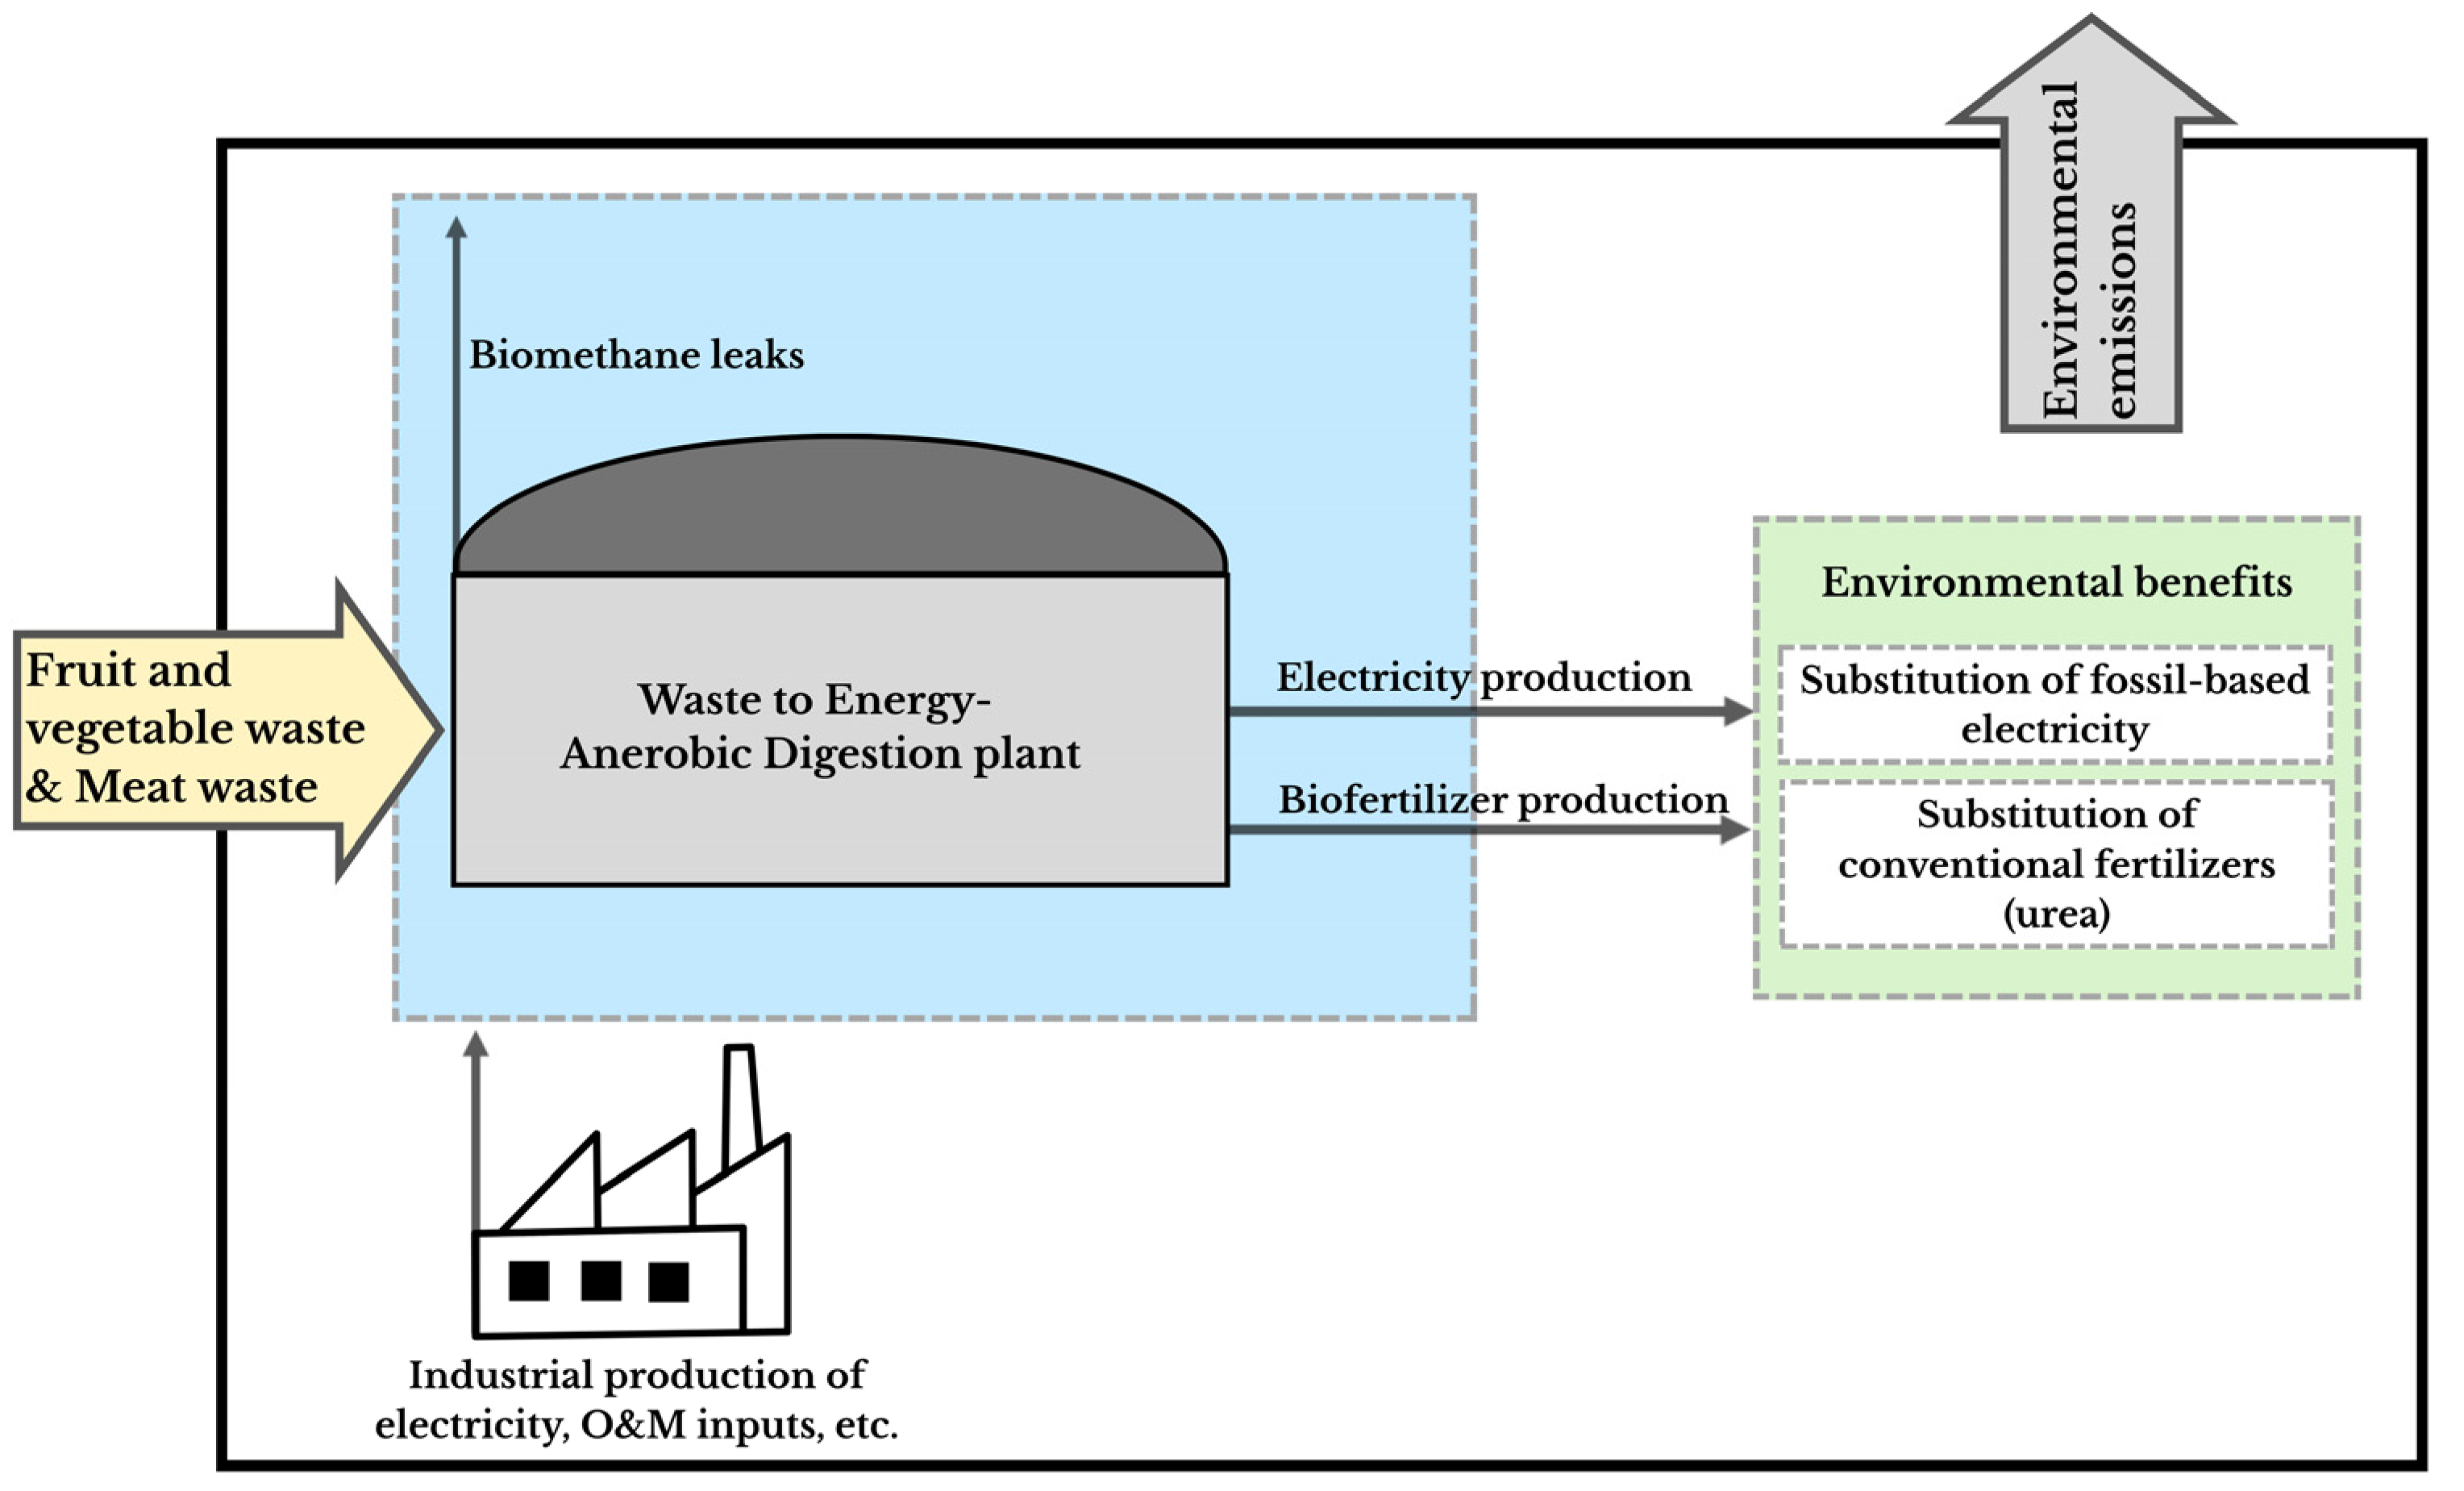
The LCA model was implemented in SimaPro v8.3.0 PhD© software and the secondary data were obtained from the Ecoinvent v3.2 database (contained within the same software). The environmental burdens and credits associated with electricity generation—assumed to replace fossil-based grid mix in the Mexican context—and with the substitution of conventional nitrogen fertilizers, were included through system expansion. The midpoint climate change indicator (CCI), particulate matter formation (PMF), fossil depletion (FD) and human toxicity-non-carcinogenic (HT-nc) were selected as the primary environmental metric according to the ReCiPe method [19].
Figure 1 illustrates the system boundaries adopted in this study, encompassing the production and supply of all material and energy inputs across each life cycle stage, together with the environmental credits associated with the substitution of fossil-based electricity and conventional nitrogen fertilizers. System boundary expansion was applied to account for the multifunctionality of WtE-AD systems, which simultaneously treat waste and produce valuable co-products. Specifically, the expansion includes electricity generation -assumed to displace grid electricity in the corresponding regional context-, and biofertilizer production—assumed to substitute conventional mineral nitrogen fertilizers. This approach avoids allocation by explicitly modeling the avoided environmental burdens associated with substituted products [16,17]. The assessment excludes waste transportation, civil work, machinery, and vehicle construction. Their inclusion would not affect the relative comparison between inhibition scenarios, which is the core focus of the study. Previous LCA studies on WtE-AD systems have demonstrated that infrastructure and construction contribute marginally to total impacts compared to operational electricity consumption and generation [20,21].
Figure 1.
System boundaries for the energetic valorization of organic waste (FVW + MW) in waste-to-energy anaerobic digestion (WtE-AD) plant.
2.1.2. Baseline Scenario
The baseline scenario was defined as a large-scale WtE-AD plant with a treatment capacity of 60 t d−1, operating at a methane yield of 521 mL CH4 g VS−1 and evaluated over a 25-year time horizon.
This configuration, along with the associated economic parameters—a waste management fee of 33 USD t−1, an electricity sales price of 0.05 USD kWh−1, and a biofertilizer sales price of 129 USD t−1—was established in Part 1 of this study, representing the minimum capacity required to achieve economic viability in the absence of methanogenic inhibition within the Mexican context.
2.1.3. Treatment Capacity Scenarios
A capacity-based assessment was conducted to determine the influence of waste treatment scale on the environmental performance of the WtE–AD plant. Waste management capacities ranging from 70 to 200 t d−1 were evaluated, in line with values reported for comparable systems in the literature [4]. The analysis assumed a constant feed of FVW and MW throughout the operational time horizon, with electricity generation estimated using the specific methane yield corresponding to stable operation.
2.1.4. Sensitivity Analysis
Inhibition Events
To quantify the environmental effects of inhibition events (IEs) in a large-scale WtE-AD process, a sensitivity analysis was conducted considering treatment capacities ranging from 70 to 200 t d−1. Díaz-Castro et al. [13] define IEs as the complete absence of meat waste (MW) in the feedstock, which leads to measurable reductions in both electricity generation and organic waste treatment capacity. Electricity and biofertilizer production were estimated based on the experimental methane yields of the inhibited process reported in Part 1, corresponding to 67.5 m3 CH4 t−1 VS. The scenarios consider between 0 and 10 IEs over a 25-year time horizon.
Comparison of Electricity Mix Scenario
To evaluate the environmental profile of a large-scale WtE-AD plant across different regions—and in alignment with Part 1—we compared four grid mixes: Mexico (baseline), New York, USA (NPCC region), Italy, and Germany. Mexico was selected as the baseline scenario due to its relatively high share of fossil-based electricity generation, where WtE-AD deployment is expected to play a relevant role in waste management strategies. The remaining grids were selected to represent electricity systems with progressively higher levels of decarbonization, allowing the sensitivity of WtE-AD environmental performance to background power system characteristics to be systematically assessed.
In SimaPro, only the background electricity mix applied to on-site consumption and to the credit for exported electricity was varied; all other foreground assumptions (mass and energy balances and CHP efficiency) were held constant. Exported electricity was assumed to displace the same regional grid to which the plant is connected in each scenario. The analysis was conducted for a treatment capacity of 60 t d−1 and a methane yield of 521 mL CH4 g−1 VS, as reported in Part 1, and explicitly incorporated 0–10 methanogenic inhibition events following the previously described procedure [13].
2.1.5. Life Cycle Inventory
The life cycle inventory (LCI) was developed to quantify the inputs and outputs of resources, raw materials, energy, and emissions associated with each of the study scenarios. A custom spreadsheet model in Microsoft Excel© was used to calculate material and energy inputs as a function of the organic waste mass managed (FVW and MW). Energy and material requirements across the life cycle stages included the amount of waste received by the plant, the electricity demand of unit operations—shredding, anaerobic digestion with heating and mixing, and digestate drying—and the production of electricity and biofertilizer as co-products.
The experimental methane yields used in the mathematical scale-up models of the WtE-AD process were obtained from two laboratory-scale CSTRs operated at a hydraulic retention time (HRT) of 20 days and an organic loading rate (OLR) of 2 kg VS m−3 d−1, fed with fruit and vegetable waste (FVW) and meat waste (MW). A feeding scheme based on an FVW:MW ratio of 1:1 (VS basis) at 30 g VS L−1 was used to determine the methane yield under stable operating conditions. Subsequently, MW was withdrawn from the feed to induce methanogenic inhibition and to quantify methane yields under inhibited conditions. The resulting methane yields were 521 and 67.5 mL g−1 VS for stable and inhibited processes, respectively. A detailed description of the experimental methodology is provided in Part 1 of this study by Díaz-Castro et al. [13].
Energy and material requirements across the life cycle stages included the amount of waste treated, the electricity demand of the main unit operations (shredding, anaerobic digestion with heating and mixing, and digestate drying), as well as the production of electricity and biofertilizer as co-products. The equations used to estimate electricity consumption, electricity generation, and biofertilizer production across the different scenarios were adopted from Part 1 of this study [13] and from Albalate-Ramírez et al. [22].
Direct process emissions, including methane leaks from anaerobic digestion and ammonia emissions during digestate management, were estimated following methodologies applied in previous studies by Albalate-Ramírez et al. [22]. Fugitive methane losses were assumed to correspond to 1% of the total CH4 generated at the CSTR reactor unit operation, with the remaining methane directed to energy recovery. Ammonia emissions were estimated assuming a nitrogen content in digestate of 5 × 10⁻⁵ kg N kg−1 digestate and an NH3 emission factor of 1.2 × 10⁻³ kg NH3 kg−1 N (Miramontes-Martínez et al. [4]). The Ecoinvent database v3.2 was employed to obtain the elementary fluxes of secondary data.
2.1.6. Landfill Impact Assessment Using EASETECH Software
To evaluate the potential environmental benefits of treating FVW and MW in a large-scale WtE-AD plant, the environmental impacts associated with their disposal in a SL were estimated as a reference point. The EASETECH (version 3.4.4) software was used for this purpose, as it is a specialized tool for life cycle assessment and environmental and economic evaluation of solid waste management systems. The model enabled the quantification of emissions resulting from waste confinement, considering physicochemical characteristics, degradation rates, and biogas capture factors under conditions representative of a conventional landfill. Environmental impacts were assessed using the ReCiPe 2016 method, hierarchical perspective at the midpoint level, which allowed for the calculation of the four impact categories considered in this study: climate change, particulate matter formation, fossil resource depletion, and non-carcinogenic human toxicity.
3. Results and Discussion
3.1. Life Cycle Inventory
Table 2 presents the life cycle inventory (LCI) results related to electricity consumption (kWh FU−1) in a WtE-AD plant operating under different treatment capacities (60 to 200 t d−1) and scenarios involving varying numbers of methanogenic IEs (0 to 10). Data are expressed per functional unit (one tonne of mixed FVW and MW treated) and reflect variations in system input flows in response to changes in process stability. Electricity generation and biofertilizer generation in all scenarios were 432 kWh FU−1 and 0.0012 ton FU−1. This information was subsequently used to calculate the net environmental impacts for each scenario analyzed.
Table 2.
Life Cycle Inventory results for electricity consumption (kWh FU−1) in WtE-AD plant under varying treatment capacities and inhibition events.
Table 3 presents the life cycle inventory (LCI) results for methane (CH4) leaks and ammonia (NH3) emissions generated during the operation of WtE-AD plants under different treatment capacities (60 to 200 t d−1) and methanogenic inhibition scenarios (0 to 10 IEs). These values are reported per functional unit and allow for the analysis of direct emission behavior under both stable and unstable operational conditions. This information is essential for interpreting the marginal contribution of these gaseous flows to the environmental impact indicators evaluated in this study.
Table 3.
Life Cycle Inventory results for methane leaks and ammonia emissions in WtE-AD plant under varying treatment capacities and inhibition events. Data expressed per functional unit.
3.2. Effect of Treatment Capacity on Environmental Performance
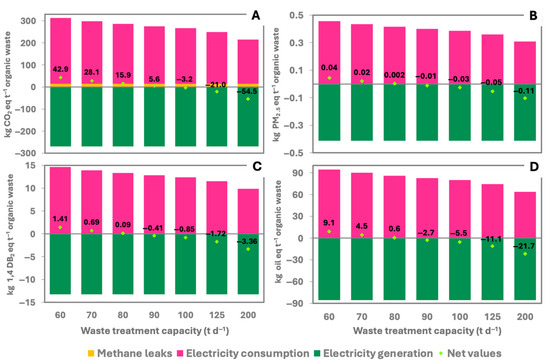
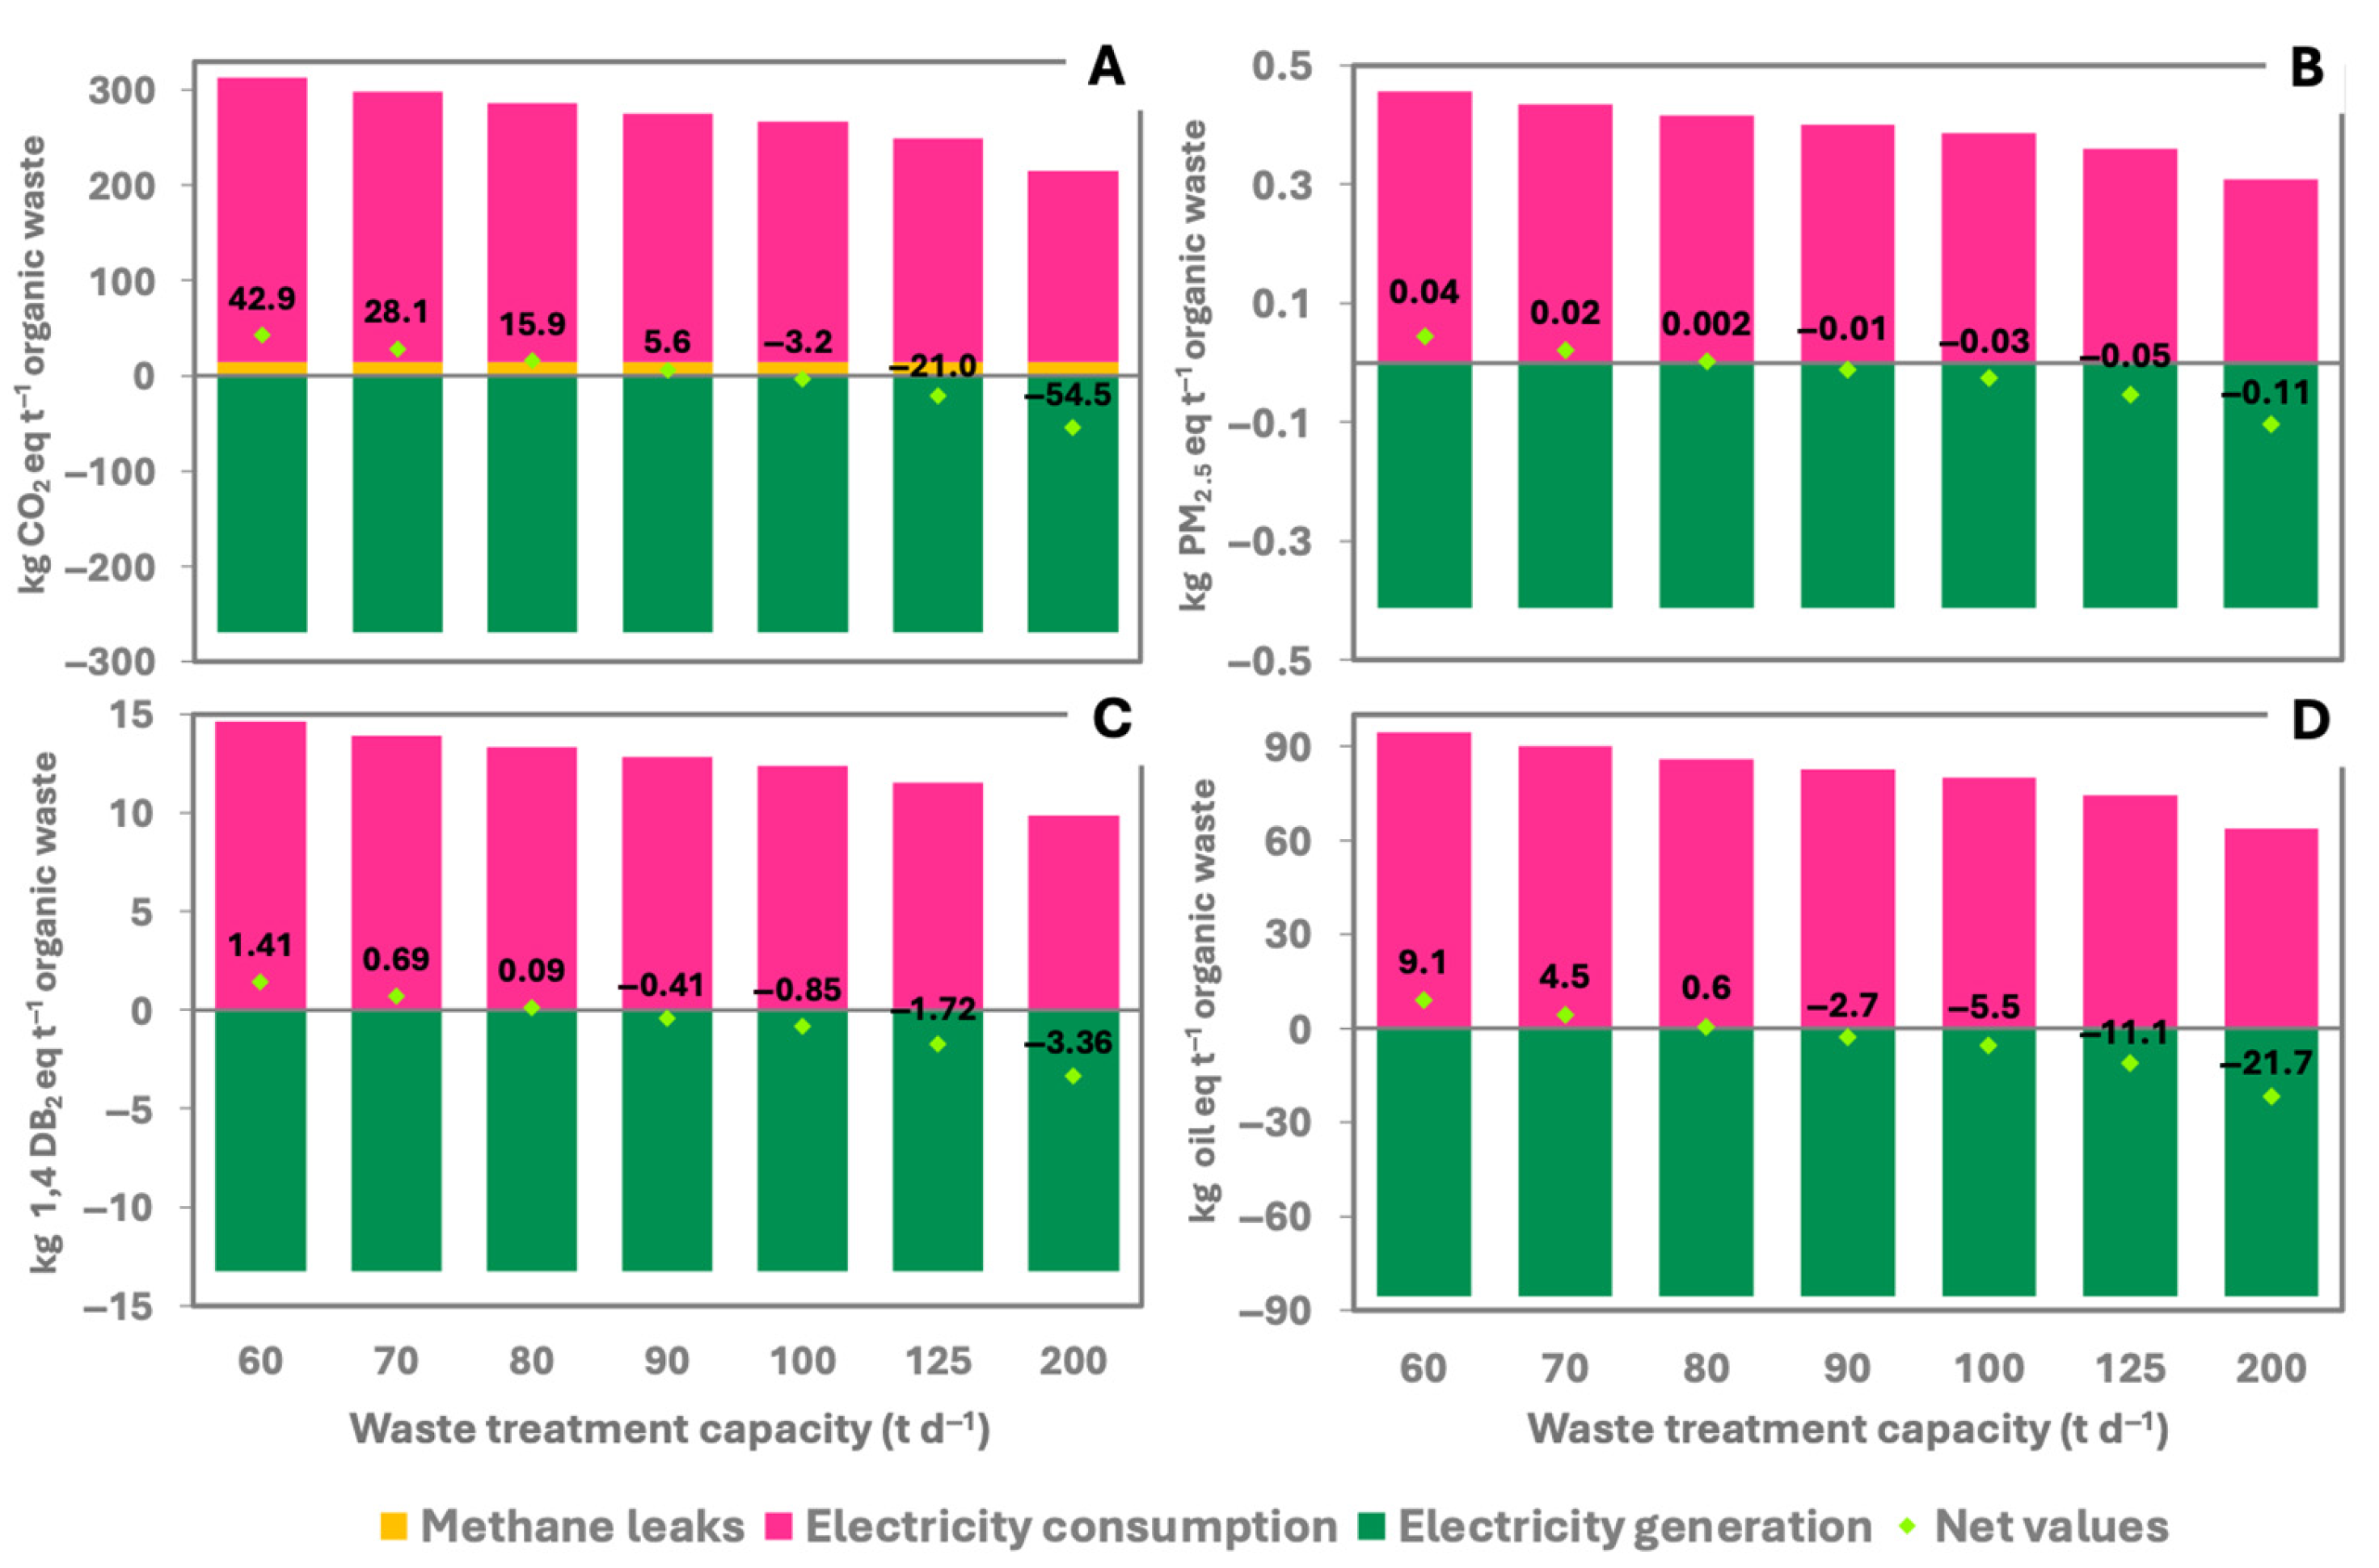
Figure 2 presents the midpoint impact indicators used to evaluate the environmental performance of WtE-AD plants co-digesting FVW and MW, as a function of treatment capacity, expressed per ton of organic waste treated. Across the four assessed indicators increasing waste treatment capacity results in a progressive mitigation of environmental impacts. This trend is primarily driven by scale effects, as larger facilities exhibit lower specific electricity consumption per ton of waste, which directly improves the net energy balance of the system.
Figure 2.
Effect of treatment capacity in WtE-AD plant on environmental performance. (A) climate change; (B) particulate matter formation; (C) human toxicity, non-carcinogenic; (D) fossil resource depletion.
As shown in Table 1, increasing the treatment capacity substantially reduced the electricity demand of WtE-AD processes; plants treating 200 t d−1 exhibited a 33% lower energy demand per ton of waste compared to 60 t d−1 facilities (under non-inhibitory conditions). This reduction amplifies the environmental benefits associated with electricity generation, as the produced electricity displaces grid electricity that is predominantly fossil-based in the Mexican energy mix (77.33%), followed by hydroelectric (15.76%), nuclear (3.74%), renewables (3.15%), and waste-based sources (0.02%) [23]. Notably, the benefits associated with electricity generation were independent of treatment capacity, since the biogas yield assumed in this study was fixed across all waste management scenarios (521 m3 CH4 t−1 VS) and did not reflect scale effects. On the other hand, methane leaks and biofertilizer generation contributed negligibly to the four environmental indicators evaluated. Table 2 presents methane emissions (leaks) and ammonia emissions (associated with biofertilizer drying) in WtE-AD plants under varying treatment capacities and inhibition events, highlighting their marginal contribution to the overall environmental balance of the system.
In terms of greenhouse gas emissions (Figure 2A), the substitution of conventional electricity from the Mexican energy mix represents the main environmental benefit; the replacement of 1 kWh yields a savings of 0.624 kg CO2 eq. Table 2 presents the total amount of electricity consumed in each scenario analyzed. Previous studies have reported a GHG savings of 0.504 kg CO2 eq kWh−1 for similar WtE-AD processes implemented in the Mexican context [4]. Bacenetti et al. [24] reported GHG savings ranging from 0.21 to 1.07 kg CO2 eq kWh−1 for WtE-AD processes using maize, manure, and their co-digestion as substrates. The reported values depend on several factors, including the nature of the substrate (energy crop or waste), transport distances between the substrate source and the plant, the efficiency of the CHP unit, and the type of energy mix being displaced. Tian et al. [5] reported GHG mitigation potentials of −728 to −814 kg CO2 eq t−1 of food waste, for anaerobic digestion systems under stable operating conditions, mainly driven by electricity substitution and nutrient recovery. However, their assessment assumes uninterrupted and optimal reactor performance throughout the system lifetime.
Pérez-Camacho et al. [25] reported GHG savings ranging from 0.296 to 0.459 kg CO2 eq kWh−1 of electricity fed into the UK grid, based on WtE-AD processes using grass/maize silage, cow manure, and food waste under different feeding conditions and assuming a 100 km transport distance from the waste source to the treatment facility. When excluding transport, the authors reported a higher savings value of 0.543 kg CO2 eq kWh−1, comparable to the values obtained in this study, where transport distance was also not considered.
In a scenario without methanogenic inhibition events, and where all inputs and outputs remain constant over the 25-year time horizon, a process with a treatment capacity of 60 t d−1 results in an environmental impact of 23.5 kt CO2 eq. In contrast, a process treating 200 t d−1 under the same conditions yields −99.4 kt CO2 eq, corresponding to a net reduction of 122.9 kt CO2 eq in GHG emissions between both scenarios.
The remaining environmental indicators (Figure 2B–D) exhibit a similar qualitative behavior, demonstrating that the most influential activities are those related to electricity consumption and generation. Processes with treatment capacities above 100 t d−1 result in environmental credits (i.e., negative indicator values) across the impact categories analyzed.
A study by Albalate-Ramírez et al. [22] evaluated the energy recovery potential of food waste generated along the supply, distribution, and retail stages in Mexico, concluding that WtE-AD plants with treatment capacities above 281 t d−1 can achieve environmental credits in terms of GHG mitigation under stable operating conditions. However, the methane yields reported for food-waste mono-digestion (325–480 m3 CH4 t−1 VS) are based on stable process conditions and do not explicitly account for the occurrence of operational disturbances or performance variability. In contrast, the higher methane yield adopted in the present study (521 m3 CH4 t−1 VS), derived from co-digestion schemes, is evaluated within a framework that explicitly considers recurrent IEs, enabling a more realistic assessment of the long-term environmental robustness of large-scale WtE-AD processes. This highlights the crucial role of proper co-digestion from an environmental perspective, as the literature reports methane yields ranging from 384 to 490 m3 t−1 VS (Table 4) for AD of FVW processes in monodigestion and co-digestion. Monodigestion processes produce significantly less than those in this study (521 m3 of CH4 t−1VS).
Table 4.
Methane yields from anaerobic digestion processes of fruit and vegetable waste in mono- and co-digestion.
The fossil resource depletion indicator (Figure 2D), similar to the climate change indicator, shows a strong dependency on electricity consumption and generation within the Mexican energy context. Fossil resource depletion has been widely reported as being dominated by electricity consumption and substitution effects, with net credits achieved only when energy recovery offsets upstream fossil inputs [24,25].
Similarly, particulate matter formation in AD systems is primarily driven by emissions of NH3, NOx, and SO2 associated with digestate management and background electricity generation, as reported by Zhang et al. [30] and Rotthong et al. [21].
In the baseline scenario—a WtE-AD plant treating 60 t d−1 without inhibition events—the net indicator value reflected a contribution profile of 64% natural gas, 22% crude oil, 8% hard coal, and 6% brown coal. For the particulate matter formation indicator (Figure 2B), the contribution profile of gaseous emissions was 55% NH3, 25% NOx, and 20% SO2. Meanwhile, the most influential environmental burdens in the HT-nc indicator showed a contribution profile of 67% arsenic ion, 14% lead (II), 7% manganese (II), 5% mercury, 2% molybdenum (VI), 2% cadmium (II), and the remaining 3% from antimony and zinc (II) ions.
HT-nc impacts in WtE-AD processes have been reported to be largely governed by indirect upstream processes rather than by direct emissions from anaerobic digesters. Wang et al. [20] showed that Human toxicity–non-carcinogenic impacts are dominated by trace metals such as arsenic, lead, and mercury embedded in electricity generation processes, and that improvements in net energy recovery effectively reduce these impacts through electricity substitution. Similarly, Ajayi-Banji et al. [31] demonstrated that ammonia inhibition in anaerobic digestion leads to increased HT-nc impacts, not due to additional toxic emissions, but as a consequence of reduced energy recovery and increased reliance on background electricity. The dominance of arsenic and lead observed in the present study is therefore consistent with previous findings and confirms that HT-nc is highly sensitive to operational stability.
3.3. Evaluation of Inhibition Events on the Environmental Profile of WtE-AD Processes
To assess the environmental implications of operational instability in large-scale WtE-AD processes, a capacity-based assessment was performed considering different treatment capacities (60–200 t d−1) and a range of IEs over a 25-year operational horizon. Table 5 shows that the occurrence of inhibition events significantly worsened the environmental performance of all treatment capacities. The magnitude of this impact increased linearly with the number of IEs, indicating that recurrent process inhibition has a cumulative effect on climate performance. For instance, at a treatment capacity of 70 t d−1, the CCI increased from 28.1 kg CO2 eq t−1 (no IEs) to 138.6 kg CO2 eq t−1 under the most severe scenario (ten IEs). This represents an increase of nearly 400%, mainly attributed to the reduction in methane yield and, consequently, the decrease in renewable electricity generation, which limits the system’s ability to offset grid emissions. While previous studies have highlighted the advantages of scale in improving the environmental performance of anaerobic digestion plants [32,33], the present analysis demonstrates that scale also enhances environmental resilience. Plants operating at higher treatment capacities showed greater resilience to methanogenic2 inhibition effects. At 200 t d−1, even under five IEs, the system maintained a negative CCI of −2.76 kg CO2 eq t−1, indicating that the process still acted as a GHG mitigator. This behavior suggests that economies of scale can effectively buffer the environmental penalties associated with temporary operational failures.
Table 5.
Effect of inhibition events (IEs) on the climate change indicator (kg CO2 eq t−1 organic waste managed).
A critical threshold was identified between 90 and 125 t d−1, where the system transitions from a positive to a negative climate impact under stable operation (zero IEs). Below this capacity, even a small number of inhibition events can shift the system from a climate-mitigating to a climate-contributing configuration. For example, at 90 t d−1, the CCI rises from 5.6 to 59.5 kg CO2 eq t−1 with only five inhibition events, while at 125 t d−1 the system remains a GHG mitigator up to three IEs.
These results highlight that the environmental performance of WtE-AD processes is highly sensitive to both plant scale and operational reliability. Similar tendencies were observed for the other environmental indicators (see Supplementary Materials, Tables S1–S3), confirming that inhibition events exert a consistent influence across the environmental profile of WtE-AD plants.
Frequent inhibition events, often caused by fluctuations in feedstock composition or inadequate process control, can significantly undermine the climate and overall environmental benefits of anaerobic digestion. Therefore, ensuring stable reactor performance through feedstock management, monitoring, and preventive control strategies is essential to maintain the environmental advantages of WtE-AD processes. Furthermore, the findings underline the importance of scaling up facilities to achieve robustness against occasional operational failures, which is particularly relevant for developing countries where process instability may be more common due to heterogeneous waste streams and limited operational oversight.
3.4. Comparison of Using Different Electricity Mix Scenario on the Environmental Performance of WtE-AD
The influence of regional electricity mixes on the environmental performance of large-scale WtE-AD plants was assessed by modeling four representative grid scenarios: Mexico (baseline), New York (NPCC region, USA), Italy, and Germany. Only the background electricity mix associated with on-site energy consumption and electricity credits was modified, while all foreground parameters, including the mass and energy balances, remained constant. Table 6 shows a strong dependency on the environmental benefits of WtE-AD plants on the regional electricity mix. Increasing the number of inhibition events led to higher CCI values, confirming the critical role of operational reliability observed in the previous section. However, the absolute magnitude of these impacts varied substantially across regions due to differences in grid emission factors. The Mexican scenario exhibited the highest CCI values, ranging from 42.9 kg CO2 eq t−1 (no IEs) to 154.5 kg CO2-eq t−1 (ten IEs). This is primarily explained by the high fossil fuel share in the Mexican power mix, which reduces the relative environmental credit from exported electricity and amplifies the impact of reduced generation during inhibition periods.
Table 6.
Effect of different electricity mix and inhibition events (IEs) on the climate change indicator (kg CO2 eq t−1 organic waste managed).
The differences observed among the analyzed energy scenarios are explained by the composition of the corresponding electricity mixes. According to publicly available energy statistics, the Mexican electricity mix is largely dominated by fossil-based generation, whereas the German and Italian mixes exhibit higher shares of renewable energy, and the New York mix combines significant contributions from nuclear and renewables. As electricity substitution represents a major driver of environmental benefits in WtE–AD systems, displacing fossil-intensive electricity leads to higher avoided impacts, particularly for climate change and fossil resource depletion, while substitution in lower-carbon grids results in comparatively smaller benefits. These compositional differences explain the variability observed across the analyzed energy mix scenarios [34,35,36,37].
Similar dependencies between electricity mix composition and the environmental performance of WtE-AD systems have been reported in previous studies. For instance, Evangelisti et al. [38] assessed electricity generation from WtE-AD plants under the UK electricity mix and demonstrated that the environmental performance of WtE-AD processes is dominated by electricity substitution, with climate change impacts strongly dependent on the characteristics of the background power system.
Conversely, the New York (NPCC) scenario achieved the lowest CCI values, ranging from 24.5 to 61.9 kg CO2 eq t−1 across the inhibition gradient, followed by Italy and Germany, which also performed better than Mexico due to their larger share of renewable and low-carbon sources in their electricity portfolios. These results clearly illustrate that the environmental success of WtE-AD processes is highly contingent on the decarbonization level of the surrounding electricity grid. Under cleaner grid conditions, the avoided burdens from electricity export contribute more substantially to climate mitigation, allowing WtE-AD systems to act as effective GHG mitigators even under moderate operational disturbances.
Whiting and Azapagic [39] conducted a life cycle assessment of electricity and heat generation from biogas using the United Kingdom electricity mix as the reference system. Their results showed that electricity substitution is the dominant driver of environmental benefits, leading to greenhouse gas reductions of up to 34–50% and near-complete fossil resource depletion savings compared to fossil-based alternatives. Importantly, these benefits were directly linked to the fossil-intensive structure of the UK power grid, where natural gas and coal accounted for the majority of electricity generation. This finding is consistent with the present results, which demonstrate that the magnitude of environmental credits from WtE-AD systems varies substantially with the characteristics of the background electricity mix.
Similar tendencies were observed across the remaining environmental impact categories, confirming the strong dependency of the overall environmental profile on the regional electricity mix (see Supplementary Materials, Tables S4–S6). Indicators related to fossil depletion, particulate matter formation, and human toxicity-non carcinogenic exhibited consistent patterns, emphasizing that electricity substitution effects dominate the environmental performance of WtE-AD processes.
These findings underscore the critical importance of the national electricity mix in determining the true environmental success of WtE-AD technologies. Regardless of technological improvements or operational optimizations, the long-term environmental performance of these systems will remain constrained if the electricity mix continues to rely heavily on fossil-based generation. Thus, the decarbonization of the national power sector emerges as a prerequisite for realizing the full climate mitigation potential of waste-to-energy strategies. Without transitioning toward cleaner energy sources, even the most advanced WtE-AD configurations will face limited capacity to contribute effectively to net-zero or circular economy goals.
3.5. Landfill Modeling in Software EASETECH
The landfill scenario was modeled using the EASETECH software, where the input fractions consisted of FVW and MW, based on the characterization data reported in Part 1 of this study. A total input of one ton was assumed, with a 50% v/v contribution from each waste fraction. A 100-year time horizon was considered for biogas generation within the landfill cells, in accordance with standard assumptions used in life cycle assessment for long-term waste degradation. The results of this environmental assessment are presented in Table 7.
Table 7.
Environmental impact results of the landfill model in EASETECH.
The results presented in Table 7 were used to calculate the marginal environmental benefits for each scenario, based on the treatment capacity of the WtE plant and the inhibition events considered. The climate change impact obtained for the landfill scenario (1326 kg CO2 eq·t−1 of organic waste) is consistent with values reported in previous life cycle assessment studies of organic waste disposal. Lee et al. [40] reported greenhouse gas emissions of approximately 2708 kg CO2 eq·t−1 for landfilled food waste under baseline conditions, with values ranging from 1522 to 3904 kg CO2 eq·t−1 depending on landfill gas management practices and waste-specific degradation parameters.
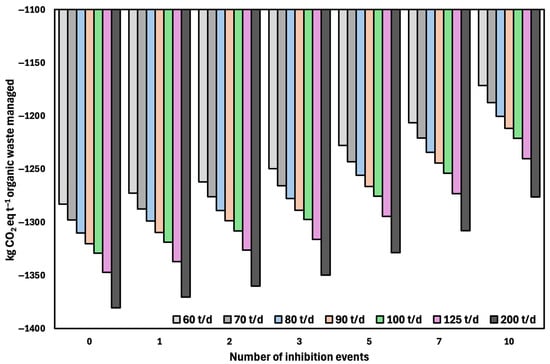
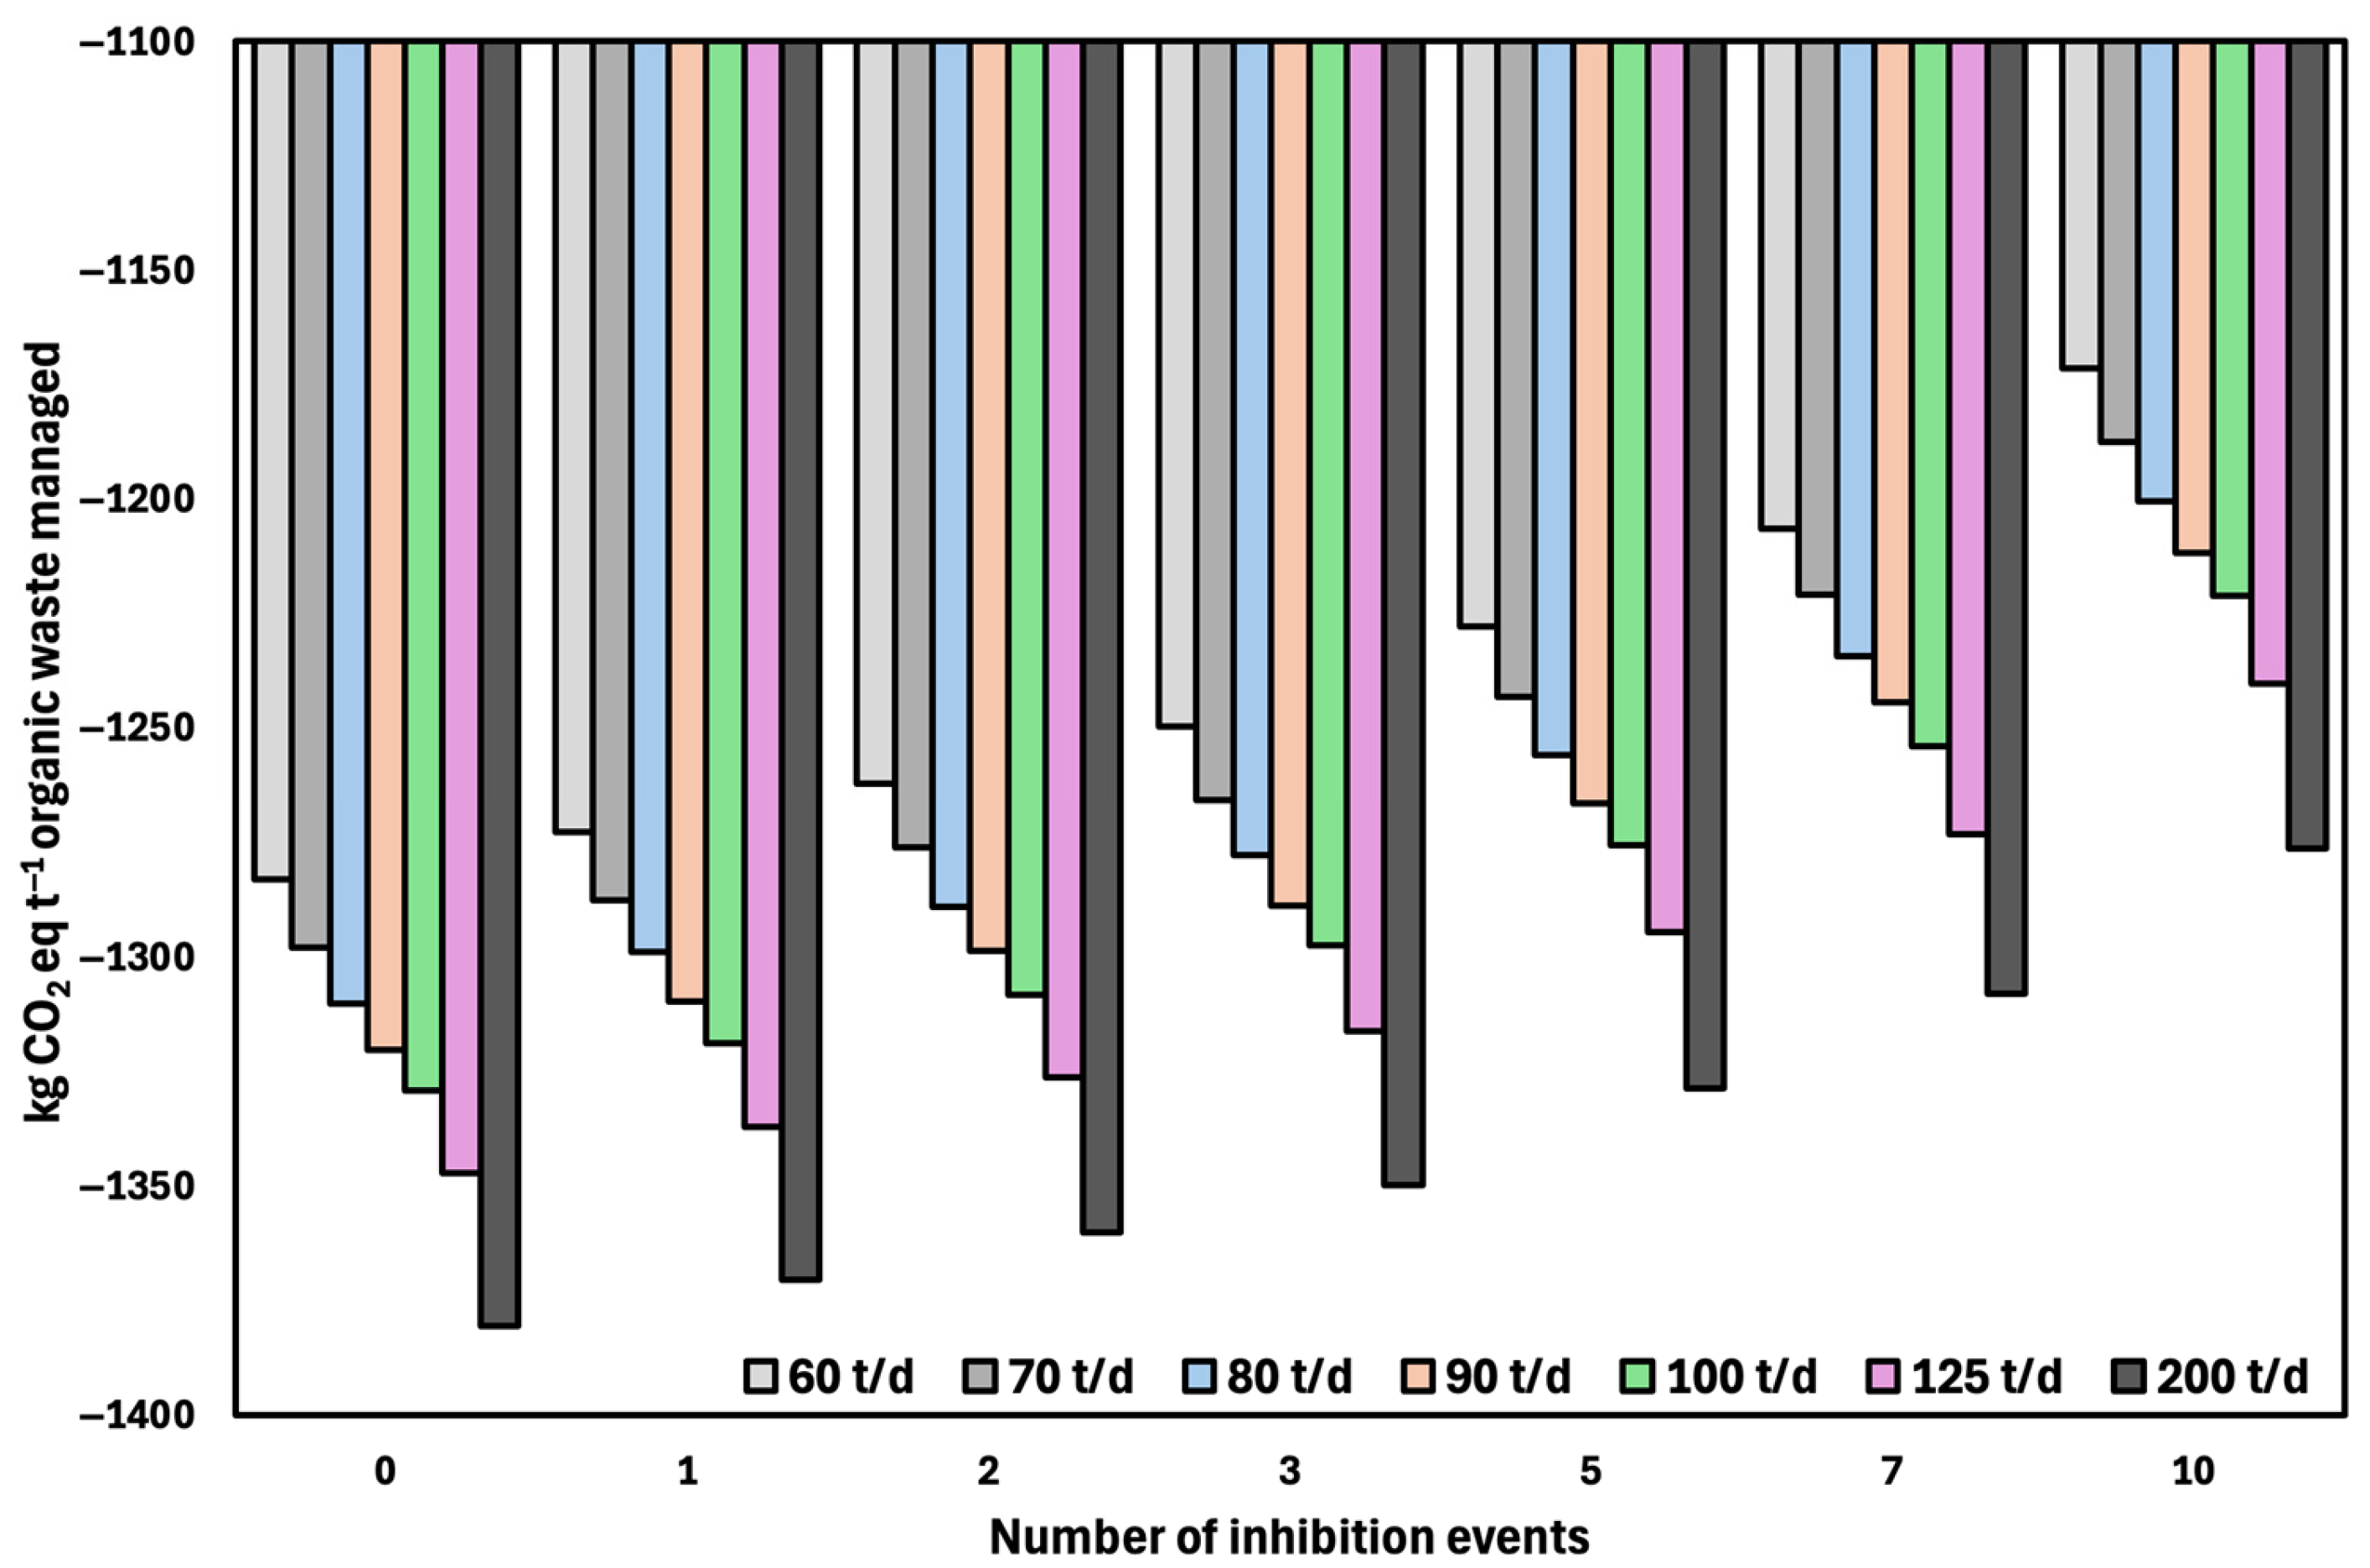
Figure 3 presents the marginal climate change benefits (in kg CO2 eq per ton of organic waste managed) for each scenario, calculated by comparing the WtE-AD system against the landfill baseline (as modeled in EASETECH and summarized in Table 7). Given that landfill disposal resulted in 1326 kg CO2 eq t−1 of organic waste, all WtE-AD scenarios provided net environmental credits by displacing this impact.
Figure 3.
Marginal Climate Change impacts of WtE-AD scenarios compared to landfill disposal, by treatment capacity and number of inhibition events.
As the number of inhibition events increases, the climate change benefit per ton of waste managed diminishes, particularly in systems with lower treatment capacities (e.g., 60–90 t d−1), where process performance is more sensitive to instability. Conversely, WtE-AD plants with higher treatment capacities (≥125 t d−1) consistently exhibit greater mitigation potential, even under severe inhibition (10 events), due to process efficiency and scale-related advantages. These results highlight the relevance of both process stability and plant capacity in maximizing climate-related environmental benefits. In a similar vein, Ouedraogo et al. [41], reported that replacing conventional municipal solid waste (MSW) management in a sanitary landfill with an integrated scenario—including recycling, gasification, and anaerobic digestion—reduced the global warming potential from 899 kg CO2-eq per ton of MSW to –14.6 kg CO2-eq, representing a net environmental benefit.
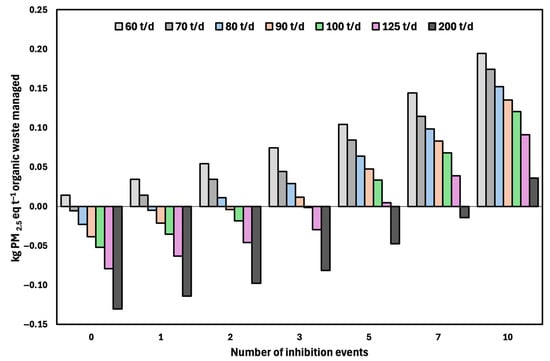
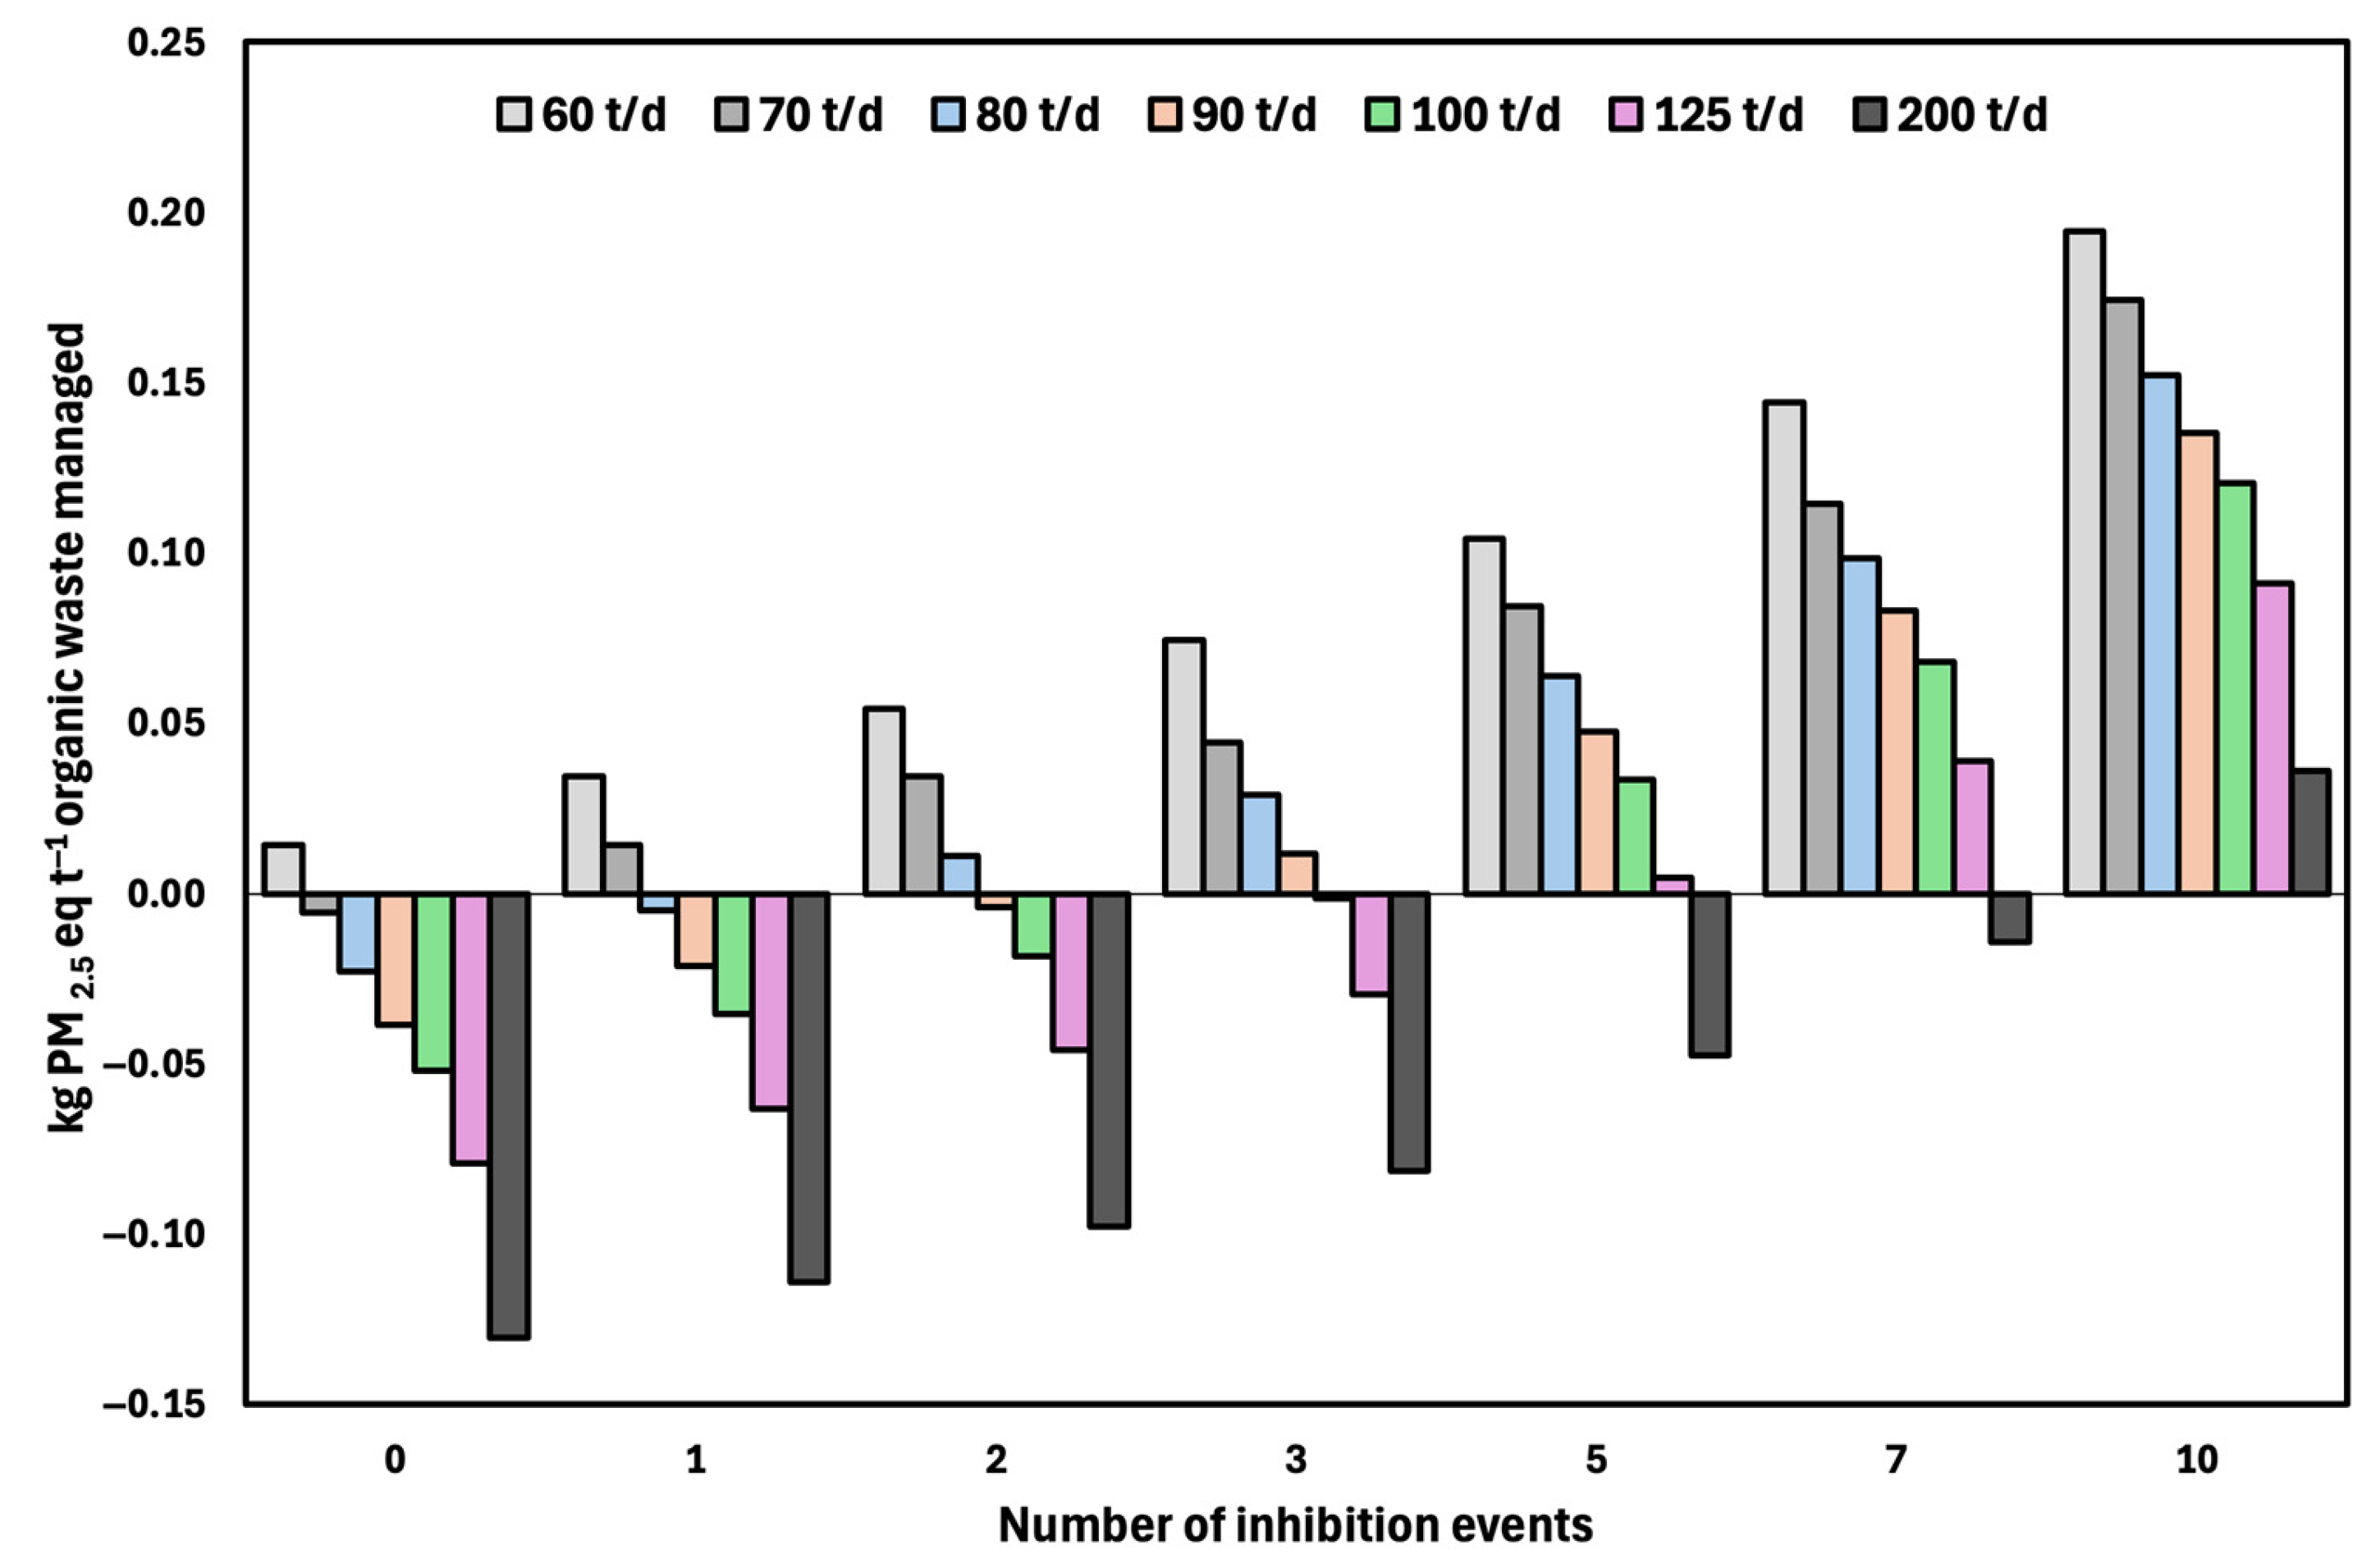
Figure 4 shows that in the absence of inhibition events, all scenarios—except for plants with a capacity of 60 t d−1—exhibit negative values for the particulate matter formation indicator, representing environmental credits associated with the process. However, as the number of inhibition events increases—from one to seven—impacts become positive (i.e., net emissions) in systems with lower treatment capacities (60–125 t d−1), indicating greater operational sensitivity under unstable conditions. Notably, plants with a capacity of 200 t d−1 maintain negative values even under severe conditions involving seven inhibition events, highlighting their greater environmental resilience in terms of particulate matter formation.
Figure 4.
Marginal particulate matter formation impacts of WtE-AD scenarios compared to landfill disposal, by treatment capacity and number of inhibition events.
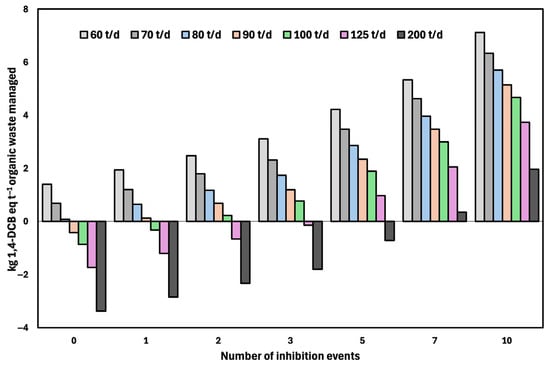
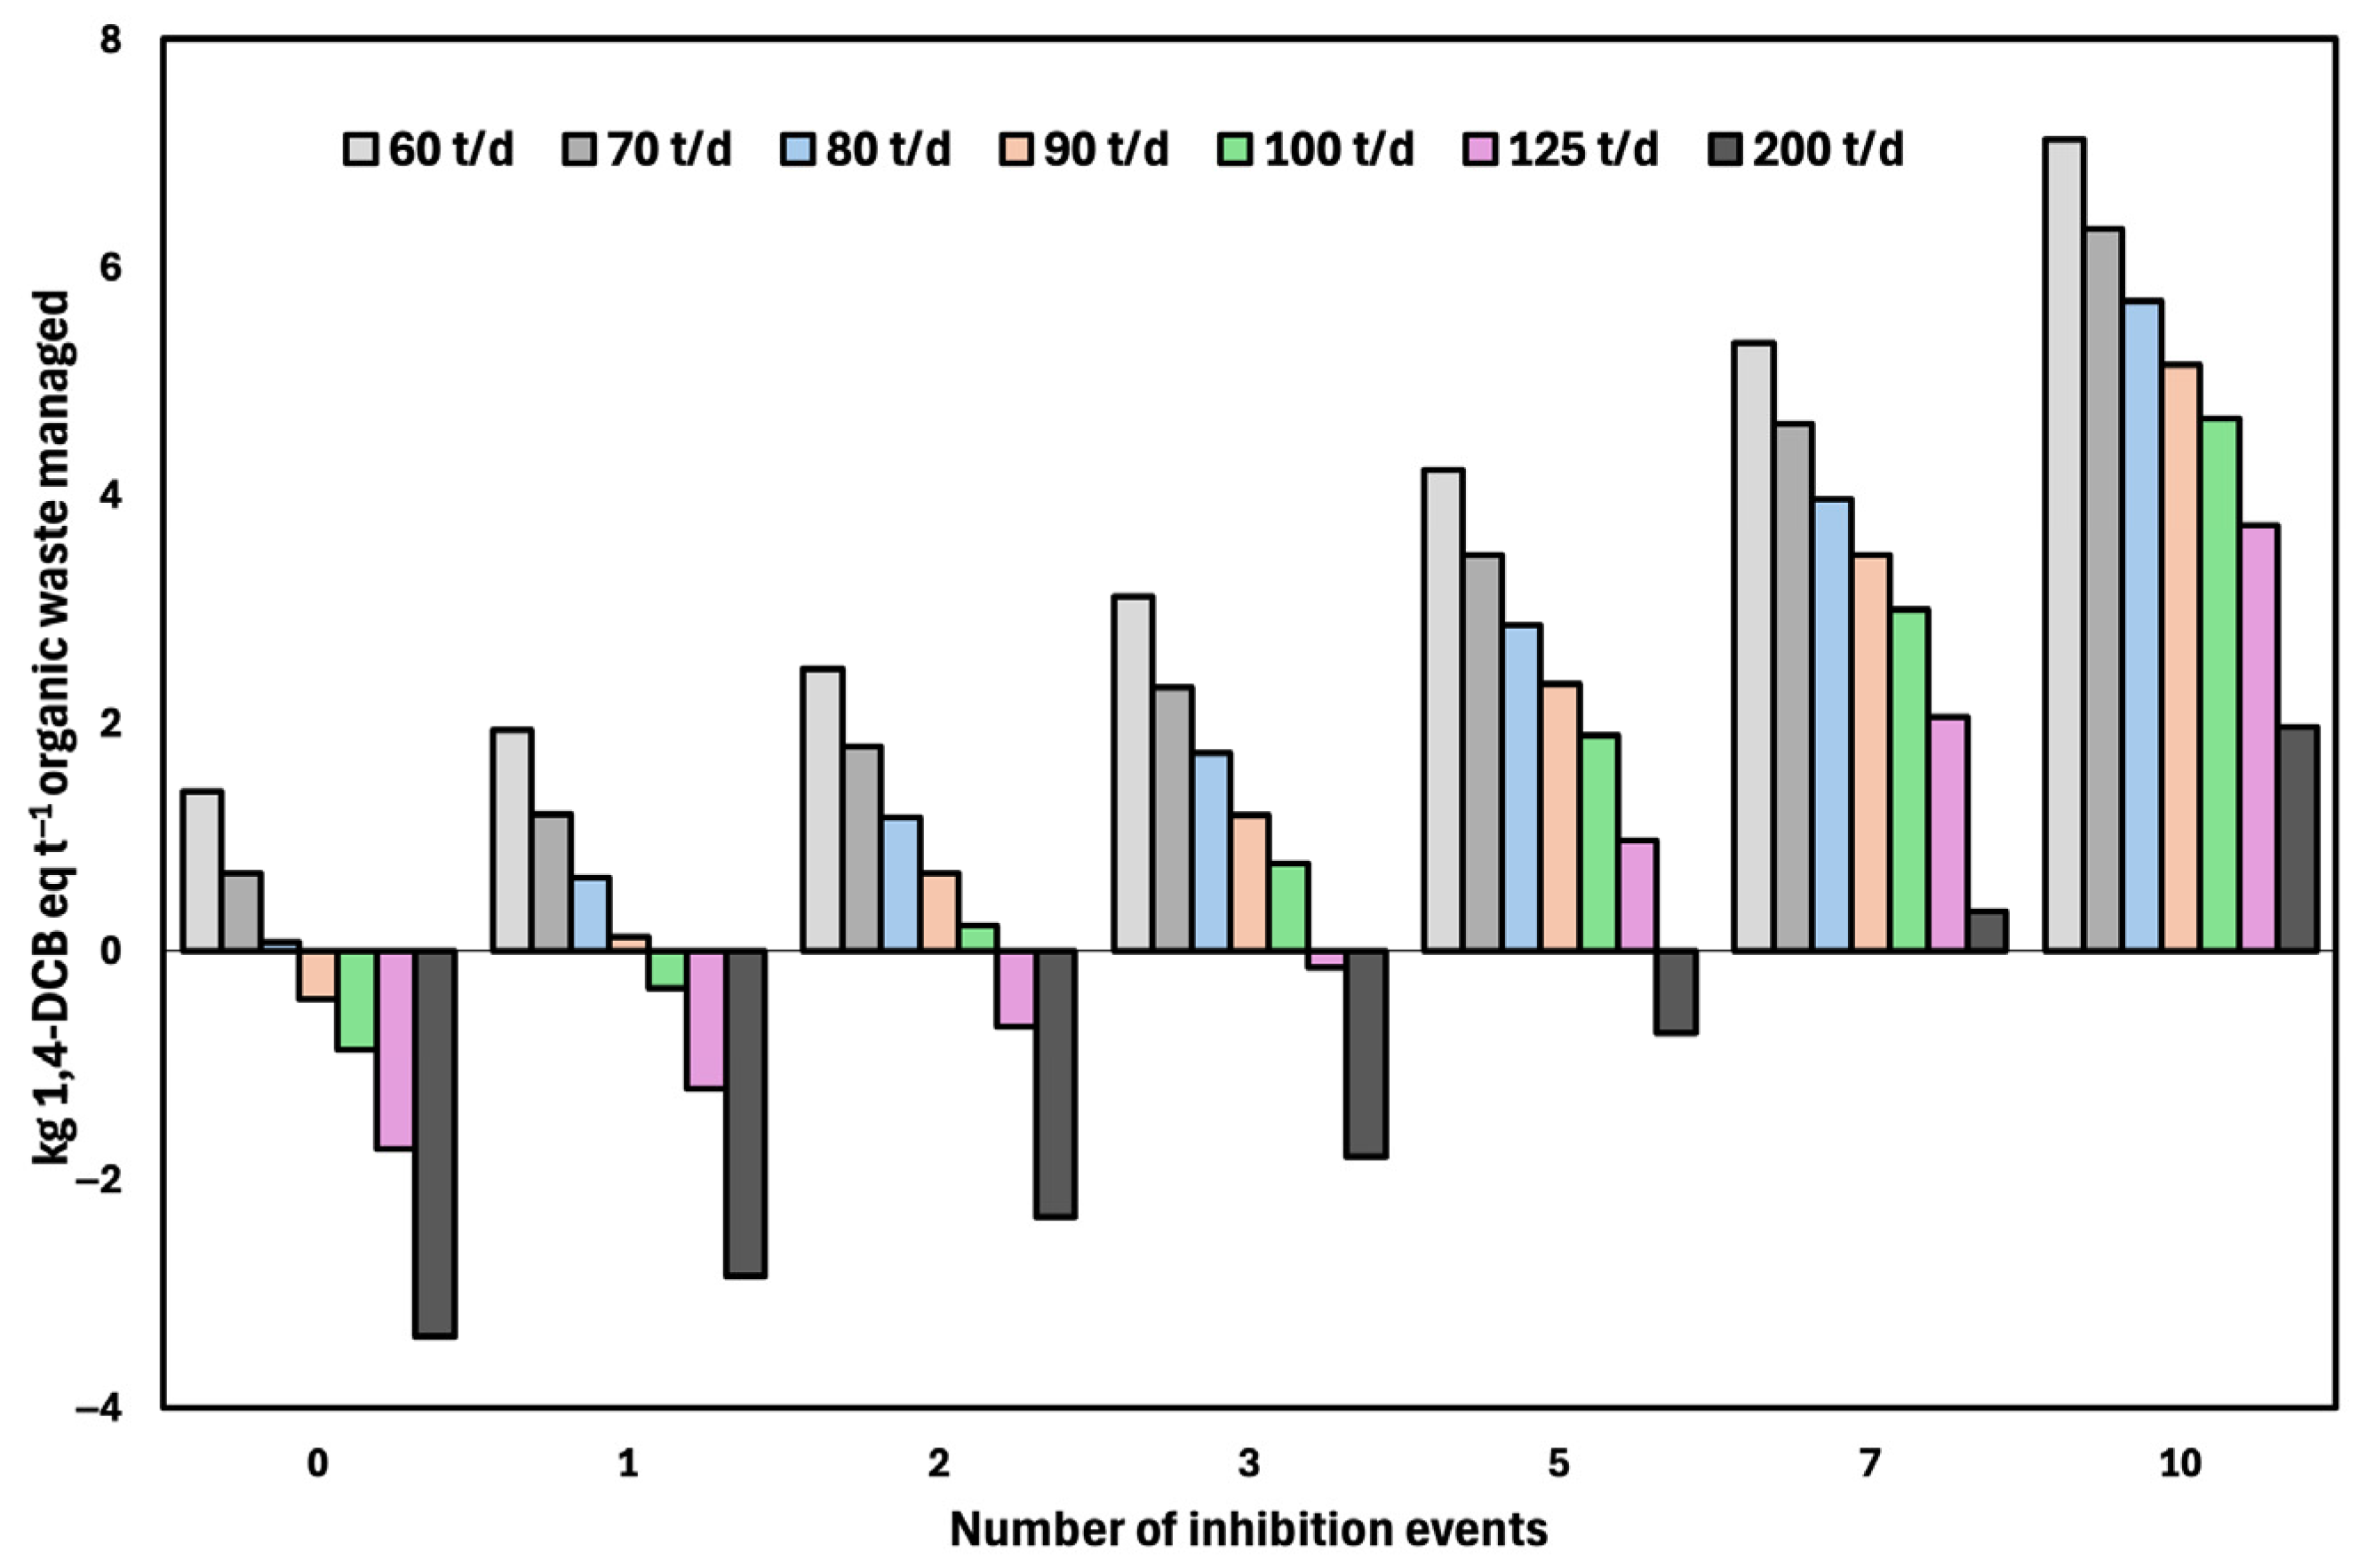
Figure 5 shows that the marginal non-carcinogenic human toxicity indicator exhibited a strong dependence on both treatment capacity and the operational stability of the process. While larger-scale systems (90–200 t d−1) achieved environmental credits in the absence of inhibition events, all scenarios showed a transition toward net emissions as the number of events increased, particularly beyond three. This behavior is primarily explained by the rise in emissions of trace elements such as arsenic, lead, cadmium, and mercury, whose contributions intensify with increased electricity consumption and input demands under unstable operating conditions.
Figure 5.
Marginal human toxicity-non carcinogenic impacts of WtE-AD scenarios compared to landfill disposal, by treatment capacity and number of inhibition events.
The comparative results obtained from the landfill modeling highlight the central role of energy substitution and landfill avoidance in determining the net environmental performance of WtE-AD processes across different treatment capacities. This behavior is consistent with previous life cycle assessments of anaerobic digestion systems, such as the study by Opatokun et al. [42], who showed that electricity generation from biogas and the diversion of organic waste from landfill lead to net environmental benefits across impact categories dominated by energy substitution, including climate change, particulate matter formation, fossil fuel depletion, and human toxicity. In their assessment, these benefits were sufficient to outweigh the direct burdens of the AD process, resulting in substantial net reductions of −757 g CO2 eq, −0.39 g PM10 eq, −87.9 g oil eq, and −10.5 g 1,4-DCB eq per kg of waste treated, respectively.
Overall, the results of this study provide insights that go beyond conventional life cycle assessments applied to WtE-AD processes. From an operational perspective, the analysis demonstrates that recurrent methanogenic inhibition events can substantially deteriorate the environmental performance of WtE-AD plants, underscoring the need for robust feedstock management and continuous process monitoring by plant operators. The identification of treatment capacity thresholds indicates that larger-scale facilities exhibit greater environmental resilience to temporary performance losses, offering relevant guidance for technology developers and infrastructure planners. At the policy level, the pronounced sensitivity of environmental outcomes to the regional electricity mix highlights that the climate mitigation potential of WtE-AD systems is closely linked to the characteristics of the surrounding energy system. Importantly, this work advances the state of the art by explicitly quantifying the long-term environmental implications of recurrent inhibition events within an industrial-scale LCA framework, an aspect that has not been explicitly quantified in previous LCA studies of WtE-AD processes, thereby providing novel evidence on the vulnerability and robustness of Waste to Energy strategies under non-ideal operating conditions.
However, a knowledge gap in this work lies in the planned scaling scheme, which relies on biogas yield data evaluated at laboratory scale. This constitutes a source of uncertainty for the overall study and highlights a clear opportunity for future assessments.
4. Conclusions
This study assessed, from a life cycle perspective, the environmental implications of recurrent methanogenic inhibition events in industrial-scale Waste-to-Energy anaerobic digestion (WtE-AD) plants operating under conditions representative of Mexico. The analysis confirms that methanogenic stability is a key determinant of the environmental performance of WtE-AD systems, as inhibition events compromise organic matter conversion efficiency and reduce the environmental benefits associated with renewable energy generation. The results note that plant scale plays a relevant role in moderating the environmental effects of inhibition. Larger treatment capacities show greater robustness against operational disturbances, allowing WtE-AD systems to maintain environmental benefits under limited inhibition scenarios. This finding highlights the importance of appropriate plant sizing and operational stability when evaluating the environmental viability of anaerobic digestion systems at an industrial scale. The environmental performance of WtE-AD systems was also shown to depend on the characteristics of the displaced electricity mix. Higher mitigation potential is achieved when electricity generated from biogas replaces fossil-intensive grids, whereas benefits are reduced when low-carbon electricity systems are displaced. This reinforces the context-specific nature of life cycle assessments and indicates that the environmental advantages of WtE-AD are strongly influenced by regional energy systems. From a methodological perspective, this work provides life cycle inventory data for industrial-scale WtE-AD plants under methanogenic inhibition scenarios, developed through a non-linear scaling approach based on design equations and operational parameters. These inventories contribute to reducing data gaps for anaerobic digestion technologies in Latin America and support more consistent environmental assessments in regions where primary industrial data remain limited. When compared to landfill disposal as a reference linear management option, WtE-AD systems show clear environmental advantages in terms of energy recovery and avoided emissions under stable operating conditions. However, these benefits should be interpreted with caution, as the present study did not explicitly include aspects such as waste collection logistics, transportation distances, or plant siting constraints, which may influence the overall environmental performance of full-scale implementations. Overall, the findings suggest that WtE-AD can represent an environmentally favorable strategy for organic waste management when methanogenic stability is ensured, and plant scale is appropriately selected. At the same time, the results emphasize the need for future studies to integrate logistical, spatial, and infrastructural factors to provide a more comprehensive assessment of WtE-AD systems within complex waste management frameworks.
Supplementary Materials
The following supporting information can be downloaded at: https://www.mdpi.com/article/10.3390/fermentation12020087/s1, Table S1: Effect of inhibition events (IEs) on human non-carcinogenic toxicity (kg 1,4-DCB eq t−1 organic waste managed); Table S2: Effect of inhibition events (IEs) on the fossil depletion indicator (kg oil eq t−1 organic waste managed); Table S3: Effect of inhibition events (IEs) on the particulate matter formation indicator (kg PM10 eq t−1 organic waste managed); Table S4: Effect of different electricity mix and inhibition events (IEs) on the human toxicity-non carcinogenic indicator (kg 1-4 DB eq t−1 organic waste managed); Table S5: Effect of different electricity mix and inhibition events (IEs) on the particulate matter formation indicator (kg PM10 eq t−1 organic waste managed); Table S6: Effect of different electricity mix and inhibition events (IEs) on the fossil depletion indicator (kg oil eq t−1 organic waste managed).
Author Contributions
Conceptualization: L.R.M.-M., A.A.-R. and P.R.-G.; data curation: E.E.G.-B.; formal analysis: L.R.M.-M., A.A.-R. and P.R.-G.; funding acquisition: P.R.-G.; investigation: E.E.G.-B.; methodology: L.R.M.-M. and E.E.G.-B.; project administration: P.R.-G.; resources: P.R.-G.; software: E.E.G.-B. and A.A.-R.; supervision: P.R.-G. and L.R.M.-M.; validation: P.R.-G.; visualization: P.R.-G.; writing—original draft: E.E.G.-B.; writing—review and editing: A.A.-R., L.R.M.-M. and P.R.-G. All authors have read and agreed to the published version of the manuscript.
Funding
This work was supported by the Autonomous University of Nuevo León through a PAICYT grant 124-IDT-2024.
Institutional Review Board Statement
Not applicable.
Informed Consent Statement
Not applicable.
Data Availability Statement
The original contributions presented in this study are included in the article/Supplementary Materials. Further inquiries can be directed to the corresponding authors.
Conflicts of Interest
Author Alonso Albalate-Ramírez was employed by the company NEOCICLO SAS de CV. The remaining authors declare that the research was conducted in the absence of any commercial or financial relationships that could be construed as a potential conflict of interest.
Abbreviations
The following abbreviations are used in this manuscript:
| AD | Anaerobic digestion |
| B.G. | Biofertilizer generation |
| CC BY | Creative Commons Attribution |
| CCI | Climate change indicator |
| CSTR | Continuous stirred-tank reactor |
| E.C. | Electricity consumption |
| E.G. | Electricity generation |
| FD | Fossil depletion |
| FDS | Final disposal sites |
| FU | Functional unit |
| FVW | Fruit and vegetable waste |
| GHGs | Greenhouse gases |
| HT-nc | Human toxicity-non-carcinogenic |
| IEs | Inhibition events |
| INECC | Instituto Nacional de Ecología y Cambio Climático |
| ISO | International Organization for Standardization |
| LCA | Life cycle assessment |
| LCI | Life cycle inventory |
| MSW | Municipal solid waste |
| MW | Meat waste |
| NPCC | NPCC region (New York, USA grid mix region) |
| PMF | Particulate matter formation |
| RF | Reference flow |
| SL | Sanitary landfill |
| VFAs | Volatile fatty acids |
| VS | Volatile solids |
| WtE | Waste-to-Energy |
| WtE-AD | Waste-to-energy anaerobic digestion |
References
- Botello-Álvarez, J.E.; Rivas-García, P.; Fausto-Castro, L.; Estrada-Baltazar, A.; Gomez-Gonzalez, R. Informal collection, recycling and export of valuable waste as transcendent factor in the municipal solid waste management: A Latin-American reality. J. Clean. Prod. 2018, 182, 485–495. [Google Scholar] [CrossRef] [Scilit]
- Tsydenova, N.; Morillas, A.V.; Hernández, Á.M.; Soria, D.R.; Wilches, C.; Pehlken, A. Feasibility and barriers for anaerobic digestion in Mexico City. Sustainability 2019, 11, 4114. [Google Scholar] [CrossRef] [Scilit]
- Bacenetti, J.; Fiala, M. Carbon footprint of electricity from anaerobic digestion plants in Italy. Environ. Eng. Manag. J. 2015, 14, 1495–1502. [Google Scholar] [CrossRef] [Scilit]
- Miramontes-Martínez, L.R.; Rivas-García, P.; Briones-Cristerna, R.A.; Abel-Seabra, J.E.; Padilla-Rivera, A.; Botello-Álvarez, J.E.; Alcalá-Rodríguez, M.M.; Levasseur, A. Potential of electricity generation by organic wastes in Latin America: A techno-economic-environmental analysis. Biomass Convers. Biorefin. 2022, 14, 27113–27124. [Google Scholar] [CrossRef] [Scilit]
- Tian, H.; Wang, X.; Lim, E.Y.; Lee, J.T.; Ee, A.W.; Zhang, J.; Tong, Y.W. Life cycle assessment of food waste to energy and resources: Centralized and decentralized anaerobic digestion with different downstream biogas utilization. Renew. Sustain. Energy Rev. 2021, 150, 111489. [Google Scholar] [CrossRef] [Scilit]
- Woon, K.S.; Lo, I.M.C.; Chiu, S.L.H.; Yan, D.Y. Environmental assessment of food waste valorization in producing biogas for various types of energy use based on LCA approach. Waste Manag. 2016, 50, 290–299. [Google Scholar] [CrossRef] [Scilit]
- Briones Cristerna, R.A. Evaluación del Aprovechamiento Integral de los Residuos Sólidos de las Centrales de Abasto en Áreas Metropolitanas de Latinoamérica. Ph.D. Thesis, Universidad Autónoma de Nuevo León, San Nicolás de los Garza, NL, Mexico, 2020. [Google Scholar]
- Albalate-Ramírez, A.; Padilla-Rivera, A.; Rueda-Avellaneda, J.F.; López-Hernández, B.N.; Miramontes-Martínez, L.R.; Estrada-Baltazar, A.; Rivas-García, P. Mapping the Sustainability of Waste-to-Energy Processes for Food Loss and Waste in Mexico—Part 2: Environmental and Economic Analysis. Sustainability 2024, 16, 9774. [Google Scholar] [CrossRef] [Scilit]
- Alibardi, L.; Cossu, R. Composition variability of the organic fraction of municipal solid waste and effects on hydrogen and methane production potentials. Waste Manag. 2015, 36, 147–155. [Google Scholar] [CrossRef] [Scilit]
- Fisgativa, H.; Tremier, A.; Dabert, P. Characterizing the variability of food waste quality: A need for efficient valorisation through anaerobic digestion. Waste Manag. 2016, 50, 264–274. [Google Scholar] [CrossRef] [Scilit]
- Alvarado-Reyna, P.M.; Albalate-Ramírez, A.; García-Balandrán, E.E.; Escamilla-Alvarado, C.; Galván-Arzola, U.; Miramontes-Martínez, L.R.; Rivas-García, P. Evaluation of the reaction capacity of early warning indicators to failures in biogas production systems. Rev. Mex. Ing. Quim. 2024, 23, Bio24313. [Google Scholar] [CrossRef] [Scilit]
- Nielsen, H.B.; Angelidaki, I. Congestion of manure and industrial organic waste at centralized biogas plants: Process imbalances and limitations. Water Sci. Technol. 2008, 58, 1521–1528. [Google Scholar] [CrossRef] [Scilit] [PubMed]
- Díaz-Castro, D.E.; García-Balandrán, E.E.; Albalate-Ramírez, A.; Escamilla-Alvarado, C.; Sinagawa-García, S.R.; Rivas-García, P.; Miramontes-Martínez, L.R. How Does Methanogenic Inhibition Affect Large-Scale Waste-to-Energy Anaerobic Digestion Processes? Part 1—Techno-Economic Analysis. Fermentation 2025, 11, 510. [Google Scholar] [CrossRef] [Scilit]
- Fiore, S.; Ruffino, B.; Campo, G.; Roati, C.; Zanetti, M.C. Scale-up evaluation of the anaerobic digestion of food-processing industrial wastes. Renew. Energy 2016, 96, 949–959. [Google Scholar] [CrossRef] [Scilit]
- Lüdtke, M.; Nordberg, A.; Baresel, C. Experimental power of laboratory-scale results and transferability to full-scale anaerobic digestion. Water Sci. Technol. 2017, 76, 983–991. [Google Scholar] [CrossRef] [Scilit]
- ISO 14040:2006; Gestión Ambiental. Análisis del Ciclo de Vida. Principios y Marco. International Organization for Standarization: Geneva, Switzerland, 2006.
- ISO 14044:2006; Gestión Ambiental. Análisis del Ciclo de Vida. Requisitos y Directrices. International Organization for Standarization: Geneva, Switzerland, 2006. Available online: https://standards.iteh.ai/catalog/standards/sist/b3d74118-4c9f-4f3e-b556-11d704441abb/iso-14044-2006 (accessed on 1 December 2025).
- Galván-Arzola, U.; Miramontes-Martínez, L.R.; Escamilla-Alvarado, C.; Botello-Álvarez, J.E.; Alcalá-Rodríguez, M.M.; Valencia-Vázquez, R.; Rivas-García, P. Anaerobic digestion of agro-industrial waste: Anaerobic lagoons in Latin America. Rev. Mex. Ing. Quim. 2022, 21, 1–17. [Google Scholar] [CrossRef] [Scilit]
- Huijbregts, M.A.; Steinmann, Z.J.; Elshout, P.M.; Stam, G.; Verones, F.; Vieira, M.; Zijp, M.; Hollander, A.; van Zelm, R. ReCiPe2016: A harmonised life cycle impact assessment method at midpoint and endpoint level. Int. J. Life Cycle Assess. 2017, 22, 138–147. [Google Scholar] [CrossRef] [Scilit]
- Wang, S.; Sahoo, K.; Jena, U.; Dong, H.; Bergman, R.; Runge, T. Life-cycle assessment of treating slaughterhouse waste using anaerobic digestion systems. J. Clean. Prod. 2021, 292, 126038. [Google Scholar] [CrossRef] [Scilit]
- Rotthong, M.; Takaoka, M.; Oshita, K.; Rachdawong, P.; Gheewala, S.H.; Prapaspongsa, T. Life Cycle Assessment of Integrated Municipal Organic Waste Management Systems in Thailand. Sustainability 2023, 15, 90. [Google Scholar] [CrossRef] [Scilit]
- Albalate-Ramírez, A.; Padilla-Rivera, A.; Rueda-Avellaneda, J.F.; López-Hernández, B.N.; Cano-Gómez, J.J.; Rivas-García, P. Mapping the Sustainability of Waste-to-Energy Processes for Food Loss and Waste in Mexico—Part 1: Energy Feasibility Study. Sustainability 2024, 16, 6111. [Google Scholar] [CrossRef] [Scilit]
- INECC. Inventario Nacional de Emisiones de Gases y Compuestos de Efecto Invernadero; Instituto Nacional de Ecología y Cambio Climático (INECC): Mexico City, Mexico, 2018. [Google Scholar]
- Bacenetti, J.; Fusi, A. The environmental burdens of maize silage production: Influence of different ensiling techniques. Anim. Feed. Sci. Technol. 2015, 204, 88–98. [Google Scholar] [CrossRef] [Scilit]
- Pérez-Camacho, M.N.; Curry, R.; Cromie, T. Life cycle environmental impacts of substituting food wastes for traditional anaerobic digestion feedstocks. Waste Manag. 2018, 73, 140–155. [Google Scholar] [CrossRef] [Scilit] [PubMed]
- Lin, J.; Zuo, J.; Gan, L.; Li, P.; Liu, F.; Wang, K.; Chen, L.; Gan, H. Effects of mixture ratio on anaerobic co-digestion with fruit and vegetable waste and food waste of China. J. Environ. Sci. 2011, 23, 1403–1408. [Google Scholar] [CrossRef] [Scilit] [PubMed]
- Zia, M.; Ahmed, S.; Kumar, A. Anaerobic digestion (AD) of fruit and vegetable market waste (FVMW): Potential of FVMW, bioreactor performance, co-substrates, and pre-treatment techniques. Biomass Convers. Biorefin. 2022, 12, 3573–3592. [Google Scholar] [CrossRef] [Scilit]
- Scano, E.A.; Asquer, C.; Pistis, A.; Ortu, L.; Demontis, V.; Cocco, D. Biogas from anaerobic digestion of fruit and vegetable wastes: Experimental results on pilot-scale and preliminary performance evaluation of a full-scale power plant. Energy Convers. Manag. 2014, 77, 22–30. [Google Scholar] [CrossRef] [Scilit]
- Mozhiarasi, V.; Balakumar, R.; Benish Rose, P.M.; Speier, C.J.; Weichgrebe, D.; Srinivasan, S.V.; Suthanthararajan, R. Enhancing methane production by anaerobic co-digestion of extruded organic wastes from slaughterhouse and vegetable market in batch and continuous processes. Clean Technol. Environ. Policy 2021, 23, 2727–2740. [Google Scholar] [CrossRef] [Scilit]
- Zhang, J.; Tian, H.; Wang, X.; Tong, Y.W. Effects of activated carbon on mesophilic and thermophilic anaerobic digestion of food waste: Process performance and life cycle assessment. Chem. Eng. J. 2020, 399, 125757. [Google Scholar] [CrossRef] [Scilit]
- Ajayi-Banji, A.; Pourhashem, G.; Rahman, S.; Feng, X. Evaluating the Environmental Impacts of Pretreatment and Nanoparticles in Solid-State Anaerobic Digestion Using Life Cycle Assessment. BioEnergy Res. 2024, 17, 1971–1984. [Google Scholar] [CrossRef] [Scilit]
- Scarlat, N.; Dallemand, J.F.; Fahl, F. Biogas: Developments and perspectives in Europe. Renew. Energy 2018, 129, 457–472. [Google Scholar] [CrossRef] [Scilit]
- Poeschl, M.; Ward, S.; Owende, P. Environmental impacts of biogas deployment—Part I: Life Cycle Inventory for evaluation of production process emissions to air. J. Clean. Prod. 2012, 24, 168–183. [Google Scholar] [CrossRef] [Scilit]
- Low Carbon Power. Electricidad en Nueva York en 2024/2025. Available online: https://lowcarbonpower.org/es/region/Nueva_York (accessed on 15 December 2025).
- Low Carbon Power. Electricidad en México en 2024/2025. Available online: https://lowcarbonpower.org/es/region/Mexico (accessed on 15 December 2025).
- Low Carbon Power. Electricidad en Italia en 2024/2025. Available online: https://lowcarbonpower.org/es/region/Italia (accessed on 15 December 2025).
- Low Carbon Power. Electricidad en Alemania en 2024/2025. Available online: https://lowcarbonpower.org/es/region/Alemania (accessed on 15 December 2025).
- Evangelisti, S.; Lettieri, P.; Borello, D.; Clift, R. Life cycle assessment of energy from waste via anaerobic digestion: A UK case study. Waste Manag. 2014, 34, 226–237. [Google Scholar] [CrossRef] [Scilit]
- Whiting, A.; Azapagic, A. Life cycle environmental impacts of generating electricity and heat from biogas produced by anaerobic digestion. Energy 2014, 70, 181–193. [Google Scholar] [CrossRef] [Scilit]
- Lee, U.; Han, J.; Wang, M. Evaluation of landfill gas emissions from municipal solid waste landfills for the life-cycle analysis of waste-to-energy pathways. J. Clean. Prod. 2017, 166, 335–342. [Google Scholar] [CrossRef] [Scilit]
- Ouedraogo, A.S.; Kumar, A.; Frazier, R.; Sallam, K.A. Comparative Life Cycle Assessment of Landfilling with Sustainable Waste Management Methods for Municipal Solid Wastes. Environments 2024, 11, 248. [Google Scholar] [CrossRef] [Scilit]
- Opatokun, S.A.; Lopez-Sabiron, A.M.; Ferreira, G.; Strezov, V. Life cycle analysis of energy production from food waste through anaerobic digestion, pyrolysis and integrated energy system. Sustainability 2017, 9, 1804. [Google Scholar] [CrossRef] [Scilit]

Disclaimer/Publisher’s Note: The statements, opinions and data contained in all publications are solely those of the individual author(s) and contributor(s) and not of MDPI and/or the editor(s). MDPI and/or the editor(s) disclaim responsibility for any injury to people or property resulting from any ideas, methods, instructions or products referred to in the content. |
© 2026 by the authors. Licensee MDPI, Basel, Switzerland. This article is an open access article distributed under the terms and conditions of the Creative Commons Attribution (CC BY) license.