


Abstract
Regional assessments of livestock manure often treat excreted organic matter as available feedstock and methane volume as an unequivocal climate benefit. This study builds a four-level resource cascade (theoretical, collectable, recoverable, and deployment-constrained methane) for 20 Latin American countries from 2024 FAOSTAT inventories of cattle, pigs, and poultry with IPCC-consistent parameters, and evaluates each level across energy, exergy, nitrogen, and climate. The theoretical envelope of 73.88 × 10⁹ m3 CH4 a−1 contracts by 82.1% to 13.22 recoverable and to a deployment corridor of 6.74 (95% interval 5.05–9.27); cattle fall from 85.4% of the theoretical to 32.5% of the recoverable resource, whereas poultry rises to 40.4%, a share conditional on controlling ammonia inhibition. Energy and climate hierarchies diverge: pigs hold 27.1% of recoverable methane yet deliver all positive manure-management mitigation (+29.14 Mt CO2eq a−1 at 5% leakage), and the central net balance including grid displacement is +43.96 Mt CO2eq a−1, with a production-based break-even leakage of 15.00%. On an exergy-equivalent basis (81.52 TWhx a−1), recovered nitrogen (25.26 TWhx; 3.77 Mt N a−1) exceeds useful heat (10.24 TWhx). Monte Carlo propagation (20,000 iterations) identifies cattle collectability as the dominant resource uncertainty (Spearman ) and digester leakage as the dominant climate uncertainty (; 99.4% probability of positive management mitigation). Intensification scenarios raise recoverable methane to 16.97–20.73 × 10⁹ m3 a−1 by 2035, and published techno-economic evidence shows that profitability depends on scale, incentives, and coproducts. Abundance, recoverability, climate effectiveness, and economic viability are four distinct quantities that must be evaluated jointly.
1. Introduction
Livestock production supports food security and rural employment in Latin America, but it is also a major agricultural source of methane and a source of pressure on soils and water resources [1,2,3]. Across the 20 countries analyzed, the 2024 inventories include more than 400 million cattle, about 100 million pigs, and several billion poultry animals [4]. Their manure streams therefore represent both an environmental liability and a circular resource: they can supply anaerobic digestion (AD) [5,6,7], retain recoverable nutrients [8,9], and mitigate greenhouse gas (GHG) emissions when AD displaces sufficiently methane-intensive baseline management systems [10,11]. Because the microbiological and process foundations of AD are mature [12,13,14] and biochemical methane potential (BMP) protocols are standardized [15], the regional research question is no longer whether manure can produce methane, but how much of the theoretical resource is physically accessible, technically recoverable, and environmentally beneficial.
Most regional assessments begin by combining livestock inventories, manure-generation factors, volatile solids (VS), and methane yields to estimate a theoretical biogas resource. This is a necessary first step, but bioenergy-assessment frameworks have long distinguished theoretical, technical, economic, and implementable potentials because conflating these levels can produce non-comparable estimates and weak policy signals [16]. For manure, species-specific availability or collection factors have long been part of national inventories, from the early assessments based on geographic information systems (GIS) for Greece [17] and Turkey [18] to the European projections to 2030 of Meyer et al. [19] and the availability model for Poland of Sefeedpari et al. [20]; within Latin America, farm-size-dependent manure collection rates have been applied to dairy systems [21]. Spatially explicit European studies further show that the transition from theoretical to realistic potential depends strongly on whether manure is physically collectable under the prevailing management system [22,23]. In these assessments, however, the collection factors are adopted as survey- or expert-based constants that are disconnected from the manure-management-system (MMS) distributions used in national greenhouse-gas inventories, so that the resource and climate layers rarely share a common, auditable basis. In Latin America, regional studies have quantified bioenergy from agricultural and livestock residues [24], proposed thermoeconomic circular-biorefineries [25], and estimated manure-derived organic-fertilizer potential [26]. National and subnational assessments also provide important evidence for Mexico (state of Jalisco) [27], Brazil (national scale and the state of Rio de Janeiro) [28,29,30,31], Argentina (Buenos Aires Province) [32], and Uruguay [33]. However, the available literature does not yet provide a harmonized Latin American quantification of how the theoretical manure resource contracts under explicit collectability and process-realization constraints, or how that contraction alters the relative importance of livestock categories and countries.
A second problem concerns how the recoverable resource is evaluated. Even when collectability is considered, inventories are commonly expressed along a single axis—methane volume or its energy equivalent—and the climate benefit of recovery is often treated as implicit. Both assumptions require explicit testing. Regarding climate effects, baseline emissions depend strongly on the manure-management system in which the manure is currently handled: manure deposited during grazing or stored under dry conditions generally has low methane emissions, reflected in methane conversion factors (MCFs) of only a few percentage points. In such cases, diverting manure to an anaerobic digester does not necessarily reduce emissions and increases them whenever the methane lost from the digestion system exceeds the methane that the manure would have emitted under its baseline management, a condition already met at leakage rates commonly measured in the field. By contrast, liquid slurries and uncovered lagoons typically have substantially higher baseline MCFs, so that anaerobic digestion has a far greater potential to reduce methane emissions [3,10,11]. Field measurements place leakage from biogas systems between 0.4% and 14.9% of production [34,35,36], while national programs have demonstrated the capacity to reduce it below 1% [37]. Regarding the product portfolio, methane, electricity, heat, and nutrients are reported in incommensurable units, preventing any rigorous statement regarding what a livestock-waste biorefinery actually recovers—as distinct from a biogas plant. Exergy provides a thermodynamically consistent common currency for this multiproduct accounting [38,39,40,41], with particular relevance to reactive nitrogen, whose industrial synthesis via the Haber–Bosch process transformed global agriculture at a considerable exergetic cost [42,43,44]; however, the published exergy literature identified for this study is concentrated mainly at the plant scale [45,46], and no harmonized Latin American manure-resource inventory integrating methane, useful heat, and nitrogen on a common exergy-equivalent basis was identified.
The Latin American experience with digesters provides the empirical basis for constraining the cascade factors: low-cost tubular digesters disseminated from Bolivia [47,48], long-term psychrophilic operation in Colombia [49,50], high-Andean codigestion [51], Central American plug-flow systems [52], and reviews of household and small-scale digesters in developing countries [53,54,55,56,57,58], together with institutional programs in Mexico [59], Africa [60,61], and Colombian coffee farms [62]. The authors’ experimental program validated compact designs and operational control based on pH and electrical conductivity (pH–EC) in the Chillón Valley and Huaycán [63,64], as well as industrial digesters for sugar-industry by-products [65]. A complementary national analysis for Peru by the authors [66] modeled manure recoverability as a time-dependent confinement trajectory across seven livestock categories. The analysis identified a divergence between the energy and mitigation rankings: broilers ranked first in terms of recoverable energy but last in terms of avoided methane emissions, whereas swine ranked first in mitigation potential. It also estimated a national break-even digester leakage rate of only 4.6%, referenced to the methane potential of the collected manure. Whether these results reflect conditions specific to Peru or point to a broader structural feature of livestock systems across Latin America remains an open question that requires regional analysis.
Finally, the economic dimension cannot be ignored, but neither can it be fabricated. Recent Latin American evidence shows that identical technologies at identical scales can yield markedly different profitability across countries because of differences in investment costs, coproduct valorization, incentives, and discount rates [67,68,69], thereby invalidating the common practice of projecting a single reference capital expenditure (CAPEX) across a heterogeneous region. The scientifically defensible alternative adopted here is a harmonized synthesis of published evidence, used to constrain—rather than to calculate—the economic layer of the cascade.
The objective of this study is therefore to quantify, at the Latin American regional scale, the transition from theoretical manure availability to recoverable and deployment-constrained circular resources, evaluated jointly across the energy, exergy, nitrogen, and climate dimensions. Specifically, the study: (i) constructs a harmonized inventory of cattle, pigs, and poultry for 20 countries; (ii) estimates VS, nitrogen, and theoretical methane using parameters consistent with the guidelines of the Intergovernmental Panel on Climate Change (IPCC); (iii) introduces species-specific collectability coefficients derived from manure-management system distributions and quantifies the resulting reordering of species and countries; (iv) develops an IPCC-consistent avoided-emissions layer to test whether recoverable methane is also climatically effective methane; (v) unifies the portfolio of recovered products (electricity, useful heat, and nitrogen) through standard exergy accounting; (vi) constrains a deployment-limited potential using explicit factors for competing uses and minimum scale; (vii) projects the resource under structural intensification scenarios to 2035; (viii) synthesizes the published Latin American techno-economic evidence; and (ix) propagates all parameter uncertainty through Monte Carlo simulation with global sensitivity screening. The central hypothesis is that manure abundance, resource recoverability, climate effectiveness, and economic viability are four statistically and structurally distinct quantities, and that conflating them—as single-axis inventories implicitly do—produces materially misleading conclusions for regional bioenergy planning.
2. Materials and Methods
This section defines the geographical and livestock scope of the study, formalizes the four-level resource cascade and its species-specific parameters, and describes the layers used to evaluate each level: avoided emissions, exergy, energy and nitrogen valorization, structural scenarios to 2035, the synthesis of economic evidence, and the Monte Carlo uncertainty analysis.
2.1. Geographical and Livestock Scope
The study covers 20 Latin American countries: Argentina, Bolivia, Brazil, Chile, Colombia, Costa Rica, Cuba, Ecuador, El Salvador, Guatemala, Haiti, Honduras, Mexico, Nicaragua, Panama, Paraguay, Peru, the Dominican Republic, Uruguay, and Venezuela. The core inventory includes cattle, pigs, and poultry because these streams combine high regional abundance with the strongest basis for a harmonized characterization of manure-management systems. National livestock populations were obtained from the Crops and Livestock Products domain of FAOSTAT, the statistical database of the Food and Agriculture Organization of the United Nations (FAO) [4], using 2024 observations for all countries except Nicaragua, for which the latest available observation corresponds to 2023. The poultry series represents an aggregated inventory of live birds; IPCC chicken parameters are used as a representative proxy, which is appropriate for regional screening but introduces additional uncertainty where ducks, geese, or turkeys account for a non-negligible share. These birds are therefore included in, rather than excluded from, the inventory; because they are heavier and excrete more volatile solids per head than the chicken proxy, the poultry resource is conservative in this respect, although it is an upper bound with respect to ammonia inhibition (Section 3.1).
The analysis is not intended to constitute a complete inventory of all livestock species in the region. Sheep, goats, buffaloes, equines, and South American camelids may be locally relevant, but their manure is frequently dominated by grazing-based management and their degree of confinement is highly site-specific. Excluding these streams makes the regional estimate conservative with respect to total theoretical organic matter while maintaining a clearer correspondence between the modeled resource and manure flows with plausible collection pathways. Their inclusion would not alter the main findings: under Equations (2) and (3), each stream enters the recoverable level in proportion to its collectability, so a predominantly grazed stream with a collectability of the order of that of cattle (0.08) would add less than one-tenth of its theoretical potential to the recoverable resource (), enlarging the theoretical envelope far more than the recoverable one and thereby reinforcing, rather than altering, the contraction and reordering reported in Section 3.1.
2.2. Four-Level Cascade
Following the hierarchy of potentials [16], the resource is organized into four nested levels. The theoretical potential for country i and species s is
where is the livestock inventory, is the typical live mass, is the specific VS excretion rate (kg VS (1000 kg mass)−1 d−1), and is the maximum methane production potential (m3 CH4 kg−1 VS). The collectable potential applies the collectability fraction , representing the share of manure that is physically confined and accessible under prevailing management systems:
The collectability fraction is the regional counterpart of the recoverability factor of the national model [66]. The recoverable potential incorporates the effective efficiency of the anaerobic digestion system, :
The deployment-constrained level accounts for competing uses of the contained manure (: sale or direct application as fertilizer, fuel, or other already committed uses [8,70]) and for the fraction of the resource located in production units below the minimum viable scale ( retains the viable fraction) [68,71]:
where is the aggregated deployment factor. Because and lack harmonized regional statistics, the deployment-constrained level is explicitly reported as a scenario corridor using broad triangular distributions rather than as a point estimate. Nitrogen follows the same logic across its theoretical, collectable, and recoverable levels, assuming 85% retention of collected N throughout the integrated recovery chain [9,72].
2.3. Species-Specific Parameters
Table 1 summarizes the central species-specific parameters and their uncertainty ranges, which feed both the deterministic calculations and the Monte Carlo analysis; its interpretation anticipates the dominant mechanism of the study: the structural asymmetry of .
Table 1.
Central species-specific parameters and uncertainty ranges. Sources: 2019 IPCC Refinement [11], 2006 Guidelines [73], BMP protocol [15], and regional digester literature [47,50,52]. Values without brackets are deterministic constants. follows a uniform distribution; uncertain parameters otherwise follow triangular distributions (minimum, mode, maximum), with the poultry-collectability exception specified below.
The collectability coefficients aggregate the MMS usage distributions of the 2019 IPCC Refinement for the Latin America region [11]: represents the share of excreted VS handled in confinable systems with a plausible collection pathway (liquid/slurry, uncovered anaerobic lagoon, solid storage, drylot, daily spread, and poultry litter), whereas manure deposited on pasture, range, and paddock is treated as non-collectable. The central values are rounded modes consistent with those regional MMS defaults, and the triangular ranges span the heterogeneity documented in the regional digester and manure-management literature [22,23,70]; the coefficients are therefore regional screening parameters, not country-specific measurements. This derivation differs from the survey- or expert-based availability factors of earlier inventories [17,18,20] in that the same MMS distribution supplies both the collectable fraction and the baseline MCF of the contained flow (Section 2.4), so that the resource and climate layers are mutually consistent by construction; it replaces, at the regional scale, the census-based recoverability of the national model [66], because harmonized census data on production systems are not available for the 20 countries. The central (0.85) represents the ratio of realized to maximum methane production in well-operated digestion systems; the lower bound of its range (0.70) covers the field performance reported for low-cost tubular digesters under psychrophilic conditions [49,50], and the moderate sensitivity of the recoverable resource to this parameter (Spearman rank correlation coefficient , Section 3.4) indicates that the central results are not critically dependent on this assumption; a species-specific test for the ammonia-limited digestion of poultry litter is reported in Section 3.1.
Three asymmetries in Table 1 strongly influence the results. The central cattle collectability (0.08) is an order of magnitude lower than that of pigs (0.94) and poultry (1.00), reflecting the predominance of extensive grazing across the region. The baseline management factor for contained pig flows (slurries and warm-climate lagoons, MCF = 0.40) is more than an order of magnitude higher than that for contained cattle manure (0.04) and more than twenty times that for dry poultry litter (0.015) [11]. The adopted leakage range [1–13.17%] is the range of methane conversion factors that the 2019 IPCC Refinement tabulates for anaerobic digesters, from best complete industrial technology with gastight digestate storage to high-leakage, low-quality technology with open digestate storage [11], and is the convention adopted in the national model [66]; it brackets documented national best practices [37] and the whole-plant losses measured in the field [35,36], whose maximum across 23 plants (14.9%) lies slightly above it [34]. These three asymmetries determine, respectively, the contraction of the cascade, the energy–climate decoupling, and the fragility of the climate benefit. The collectability and baseline-MCF coefficients are species-specific regional screening parameters rather than country-specific measurements; consequently, cross-country differences in the central results arise primarily from livestock composition and inventory scale, while within-country management heterogeneity is represented through the uncertainty analysis.
2.4. Avoided-Emissions Layer
The management CH4 balance of the contained flow compares baseline management emissions with fugitive methane from the digestion system [11]. Baseline emissions are proportional to the methane-production potential of the collected substrate, whereas is defined here as the fraction of recovered (produced) methane emitted fugitively, consistent with the production-based convention used in whole-plant measurement campaigns [34,35]; it is intended to aggregate all post-collection loss pathways quantified in such campaigns (digester and gas-handling leaks, engine slip, and open digestate storage):
where is the density of methane and GWP100 its 100-year global warming potential, taken as 27 for non-fossil methane in accordance with the Sixth Assessment Report (AR6) of the IPCC [74]. The density is set at kg Nm−3, the value at normal conditions (0 °C and 101.325 kPa), which is the same volume basis used for the lower heating value and the chemical exergy of methane. The IPCC Tier 2 manure-management equations instead use a rounded conversion factor of 0.67 kg m−3 [11,73]. Adopting 0.716 kg Nm−3 therefore yields CH4 mass flows 6.9% higher than those of a strict IPCC computation; because the same factor multiplies both the baseline and the fugitive terms, this choice does not change the sign of the balance, the ranking of mitigation intensities, or the break-even leakage. The volume basis of the IPCC defaults is not stated explicitly, but the 0.67 kg m−3 factor corresponds to methane at approximately 20 °C. If is interpreted on that basis, the methane volumes, energies, and methane-derived exergies reported here exceed their normal-condition equivalents by 7.3% (293.15/273.15). This common scale factor lies well within the Monte Carlo intervals and leaves the species shares, rankings, signs of the balances, contraction and recovery ratios, and break-even leakages unchanged; only in the exergy-equivalent portfolio (Section 2.5), whose nitrogen term does not depend on , would the nitrogen share rise from 31.0% to 32.5% and the normalized circular exergy recovery indicator from 10.71% to 10.95%, without altering its ordering. Using Equation (3), Equation (5) is equivalent to . The credit from electricity displacement is
with treated as a scenario parameter [0.20–0.60 t CO2 MWh−1] spanning hydro-dominated grids to thermal systems; the net balance is the sum of both terms. Two indicators are derived from Equation (5): mitigation intensity per recovered cubic meter (kg CO2eq m−3), which orders the country–species segments into a mitigation supply curve, and the portfolio break-even leakage, , at which the management CH4 benefit is fully offset.
2.5. Exergy Layer
The product portfolio is harmonized on an exergy-equivalent basis [38,39,40] and reported in exergy-equivalent terawatt-hours (TWhx). The standard chemical exergy of methane (831.65 kJ mol−1 [38]) corresponds to MJ Nm−3. Electricity is pure exergy; useful heat delivered at 80 °C is weighted by its Carnot factor (, with °C); and recovered nitrogen is represented by an ammonia-equivalent chemical-exergy proxy based on 337.9 kJ mol−1 for NH3 [38], i.e., MJ kg−1 N. This proxy is conservative relative to the cumulative exergy cost of Haber–Bosch synthesis [42], but it does not imply that the recovered nutrient product is chemically identical to pure ammonia. The exergy-equivalent value of the product portfolio is
where and are the electricity and useful heat delivered by cogeneration (Section 2.6), and are the reference (dead-state) and heat-delivery temperatures (298.15 K and 353.15 K), and is the mass of recovered nitrogen. The normalized circular exergy recovery indicator (CER) references this value to the chemical exergy of the theoretical methane envelope:
where is the regional theoretical methane potential, that is, the sum of over all countries and species. CER is used as a portfolio-normalization indicator referenced to the theoretical methane-exergy envelope. Because its numerator also includes the ammonia-equivalent exergy proxy assigned to recovered nitrogen, CER should not be interpreted as a conventional second-law efficiency; rather, it provides a common thermodynamic-quality basis for comparing the modeled product portfolio at resource scale [41,45,46].
2.6. Energy and Nitrogen Valorization
The chemical energy of recoverable methane is calculated with a lower heating value of 9.944 kWh Nm−3; the electricity pathway assumes cogeneration with an electrical efficiency of 35% and a useful thermal efficiency of 50% [5,71,75]. Recoverable nitrogen is additionally expressed as a urea equivalent (factor 2.174, corresponding to the 46% nitrogen content of commercial urea) for agronomic interpretation [76,77,78,79], in the context of the region’s dependence on synthetic fertilizers [43,44].
2.7. Structural Scenarios to 2035
Collectability is not a static parameter: it depends on the livestock confinement structure, which is modified by projected livestock intensification [80], as recognized in earlier time-dependent manure assessments [17,19,81]. The regional scenarios adopt discrete 2035 values of rather than the continuous confinement trajectory of the national model [66], because the two calibration points that such a trajectory requires are not available for all countries. Three scenarios are defined: S0 (2024 structure, ); moderate S1 2035 (; pig inventory +15% and poultry +20%); and intensive S2 2035 (; +30% and +40%). The factors are stated as directional assumptions consistent with agricultural outlooks [80], rather than as econometric projections.
2.8. Synthesis of Economic Evidence
A uniform CAPEX cost model for 20 countries was deliberately rejected: comparative evidence demonstrates that digesters of identical size yield divergent profitability indicators (net present value, NPV, and internal rate of return, IRR) across Mexico, Colombia, and Uganda because of differences in investment costs, coproducts, local prices, and incentives [67,68,69]; therefore, a single regional cost would constitute false precision. Instead, Section 3.9 synthesizes only verified primary studies from the region and the international cost references of the International Renewable Energy Agency (IRENA) and the International Energy Agency (IEA), complemented by a technology evaluation of biogas desulfurization costs [71,82,83,84], organized by technological scale, and derives qualitative viability conditions for the deployment corridor. The economic layer is therefore derived exclusively from published studies: country-specific evidence is reported only where primary studies exist (Bolivia, Mexico, Colombia, and rural Andean communities, with Uganda as an external contrast), whereas the international references provide generic, non-country-specific cost ranges. This layer does not enter the resource or climate calculations; it constrains the cascade only through the viable-scale factor in Equation (4).
2.9. Monte Carlo, Sensitivity, and Ranking
All parameter uncertainty is propagated through a single Monte Carlo chain with iterations, implemented with NumPy’s default random generator and a fixed seed (20260822) over the distributions in Table 1, fully specified in Table S2 of the Supplementary Material; the resource, climate, and deployment intervals reported throughout the article derive from this same chain. Sensitivity is quantified using Spearman rank correlation coefficients () between each parameter and the outputs (recoverable resource, CH4 balance, net balance, and deployment-constrained resource). Country rankings are compared using the Spearman () and Kendall () rank correlation coefficients between orderings, with their associated p-values. The calculations were implemented in Python 3; the single calculation-and-figure script, together with the data, accompanies the article as Supplementary Material.
3. Results
The results follow the cascade from the theoretical to the deployment-constrained level: Section 3.1, Section 3.2, Section 3.3 and Section 3.4 quantify the contraction of the resource, its energy and nitrogen content, its distribution among countries, and its uncertainty; Section 3.5, Section 3.6, Section 3.7 and Section 3.8 evaluate the climate balance, the exergy-equivalent product portfolio, the deployment corridor with the 2035 scenarios, and the sensitivity of the climate balance; and Section 3.9 synthesizes the published technoeconomic evidence.
3.1. The Regional Cascade: An 82.1% Contraction That Reorders the Resource
The first result is the magnitude and structure of the contraction between levels. Figure 1 presents the theoretical and recoverable levels by country; the intermediate collectable level is reported by species in Table 2.
Figure 1.
Theoretical versus recoverable methane potential by country (109 m3 CH4 a−1), aggregated over the three livestock categories; 20 Latin American countries, 2024 inventories.
Table 2.
Regional methane resource by livestock category under the central scenario.
The regional theoretical potential is 73.88 × 10⁹ m3 CH4 a−1, of which cattle account for 63.10 (85.4%). Applying the central collectability coefficients (Equation (2)) reduces the resource to 15.56, and the AD realization factor (Equation (3)) further reduces it to 13.22 × 10⁹ m3 a−1. The resulting 82.1% contraction is therefore dominated by the collection constraint rather than by the conversion step. Under the central cattle collectability assumption (), 92% of the theoretical cattle-manure resource is treated as non-collectable, consistent with the predominance of grazing-based management represented in the model. Pig and poultry streams retain a substantially larger fraction because their central collectability coefficients are much higher. The cascade therefore changes not only the magnitude of the resource but also its composition.
This reordering is examined in Figure 2, which compares the shares of each species at the theoretical and recoverable levels and is quantified in Table 2.
Figure 2.
Reordering of the resource among species when moving from the theoretical to the recoverable level: percentage shares by species.
Cattle account for 85.4% of theoretical methane, whereas pigs and poultry contribute 6.1% and 8.5%, respectively. After collectability and process-realization constraints are applied, cattle fall to 32.5% of the recoverable resource, poultry becomes the largest component (40.4%), and pigs contribute 27.1%. This reordering shows that livestock abundance alone is an incomplete proxy for biorefinery feedstock availability when manure-containment structures differ markedly among species. A planning exercise based only on theoretical potential would therefore over-prioritize cattle-dominated resources that are largely unavailable under the central management assumptions.
The uniform central (0.85) may overstate the realization attainable in the monodigestion of nitrogen-rich substrates, because the free ammonia released during the degradation of poultry litter and, to a lesser extent, pig slurry can inhibit methanogenesis [85,86]. A species-specific test was therefore performed by lowering for poultry to 0.70, the lower bound of its uncertainty range, while keeping all other parameters at their central values. The recoverable resource then decreases to m3 a−1, and the shares become 34.9% for cattle, 29.2% for pigs, and 35.9% for poultry, which remains the largest component; the net climate balance changes only marginally (+43.56 versus +43.96 Mt CO2eq a−1), and recovered nitrogen still exceeds useful heat in the exergy-equivalent portfolio (32.6% versus 12.3%). Poultry remains the largest recoverable stream as long as its effective digestion efficiency exceeds 0.68; below this threshold, cattle again become the largest component, although with a share (36.8% at 0.60) far below its theoretical 85.4%. Lowering to 0.70 for both pigs and poultry yields shares of 36.8%, 25.3%, and 37.8% for cattle, pigs, and poultry, respectively. The poultry share of 40.4% is therefore an upper bound conditional on the control of ammonia inhibition, whereas the contraction and reordering of the resource are robust to this assumption.
Codigestion is the principal strategy for attaining high realization factors with these nitrogen-rich substrates and is therefore the operating condition under which is attainable for poultry and pig manure. For chicken manure, the studies compiled by Shapovalov et al. [86] report methane-yield intensifications of 150–195% for codigestion with agricultural wastes or cattle manure and of 40–135% for ammonium-management techniques such as air purging, struvite formation, and gas-phase recirculation. For pig manure, the addition of 3% crude glycerol under thermophilic conditions increased the specific biogas production by 180% relative to monodigestion [87]. More generally, codigestion with agro-industrial residues is an established route to higher methane yields [13,88], and the codigestion of manure mixtures has been validated in low-cost tubular digesters in the Andes [51]. Because the additional methane contributed by co-substrates does not originate from manure, it lies outside the single-substrate scope of this study (Section 4.7); codigestion is therefore interpreted here as the operational pathway to the adopted realization factors, not as an additional resource.
3.2. Energy and Nitrogen Valorization of the Recoverable Resource
The central recoverable methane resource contains 131.48 TWh a−1 of chemical energy (cattle 42.67; pigs 35.64; poultry 53.17). When used in cogeneration with 35% electrical efficiency and 50% useful thermal efficiency, this corresponds to 46.02 TWh a−1 of electricity and 65.74 TWh a−1 of useful heat. These values describe the conversion potential of the recoverable envelope, not the expected dispatch of a future fleet of plants. The modeled contained flows carry 4.44 Mt N a−1; under the integrated 85% recovery scenario, 3.77 Mt N a−1 could be captured in nutrient products, equivalent to 8.20 Mt a−1 of urea. Poultry contributes approximately 42.0% of the collectable N, pigs 30.3%, and cattle 27.7%; thus, the nutrient portfolio also shifts away from cattle after applying the management constraint. These nutrient results should be interpreted as an upper technological scenario [72,76,77].
3.3. Country-Level Distribution and National Hierarchies
Table 3 presents the ten leading countries by recoverable methane (the complete table of 20 countries is provided as Table S1 in the Supplementary Material); its purpose is twofold: to quantify the geographic concentration of the resource and to demonstrate how the contraction modifies national rankings.
Table 3.
Leading countries by recoverable methane potential under the central scenario. Methane in 109 m3 CH4 a−1; electricity in TWh a−1. CRR: cascade recovery ratio (recoverable-to-theoretical). Rank change compares the recoverable ranking with the theoretical ranking.
Three observations emerge from Table 3. First, geographic concentration: Brazil dominates under both definitions (38.10 theoretical; 6.02 recoverable), followed by Mexico (1.92), Colombia (0.964), Argentina (0.886), and Bolivia (0.542), consistent with available national assessments [27,28,29,30]. Second, the strong but incomplete association between the hierarchies: the theoretical and recoverable rankings correlate with (; Kendall , ), the expected signature of a structural constraint: large inventories continue to matter, but they no longer uniquely determine the ranking. The Dominican Republic rises five positions; Peru, Ecuador, and Chile rise three; Panama rises two; in contrast, Uruguay falls five positions, Nicaragua four, and Paraguay and Cuba three. Third, the cascade recovery ratio (CRR) acts as a structural signature of species composition under the common species-specific collectability coefficients used in this regional screening. The highest values correspond to the Dominican Republic (42.8%), Ecuador (38.4%), Peru (34.6%), and Chile (34.1%), whose modeled resources contain larger shares of the more collectable pig and poultry streams. The lowest values correspond to Cuba (9.1%), Uruguay (10.4%), Argentina (11.2%), and Paraguay (11.4%), where the low-collectability cattle component is more influential; the regional median is 22.9%. These differences should therefore not be interpreted as direct measurements of country-specific manure-management performance.
Figure 3 positions countries in the plane defined by the cascade recovery ratio (CRR) and the absolute magnitude of the recoverable resource, translating Table 3 into policy typologies; the grey reference lines mark the regional medians (CRR = 22.9%; recoverable resource ≈ 0.23 × 10⁹ m3 CH4 a−1), which define four screening quadrants.
Figure 3.
National opportunity matrix: cascade recovery ratio versus recoverable resource (logarithmic scale); marker size is proportional to the theoretical resource, and grey lines mark the regional medians.
The two regional medians separate four screening quadrants with different deployment implications: (i) large, low-capture systems (Brazil, Argentina, Colombia, Venezuela, Paraguay), where the modeled resource is strongly constrained by the cattle component and additional confinement would expand the collectable envelope; (ii) medium-scale, high-retention systems (Mexico, Bolivia, Peru, Ecuador, Dominican Republic), whose pig- and poultry-rich composition yields CRR values above the median together with resources above the median; (iii) small, low-capture systems (Uruguay, Nicaragua, Honduras, Haiti, Cuba), where the cattle share depresses both axes; and (iv) small, high-retention systems (Chile, Guatemala, Panama, Costa Rica, El Salvador), where limited absolute scale can favor distributed solutions of the type documented in the regional digester literature [47,50,52,62,89]. Mexico is the only country that combines a recoverable resource above m3 a−1 with an above-median CRR; Brazil exceeds that threshold six-fold but lies below the CRR median. These typologies are screening categories rather than direct country-level measurements of farm structure.
3.4. Uncertainty of the Recoverable Resource
Before assessing the climate and exergy layers, the robustness of the resource itself must be constrained. Figure 4 shows the Monte Carlo distribution of the regional recoverable resource and its sensitivity decomposition.
Figure 4.
Uncertainty of the regional recoverable resource: Monte Carlo distribution () and parameter–output Spearman correlations.
The regional recoverable resource has a median of 14.57 ×10⁹ m3 a−1, with a 95% interval of [10.99–19.56]: even the lower percentile supports a portfolio exceeding 38 TWh a−1 of electricity. The deterministic central scenario (13.22) lies below the Monte Carlo median because the central values enter the chain as distribution modes and the cattle-collectability distribution is strongly right-skewed (mode 0.08; mean ≈ 0.11). Sensitivity is dominated by cattle collectability (), far above (+0.397) and the values: uncertainty in the Latin American resource is primarily uncertainty about how much cattle manure is contained, rather than about biodegradability or technology. This finding prioritizes the regional empirical agenda: country-level surveys of manure-management systems would yield greater uncertainty reduction than additional BMP campaigns [11,15] (complete coefficients in Table S3).
3.5. Avoided Emissions: Energy and Climate Hierarchies Diverge
The climate layer reveals the clearest divergence between resource magnitude and mitigation performance. Table 4 presents the central balance by species with 5% leakage and a grid emission factor of 0.40 t CO2 MWh−1.
Under the central assumptions, Table 4 shows a clear divergence between the energy and climate hierarchies. Along the management CH4 axis, pigs—with 27.1% of recoverable methane—provide all positive management-mitigation benefit (+29.14 Mt CO2eq a−1) because the modeled baseline corresponds to liquid systems with a substantially higher MCF (0.40) [11]. Poultry, the leading regional energy source (40.4%), remains climatically negative along this axis (−3.34): dry litter produces little baseline methane (MCF 1.5%), such that digesting it with 5% production-based leakage emits more methane than it avoids. Contained cattle manure is approximately neutral (−0.24 on a recoverable flow of 4.29 × 10⁹ m3): its central baseline MCF (0.04) lies at the neutrality condition , and the full uncertainty chain assigns a probability close to 0.5 to either sign, so the cattle management term should be read as zero within uncertainty rather than as a negative result. The regional management balance remains positive (+25.55) because the pig flow offsets the poultry deficit; when the electricity credit (+18.41) is added, the central net balance reaches +43.96 Mt CO2eq a−1. This regional ordering reproduces the national result for Peru [66], where broilers rank first by recoverable energy but last by avoided methane and swine rank first by mitigation, and shows that the dissociation is a structural property of Latin American livestock systems rather than a national particularity. The grid credit is proportional to : at 0.20 t CO2 MWh−1, closer to the hydro-dominated grids of Brazil and Colombia that host most of the recoverable resource, the credit falls to +9.20 and the central net balance to +34.76 Mt CO2eq a−1, and the poultry net term becomes negative below t CO2 MWh−1. The sign of the climate benefit of AD therefore depends on the composition of the contained flow, the digestion realization fraction, fugitive emissions, and the displaced grid, rather than on the technology label itself.
Figure 5 organizes this result as a mitigation supply curve over cumulative recoverable methane, ordered by decreasing intensity. Because the regional coefficients are common to all countries, intensity is uniform within each species, and the country dimension affects only the cumulative-volume axis; panel (b) enlarges the cattle and poultry segments, which are barely visible at the scale of the pig segment.
Figure 5.
Regional management CH4 mitigation supply curve (5% production-based leakage): (a) complete curve; (b) enlarged view of the cattle and poultry segments.
The curve shows a sharp discontinuity: pig segments (intensity +8.13 kg CO2eq m−3) exhaust the positive range within the first 3.58 × 10⁹ m3, while the remaining 72.9% of recoverable methane operates with negative management intensity (−0.06 for cattle and −0.63 for poultry; Figure 5b). At the central 5% leakage assumption, only the pig component (27.1% of recoverable methane) is simultaneously positive on the management-CH4 axis; for cattle and poultry, any net climate benefit in this model depends primarily on electricity displacement rather than on avoided manure-management methane. The management balance is linear in leakage, declining by 2.56 Mt CO2eq per percentage point: from +35.78 Mt at 1% to +25.55 Mt at 5%, to +4.67 Mt at the IPCC upper bound of 13.17% [11], and to only +0.25 Mt at 14.9%, the highest whole-plant loss measured across 23 plants [34]. The production-based portfolio break-even is 15.00%, obtained after accounting for the central digestion realization factor (); it therefore lies just above the IPCC upper bound and coincides with the upper end of the measured plant-loss range, so the management benefit is robust for plants operating at typical losses of 2–5% [34,35,36] and vanishes for the worst measured plants. Expressed on the same collected-potential basis as the national value of 4.6% obtained for Peru [66], the regional break-even corresponds to the flow-weighted baseline MCF of 12.75%, nearly three times higher, because the Peruvian contained portfolio is drier. The complete segment data of the supply curve are provided in Table S4. Leakage control therefore remains a pivotal operational variable; referencing leakage to produced methane, as measured in field campaigns [34,36], yields a wider central safety margin than referencing it to the collected methane potential, because the digestion realization factor scales the fugitive term [37].
3.6. The Portfolio on an Exergy Basis: Nitrogen Displaces Heat
Figure 6 contrasts the product portfolio on an energy and exergy basis, applying Equations (7) and (8).
Figure 6.
Regional product portfolio on an energy (a) and exergy (b) basis: electricity, useful heat at 80 °C, and recovered nitrogen.
The change in metric reorders the portfolio. On an energy basis, useful heat dominates (65.74 TWh versus 46.02 TWh of electricity), while nitrogen does not appear at all because it is not an energy flow. On an exergy-equivalent basis, the contribution assigned to heat at 80 °C is reduced to 10.24 TWhx by the Carnot factor (0.156), electricity retains its full value (46.02 TWhx; 56.5%), and recovered nitrogen contributes 25.26 TWhx (31.0%) under the ammonia-equivalent proxy, exceeding the heat contribution (12.6%). The total portfolio of 81.52 TWhx corresponds to a normalized CER of 10.71% relative to the theoretical methane-exergy reference envelope (761.34 TWhx) and to 59.8% of the exergy of recoverable methane. The interpretation is twofold: first, energy-only assessments overemphasize low-temperature heat and omit the quality-equivalent contribution assigned to nutrient recovery, a bias that the nutrient-valorization literature has highlighted from an agronomic perspective [9,72,79]; second, under the ammonia-equivalent proxy adopted here, recovered nitrogen represents nearly one-third of the normalized product-portfolio value, with direct relevance for a region structurally dependent on synthetic fertilizers [42,43,44,76].
3.7. Deployment Corridor and Structural Scenarios
Figure 7 completes the cascade with the fourth level (Equation (4)) and presents the structural scenarios for 2035, which are summarized in Table 5.
Figure 7.
(a) Complete four-level regional cascade, with the deployment-constrained corridor shown as the central-scenario value and its 95% interval from the full uncertainty chain. (b) Recoverable methane under the 2024 baseline (S0) and the moderate (S1) and intensive (S2) structural intensification scenarios for 2035, with the cattle share of each portfolio.
Table 5.
Structural scenarios for 2035: assumptions and resulting recoverable resource.
The application of competitive-use and minimum-scale factors (central deployment fractions of 0.325 for cattle, 0.595 for pigs, and 0.600 for poultry) reduces the central deployable resource to 6.74 × 10⁹ m3 a−1—50.9% of the recoverable resource and 9.1% of the theoretical resource, with a full-chain Monte Carlo median of 6.83 and a 95% interval of [5.05–9.27] (sensitivity coefficients in Table S3). The corridor is deliberately broad: its message is not a point estimate but rather the demonstration that, even after correcting for collectability, approximately half of the recoverable envelope remains contested by competing manure uses [8,70] and production structures below viable scale [68,71]. It is the quantitative, region-scale equivalent of the hierarchy of constraints that Batidzirai et al. [16] formalized conceptually and Einarsson and Persson [23] resolved spatially for Europe. Under the central deployment assumptions, the resulting resource is approximately one-eleventh of the headline theoretical potential, illustrating the magnitude of the combined physical and deployment constraints.
The scenarios indicate that increasing the cattle collectability assumption from 8% to 16%, together with the stated pig and poultry inventory-growth assumptions that are directionally consistent with the agricultural outlook [80], would increase the recoverable resource by 56.8% and raise the cattle share to 41.4% in S2. Static inventories are therefore misleading in both temporal directions: they overestimate today’s usable resource by ignoring collectability and underestimate tomorrow’s resource by ignoring the intensification trend—with the climate caveat that the same confinement creates new emitting flows whose management will determine the sign of the balance (Section 3.5).
3.8. Sensitivity of the Climate Balance
Figure 8 ranks the parameters governing the net GHG balance in the full-chain Monte Carlo analysis.
Figure 8.
Sensitivity of the net GHG balance: Spearman correlations of the dominant parameters ().
The climate hierarchy differs radically from that of the resource (Figure 4): digester leakage remains the dominant parameter with a negative sign (), followed by the baseline pig MCF (+0.485), pig (+0.368), and the grid factor (+0.342). Cattle collectability, which ranks first for the recoverable resource, drops to the fifth–sixth positions among the climate drivers (+0.182), statistically indistinguishable from the cattle baseline MCF (+0.193). In the full-chain Monte Carlo analysis, the management CH4 balance reaches a median of 25.79 Mt CO2eq a−1 [5.19–46.45], with a 99.4% probability of a positive sign; the grid credit is 20.15 [11.48–31.77]; and the net balance is 46.15 [24.27–70.23]. The resulting data priorities differ by objective: resource-focused uncertainty reduction should prioritize cattle-manure collectability, whereas climate-focused uncertainty reduction should prioritize digester leakage [34,37] and the baseline management of pig manure. These remain distinct empirical agendas, and this study explicitly separates them at the regional scale; the complete correlation coefficients for the three outputs are provided in Table S3.
3.9. Synthesis of Published Technoeconomic Evidence
Table 6 synthesizes the verified primary economic evidence, organized by scale, together with international cost references; its purpose is to constrain the viability of the deployment corridor without introducing a regional cost model that is not supported by the available evidence.
Table 6.
Harmonized synthesis of published technoeconomic evidence on anaerobic digestion of manure relevant to Latin America.
Three robust patterns emerge from the evidence corpus. First, costs and profitability span more than one order of magnitude with scale and technology: household tubular digesters are installed for hundreds of dollars [47,67], whereas agency benchmarks for power systems report 2570–6100 USD kW−1 [82]. Second, profitability is conditional rather than intrinsic: in Chiapas, all four household systems are profitable with payback periods of 1–2 years, but only when biofertilizer revenue is included [67]; in Colombia, industrial biomethane becomes profitable only with tax incentives and improves decisively when capacity is doubled [68]; and in Uganda, the same digester size yields uniformly negative NPV when biogas is the only valued product [69]. The Mexico–Uganda contrast demonstrates that digestate—precisely the carrier of 31% of the portfolio’s exergy value (Section 3.6)—determines the economic sign. Third, and decisive for the regional methodology: identical technologies at identical scales produce markedly different profitability across countries because of differences in investment, operating costs, coproduct prices, and discount rates [67,68,69]. This published divergence provides the empirical justification for treating the economic layer as literature-bounded scenario evidence—and for expressing the minimum-scale constraint through the factor in Equation (4)—rather than computing a uniform CAPEX.
Biogas cleaning, a stage not covered by the preceding studies, must also be included in any cost estimate, particularly for pig and poultry manure, whose high protein content generates hydrogen sulfide (H2S) concentrations of 80–4000 ppmv in raw biogas [84]. Because internal combustion engines tolerate less than 500 ppm (and some less than 50 ppm), boilers less than 1000 ppm, and cooking stoves less than 10 ppm [84], desulfurization is required before any energy use. In situ air dosing is the least expensive option but frequently fails to keep H2S below engine limits in practice, whereas external biological, biochemical, and catalytic processes reach total treatment costs of 0.11–0.21 euro cents per Nm3 of biogas, activated carbon about 1.08, and caustic scrubbing of sulfur-rich biogas 1.82–2.56 euro cents per Nm3 (Table 6). For biogas with 60% methane, these values correspond to approximately 0.2–4.3 EUR per MWh of biogas energy (authors’ conversion), negligible for regenerative biological processes at large scale but a non-negligible fraction of the 10–30 USD MWh−1 production cost of biogas in simple digesters [71] when sulfur-rich biogas is treated chemically or by adsorption. Because unit costs rise as plant size decreases (from 0.18 to 0.72 euro cents per m3 when a biotrickling filter is scaled down from 2000 to 200 m3 h−1) and chemical and adsorptive costs scale with the sulfur load, desulfurization weighs more heavily on pig and poultry manure and on small plants; it therefore reinforces, rather than alters, the scale and coproduct conditions identified above.
4. Discussion
This section interprets the results in relation to the existing literature, examines the energy–climate decoupling, the exergy-based portfolio, the national deployment pathways, and the scope of the economic evidence, and closes with the resulting data agenda and the limitations of the study.
4.1. Theoretical Potential as a Misleading Indicator
The principal contribution is not the magnitude of Latin America’s theoretical methane potential, which is already well established [24,29], but the quantified contraction and reordering that occur when the resource is evaluated through collectability, process realization, deployment, climate, and coproduct constraints. The 82.1% contraction from theoretical to recoverable methane, followed by a further reduction to the deployment corridor, is sufficiently large to change the interpretation of the regional resource rather than merely refine its magnitude. Under the theoretical model, cattle appear as the overwhelmingly dominant regional feedstock; however, grazing livestock distribute manure over large areas and, except under confinement, these VS do not exist as a digester feedstock in the engineering sense. The decline of cattle from 85.4% to 32.5% of the recoverable resource is directionally consistent with Brazilian assessments emphasizing the greater capturability of confined pig and poultry manure [29] and with the collectability-related contraction identified by European spatial models a decade earlier [22,23]. For Brazil, the recent techno-economic inventory of Travieso Fernández et al. [29] attributes about one-third of a national technical potential of 43–45 × 109 Nm3 a−1 of biomethane to livestock and other agro-industrial residues jointly (at most ≈ 15 × 109 Nm3 a−1), a figure that lies between the theoretical (38.10) and recoverable (6.02) manure levels obtained here, as expected for a technical potential that applies recovery factors without the explicit grazing-based collectability truncation of Equation (2). Earlier Latin American screening exercises adopted ad hoc collection fractions (e.g., 10% of cattle, 40% of pigs, and 50% of poultry manure [26]), whereas the coefficients used here are derived from the IPCC manure-management-system distributions and propagated with explicit uncertainty. The 82.1% regional contraction is of the same order as the 74.6% obtained for Peru with census-based recoverability [66]. The specific contribution of this work is to show that the contraction also reorders livestock categories and shifts national rankings by up to five positions. National and subnational assessments [27,28,30,32,33] provide essential local evidence, but by design they cannot establish this region-wide comparative reordering.
4.2. The Energy–Climate Decoupling and Its Geography
The decoupling quantified in Section 3.5 and Section 3.8 refines a policy distinction that is discussed qualitatively in the livestock-mitigation literature [2,3,10]. Under the central scenario, management-CH4 mitigation is concentrated in the pig-manure stream in liquid-management systems—27.1% of recoverable methane but 100% of the positive management-mitigation benefit—whereas the energy value extends across the full portfolio. This result suggests that climate and energy instruments should not use identical eligibility criteria. Under the central 5% leakage assumption, poultry digestion does not generate a positive management-CH4 credit in this model; its net climate benefit instead arises from electricity displacement. The contrast with the authors’ national analysis for Peru [66]—a break-even leakage of 4.6%, referenced to the collected methane potential, with a predominantly dry contained portfolio—defines the domain of validity: the climate sign is governed by the relation between the flow-weighted baseline MCF and production-based digester leakage after accounting for . For the regional central portfolio, the flow-weighted baseline MCF of the collected stream is 12.75%, whereas the corresponding production-based break-even leakage is 15.00% because . Measurement campaigns report plant-level leakage values approaching the upper end of the adopted range [34,35,36], while national programs have demonstrated operation near 1% [37]. The regional climate benefit is therefore real but conditional on construction and operational quality [53,58].
4.3. The Exergy Lens and the Three-Product Biorefinery
The exergy-based reordering of the portfolio—nitrogen ahead of heat under the ammonia-equivalent proxy—translates a well-established agronomic argument [9,72,77,78,79] into a thermodynamically normalized portfolio comparison, consistent with the tradition of resource exergy analysis [38,39,40,41] and extending plant-scale reasoning [45,46] to the continental resource scale. The normalized CER of 10.71% provides a common reference for the modeled multiproduct portfolio, but it should not be interpreted as a second-law efficiency or as a direct measure of engineering improvement potential. Within this normalized framework, relevant improvement pathways include increasing useful-heat quality, valorizing digestate as a formulated fertilizer [76], and closing the regional nitrogen cycle by reducing dependence on Haber–Bosch synthesis [42,43,44]. For biorefinery design, the message remains concrete: nutrient flows should enter the objective function alongside electricity and useful heat, as proposed by the regional circular-biorefinery agenda [25,26].
4.4. National Typologies and Deployment Pathways
The opportunity matrix (Figure 3) and the economic evidence (Table 6) converge on differentiated deployment pathways. In the large, low-capture systems of quadrant (i), the dominant pathway is structural and medium-to-large scale, with the Brazilian precedent of technoeconomic inventories [29,30,31]. In the high-retention and small-scale systems of quadrants (ii) and (iv), a well-documented pathway is the low-cost digester with coproduct valorization [47,48,49,50,51,52,54,55,57,67,89,90], whose adoption depends more on financing and technical support than on technology [53,59,60,61,62]. The authors’ Peruvian experimental evidence—validated compact designs and pH–EC operational control [63,64]—falls within this second pathway, whereas industrial systems based on agro-industrial by-products [13,65,68,88] belong to the first.
4.5. What the Economic Evidence Supports and What It Does Not
The synthesis in Table 6 supports three statements: small-scale profitability conditional on coproducts, industrial viability conditional on scale and incentives, and international heterogeneity that cannot be reduced to a single cost. It does not, however, support country-level levelized cost estimates or regional cost curves: producing them would require harmonized primary investment and tariff data that are currently unavailable for all 20 countries. Accordingly, the study does not infer country-level costs beyond the available evidence; instead, the deployment corridor represents this uncertainty through explicit and auditable parameters.
4.6. Uncertainty as a Data Agenda
The dual sensitivity hierarchy (Figure 4 and Figure 8) converts uncertainty into a data agenda: (i) national surveys of manure-management systems—bovine collectability and baseline MCFs—should take priority over additional BMP campaigns; (ii) measurement of leakage from Latin American plants, which is not represented by a harmonized regional monitoring program in the evidence assembled here, should follow validated tracer-gas protocols [34,35,36,37]; and (iii) national grid emission factors should be developed to refine the electricity-displacement credit. The model structure allows each data improvement to be incorporated without altering the overall architecture.
4.7. Limitations
Eight limitations constrain the scope of the analysis. (1) The analysis uses central species-specific parameters at the regional scale; in particular, the baseline MCFs are applied uniformly across 20 countries whose climates span the full temperature dependence of the IPCC MCF tables, and this climatic and within-country system heterogeneity is represented through uncertainty distributions rather than subnational maps such as those available for specific cases [27,28,32]. (2) The aggregated poultry inventory, which includes ducks, geese, and turkeys, is modeled using chicken parameters as a proxy, while sheep, goats, buffaloes, equines, and South American camelids are excluded, making the total theoretical estimate conservative; because these streams are predominantly grazed, their inclusion would enlarge the theoretical envelope far more than the recoverable resource (Section 2.1). (3) The deployment-corridor factors (, ) are scenario assumptions informed by the literature [8,68,70,71], rather than harmonized statistics, and the 2035 scenarios are directional, consistent with the agricultural outlook of the Organisation for Economic Co-operation and Development (OECD) and FAO [80], without econometric herd modeling. (4) The GHG balance excludes N2O from digestate application and transport emissions, which may be partially compensatory according to the manure-management literature [3,9]; in addition, is referenced to produced methane, whereas the residual methane potential of digestate stored in open tanks scales with the undigested fraction and was the largest loss pathway in the plant campaigns of Baldé et al. [36], the upper values of the adopted IPCC digester range include open digestate storage [11], but low- systems may still carry post-digester emissions beyond those represented. (5) The nitrogen term uses an ammonia-equivalent chemical-exergy proxy rather than the measured chemical exergy of a specific recovered fertilizer product; CER is therefore a normalized portfolio indicator, not a conventional second-law efficiency [42]. (6) Codigestion with agro-industrial residues, which can increase yields [13,63,88], is outside the single-substrate scope; conversely, the uniform does not represent the free-ammonia inhibition that constrains the monodigestion of nitrogen-rich poultry litter [5,6,85], so the poultry term—the largest recoverable stream—is an upper bound in the absence of codigestion or ammonia management; Section 3.1 quantifies this sensitivity and summarizes the codigestion evidence. (7) The economic layer is a synthesis of evidence rather than a financial model; its conclusions represent viability conditions, not cash-flow projections. (8) The grid emission factor is a regional scenario parameter; because the hydro-dominated grids of Brazil and Colombia host a large share of the recoverable resource, the central electricity credit is likely an upper estimate (Section 3.5), and country-specific factors should replace it in national applications.
5. Conclusions
The transition from theoretical to usable resource is governed by manure-management structure rather than biochemistry. Across 20 countries and three livestock categories, the theoretical envelope of 73.88 × 10⁹ m3 CH4 a−1 contracts by 82.1% to 13.22 recoverable and 6.74 [5.05–9.27] deployable (9.1% of the theoretical resource). This constraint reorders the portfolio—cattle decline from 85.4% to 32.5%, while poultry rises to 40.4%—and shifts national rankings by up to five positions (), showing that theoretical abundance alone can distort comparative priorities. The poultry share is an upper bound conditional on the control of ammonia inhibition: if its effective digestion efficiency falls below approximately 0.68, cattle again become the largest recoverable stream, but with a share far below its theoretical 85.4%, so the reordering persists.
Energy and climate rankings are decoupled: pig manure, accounting for 27.1% of recoverable methane, provides 100% of the positive management CH4 mitigation (+29.14 Mt CO2eq a−1), whereas poultry and cattle remain negative along this axis at the central 5% leakage assumption. The central regional net balance is +43.96 Mt CO2eq a−1 and is robust but conditional: Monte Carlo propagation gives a 99.4% probability of a positive management balance, the production-based break-even leakage (15.00%) coincides with the highest plant loss measured in the field, and climate sensitivity remains dominated by leakage () and by the displaced grid rather than by resource size.
On an exergy-equivalent basis, the 81.52 TWhx portfolio (normalized CER of 10.71%) reverses the hierarchy of secondary products: recovered nitrogen (31.0%) exceeds useful heat (12.6%), supporting the explicit inclusion of nutrient flows in design and business-model objectives, consistent with the economic evidence that coproduct valorization can materially affect small-scale profitability.
The static 2024 resource also understates the range represented by the structural 2035 scenarios: increasing cattle collectability together with the stated pig and poultry growth assumptions raises recoverable methane by 28.4–56.8% (16.97–20.73 × 10⁹ m3 a−1), with the caveat that such confinement creates new emission streams whose management—rather than their magnitude—will determine the climate benefit. Static inventories are misleading in both temporal directions.
Abundance, recoverability, climate effectiveness, and economic viability are four distinct quantities that must be evaluated jointly. Regional empirical priorities are therefore ranked as follows: surveys of manure-management systems (resource), systematic leakage measurements and characterization of pig-manure management (climate), and primary investment and tariff data (economics). The model architecture, which is reproducible and based on open data, can incorporate each improvement without rebuilding the framework.
Supplementary Materials
The following supporting information can be downloaded at: https://www.mdpi.com/article/10.3390/fermentation12110516/s1, Table S1: complete country-level results with canonical-chain Monte Carlo intervals; Table S2: Monte Carlo specification, Table S3; global Spearman sensitivity coefficients for the three outputs; Table S4: mitigation supply-curve segments, the country and species datasets (country_source.csv, supp_country.csv), the results file (results.json), and the fixed-seed scripts (compute_all.py, make_supplementary.py) that regenerate every reported value, all eight figures, and the supplementary document itself.
Author Contributions
Conceptualization, Y.C.A. and R.J.B.; methodology, Y.C.A. and R.J.B.; software, Y.C.A. and R.J.B.; validation, Y.C.A. and R.J.B.; formal analysis, Y.C.A. and R.J.B.; investigation, R.A.M.V., Y.C.A. and R.J.B.; data curation, R.A.M.V.; writing—original draft preparation, Y.C.A. and R.J.B.; writing—review and editing, R.A.M.V., Y.C.A. and R.J.B.; visualization, R.A.M.V.; supervision, Y.C.A. and R.J.B.; project administration, Y.C.A. All authors have read and agreed to the published version of the manuscript.
Funding
This research received no external funding.
Institutional Review Board Statement
Not applicable.
Informed Consent Statement
Not applicable.
Data Availability Statement
All data and scripts required to reproduce the results and figures are included as Supplementary Material.
Conflicts of Interest
The authors declare no conflicts of interest.
Nomenclature
The following abbreviations and symbols are used in this manuscript:
| AD | Anaerobic digestion |
| AR6 | Sixth Assessment Report of the IPCC |
| BMP | Biochemical methane potential |
| CAPEX | Capital expenditure |
| CER | Normalized circular exergy recovery indicator (%) |
| CO2eq | Carbon dioxide equivalent |
| CRR | Cascade recovery ratio (recoverable-to-theoretical, %) |
| EC | Electrical conductivity |
| FAO | Food and Agriculture Organization of the United Nations |
| FAOSTAT | Statistical database of FAO |
| GHG | Greenhouse gas |
| GIS | Geographic information system |
| H2S | Hydrogen sulfide |
| IEA | International Energy Agency |
| IPCC | Intergovernmental Panel on Climate Change |
| IRENA | International Renewable Energy Agency |
| MBtu | Million British thermal units |
| MCF | Methane conversion factor of a manure-management system |
| MMS | Manure-management system |
| Nm3 | Normal cubic meter (0 °C, 101.325 kPa) |
| NPV/IRR | Net present value/Internal rate of return |
| OECD | Organisation for Economic Co-operation and Development |
| ppmv | Parts per million by volume |
| S0, S1, S2 | Baseline (2024), moderate (2035), and intensive (2035) scenarios |
| TWhx | Exergy-equivalent terawatt-hours |
| VS | Volatile solids |
| a | Year (annum) |
| Maximum methane-producing capacity of species s (m3 CH4 kg−1 VS) | |
| Deployment factor, | |
| , | Electricity and useful heat delivered by cogeneration (TWh a−1) |
| Electricity grid emission factor (t CO2 MWh−1) | |
| , | Specific chemical exergy of methane (MJ Nm−3) and nitrogen (MJ kg−1 N) |
| Exergy-equivalent value of the product portfolio (TWhx a−1) | |
| Collectability fraction of species s (: cattle) | |
| Methane leakage of the biogas system (fraction of produced methane) | |
| Break-even leakage | |
| GWP100 | 100-year global warming potential |
| i, s | Country and species indices |
| Typical live mass of species s (kg head−1) | |
| Mass of recovered nitrogen (Mt N a−1) | |
| MCFbase,s | Baseline methane conversion factor of the contained flow of species s |
| N | Number of Monte Carlo iterations |
| Inventory of species s in country i (heads) | |
| p | p-value of a rank correlation |
| Fraction of the resource above the minimum viable scale | |
| , | Reference and heat-delivery temperatures (K) |
| Fraction of competitive uses of contained manure | |
| , , , | Theoretical, collectable, recoverable, and deployment-constrained methane (m3 CH4 a−1) |
| CH4 | Manure-management CH4 balance (Mt CO2eq a−1) |
| Effective digestion-system efficiency (realization factor) | |
| Volatile-solids excretion rate of species s | |
| Density of methane (kg Nm−3) | |
| Spearman rank correlation coefficient | |
| Kendall rank correlation coefficient |
References
- Organización de las Naciones Unidas para la Alimentación y la Agricultura. Soluciones Ganaderas para el Cambio Climático; FAO: Roma, Italy, 2018. [Google Scholar]
- Food and Agriculture Organization of the United Nations. Pathways Towards Lower Emissions: A Global Assessment of the Greenhouse Gas Emissions and Mitigation Options from Livestock Agrifood Systems; Technical report; FAO: Rome, Italy, 2023. [Google Scholar]
- Chadwick, D.; Sommer, S.; Thorman, R.; Fangueiro, D.; Cardenas, L.; Amon, B.; Misselbrook, T. Manure management: Implications for greenhouse gas emissions. Anim. Feed. Sci. Technol. 2011, 166–167, 514–531. [Google Scholar] [CrossRef] [Scilit]
- Food and Agriculture Organization of the United Nations. FAOSTAT Statistical Database: Production — Crops and Livestock Products, Live Animals; Data Through 2024; FAO: Rome, Italy, 2025; Available online: https://www.fao.org/faostat/en/#data/QCL (accessed on 22 August 2026).
- Weiland, P. Biogas production: Current state and perspectives. Appl. Microbiol. Biotechnol. 2010, 85, 849–860. [Google Scholar] [CrossRef] [Scilit]
- Nasir, I.M.; Mohd Ghazi, T.I.; Omar, R. Anaerobic digestion technology in livestock manure treatment for biogas production: A review. Eng. Life Sci. 2012, 12, 258–269. [Google Scholar] [CrossRef] [Scilit]
- Appels, L.; Baeyens, J.; Degrève, J.; Dewil, R. Principles and potential of the anaerobic digestion of waste-activated sludge. Prog. Energy Combust. Sci. 2008, 34, 755–781. [Google Scholar] [CrossRef] [Scilit]
- Leip, A.; Ledgard, S.; Uwizeye, A.; Palhares, J.C.P.; Aller, M.F.; Amon, B.; Binder, M.; Cordovil, C.M.d.S.; De Camillis, C.; Dong, H.; et al. The value of manure—Manure as co-product in life cycle assessment. J. Environ. Manag. 2019, 241, 293–304. [Google Scholar] [CrossRef] [Scilit]
- Möller, K.; Müller, T. Effects of anaerobic digestion on digestate nutrient availability and crop growth: A review. Eng. Life Sci. 2012, 12, 242–257. [Google Scholar] [CrossRef] [Scilit]
- Symeon, G.K.; Akamati, K.; Dotas, V.; Karatosidi, D.; Bizelis, I.; Laliotis, G.P. Manure Management as a Potential Mitigation Tool to Eliminate Greenhouse Gas Emissions in Livestock Systems. Sustainability 2025, 17, 586. [Google Scholar] [CrossRef] [Scilit]
- Intergovernmental Panel on Climate Change. Chapter 10: Emissions from Livestock and Manure Management. In 2019 Refinement to the 2006 IPCC Guidelines for National Greenhouse Gas Inventories, Volume 4: Agriculture, Forestry and Other Land Use; IPCC: Geneva, Switzerland, 2019. [Google Scholar]
- Lettinga, G. Anaerobic digestion and wastewater treatment systems. Antonie Leeuwenhoek 1995, 67, 3–28. [Google Scholar] [CrossRef] [Scilit]
- Mata-Alvarez, J.; Macé, S.; Llabrés, P. Anaerobic digestion of organic solid wastes. An overview of research achievements and perspectives. Bioresour. Technol. 2000, 74, 3–16. [Google Scholar] [CrossRef] [Scilit]
- Holm-Nielsen, J.B.; Al Seadi, T.; Oleskowicz-Popiel, P. The future of anaerobic digestion and biogas utilization. Bioresour. Technol. 2009, 100, 5478–5484. [Google Scholar] [CrossRef] [Scilit]
- Angelidaki, I.; Alves, M.; Bolzonella, D.; Borzacconi, L.; Campos, J.L.; Guwy, A.J.; Kalyuzhnyi, S.; Jenicek, P.; van Lier, J.B. Defining the biomethane potential (BMP) of solid organic wastes and energy crops: A proposed protocol for batch assays. Water Sci. Technol. 2009, 59, 927–934. [Google Scholar] [CrossRef] [Scilit]
- Batidzirai, B.; Smeets, E.M.W.; Faaij, A.P.C. Harmonising bioenergy resource potentials—Methodological lessons from review of state of the art bioenergy potential assessments. Renew. Sustain. Energy Rev. 2012, 16, 6598–6630. [Google Scholar] [CrossRef] [Scilit]
- Batzias, F.A.; Sidiras, D.K.; Spyrou, E.K. Evaluating livestock manures for biogas production: A GIS based method. Renew. Energy 2005, 30, 1161–1176. [Google Scholar] [CrossRef] [Scilit]
- Onurbaş Avcıoğlu, A.; Türker, U. Status and potential of biogas energy from animal wastes in Turkey. Renew. Sustain. Energy Rev. 2012, 16, 1557–1561. [Google Scholar] [CrossRef] [Scilit]
- Meyer, A.K.P.; Ehimen, E.A.; Holm-Nielsen, J.B. Future European biogas: Animal manure, straw and grass potentials for a sustainable European biogas production. Biomass Bioenergy 2018, 111, 154–164. [Google Scholar] [CrossRef] [Scilit]
- Sefeedpari, P.; Pudełko, R.; Jędrejek, A.; Kozak, M.; Borzęcka, M. To What Extent Is Manure Produced, Distributed, and Potentially Available for Bioenergy? A Step toward Stimulating Circular Bio-Economy in Poland. Energies 2020, 13, 6266. [Google Scholar] [CrossRef] [Scilit]
- Villarroel-Schneider, J.; Höglund-Isaksson, L.; Mainali, B.; Martí-Herrero, J.; Cardozo, E.; Malmquist, A.; Martin, A. Energy self-sufficiency and greenhouse gas emission reductions in Latin American dairy farms through massive implementation of biogas-based solutions. Energy Convers. Manag. 2022, 261, 115670. [Google Scholar] [CrossRef] [Scilit]
- Scarlat, N.; Fahl, F.; Dallemand, J.F.; Monforti-Ferrario, F.; Motola, V. A spatial analysis of biogas potential from manure in Europe. Renew. Sustain. Energy Rev. 2018, 94, 915–930. [Google Scholar] [CrossRef] [Scilit]
- Einarsson, R.; Persson, U.M. Analyzing key constraints to biogas production from crop residues and manure in the EU—A spatially explicit model. PLoS ONE 2017, 12, e0171001. [Google Scholar] [CrossRef] [Scilit]
- International Renewable Energy Agency. Agricultural Residue-Based Bioenergy: Regional Potential and Scale-Up Strategies; Technical report; IRENA: Abu Dhabi, India, 2023. [Google Scholar]
- Gómez Montoya, J.P.; Castillo Alvarez, Y.; Fernandes De Magalhães, R.; Lermen, F.H. A thermo-economic analysis of a circular economy model for biomass in South America producing biofertilizers and biogas from municipal solid waste. Renew. Energy 2024, 225, 120254. [Google Scholar] [CrossRef] [Scilit]
- Gómez Montoya, J.P.; Ortiz Dongo, L.F.; Solórzano, R.; Arrieta Gonzales, C.; Luna Delrisco, M.; Coaquira Torres, E.; Rojas Rimbaldi, J.M. Thermoeconomic Assessment and Modeling of the Potential for Organic Fertilizer Production from Farm Animal Manure in Latin America: Towards Sustainable and Circular Agriculture. In Proceedings of the LACCEI International Multi-Conference for Engineering, Education and Technology, Ciudad de México, Mexico, 16–18 July 2025. [Google Scholar] [CrossRef] [Scilit]
- Díaz-Vázquez, D.; Alvarado-Cummings, S.C.; Meza-Rodríguez, D.; Senés-Guerrero, C.; de Anda, J.; Gradilla-Hernández, M.S. Evaluation of Biogas Potential from Livestock Manures and Multicriteria Site Selection for Centralized Anaerobic Digester Systems: The Case of Jalisco, México. Sustainability 2020, 12, 3527. [Google Scholar] [CrossRef] [Scilit]
- Oliveira, H.R.; Kozlowsky-Suzuki, B.; Björn, A.; Shakeri Yekta, S.; Caetano, C.F.; Pinheiro, É.F.M.; Marotta, H.; Bassin, J.P.; Oliveira, L.; Reis, M.d.M.; et al. Biogas potential of biowaste: A case study in the state of Rio de Janeiro, Brazil. Renew. Energy 2024, 221, 119751. [Google Scholar] [CrossRef] [Scilit]
- Travieso Fernández, D.I.; Coronado Rodriguez, C.J.; Blanco Machín, E.; Travieso Pedroso, D.; de Carvalho Júnior, J.A. Brazil’s Biogas–Biomethane Production Potential: A Techno-Economic Inventory and Strategic Decarbonization Outlook. Biomass 2026, 6, 4. [Google Scholar] [CrossRef] [Scilit]
- Salomon, K.R.; Silva Lora, E.E. Estimate of the electric energy generating potential for different sources of biogas in Brazil. Biomass Bioenergy 2009, 33, 1101–1107. [Google Scholar] [CrossRef] [Scilit]
- Naranjo Herrera, A.M.; Esteves, E.M.M.; Mansouri, M.; Breuhaus, P.; Morgado, C.d.R.V. Brazilian bioenergy generation from cattle and pig manure: An economic life cycle assessment. Renew. Energy 2026, 262, 125345. [Google Scholar] [CrossRef] [Scilit]
- Venier, F.; Yabar, H. Renewable energy recovery potential towards sustainable cattle manure management in Buenos Aires Province: Site selection based on GIS spatial analysis and statistics. J. Clean. Prod. 2017, 162, 1317–1333. [Google Scholar] [CrossRef] [Scilit]
- Moreda, I.L. The potential of biogas production in Uruguay. Renew. Sustain. Energy Rev. 2016, 54, 1580–1591. [Google Scholar] [CrossRef] [Scilit]
- Scheutz, C.; Fredenslund, A.M. Total methane emission rates and losses from 23 biogas plants. Waste Manag. 2019, 97, 38–46. [Google Scholar] [CrossRef] [Scilit]
- Wechselberger, V.; Reinelt, T.; Yngvesson, J.; Scharfy, D.; Scheutz, C.; Huber-Humer, M.; Hrad, M. Methane losses from different biogas plant technologies. Waste Manag. 2023, 157, 110–120. [Google Scholar] [CrossRef] [Scilit]
- Baldé, H.; Wagner-Riddle, C.; MacDonald, D.; VanderZaag, A. Fugitive methane emissions from two agricultural biogas plants. Waste Manag. 2022, 151, 123–130. [Google Scholar] [CrossRef] [Scilit]
- Fredenslund, A.M.; Gudmundsson, E.; Maria Falk, J.; Scheutz, C. The Danish national effort to minimise methane emissions from biogas plants. Waste Manag. 2023, 157, 321–329. [Google Scholar] [CrossRef] [Scilit]
- Szargut, J.; Morris, D.R.; Steward, F.R. Exergy Analysis of Thermal, Chemical, and Metallurgical Processes; Hemisphere Publishing: New York, NY, USA, 1988. [Google Scholar]
- Kotas, T.J. The Exergy Method of Thermal Plant Analysis; Butterworths: London, UK, 1985. [Google Scholar]
- Dincer, I.; Rosen, M.A. Exergy: Energy, Environment and Sustainable Development, 2nd ed.; Elsevier: Oxford, UK, 2013. [Google Scholar]
- Hepbasli, A. A key review on exergetic analysis and assessment of renewable energy resources for a sustainable future. Renew. Sustain. Energy Rev. 2008, 12, 593–661. [Google Scholar] [CrossRef] [Scilit]
- Erisman, J.W.; Sutton, M.A.; Galloway, J.; Klimont, Z.; Winiwarter, W. How a century of ammonia synthesis changed the world. Nat. Geosci. 2008, 1, 636–639. [Google Scholar] [CrossRef] [Scilit]
- Smil, V. Enriching the Earth: Fritz Haber, Carl Bosch, and the Transformation of World Food Production; MIT Press: Cambridge, MA, USA, 2001. [Google Scholar]
- Sutton, M.A.; Bleeker, A.; Howard, C.M.; Bekunda, M.; Grizzetti, B.; de Vries, W.; van Grinsven, H.J.M.; Abrol, Y.P.; Adhya, T.K.; Billen, G.; et al. Our Nutrient World: The Challenge to Produce More Food and Energy with Less Pollution; Technical report; Centre for Ecology and Hydrology: Edinburgh, UK, 2013. [Google Scholar]
- Ruwa, T.L.; Abbasoğlu, S.; Akün, E. Energy and Exergy Analysis of Biogas-Powered Power Plant from Anaerobic Co-Digestion of Food and Animal Waste. Processes 2022, 10, 871. [Google Scholar] [CrossRef] [Scilit]
- Im-Orb, K.; Piroonlerkgul, P. Exergy Analysis of Biogas Production from Food Waste Through Anaerobic Digestion. Chem. Eng. Trans. 2025, 115, 25–30. [Google Scholar] [CrossRef]
- Martí-Herrero, J.; Chipana, M.; Cuevas, C.; Paco, G.; Serrano, V.; Zymla, B.; Heising, K.; Sologuren, J.; Gamarra, A. Low cost tubular digesters as appropriate technology for widespread application: Results and lessons learned from Bolivia. Renew. Energy 2014, 71, 156–165. [Google Scholar] [CrossRef] [Scilit]
- Martí Herrero, J. Biodigestores Tubulares: Guía de Diseño y Manual de Instalación; Redbiolac: Quito, Ecuador, 2019. [Google Scholar]
- Jaimes-Estévez, J.; Zafra, G.; Martí-Herrero, J.; Pelaz, G.; Morán, A.; Puentes, A.; Gomez, C.; Castro, L.d.P.; Escalante Hernández, H. Psychrophilic Full Scale Tubular Digester Operating over Eight Years: Complete Performance Evaluation and Microbiological Population. Energies 2021, 14, 151. [Google Scholar] [CrossRef] [Scilit]
- Castro, L.; Escalante, H.; Jaimes-Estévez, J.; Díaz, L.J.; Vecino, K.; Rojas, G.; Mantilla, L. Low cost digester monitoring under realistic conditions: Rural use of biogas and digestate quality. Bioresour. Technol. 2017, 239, 311–317. [Google Scholar] [CrossRef] [Scilit]
- Garfí, M.; Ferrer-Martí, L.; Perez, I.; Flotats, X.; Ferrer, I. Codigestion of cow and guinea pig manure in low-cost tubular digesters at high altitude. Ecol. Eng. 2011, 37, 2066–2070. [Google Scholar] [CrossRef] [Scilit]
- Lansing, S.; Víquez, J.; Martínez, H.; Botero, R.; Martin, J. Quantifying electricity generation and waste transformations in a low-cost, plug-flow anaerobic digestion system. Ecol. Eng. 2008, 34, 332–348. [Google Scholar] [CrossRef] [Scilit]
- Bond, T.; Templeton, M.R. History and future of domestic biogas plants in the developing world. Energy Sustain. Dev. 2011, 15, 347–354. [Google Scholar] [CrossRef] [Scilit]
- Rajendran, K.; Aslanzadeh, S.; Taherzadeh, M.J. Household Biogas Digesters—A Review. Energies 2012, 5, 2911–2942. [Google Scholar] [CrossRef] [Scilit]
- Surendra, K.C.; Takara, D.; Hashimoto, A.G.; Khanal, S.K. Biogas as a sustainable energy source for developing countries: Opportunities and challenges. Renew. Sustain. Energy Rev. 2014, 31, 846–859. [Google Scholar] [CrossRef] [Scilit]
- Kinyua, M.N.; Rowse, L.E.; Ergas, S.J. Review of small-scale tubular anaerobic digesters treating livestock waste in the developing world. Renew. Sustain. Energy Rev. 2016, 58, 896–910. [Google Scholar] [CrossRef] [Scilit]
- Kulkarni, I.; Zang, J.W.; Leandro, W.M.; Parikh, P.; Adler, I.; Da Fonseca-Zang, W.A.; Campos, L.C. Closed-Loop Biodigesters on Small-Scale Farms in Low- and Middle-Income Countries: A Review. Water 2021, 13, 2744. [Google Scholar] [CrossRef] [Scilit]
- Issahaku, M.; Derkyi, N.S.A.; Kemausuor, F. A systematic review of the design considerations for the operation and maintenance of small-scale biogas digesters. Heliyon 2024, 10, e24019. [Google Scholar] [CrossRef] [Scilit]
- United States Agency for International Development; International Renewable Resources Institute of Mexico. Anaerobic Biodigester Technology in Methane Capture and Manure Management in Mexico: The History and Current Situation; Technical report; USAID: Washington, DC, USA; IRRI: Mexico City, Mexico, 2015.
- Food and Agriculture Organization of the United Nations. Biogas Systems in Rwanda—A Critical Review; Technical report; FAO: Rome, Italy, 2021. [Google Scholar]
- Andriamanohiarisoamanana, F.J.; Randrianantoandro, T.N.; Ranaivoarisoa, H.F.; Kono, H.; Yoshida, G.; Ihara, I.; Umetsu, K. Integration of biogas technology into livestock farming: Study on farmers’ willingness to pay for biodigesters in Madagascar. Biomass Bioenergy 2022, 164, 106557. [Google Scholar] [CrossRef] [Scilit]
- Hernández-Sarabia, M.; Sierra-Silva, J.; Delgadillo-Mirquez, L.; Ávila-Navarro, J.; Carranza, L. The Potential of the Biodigester as a Useful Tool in Coffee Farms. Appl. Sci. 2021, 11, 6884. [Google Scholar] [CrossRef] [Scilit]
- Castillo Alvarez, Y.; Jiménez Borges, R.; Patiño Vidal, C.D.; Carhuancho Leon, F.M.; Pinares Buendia, J.S.; Samaniego Nolasco, J.A. Design Improvements and Best Practices in Small-Scale Biodigesters for Sustainable Biogas Production: A Case Study in the Chillon Valley, Perú. Energies 2025, 18, 338. [Google Scholar] [CrossRef] [Scilit]
- Camacho Alvarez, D.G.; Chávez García, J.A.; Castillo Alvarez, Y.; Jiménez Borges, R. Sustainable Valorization of Bovine–Guinea Pig Waste: Co-Optimization of pH and EC in Biodigesters. Recycling 2025, 10, 190. [Google Scholar] [CrossRef] [Scilit]
- Castillo Alvarez, Y.; Monteagudo Yanes, J.P.; Jiménez Borges, R.; Patiño Vidal, C.D. Propuesta de diseño de un biodigestor industrial de cachaza para la generación de energía eléctrica. Rev. Univ. Y Soc. 2021, 13, 74–80. [Google Scholar]
- Castillo Alvarez, Y.; Jiménez Borges, R.; Rodríguez Pérez, B.; Camacho Alvarez, D.G.; Chávez García, J.A.; Champin Luy, G.M. Manure Recoverability Governs the Available Biogas Resource and Emissions: Peruvian Livestock as a Case Study. Environments 2026, 13, 479. [Google Scholar] [CrossRef] [Scilit]
- Venegas-Venegas, J.A.; Aryal, D.R.; Pinto-Ruiz, R.; Guevara-Hernández, F.; Reyes-Sosa, M.B.; Pérez-Fernández, A.; Castellanos-Suárez, J.A. Continuing to Use Firewood or Switching to Biogas: Economic and Environmental Benefits of Low-Cost Tubular Biodigesters in Chiapas, Mexico. Fuels 2026, 7, 15. [Google Scholar] [CrossRef] [Scilit]
- Delgado, J.M.; Mosquera, A.M.; Ocampo, D.; Ríos, L.A.; Peñuela, M. An economic analysis of biogas production using swine manure in ZOMAC territories of Colombia. Sci. Rep. 2026, 16, 31440. [Google Scholar] [CrossRef] [Scilit]
- Kabyanga, M.; Balana, B.B.; Mugisha, J.; Walekhwa, P.N.; Smith, J.; Glenk, K. Economic potential of flexible balloon biogas digester among smallholder farmers: A case study from Uganda. Renew. Energy 2018, 120, 392–400. [Google Scholar] [CrossRef] [Scilit]
- Garfí, M.; Martí-Herrero, J.; Garwood, A.; Ferrer, I. Household anaerobic digesters for biogas production in Latin America: A review. Renew. Sustain. Energy Rev. 2016, 60, 599–614. [Google Scholar] [CrossRef] [Scilit]
- International Energy Agency. Outlook for Biogas and Biomethane: Prospects for Organic Growth; Technical report; IEA: Paris, France, 2020. [Google Scholar]
- Chojnacka, K.; Moustakas, K. Anaerobic digestate management for carbon neutrality and fertilizer use: A review of current practices and future opportunities. Biomass Bioenergy 2024, 180, 106991. [Google Scholar] [CrossRef] [Scilit]
- Intergovernmental Panel on Climate Change. 2006 IPCC Guidelines for National Greenhouse Gas Inventories, Volume 4: Agriculture, Forestry and Other Land Use; IPCC: Geneva, Switzerland, 2006; Volume 4. [Google Scholar]
- Forster, P.; Storelvmo, T.; Armour, K.; Collins, W.; Dufresne, J.L.; Frame, D.; Lunt, D.J.; Mauritsen, T.; Palmer, M.D.; Watanabe, M.; et al. The Earth’s Energy Budget, Climate Feedbacks, and Climate Sensitivity. In Climate Change 2021: The Physical Science Basis. Contribution of Working Group I to the Sixth Assessment Report of the Intergovernmental Panel on Climate Change; Cambridge University Press: Cambridge, UK, 2021; pp. 923–1054. [Google Scholar] [CrossRef] [Scilit]
- Mertins, A.; Wawer, T. How to use biogas? A systematic review of biogas utilization pathways and business models. Bioresour. Bioprocess. 2022, 9, 59. [Google Scholar] [CrossRef] [Scilit]
- Pandey, B.; Chen, L. Technologies to recover nitrogen from livestock manure—A review. Sci. Total Environ. 2021, 784, 147098. [Google Scholar] [CrossRef] [Scilit]
- Barampouti, E.M.; Mai, S.; Malamis, D.; Moustakas, K.; Loizidou, M. Exploring technological alternatives of nutrient recovery from digestate as a secondary resource. Renew. Sustain. Energy Rev. 2020, 134, 110379. [Google Scholar] [CrossRef] [Scilit]
- Zubair, M.; Wang, S.; Zhang, P.; Ye, J.; Liang, J.; Nabi, M.; Zhou, Z.; Tao, X.; Chen, N.; Sun, K.; et al. Biological nutrient removal and recovery from solid and liquid livestock manure: Recent advance and perspective. Bioresour. Technol. 2020, 301, 122823. [Google Scholar] [CrossRef] [Scilit]
- Szymańska, M.; Ahrends, H.E.; Srivastava, A.K.; Sosulski, T. Anaerobic Digestate from Biogas Plants—Nuisance Waste or Valuable Product? Appl. Sci. 2022, 12, 4052. [Google Scholar] [CrossRef] [Scilit]
- OECD and Food and Agriculture Organization of the United Nations. OECD-FAO Agricultural Outlook 2025–2034; OECD Publishing: Paris, France, 2025. [Google Scholar]
- Melikoglu, M.; Menekse, Z.K. Forecasting Turkey’s cattle and sheep manure based biomethane potentials till 2026. Biomass Bioenergy 2020, 132, 105440. [Google Scholar] [CrossRef] [Scilit]
- International Renewable Energy Agency. Renewable Energy Technologies: Cost Analysis Series—Biomass for Power Generation; Technical report; IRENA: Abu Dhabi, India, 2012. [Google Scholar]
- International Renewable Energy Agency. Measuring Small-Scale Biogas Capacity and Production; Technical report; IRENA: Abu Dhabi, India, 2016. [Google Scholar]
- Allegue, L.B.; Hinge, J. Biogas Upgrading: Evaluation of Methods for H2S Removal; Technical report; Danish Technological Institute: Taastrup, Denmark, 2014; Available online: https://www.teknologisk.dk/_/media/60599_Biogas+upgrading.+Evaluation+of+methods+for+H2S+removal.pdf (accessed on 30 September 2026).
- Rajagopal, R.; Massé, D.I.; Singh, G. A critical review on inhibition of anaerobic digestion process by excess ammonia. Bioresour. Technol. 2013, 143, 632–641. [Google Scholar] [CrossRef] [Scilit]
- Shapovalov, Y.; Zhadan, S.; Bochmann, G.; Salyuk, A.; Nykyforov, V. Dry Anaerobic Digestion of Chicken Manure: A Review. Appl. Sci. 2020, 10, 7825. [Google Scholar] [CrossRef] [Scilit]
- Astals, S.; Nolla-Ardèvol, V.; Mata-Alvarez, J. Thermophilic co-digestion of pig manure and crude glycerol: Process performance and digestate stability. J. Biotechnol. 2013, 166, 97–104. [Google Scholar] [CrossRef] [Scilit]
- Almomani, F.; Bhosale, R.R. Enhancing the production of biogas through anaerobic co-digestion of agricultural waste and chemical pre-treatments. Chemosphere 2020, 255, 126805. [Google Scholar] [CrossRef] [Scilit]
- Pérez, I.; Garfí, M.; Cadena, E.; Ferrer, I. Technical, economic and environmental assessment of household biogas digesters for rural communities. Renew. Energy 2014, 62, 313–318. [Google Scholar] [CrossRef] [Scilit]
- Garfí, M.; Castro, L.; Montero, N.; Escalante, H.; Ferrer, I. Evaluating environmental benefits of low-cost biogas digesters in small-scale farms in Colombia: A life cycle assessment. Bioresour. Technol. 2019, 274, 541–548. [Google Scholar] [CrossRef] [Scilit]
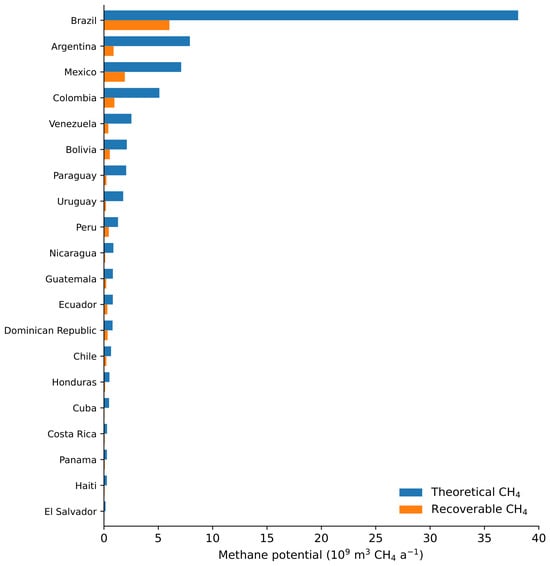
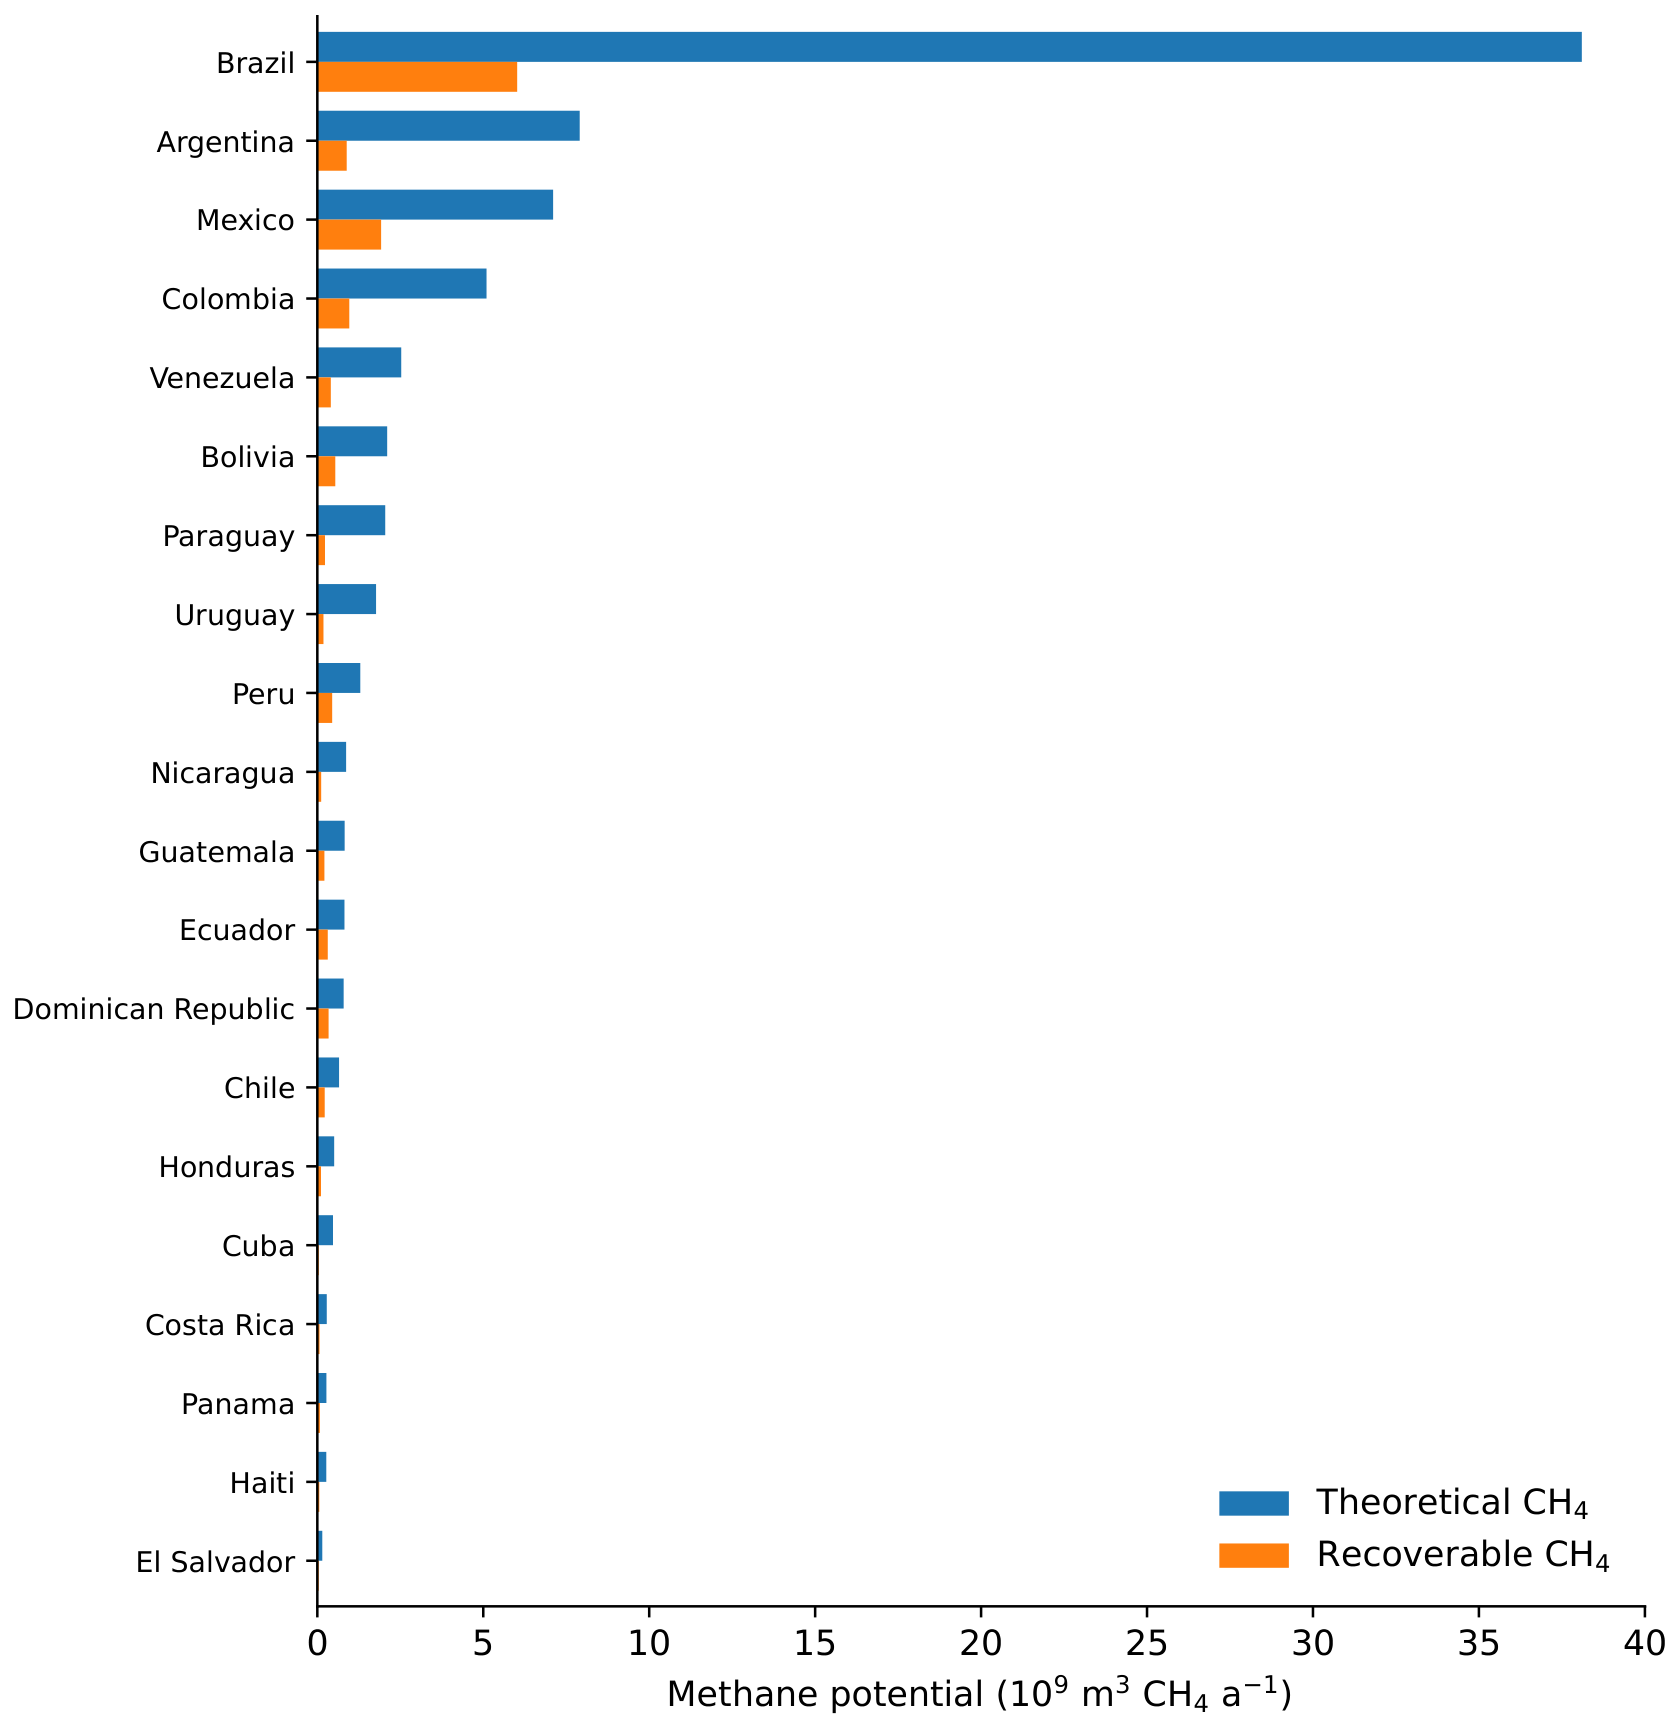
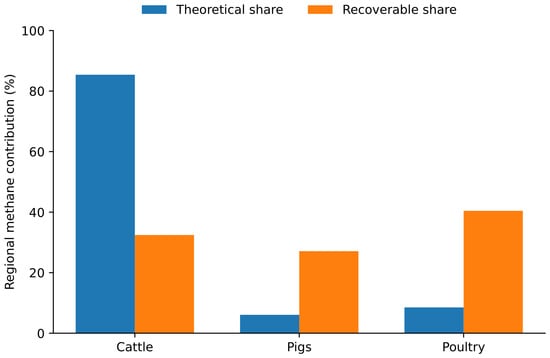
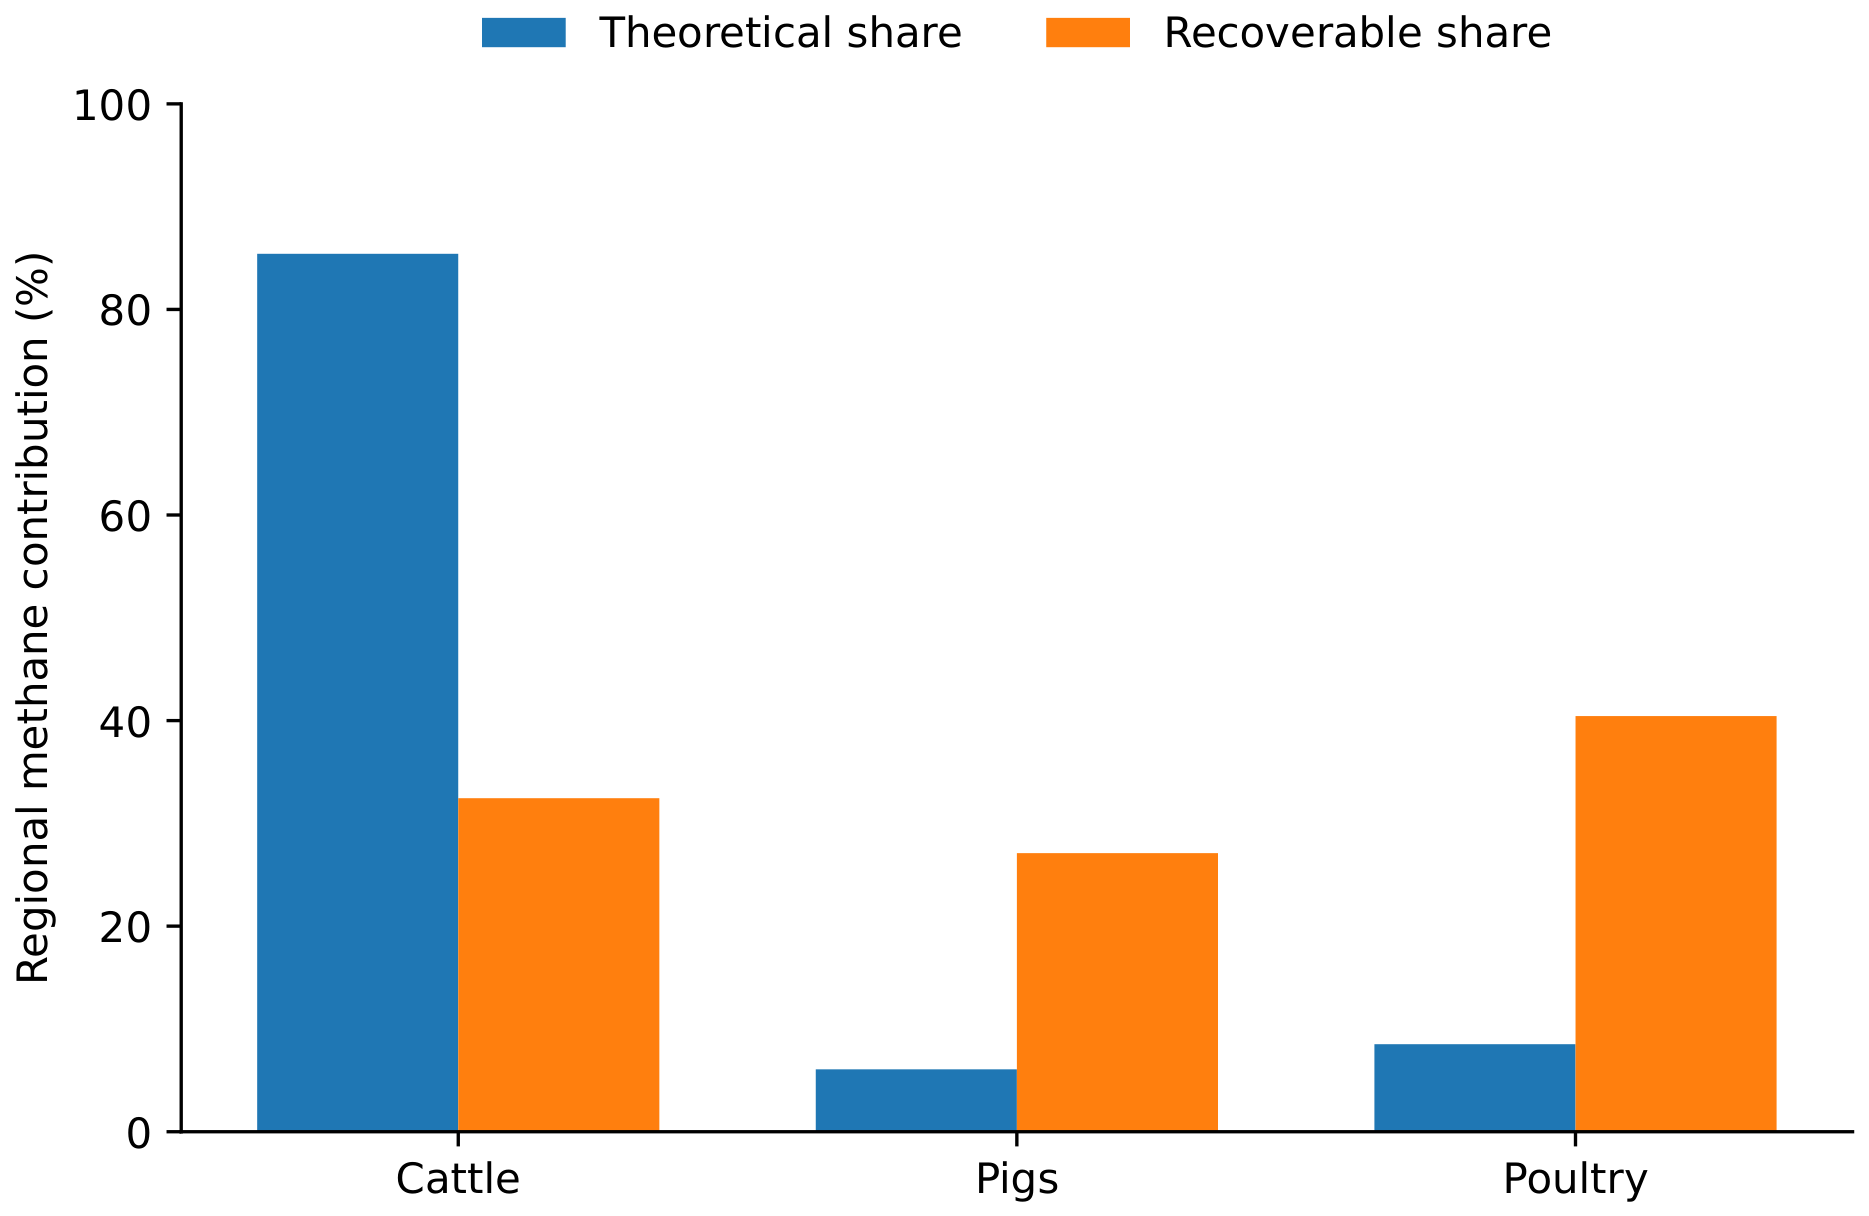
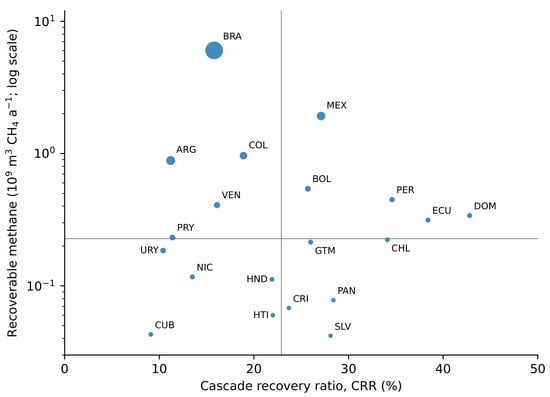
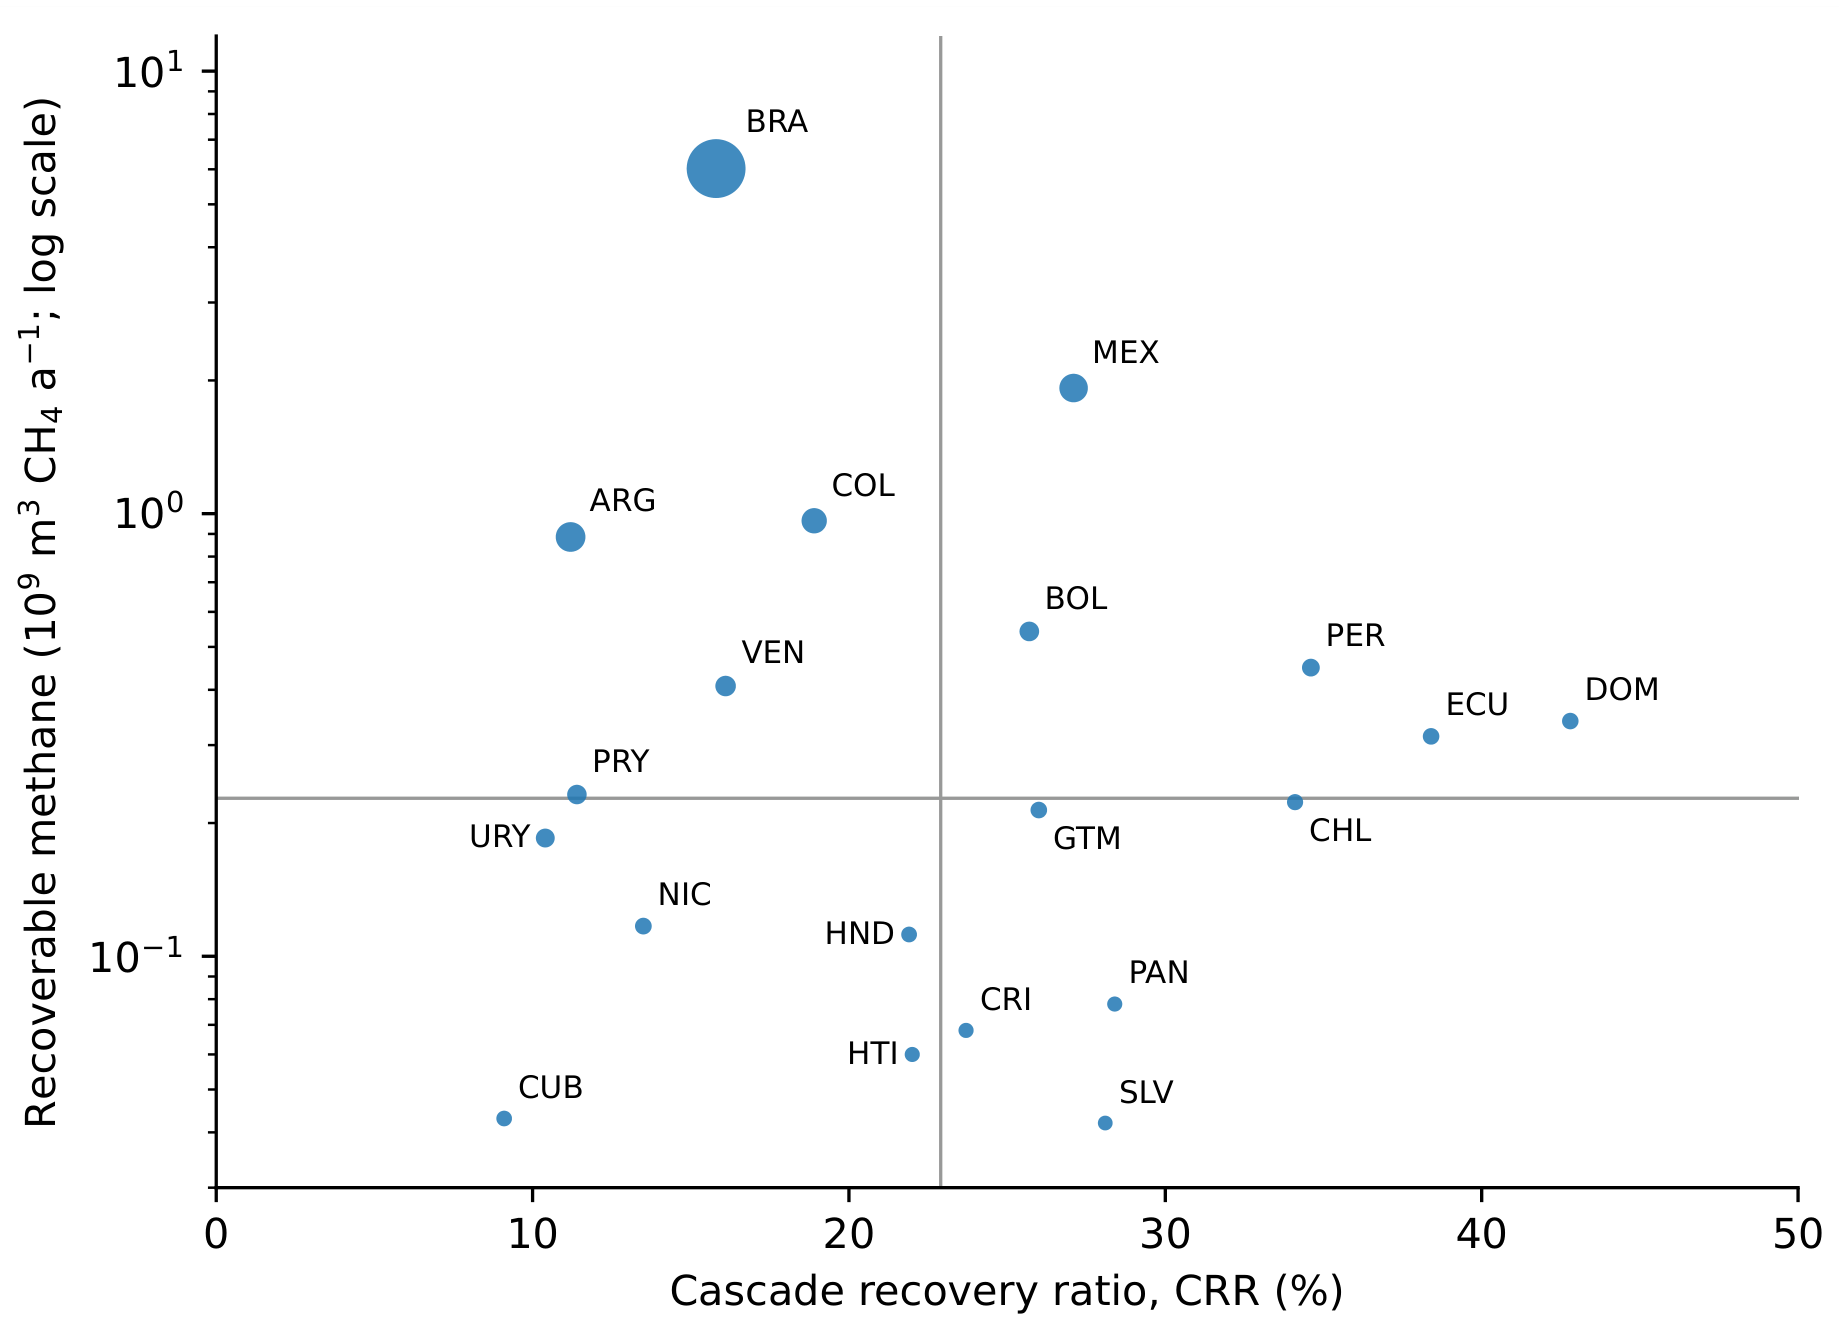
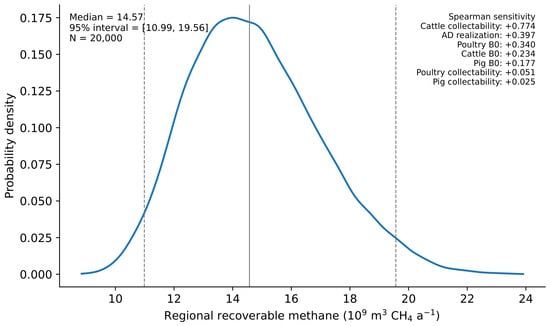
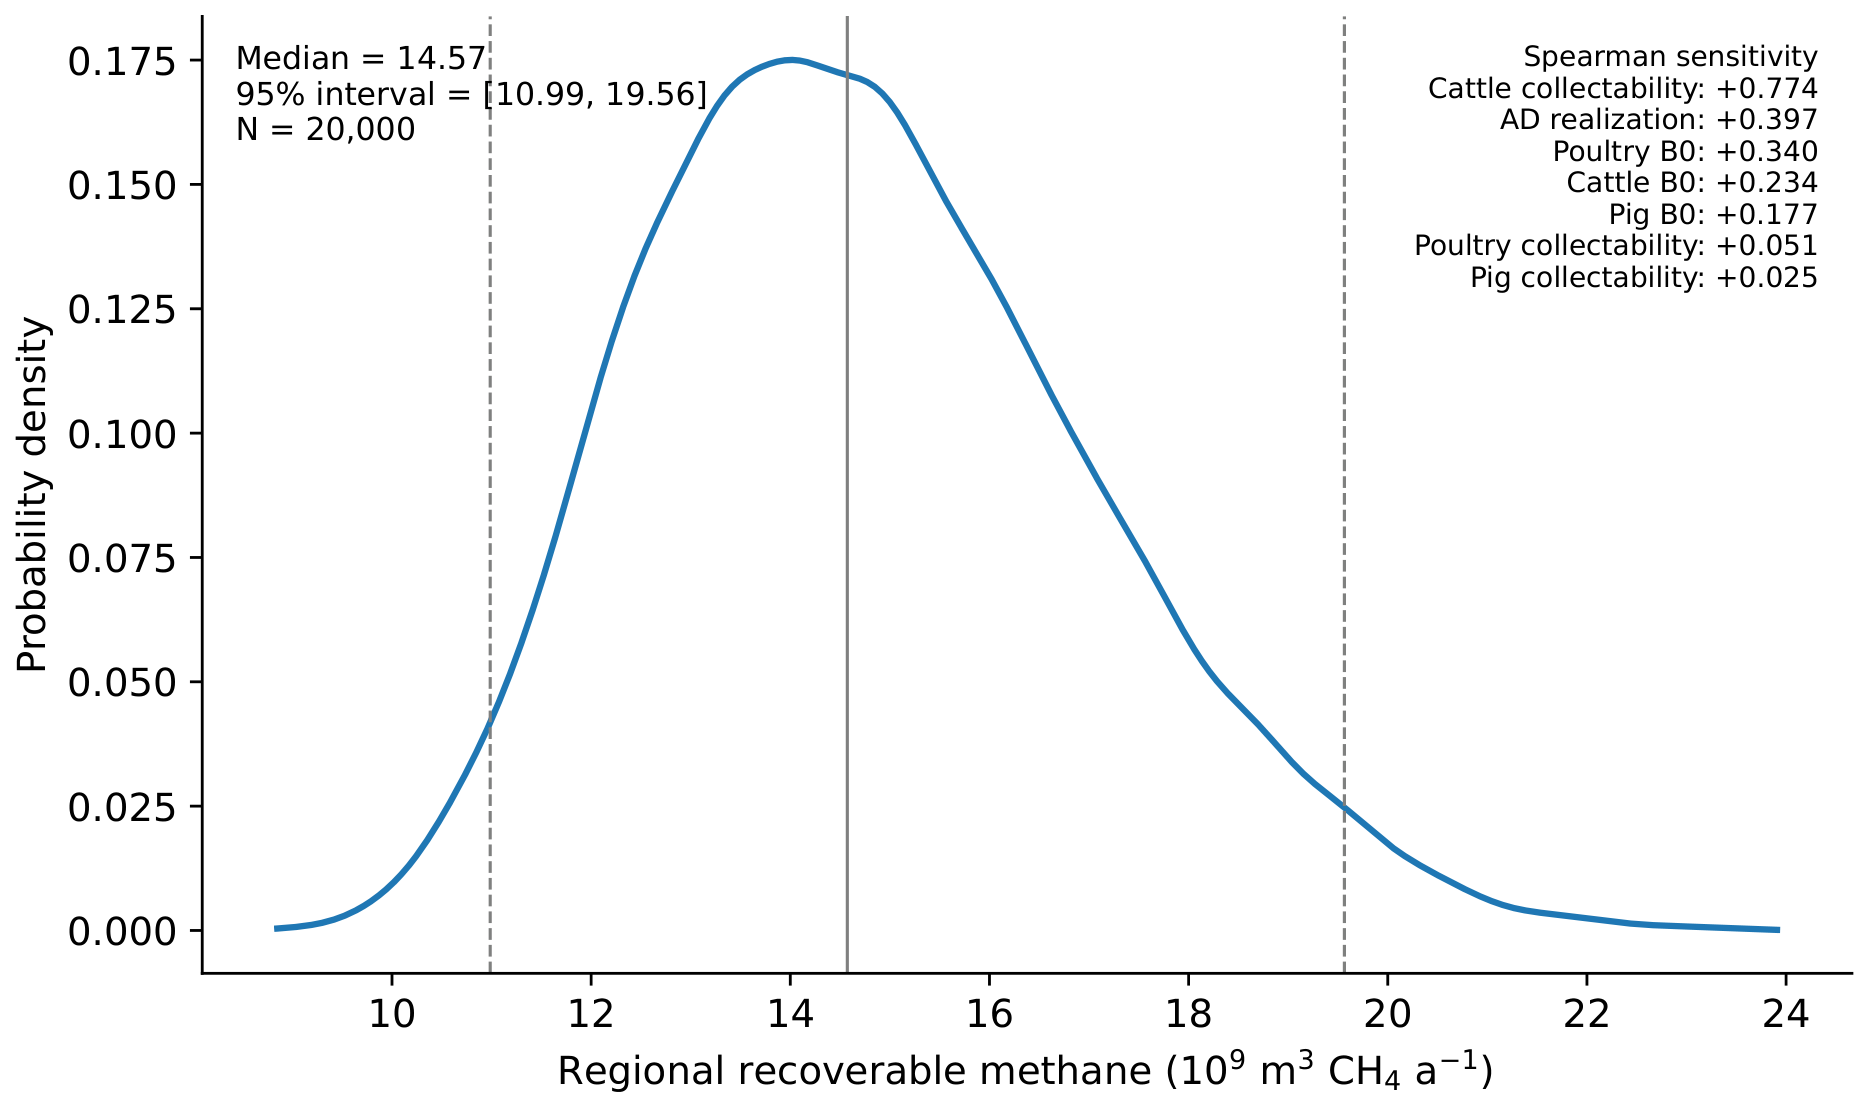
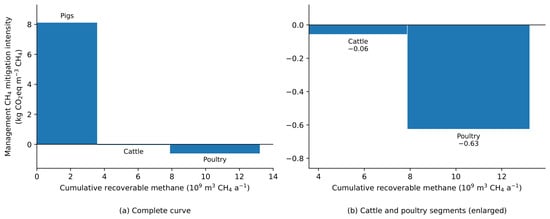
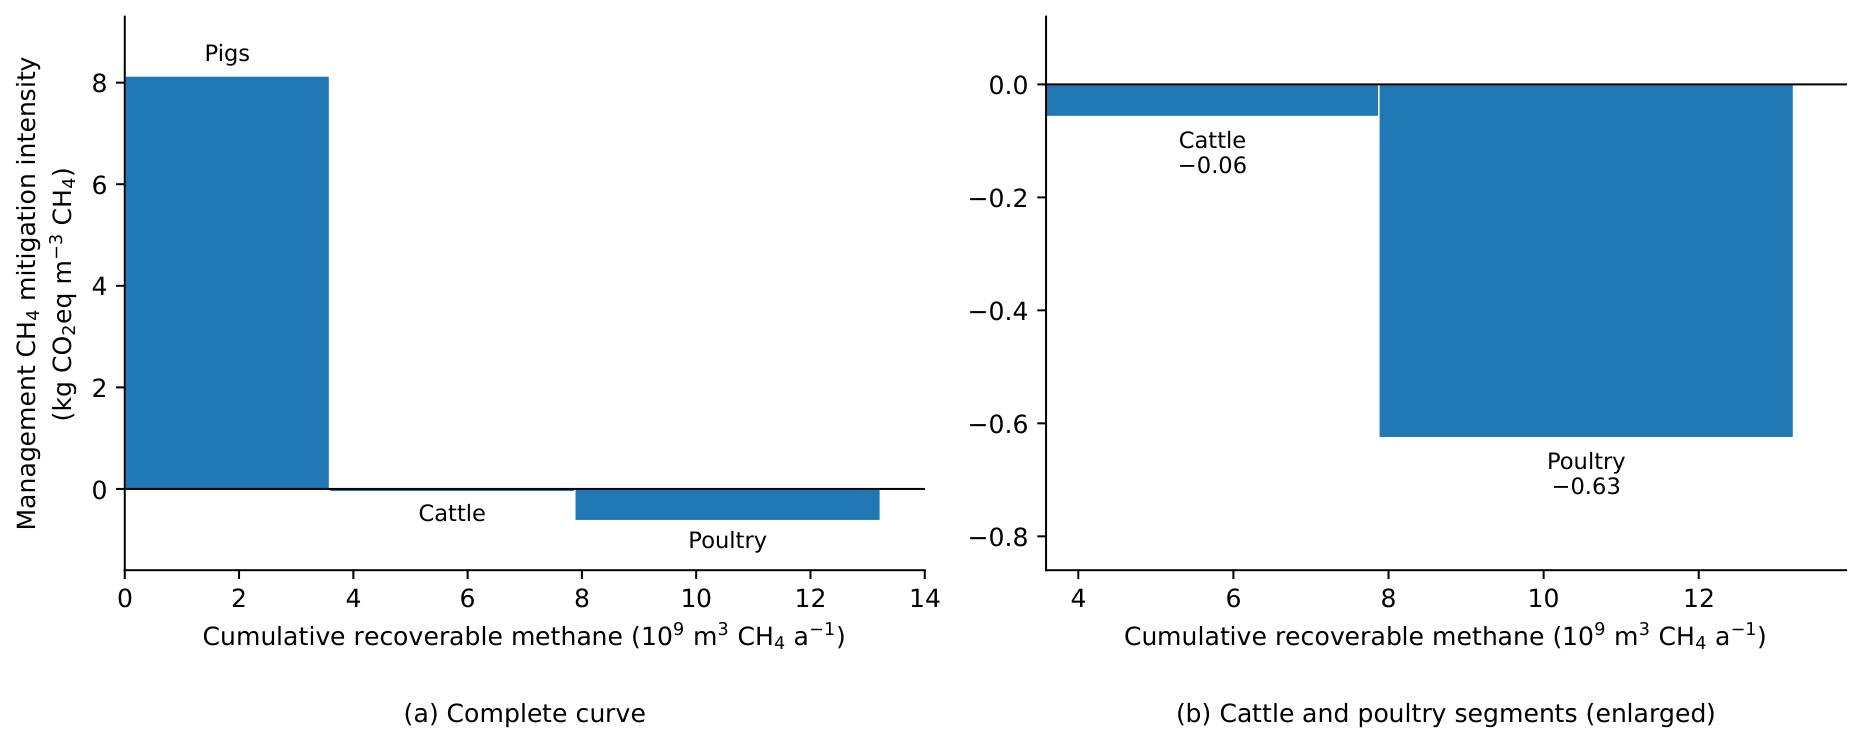
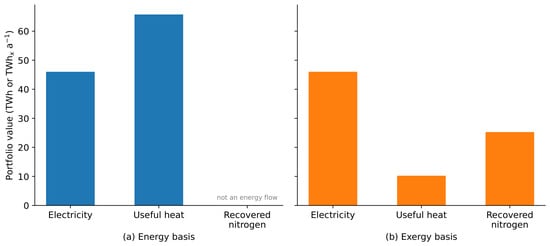
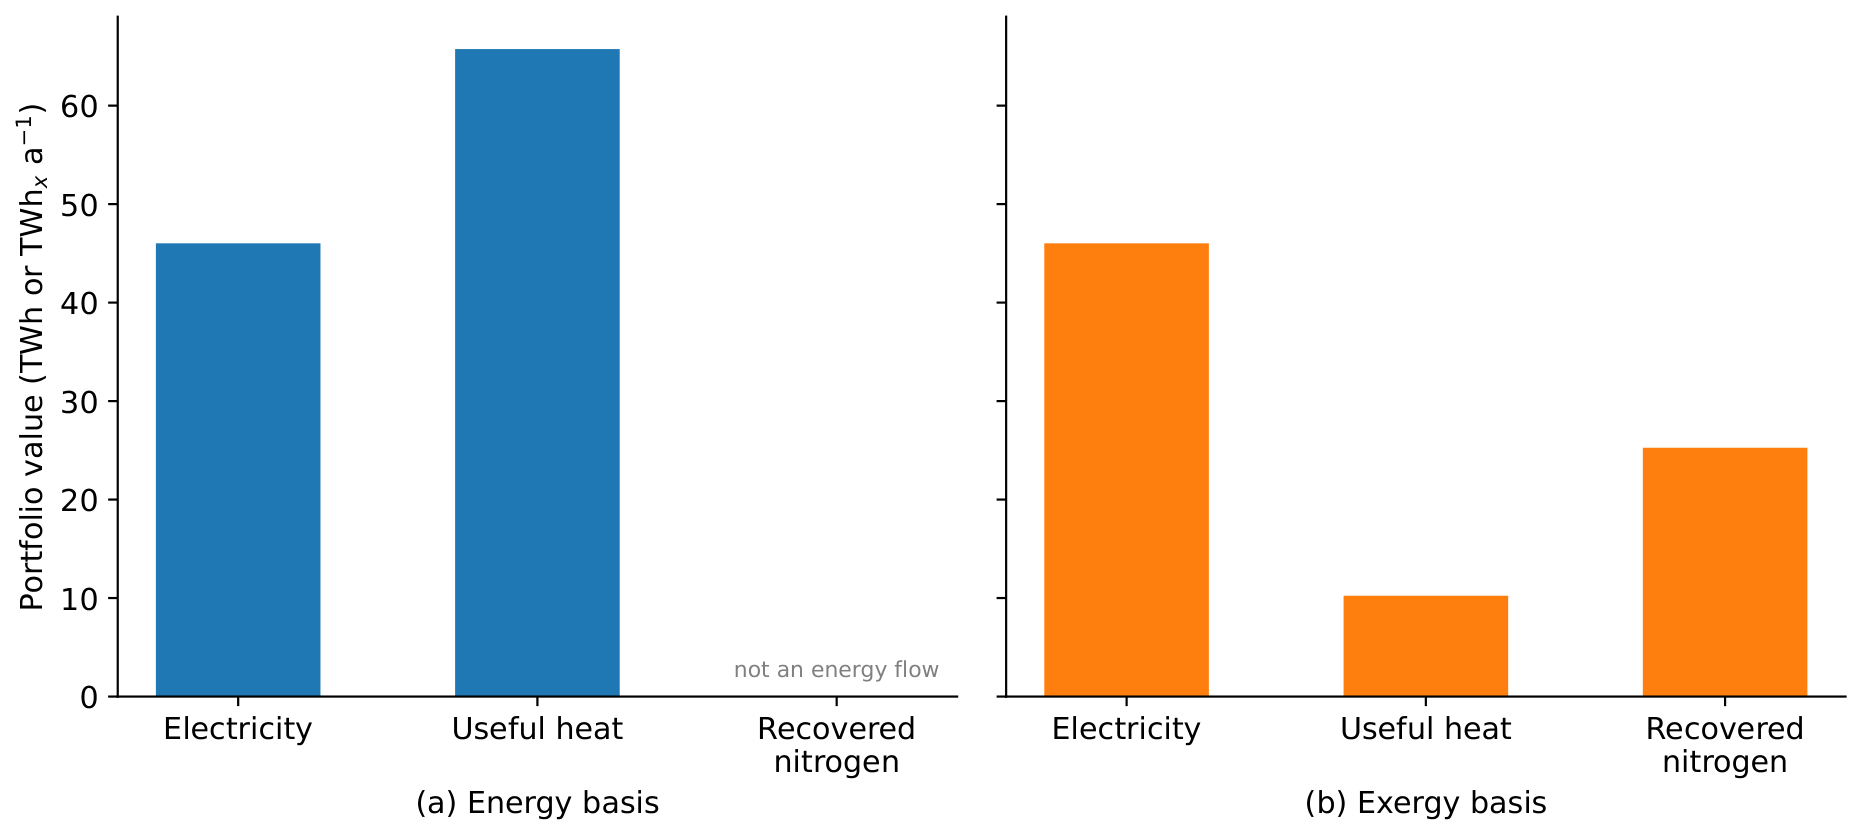
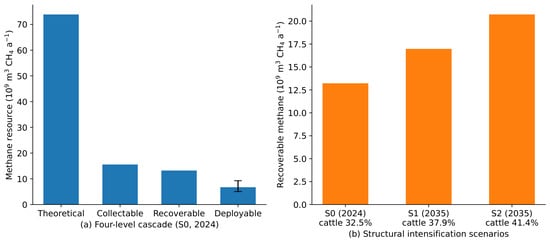
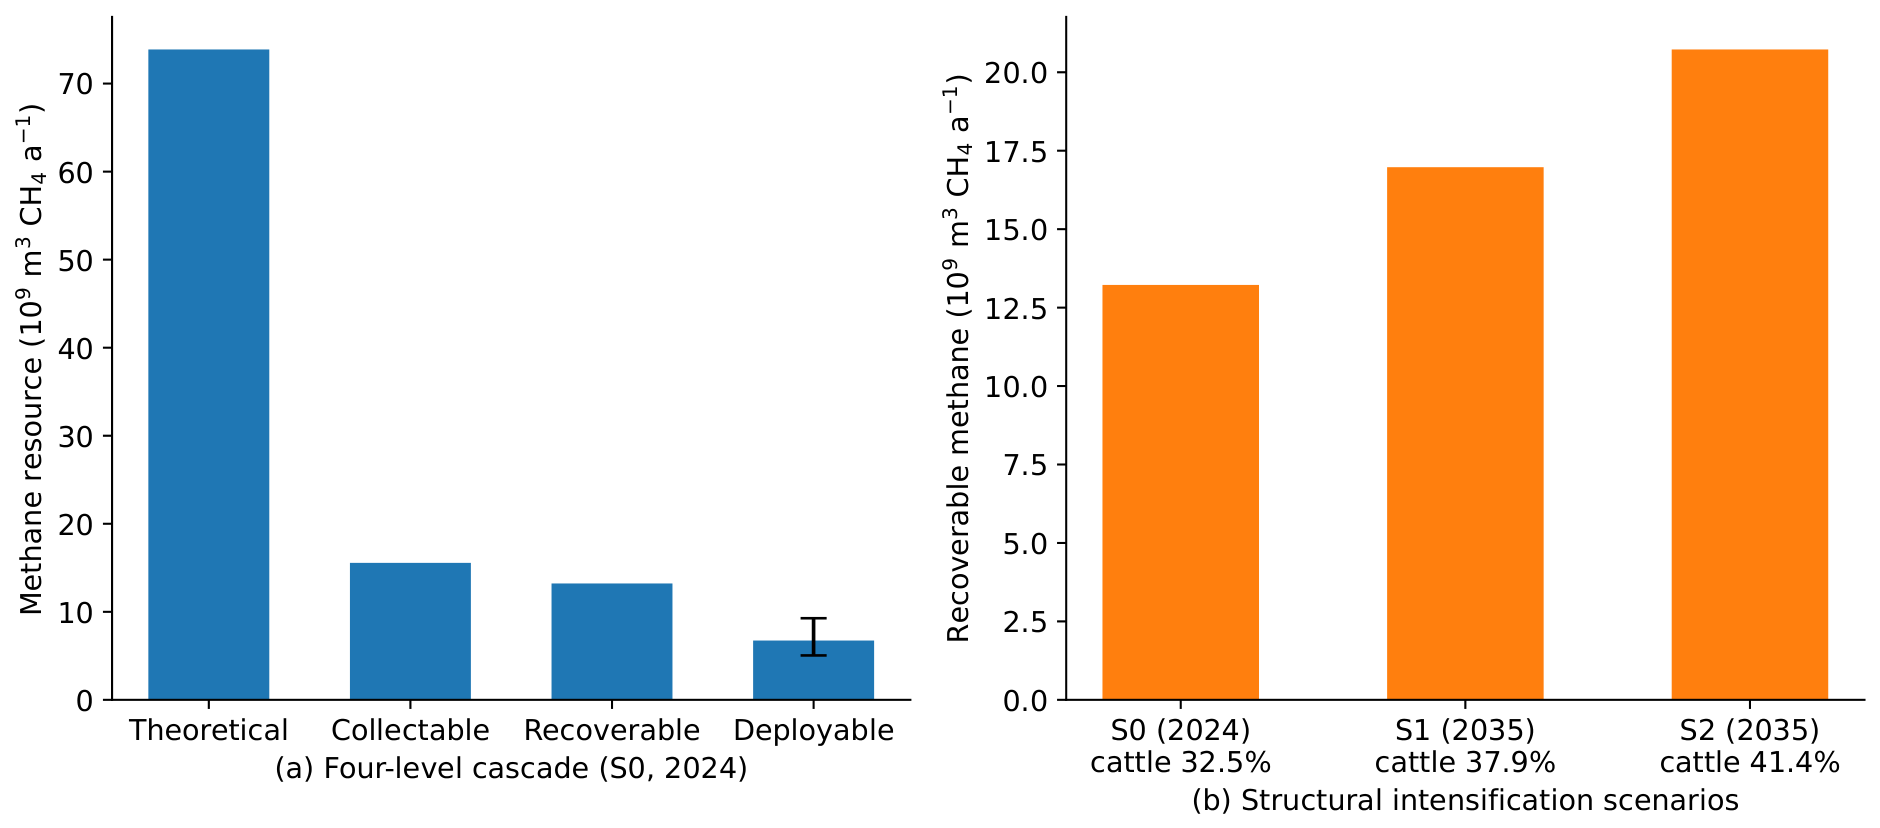
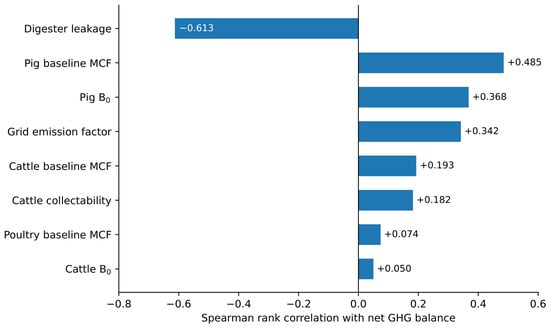
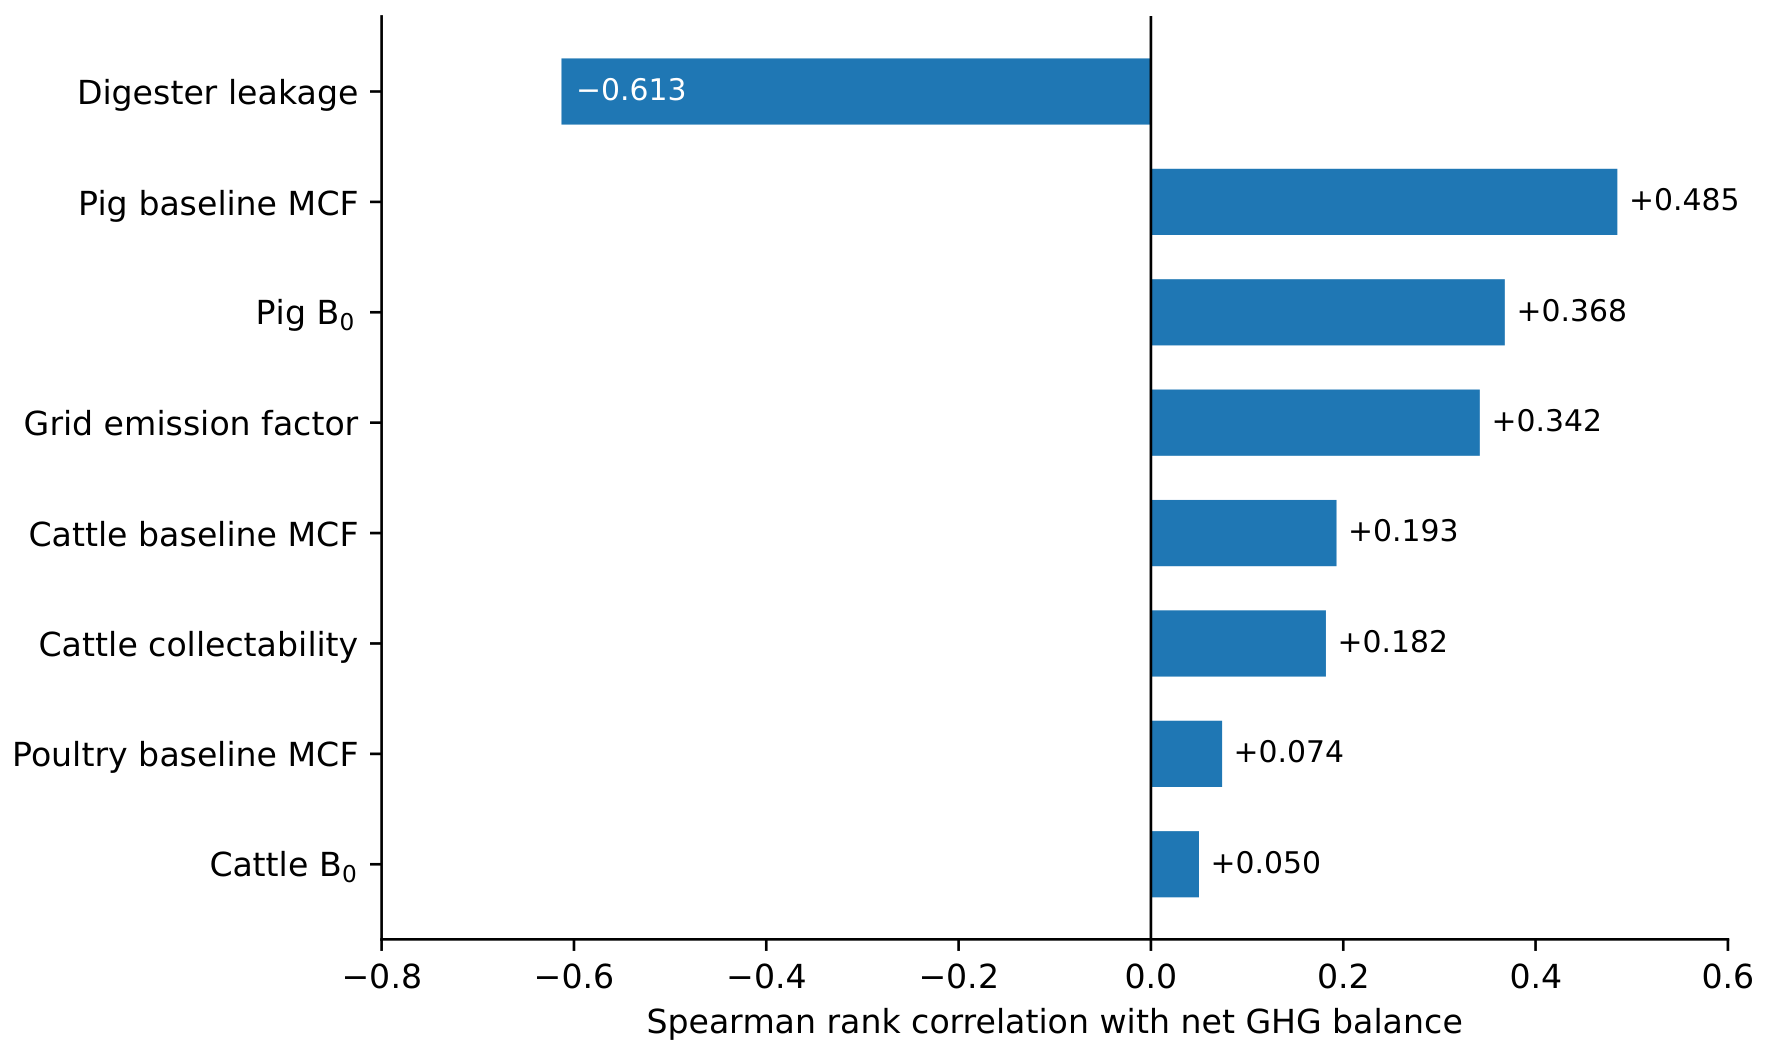

Disclaimer/Publisher’s Note: The statements, opinions and data contained in all publications are solely those of the individual author(s) and contributor(s) and not of MDPI and/or the editor(s). MDPI and/or the editor(s) disclaim responsibility for any injury to people or property resulting from any ideas, methods, instructions or products referred to in the content. |
© 2026 by the authors. Licensee MDPI, Basel, Switzerland. This article is an open access article distributed under the terms and conditions of the Creative Commons Attribution (CC BY) license.