


Abstract
The dairy industry produces large quantities of lactose-rich residues which could be fermented into a suite of valuable products. In this study, we sought to ferment concentrated cheese whey (CCW), with an initial lactose concentration of about 150 g/L, into D-lactic acid (D-LA) using an engineered strain of Lactiplantibacillus plantarum ATCC BAA-793 that lacks the L-lactate dehydrogenase gene (ldhL1), referred to as LdhL1. In experiments using lactose-supplemented laboratory MRS media, greater than 99% of the lactic acid generated by LdhL1 was the D-stereoisomer, compared to equimolar production of D- and L-lactic acid (L-LA) with the wild-type (WT) strain. When CCW was used as the major source of lactose and essential nutrients, most lactose was fermented in 7 days. However, in mixtures of CCW and MRS, fermentations with high-density LdhL1 cultures took less than 1 day, yielding D-LA titers of ~75 g D-LA/L, with 94% of the LA being the D-LA isomer, and with a production rate of ~3.7 g D-LA/(L h). This fermentation process achieves some of the highest titers and rates of D-LA production from dairy residues, an important step toward valorizing lactose-rich dairy residues.
1. Introduction
After milk is used for the manufacturing of food products, about 85% of the milk by volume ends up as low-value liquid residue [1,2]. These residues are rich in the disaccharide lactose, have low economic value [1,2,3], and their treatment or disposal often creates a financial burden for the farmer and the industry [4,5]. Given the abundance of lactose-rich dairy residues, there is a growing interest in converting these underutilized resources into valuable products.
This work sought to selectively ferment dairy residues into the D-stereoisomer of lactic acid (D-LA), which is used as a precursor monomer in the production of polylactic acid (PLA). Currently, poly-L-lactic acid (PLLA), derived from the L-LA stereoisomer, is the major industrial PLA polymer produced [6,7]. However, poly-D-lactic acid (PDLA) derived from a D-LA monomer is of interest due to the improved thermal and mechanical stability of polymers composed of PLLA and PDLA mixtures when compared to those containing only PLLA or PDLA [4,7,8]. LA monomers are usually produced by fermentation of food-grade materials [6,9], with major drivers of production cost being the sources of sugar and other nutrients such as amino acids and vitamins needed to fuel the fermentation. Some studies have evaluated the use of lactose-rich dairy residues such as whey permeate and acid whey to produce enriched solutions of D-LA [10,11,12,13,14]. However, the lactose concentration in these residues is limited by the concentration of this disaccharide in milk (~40 g/L), so D-LA titers are low compared to those obtained when using glucose solutions [15].
In this study we used concentrated cheese whey (CCW), a residual product after extraction of all food-value coproducts from the whey, that contains approximately 150 g/L of lactose, to evaluate whether greater D-LA titers could be produced at high rates compared to production using dairy coproducts with lower lactose concentration. We report on the production of enriched solutions of D-LA by fermentation of CCW using a Lactiplantibacillus plantarum strain deficient in L-LA synthesis. Using this strain, it was possible to generate enriched solutions of D-LA from the CCW residue, even though other bacteria were present in the CCW. Supplementing CCW with other nutrient-rich extracts resulted in one of the highest rates of D-LA production reported in the literature. The insight gained through these experiments enables further optimization of fermentation systems for selective production of D-LA from lactose-rich dairy residues.
2. Materials and Methods
2.1. Bacterial Strains, Plasmids, and Primers
L. plantarum strain ATCC BAA-793 (also known as NCIMB8826 or WCFS1; GCF_000203855.3), the wild-type (WT) strain in this study, was used for generating a ΔldhL1 strain, henceforth referred to as LdhL1, a mutant with an in-frame deletion of the ldhL1 gene (L-lactate dehydrogenase, lp_0537) (Table 1). L. plantarum strains were grown at 37 °C as static cultures in deMan, Rogosa, and Sharpe (MRS) media (Alpha Biosciences, Baltimore, MD, USA) prepared to contain 20 g/L lactose or 20 g/L glucose as a fermentable substrate. Escherichia coli EC1000 (Addgene, Watertown, MA, USA) was used as a cloning host and was cultured in lysogeny broth (LB powder Invitrogen™ Luria Broth Base powder; Fisher Scientific, Waltham, MA, USA) at 37 °C and shaken at 250 rpm.
Table 1.
Bacterial strains, plasmids, and oligonucleotide primers used in this study.
The LdhL1 strain was constructed by homologous recombination. Plasmid pVPL3002-ldhL1 (Table 1), used to delete the ldhL1 gene, was constructed by amplifying 1000 bp of DNA upstream from ldhL1, using primers ldhL1_US_fwd and ldhL1_US_rev (Table 1), and a 950 bp DNA region downstream from ldhL1, using ldhL1_DS_fwd and ldhL1_DS_rev (Table 1). For amplification, the polymerase chain reaction (PCR) used Q5® Hot Start High-Fidelity 2X Master Mix (New England Biolabs, Ipswich, MA, USA). The upstream and downstream fragments of ldhL1 were cloned into pVPL3002 [16] using NEBuilder® HiFi DNA Assembly Master Mix (New England Biolabs, Ipswich, MA, USA), yielding plasmid pVPL3002-ldhL1 (Table 1). This plasmid was transformed into E. coli EC1000 following previously outlined transformation methods [17]. The DNA sequences of all plasmid constructs were confirmed by PCR and DNA sequencing (Plasmidsaurus, South San Francisco, CA, USA).
2.2. Homologous Recombination
To construct the LdhL1 mutant, homologous recombination was performed as described [16], except that 1500 µg/mL vancomycin was used as a counterselection marker in the double cross-over selection step. Electro-transformation was performed with a BioRad GenePusler Xcell (BioRad, Hercules, CA, USA) using 2 mm cuvettes. The ldhL1 deletion was confirmed by PCR amplicon sequencing across the gene, and whole-genome sequencing using an Illumina NextSeq 1000 was used for an overall assessment of mutations.
2.3. Dairy Residue Source
The dairy residue used in these experiments is based on cheese whey (CW) that was produced and processed by Burnett Dairy (Wilson, WI, USA). The dairy plant generates CCW after extracting value from CW. First, the CW is centrifuged to recover fat globules. The remaining CW is pasteurized using a high-temperature short-time method (73.3 °C, 15 s) and ultrafiltered to remove molecules larger than 10 kDa, recovering a whey protein concentrate (WPC). The resulting liquid residue undergoes reverse osmosis, which concentrates the remaining dairy components, including lactose, into a concentrated residue while producing polished water that can be discharged or reused [18,19]. This lactose-rich solution is the CCW used as a fermentation substrate in this research.
2.4. Culturing Conditions During Fermentation Experiments
Fermentation experiments were conducted in batch mode in 1.4 L bioreactor vessels, in a Multifors 2 parallel bench top reactor system (Infors USA Inc., Annapolis Junction, MD, USA), using a working volume of 500 mL, unless otherwise stated. The bioreactors have an integrated bioprocess platform (Eve software, Infors USA Inc., Annapolis Junction, MD, USA) for control of pH and temperature, and for dissolved oxygen sensing. At the beginning of the incubation period, bioreactors were bubbled with N2 gas for ~30 min to remove dissolved oxygen from the medium. The pH was maintained at 6.0 using automated additions of 5 M NaOH (Sigma-Aldrich, St. Louis, MO, USA), when needed. The reactors were operated at 37 °C, with mixing set at 200 rpm. In all cases, experiments were conducted in triplicate. Samples were periodically collected to measure optical density at 600 nm (OD600), using a BioSpec mini (Shimadzu, Kyoto, Japan), and for analysis of lactose and fermentation products.
Initial fermentation experiments started with 450 mL CCW inoculated with 50 mL of cells collected at the mid-exponential log phase of cultures to maximize cell viability. These cultures were grown in glucose-containing (20 g/L) MRS medium (Thermo Fisher Scientific, Waltham, MA, USA). Some experiments tested the effect of using higher initial cell densities by using a different inoculum preparation method. In this case, 50 mL of the mid-log-phase pre-grown cultures were inoculated into 450 mL MRS containing 20 g/L glucose and incubated for 24 h. After the 24 h incubation period, all 500 mL of culture was spun down in a Beckman Coulter Avanti J-E centrifuge (Beckman Coulter, Inc., Brea, CA, USA), at 6000 g and room temperature, for 10 min. After the supernatant was removed, the cell pellet was re-suspended into 50 mL of MRS containing 20 g/L glucose and returned to the reactor before adding 450 mL of CCW. Alternatively, after the 24 h incubation period, a hollow-fiber membrane (Repligen D04-P20U-05-S, Waltham, MA, USA) was employed to remove spent media, while retaining the cells within the reactor. With this later procedure, different volumes of spent media were removed and replaced with CCW, or CCW mixed with additional nutrients, to begin the fermentation experiment.
2.5. 16S rRNA Gene Sequence Analysis
DNA extraction and quality control was done as previously described [20]. The extracted DNA was submitted to the University of Wisconsin Biotechnology Center for 16S rRNA analysis using paired end, 300 bp sequencing on an Illumina MiSeq Sequencer and a MiSeq 600 bp (v3) sequencing cartridge (Illumina, Inc., San Diego, CA, USA). The facility used primers targeting the 16S rRNA gene V3/V4 variable region [20]. Analysis and processing of raw 16S rRNA gene sequences were performed as described in Fortney et al. [20].
2.6. Analytical Tests
Assays for the determination of carbohydrates (lactose, glucose, galactose), organic acids (acetic, lactic, succinic) and alcohols (ethanol, glycerol) were performed in triplicate using high-performance liquid chromatography (HPLC) in an Agilent HPLC 1260 Infinity I (Agilent Technologies, Santa Clara, CA, USA) equipped with an Aminex HPX-87H 30 cm × 7.8 mm column (BioRad, Hercules, CA, USA) and a refractive index detector (RID). Calibration curves for each metabolite were constructed from standards prepared using HPLC grade chemicals with 99% purity. With this quantification method, total LA was measured since the stereoisomers were not separated.
Quantification of D-LA and L-LA was achieved using a Shimadzu 8045 liquid chromatography mass spectroscopy (LC-MS) system (Shimadzu, Kyoto, Japan) equipped with an Astec® CHIROBIOTIC® R Chiral 15 cm × 2.1 mm HPLC column (Sigma-Aldrich, St. Louis, MO, USA) that separated the L-LA and D-LA stereoisomers [21]. Multiple reaction monitoring was used to detect the metabolites by the specific m/z transition of precursor (89.3 m/z) to fragment product (43 m/z) with a collision energy of 13 V. The mobile phase, used in isocratic mode at 0.7 mL/min, was 15% 33.3 mM ammonium acetate in LCMS-grade water (pH = 5.8) and 85% acetonitrile LCMS grade [21]. Commercial standards for L-LA (Millipore Sigma, Burlington, MA, USA) and D-LA (Neta Scientific, Hainesport, NJ, USA), with 99% purity, were used for calibration curves.
Total nitrogen and two forms of phosphorus, total and reactive, were measured with test kits (Hach Company, Loveland, CO, USA) as described [22]. Total protein was measured using the Compat-Able™ Protein Assay Preparation Reagent Kit (Thermo Scientific, Waltman, MA, USA) to pretreat the samples, followed by the Pierce™ BCA Protein Assay Kit (Thermo Scientific, Waltman, MA, USA). Chemical oxygen demand (COD) equivalents were calculated based off complete oxidation of a given metabolite [23]. Accordingly, the following conversion factors were used: 1.12 g COD/g lactose, 1.07 g COD/g glucose, 1.07 g COD/g lactic acid, 1.07 g COD/g acetic acid, 2.08 g COD/g ethanol, 1.07 g COD/g galactose, 0.95 g COD/g succinic acid, and 1.22 g COD/g glycerol.
2.7. Cost Analysis
BioSTEAM (version 2.54.0) was used for a comparative screening test of D-LA production from glucose versus CCW that included process simulation, technoeconomic analysis, and uncertainty analyses [24]. Default properties for chemicals were obtained from the Thermosteam module of BioSTEAM. BioSTEAM defaults were used for cost per kg of the different inputs, except for CCW, which was assumed to be available free of cost, and the nutrient supplement, for which a $70/kg cost was assumed.
3. Results
3.1. Generation of an L. plantarum ΔldhL1 Mutant
L. plantarum [25] has been engineered to selectively produce D-LA from starch [26] and pentose sugars [27] by deletion of the L-lactate dehydrogenase 1 gene (ldhL1, lp_0537, GCF_000203855.3) and introduction of heterologous genes for starch and xylose utilization, respectively [26,27]. In this study, we tested an L. plantarum ΔldhL1 mutant that lacks only the ldhL1 gene for its ability to produce D-LA from CCW, a lactose-rich dairy residue. The strain was generated by an in-frame deletion of the ldhL1 gene via homologous recombination [16]. Loss of the ldhL1 gene was confirmed by PCR amplification using primers ldhL1_374 F and ldhL1_7112 R (Table 1), with an expected amplicon size of ~2.8 kb for the ldhL1 gene deletion and ~3.7 kb for the parent strain (Figure S1). Whole-genome sequencing confirmed the in-frame deletion (Table S1).
3.2. Lactic Acid Production by WT and LdhL1 Strains in Laboratory Media
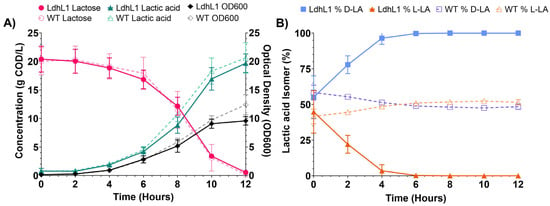
To assess the impact of the ldhL1 gene deletion on L. plantarum metabolism, growth of LdhL1 and WT was evaluated in lactose-supplemented MRS medium that did not contain any other added sugar. Growth, lactose consumption, and total LA production were similar for both strains (Figure 1A). However, WT accumulated almost equal amounts of D- and L-LA, whereas LdhL1 preferentially produced D-LA (Figure 1B). Low amounts of both D-LA and L-LA were detected at time zero, indicating that these LA stereoisomers are present in the MRS medium (0.33 g/L L-LA and 0.42 g/L of D-LA when LdhL1 was used as inoculum, and 0.30 g/L L-LA and 0.30 g/L of D-LA when WT was used as inoculum) (Figure S2). However, as the experiment with LdhL1 progressed, the concentration of L-LA in the medium decreased to zero, whereas the D-LA concentration increased, indicating that D-LA was the only LA stereoisomer produced by LdhL1 (Figure S2). In contrast, the WT experiments showed equal production of D-LA and L-LA (Figure S2).
Figure 1.
(A) Lactose consumption, lactic acid (LA) production, and culture density during growth of LdhL1 and WT cells on lactose-supplemented MRS media. (B) Contribution of L-LA and D-LA to the total LA concentration throughout the fermentation. Each data point represents the average and standard deviations of three biological replicates.
3.3. Fermentation of CCW by LdhL1
CCW is the concentrated liquid residue that results from the different steps used to recover fats, proteins, and other food products from the whey generated from cheese manufacturing. Accordingly, CCW has a high concentration of organic substrates and low concentration of nitrogen-containing substances (Table 2). On a COD basis, lactose, ethanol, and LA represent 86.0%, 5.6%, and 4.3% of the soluble COD present in the residue, while protein is only 0.4% of the soluble COD (Table 2).
Table 2.
Characteristics of CCW residue used in batch bioreactor experiments.
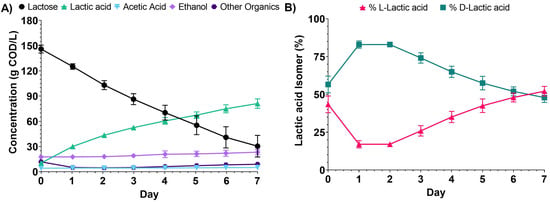
We evaluated the fermentation of lactose and the production of D-LA when LdhL1 was grown with CCW as the main source of organic carbon and other nutrients (Figure 2). Lactose consumption was slow, with less than 80% consumed in fermentation experiments that lasted 7 days (Figure 2A). LA was the main product that accumulated over time in the culture medium, and when the relative concentration of the D-LA and L-LA isomers was assessed (Figure 2B), we observed D-LA as the predominant isomer at the beginning of the incubation, but equimolar amount of both isomers at the end of the 7-day incubation period. This shift in the relative concentration of the LA isomers can be explained by rapid D-LA production during the first two days of fermentation, followed by an increased rate of L-LA production after two days of incubation (Figure S3). In experiments with the WT strain, lactose fermentation was also slow, and approximately equimolar amounts of L-LA and D-LA were produced throughout the fermentation experiment (Figure S4).
Figure 2.
(A) Extracellular levels of lactose, total LA, acetic acid, ethanol, and other measured organics (galactose, succinic acid, glucose, glycerol) during fermentation of CCW inoculated with LdhL1 (initial OD600 = 0.5). (B) Fractions of L-LA and D-LA during the fermentation. Each data point represents the average and standard deviations from three separate bioreactor experiments.
One possibility for the inability of LdhL1 to maintain selectivity towards D-LA in this experiment is that during the long incubation period there is growth of other lactic acid bacteria present in the CCW residue. To test this hypothesis, we analyzed the fermentation of uninoculated CCW under the same bioreactor conditions (Figure S5). In the absence of added LdhL1, less than 50% of the lactose was consumed in 7 days, with both LA and ethanol accumulating as fermentation products. Furthermore, the LA stereoisomers start with a racemic mixture present in the CCW, and then slow accumulation of both isomers during the first three days of fermentation, followed by an increase in rate of L-LA production as the fermentation experiment progresses (Figure S5). The microbial community present at the end of these fermentations was assessed with a 16S rRNA gene sequence analysis (Table S2), which showed Bifobacteriaceae (77.9% relative abundance) and Lactobacillaceae (14.5% relative abundance) as the most abundant microorganisms when classified at the family level. These results support the hypothesis that fermenting organisms present in the CCW residue may contribute to lactose metabolism and L-LA accumulation in the 7-day incubations with LdhL1 (Figure 2).
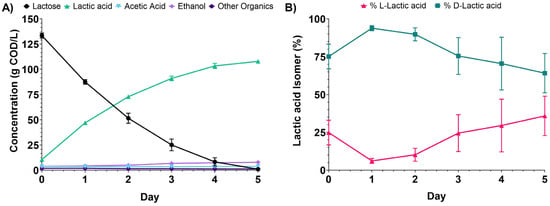
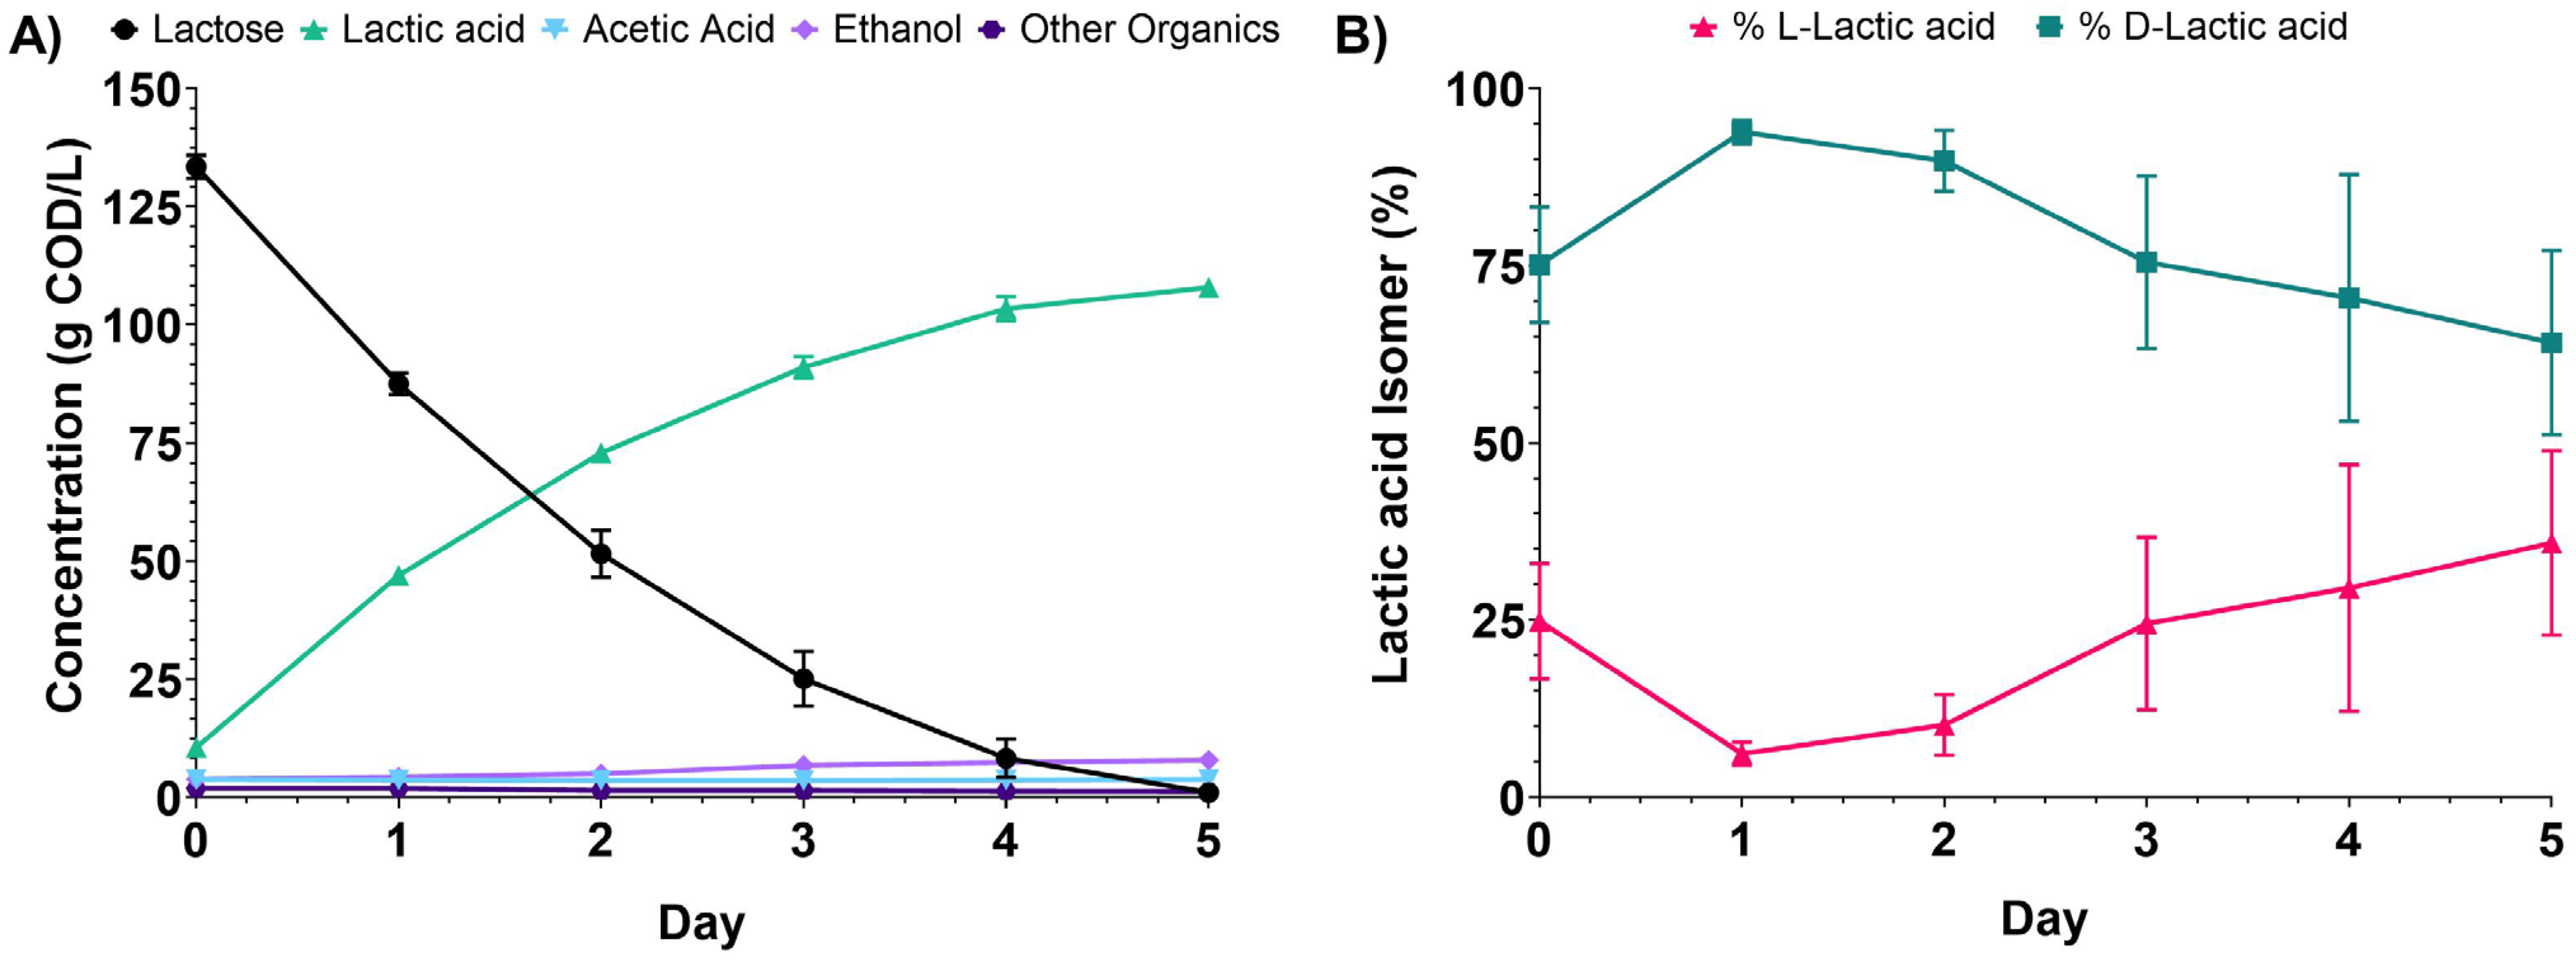
Given the likely presence of fermenting organisms in CCW, which could interfere with the objective of selective D-LA production, we tested whether starting with a higher inoculum of LdhL1 cells would improve D-LA production rates (Figure 3). In this experiment, we performed a pre-growth step with MRS directly in the bioreactor, before addition of CCW. That is, a 500 mL culture of LdhL1 cells grown on MRS containing 20 g/L glucose for ~1 day was collected by centrifugation and re-suspended in 50 mL of fresh MRS containing 20 g/L glucose, then 450 mL of CCW was added to initiate the experiment. Thus, the growth medium was composed of 90% CCW and 10% MRS. As shown in Figure 3, lactose utilization and LA production were faster, with all lactose consumed in 5 days and only LA accumulating as the fermentation product (Figure 3A). However, as in the prior experiment (Figure 2), D-LA was the dominant stereoisomer at early time points, but the concentration of extracellular L-LA increased towards the end of the incubation period (Figure 3B). The accumulation of the individual stereoisomers in individual experiments (Figure S6) reveals a similar pattern to earlier experiments, in which the L-LA production is slow in the first two days of incubation, and accelerates as the fermentation progresses, and D-LA production is fast during the first half of the experiment and plateaus in the second half of the experiment (Figure S6).
Figure 3.
CCW fermentation starting with higher concentration of LdhL1 cells (initial OD600 = 8.5). (A) Extracellular levels of lactose, LA, acetic acid, ethanol, and other organics (galactose, succinic acid, glucose, glycerol). (B) Fractions of L-LA and D-LA throughout the fermentation period. Each data point represents average and standard deviations of three separate bioreactor experiments.
Since in these experiments (Figure 2 and Figure 3) it took 5 or more days for the culture to consume the majority of the lactose present in the CCW, and the D-LA selectivity was only present in the first days of incubation, we investigated whether having a lower fraction of CCW at the beginning of the experiment, while starting with a high-density LdhL1 culture would improve fermentation rates and selectivity towards D-LA.
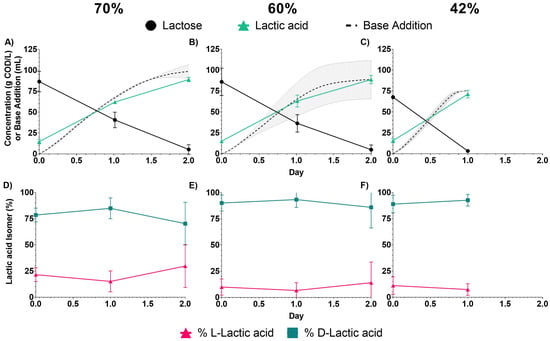
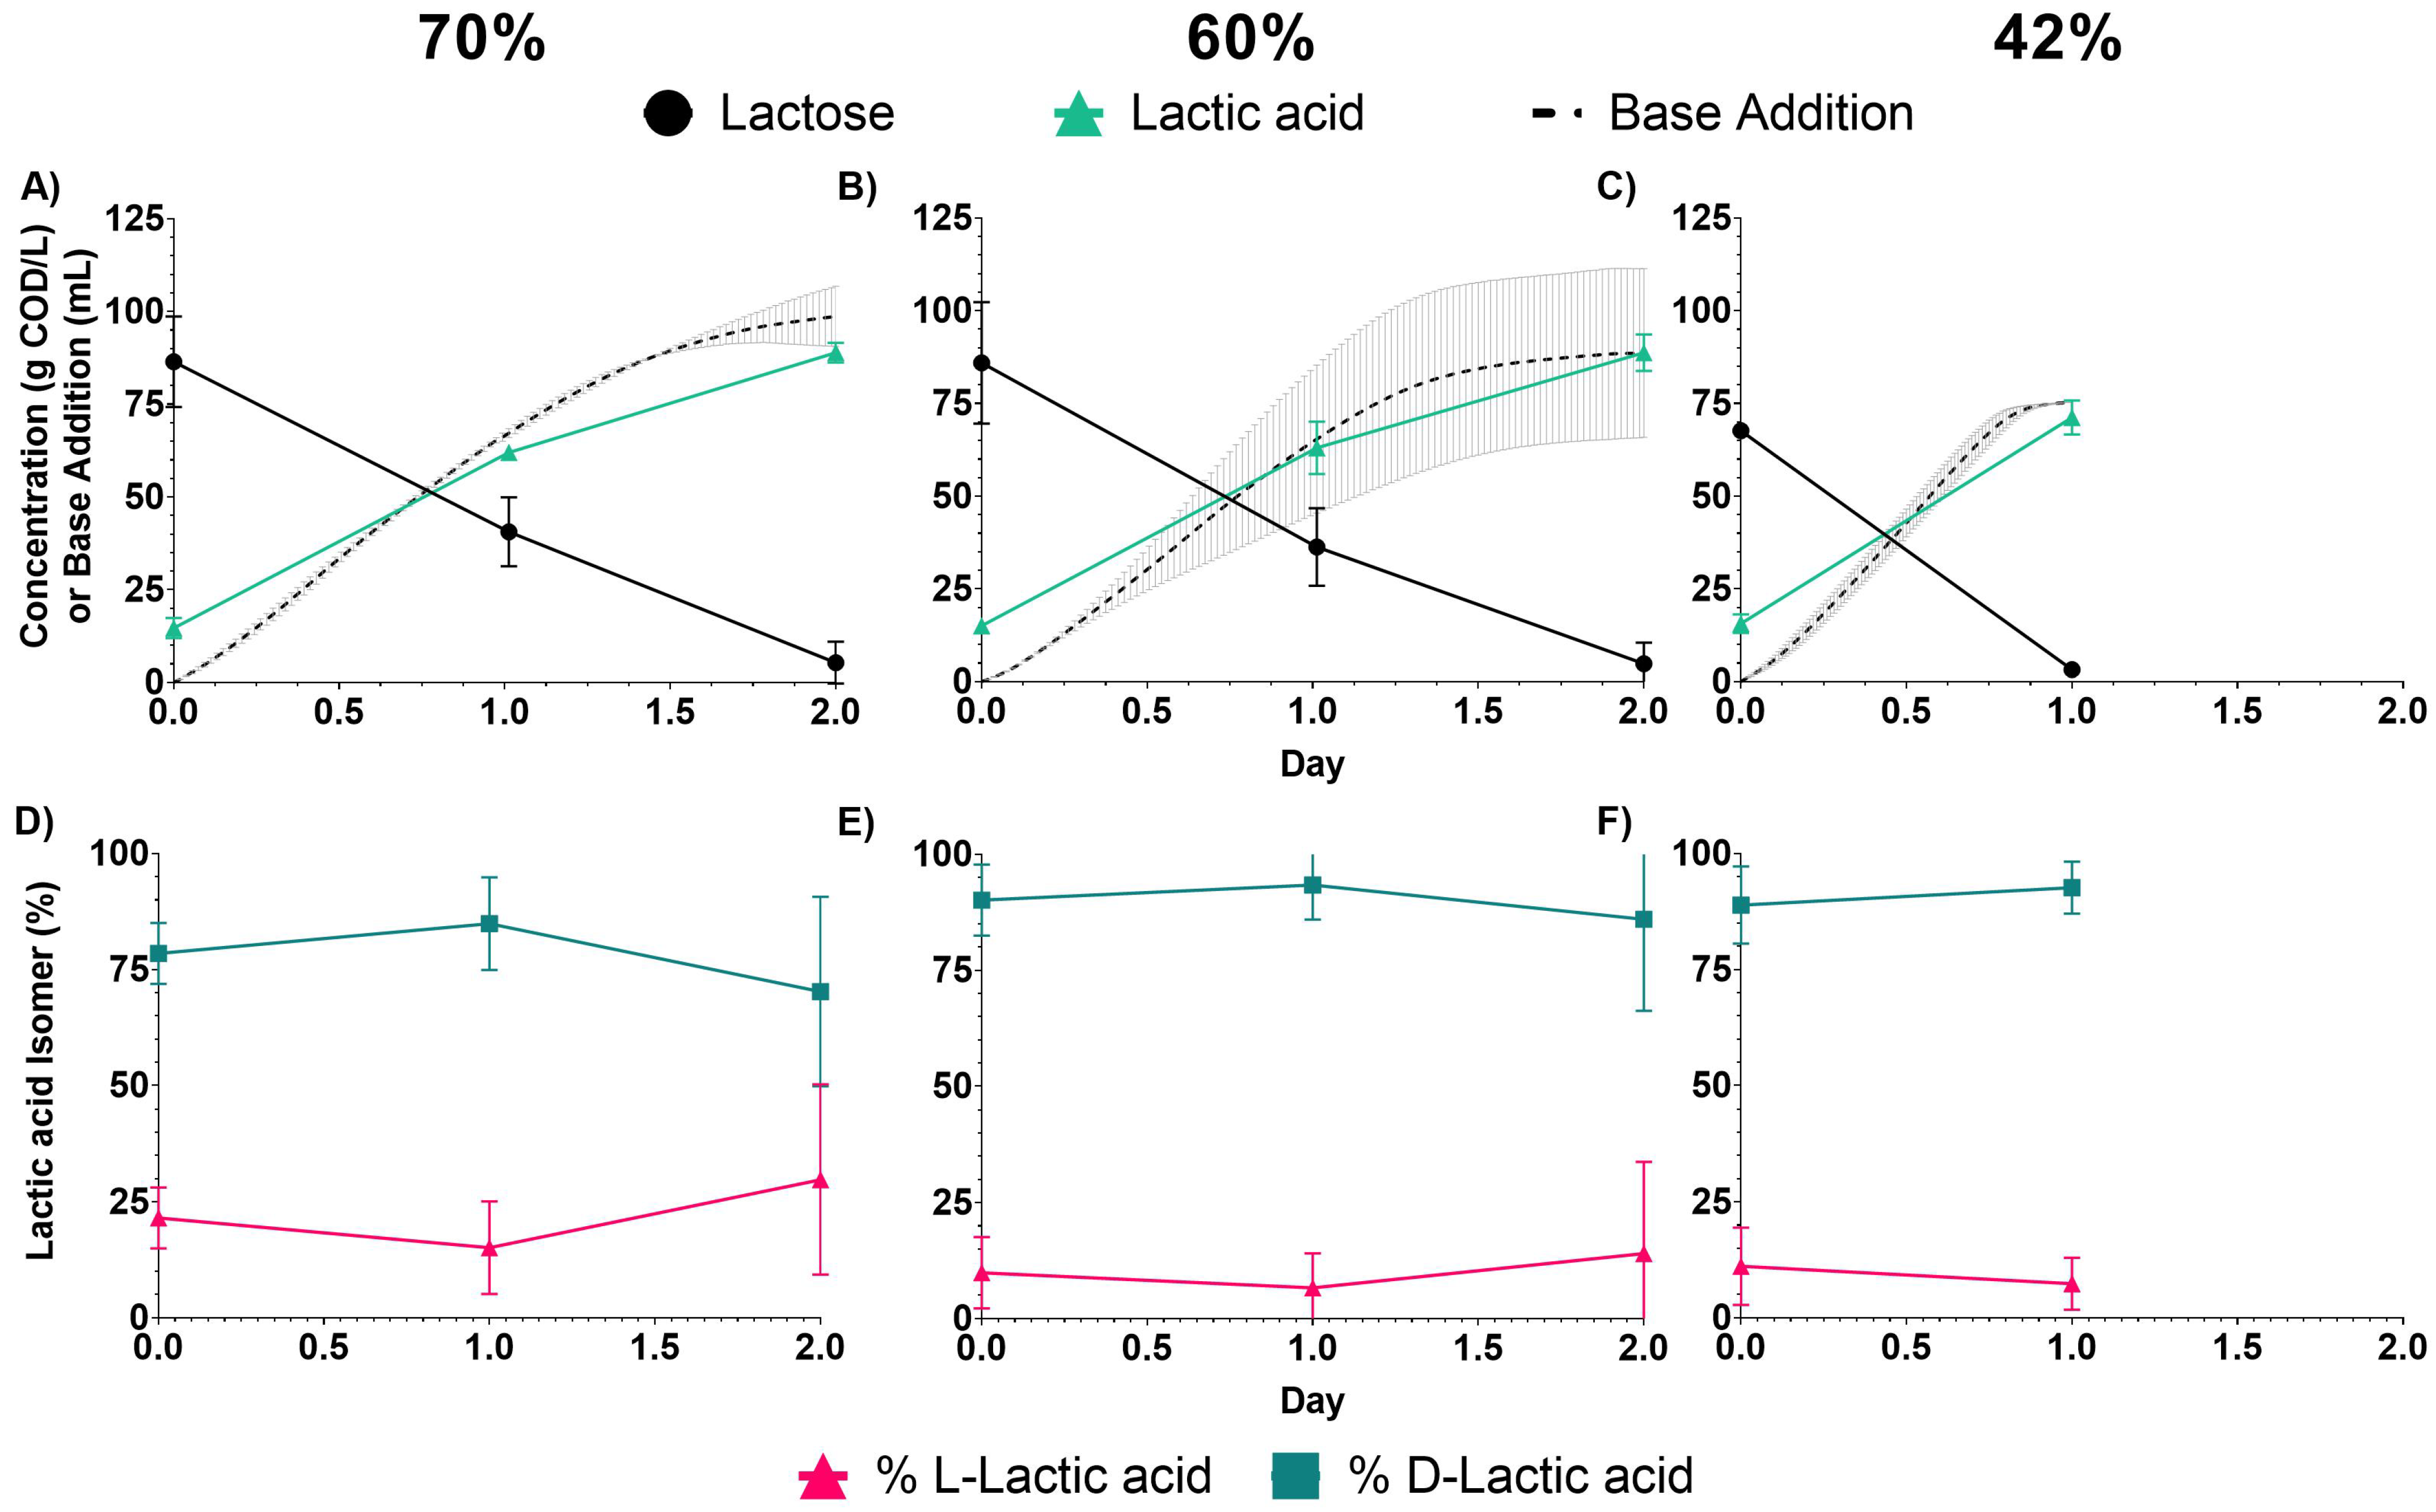
For these experiments, we employed a hollow-fiber membrane to remove spent media and retain the cells in the bioreactor. Experiments were performed replacing 70%, 60%, and 42% of the volume of spent medium with CCW (Figure 4) to test conditions with lower replacement than the 90% used in the prior experiment (Figure 3). With lower CCW fractions, we anticipated that the D-LA titer would be lower but hypothesized that selectivity towards D-LA would be higher. Furthermore, with faster fermentation taking place, we used the accumulated base addition to maintain constant pH as a proxy to estimate the duration of the fermentation process (Table S3). This approach was verified with the condition that produced the fastest fermentation results (Figure S7). When 70% CCW was used (Figure 4A,D), the majority of the lactose was consumed in 2 days, 83.4 ± 2.6 g LA/L was produced, and 70.2 ± 23.6% of the LA was the D-LA isomer. The individual replicates of these experiments show variability in the accumulation of L-LA, with L-LA production not observed in one of the three replicates (Figure S8). We hypothesize this is due to differences in the CCW batches collected from the dairy plant and differences in transportation and storage of these samples, which may introduce different flora into the fermentation experiments. The base addition in these experiments slow down near the 2-day mark, indicating that fermentations were essentially completed in approximately 48 h.
Figure 4.
Fermentation experiments with LdhL1 (initial OD600 = 7.5) and different fractions of spent medium replaced with CCW. Extracellular levels of lactose and LA measured at 1-day intervals and cumulative amount of base added to maintain constant pH when (A) 70%, (B) 60%, (C) 42% of spent medium was replaced with CCW. Fractions of L-LA and D-LA during the fermentation when (D) 70%, (E) 60%, (F) 42% of spent medium was replaced with CCW. Each data point represents average and standard deviations of three separate bioreactor experiments, except for base addition which is from only two biological replicates due to an error recording the data in one replicate.
With 60% CCW, lactose was also consumed in 2 days, 83.2 ± 5.2 g LA/L were produced, and the D-LA isomer accounted for 86.0 ± 22.8% of the total LA (Figure 4B,E). Individual experiments at this condition also show variability in L-LA production, with L-LA accumulation not observed in two out of the three replicates (Figure S9). In this case, base addition begins to plateau at about 1.5 days, indicating that fermentation was completed in less than 48 h.
When 42% CCW was used (Figure 4C,F), lactose depletion occurred within a day, and 66.8 ± 4.8 g/L LA were produced with 92.6 ± 6.4% being the D-LA isomer. The individual experiments show reduced L-LA accumulation in two out of the three replicates, and no accumulation in one replicate (Figure S10), and the base addition curve plateaus before the 1-day mark, indicating completion of the fermentation process in less than 24 h. Overall, these experiments are in agreement with the hypotheses that selectivity towards D-LA during fermentation of CCW improves when the fraction of CCW to MRS medium decreases.
3.4. Effect of MRS Addition on CCW Fermentation into D-LA by LdhL1
We hypothesized that the progressive decrease in the time needed for lactose fermentation as the fraction of CCW decreased from 90% (Figure 3) to 42% (Figure 4) could indicate the importance of nutrients present in the MRS in improving sugar fermentation by LdhL1. We tested this hypothesis in experiments in which 60% of the spent medium was replaced with CCW (middle condition in Figure 4), but different amounts of additional MRS powder (without glucose or lactose) were added as a nutrient supplement at the beginning of the fermentation experiment (Figure 5).
Figure 5.
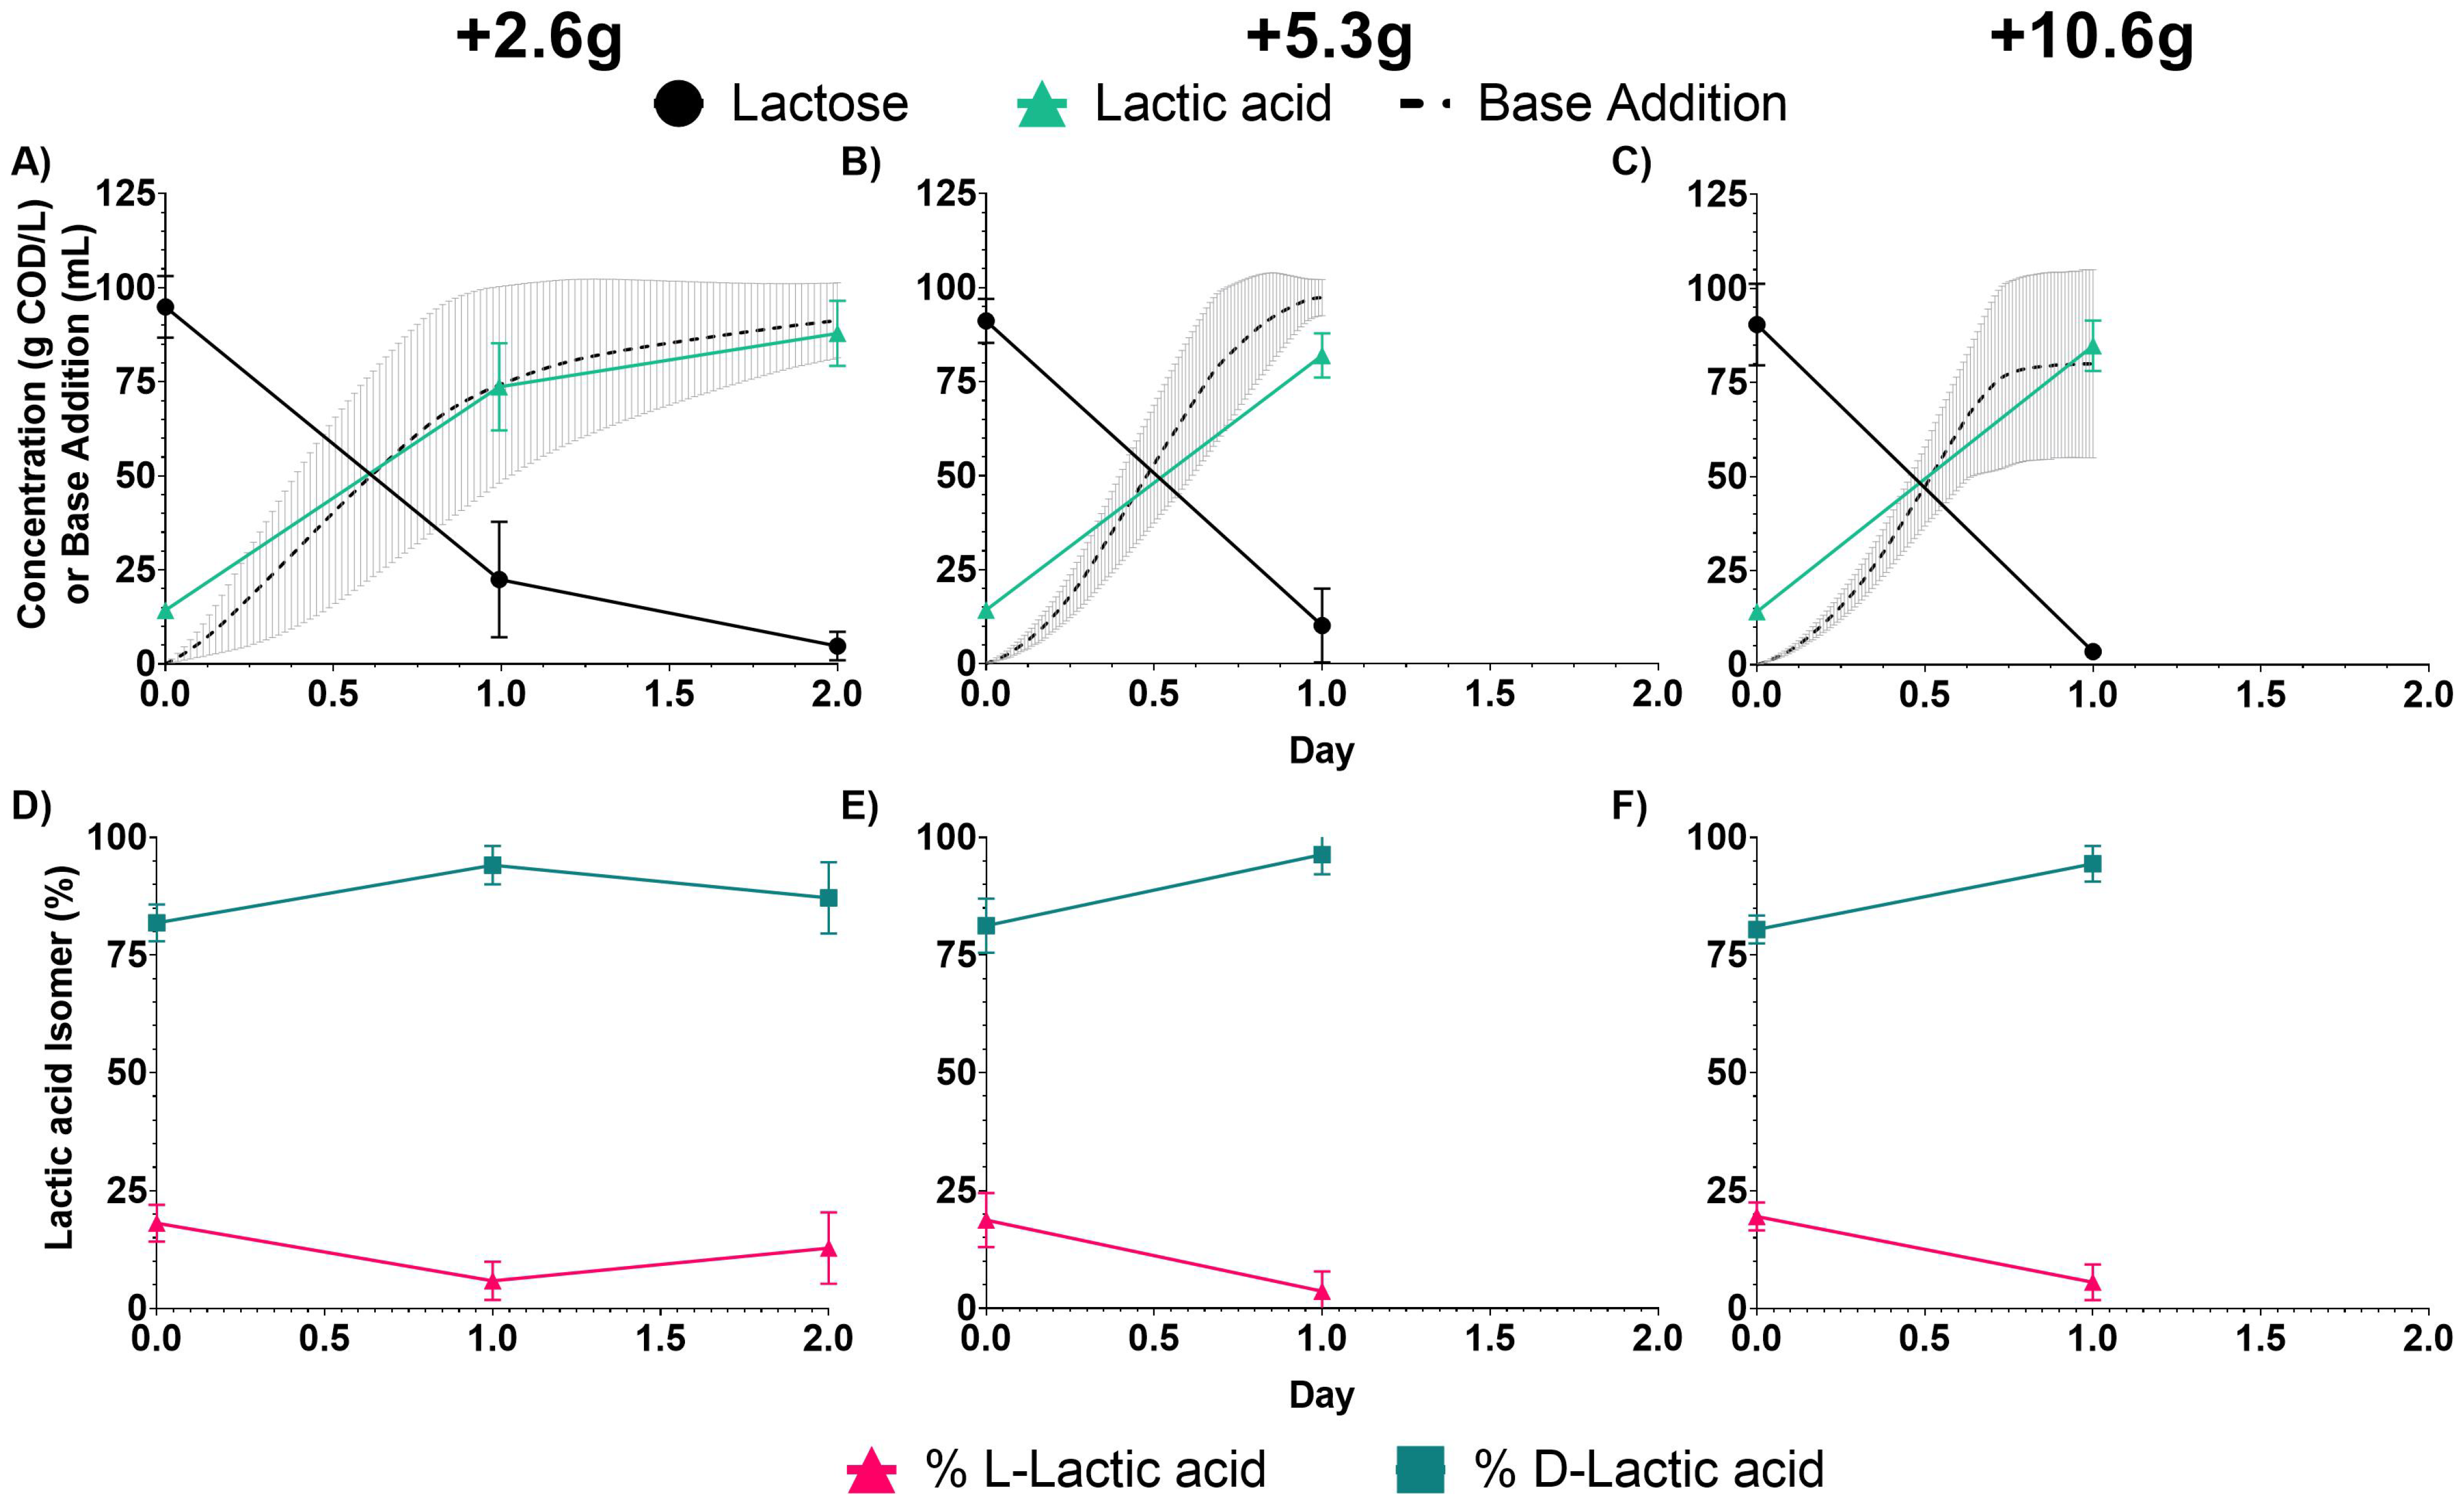
Fermentation experiments with LdhL1 (initial OD600 = 8) where 60% of spent medium was replaced with CCW supplemented with MRS powder without sugars. Extracellular levels of lactose and LA measured at 1-day intervals and cumulative amount of base added to maintain constant pH when (A) 2.6 g, (B) 5.3 g, (C) 10.6 g of MRS powder was added. Fractions of L-LA and D-LA during the fermentation with (D) 2.6 g, (E) 5.3 g, (F) 10.6 g of MRS powder added. Each data point represents average and standard deviation of three separate bioreactor experiments.
In these experiments, the addition of MRS powder decreased the time needed to ferment the lactose in CCW (Figure 5). When 2.6 g of MRS powder was added, there was a large variation in the amount of time it took for the fermentation to be completed, with some individual replicates taking one day to complete and another taking more than 2 days (Figure S11). With 5.3 g addition, two out of the three replicates showed completion in less than a day (Figure S12), and with 10.6 g addition, fermentation in all replicates took less than 1 day to be completed (Figure S13). In all cases, high D-LA selectivity was achieved (Figure 5), with the D-LA isomer representing 91.2% to 96.0% of the total LA. The estimated average D-LA production rates in these experiments ranged from 2.4 to 3.7 g D-LA/(L h), the titers ranged from 73.9 to 75.2 g D-LA/L, and the estimated yields averaged 1.0 g D-LA/g lactose. These results demonstrate the benefit of adding nutrients to CCW to achieve rapid sugar fermentation, which improved D-LA selectivity and titers compared to the experiments without nutrient supplementation (Table 3).
Table 3.
Comparison of D-LA production across individual experiments.
4. Discussion
In this work, we demonstrated preferential production of D-LA using CCW inoculated with an engineered strain of L. plantarum that contains an in-frame deletion of the L-lactate dehydrogenase gene (ldhL1). We followed an experimental design in which the outcome of one fermentation generated hypotheses to test in the following experiment, an approach that resulted in progressive improvement of lactose consumption and more rapid, selective accumulation of D-LA as the fermentation product (Table 3).
There are three key observations that can be derived from the results of these experiments. First, we showed that the CCW residue, although rich in the fermentable disaccharide lactose, lacks sufficient nutrients to sustain rapid fermentation by the LdhL1 strain. With CCW as the sole source of organic carbon and other nutrients, the rate of fermentation was slow, requiring 7 days to transform the high concentration of lactose (~130 g/L) into fermentable products. Moreover, during these week-long fermentation periods, the preferential production of D-LA was not maintained (Figure 2), and we hypothesize this is because of competition with other lactic acid bacteria present in CCW (Figure S5). Second, starting fermentations with high-density inoculum improved lactose utilization rates, but it was not sufficient to overcome the loss of preferential D-LA production (Figure 3 and Figure 4). Third, addition of MRS powder as a source of other nutrients reduced the fermentation time to ~1 day and resulted in achieving greater than 90% D-LA selectivity (Figure 5).
In the end, the highest D-LA production rates were achieved when both high-density LdhL1 inoculum and nutrient supplementation were used, even though the experiments with high-density inoculum had lower initial lactose concentrations than when using CCW as the sole source of organic carbon and other nutrients (Table 3). We conclude from the results of these experiments that the selective production of D-LA with LdhL1 and CCW requires conditions that provide an environment for the rapid growth of LdhL1 and a competitive advantage over any other bacteria that may be present in the dairy residue.
4.1. Comparison of D-LA Production in Different Studies Using Dairy Residues
To put the experimental results into context, D-LA productivity was compared to other studies that have used dairy residues as substrates for selective D-LA production (Table 4). In terms of D-LA titer from CCW, the LdhL1 strain, which produced 75.2 ± 9.4 g D-LA/L, had the second-highest D-LA titer reported to date. Liu et al. [30] reported a titer of 113 g D-LA/L using a dairy residue with ~1.7-times-higher lactose concentration (140 g lactose/L). Although the CCW we used had a higher lactose concentration (Table 2), the preparation of high-density cultures in our experiments reduced the effective initial lactose concentration to 80.6 ± 11.1 g/L. However, the fermentation rate was faster in our experiments, which required less than 1 day for completion compared to 2 days in the study of Liu et al. [30] (Table 4). Liu et al. [30] used cheese whey powder as the lactose source, giving them flexibility on the initial lactose concentration used in their reconstituted feed, which also included neutral protease and yeast extract as supplements. It is possible that we could further concentrate the CCW to increase the D-LA titer. However, the concentration of lactose in the CCW (approximately 150 g/L) is high and approaches the lower end of its equilibrium solubility in aqueous systems at 37 °C [31]. Therefore, further concentration of CCW or other lactose-rich dairy residues to a point where the lactose concentration exceeds its solubility may not be an effective strategy to increase the D-LA titer. All other published studies in Table 4 used less concentrated lactose dairy residues, naturally resulting in lower D-LA titers.
Table 4.
Comparison of D-LA production using dairy residues from different studies.
In terms of D-LA production rates, under the best bioreactor conditions the LdhL1 strain produced 3.7 ± 0.3 g D-LA/(L h) after approximately 21 h, which was the second-highest rate reported. Delmoitié et al. [11] reported a rate of ~7 g D-LA/(L h) on a continuously stirred tank reactor (CSTR) system and an enrichment of lactic acid bacteria. In Delmoitié et al. [11], they tested how pH, temperature, and hydraulic retention time (HRT) affected selectivity of LA using cheese whey permeate (CW). Delmoitié et al. [11] also tested the impact of nutrient supplementation (6, 9, and 10 g/L of yeast extract) on fermentation performance and determined that 9 g/L was the minimum amount of yeast extract needed to maintain LA selectivity in their bioreactor runs [11]. They found that a temperature of 45 °C and acidic pH (5–5.5) was optimal for high selectivity of D-LA over other end products, allowing them to establish continuous high D-LA yield and productivity. Temovska et al. [10] also used a CSTR to enrich for a microbial community that preferentially produced D-LA from a lactose-rich dairy residue. They used acid whey (AW) and produced D-LA at a rate of 1.57 g D-LA/(L h) using temperature and pH conditions (50 °C and pH of 5) that resembled those used by Delmoitié et al. [11] for selective D-LA production. While both studies demonstrated the possibility of enriching for D-LA producing microbial communities in CSTRs, the uncertainties associated with fluctuations in the microbial communities require further experimentation for commercial applications.
The best condition with LdhL1 produced a yield of 1.0 ± 0.1 g D-LA/g lactose, which is 95% of the LA theoretical yield for homolactic fermentation from lactose (i.e., 4 moles LA per mole lactose; 1.05 g LA/g lactose). Liu et al. [30] reported a yield of 0.94 g D-LA/g lactose (90% of theoretical yield) in experiments with Lactobacillus delbrueckii subsp. bulgaricus, while Sahoo et al. [12] in co-culture experiments (Lactobacillus delbrueckii subsp. lactis and engineered Lactococcus lactis) and Temovska et al. [10] using the native microbial community present in AW reported yields of 0.9 g D-LA/g lactose. The yield with LdhL1 was lower on average when using only CCW without nutrient supplementation or concentrated cell cultures (Table 3), indicating the importance of nutrient supplementation and high-density cultures to improve LdhL1 growth rate and outcompete any other lactic acid bacteria present in CCW.
In CSTR systems, Delmoitié et al. [11] showed there was a tradeoff between D-LA productivity and yield. As D-LA productivity increased with decreasing HRT, the yield decreased [11]. This could be due to the natural competition among microbial community members. In our experiments with LdhL1, increases in D-LA productivity were accompanied by expected yield increases (Table 3). The use of different bioreactor temperatures could potentially explain the differences in these studies. The CSTR enrichments of Delmoitié et al. [11] and Temovska et al. [10] used thermophilic conditions (50 °C) whereas we used mesophilic conditions (37 °C), a standard cultivation temperature for L. plantarum [32]. It is possible that with dairy residues, mesophilic conditions favor heterolactic fermentation, and thus, given the presence of other microorganisms in CCW, a strategy of using CSTR operation may not work with LdhL1 as it would create long-term conditions that may favor the growth of microorganisms that perform heterolactic fermentation.
4.2. Comparison to D-LA Production from Glucose
In addition to comparing results of D-LA production from different dairy residues (Table 4), we also compared our data to reported studies that used glucose as a carbon source for selective production of D-LA (Table 5). The rates and yields with glucose and different engineered microbial strains are close to those obtained with Ldh1 and lactose-rich CCW (Table 5). This observation supports the use of lactose-rich dairy residues instead of glucose for D-LA production. The most salient difference between our results and those of other studies is in D-LA titers, which correlate with the sugar concentration used in the experiments. Since the aqueous solubility of glucose is about 4.5-times higher than that of lactose [31,33], feeding streams with higher initial glucose concentration can be prepared, resulting in higher D-LA titers, as Table 5 shows. Nevertheless, the maximum glucose concentration may be limited by other factors such as osmotic pressure or substrate inhibition [34].
Table 5.
Comparison of D-LA production in this study compared to glucose as substrate.
4.3. Cost Considerations
For another way to compare the fermentation of CCW to D-LA with production of D-LA from glucose, we used a simplified cost analysis with BioSTEAM [24]. Three scenarios, reflecting the three different nutrient supplementation conditions experimentally analyzed with LdhL1 (Figure 5), were simulated and compared to a baseline case using glucose fermented to D-LA. The simulated process in this screening analysis (Figure S14) starts with a feed mixer that receives CCW or a glucose-based solution (both represented as the carbohydrate feed plus dilution water to set the feed concentration), the nutrient supplement, ammonia requirements, and stoichiometric amounts of NaOH for pH control. A batch bioreactor module receives the feed and produces D-LA at the experimentally observed rates (Table 3) and simulates D-LA and L-LA production as separate chemicals. A lump splitter simulates the recovery of 95% of the total LA from the broth, and a separation unit splits the D-LA product from L-LA. The unrecovered acid is sent to waste treatment. The model simulated a biorefinery processing 1000 m3/day of feed (Table 6) using NaOH for pH control and maintaining pH 6 in all conditions. Ammonia requirements were calculated by the model based on fermentation stoichiometry [24]. For the glucose case, input parameters used for feed concentration, fermentation rate, and D-LA titer were as reported by Okano et al. [26] and summarized in Table 6.
Table 6.
Technoeconomic analysis summary of D-LA production from glucose and CCW.
In our experiments, MRS was used as the supplemental nutrient source. MRS is a specialized laboratory medium not used in large-scale quantities for industrial fermentation applications due to its high cost. Krull et al. analyzed the effect of different MRS components on L-LA production rates and determined that 5 g/L yeast extract and 5 g/L meat extract provided the nutritional needs for efficient growth of Lactobacillus casei [40]. In addition, Sikder et al. [41] modeled lactic acid production from sugarcane juice using a L. plantarum strain that required 5 g/L peptone and 10 g/L yeast extract and assumed a cost of $22/kg for the nutrient supplement. For our screening comparison, we assumed a nutrient supplement requirement of 5 g/L in the glucose case and at 5.2 g/L, 10.6 g/L, and 21.2 g/L to represent the three conditions experimentally tested with mixtures of CCW and MRS. The bulk cost of the nutrient supplement was assumed to be $70/kg, to represent a high cost of this supplement. The fermentable carbohydrate for the glucose case was assumed to have a unit price of $0.45/kg, whereas for the CCW cases it was assumed that lactose was available free of charge (i.e., the biorefinery would be located next to a dairy industry producing CCW residues). The simulations used a default 10% internal rate of return [24].
The screening analysis resulted in an estimated minimum selling price (MSP) of D-LA of $5.25/kg when glucose was used as the fermentable substrate (Table 6). When CCW was used, the MSP ranged from $6.54/kg at the +2.6 g nutrient supplement case to $24.60/kg at the +10.6 g case (Table 6). Although volumetric productivity was 2.7-times higher in the +10.6 g case and resulted in 45% less total fermented volume requirement compared to the +2.6 g case (1360 m3 versus 3000 m3; Table 6), its MSP was 3.8-times higher, indicating that the process is highly sensitive to the cost of the nutrient supplement. An uncertainty analysis (Figure S15) shows that the MSP in the glucose case was most sensitive to the nutrient supplement cost, followed by product recovery percent and lactic acid yield. In the case of CCW, variation in the fraction of LA that is the D-LA isomer showed the largest influence on MSP at the +2.6 g and +5.3 g cases, whereas the unit price of nutrients dominated the uncertainty in MSP at the +10.6 g.
5. Conclusions
The work presented here demonstrated conversion of CCW into enriched solutions of D-LA that were on the high end of titer, rate, and yield compared to other studies converting dairy residues into D-LA. In this study, we used CCW directly produced from the manufacturing of cheese, after recovering all food-grade coproducts. Accordingly, this stream not only has a nutrient deficiency, but may also contain microorganisms from milk processing at the dairy plant that may interfere with the selective production of D-LA by the engineered L. plantarum strain used as an inoculum. The results of this work are consistent with the hypothesis that achieving high D-LA production rates with LdhL1 requires conditions that minimize the growth of other bacteria in CCW. In this study, this was achieved by increasing the density of the L. plantarum culture used and by providing nutrient supplementation to support rapid growth of LdhL1 to maintain selectivity towards D-LA production. It may also be possible that sustainable D-LA production from CCW at a larger scale would require a pasteurization or sterilization step prior to fermentation to minimize growth of other bacteria.
The observed D-LA production rates and yields were comparable to those reported when using food-grade glucose as the fermentable sugar, and a screening cost analysis suggested that the cost of producing D-LA from lactose could be competitive to production from glucose if the cost of the nutrient supplement could be reduced. Our work, and that reported by others, shows that supplementation with nutrient-rich extracts is needed to accelerate fermentation rates from dairy residues [11,30]. Given the industry practice of recovering as much value as possible through food-grade coproducts from cheese whey, CCW and similar dairy residues are inherently deficient in one or more nutrients [12,14,22,28]. Thus, there is a need to investigate the use of cheaper nutrient supplements to improve the economics of the process. Possible sources of less expensive nutrients include the potential use of nutrient-rich coproducts produced from other dairy operations that may be readily available [28]. Alternatively, a reduction in the amount of processing that CW undergoes before the CCW residue is produced could leave required nutrients in the produced residue. Evaluating this alternative would need consideration of the revenue generated from the food-grade coproducts that are extracted from the CW before CCW is ultimately produced. An additional possibility that could be explored for inexpensive sources of nutrients could be the residues that may be produced by other industries in nearby locations to the CCW-producing industry [40].
However, the screening cost analysis also suggested that improving production rates by increasing the addition of nutrients was not favorable to the overall cost, even though fermentation rates increased.
In conclusion, although nutrient supplementation is a large contributor to the fermentation cost, our results show that it is feasible to use untreated lactose-rich residues such as CCW for D-LA production, an alternative that will benefit the dairy industry by creating a high-volume product from an abundant non-food residue after milk is used for food production. The cost analysis showed an MSP for lactose-based D-LA production that was similar to that for glucose-based production if nutrient supplement remains low. Finding alternative inexpensive nutrient sources and increasing D-LA selectivity during CCW fermentation remain high research priorities.
Supplementary Materials
The following supporting information can be downloaded at https://www.mdpi.com/article/10.3390/fermentation12110509/s1, Figure S1: PCR amplification of the L. plantarum ldhL1 gene region. Figure S2: Concentration of individual isomers of D-LA and L-LA, from experiments reported in Figure 1. Figure S3: Individual bioreactor experiments with CCW inoculated with LdhL1. Figure S4: Individual bioreactor experiments with CCW inoculated with WT. Figure S5: Individual bioreactor experiments with uninoculated CCW. Figure S6: Individual bioreactor experiments of CCW fermentation starting with higher concentration of LdhL1 cells (initial OD600 = 8.5). Figure S7: Validation of cumulative base addition as a proxy for fermentation rate and lactic acid accumulation. Figure S8: Individual fermentation experiments with LdhL1 where 70% of spent medium is replaced with CCW. Figure S9: Individual fermentation experiments with LdhL1 where 60% of spent medium is replaced with CCW. Figure S10: Individual fermentation experiments with LdhL1 where 42% of spent medium is replaced with CCW. Figure S11: Individual fermentation experiments with LdhL1 where 60% of spent medium is replaced with CCW + 2.6 g MRS. Figure S12: Individual fermentation experiments with LdhL1 where 60% of spent medium is replaced with CCW + 5.3 g MRS. Figure S13: Individual fermentation experiments with LdhL1 where 60% of spent medium is replaced with CCW + 10.6 g MRS. Figure S14: Simulated process flow for screening cost analysis of D-LA fermentation. Figure S15: Tornado plots showing the sensitivity of MSP to biological, economic, or design assumptions. Table S1: Mutational analysis summary for SNPs and INDELs identified in LdhL1 compared to WT. Table S2: Microbial community composition at the end of uninoculated CCW experiments. Table S3: Comparison of D-LA production across individual experiments of each biological replicate. Reference [42] are cited in the Supplementary Materials.
Author Contributions
Conceptualization, G.E., T.J.D. and D.R.N.; methodology, G.E., J.-H.O., T.J.D. and D.R.N.; software, G.E.; validation, G.E., T.J.D. and D.R.N.; formal analysis, G.E., A.G.K., A.U. and J.-H.O.; investigation, G.E., A.G.K. and A.U.; resources, T.J.D., and D.R.N.; data curation, G.E., A.G.K. and A.U.; writing—original draft preparation, G.E.; writing—review and editing, J.-H.O., T.J.D. and D.R.N.; visualization, G.E.; supervision, T.J.D., and D.R.N.; project administration, T.J.D. and D.R.N.; funding acquisition, T.J.D. and D.R.N. All authors have read and agreed to the published version of the manuscript.
Funding
This work was supported by the Dairy Business Innovation Alliance (grant number project AAN1759), the National Dairy Council (grant number AWD00000053, project AAM1591), the Wisconsin Dairy Innovation Hub, the Promoting Industry Collaboration Initiative of the UW-Madison Office of the Vice Chancellor for Research, and the Great Lakes Bioenergy Research Center, U.S. Department of Energy, Office of Science, Biological and Environmental Research Program, under Award Number DE-SC0018409.
Institutional Review Board Statement
Not applicable.
Informed Consent Statement
Not applicable.
Data Availability Statement
The original contributions presented in this study are included in the article/Supplementary Material. Further inquiries can be directed to the corresponding author.
Acknowledgments
We thank our collaborators at Soil Net LLC and Burnett Dairy (Wilson, WI) for providing CCW; Mike Molitor and John Lucey at the Center for Dairy Research (https://www.cdr.wisc.edu/) for dairy industry background; Jan-Peter van Pijkeren for help with lactic acid bacteria; Kevin Myers and Michael Noguera for computational analysis; the University of Wisconsin Biotechnology Center DNA Sequencing Facility (Research Resource Identifier—RRID:SCR_017759) for 16S rRNA library and sequencing; Michael Botts, Zach Wegner, Gaby Muñoz Sánchez, and Avery Vilbert for analytical support; and Kevin Walters, Bumkyu Kim, and Faith Koester for help with bioreactor operations.
Conflicts of Interest
The authors declare no conflicts of interest.
References
- Menchik, P.; Zuber, T.; Zuber, A.; Moraru, C.I. Composition of coproduct streams from dairy processing: Acid whey and milk permeate. J. Dairy Sci. 2019, 102, 3978–3984. [Google Scholar] [CrossRef] [Scilit]
- Das, B.; Sarkar, S.; Sarkar, A.; Bhattacharjee, S.; Bhattacharjee, C. Recovery of whey proteins and lactose from dairy waste: A step towards green waste management. Process Saf. Environ. Prot. 2016, 101, 27–33. [Google Scholar] [CrossRef] [Scilit]
- Koller, M.; Salerno, A.; Muhr, A.; Reiterer, A.; Chiellini, E.; Casella, S.; Horvat, P.; Braunegg, P.H.A.G. Whey Lactose as a Raw Material for Microbial Production of Biodegradable Polyesters; IntechOpen: London, UK, 2013. [Google Scholar] [CrossRef] [Scilit]
- Mukherjee, P.; Raj, N.; Sivaprakasam, S. Harnessing valorization potential of whey permeate for D-lactic acid production using lactic acid bacteria. Biomass Convers. Biorefinery 2023, 13, 15639–15658. [Google Scholar] [CrossRef] [Scilit]
- Panesar, P.S.; Kennedy, J.F. Biotechnological approaches for the value addition of whey. Crit. Rev. Biotechnol. 2011, 32, 327–348. [Google Scholar] [CrossRef] [Scilit]
- Kim, J.; Kim, Y.-M.; Lebaka, V.R.; Wee, Y.-J. Lactic Acid for Green Chemical Industry: Recent Advances in and Future Prospects for Production Technology, Recovery, and Applications. Fermentation 2022, 8, 609. [Google Scholar] [CrossRef] [Scilit]
- Taib, N.-A.A.B.; Rahman, R.; Huda, D.; Kuok, K.K.; Hamdan, S.; Bin Bakri, M.K.; Bin Julaihi, M.R.M.; Khan, A. A review on poly lactic acid (PLA) as a biodegradable polymer. Polym. Bull. 2022, 80, 1179–1213. [Google Scholar] [CrossRef] [Scilit]
- Alexandri, M.; Schneider, R.; Mehlmann, K.; Venus, J. Recent Advances in D-Lactic Acid Production from Renewable Resources. Food Technol. Biotechnol. 2019, 57, 293–304. [Google Scholar] [CrossRef] [Scilit]
- Zandona, E.; Blažić, M.; Jambrak, A.R. Whey Utilisation: Sustainable Uses and Environmental Approach. Food Technol. Biotechnol. 2021, 59, 147–161. [Google Scholar] [CrossRef]
- Temovska, M.; Hegner, R.; Ortiz-Ardila, A.E.; Usack, J.G.; Angenent, L.T. Lactate production from lactose-rich wastewater: A comparative study on reactor configurations to maximize conversion rates and efficiencies. Water Res. 2025, 278, 123365. [Google Scholar] [CrossRef] [Scilit]
- Delmoitié, B.; Sakarika, M.; Rabaey, K.; De Wever, H.; Regueira, A. Tailoring non-axenic lactic acid fermentation from cheese whey permeate targeting a flexible lactic acid platform. J. Environ. Manag. 2024, 373, 123529. [Google Scholar] [CrossRef] [Scilit]
- Sahoo, T.K.; Jayaraman, G. Co-culture of Lactobacillus delbrueckii and engineered Lactococcus lactis enhances stoichiometric yield of d-lactic acid from whey permeate. Appl. Microbiol. Biotechnol. 2019, 103, 5653–5662. [Google Scholar] [CrossRef] [Scilit]
- Mukherjee, P.; Pal, S.; Sivaprakasam, S. Optimization of D-lactic acid biosynthesis from diverse carbon sources in mutant Lactobacillus delbrueckii subsp. bulgaricus via random mutagenesis. Syst. Microbiol. Biomanuf. 2024, 5, 702–721. [Google Scholar] [CrossRef] [Scilit]
- Prasad, S.; Srikanth, K.; Limaye, A.M.; Sivaprakasam, S. Homo-fermentative production of d-lactic acid by Lactobacillus sp. employing casein whey permeate as a raw feed-stock. Biotechnol. Lett. 2014, 36, 1303–1307. [Google Scholar] [CrossRef] [Scilit]
- Feng, X.; Jiang, L.; Han, X.; Liu, X.; Zhao, Z.; Liu, H.; Xian, M.; Zhao, G. Production of d-lactate from glucose using Klebsiella pneumoniae mutants. Microb. Cell Fact. 2017, 16, 1–11. [Google Scholar] [CrossRef] [Scilit]
- Zhang, S.; Oh, J.-H.; Alexander, L.M.; Özçam, M.; van Pijkeren, J.-P. d-Alanyl-d-Alanine Ligase as a Broad-Host-Range Counterselection Marker in Vancomycin-Resistant Lactic Acid Bacteria. J. Bacteriol. 2018, 200. [Google Scholar] [CrossRef] [Scilit]
- Green, M.R.; Sambrook, J. Transformation of Escherichia coli by Electroporation. Cold Spring Harb. Protoc. 2020, 2020, 101220. [Google Scholar] [CrossRef] [Scilit]
- Deshwal, G.K.; Akshit; Kadyan, S.; Sharma, H.; Singh, A.K.; Panjagari, N.R.; Meena, G.S. Applications of reverse osmosis in dairy processing: An Indian perspective. J. Food Sci. Technol. 2021, 58, 3676–3688. [Google Scholar] [CrossRef] [Scilit]
- Brião, V.B.; Salla, A.C.V.; Miorando, T.; Hemkemeier, M.; Favaretto, D.P.C. Water recovery from dairy rinse water by reverse osmosis: Giving value to water and milk solids. Resour. Conserv. Recycl. 2019, 140, 313–323. [Google Scholar] [CrossRef] [Scilit]
- Fortney, N.W.; Hanson, N.J.; Rosa, P.R.F.; Donohue, T.J.; Noguera, D.R. Diverse Profile of Fermentation Byproducts From Thin Stillage. Front. Bioeng. Biotechnol. 2021, 9, 695306. [Google Scholar] [CrossRef] [Scilit]
- Henry, H.; Conus, N.M.; Steenhout, P.; Béguin, A.; Boulat, O. Sensitive determination of d-lactic acid and l-lactic acid in urine by high-performance liquid chromatography–tandem mass spectrometry. Biomed. Chromatogr. 2011, 26, 425–428. [Google Scholar] [CrossRef] [Scilit]
- Walters, K.A.; Mohan, G.; Myers, K.S.; Ingle, A.T.; Donohue, T.J.; Noguera, D.R. A metagenome-level analysis of a microbial community fermenting ultra-filtered milk permeate. Front. Bioeng. Biotechnol. 2023, 11, 1173656. [Google Scholar] [CrossRef] [Scilit]
- Rittmann, B.E.; McCarty, P.L. Environmental Biotechnology: Principles and Applications; McGraw-Hill: New York, NY, USA, 2001. [Google Scholar]
- Shi, R.; Guest, J.S. BioSTEAM-LCA: An Integrated Modeling Framework for Agile Life Cycle Assessment of Biorefineries under Uncertainty. ACS Sustain. Chem. Eng. 2020, 8, 18903–18914. [Google Scholar] [CrossRef] [Scilit]
- Kleerebezem, M.; Boekhorst, J.; Van Kranenburg, R.; Molenaar, D.; Kuipers, O.P.; Leer, R.; Tarchini, R.; Peters, S.A.; Sandbrink, H.M.; Fiers, M.W.E.J.; et al. Complete genome sequence of Lactobacillus plantarum WCFS1. Proc. Natl. Acad. Sci. USA 2003, 100, 1990–1995. [Google Scholar] [CrossRef] [Scilit]
- Okano, K.; Zhang, Q.; Shinkawa, S.; Yoshida, S.; Tanaka, T.; Fukuda, H.; Kondo, A. Efficient Production of Optically Pure d -Lactic Acid from Raw Corn Starch by Using a Genetically Modified l-Lactate Dehydrogenase Gene-Deficient and α-Amylase-Secreting Lactobacillus plantarum Strain. Appl. Environ. Microbiol. 2009, 75, 462–467. [Google Scholar] [CrossRef] [Scilit]
- Zhang, Y.; Vadlani, P.V.; Kumar, A.; Hardwidge, P.R.; Govind, R.; Tanaka, T.; Kondo, A. Enhanced D-lactic acid production from renewable resources using engineered Lactobacillus plantarum. Appl. Microbiol. Biotechnol. 2015, 100, 279–288. [Google Scholar] [CrossRef] [Scilit]
- Walters, K.A.; Myers, K.S.; Ingle, A.T.; Donohue, T.J.; Noguera, D.R. Effect of Temperature and pH on Microbial Communities Fermenting a Dairy Coproduct Mixture. Fermentation 2024, 10, 422. [Google Scholar] [CrossRef] [Scilit]
- Mariotti, F.; Tomé, D.; Mirand, P.P. Converting Nitrogen into Protein—Beyond 6.25 and Jones’ Factors. Crit. Rev. Food Sci. Nutr. 2008, 48, 177–184. [Google Scholar] [CrossRef] [Scilit]
- Liu, P.; Zheng, Z.; Xu, Q.; Qian, Z.; Liu, J.; Ouyang, J. Valorization of dairy waste for enhanced D-lactic acid production at low cost. Process Biochem. 2018, 71, 18–22. [Google Scholar] [CrossRef] [Scilit]
- Schuck, P. Lactose and Oligosaccharides|Lactose: Crystallization. In Encyclopedia of Dairy Sciences; Elsevier: Amsterdam, The Netherlands, 2011; pp. 182–195. [Google Scholar] [CrossRef] [Scilit]
- Brooijmans, R.J.W.; de Vos, W.M.; Hugenholtz, J. Lactobacillus plantarum WCFS1 Electron Transport Chains. Appl. Environ. Microbiol. 2009, 75, 3580–3585. [Google Scholar] [CrossRef] [Scilit]
- Alves, L.A.; Almeida e Silva, J.B.; Giulietti, M. Solubility of d-Glucose in Water and Ethanol/Water Mixtures. J. Chem. Eng. Data 2007, 52, 2166–2170. [Google Scholar] [CrossRef] [Scilit]
- Fu, X.; Wang, Y.; Wang, J.; Garza, E.; Manow, R.; Zhou, S. Semi-industrial scale (30 m3) fed-batch fermentation for the production of d-lactate by Escherichia coli strain HBUT-D15. J. Ind. Microbiol. Biotechnol. 2017, 44, 221–228. [Google Scholar] [CrossRef] [Scilit]
- Zhou, L.; Niu, D.-D.; Tian, K.-M.; Chen, X.-Z.; Prior, B.A.; Shen, W.; Shi, G.-Y.; Singh, S.; Wang, Z.-X. Genetically switched d-lactate production in Escherichia coli. Metab. Eng. 2012, 14, 560–568. [Google Scholar] [CrossRef] [Scilit]
- Zheng, L.; Xu, T.; Bai, Z.; He, B. Mn2+/Mg2+-dependent pyruvate kinase from a d-lactic acid-producing bacterium Sporolactobacillus inulinus: Characterization of a novel Mn2+-mediated allosterically regulated enzyme. Appl. Microbiol. Biotechnol. 2013, 98, 1583–1593. [Google Scholar] [CrossRef] [Scilit]
- Okino, S.; Suda, M.; Fujikura, K.; Inui, M.; Yukawa, H. Production of d-lactic acid by Corynebacterium glutamicum under oxygen deprivation. Appl. Microbiol. Biotechnol. 2008, 78, 449–454. [Google Scholar] [CrossRef] [Scilit]
- Ishida, N.; Suzuki, T.; Tokuhiro, K.; Nagamori, E.; Onishi, T.; Saitoh, S.; Kitamoto, K.; Takahashi, H. d-Lactic acid production by metabolically engineered Saccharomyces cerevisiae. J. Biosci. Bioeng. 2006, 101, 172–177. [Google Scholar] [CrossRef] [Scilit]
- Yoshida, S.; Okano, K.; Tanaka, T.; Ogino, C.; Kondo, A. Homo-d-lactic acid production from mixed sugars using xylose-assimilating operon-integrated Lactobacillus plantarum. Appl. Microbiol. Biotechnol. 2011, 92, 67–76. [Google Scholar] [CrossRef] [Scilit]
- Krull, S.; Brock, S.; Prüße, U.; Kuenz, A. Hydrolyzed Agricultural Residues—Low-Cost Nutrient Sources for l-Lactic Acid Production. Fermentation 2020, 6, 97. [Google Scholar] [CrossRef] [Scilit]
- Sikder, J.; Roy, M.; Dey, P.; Pal, P. Techno-economic analysis of a membrane-integrated bioreactor system for production of lactic acid from sugarcane juice. Biochem. Eng. J. 2012, 63, 81–87. [Google Scholar] [CrossRef] [Scilit]
- Deatherage, D.E.; Barrick, J.E. Identification of mutations in laboratory-evolved microbes from next-generation sequencing data using breseq. Methods Mol. Biol. 2014, 1151, 165–188. [Google Scholar] [CrossRef] [Scilit]

Disclaimer/Publisher’s Note: The statements, opinions and data contained in all publications are solely those of the individual author(s) and contributor(s) and not of MDPI and/or the editor(s). MDPI and/or the editor(s) disclaim responsibility for any injury to people or property resulting from any ideas, methods, instructions or products referred to in the content. |
© 2026 by the authors. Licensee MDPI, Basel, Switzerland. This article is an open access article distributed under the terms and conditions of the Creative Commons Attribution (CC BY) license.