


Abstract
This study aimed to determine the effects of dietary supplementation with a compound additive containing guanidinoacetic acid (GAA) and cysteamine on rumen metabolism, fermentation, and the microbiota of fattening Holstein bulls. Sixty Holstein dairy bulls (294.33 ± 3.42 kg) were divided into three groups (n = 20). Each treatment comprised three independently fed pens (n = 3 pens per treatment), and one bull was sampled from each pen for the rumen measurements. Group A served as the control group, whereas Groups B and C received a concentrated supplement containing 1 kg/t and 2 kg/t of a compound additive (GAA combined with cysteamine), respectively, over 90 days. Kyoto Encyclopedia of Genes and Genomes identified five key pathways. Specifically, indole-3-acetaldehyde, 2-amino-3-methoxybenzoic acid, 2-succinyl-5-enolpyruvyl-6-hydroxy-3-cyclohexene-1-carboxylate, and cholesterol glucuronide were upregulated, whereas 4-fumarylacetoacetic acid and pseudouridine 5′-phosphate were downregulated. Compared with those in the control group, acetic acid, butyric acid, total volatile fatty acids (VFAs), propionic acid, and microbial crude protein (MCP) increased, whereas pH, acetic acid/propionic acid (A/P) ratio, and NH3-N did not differ. At the genus level, Weissella abundance increased, Methanobrevibacter abundance decreased, and Xylanibacter and Ruminococcus abundances increased in the low-supplementation group (1 kg/t). Methanobrevibacter correlated negatively with VFAs, MCP, and NH3-N but correlated positively with A/P. Weissella and Ruminococcus showed the opposite trend. Increasing the inclusion level of the compound additive improved rumen metabolism, fermentation, and the microbial environment. This ultimately reduced stress and enhanced rumen health in fattening Holstein bulls.
1. Introduction
The Chinese dairy industry is relatively large, and many dairy bulls are culled annually on dairy farms for fattening. However, the feed-to-meat ratio and meat yield of dairy bull breeds are relatively low [1]. Therefore, improving the economic benefits of dairy bull breeds relative to traditional beef cattle breeds is necessary. This is achievable by optimizing diet composition and using additional effective additives during fattening [2].
Guanidinoacetic acid (GAA) is synthesized by cleaving the amidino group from the guanidino group of L-arginine and transferring it to glycine via L-arginine-glycine amidinotransferase. As a natural metabolite of glycine, GAA serves as the sole endogenous precursor for creatine synthesis [3]. However, because endogenous GAA synthesis is limited and its direct absorption is low, exogenous GAA has become the preferred source for replenishing creatine in ruminants [4], and dietary GAA supplementation has been shown to improve feed efficiency, blood indices and meat quality in beef cattle breeds such as Jinjiang bulls [5]. GAA is converted into creatine mainly in the liver and kidney and is stored as phosphocreatine in high-energy-demanding tissues such as skeletal muscle and brain, where it acts as a rapidly mobilizable energy reserve. Moreover, creatine synthesis from GAA increases the demand for arginine, glycine and methyl donors [6], coupling exogenous GAA supply to systemic nitrogen and one-carbon metabolism in cattle.
Cysteamine is a sulfur-containing small molecule that functions as an active substance in the animal body. It interacts with the disulfide bond of somatostatin [7], alleviating the inhibition of growth hormone synthesis and activating the insulin-like growth factor 1 pathway via the hypothalamic–pituitary–liver axis, thereby promoting cell proliferation and protein synthesis [8,9]. These effects are ultimately reflected in the feed-to-meat ratio and economic benefits of meat production. Nevertheless, in practical application, the irritative thiol group of cysteamine may cause intestinal mucosal damage and oxidative stress in animals when administered at high doses, which has driven the development of coated or rumen-protected cysteamine products for ruminants.
Considering that GAA mainly supplies energy and creatine precursors to support muscle metabolism, whereas cysteamine regulates the somatotropic axis and the antioxidant system, the two additives exhibit complementary mechanisms of action. Dietary addition of GAA may enhance blood antioxidant enzyme activity, thereby alleviating the oxidative stress damage induced by cysteamine and stabilizing intestinal health, which provides a rationale for their co-supplementation. In line with this concept, combined regimes of GAA with other functional additives, such as betaine, have improved growth performance, nutrient digestion and ruminal fermentation in Angus bulls [10], as well as rumen microbial protein synthesis in lambs [11]. Recently, transcriptomic analysis in Holstein steers further revealed tissue-specific regulatory effects of GAA on hepatic energy metabolism and muscle creatine biosynthesis [12]. Nevertheless, the intrinsic metabolic and microbial regulatory mechanisms underlying the simultaneous use of GAA and cysteamine within the rumen remain largely unexplored, as most previous studies have focused on their systemic or post-absorptive effects rather than ruminal responses.
The ruminal microbiome is a pivotal mediator of nutrient digestion and nitrogen metabolism in cattle, and its composition and activity can be effectively shaped by dietary additives [13]. We therefore hypothesized that increasing the inclusion level of a GAA–cysteamine compound additive in fattening dairy bulls would improve ruminal energy and nitrogen metabolism, as reflected by altered volatile fatty acid profiles, reduced NH3-N, and enhanced microbial protein synthesis, and reshape the ruminal bacterial community, thereby providing the ruminal substrate and metabolic basis that support the improved health of the animals. To test this hypothesis, the present study investigated the effects of a guanidinoacetic acid–cysteamine compound additive on rumen metabolism, fermentation parameters, and rumen microbial communities in fattening dairy bulls, with the aim of providing a rumen-level mechanistic explanation for their combined application.
2. Materials and Methods
2.1. Test Materials
GAA and cysteamine composite formulations were procured from a market. The primary components included GAA (400 g/kg), cysteamine (200 g/kg), attapulgite powder, plant extracts, probiotics, minerals, and vitamins. The attapulgite clay served as the carrier. The GAA purity was ≥90%, and the cysteamine purity was ≤10%.
2.2. Experimental Design
The experimental site was a beef cattle farm in Shijiazhuang City, Hebei Province, China. A total of 60 healthy dairy bulls of similar age, with an average body weight of 294.33 ± 3.42 kg, were used. The 60 bulls were allocated to three dietary treatments, and each treatment was housed in one large pen that was subdivided into three small pens (7, 6 and 7 bulls, respectively; 20 bulls per treatment in total). The small pens were completely separated from one another and each was equipped with independent feeding and watering facilities, so that feeding and management were independent among pens. The small pen was therefore regarded as the experimental unit (n = 3 pens per treatment) and provided a total mixed ration diet in accordance with beef cattle feeding standards (NY/T815-2004) [14]. The composition of the formulated diet based on the measured values is presented in Table 1. Group A served as the control group. In Group B, 1 kg/t of compound additive was incorporated into the concentrate feed. Group C received an increased amount of composite additive (2 kg/t). Accordingly, Group B received 400 g of GAA and 200 g of cysteamine per tonne of concentrate feed, and Group C received 800 g of GAA and 400 g of cysteamine per tonne of concentrate feed, constituting the two experimental groups. The cattle had free access to water and were fed twice daily at 8 am and 5 pm. Daily feed intake was recorded, and the bulls were weighed once a month. The pre-feeding period lasted for seven days, followed by a formal trial period of 90 days. Weight information is provided in Table 2 and Table 3.
Table 1.
Dry matter composition of dietary nutrients.
Table 2.
Differences in weight and dry matter intake.
Table 3.
Differences in weight in slaughtered bulls.
2.3. Rumen Fluid Collection and pH Measurement
At the end of the 90-day feeding trial, after a 24 h fasting period with free access to water, one bull was selected from each of the three small pens of every treatment (three bulls per treatment, n = 3) and slaughtered at a local commercial abattoir following standard humane procedures (electrical stunning followed by exsanguination). In each pen, the bull whose body weight was closest to the mean of that pen was selected. Because one bull was sampled from each small pen, the three rumen samples obtained per treatment were independent of one another. Immediately after evisceration, the rumen was exteriorized and opened along the dorsal sac, and the ruminal digesta was thoroughly mixed manually. Representative samples were collected from the cranial, ventral and caudal sacs of the rumen and pooled to obtain a homogeneous composite sample. The pooled digesta was then squeezed through four layers of sterile gauze to obtain ruminal fluid. The pH of the strained ruminal fluid was measured immediately (within 5 min of collection) in triplicate using a testo 206 portable pH meter (resolution, 0.01; Testo SE & Co. KGaA, Lenzkirch, Germany), which was calibrated with standard buffers (pH 4.01 and 7.00) before sampling.
2.4. Characterization of Rumen Metabolome
Rumen metabolites were profiled using LC-MS at Majorbio Bio-Pharm Technology Co. Ltd. (Shanghai, China) on a Thermo UHPLC-Exploris 480 platform (Thermo Fisher Scientific, Waltham, MA, USA) fitted with an ACQUITY HSS T3 column (100 mm × 2.1 mm i.d., 1.8 µm; Waters, Milford, MA, USA). The acquired raw data were processed with Progenesis QI (Waters Corporation, Milford, CT, USA), and metabolites were annotated by searching the HMDB (http://www.hmdb.ca/, accessed on 26 June 2025), Metlin (https://metlin.scripps.edu/, accessed on 26 June 2025) and an in-house Majorbio database. Identifications were accepted at two confidence tiers on the basis of MS/MS spectral matching: B(i), in which the acquired spectra were matched against an in-house experimental MS/MS library and therefore carried higher confidence, and B(ii), in which they were matched against computer-simulated theoretical spectra in public databases. Both tiers correspond to MSI Level 2 putative annotation [15]. Only metabolites annotated at the B(i) or B(ii) tier were carried forward for biological interpretation and pathway analysis, and results based on B(ii) annotations were interpreted with additional caution because they rest on theoretical spectral prediction rather than on measured spectra. Analytical stability was monitored using quality control (QC) samples prepared by pooling aliquots of all samples, which were injected after every 5–15 samples throughout the run; features whose relative standard deviation (RSD) in the QC samples exceeded 30% were excluded from downstream analysis. Multivariate modeling was carried out in R using the ropls package (version 1.6.2), with principal component analysis (PCA) and orthogonal partial least-squares discriminant analysis (OPLS-DA), and model stability was evaluated using a 7-cycle permutation test. Metabolites differing between Group A and Groups B/C were initially screened using a variable importance in projection (VIP) score > 1.0 from the OPLS-DA model together with a univariate Student’s t-test p value < 0.05. Because a large number of features were tested simultaneously, the false discovery rate (FDR) was controlled by adjusting p values using the Benjamini–Hochberg (BH) procedure [16], and features meeting all three criteria (VIP > 1.0, p < 0.05 and BH-adjusted p < 0.1) were retained as high-confidence differential metabolites. This threshold follows the practice generally adopted in untargeted metabolomics, in which a large number of simultaneously tested features increases the risk of false positives [17]. Finally, the retained differential metabolites were mapped to biochemical pathways through enrichment and pathway analysis based on the KEGG database (http://www.genome.jp/kegg/; accessed on 26 June 2025) [18].
2.5. Measurement of Rumen Fermentation Parameters
MCP in the rumen fluid was determined using the Coomassie brilliant blue method [19], (NH3-N) [20] was measured via colorimetry, and volatile fatty acids (VFAs) were determined using a Shimadzu GC-14B gas chromatograph [21].
2.6. Characterization of Rumen Microbiota
Polymerase chain reaction amplification of the V3–V4 variable region of the 16S rRNA gene was performed using the upstream primers 338F (5′-ACTCCTACGGGAGGCAGCAG-3′) and downstream primers 806R (5′-GGACTACHVGGGTWTCTAAT-3′) [22]. High-throughput sequencing using Illumina NextSeq 2000 was performed by Shanghai Meiji Biomedical Technology Co., Ltd. (Shanghai, China). [23].
2.7. Data Analysis
Fermentation parameters were analyzed using one-way analysis of variance with SPSS 24.0. Before one-way ANOVA, the Shapiro–Wilk test and Levene’s test were applied to check the normality of the data distribution and the homogeneity of variances, respectively (p > 0.05 for all variables). With only three experimental units per treatment, these tests are reported as descriptive indicators only and have limited diagnostic value; the analyses should therefore be regarded as exploratory. The least significant difference method facilitated comparative analysis among the groups, and the results were expressed as means ± SEM. A significant difference was defined as p < 0.05, an extremely significant difference as p < 0.01, and a non-significant difference as p ≥ 0.05.
Microbial analysis was conducted using mothur software (v1.30.1) to calculate the alpha diversity index [24]. The similarity in the microbial community structure between the groups was assessed via principal coordinate analysis (PCoA) using the Bray–Curtis distance algorithm. Community bar charts were generated using R software (version 3.3.1). To identify microbial groups with significant differences in abundance at the phylum and genus levels among the various groups, linear discriminant analysis (LDA) effect size (LEfSe) analysis was performed with a threshold of LDA score > 2.2 and p < 0.05. Additionally [25], Spearman’s rank correlation analysis was performed to evaluate the relationships between the relative abundances of the dominant rumen microbial taxa (genus level) and the concentrations of significantly altered rumen fermentation parameters (including pH, NH3-N, MCP, and individual volatile fatty acids). Only microbial genera present in at least 50% of the samples were included in the correlation analysis. The correlation coefficients and p values were calculated using the Hmisc package in R, and the results were visualized as a heatmap. To account for multiple testing, the p values were adjusted using the Benjamini–Hochberg FDR method, and correlations with adjusted p < 0.01 were considered significant.
All data were analyzed with the small pen as the experimental unit (n = 3 pens per treatment). One bull was sampled from each small pen for the rumen measurements, so that each treatment was represented by three mutually independent rumen samples.
3. Results
3.1. Rumen Metabolic Indicators
3.1.1. PCA and OPLS-DA
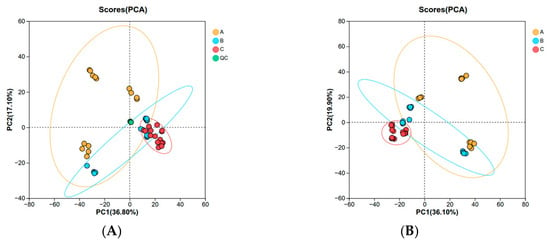
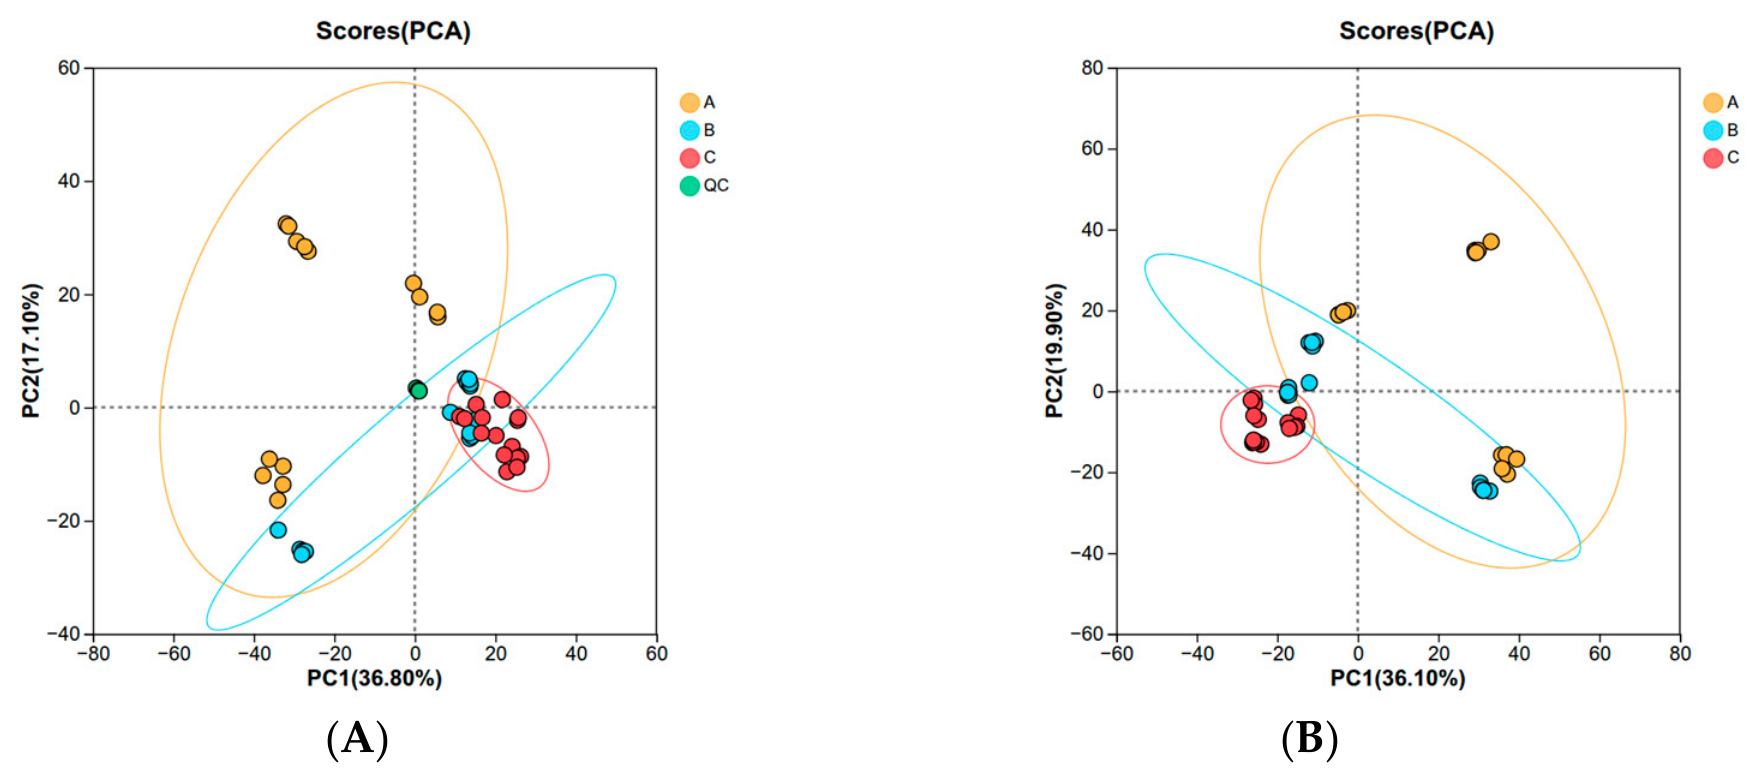
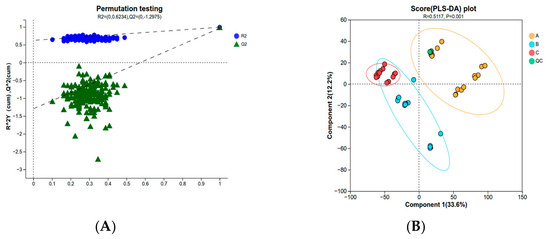
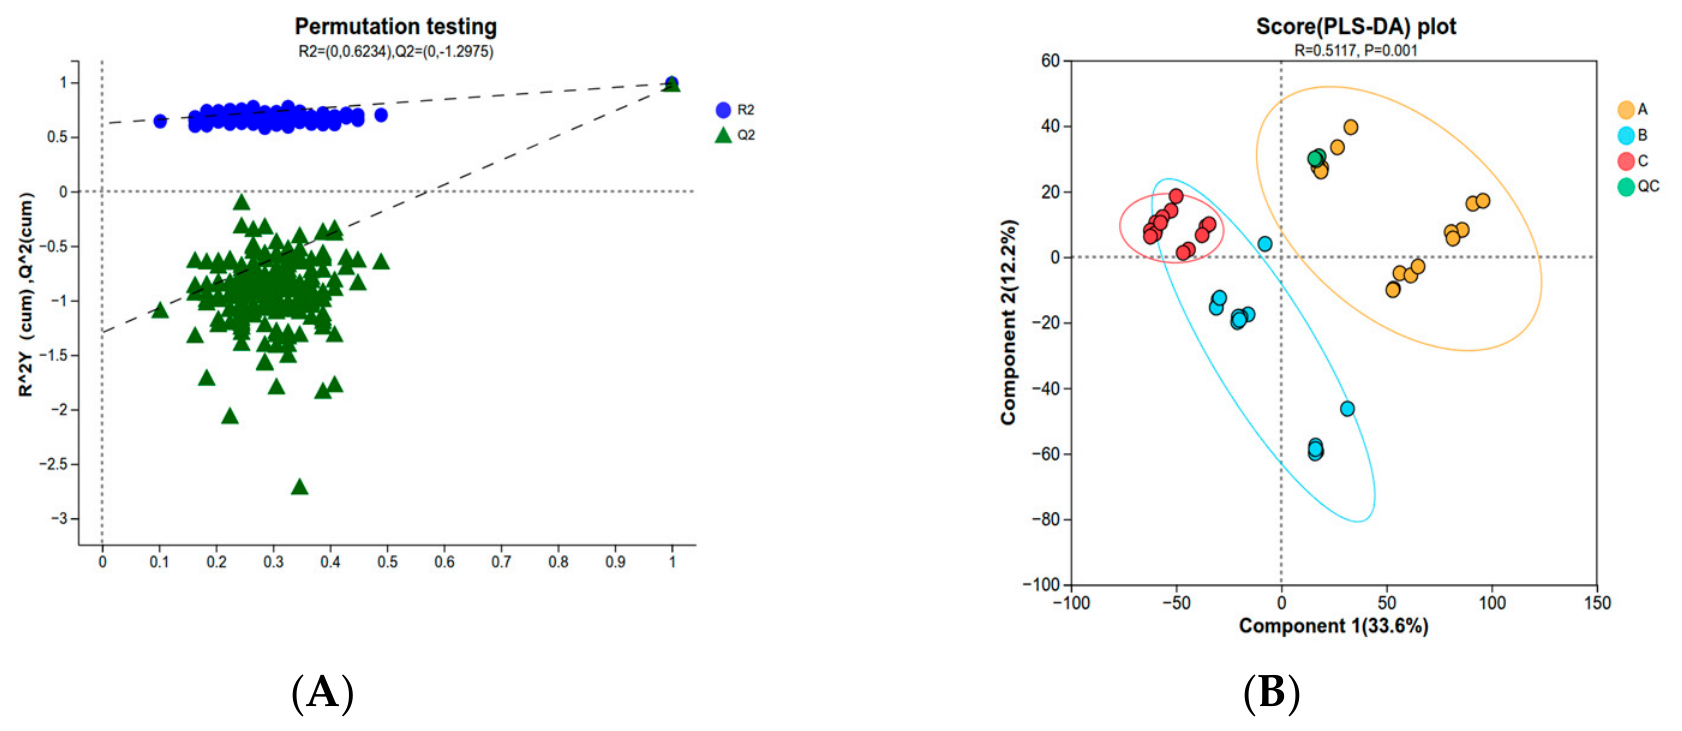
PCA transforms a set of potentially correlated variables into a set of linearly uncorrelated variables via orthogonal transformation. This method derives several principal components that account for the largest proportion of the variance in the explanatory matrix based on the original variables. The three groups exhibited some separation in both the positive/negative ion mode (ESI+/ESI−); however, the classification effect was not pronounced (Figure 1A,B). Consequently, further analysis of the model correlation between the samples within the groups and expression-level data was performed using OPLS-DA refinement, which allowed for the prediction of regression effects. A pronounced separation was observed between the three groups (Figure 2B), and the intercept of the regression line for Q2 with the Y-axis was <0.05. In addition, the regression lines for R2 and Q2 displayed an upward trend, and the permutation test met the established criteria. Thus, the model did not exhibit statistically significant overfitting.
Figure 1.
Rumen principal component analysis (PCA) scores. (A) Cation mode. (B) Anion mode. A, rumen samples from the control group; B, experimental Group B; C, experimental Group C; QC, quality control samples.
Figure 2.
Rumen orthogonal partial least squares discriminant analysis (OPLS-DA) model and analysis chart. (A) OPLS-DA model. R2 indicates the model’s explanatory power, whereas Q2 reflects its predictive power. The horizontal axis represents the permutation retention rate of the permutation test. (B) Analysis chart displaying the rumen samples from the control group. QC denotes the quality control samples.
3.1.2. General Analysis of Differential Metabolites
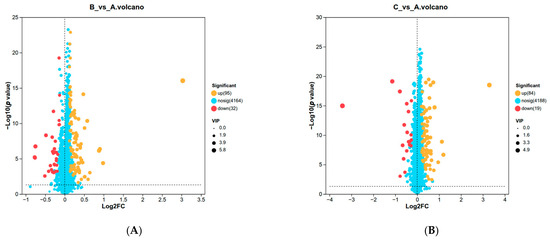
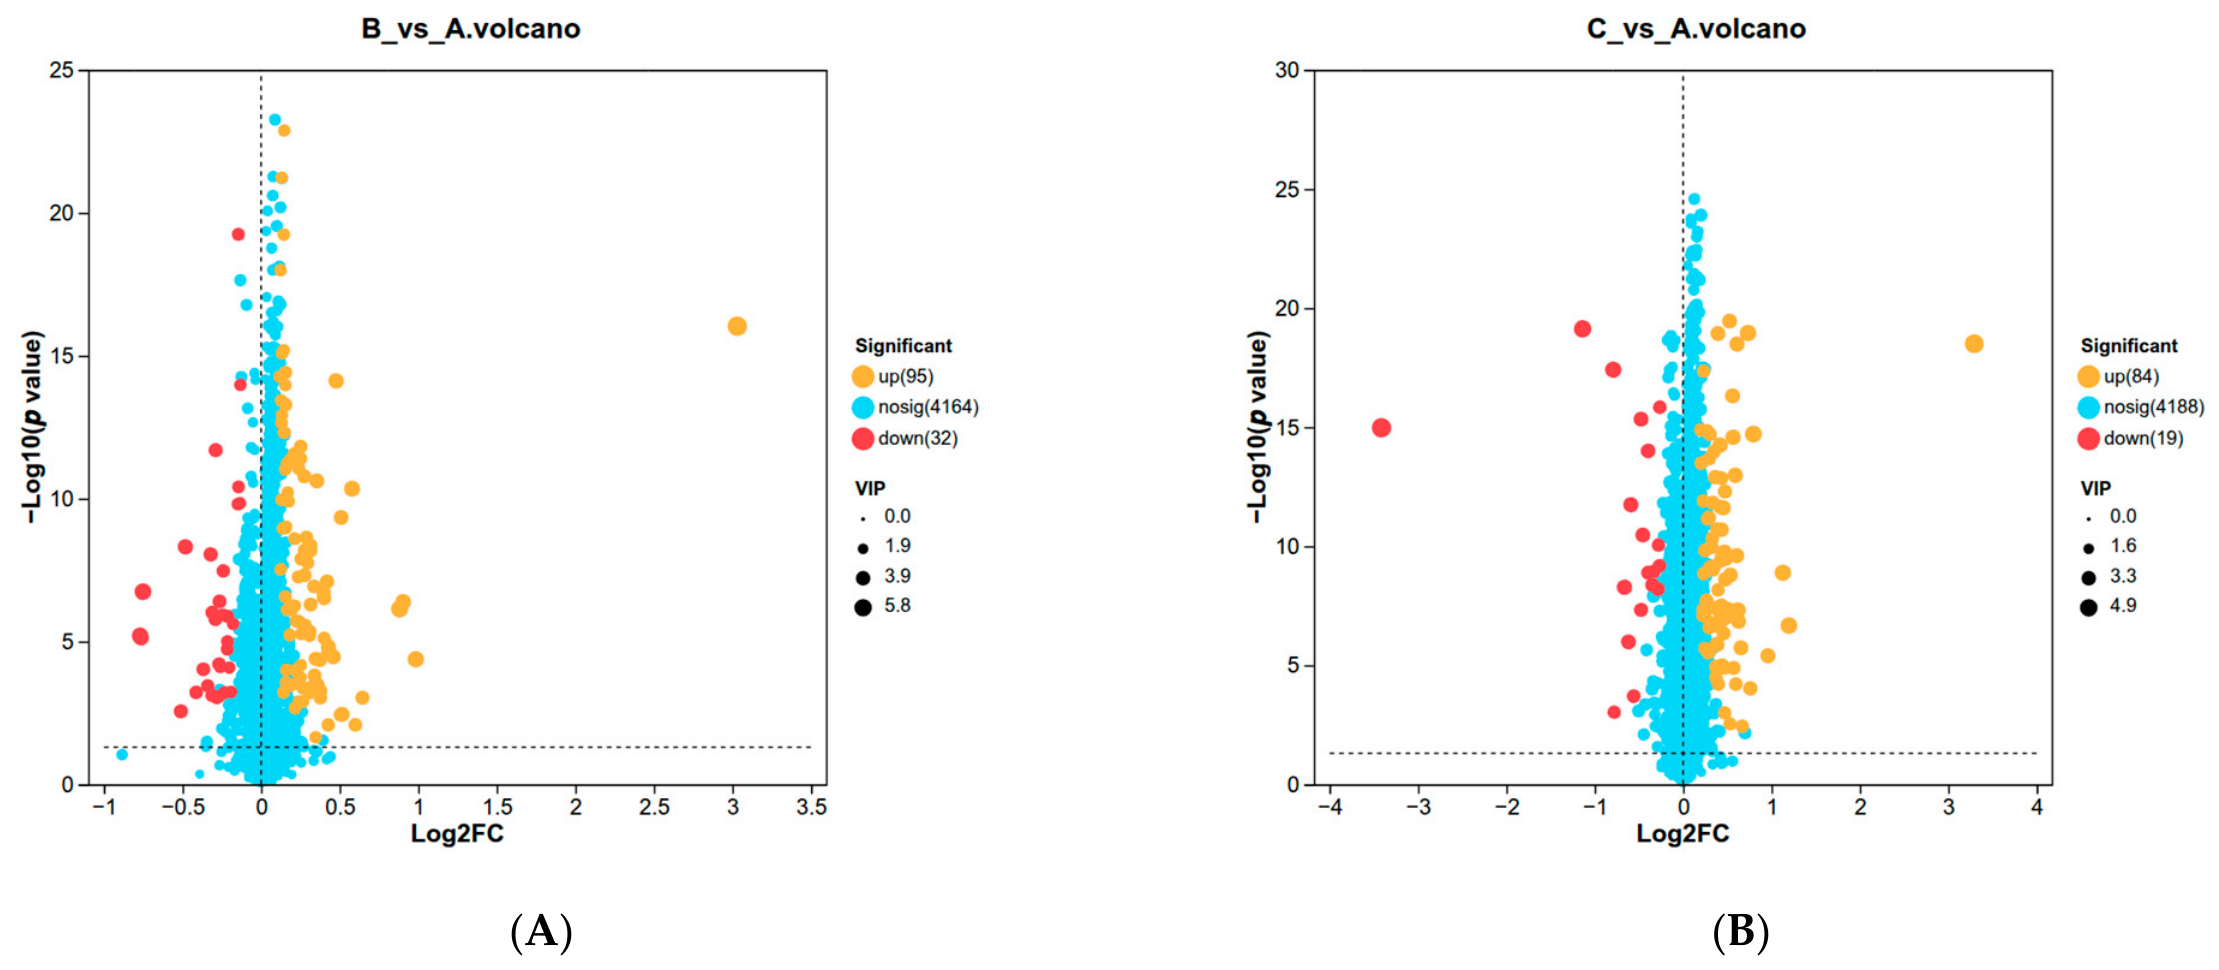
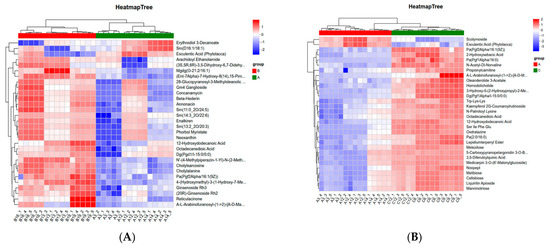
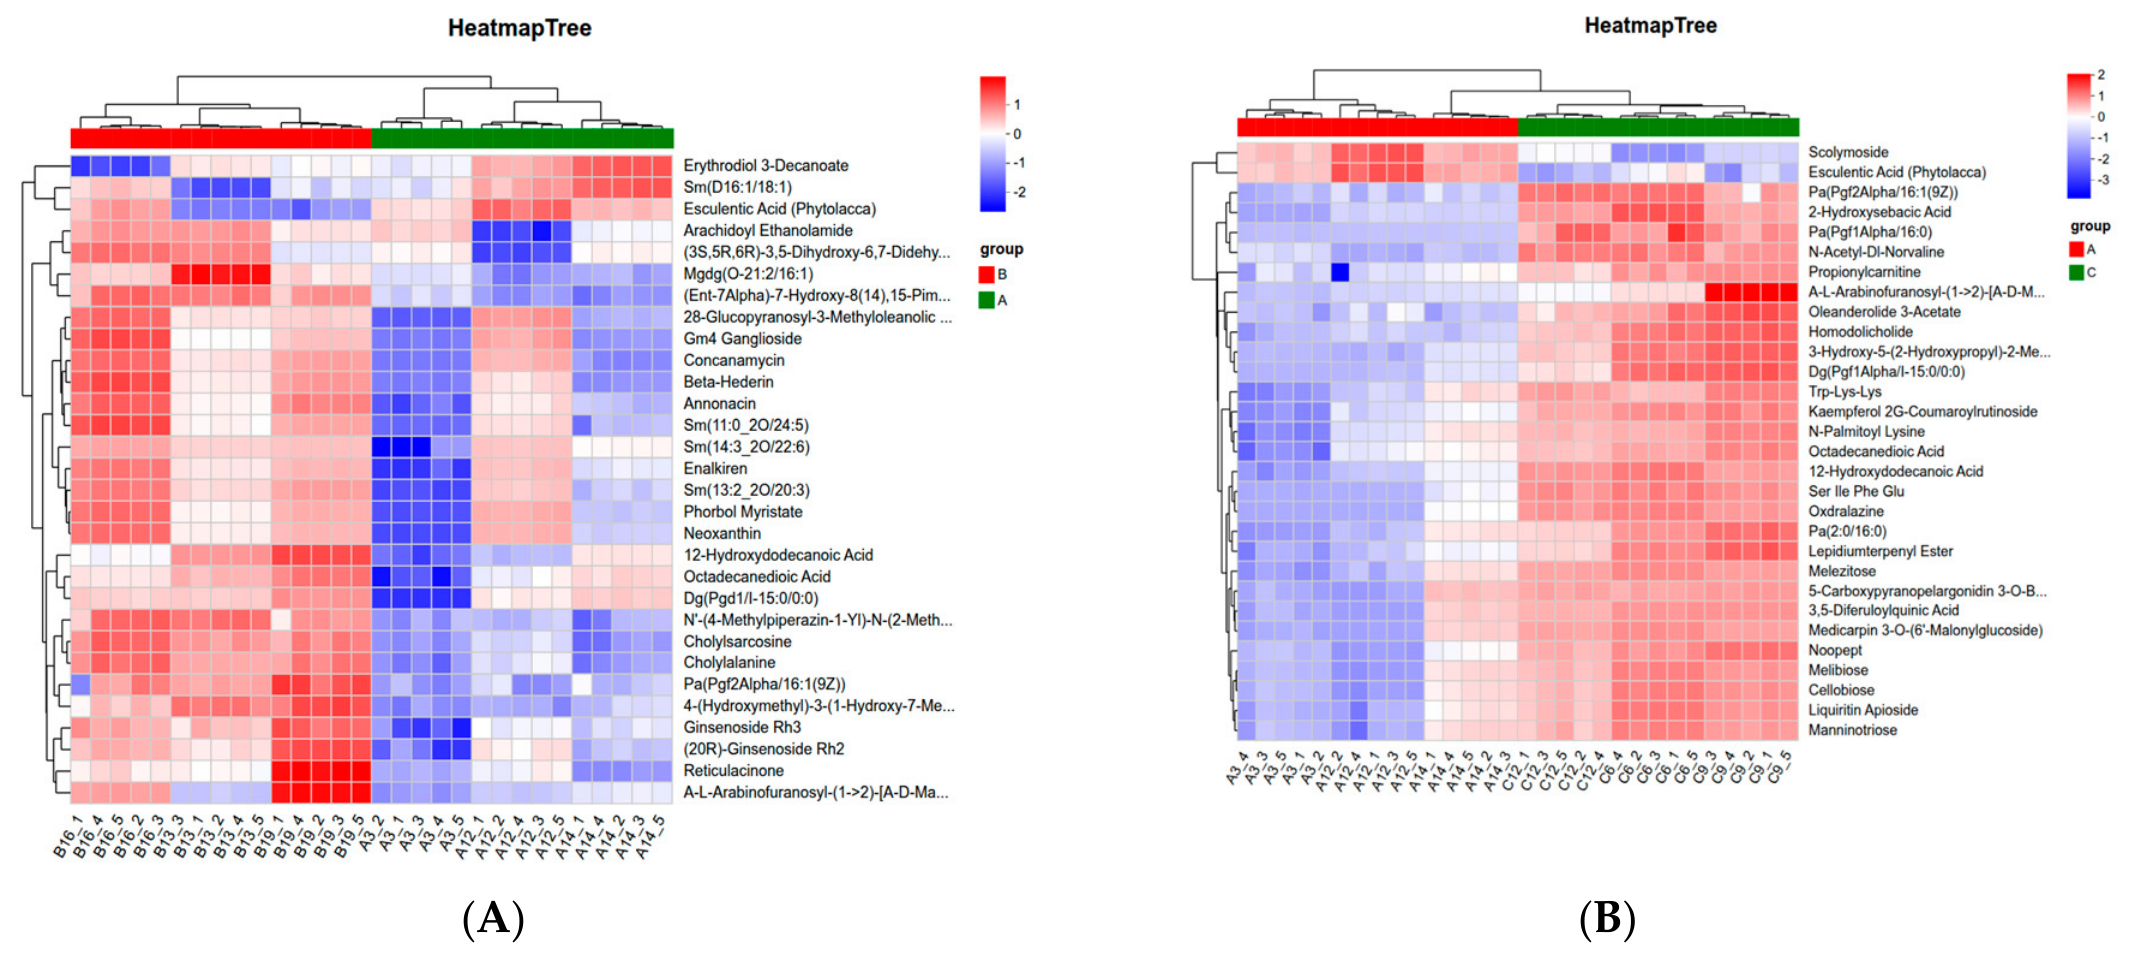
With a VIP value >1, and a p-value < 0.05, a distribution map illustrating the differential changes was generated (Figure 3). Compared with Group A, Group B exhibited pronounced upregulation of 95 metabolites and downregulation of 32 metabolites (Figure 3A). Similarly, Group C showed substantial upregulation of 84 metabolites and downregulation of 19 metabolites compared with Group A (Figure 3B). Additionally, the top 30 metabolites were categorized according to the degree of enrichment. As depicted in Figure 4, the sub-clusters of metabolites in Groups B and C displayed notable differences compared with that in the control group, while demonstrating good internal consistency with no apparent discrepancies.
Figure 3.
Volcano diagrams of differential metabolites. (A) B vs. A; (B) C vs. A. The horizontal axis represents the fold change in metabolite expression levels between the two groups, and A represents the control group. The point size corresponds to the variable importance in projection (VIP) value. Orange indicates significant upregulation (p < 0.05), whereas red indicates significant downregulation (p < 0.05).
Figure 4.
Heat map of the condensation clustering matrix of differential metabolites. (A) Group B. (B) Group C. A represents the control group. Red indicates upregulated expression (p < 0.05) and blue indicates downregulated expression (p < 0.05).
3.1.3. Enrichment Analysis of Differential Metabolite KEGG Pathways
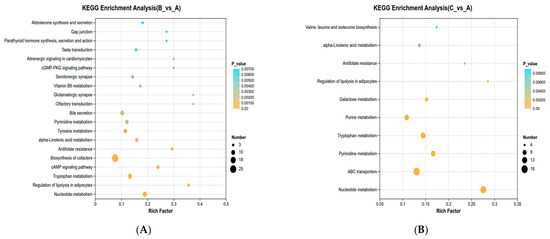
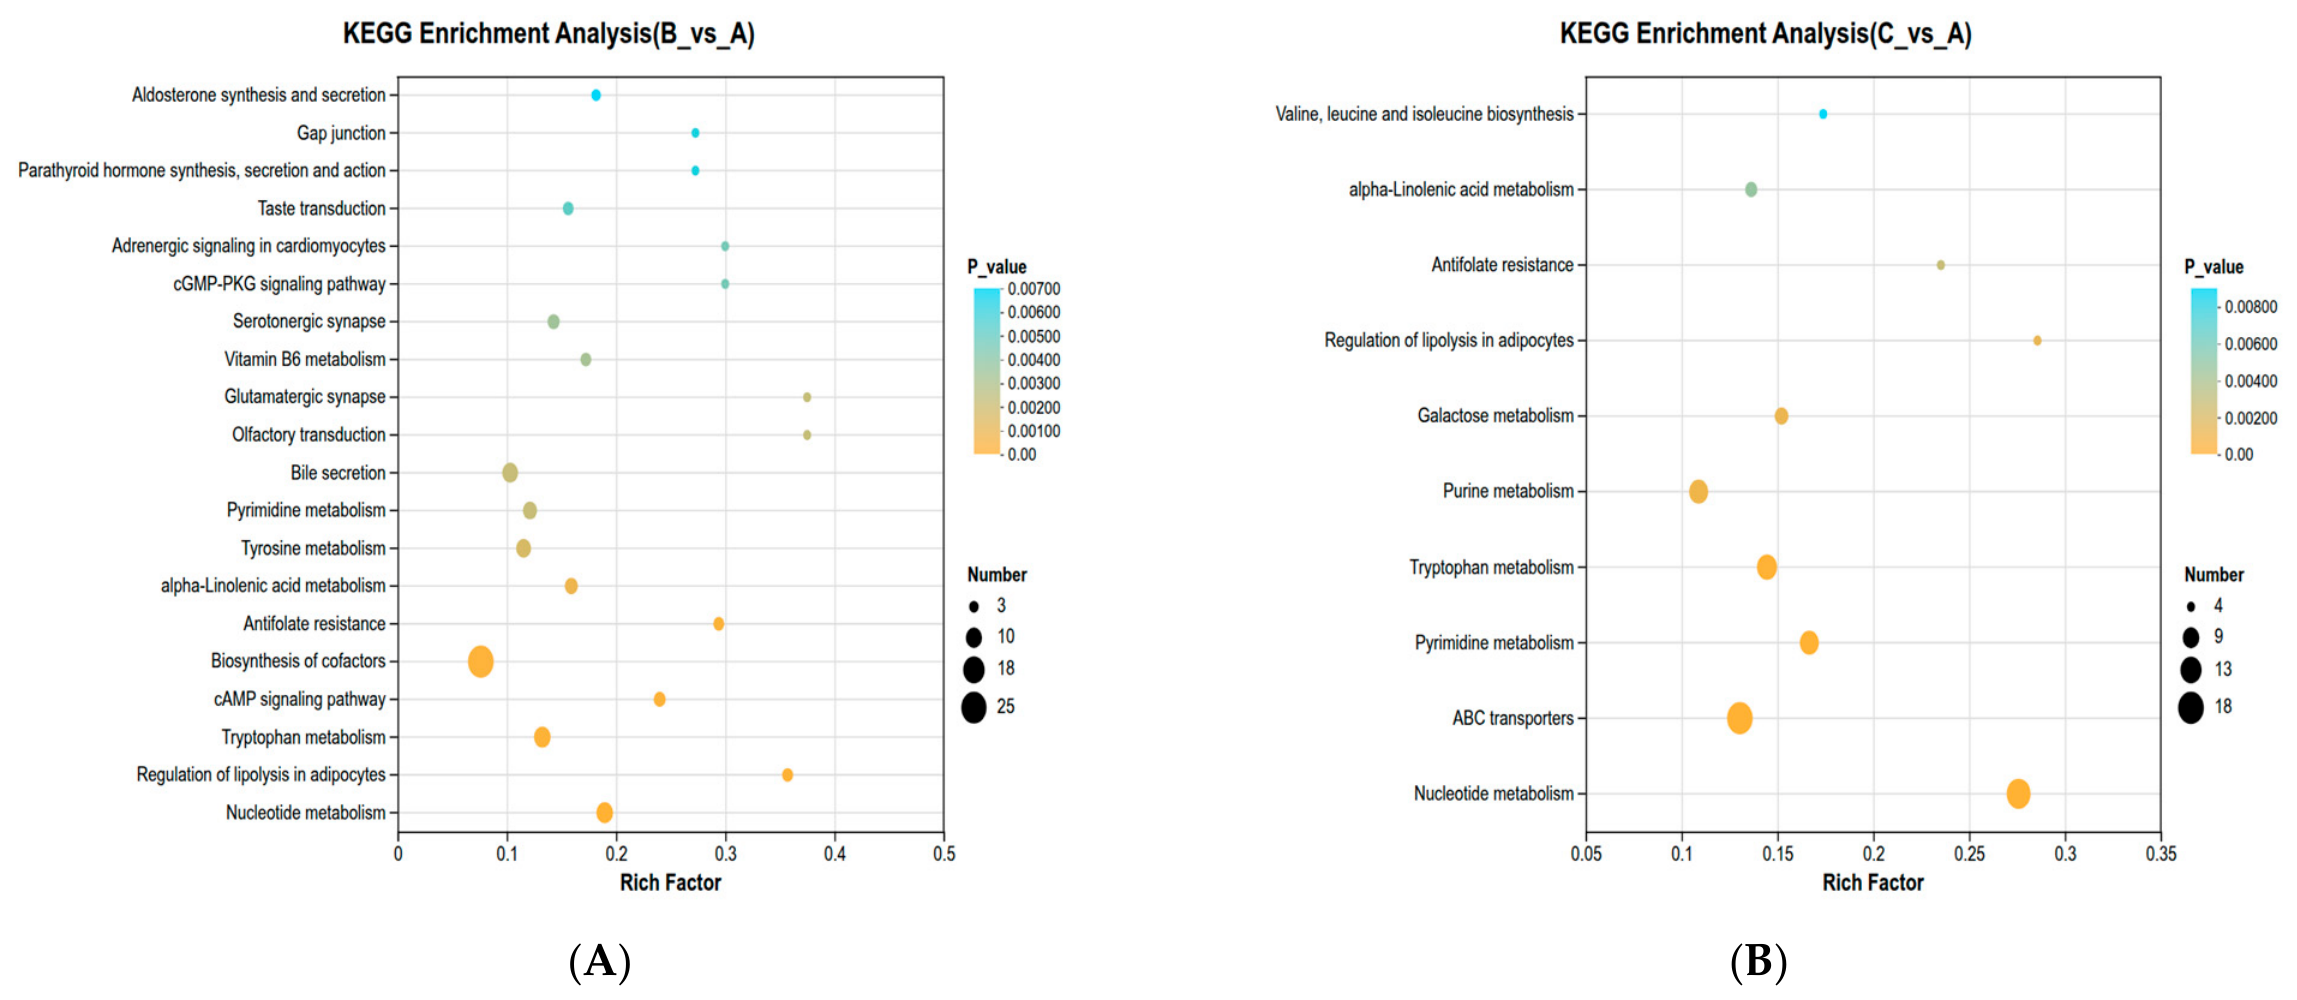
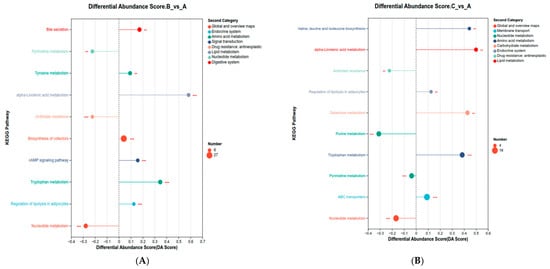
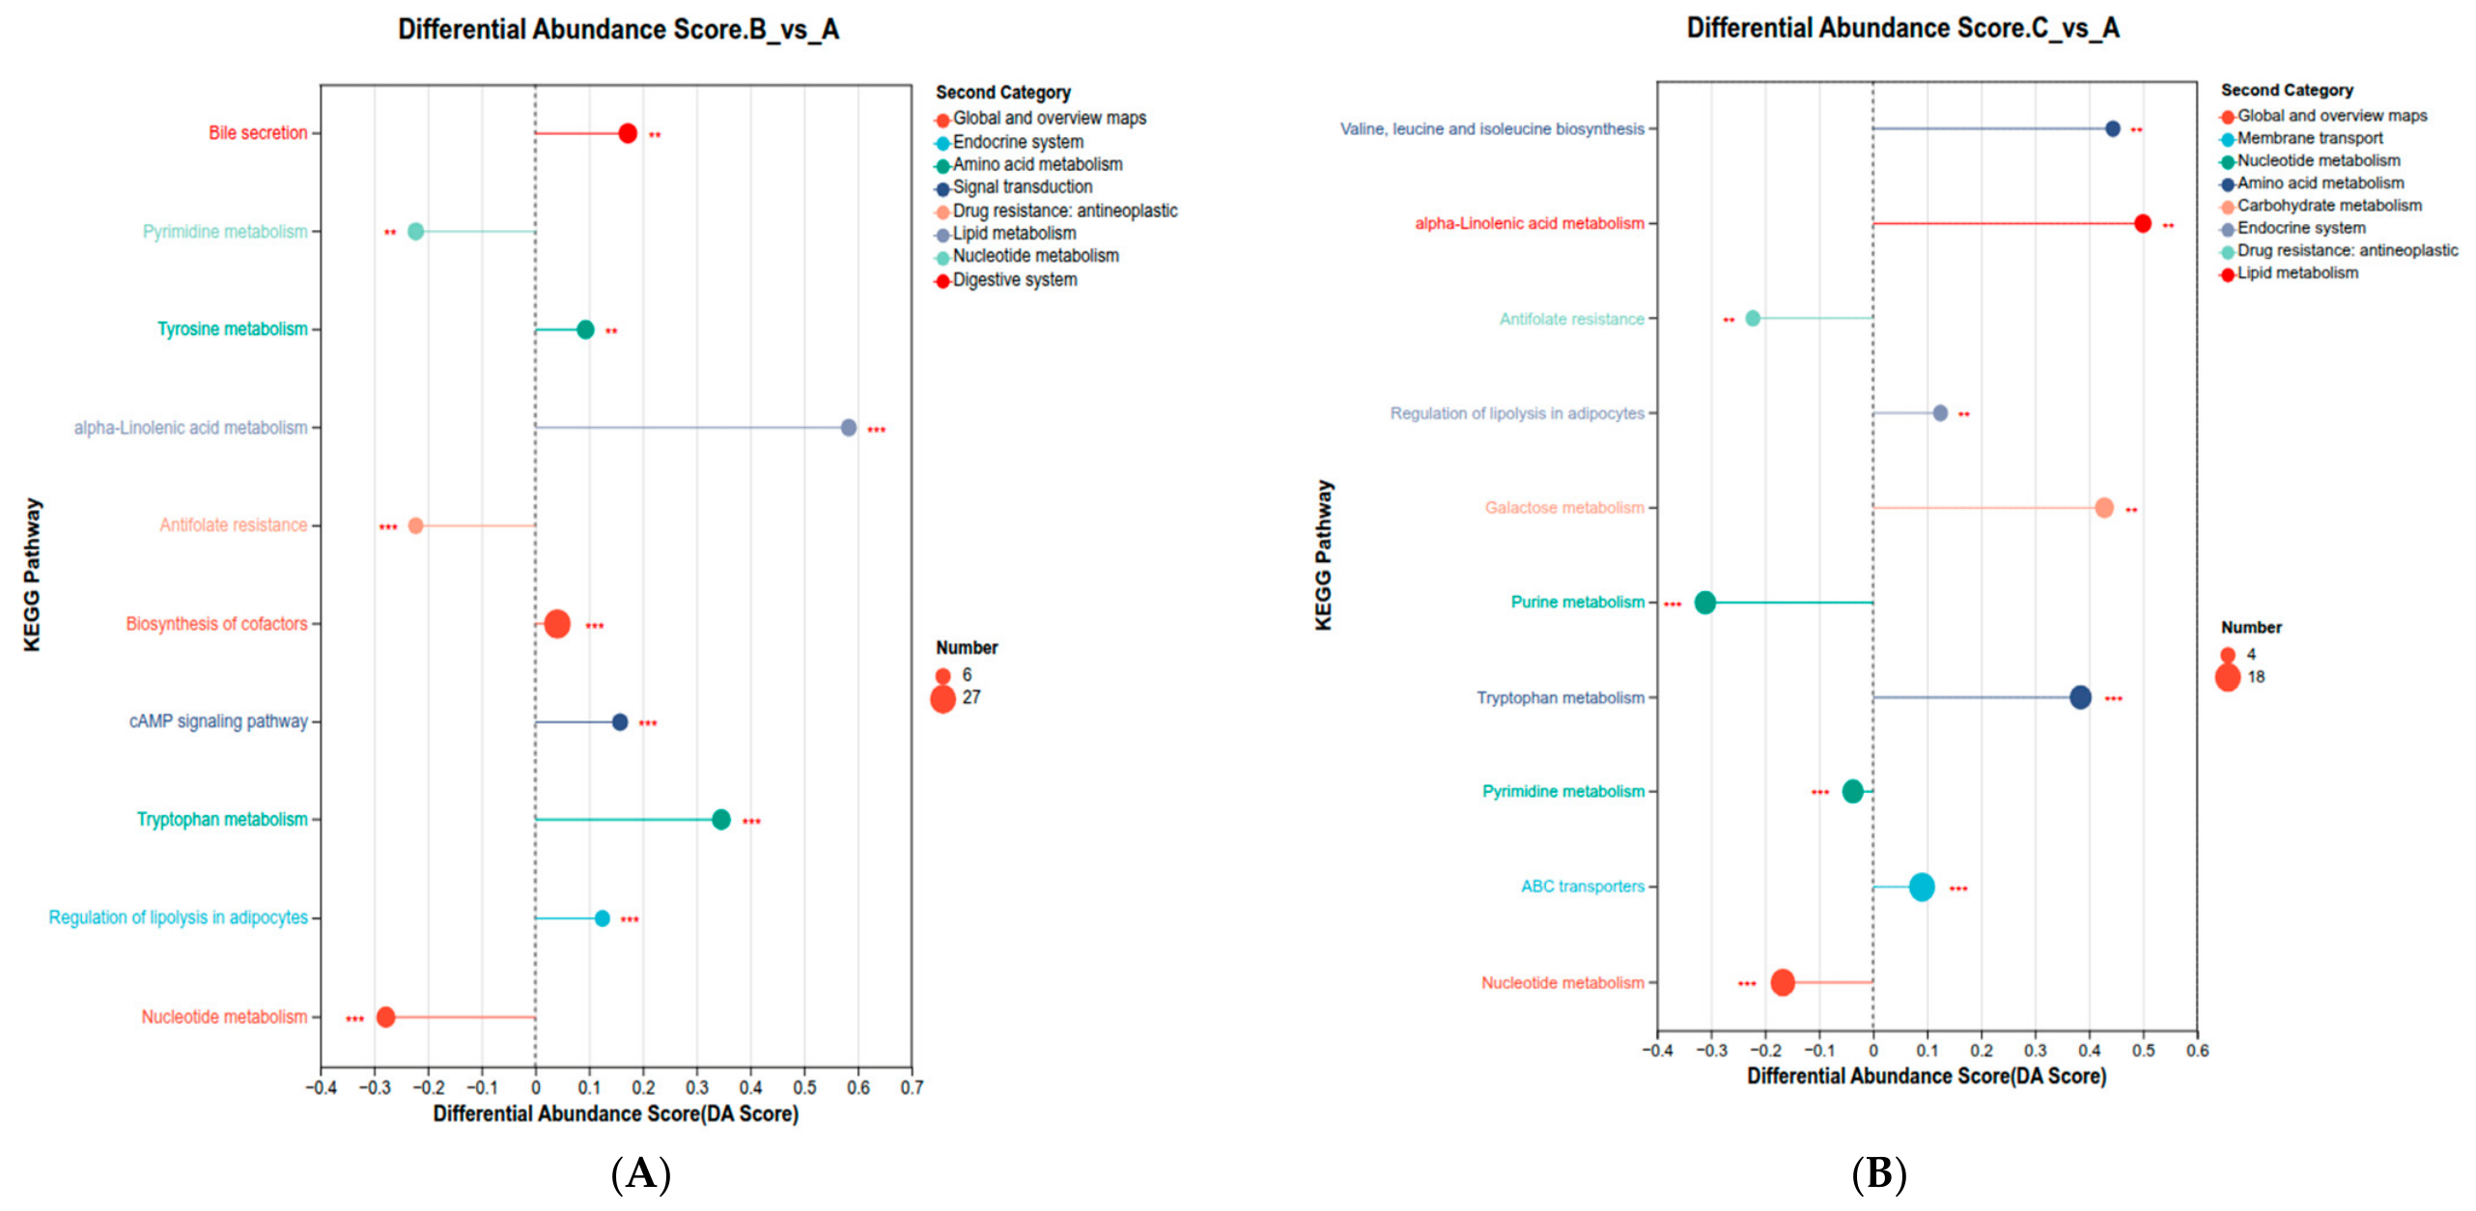
KEGG enrichment analysis was performed on differential metabolites exhibiting VIP ≥ 2 and p < 0.05 (Figure 5). The findings indicated that compared with Group A, Groups B and C had 20 (Figure 5A) and 10 (Figure 5B) characteristic metabolic pathways, respectively. An analysis of the top 10 significant metabolic pathways based on relative abundance is presented in Figure 6. The primary upregulated pathways enriched by metabolites in Group B included adipocyte lipolysis regulation, tryptophan metabolism, tyrosine metabolism, cofactor biosynthesis, bile secretion, and alpha-linolenic acid metabolism. The main upregulated pathways included nucleotide metabolism, pyrimidine metabolism, and the antifolate resistance pathway (Figure 6A). In Group C, the primary upregulated pathways enriched by metabolites included the ABC transport protein pathway; tryptophan metabolism; galactose metabolism; adipocyte lipolysis regulation; alpha-linolenic acid metabolism; and valine, leucine, and isoleucine biosynthesis. The principal upregulated pathways included nucleotide metabolism, pyrimidine metabolism, and the antifolate resistance pathway (Figure 6B). A metabolic set was established based on the KEGG enrichment results, and the expression of differential metabolites is shown in Table 4.
Figure 5.
Differential metabolic pathway enrichment analysis. (A) Group B. (B) Group C. The size of each point represents the number of differential metabolites enriched in that pathway. The darker the color of the point, the more statistically significant the enrichment.
Figure 6.
Differential metabolic pathway abundance. Group A served as the control. (A) Group B. (B) Group C. The horizontal axis illustrates the relative importance of the metabolite pathway, whereas the vertical axis denotes the significance of enrichment. The size of the bubbles reflects their influence. The more down-regulated the overall expression of the pathway is p_value or FDR < 0.001 is labelled as ***, p_value or FDR < 0.01 is labelled as **.
Table 4.
Differences in metabolite expression between groups.
3.2. Rumen Fermentation Parameters
As shown in Table 5, no significant differences in pH, acetic acid/propionic acid (A/P) ratio, and NH3-N indicators were observed among Groups B, C, and A (p ≥ 0.05). In contrast, the propionic acid and MCP levels increased significantly (p < 0.05), and the levels of acetic acid, butyric acid, and VFAs increased extremely significantly (p < 0.01).
Table 5.
Rumen fermentation parameters.
3.3. Comparison of Rumen Microbial Diversity
3.3.1. Comparison of Alpha Diversity Index Between Groups
Differences in rumen microbial alpha richness and diversity among the groups are shown in Table 6. No significant differences in the richness estimators (ACE and Chao1) and diversity indices (Shannon and Simpson) (p > 0.05) were observed.
Table 6.
Intergroup alpha diversity indices.
3.3.2. Comparison of Beta Diversity Index Between Groups
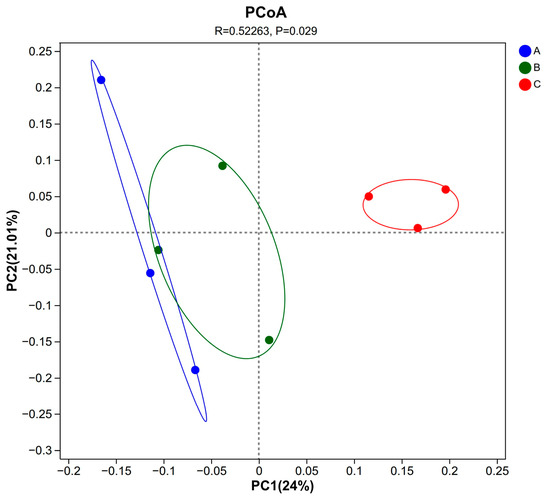
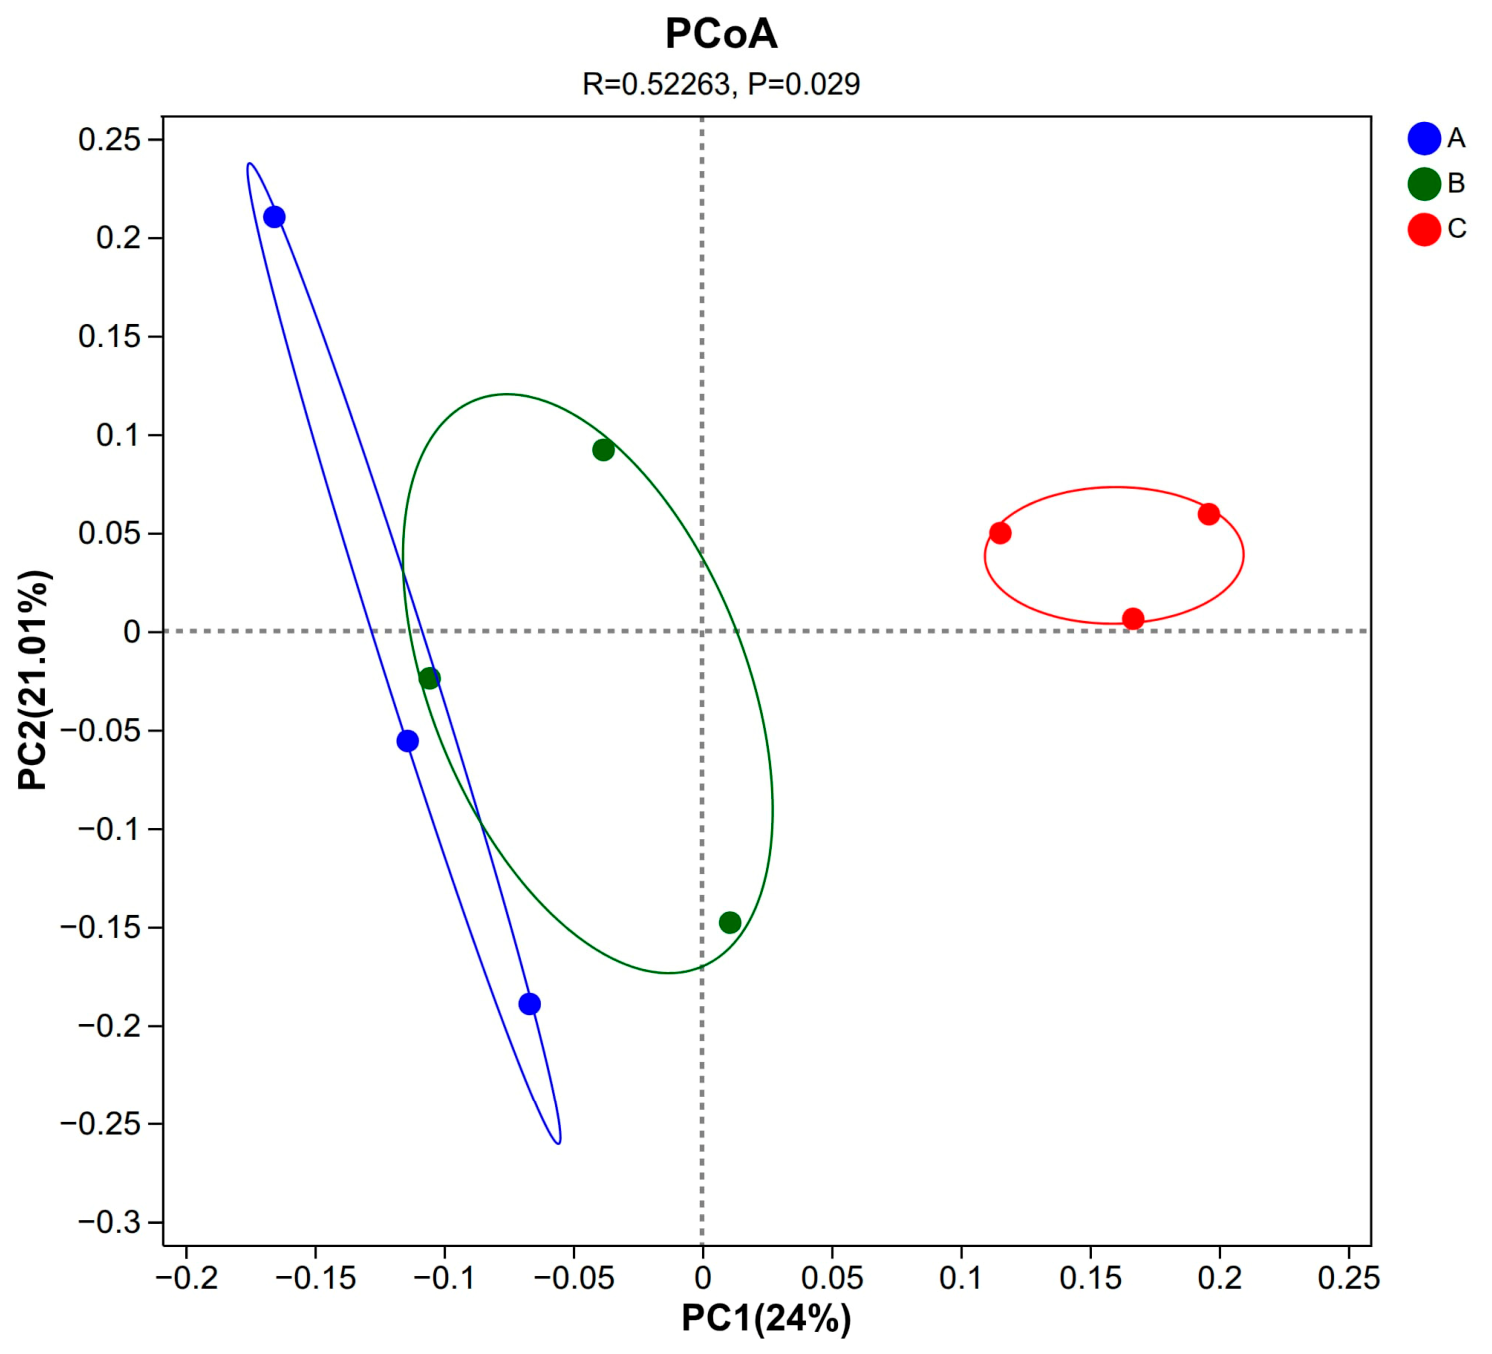
PCoA reduces the dimensionality of non-constrained data and utilizes a species distance matrix to illustrate sample differences. As shown in Figure 7, the first principal component accounted for 24% of the variance, whereas the second principal component accounted for 21.01%. Notably, a discernible separation was observed between Groups B and A, whereas Group C exhibited a pronounced separation from Group A (p = 0.029).
Figure 7.
Principal coordinate analysis (PCoA).
3.4. Comparison of Rumen Microbial Composition Between Groups
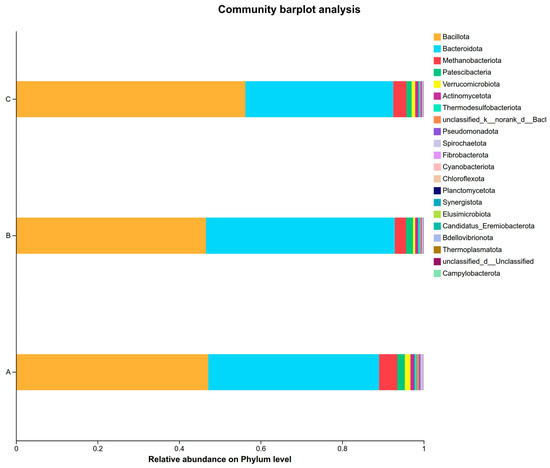
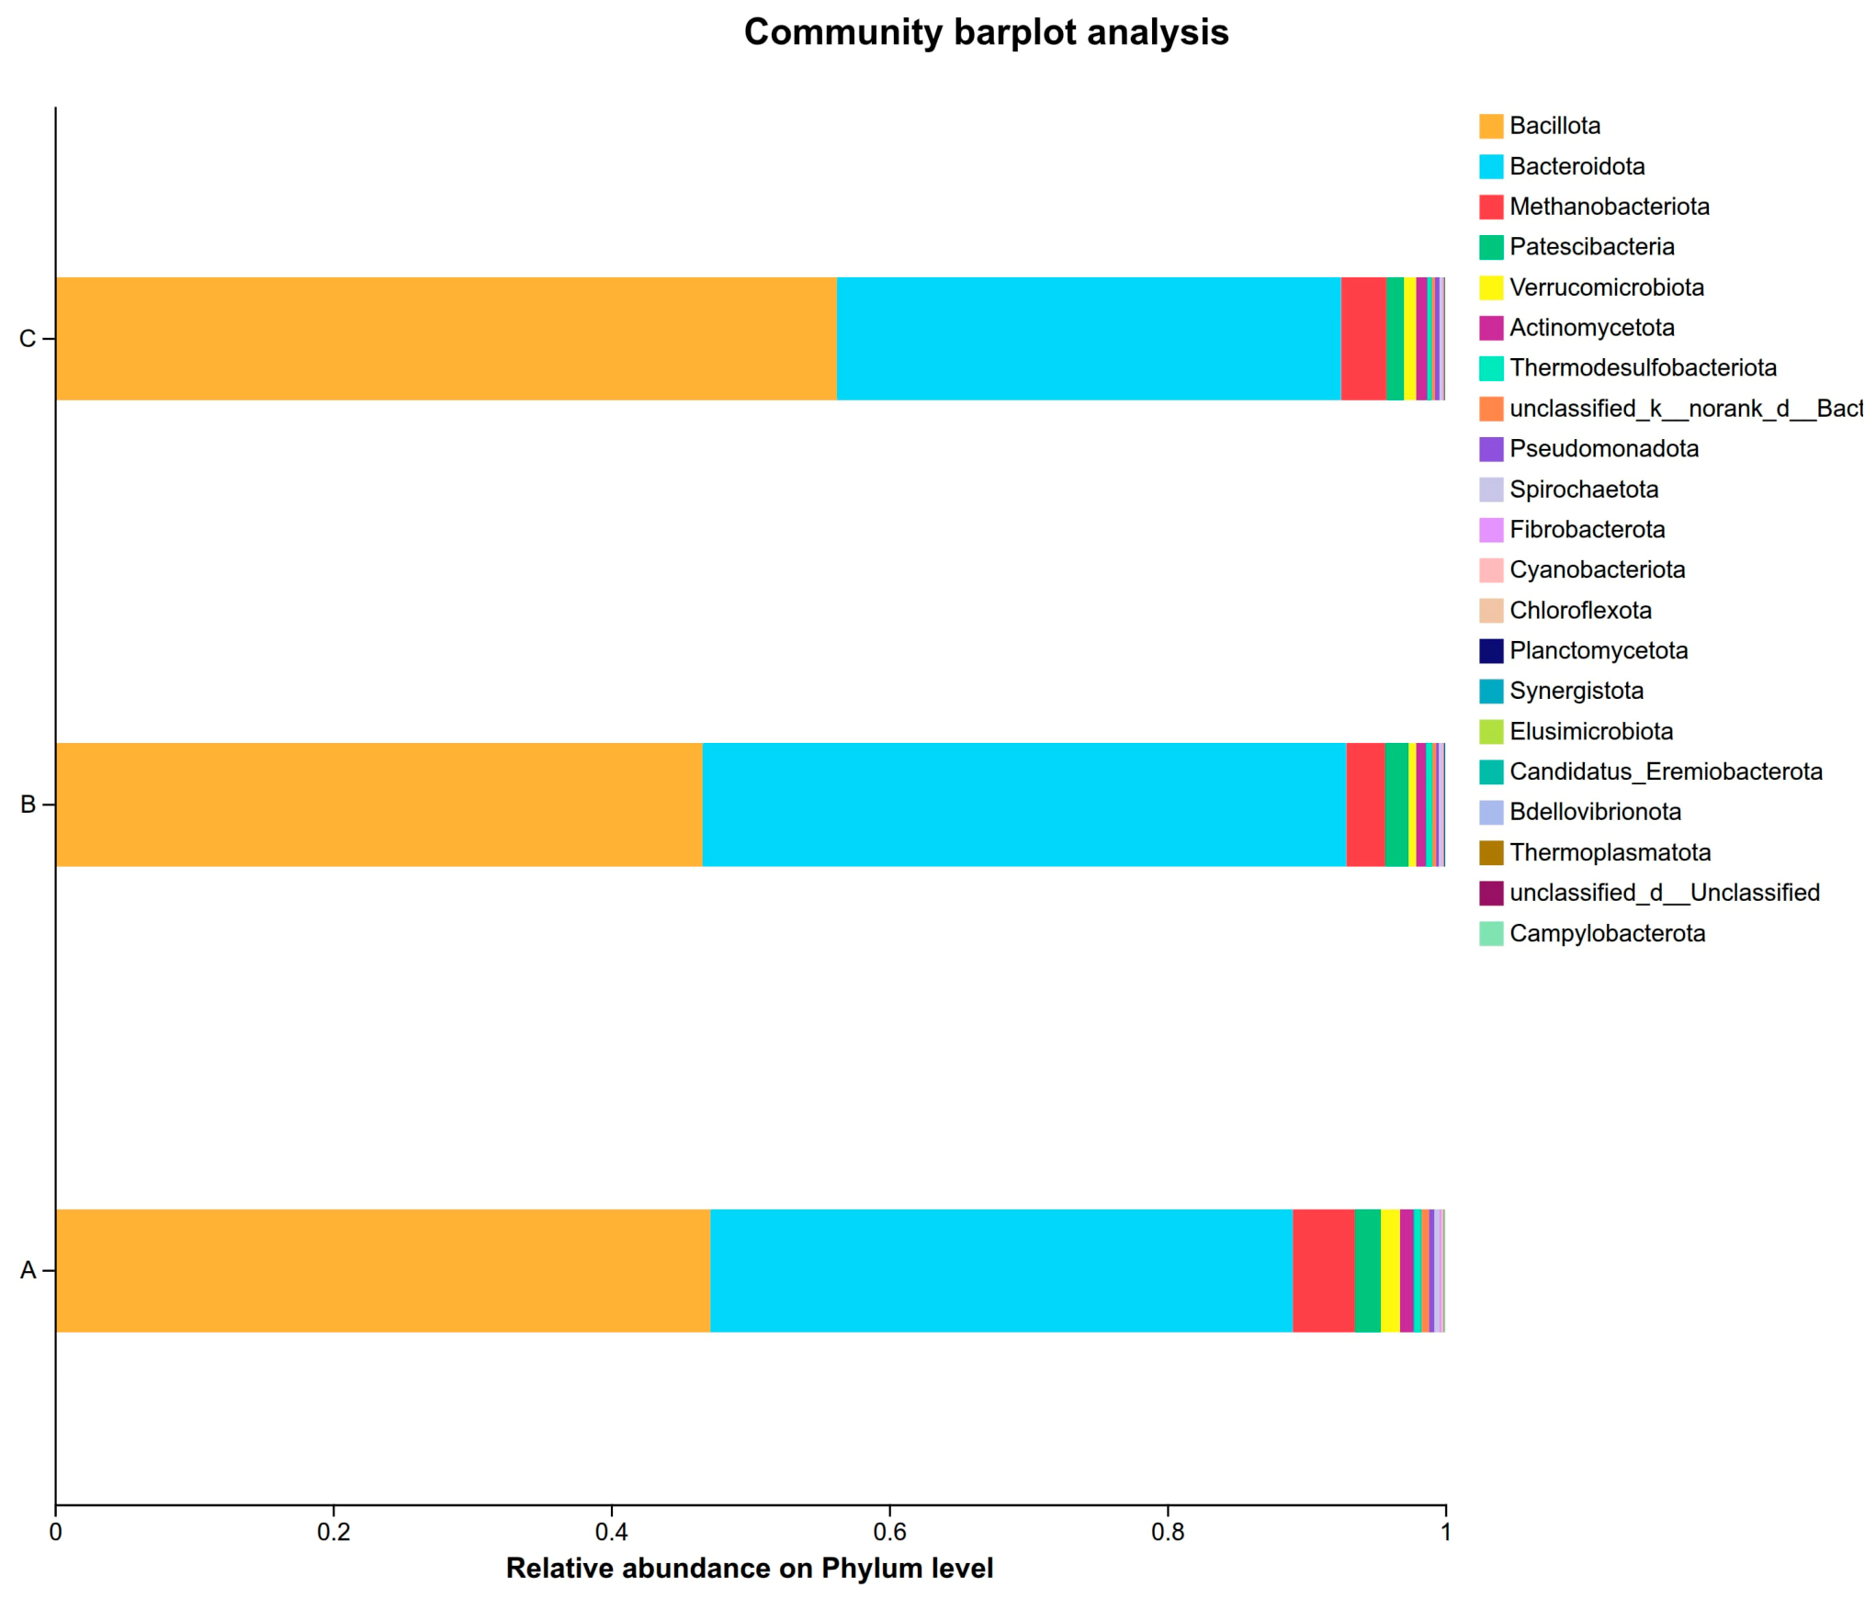
Figure 8 and Table 7 present the top 10 dominant phyla and genera in the rumen. Each exhibited a relative abundance greater than 1% within their respective groups. The predominant phyla were Firmicutes, Bacteroidetes, and Euryarchaeota. Among the genera, Xylanibacter displayed the highest relative abundance in the three experimental groups.
Figure 8.
Differences in rumen bacterial composition among groups.
Table 7.
Differences in bacterial community composition among groups at the genus level.
At the genus level, the abundance of Weissella in the experimental groups extremely significantly increased (p < 0.01), whereas that of Methanobrevibacter significantly decreased (p < 0.05). The abundances of Xylanibacter, Rikenellaceae_RC9_gut_group, NK4A214_group, norank_f__F082, norank_f__UCG-011, Christensenellaceae_R-7_group, norank_f__Muribaculaceae, and Ruminococcus did not vary significantly (p ≥ 0.05).
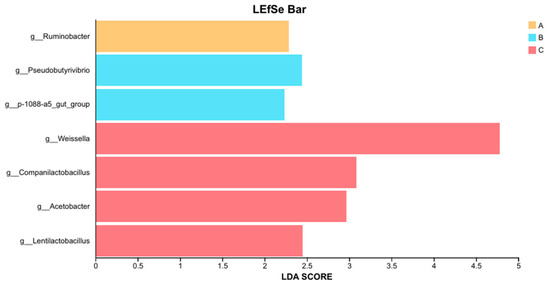
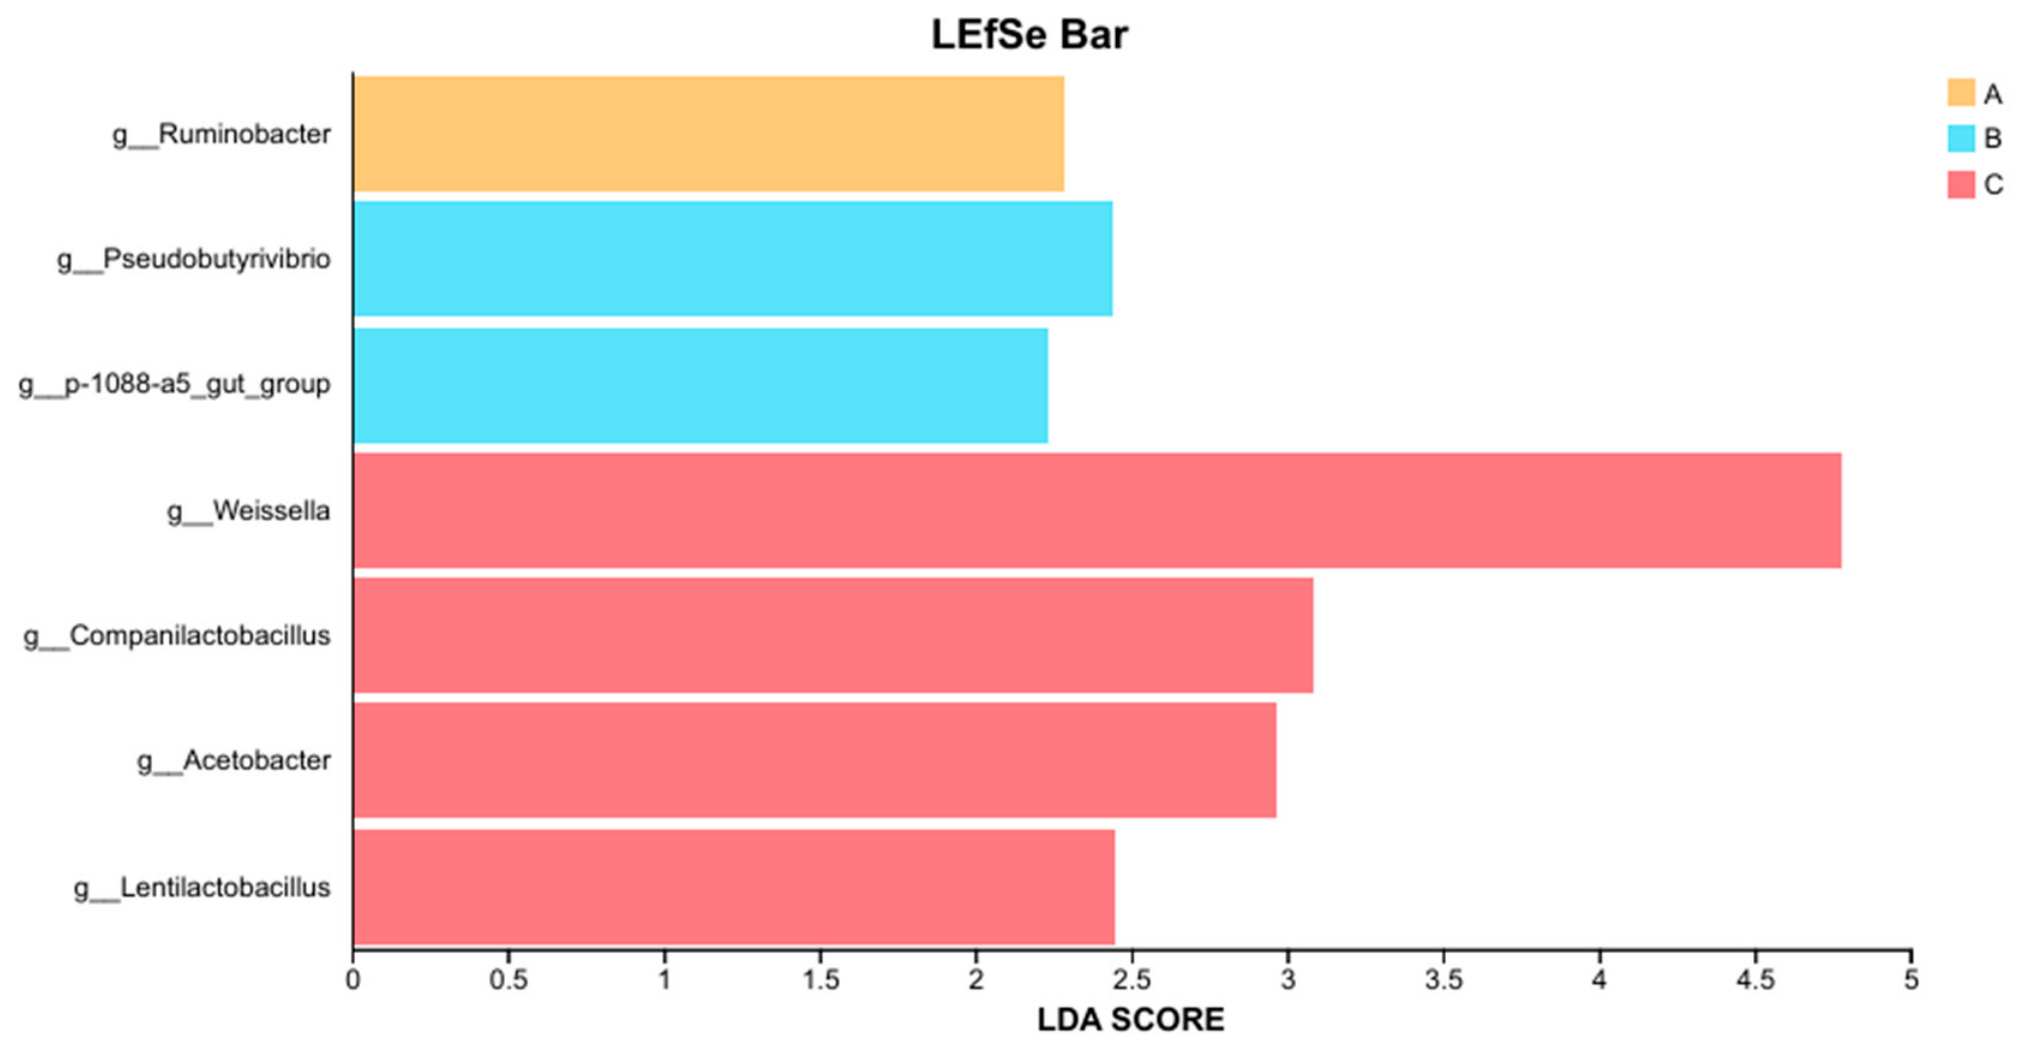
LEfSe species discrimination screened out a total of seven differential bacterial genera at the genus level (Figure 9). Group A was enriched with Ruminobacter amylophilus and Group B was enriched with Pseudobutyrivibrio and the p-1088-a5_gut_group. Group C was enriched in four bacterial genera: Weissella, Companilactobacillus, Acetobacter, and Lentilactobacillus.
Figure 9.
Linear discriminant analysis (LDA) effect size (LEfSe) of rumen microbiota across Groups A, B, and C (LDA score > 2.2).
3.5. Correlation Analysis Between Rumen Microorganisms and Rumen Fermentation Parameters
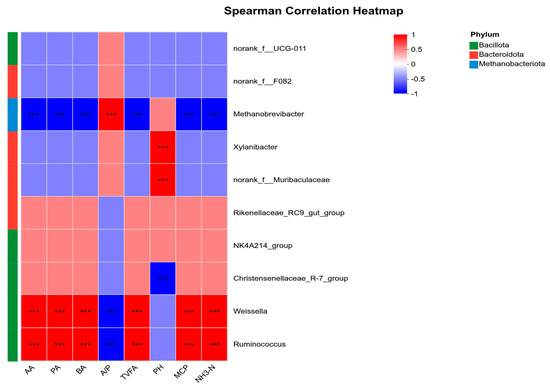
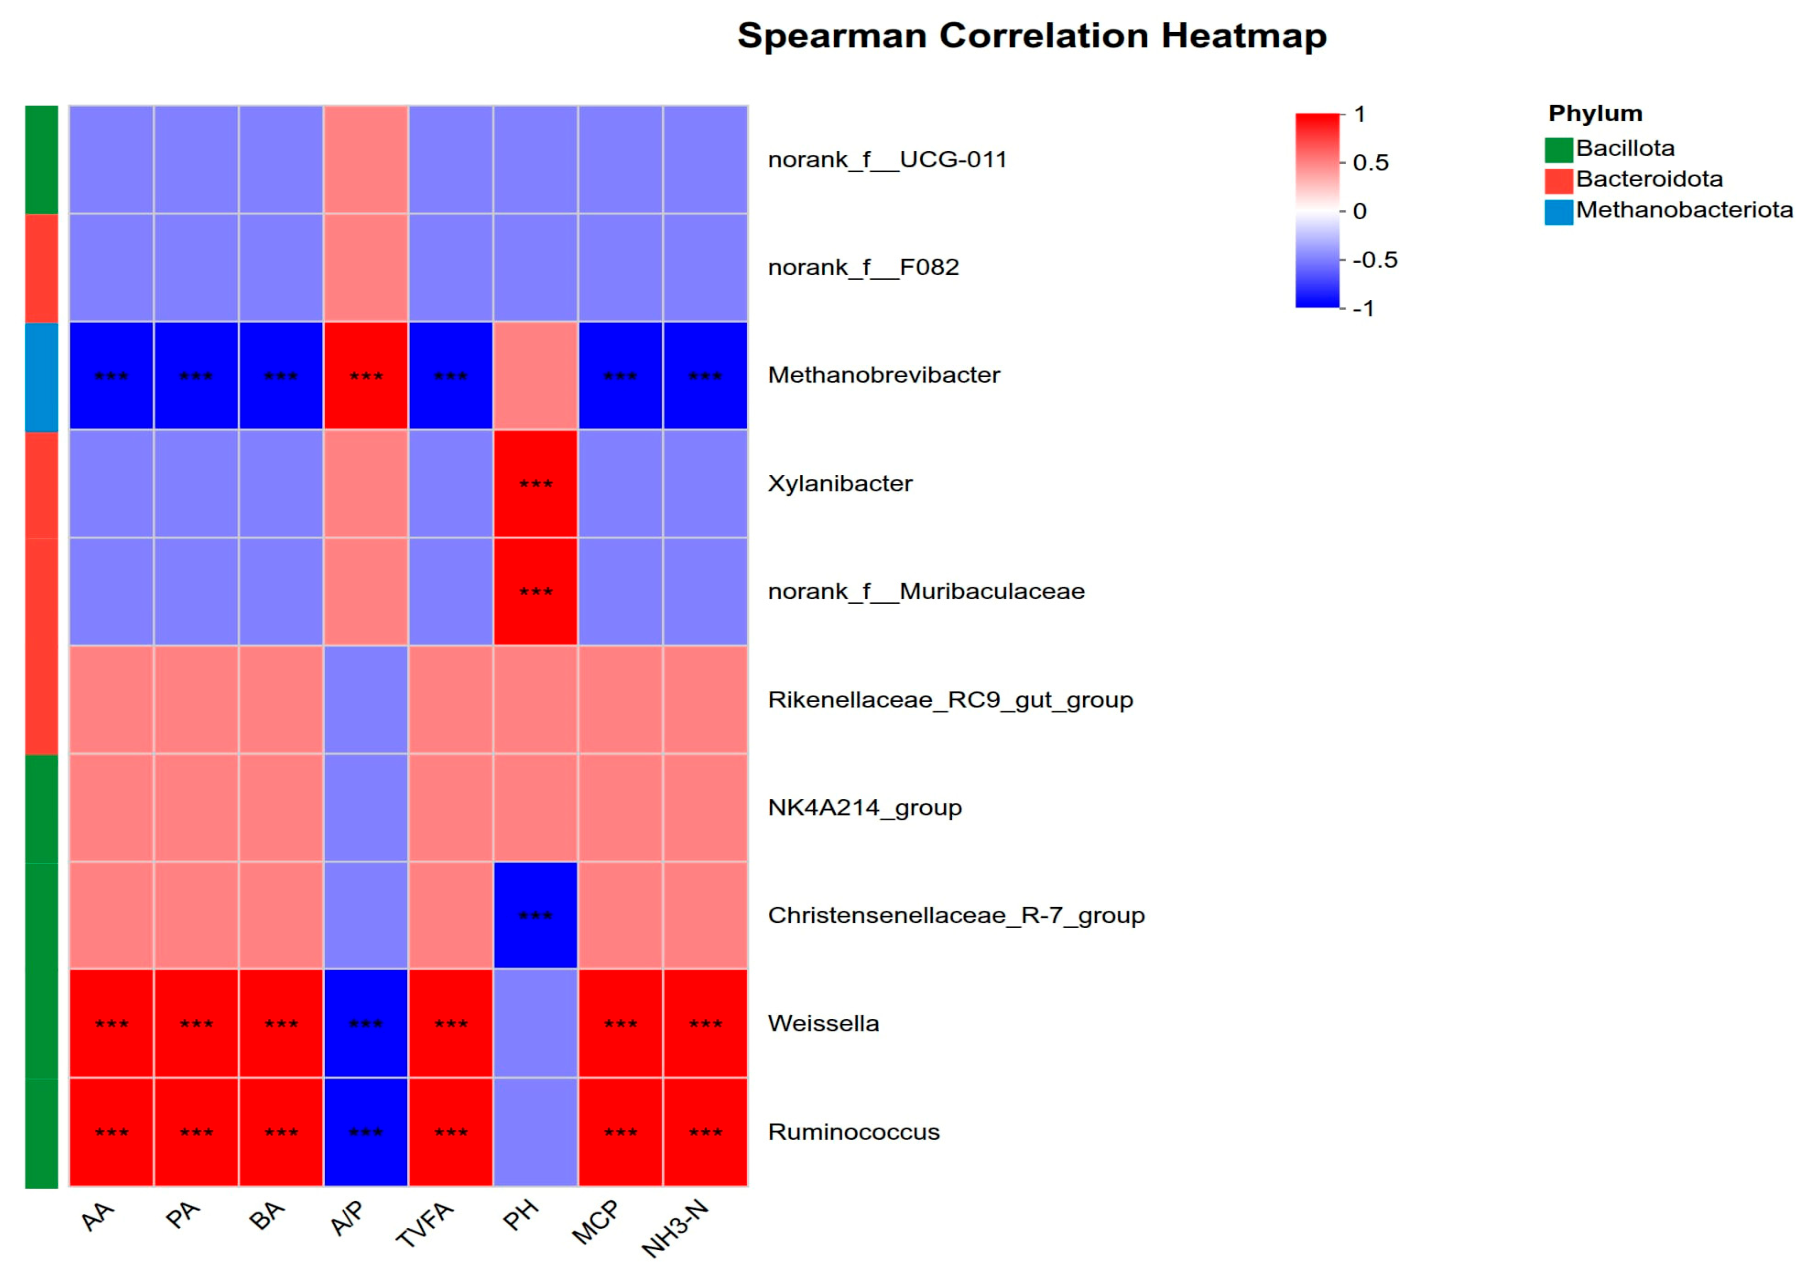
A correlation analysis between rumen microbial bacterial genera and rumen fermentation parameters is shown in Figure 10 (after Benjamini–Hochberg correction). Methanobrevibacter was extremely significantly negatively correlated with acetic acid (R = −0.82, p < 0.01), propionic acid (R = −0.77, p < 0.01), butyric acid (R = −0.83, p < 0.01), VFAs (R = −0.79, p < 0.01), MCP (R = −0.79, p < 0.01), and NH3-N (R = −0.82, p < 0.01), and extremely significantly positively correlated with the A/P ratio (R = 0.80, p < 0.01). Xylanibacter was extremely significantly positively correlated with pH (R = 0.78, p < 0.01), and norank_f__Muribaculaceae was extremely significantly positively correlated with pH (R = 0.84, p < 0.01). The Christensenellaceae_R-7_group was extremely significantly negatively correlated with pH (R = −0.79, p < 0.01). Weissella was extremely significantly positively correlated with acetic acid (R = 0.84, p < 0.01), propionic acid (R = 0.80, p < 0.01), butyric acid (R = 0.84, p < 0.01), VFAs (R = 0.75, p < 0.01), MCP (R = 1, p < 0.01), and NH3-N (R = 0.80, p < 0.01), and extremely significantly negatively correlated with the A/P ratio (R = −0.79, p < 0.01). Ruminococcus was extremely significantly positively correlated with acetic acid (R = 0.82, p < 0.01), propionic acid (R = 0.82, p < 0.01), butyric acid (R = 0.81, p < 0.01), VFAs (R = 0.79, p < 0.01), MCP (R = 0.86, p < 0.01), and NH3-N (R = 0.80, p < 0.01), and extremely significantly negatively correlated with the A/P ratio (R = −0.76, p < 0.01).
Figure 10.
Heatmap illustrating the correlation between rumen microbiota and rumen fermentation parameters. *** denotes a highly significant correlation (p < 0.01).
4. Discussion
4.1. KEGG Differential Metabolite Analysis
KEGG enrichment analysis showed that the differential metabolites were mainly involved in tryptophan, tyrosine and pyrimidine metabolism, ubiquinone and other terpenoid-quinone biosynthesis, and pentose and glucuronate interconversions (Table 4). Compared with the control, four metabolites were consistently upregulated—indole-3-acetaldehyde, 2-amino-3-methoxybenzoic acid, 2-succinyl-5-enolpyruvyl-6-hydroxy-3-cyclohexene-1-carboxylate (SEPHCHC), and cholesterol glucuronide—whereas 4-fumarylacetoacetate and pseudouridine 5′-phosphate were downregulated. These changes suggest that co-supplementation shifted ruminal metabolism toward a state of lower oxidative and toxic load, although the underlying mechanisms were not directly examined in this study.
SEPHCHC is an intermediate of the menaquinone biosynthesis pathway, and menaquinone serves as an electron-transport cofactor that can support the fermentation activity of ruminal anaerobes [26]. Cysteamine upregulates the levels of menaquinone synthesis precursors by modifying rumen hydrogen metabolism pathways, which could reduce the hydrogen available for methanogenesis and lower the risk of acute rumen acidosis [27]. It should be noted, however, that this inference is based on indirect indicators, as methane emissions were not directly measured in the present study. In addition, the inferred reduction in methanogenesis was based solely on the decreased abundance of Methanobrevibacter and the increased propionate proportion. Other methanogenic archaeal lineages were not examined separately, and propionate synthesis does not always exhibit a linear relationship with methane suppression; therefore, the proposed reduction in methane emissions and the associated energy savings should be interpreted with caution. Its accumulation may reflect an increased menaquinone-synthesis flux. Tryptophan-derived metabolites such as indole-3-acetaldehyde have been reported to act through aryl-hydrocarbon-receptor-related pathways to modulate mucosal homeostasis [28,29]. Similarly, the increased cholesterol glucuronide and the decreased 4-fumarylacetoacetate (a toxic intermediate of tyrosine catabolism) and pseudouridine 5′-phosphate levels are consistent with enhanced hepatic detoxification and reduced microbial autolytic stress [30,31,32]. It should be emphasized, however, that these pathway-level links are inferred from metabolite annotation and enrichment analysis; inflammatory markers, mucosal barrier integrity and AhR activity were not measured, and targeted assays are required to substantiate these interpretations. Cysteamine utilizes thiol groups to eliminate reactive oxygen species, alleviate the inhibition of oxidative stress by various key metabolic enzymes, stabilize rumen fermentation pH, reduce endotoxin release, and optimize the composition of beneficial bacterial microbiota [27]. GAA enhances the nitrogen utilization rate of the diet; mitigates the energy loss associated with amino acid stress decomposition; strengthens the tricarboxylic acid cycle and pentose phosphate pathway [33]; and supplies adequate carbon and nitrogen substrates [34] for the shikimate pathway, methylation modification, and nucleotide cycle. The compound additive functions synergistically to regulate homeostasis in dairy bulls by enhancing the antioxidant capacity of rumen microbiota, decreasing the accumulation of endogenous toxic metabolites, reducing mucosal inflammatory responses, and increasing rumen fermentation efficiency. This ultimately improves rumen health, enhances growth performance, and improves feed conversion efficiency in dairy bulls [35,36].
4.2. Influence of Rumen Fermentation Parameters
Co-supplementation increased the ruminal concentrations of acetic acid, propionic acid, butyric acid and total VFAs, with values rising numerically as the additive dose increased from 1 to 2 kg/t. Acetic acid, butyric acid and total VFAs increased extremely significantly (p < 0.01), propionic acid and MCP increased significantly (p < 0.05), and the A/P ratio declined numerically, whereas pH and NH3-N were unaffected. Because only two dose levels were tested, this apparent dose dependency should be regarded as descriptive rather than as evidence of a linear response.
VFAs are the principal energy-yielding products of ruminal carbohydrate fermentation, and their concentrations and proportions directly reflect the fermentation activity of rumen microorganisms and the extent of substrate degradation; they are therefore critical indicators of rumen fermentation function. The overall increase in VFAs observed here indicates that co-supplementation enhanced ruminal fermentation intensity, in agreement with earlier studies in which GAA and cysteamine were supplemented separately to fattening diets [37,38].
The marked increase in acetic acid was accompanied by changes in fibrolytic taxa: Ruminococcus, a cellulolytic genus positively correlated with acetic acid, tended to increase, whereas Xylanibacter, a xylan-degrading genus within the phylum Bacteroidetes, was numerically higher in Group B. Cellulose and hemicellulose degradation by such fibrolytic bacteria is a major source of ruminal acetate [39]. In addition, co-supplementation may improve the ruminal redox microenvironment and the activity of carbohydrate-degrading enzymes (e.g., cellulase and xylanase) of anaerobic fibrolytic bacteria [40], although neither antioxidant enzyme activities nor fibrolytic enzyme activities were measured in this study, so this explanation remains speculative.
The significant increase in propionic acid, together with the numerical decline in the A/P ratio, suggests a partial shift toward propionic-type fermentation. Cysteamine has been reported to promote propionate production by stimulating propionate-producing and polysaccharide-degrading bacteria, such as members of Prevotellaceae and Bacteroidetes [38]. In the present study, the genera most strongly and positively correlated with propionic acid were Weissella and Ruminococcus (Figure 10), whereas Xylanibacter and norank_f__Muribaculaceae, which are polysaccharide-utilizing members of the phylum Bacteroidetes that ferment starch and hemicellulose and have been associated with propionate formation [41], were not significantly correlated with propionic acid; their contribution therefore remains uncertain. A propionate-oriented fermentation pattern is generally considered energetically favorable in ruminants because propionic acid is the principal substrate for hepatic gluconeogenesis and its formation competes with methanogenesis for hydrogen, thereby improving dietary energy utilization and supporting growth performance [42]. Accordingly, the present shift toward propionic acid may enhance gluconeogenic substrate supply.
Butyric acid, the primary energy source for ruminal epithelial cells, increased extremely significantly. Under high-concentrate conditions associated with subacute ruminal acidosis, butyrate-producing taxa such as Christensenellaceae_R-7_group can be downregulated [43,44]. In the present study, the abundance of Christensenellaceae_R-7_group was unchanged, whereas butyric acid increased markedly, implying that other butyrate-producing lineages (e.g., the p-1088-a5_gut_group within Lachnospiraceae) may have contributed; these taxa were not further quantified.
MCP, a major source of absorbable protein for the host, increased significantly. Microbial protein synthesis depends on an adequate energy supply for microbial proliferation; therefore, the elevated ruminal VFAs concentrations observed here may have provided the energy required to support microbial growth and protein synthesis [45]. GAA has additionally been reported to improve nitrogen utilization and the efficiency of MCP synthesis by modulating nitrogen-metabolizing microbiota [37]. In the present study, NH3-N did not differ among groups despite the increased MCP, which may indicate improved capture of ruminal ammonia into microbial protein. Future nitrogen balance studies are warranted to validate this interpretation.
4.3. Correlation Analysis of Rumen Microbial Changes and Fermentation Parameters
The structure of the rumen microbial community influences fermentation pathways and composition of the final products derived from dietary carbohydrates and nitrogen-containing substances. Changes in the abundance of ruminal microbial taxa may therefore provide a basis for understanding how the additives modified ruminal fermentation patterns.
Xylanibacter is a prominent hemicellulose-degrading bacterium within the phylum Bacteroidetes that utilizes xylan, and Ruminococcus is a prevalent cellulolytic genus; both have been linked to fiber fermentation, and cobalamin-dependent pathways in ruminal bacteria such as Xylanibacter ruminicola that support propionate formation [46]. In the present study, Xylanibacter was not significantly altered overall but was numerically highest in Group B and was positively correlated with pH; Ruminococcus tended to increase and was positively correlated with acetic acid (Figure 10). These associations suggest that fibrolytic activity may have been moderately enhanced, but the weak statistical evidence precludes a firm conclusion about their contribution to the increased VFA production.
norank_f__Muribaculaceae is an uncultured lineage within the phylum Bacteroidetes that has been associated with the degradation of starch and non-structural polysaccharides and with propionate formation via the succinate pathway [47]. In this study, its abundance did not differ significantly among groups and was positively correlated with pH rather than with propionic acid. Although it was numerically higher in Group B and lower in Group C, propionic acid increased in both groups; this discrepancy may reflect the functional redundancy and complementarity of ruminal microbial metabolism, but it also indicates that Muribaculaceae was probably not the main driver of the propionic acid response.
Weissella is a facultative anaerobic lactic acid bacterium belonging to the phylum Firmicutes and represents a crucial probiotic group within the rumen. The notable differences observed among the experimental groups suggested that this bacterium was substantially enriched in response to the compound additive. The regulatory effects of cysteamine on the rumen environment and selective enrichment of the Weissella genus have been confirmed in breeding studies involving cashmere goats [48]. This category of lactic acid bacteria possesses robust antioxidant properties and exhibits antagonistic effects against pathogenic bacteria, thereby alleviating oxidative stress in the rumen. A comprehensive genomic study of Weissella derived from beef cattle demonstrated [49] that this bacterium competitively inhibited the colonization of harmful bacteria by secreting antibacterial substances. These results are consistent with a contribution of Weissella to the enhanced ruminal fermentation, although a causative role requires functional validation.
Methanobrevibacter is the predominant hydrogenotrophic methanogen in the rumen; methanogenesis consumes the hydrogen generated during fermentation and represents a dietary energy loss, and propionate formation is considered a competing hydrogen sink that can limit the substrate available to methanogens [50]. Methane-producing potential also differs among methanogenic lineages, and dietary treatments can selectively affect high-methane-producing strains [51]. In the present study, Methanobrevibacter abundance decreased and was negatively correlated with VFAs, MCP and NH3-N and positively correlated with the A/P ratio (Figure 10). Together with the increased propionate proportion, these observations suggest that the hydrogen available for methanogenesis may have been reduced. However, methane emissions were not directly measured; Methanobrevibacter is not the only methanogenic lineage in the rumen; and the propionate–methane relationship is not necessarily linear. The inferred potential to reduce methanogenesis and the associated dietary energy loss should therefore be confirmed by direct methane quantification in future studies.
This study has some limitations. First, the statistical analyses were based on three experimental units per treatment (n = 3 small pens), because rumen digesta could only be obtained at slaughter. One bull was selected from each small pen, so that the three rumen samples per treatment were independent of one another, and the selected bull was the one whose body weight was closest to the mean of its pen. Nevertheless, three experimental units per treatment provide limited statistical power to detect small or moderate differences, and the Shapiro–Wilk and Levene’s tests reported have limited diagnostic value for this sample size. All results are therefore interpreted as exploratory and hypothesis-generating, and non-significant outcomes are reported as “no difference detected, possibly reflecting limited statistical power” rather than as evidence of no effect. Second, rumen samples were obtained after slaughter; hence, dynamic changes in rumen fermentation and microbial communities during the trial period could not be monitored. Finally, methane emissions were not directly measured; therefore, the proposed reduction in methanogenesis was inferred from shifts in fermentation parameters and microbiota, rather than direct quantification. In addition, GAA and cysteamine were administered as a commercial compound additive, in which the active ingredients could not be separated from plant extracts, probiotics, vitamins, minerals and carrier materials. Consequently, differences between the two supplemented groups (1 and 2 kg/t) reflect the effect of increasing the supplementation level of the compound additive and cannot be attributed solely to GAA or cysteamine, because the additional load of plant extracts, probiotics, vitamins, minerals and carrier substances at the higher level may have independently influenced ruminal fermentation. Accordingly, future studies with larger sample sizes, repeated in vivo sampling, direct methane measurements, and factorial designs using purified individual additives or an appropriate carrier-only control are warranted to validate the current study findings.
5. Conclusions
The incorporation of a GAA–cysteamine compound additive into the diet can enhance rumen metabolic capacity in fattening cattle. Additionally, this dietary intervention may reduce inflammation and stress-related damage, optimize rumen fermentation functions, improve the internal environment, and promote overall rumen health.
Author Contributions
Y.H.: writing—original draft preparation, visualization, methodology, investigation, and data curation. Y.L.: writing—review and editing and supervision. Y.Z.: writing—review and editing, methodology, investigation, and formal analysis. X.W.: data curation. J.S. and W.L.: investigation and data curation. Z.H.: supervision, methodology, funding acquisition, and conceptualization. All authors have read and agreed to the published version of the manuscript.
Funding
This research received no external funding.
Institutional Review Board Statement
All animal procedures were reviewed and approved by the Laboratory Animals Welfare and Ethics Committee of Nanjing Agricultural University (Audit Number: NJAULLSC2025022; Approval date: 1 January 2025).
Informed Consent Statement
Not applicable.
Data Availability Statement
The raw sequence data reported in this paper have been deposited in the Genome Sequence Archive (Genomics, Proteomics & Bioinformatics 2025) in National Genomics Data Center (Nucleic Acids Res 2025), China National Center for Bioinformation/Beijing Institute of Genomics, Chinese Academy of Sciences (GSA: CRA049105), and are publicly accessible at https://ngdc.cncb.ac.cn/gsa (accessed on 30 August 2026).
Conflicts of Interest
The funders had no role in the design of the study; in the collection, analyses, or interpretation of data; in the writing of the manuscript; or in the decision to publish the results.
Abbreviations
The following abbreviations are used in this manuscript:
| GAA | guanidinoacetic acid |
| MCP | microbial crude protein |
| A/P | acetic acid/propionic acid |
| VFA | volatile fatty acid |
| NH3-N | NH3-N |
| KEGG | Kyoto Encyclopedia of Genes and Genomes |
| PCoA | principal coordinate analysis |
| LDA | linear discriminant analysis |
| LEfSe | linear discriminant analysis effect size |
References
- Jaborek, J.R.; Carvalho, P.H.V.; Felix, T.L. Post-weaning management of modern dairy cattle genetics for beef production: A review. J. Anim. Sci. 2023, 101, skac345. [Google Scholar] [CrossRef] [Scilit] [PubMed]
- Keto, L.; Manni, K.; Huuskonen, A. Effects of three different grass silage-based total mixed rations on meat quality of finishing Holstein and Nordic Red dairy bulls. Livest. Sci. 2024, 283, 105458. [Google Scholar] [CrossRef] [Scilit]
- Yan, Z.; Yan, Z.; Liu, S.; Yin, Y.; Yang, T.; Chen, Q. Regulative mechanism of guanidinoacetic acid on skeletal muscle development and its application prospects in animal husbandry: A review. Front. Nutr. 2021, 8, 714567. [Google Scholar] [CrossRef] [Scilit] [PubMed]
- Ostojic, S.M. Guanidinoacetic acid as a performance-enhancing agent. Amino Acids 2016, 48, 1867–1875. [Google Scholar] [CrossRef] [Scilit] [PubMed]
- Li, Z.; Liang, H.; Xin, J.; Xu, L.; Li, M.; Yu, H.; Zhang, W.; Ge, Y.; Li, Y.; Qu, M. Effects of dietary guanidinoacetic acid on the feed efficiency, blood measures, and meat quality of Jinjiang bulls. Front. Vet. Sci. 2021, 8, 684295. [Google Scholar] [CrossRef] [Scilit] [PubMed]
- Ardalan, M.; Miesner, M.D.; Reinhardt, C.D.; Thomson, D.U.; Armendariz, C.K.; Smith, J.S.; Titgemeyer, E.C. Effects of guanidinoacetic acid supplementation on nitrogen retention and methionine flux in cattle. J. Anim. Sci. 2021, 99, skab172. [Google Scholar] [CrossRef] [Scilit] [PubMed]
- Szabo, S.; Reichlin, S. Somatostatin in rat tissues is depleted by cysteamine administration. Endocrinology 1981, 109, 2255–2257. [Google Scholar] [CrossRef] [Scilit] [PubMed]
- Shokrollahi, B.; Fazli, A.; Morammazi, S.; Saadati, N.; Ahmad, H.I.; Hassan, F.U. Cysteamine administration in lambs grazing on mountain pastures: Effects on the body weight, antioxidant capacity, thyroid hormones and growth hormone secretion. Vet. Med. Sci. 2022, 8, 328–335. [Google Scholar] [CrossRef] [Scilit] [PubMed]
- Yaqoob, M.U.; Hou, J.; Zhe, L.; Qi, Y.; Wu, P.; Zhu, X. Coated cysteamine, a potential feed additive for ruminants—An updated review. Anim. Biosci. 2024, 37, 161–172. [Google Scholar] [CrossRef] [Scilit] [PubMed]
- Liu, C.; Wang, C.; Zhang, J.; Liu, Q.; Guo, G.; Huo, W.J.; Pei, C.X.; Chen, L.; Zhang, Y.L. Guanidinoacetic acid and betaine supplementation have positive effects on growth performance, nutrient digestion and rumen fermentation in Angus bulls. Anim. Feed Sci. Technol. 2021, 276, 114923. [Google Scholar] [CrossRef] [Scilit]
- Ren, G.; Hao, X.; Zhang, X.; Liu, S.; Zhang, J. Effects of guanidinoacetic acid and betaine on growth performance, energy and nitrogen metabolism, and rumen microbial protein synthesis in lambs. Anim. Feed Sci. Technol. 2022, 292, 115402. [Google Scholar] [CrossRef] [Scilit]
- Wei, Y.; Bu, Y.; Li, Y.; Wang, F.; Jafari, H.; Liu, L.; Luo, L.; Sui, X.; Lei, C.; Sun, F. Integrated transcriptomic and phenotypic analysis reveals tissue-specific regulatory effects of guanidinoacetic acid in cattle. BMC Genom. 2025, 26, 1033. [Google Scholar] [CrossRef] [Scilit] [PubMed]
- Zhang, S.; Zheng, N.; Zhao, S.; Wang, J. Allicin enhances urea-N conversion to microbial-N by inhibiting urease activity and modulating the rumen microbiome in cattle. Microbiome 2025, 13, 124. [Google Scholar] [CrossRef] [Scilit] [PubMed]
- NY/T 815-2004; Feeding Standard of Beef Cattle. China Agriculture Press: Beijing, China, 2004.
- Sumner, L.W.; Amberg, A.; Barrett, D.; Beale, M.H.; Beger, R.; Daykin, C.A.; Fan, T.W.; Fiehn, O.; Goodacre, R.; Griffin, J.L.; et al. Proposed minimum reporting standards for chemical analysis Chemical Analysis Working Group (CAWG) Metabolomics Standards Initiative (MSI). Metabolomics 2007, 3, 211–221. [Google Scholar] [CrossRef] [Scilit] [PubMed]
- Benjamini, Y.; Hochberg, Y. Controlling the false discovery rate: A practical and powerful approach to multiple testing. J. R. Stat. Soc. Ser. B (Methodol.) 1995, 57, 289–300. [Google Scholar] [CrossRef] [Scilit]
- Broadhurst, D.; Goodacre, R.; Reinke, S.N.; Kuligowski, J.; Wilson, I.D.; Lewis, M.R.; Dunn, W.B. Guidelines and considerations for the use of system suitability and quality control samples in mass spectrometry assays applied in untargeted clinical metabolomic studies. Metabolomics 2018, 14, 72. [Google Scholar] [CrossRef] [Scilit] [PubMed]
- Song, J.; Kong, G.; Wang, X.; Zhai, Y.; Wang, J.; Xu, J.; Li, C.; Liu, W.; Han, Y.; Han, Z. Dietary Hydroxy-Selenomethionine Improves Antioxidant Status and Reduces Somatic Cell Count in Dairy Cows: Multi-Omics Insights into Rumen Microbiota and Metabolic Profiles. Antioxidants 2026, 15, 813. [Google Scholar] [CrossRef] [Scilit] [PubMed]
- Bradford, M.M. A rapid and sensitive method for the quantitation of microgram quantities of protein utilizing the principle of protein-dye binding. Anal. Biochem. 1976, 72, 248–254. [Google Scholar] [CrossRef] [PubMed]
- Broderick, G.A.; Kang, J.H. Automated simultaneous determination of ammonia and total amino acids in ruminal fluid and in vitro media. J. Dairy Sci. 1980, 63, 64–75. [Google Scholar] [CrossRef] [Scilit] [PubMed]
- Erwin, E.S.; Marco, G.J.; Emery, E.M. Volatile fatty acid analyses of blood and rumen fluid by gas chromatography. J. Dairy Sci. 1961, 44, 1768–1771. [Google Scholar] [CrossRef] [Scilit]
- Caporaso, J.G.; Kuczynski, J.; Stombaugh, J.; Bittinger, K.; Bushman, F.D.; Costello, E.K.; Fierer, N.; Peña, A.G.; Goodrich, J.K.; Gordon, J.I.; et al. QIIME allows analysis of high-throughput community sequencing data. Nat. Methods 2010, 7, 335–336. [Google Scholar] [CrossRef] [Scilit] [PubMed]
- Chen, S.; Zhou, Y.; Chen, Y.; Gu, J. fastp: An ultra-fast all-in-one FASTQ preprocessor. Bioinformatics 2018, 34, i884–i890. [Google Scholar] [CrossRef] [Scilit] [PubMed]
- Schloss, P.D.; Westcott, S.L.; Ryabin, T.; Hall, J.R.; Hartmann, M.; Hollister, E.B.; Lesniewski, R.A.; Oakley, B.B.; Parks, D.H.; Robinson, C.J.; et al. Introducing mothur: Open-source, platform-independent, community-supported software for describing and comparing microbial communities. Appl. Environ. Microbiol. 2009, 75, 7537–7541. [Google Scholar] [CrossRef] [Scilit] [PubMed]
- Segata, N.; Izard, J.; Waldron, L.; Gevers, D.; Miropolsky, L.; Garrett, W.S.; Huttenhower, C. Metagenomic biomarker discovery and explanation. Genome Biol. 2011, 12, R60. [Google Scholar] [CrossRef] [Scilit] [PubMed]
- Metwally, R.A.; El-Sersy, N.A.; El Sikaily, A.E.; Sabry, S.A.; Ghozlan, H.A. Vitamin K (menaquinone) from marine Kocuria sp. RAM1: Optimization, characterization and potential in vitro biological activities. Microb. Cell Fact. 2025, 24, 132. [Google Scholar] [CrossRef] [Scilit] [PubMed]
- Wu, Q.; Chen, H.; Zhang, F.; Wang, W.; Xiong, F.; Liu, Y.; Lv, L.; Li, W.; Bo, Y.; Yang, H. Cysteamine supplementation in vitro remarkably promoted rumen fermentation efficiency towards propionate production via Prevotella enrichment and enhancing antioxidant capacity. Antioxidants 2022, 11, 2233. [Google Scholar] [CrossRef] [Scilit] [PubMed]
- Shang, H.; Huang, C.; Xiao, Z.; Yang, P.; Zhang, S.; Hou, X.; Zhang, L. Gut microbiota-derived tryptophan metabolites alleviate liver injury via AhR/Nrf2 activation in pyrrolizidine alkaloids-induced sinusoidal obstruction syndrome. Cell Biosci. 2023, 13, 127. [Google Scholar] [CrossRef] [Scilit] [PubMed]
- Xue, C.; Li, G.; Zheng, Q.; Gu, X.; Shi, Q.; Su, Y.; Chu, Q.; Yuan, X.; Bao, Z.; Lu, J.; et al. Tryptophan metabolism in health and disease. Cell Metab. 2023, 35, 1304–1326. [Google Scholar] [CrossRef] [Scilit] [PubMed]
- Tukey, R.H.; Strassburg, C.P. Human UDP-glucuronosyltransferases: Metabolism, expression, and disease. Annu. Rev. Pharmacol. Toxicol. 2000, 40, 581–616. [Google Scholar] [CrossRef] [Scilit] [PubMed]
- Kubo, S.; Sun, M.; Miyahara, M.; Umeyama, K.; Urakami, K.; Yamamoto, T.; Jakobs, C.; Matsuda, I.; Endo, F. Hepatocyte injury in tyrosinemia type 1 is induced by fumarylacetoacetate and is inhibited by caspase inhibitors. Proc. Natl. Acad. Sci. USA 1998, 95, 9552–9557. [Google Scholar] [CrossRef] [Scilit] [PubMed]
- Xu, L.; Shen, S.; Zhang, Y.; Guo, Z.; Lu, B.; Huang, J.; Li, R.; Shen, Y.; Zhang, L.S.; Deng, X. Quantitative RNA pseudouridine landscape reveals dynamic modification patterns and evolutionary conservation across bacterial species. Elife 2026, 14, RP107545. [Google Scholar] [CrossRef] [PubMed]
- Yi, S.; Hu, S.; Wang, J.; Abudukelimu, A.; Wang, Y.; Li, X.; Wu, H.; Meng, Q.; Zhou, Z. Effect of guanidinoacetic acid supplementation on growth performance, rumen fermentation, blood indices, nutrient digestion, and nitrogen metabolism in Angus steers. Animals 2024, 14, 401. [Google Scholar] [CrossRef] [Scilit] [PubMed]
- Dong, C.; Wei, M.; Ju, J.; Du, L.; Zhang, R.; Xiao, M.; Zheng, Y.; Bao, H.; Bao, M. Effects of guanidinoacetic acid on in vitro rumen fermentation and microflora structure and predicted gene function. Front. Microbiol. 2024, 14, 1285466. [Google Scholar] [CrossRef] [Scilit] [PubMed]
- Meenongyai, W.; Wongpanit, K.; Khejornsart, P.; Phongkaew, P.; Traithilen, U.; Waramit, N.; Helali, M.M.H.; Shimul, A.I.; Mamun, A.A. Effects of varying levels of coated cysteamine hydrochloride in diet on growth performance and carcass quality of steers. Anim. Biosci. 2025, 38, 2136–2148. [Google Scholar] [CrossRef] [Scilit] [PubMed]
- Eckhardt, E.P.; Kim, W.; Jaborek, J.; Garmyn, A.J.; Kang, D.; Kim, J. Evaluation of guanidinoacetic acid supplementation on finishing beef steer growth performance, skeletal muscle cellular response, and carcass characteristics. J. Anim. Sci. 2024, 102, skae337. [Google Scholar] [CrossRef] [Scilit] [PubMed]
- Speer, H.F.; Pearl, K.A.; Titgemeyer, E.C. Relative bioavailability of guanidinoacetic acid delivered ruminally or abomasally to cattle. J. Anim. Sci. 2020, 98, skaa282. [Google Scholar] [CrossRef] [Scilit] [PubMed]
- Wu, Q.C.; Wang, W.K.; Zhang, F.; Li, W.J.; Wang, Y.L.; Lv, L.K.; Yang, H.J. Dietary cysteamine supplementation remarkably increased feed efficiency and shifted rumen fermentation toward glucogenic propionate production via enrichment of Prevotella in feedlot lambs. Microorganisms 2022, 10, 1105. [Google Scholar] [CrossRef] [Scilit] [PubMed]
- Firkins, J.L.; Henderson, E.L.; Duan, H.; Pope, P.B. International symposium on ruminant physiology: Current perspective on rumen microbial ecology to improve fiber digestibility. J. Dairy Sci. 2025, 108, 7511–7529. [Google Scholar] [CrossRef] [Scilit] [PubMed]
- Li, W.; Cui, Z.; Jiang, Y.; Aisikaer, A.; Wu, Q.; Zhang, F.; Wang, W.; Bo, Y.; Yang, H. Dietary guanidine acetic acid improves ruminal antioxidant capacity and alters rumen fermentation and microflora in rapid-growing lambs. Antioxidants 2023, 12, 772. [Google Scholar] [CrossRef] [Scilit] [PubMed]
- Gorji, A.E.; Xue, B.; Yan, T.; Sadkowski, T.; Chen, X.; Cristóbal-Carballo, O.; Morrison, S.; Razban, V.; Smith, L.; Stergiadis, S.; et al. Apple pomace and hempseed cake can reduce methane intensity (CH4/DMI) and alter the rumen microbiome in dairy cows: A shotgun metagenomic approach. J. Anim. Sci. Biotechnol. 2026, 17, 128. [Google Scholar] [CrossRef] [Scilit] [PubMed]
- Fonseca, P.A.S.; Lam, S.; Chen, Y.; Waters, S.M.; Guan, L.L.; Cánovas, A. Multi-breed host rumen epithelium transcriptome and microbiome associations and their relationship with beef cattle feed efficiency. Sci. Rep. 2023, 13, 16209. [Google Scholar] [CrossRef] [Scilit] [PubMed]
- Zhen, Y.; Xi, Z.; Nasr, S.M.; He, F.; Han, M.; Yin, J.; Ge, L.; Chen, Y.; Wang, Y.; Wei, W.; et al. Multi-omics reveals the impact of exogenous short-chain fatty acid infusion on rumen homeostasis: Insights into crosstalk between the microbiome and the epithelium in a goat model. Microbiol. Spectr. 2023, 11, e0534322. [Google Scholar] [CrossRef] [Scilit] [PubMed]
- Mu, Y.; Qi, W.; Zhang, T.; Zhang, J.; Mao, S. Multi-omics analysis revealed coordinated responses of rumen microbiome and epithelium to high-grain-induced subacute rumen acidosis in lactating dairy cows. mSystems 2022, 7, e0149021. [Google Scholar] [CrossRef] [Scilit] [PubMed]
- Seo, J.K.; Kim, M.H.; Yang, J.Y.; Kim, H.J.; Lee, C.H.; Kim, K.H.; Ha, J.K. Effects of synchronicity of carbohydrate and protein degradation on rumen fermentation characteristics and microbial protein synthesis. Asian-Australas. J. Anim. Sci. 2013, 26, 358–365. [Google Scholar] [CrossRef] [Scilit] [PubMed]
- Mahoney-Kurpe, S.C.; Palevich, N.; Gagic, D.; Biggs, P.J.; Reid, P.M.; Altshuler, I.; Pope, P.B.; Attwood, G.T.; Moon, C.D. Transcriptomic and proteomic changes associated with cobalamin-dependent propionate production by the rumen bacterium Xylanibacter ruminicola. mSystems 2024, 9, e0086424. [Google Scholar] [CrossRef] [Scilit] [PubMed]
- Facchin, S.; Calgaro, M.; Savarino, E.V. Rethinking short-chain fatty acids: A closer look at propionate in inflammation, metabolism, and mucosal homeostasis. Cells 2025, 14, 1130. [Google Scholar] [CrossRef] [Scilit] [PubMed]
- Wu, T.; Liang, J.; Wang, T.; Zhao, R.; Ma, Y.; Gao, Y.; Zhao, S.; Chen, G.; Liu, B. Cysteamine-supplemented diet for cashmere goats: A potential strategy to inhibit rumen biohydrogenation and enhance plasma antioxidant capacity. Front. Vet. Sci. 2022, 9, 997091. [Google Scholar] [CrossRef] [Scilit] [PubMed]
- Lee, M.G.; Yum, S.Y.; Gim, G.M.; Eom, K.H.; Jin, D.Y. Genomic and phenotypic analysis of Weissella cibaria LB13201 and LB13206 isolated from Hanwoo (native Korean cattle) with antimicrobial and anti-inflammatory properties. Front. Microbiol. 2026, 17, 1674601. [Google Scholar] [CrossRef] [Scilit] [PubMed]
- Wang, K.; Xiong, B.; Zhao, X. Could propionate formation be used to reduce enteric methane emission in ruminants? Sci. Total Environ. 2023, 855, 158867. [Google Scholar] [CrossRef] [Scilit] [PubMed]
- Tapio, I.; Snelling, T.J.; Strozzi, F.; Wallace, R.J. The ruminal microbiome associated with methane emissions from ruminant livestock. J. Anim. Sci. Biotechnol. 2017, 8, 7. [Google Scholar] [CrossRef] [Scilit] [PubMed]

Disclaimer/Publisher’s Note: The statements, opinions and data contained in all publications are solely those of the individual author(s) and contributor(s) and not of MDPI and/or the editor(s). MDPI and/or the editor(s) disclaim responsibility for any injury to people or property resulting from any ideas, methods, instructions or products referred to in the content. |
© 2026 by the authors. Licensee MDPI, Basel, Switzerland. This article is an open access article distributed under the terms and conditions of the Creative Commons Attribution (CC BY) license.