


Error in Figure
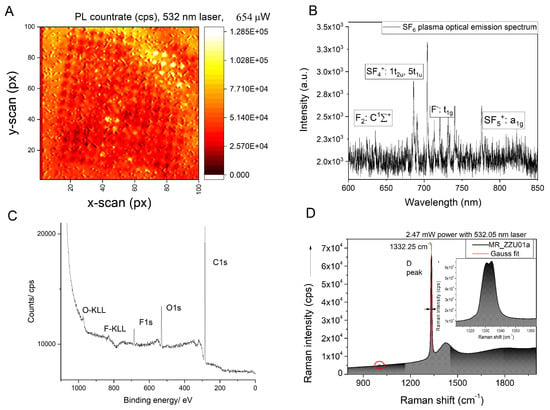
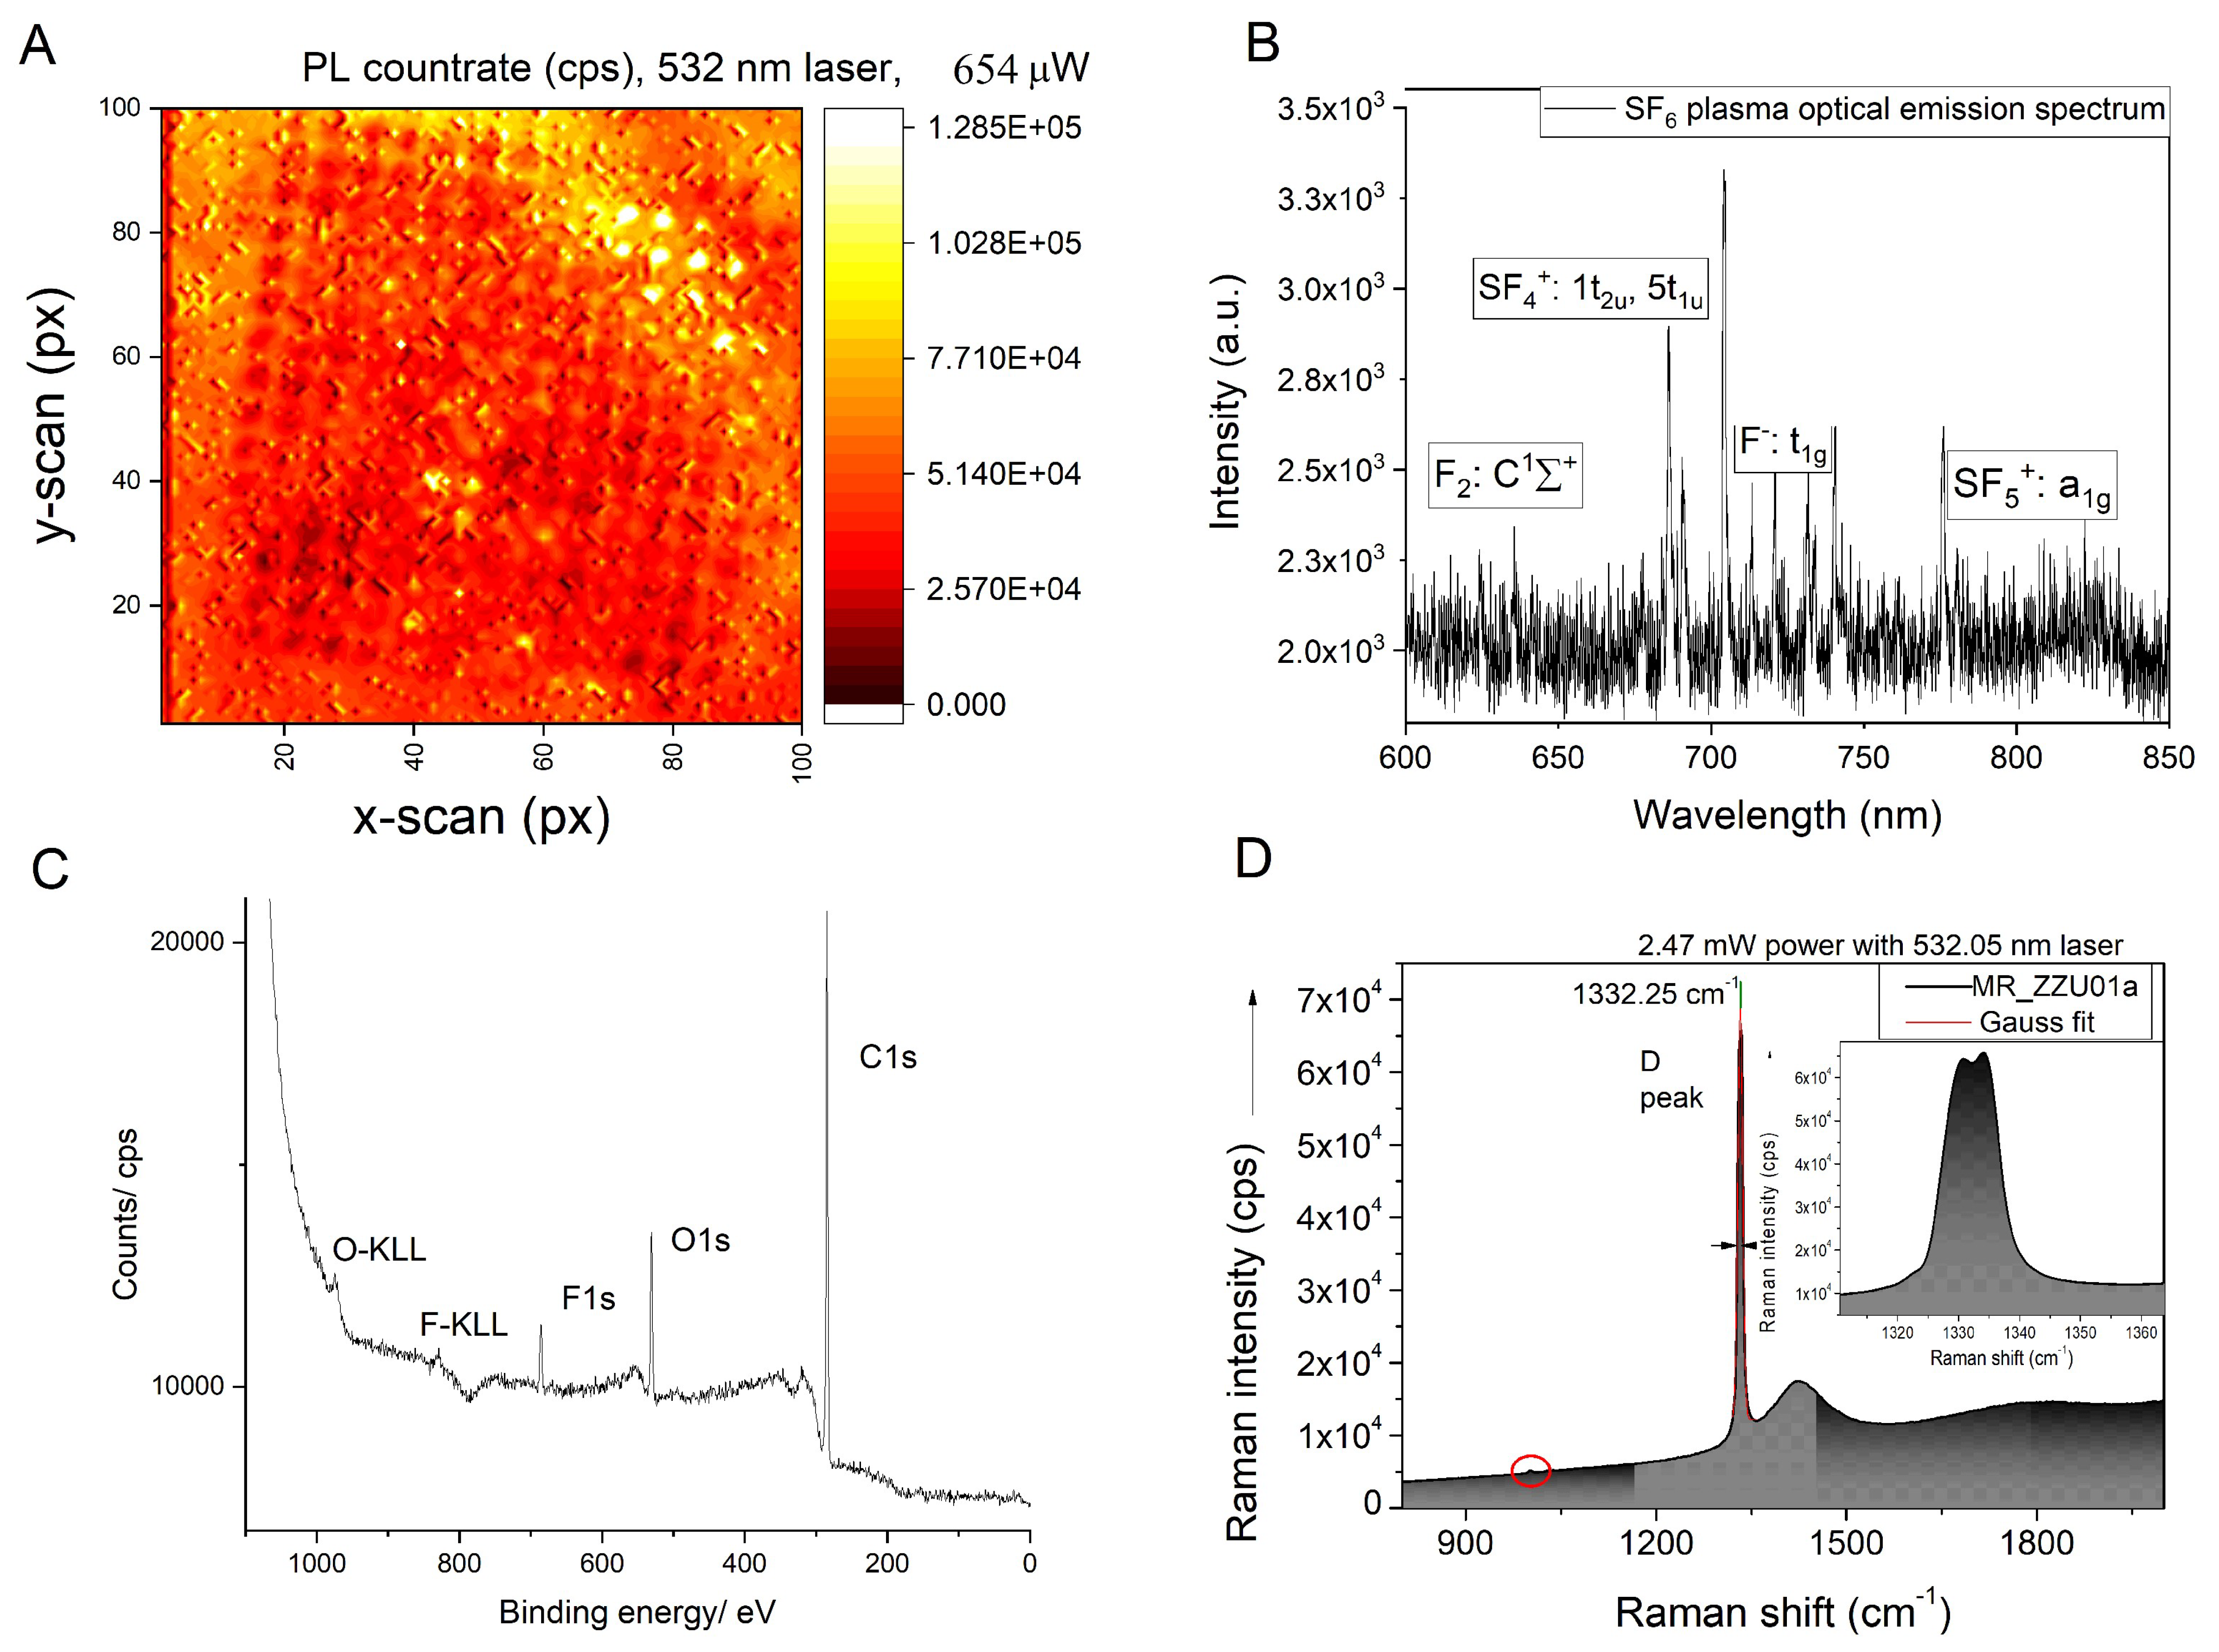
The authors would like to update the XPS spectrum in Figure 3c. In the original article [1], wrong data is mistakenly displayed in Figure 3c. The corrected Figure 3 appears below and shows the correct XPS data, also proving the presence of fluorine on the surface after the plasma treatment of the diamond. Therefore, the conclusions drawn in the original article are not affected by the error. The authors would like to apologize for this mistake. The original publication has also been updated.
Figure 3.
(A) Photoluminescence scan of nanopillars etched into diamond after 0 V bias plasma fluorination. The pillars were partially covered with single crystal quartz plate in order to shield them from the influence of plasma. Such an approach allows quantification of the fluorine termination on negatively charged nitroogen vacancies. An effect of photoluminescence quenching is clearly visible. (B) Optical emission spectrum of 0 V bias SF6 used to fluorinate the diamond with respective transitions. (C) XPS spectrum of the plasma-fluorinated CVD-grown diamond. (D) Dedicated Raman spectrum showing splitting of D-band due to the growth-induced stress, which serves as a proof for lack of underetching.
Reference
- Radtke, M.; Slablab, A.; Van Vlierberghe, S.; Lin, C.-N.; Lu, Y.-J.; Shan, C.-X. Plasma Treatments and Light Extraction from Fluorinated CVD-Grown (400) Single Crystal Diamond Nanopillars. C 2020, 6, 37. [Google Scholar] [CrossRef] [Scilit]
Publisher’s Note: MDPI stays neutral with regard to jurisdictional claims in published maps and institutional affiliations. |
© 2022 by the authors. Licensee MDPI, Basel, Switzerland. This article is an open access article distributed under the terms and conditions of the Creative Commons Attribution (CC BY) license (https://creativecommons.org/licenses/by/4.0/).