Article

Easy and Low-Cost Method for Synthesis of Carbon–Silica Composite from Vinasse and Study of Ibuprofen Removal

by
Yuvarat Ngernyen
1,*,
Thitipong Siriketh
2,
Kritsada Manyuen
2,
Panta Thawngen
2,
Wipha Rodtoem
2,
Kritiyaporn Wannuea
2,
Jesper T. N. Knijnenburg
3 and
Supattra Budsaereechai
4,*
1
Biomass & Bioenergy Research Laboratory, Department of Chemical Engineering, Faculty of Engineering, Khon Kaen University, Khon Kaen 40002, Thailand
2
Lahan Sai Ratchadaphisek School, Lahansai District, Buri Ram 31170, Thailand
3
Biodiversity and Environmental Management Division, International College, Khon Kaen University, Khon Kaen 40002, Thailand
4
Department of Mechanical Engineering, Faculty of Engineering and Industrial Technology, Chaiyaphum Rajabhat University, Chaiyaphum 36000, Thailand
*
Authors to whom correspondence should be addressed.
Submission received: 11 September 2022 / Revised: 29 September 2022 / Accepted: 3 October 2022 / Published: 7 October 2022

Abstract

:
Vinasse was successfully utilized to synthesize carbon–silica composite with a low-cost silica source available in Thailand (sodium silicate, Na2SiO3) and most commonly used source, tetraethyl orthosilicate (TEOS). The composites were prepared by a simple one-step sol–gel process by varying the vinasse (as carbon source) to silica source (Na2SiO3 or TEOS) weight ratio. The resulting composites were characterized by N2 adsorption, moisture and ash contents, pH, pHpzc, bulk density, Fourier transform infrared spectroscopy (FTIR), thermogravimetric analysis (TGA) and scanning electron microscopy-energy dispersive X-ray analysis (SEM-EDX). The composites had highest surface area of 313 and 456 m2/g, with average mesopore diameters of 5.00 and 2.62 nm when using Na2SiO3 and TEOS as the silica sources, respectively. The adsorption of a non-steroidal anti-inflammatory drug, ibuprofen, was investigated. The contact time to reach equilibrium was 60 min for both composites. The adsorption kinetics were fitted by a pseudo-second-order model with the correlation coefficient R2 > 0.997. The adsorption isotherms were well described by the Langmuir model (R2 > 0.992), which indicates monolayer adsorption. The maximal adsorption capacities of the Na2SiO3- and TEOS-based composites were as high as 406 and 418 mg/g at pH 2, respectively. The research results indicate that vinasse and a low-cost silica source (Na2SiO3) show great potential to synthesize adsorbents through a simple method with high efficiency.

1. Introduction

Nonsteroidal anti-inflammatory drugs (NSAIDs) represent one of the most widely used pharmaceutical products available without prescription. Ibuprofen (IBP) (Figure 1) is one of the most commonly and widely used NSAIDs in the treatment of fever, muscle pain and inflammation [1]. IBP is released into the environment through hospital and medical effluents, pharmaceutical wastewater and veterinary use [1]. NSAIDs become a great threat to aquatic ecosystems when left untreated before being discharged into the environment. Due to the inhibition of NSAIDs on microbial growth, it is difficult to treat them using anaerobic and aerobic sewage treatment [2]. Among many treatment techniques, adsorption is a simple and practical method. Many types of solid adsorbents are available and mesoporous materials are particularly attractive in the pharmaceutical field due to their large pore diameter, high thermal stability and high surface area as well as large pore volume [3,4].
Mesoporous carbon–silica composites are materials that can combine the beneficial properties of carbon and silica, resulting in high surface area, high porosity, chemical stability and high conductivity [5]. They can be used in many applications, such as adsorbents, insulation materials, lithium-ion battery anode materials and biosensors [6]. Carbon–silica composites can be derived from many carbon and silica sources, for example, resorcinol–formaldehyde [5], sucrose [7], furfuryl alcohol [7], activated carbon [8], tetraethyl orthosilicate (TEOS) [5,8] and mesoporous silica MCM-41 [7]. However, these chemicals have a high cost in Thailand. This motivated us to use waste from industry and a low-cost chemical to synthesize carbon–silica composites.
Wu et al. [6] reviewed that there are three methods to synthesize carbon–silica composites: hybrid pyrolysis carbonization, hydrothermal carbonization and sol–gel method. The first method involves the pyrolysis of organic precursors followed by carbonization to obtain carbonaceous residues with high carbon content. During the preparation process, the carbon precursor is homogeneously mixed with the silica material that retains a relatively rigid structure during the carbonization process due to its high melting point. As the pyrolytic carbonization is completed, the two components (carbon and silica) will be closely combined to form a carbon–silica composite. Typical pyrolysis temperatures used in the literature are 800–850 °C. Secondly, the hydrothermal carbonization process takes place in aqueous solution in a closed vessel at a moderate temperature of 180–250 °C and high pressure of 2–10 MPa. The carbon and silica precursors are fully mixed in an aqueous solution, transferred into a high-pressure reactor for hydrothermal reaction and, finally, a carbon–silica composite is obtained. Finally, the sol–gel method provides a suitable route to combine the organic and inorganic compounds into a homogeneous hybrid in a chemically linking or physically mixing state. This process can be generally described in five steps: hydrolysis, polycondensation, aging, drying and thermal decomposition. The catalysts used in the literature for hydrolysis reaction are formic acid, hydrochloric acid and nitric acid, while ethylenediamine, ammonia water and ammonium hydroxide are used as catalysts for the polycondensation reaction [6].
In this study, vinasse, a by-product from ethanol production, was used as carbon source and locally produced sodium silicate (Na2SiO3) as well as TEOS were used as silica sources. Carbon–silica composites were synthesized via sol–gel method without using high-temperature processing and catalyst for polycondensation, instead utilizing a hydrolysis procedure with sulfuric acid. It is important to note that the cost of Na2SiO3 was USD 0.68 per liter while TEOS costs as much as USD 132 per liter, which is a difference in cost by a factor of almost 200. Moreover, to the best of our knowledge, vinasse has not been previously used as a carbon source to synthesize carbon–silica composite, apart from our previous work that used a heating process at 85 °C [9]. Various techniques were used to study the morphology and surface properties of the composites and the adsorption behavior for IBP was evaluated.

2. Materials and Methods

2.1. Materials

Vinasse was collected from Mitr Phol Bio Fuel Plant (Phukhieo), Chaiyaphum province, Thailand. The major components of sugarcane vinasse are typically sugars (15.7% C), acids (13.1% C), alcohols (0.8% C) and amino acids [10]. TEOS (C8H20O4Si, 99.0%) was purchased from Sigma-Aldrich (St. Louis, MO, USA). Sulfuric acid (H2SO4, 98%) and hydrochloric acid (HCl, 37%) were purchased from ANaPURE (New Zealand) and NaOH from LOBA Chemie (Maharashtra, India). Sodium chloride (NaCl) was acquired from RCI Labscan (Bangkok, Thailand). Ibuprofen (C13H18O2, 98%) was purchased from Sigma-Aldrich. All chemicals and reagents described above were of analytical grade and were used without any further purification. Sodium silicate (Na2SiO3) was locally produced by C. Thai Chemicals (Samutsakhon, Thailand).

2.2. Carbon–silica Composite Synthesis

The simple method to synthesize the carbon–silica composites (CSCs) was as follows: first, vinasse was mixed with 50% H2SO4 (volume ratio 1:2) to make the carbon source. In contrast to previous studies where concentrated H2SO4 was used [11,12], we used a lower H2SO4 concentration to reduce cost. Second, a fixed amount of 5 g silica source (either Na2SiO3 or TEOS) was mixed into the carbon source. The mixture was stirred at room temperature for 6 h. Finally, the sample was washed several times with distilled water until the pH of the washed water was equal to the pH of the starting distilled water, followed by drying at 130 °C for 3 h in an oven. The amount of vinasse was varied from 5 to 100 g to study the effect of vinasse:silica source between 1:1 to 20:1 by weight. The yield of the CSCs was calculated from the weight of the obtained composite divided by the sum of vinasse weight and silica source weight.

2.3. Materials Characterization

Surface area and pore volume analysis was conducted on a Micromeritics ASAP 2460 volumetric gas adsorption apparatus using N2 as gas adsorbate at 77 K. Before gas adsorption measurements, the composites were outgassed under vacuum at 150 °C until the pressure was <100 mTorr. Surface area (SBET) and micropore volume (Vmic) were determined by applying Brunauer–Emmet–Teller (BET) and Dubinin–Radushkevich (DR) methods, respectively. The total pore volume (VT) and average pore size (DP) were determined at P/P° (U+b0) = 0.99 and Barrett–Joyner–Halenda (BJH) method of the desorption branch. Finally, the mesopore volume (Vmeso) was found from the difference between total pore volume and micropore volume.
To determine the moisture content, 1 g of composite was heated in an oven at 150 °C for 3 h. The moisture content was calculated from the weight loss during heating divided by the initial sample weight. The ash content of the composites was determined by heating the sample in a muffle furnace at 800 °C for 2 h. After heating, the sample was placed in a desiccator for cooling and was subsequently weighed to determine the ash content. The bulk density was determined by filling a 10 mL measuring cylinder with each composite and dividing the sample weight by the volume of the measuring cylinder. The cylinder was carefully tapped during filling to ensure that no voids were created.
The pH of the composites was determined by adding 1 g of sample into 100 mL hot distilled water followed by boiling for 5 min. Then, 100 mL of distilled water was added to the mixture and was left to cool down to room temperature. The pH of the solution was measured using a digital pH meter (OHAUS, ST3100-F). The point of zero charge of the composites (pHpzc) was determined by the pH drift method. This method consisted of preparing six 0.01 M NaCl solutions with initial pH values between 2 and 12 by adjusting with 0.1 M NaOH or HCl. Then, 0.15 g of composite was added to 50 mL of each solution and the mixture was shaken by using orbital shaker (GALLENKAMP) for 48 h and filtered. The final pH of each filtrate was measured using a digital pH meter and plotted against the initial pH. The pHpzc point was determined at the point where pHfinal was equal to pHinitial.
The surface functional groups of the synthesized composites were analyzed by Fourier Transform Infrared Spectroscopy (FTIR, Bruker, ALPHA II, Billercia, MA, USA) using ATR accessory with diamond crystal. The thermal stability was studied using a thermogravimetric analyzer (TGA, Shimadzu, DTG-60H, Kyoto, Japan). The TGA analysis was carried out in both nitrogen and air atmosphere at a flow rate of 40 mL/min and the samples were heated from room temperature to 950 °C at a heating rate of 10 °C/min. The surface morphology of the composites was investigated by Scanning Electron Microscope-Energy Dispersive X-ray Spectroscopy (SEM-EDX, FEI, Helios NanoLab G3 CX, Hillsboro, OR, USA). The samples were sputter coated with gold prior to analysis.

2.4. Adsorption of Ibuprofen

The adsorption experiments were performed using batch mode at room temperature. A stock solution of IBP (100 mg/L) containing 10% v of ethanol (95%) in order to increase the IBP solubility was diluted with distilled water to various concentrations. The absorbance of the IBP solution was measured using a UV-Vis spectrophotometer (Analytik Jena AG, Jena, Germany) at 222 nm.
The contact time was varied from 5 to 300 min with adsorbent dosage of 0.01 g/50 mL of IBP solution and initial IBP concentration of 30 mg/L. The influence of pH was studied from 2 to 12 with IBP concentration 30 mg/L at equilibrium time obtained from the adsorption time experiment. Here, 0.1 M HCl or NaOH was used to adjust the solution pH. To determine the equilibrium isotherm, adsorption tests were carried out by varying the initial IBP concentration from 5 to 100 mg/L with equilibrium time and optimum pH obtained from above experiments. The amount of IBP adsorbed (q, mg/g) was calculated from the following equation:
q = ( C o C t ) V m
where Co is the initial concentration of IBP solution (mg/L), Ct is the concentration of IBP at any time t, V is the volume of IBP solution (L) and m is the mass of composites used in the experiment (g).

3. Results

3.1. Characterization of Carbon–silica Composite

3.1.1. Specific Surface Area of Composites under Different Ratio

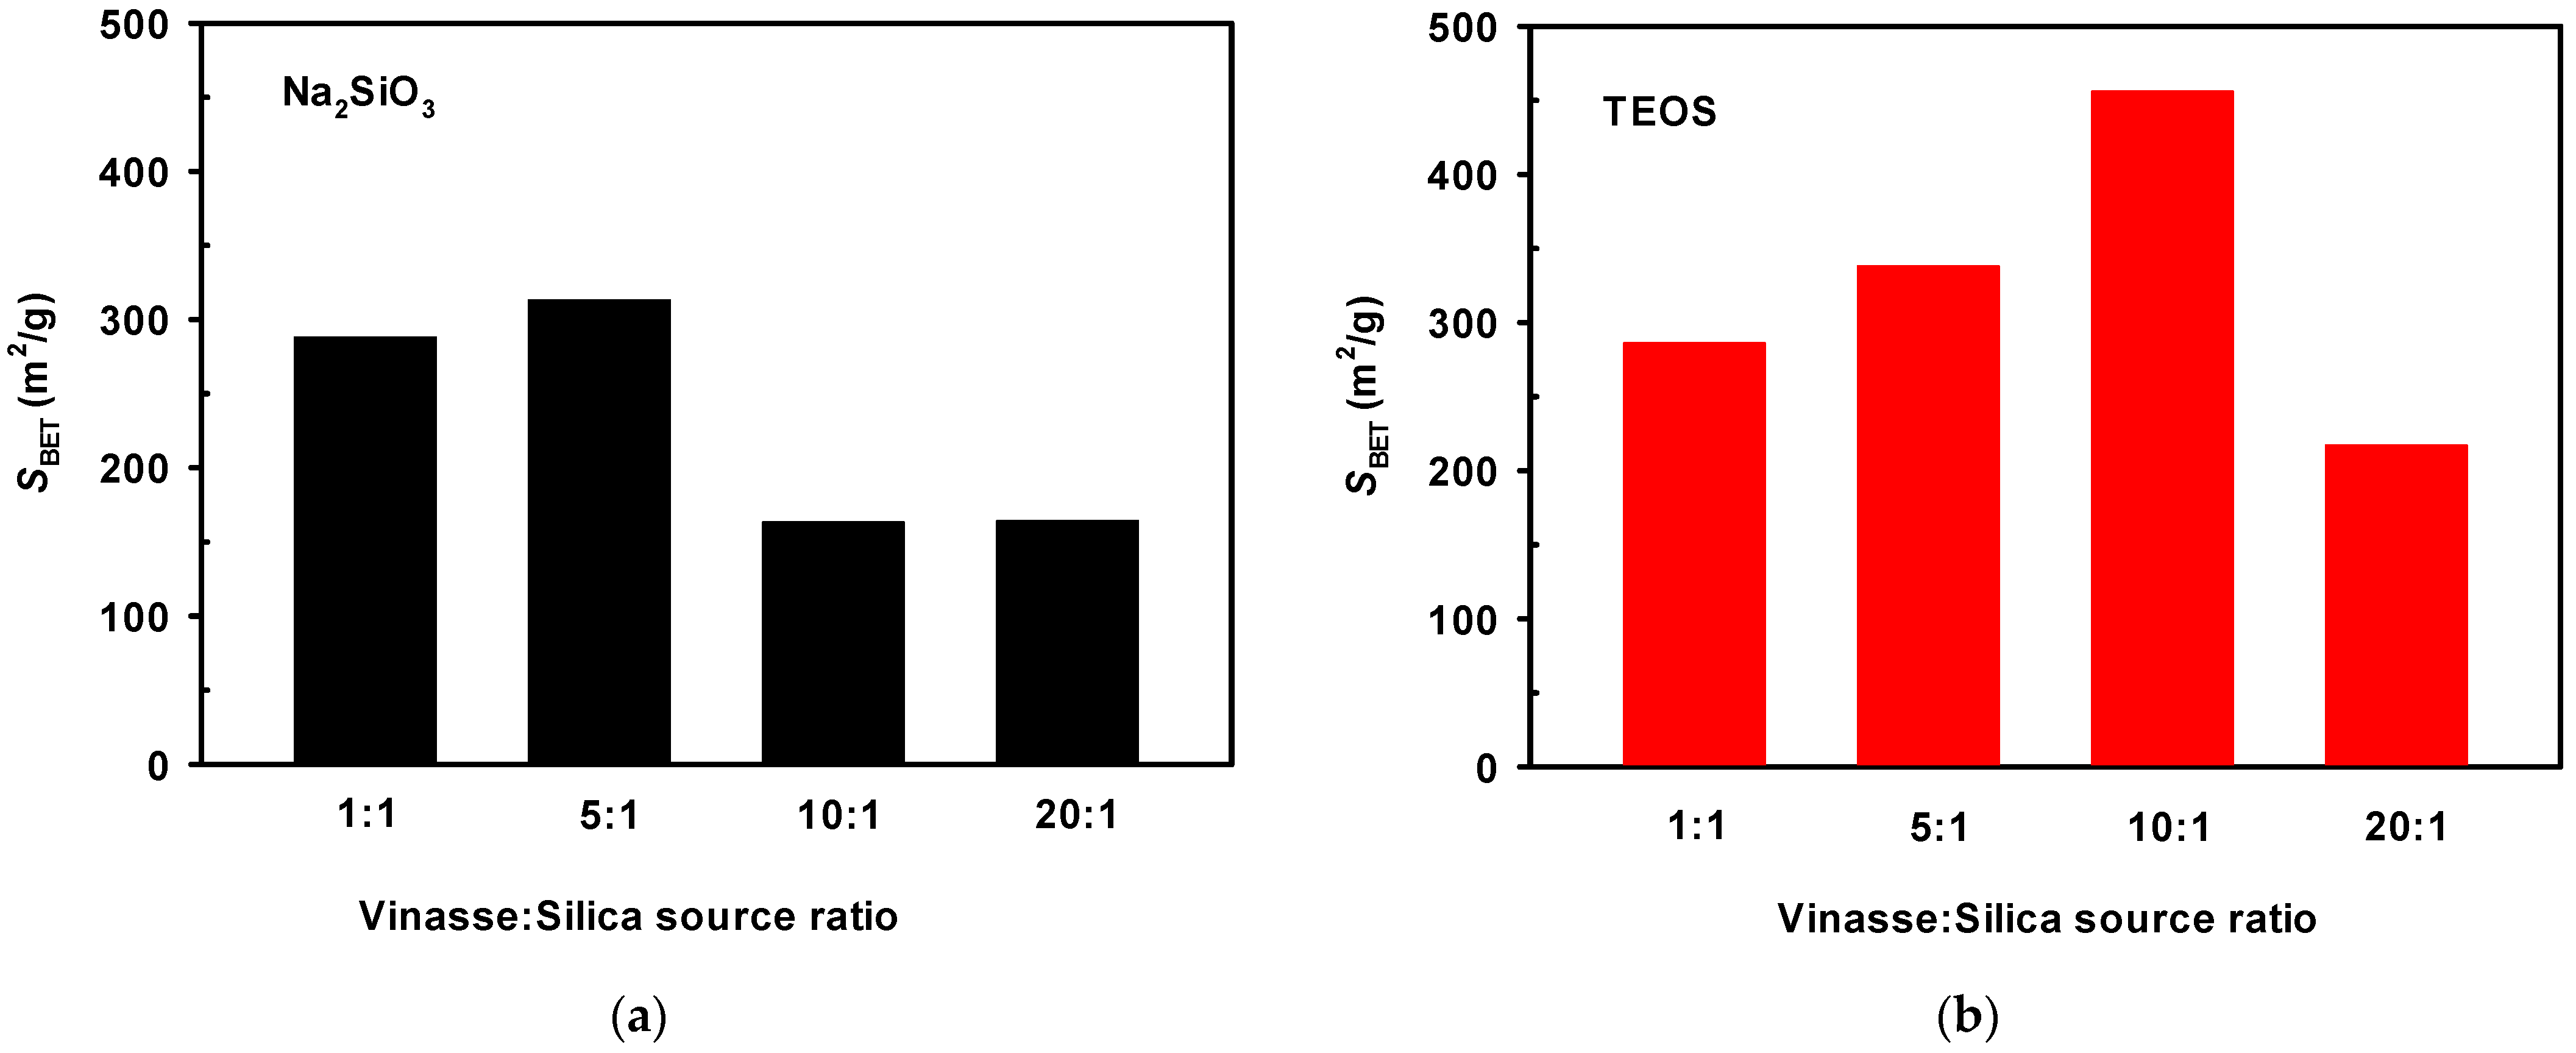
The effect of vinasse:silica source ratio on the specific surface area of the CSCs was investigated and the results are shown in Figure 2. It is important to note that a solid material could not be synthesized when using only a silica source, while using only vinasse resulted in a solid with very low surface area of 0.35 m2/g. When adding increasing amounts of silica source (i.e., for higher vinasse:silica source ratios), an increase in surface area of CSCs was observed for both silica sources (Na2SiO3 and TEOS). While the vinasse did not contain any structure directing agent, the H2SO4 treatment of vinasse in the gel mixture acted as a structure directing agent and its further interaction with silica species facilitated the formation of a porous structure. After reaching an optimum, the surface area decreased with a further increase in the source ratio. The highest surface areas were obtained at vinasse:silica source ratios of 5:1 and 10:1 when using Na2SiO3 and TEOS, respectively. At these optimal conditions, the composites prepared from Na2SiO3 and TEOS were assigned as CSC_Na and CSC_TEOS, respectively. The other porous properties of these composites are discussed in more detail below.
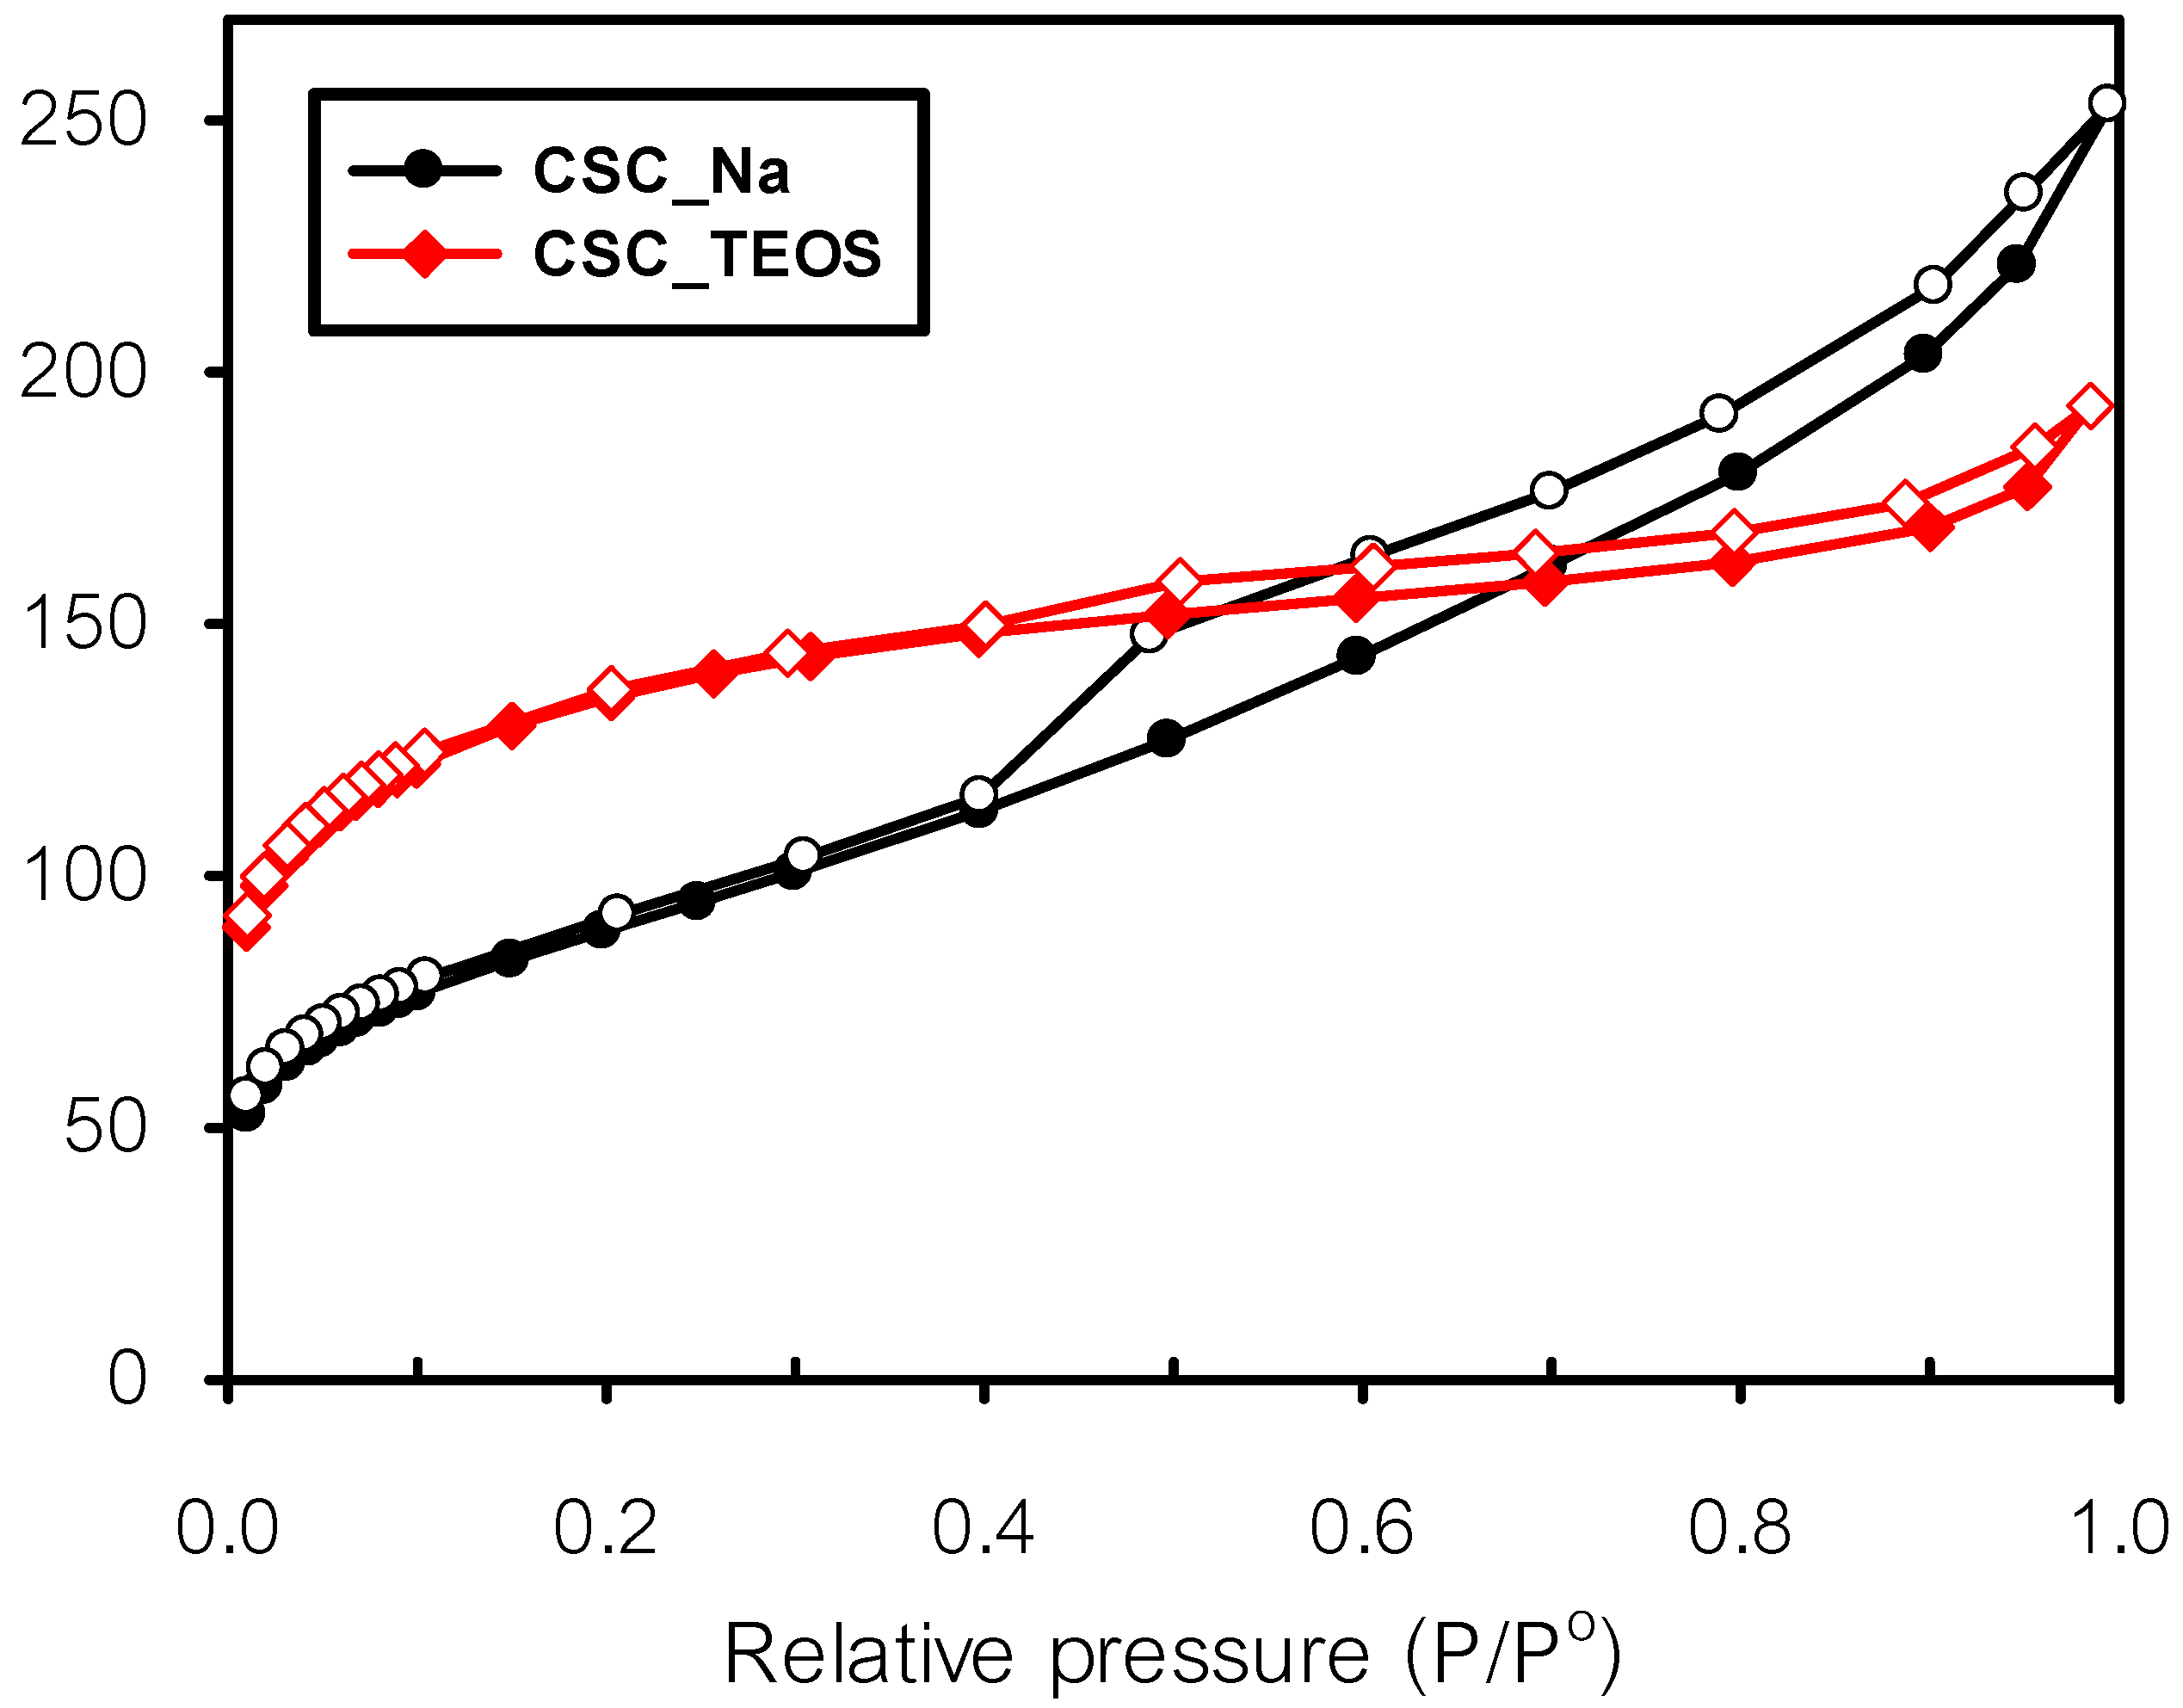
Figure 3 illustrates the N2 adsorption–desorption isotherms of composites prepared at optimum conditions (CSC_Na and CSC_TEOS). The isotherms belonged to Type IV according to IUPAC classification. The hysteresis loop for P/P° (U+b0) > 0.4 presents evidence of capillary condensation, which indicated the formation of mesopores in both composites. Table 1 shows the porous properties of the optimum CSCs, which showed the largest surface area and total pore volume of 313 m2/g and 0.39 cm3/g and 456 m2/g and 0.30 cm3/g for CSC_Na and CSC_TEOS, respectively. It can be inferred that the low-cost silica source (Na2SiO3) can produce a composite with comparable surface area and pore volume to the high-cost silica source (TEOS). Using Na2SiO3 resulted in an adsorbent with mainly mesopore volume (69%), while TEOS yielded an adsorbent with mainly micropores (67%). The average pore sizes of both composites were between 2 and 5 nm, which indicated mesoporous materials.

3.1.2. Physicochemical Properties of Composites under Optimum Conditions

The CSC yield for both silica sources is presented in Table 2. Both yields were quite low because vinasse contains around 93 wt.% water [13] that was evaporated during drying at 130 °C in the synthesis process. The moisture content is the amount of water bound to samples under normal condition, while the ash content refers to residual minerals in samples. The moisture contents of CSC_Na and CSC_TEOS were 12.97 and 16.67 wt.%, respectively. Generally, a high moisture content decreases the adsorption capacity of an adsorbent. As shown in Table 2, the ash contents of both composites were quite high, likely due to the present of silica.
The CSCs had a pH of 1.85 (CSC_Na) and 2.82 (CSC_TEOS) and pHpzc values of 2.20 (CSC_Na) and 2.70 (CSC_TEOS), which confirmed the acidic character of the surface. The bulk densities of composites were 0.66 and 0.86 g/cm3 for, respectively, CSC_Na and CSC_TEOS. These bulk densities are within the values reported for other adsorbents, for example, 0.67 g/cm3 for activated carbon prepared from mango seed [14] or 0.74 g/cm3 for 5A molecular sieve [15].
The FTIR spectra of the samples show the interaction between carbon and silica in both composites (Figure 4). The broad band at 3329 cm−1 was due to the presence of –OH stretching vibrations [11]. The band at 1705 cm−1 was attributed to the stretching vibrations of C=O of –COOH groups [11]. The low-intensity bands at 1622 and 1632 cm−1 were assigned to water physically bound to silica [16]. The peak at 1000–1200 cm−1 revealed the presence of characteristic bonds of Si–O–Si [16] and the peak observed at 955 cm−1 corresponded to Si–OH vibrations [16]. Finally, the peak at 797 cm−1 is related to O–Si–O vibrations [11].
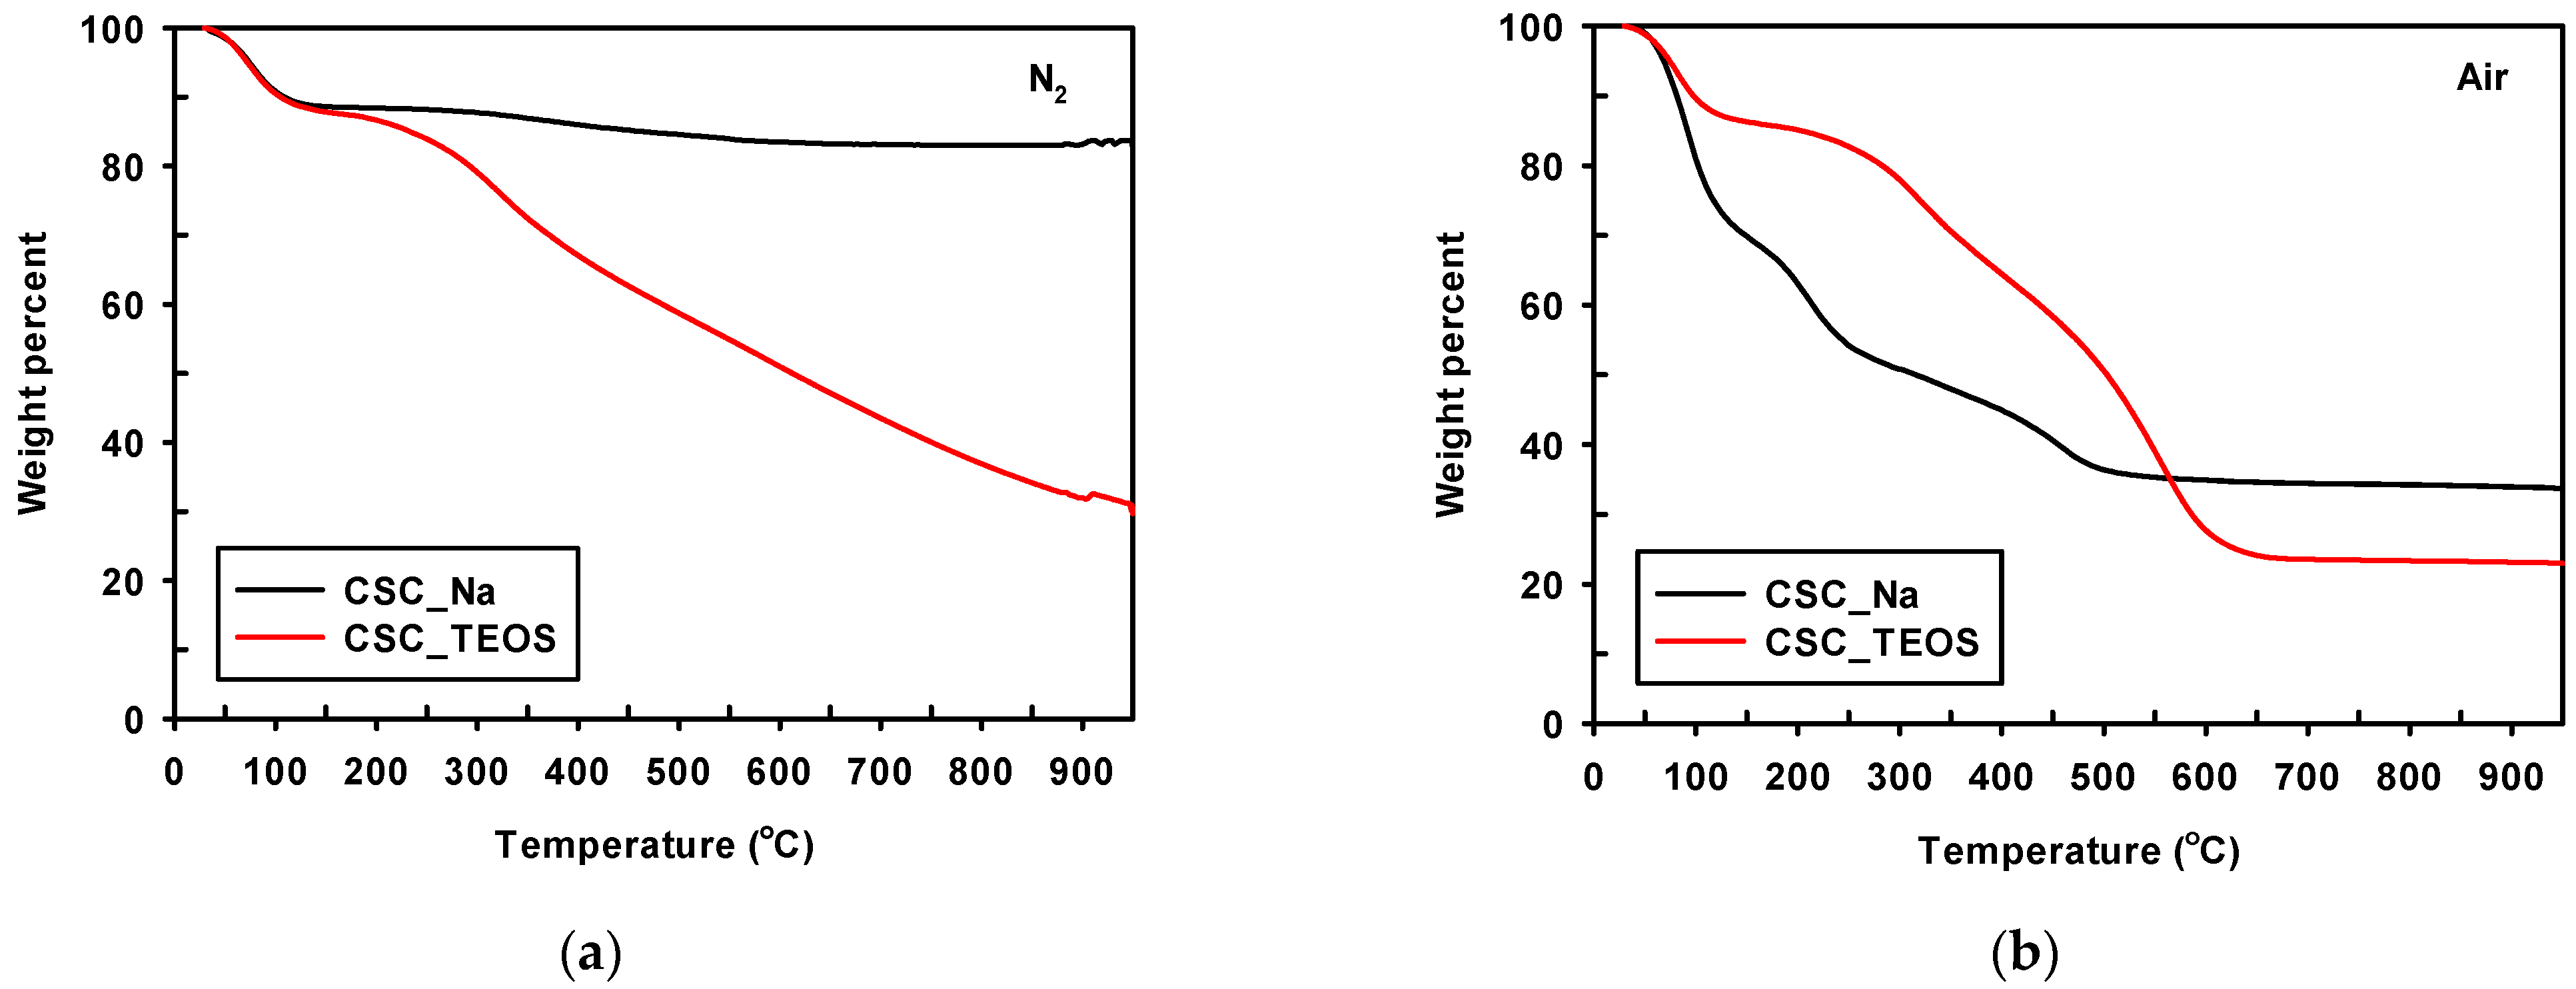
The results of the thermogravimetric analysis are shown in Figure 5. These plots show the percent weight loss of composites synthesized at optimum conditions as a function of temperature under N2 and air atmospheres. As seen in Figure 5a,b, approximately 10% and 20% weight loss occurred at approximately 100 °C, which was attributed to the molecular water adsorbed on the composite surface. The final weight of both composites under N2 atmosphere was higher than in air atmosphere. In the case of N2, pyrolysis takes place, whereas an oxidation phenomenon occurs under air. The mass loss of the composites between 250 and 650 °C under air atmosphere was due to the combustion of carbon [17]. The TGA curves indicated a 19% mass loss for CSC_Na and 58% for CSC_TEOS. The higher mass loss for CSC_TEOS was ascribed to its higher carbon content, which is consistent with the higher amount of vinasse used (vinasse:silica source ratio 10:1) compared to CSC_Na sample (vinasse:silica source ratio 5:1) at optimum conditions. From the residual weight, it is reasonable to assume that the composites contained 34 wt.% and 23 wt.% silica for CSC_Na and CSC_TEOS, respectively. In both atmospheres, the residual weight of CSC_Na was higher than CSC_TEOS, which illustrated a better thermal stability.

3.1.3. Surface Morphology

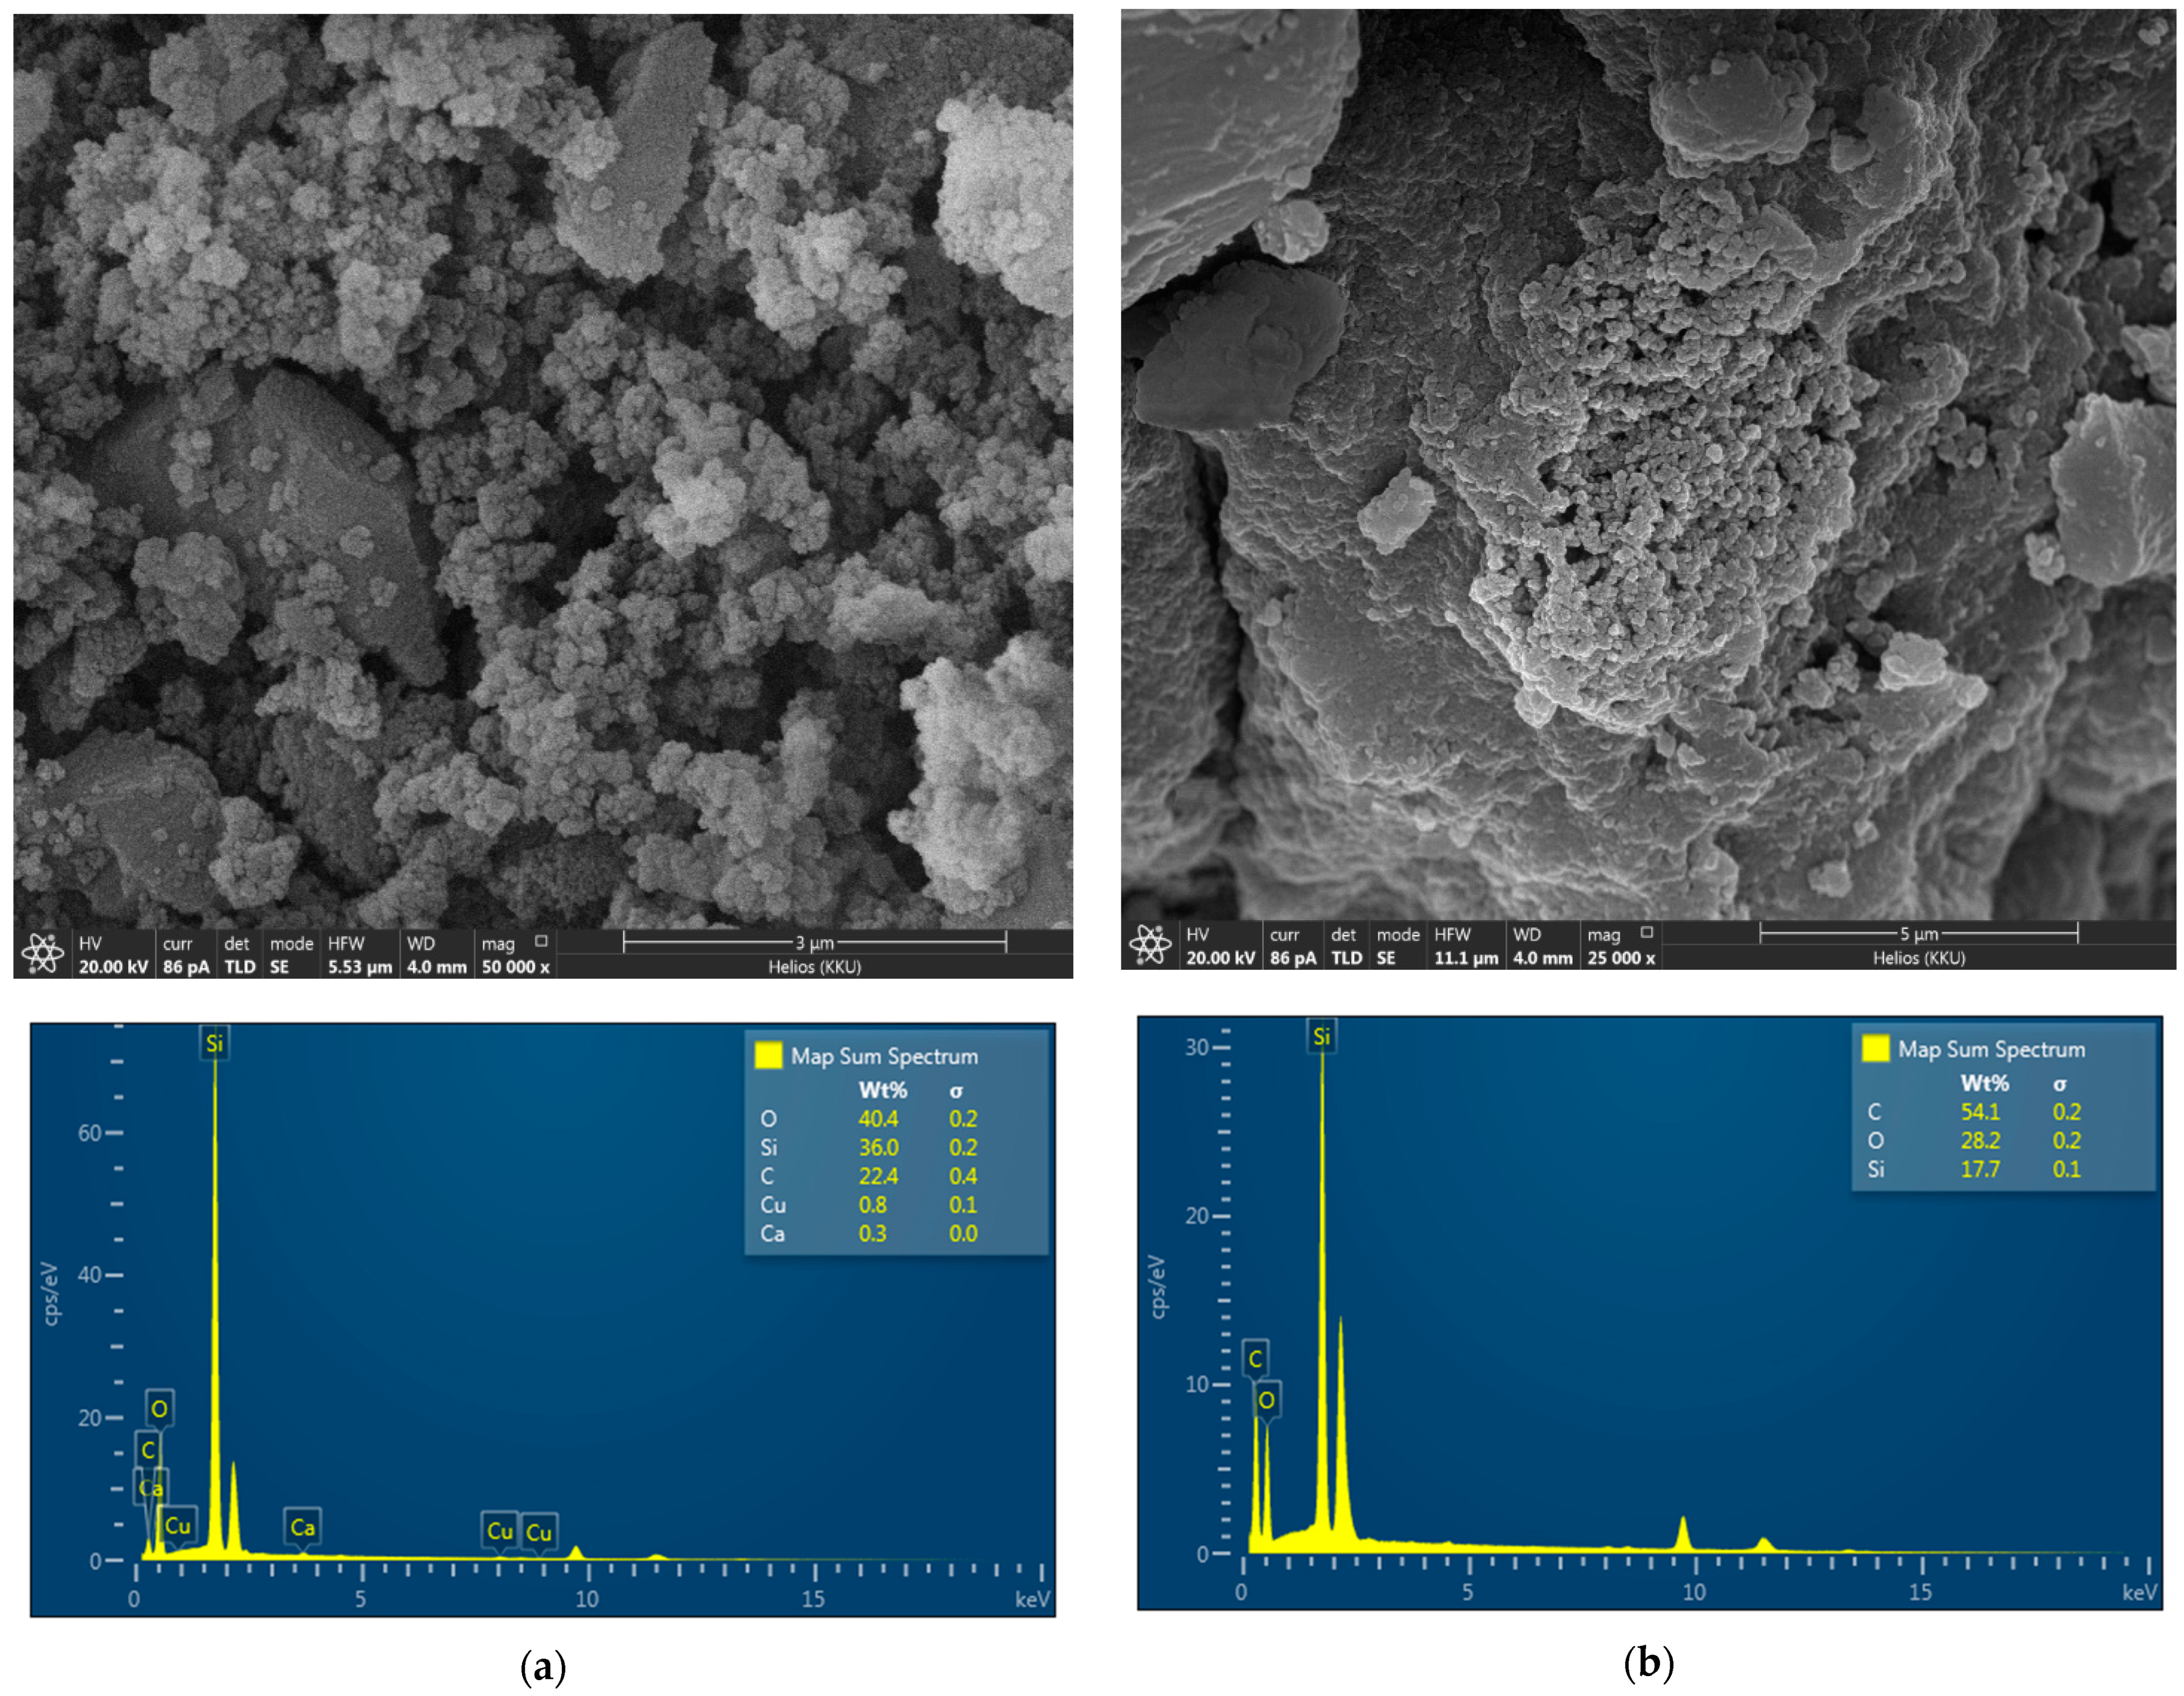
The morphological structures of the composites were analyzed by SEM (Figure 6). It can be clearly seen that both composites had cavities, in agreement with the high surface area and porosity. EDX analysis indicated the presence of C and Si in the synthesized composites. The atomic percentage of C and Si calculated from the quantification of the peaks gave values of 22.4 and 36.0 wt.% for CSC_Na and 54.1 and 17.7 wt.% for CSC_TEOS, respectively. This higher Si content for CSC_Na is consistent with is higher stability, as seen by TGA analysis and its lower carbon content.

3.2. Adsorption Study

3.2.1. Effect of Adsorption Time

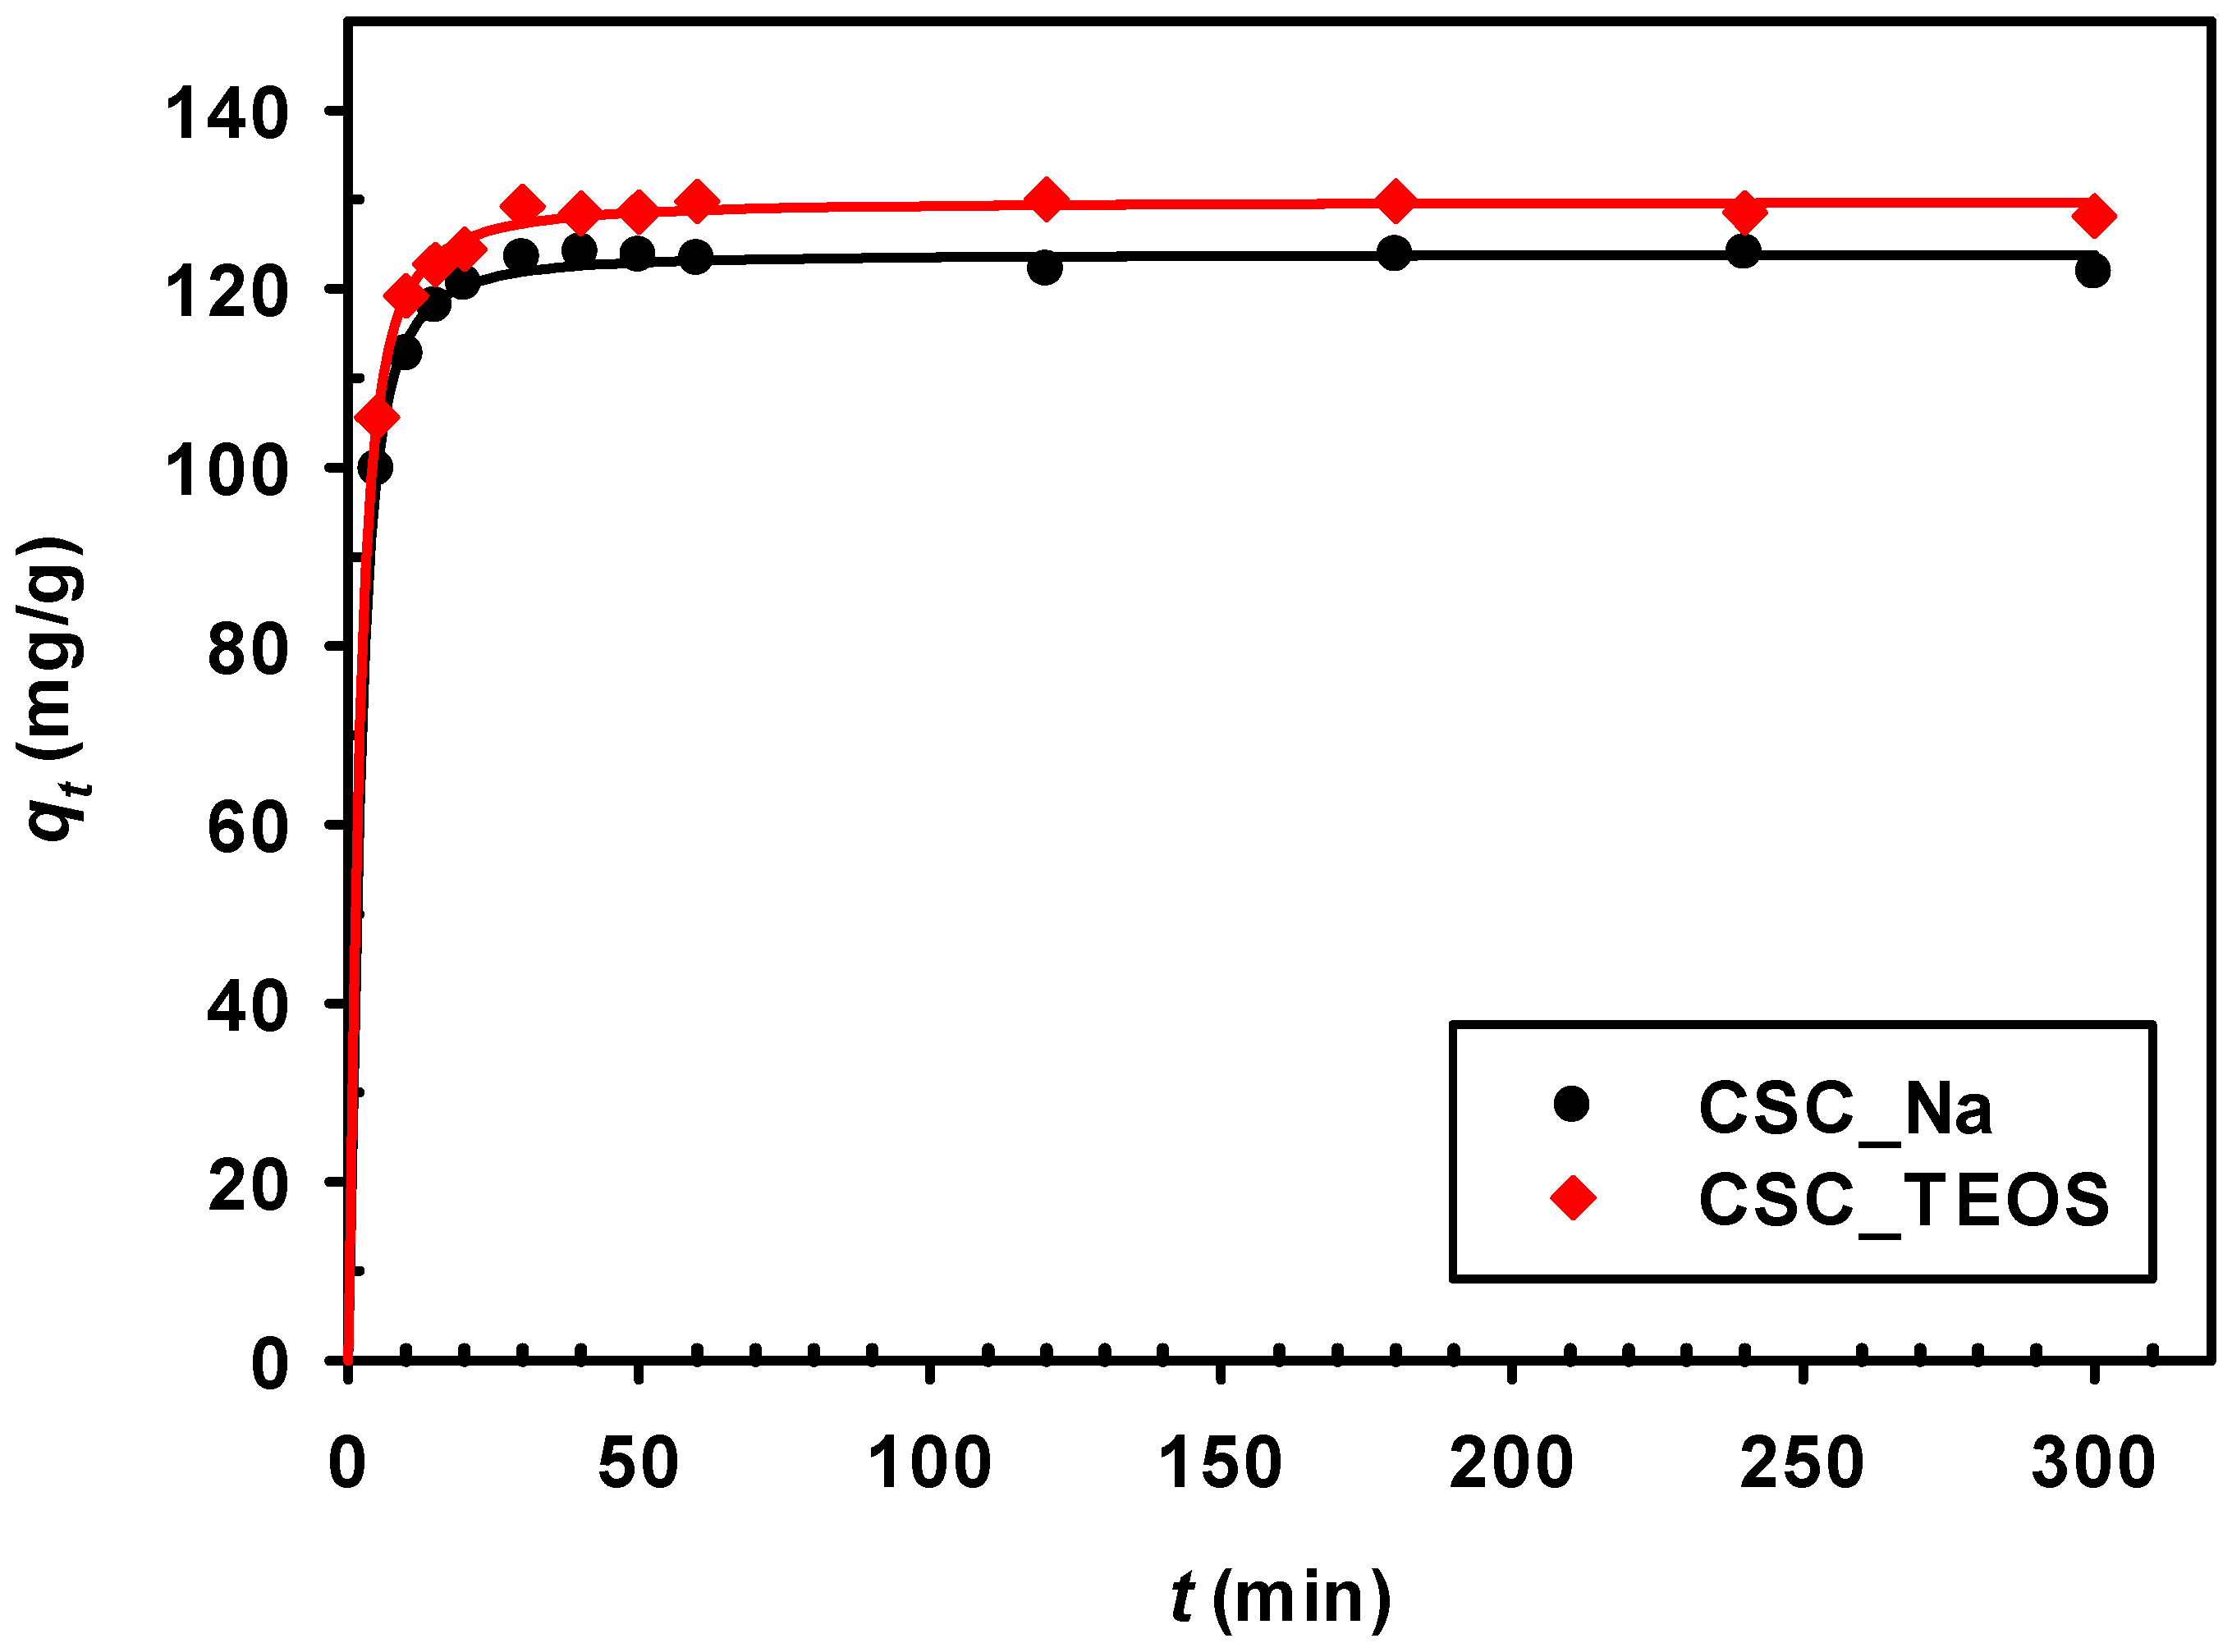
The effect of contact time on the IBP adsorption capacities for CSC_Na and CSC_TEOS is shown in Figure 7. The adsorption of IBP onto the CSCs increased with increasing contact times and the process reached equilibrium within about 60 min. Further experiments were conducted at this equilibrium contact time. Figure 7 also shows that a rapid increase in the IBP adsorption capacities occurred during the first 30 min. The fast adsorption at the initial stage might be due to the availability of the active sites on the composite. After that, the adsorption increased slowly because the active sites became saturated.

3.2.2. Effect of Initial pH

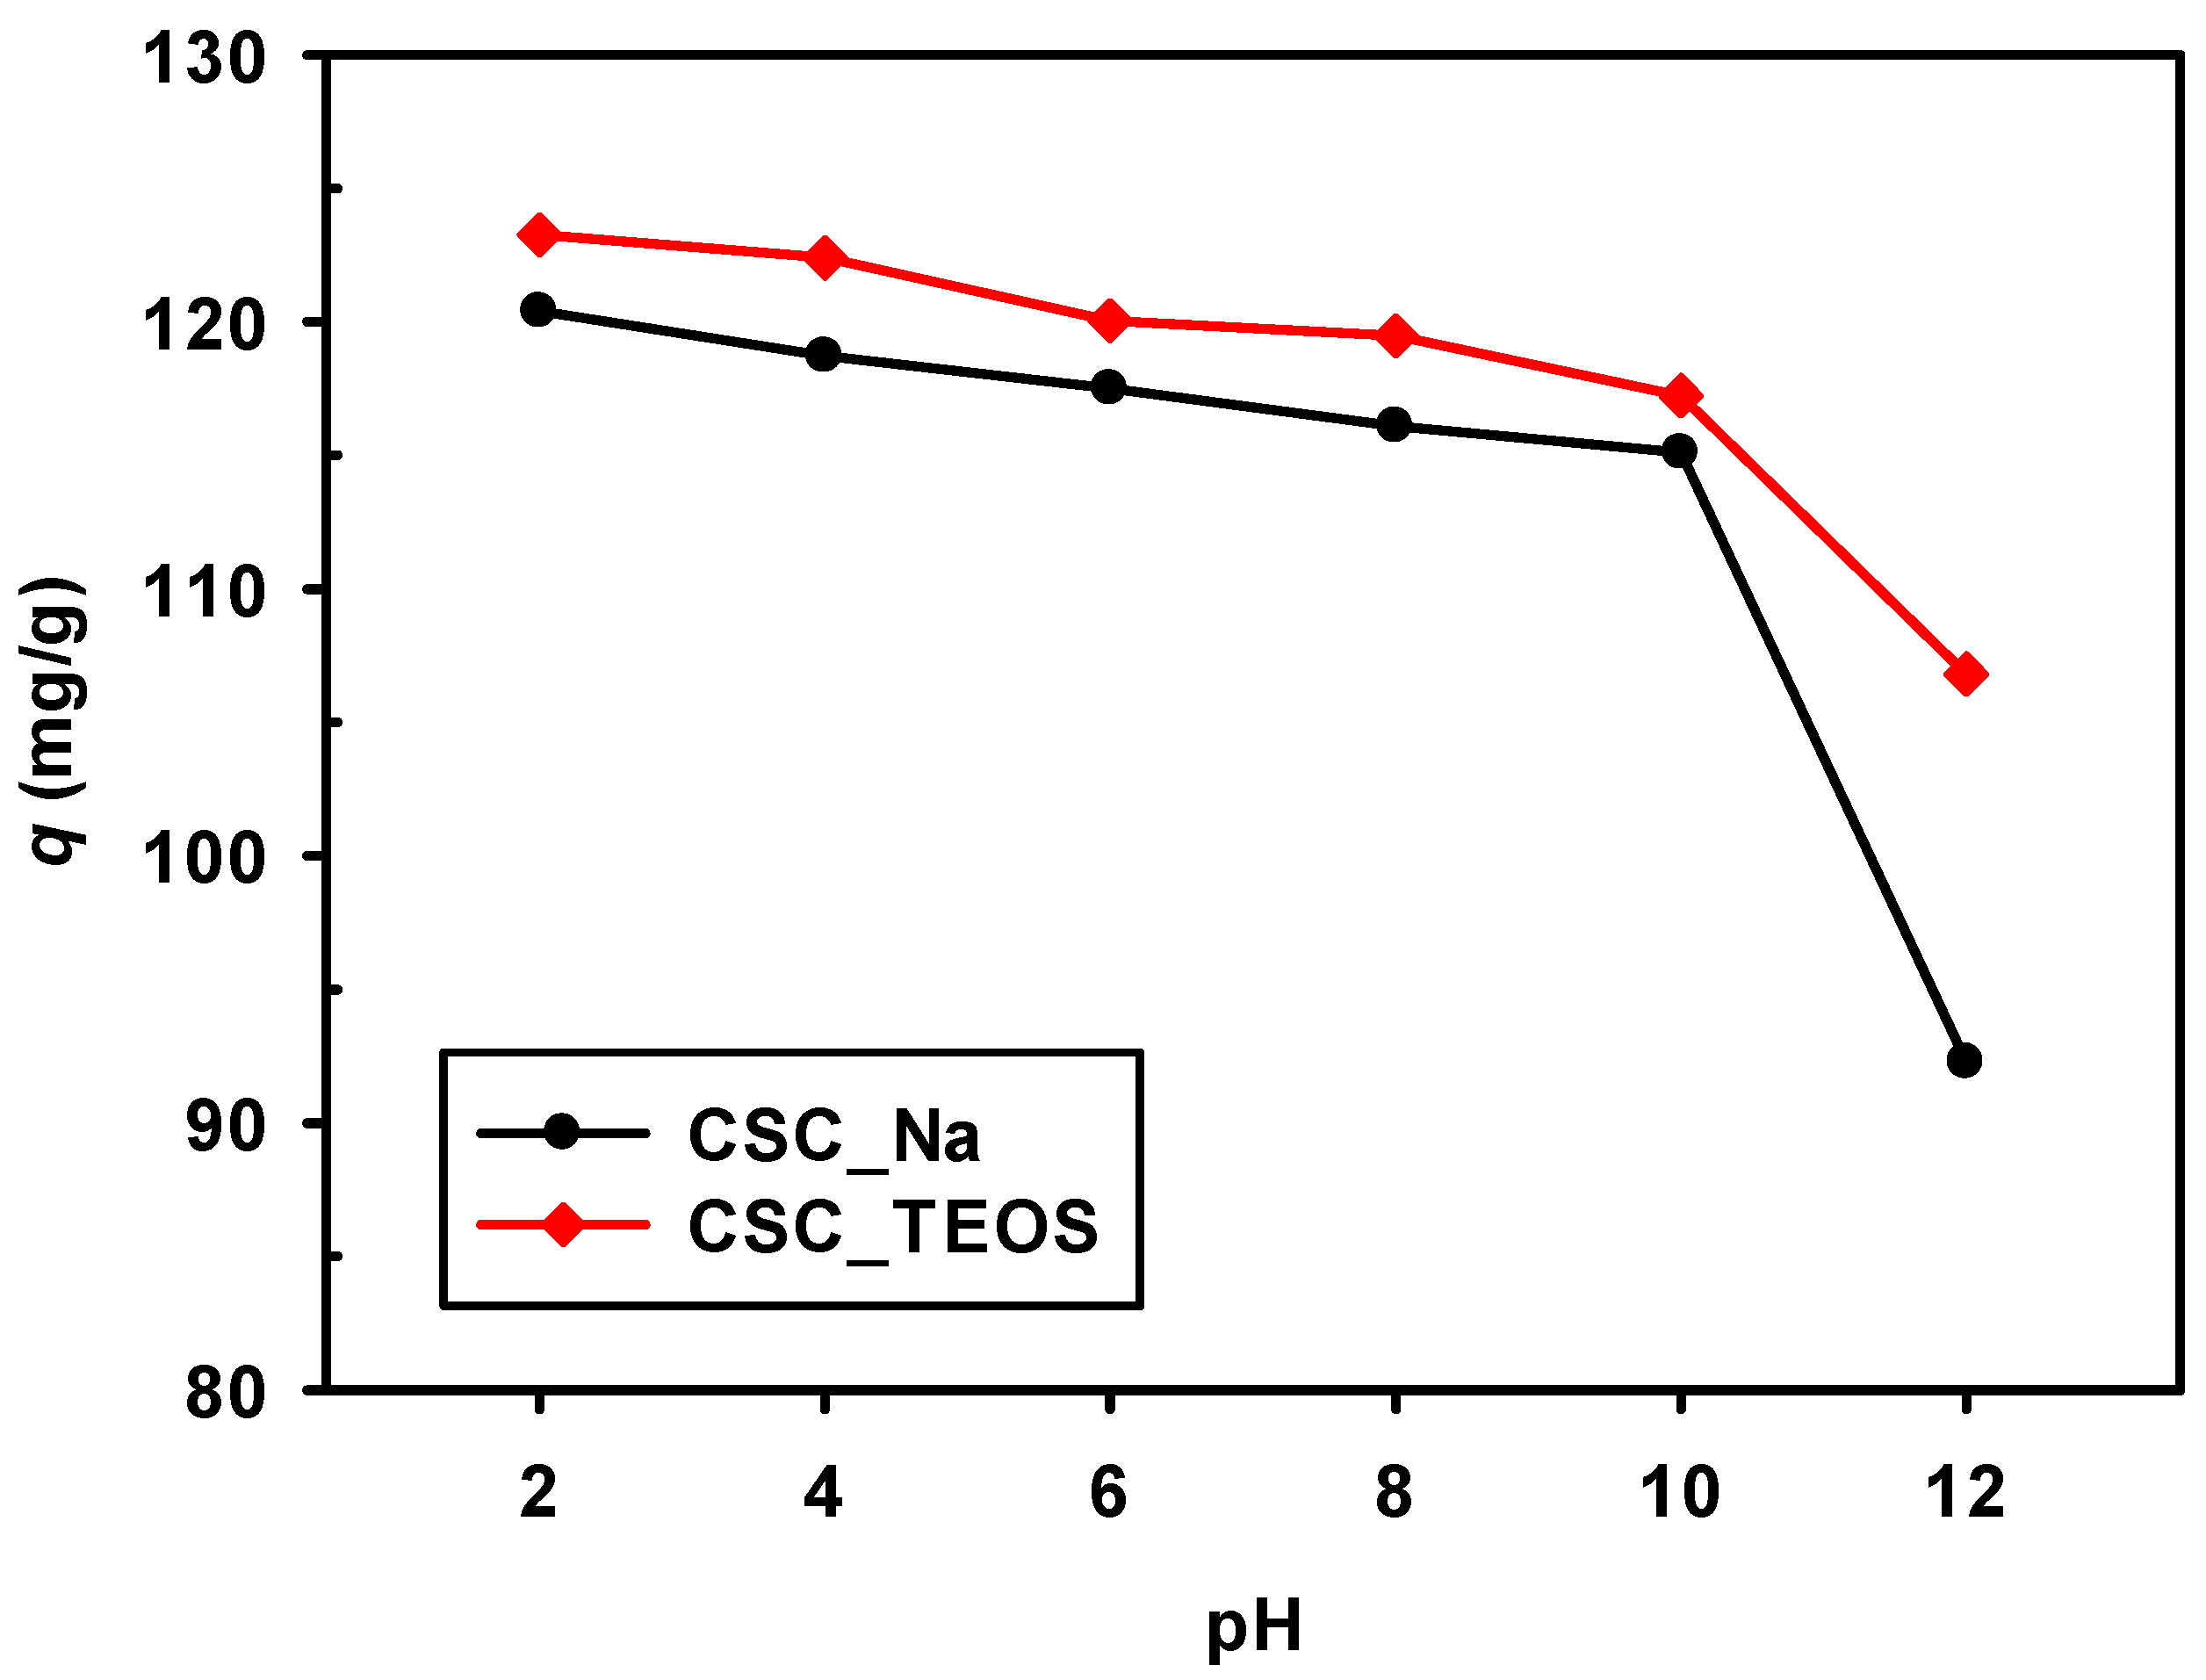
The effect of pH on IBP adsorption on both composites is presented in Figure 8. Both composites showed similar results regarding the pH effect, namely that a decrease in pH favored IBP adsorption and the highest adsorption was found at pH 2. The surface of an adsorbent is neutral at pH = pHpzc, negatively charged for pH > pHpzc and positively charged at pH < pHpzc. The charge of the adsorbate will be based on its pKa value. Ibuprofen is an acidic drug with pKa = 4.91 [18] and the IBP is distributed in water as either molecular (IBP) and anionic (IBP) forms [19]. This drug is essentially neutral at pH < pKa and acquires a negative charge when pH > pKa. For pH < pHpzc (pH = 2), both CSCs are positively charged while IBP has a neutral charge; thus, adsorption most likely involved hydrogen bonding and/or van der Waals interactions [18]. For pH > pHpzc, the surfaces of the CSCs are negatively charged and a higher proportion of negatively charged IBP at pH > pKa leads to an electrostatic repulsion between the adsorbate anions and the CSC surface [18]. Consequently, the IBP adsorption decreased. Baccar et al. [18] and Fröhlich et al. [20] also found that the adsorption of IBP was favored at low pH values. Here, pH 2 was selected for subsequent adsorption experiments.

3.2.3. Effect of Initial Solution Concentration

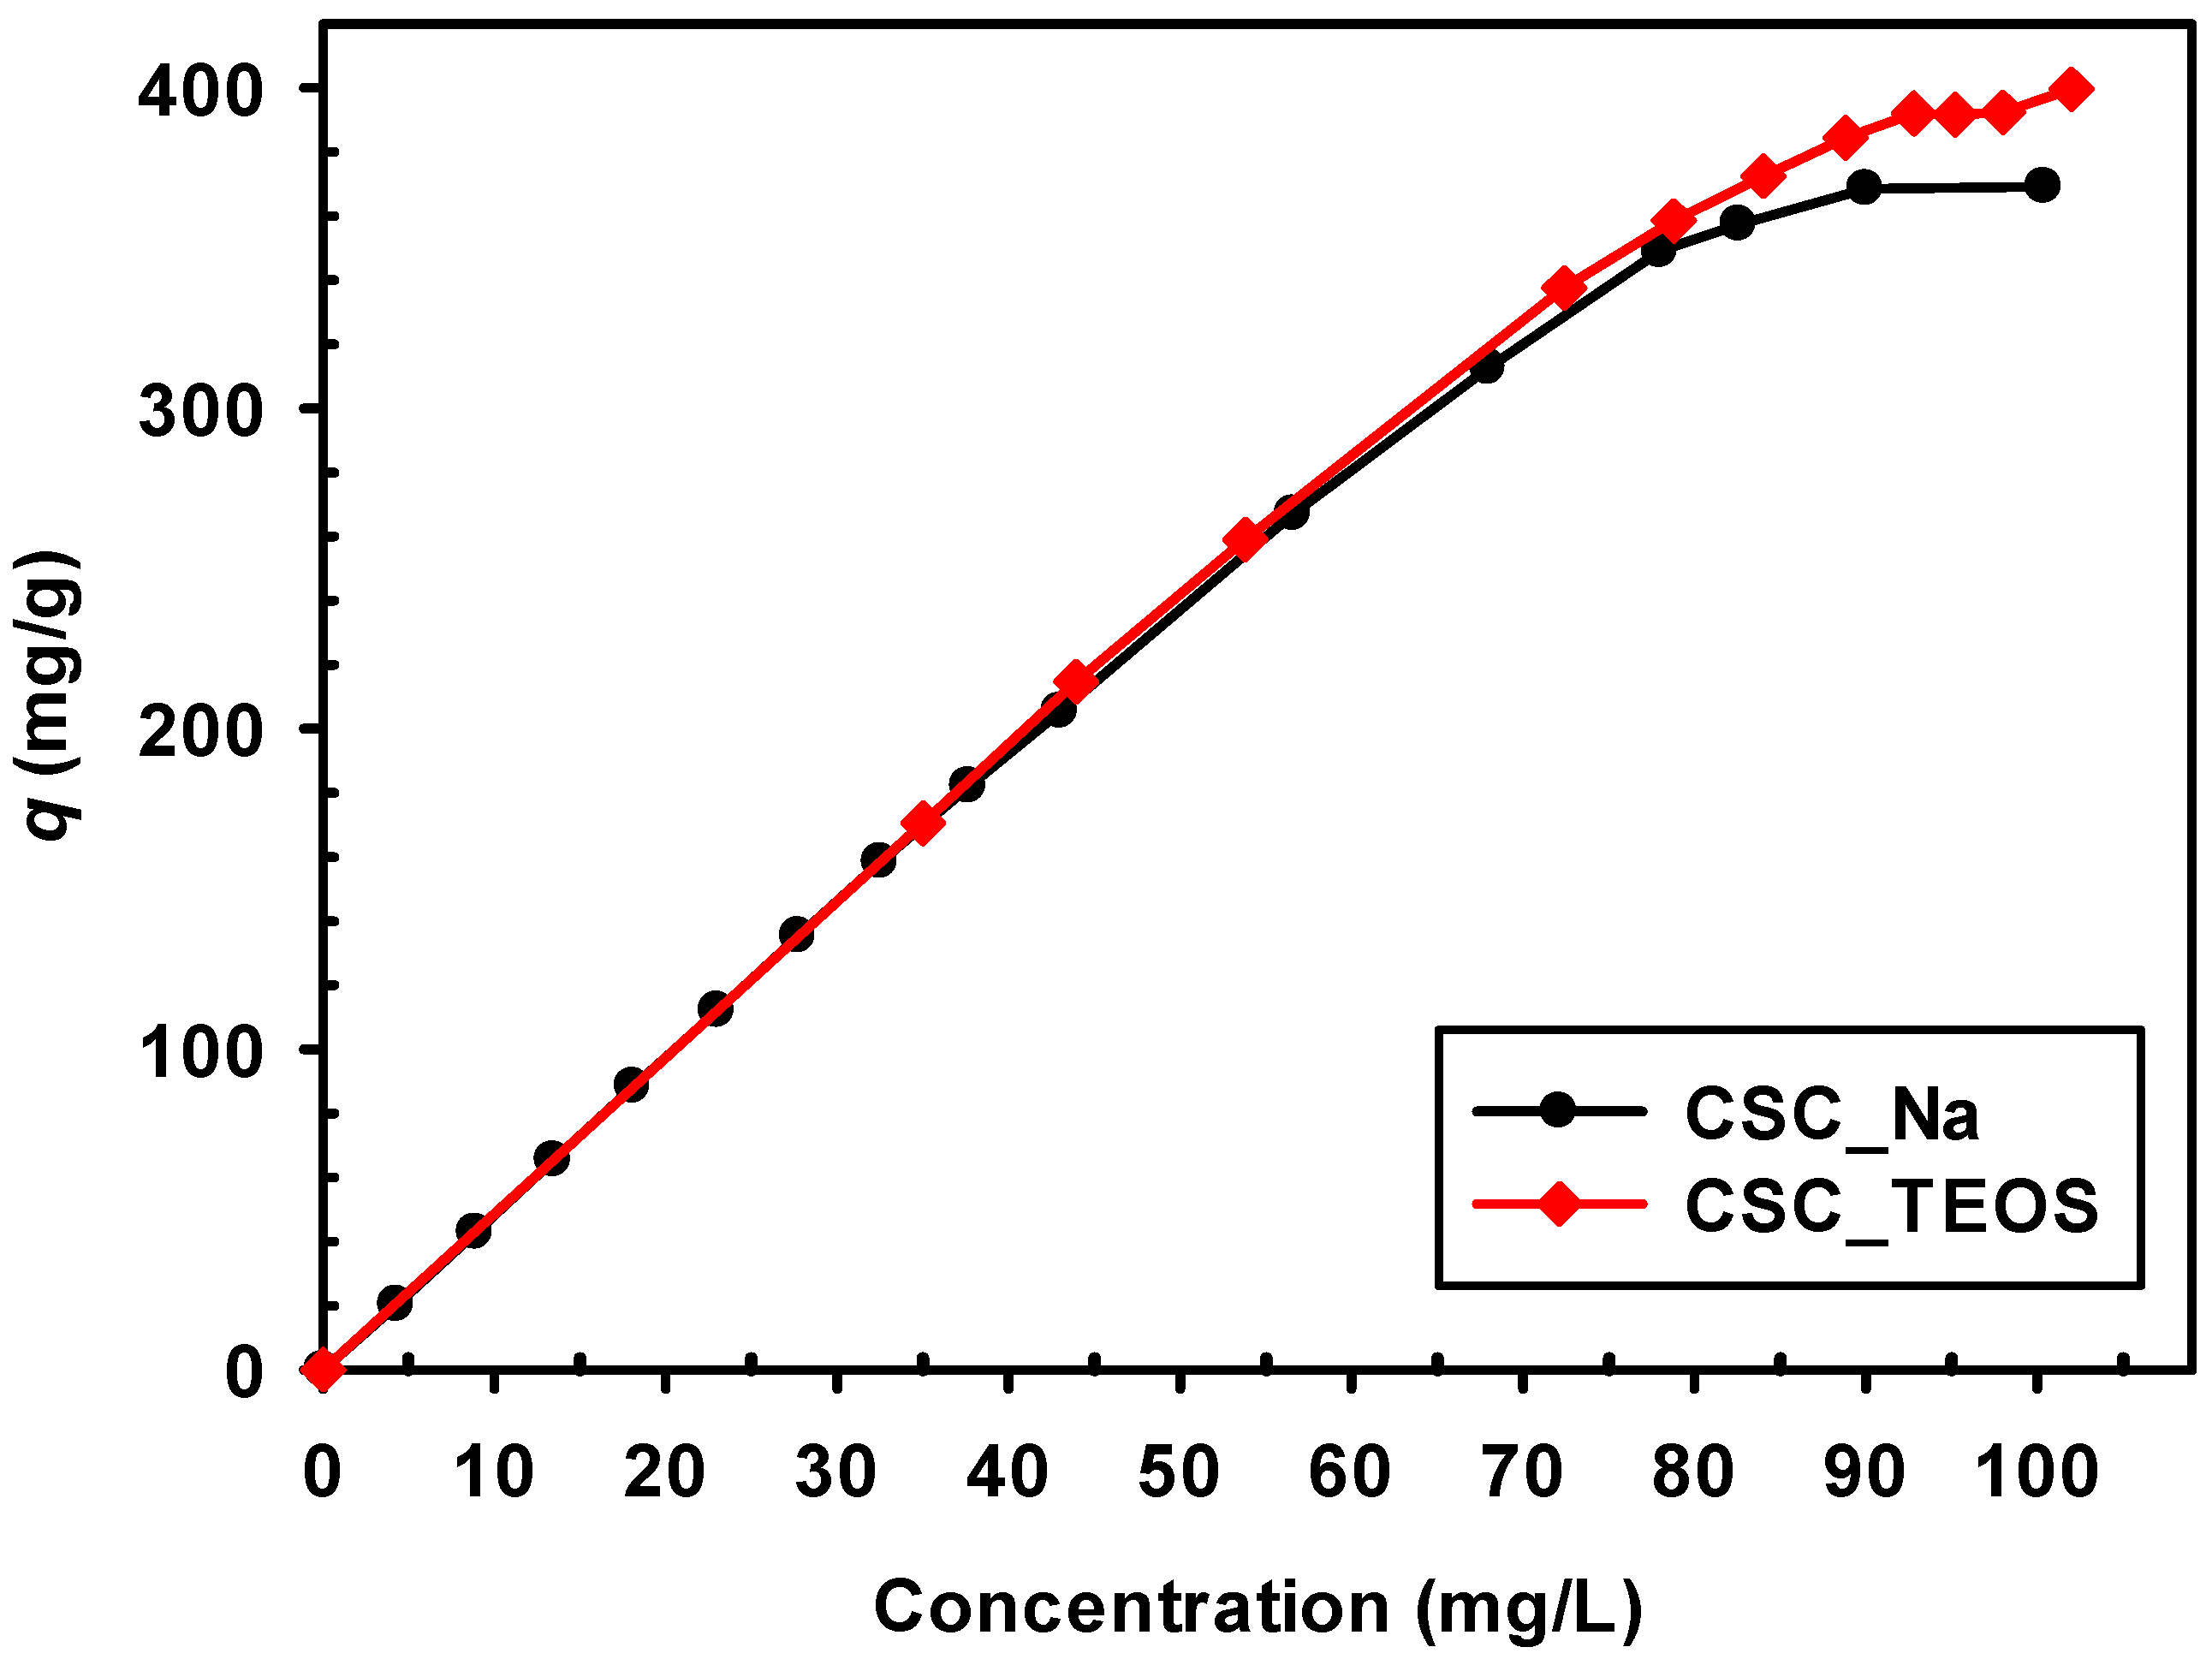
Figure 9 shows the IBP adsorption on the optimum CSCs with initial IBP concentrations of 5–100 mg/L. The adsorption capacity increased gradually with increasing IBP concentration. When the initial concentration was higher than 80 mg/L, the increase in adsorption capacity leveled off. The concentration provides an important driving force to overcome all mass transfer resistance of IBP between the aqueous and solid phase and a higher initial IBP concentration enhances the adsorption process. Due to the limitation of active sites on the adsorbent surface, the IBP molecules occupy the surface sites at critical concentration and no further capacity enhancement is possible. The CSC_Na composite prepared from Na2SiO3 had the highest equilibrium adsorption capacity of about 370 mg/g that was slightly lower than CSC_TEOS (400 mg/g), which was possibly due to the higher specific surface area of the latter.

3.2.4. Kinetic Models

The nonlinear models of pseudo-first-order and pseudo-second-order kinetics were investigated in this study. The use of nonlinear equations avoids the need for any further translation to a linear form and corresponding loss in accuracy [21]. Both models are generally expressed as [22]:
q t = q e ( 1 e k 1 t )
q t = k 2 q e 2 t 1 + k 2 q e t
where qe and qt are the amount of IBP adsorbed on CSCs in mg/g at equilibrium and at any time t (min), respectively, and k1 and k2 are the rate constant of the pseudo-first-order and (1/min) pseudo-second-order (g/(mg·min)) models, respectively.
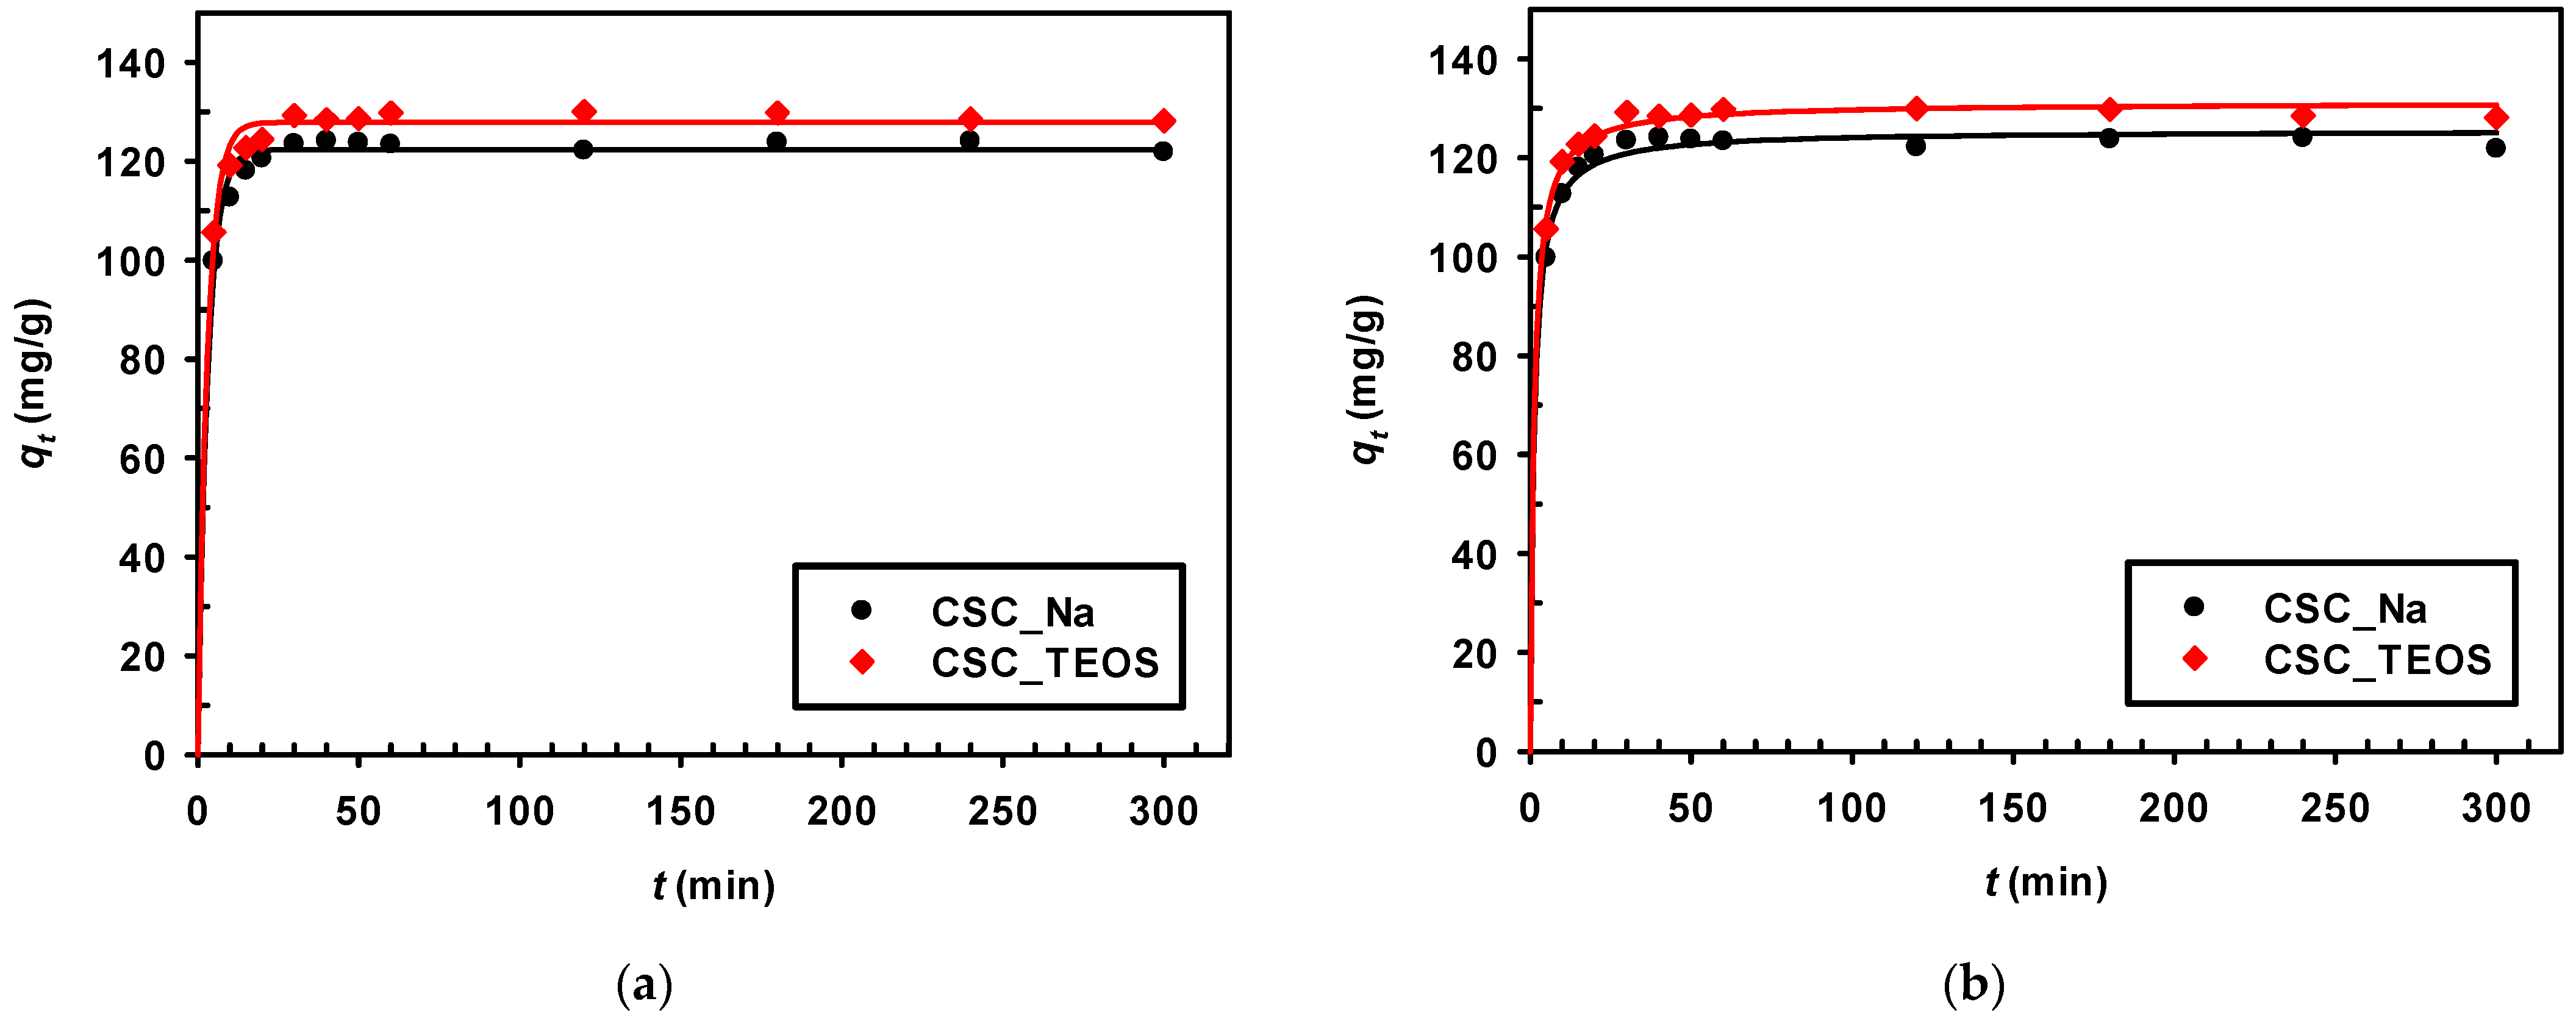
Figure 10 demonstrates the results of both kinetic models and the rate constant and qe values are given in Table 3. The suitability of the models depends on the similarity of the model and experimental qe value and the regression coefficient (R2). High R2 values were obtained for both models, but the model and experimental qe values were closer for the pseudo-second-order model. This indicated that both physical and chemical adsorption coexisted during the adsorption process and electrostatic interactions and hydrogen bonding were the main adsorption mechanisms [2].

3.2.5. Adsorption Isotherms

The equilibrium adsorption study provides information about the distribution of adsorbate molecules between the liquid and the solid phase. Several mathematical models were used to describe experimental data of adsorption isotherms, of which the most commonly used are the Langmuir and Freundlich isotherms. The Langmuir model assumes that adsorption is a monolayer process and a limited number of adsorption sites exists on the adsorbent surface. Once an adsorbate molecule is deposited onto an active site, no further adsorption occurs at that site because it can hold, at most, one adsorbate molecule. This model considers homogeneous active sites on the adsorbent surface and there are no interactions between two adsorbed molecules during the adsorption process. The Freundlich isotherm describes that a heterogeneous adsorbate surface is formed with multilayer adsorption with different adsorption energies [23]. The general nonlinear forms of the Langmuir and Freundlich equations are given below, respectively:
q e = q max K L C e 1 + K L C e
q e = K F C e 1 / n
where qmax is the maximum monolayer adsorption capacity (mg/g), Ce is the concentration of adsorbate in the solution at equilibrium (mg/L), KL is the Langmuir constant (L/mg), KF is the Freundlich constant ((mg/g)(L/mg)1/n) and 1/n is the dimensionless Freundlich adsorption intensity parameter.
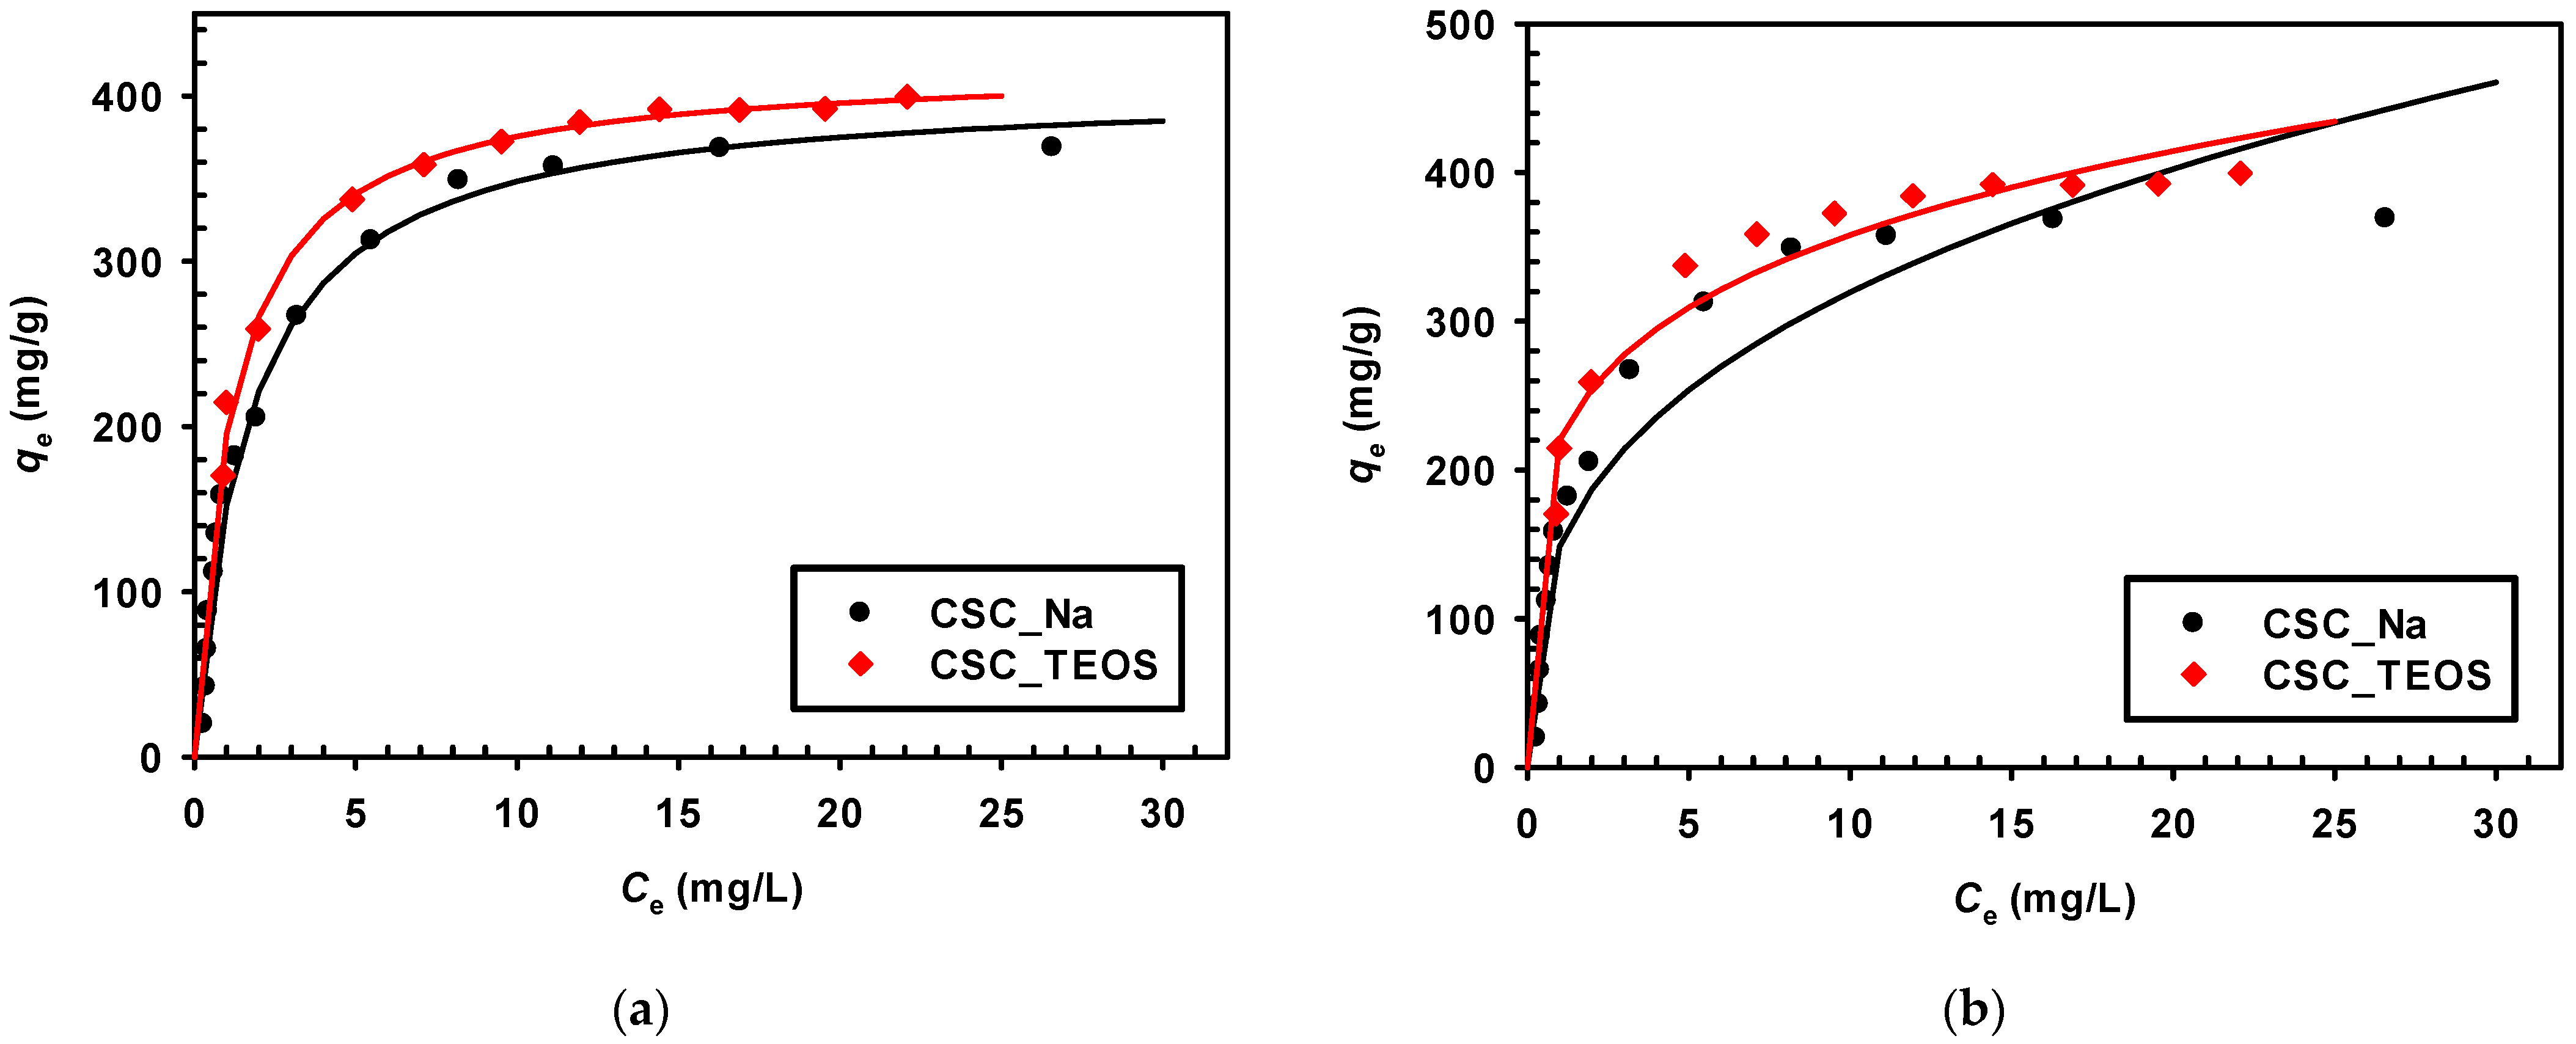
Fitting of the experimental data to the isotherm models was conducted using nonlinear regression and the results are shown in Figure 11. The parameters and the correlation coefficients (R2) are collected in Table 4. The highest R2 values for both composites were obtained for the Langmuir model, suggesting monolayer adsorption and a relatively homogeneous adsorbent surface. The values of constant KL were 0.601 and 0.880 L/mg for CSC_Na and CSC_TEOS, respectively. A higher KL value indicates a strong adsorbate–adsorbent interaction, while a smaller KL value indicates a weak interaction between adsorbate molecule and adsorbent surface. For the Freundlich isotherm model, the higher value for KF of CSC_TEOS indicated a higher affinity for IBP. This is consistent with the smaller value of 1/n (larger value of n) that implies a stronger interaction between the adsorbent and the adsorbate [24]. Moreover, the values of 1/n are 0.333 and 0.211 for CSC_Na and CSC_TEOS, respectively, implying that the adsorption of IBP is favorable. The calculated qmax values from the Langmuir model were comparable for both CSCs. This indicated that the low-cost silica source (Na2SiO3) can be used to synthesize a carbon–silica composite with high potential with similar properties and performance as the high-cost silica source (TEOS).
The adsorption performance of CSCs for IBP was compared with various other adsorbents reported in the literature. Table 5 shows that CSCs have comparable or higher adsorption capacities to other sorbents, indicating a good and promising adsorbent for IBP.

4. Conclusions

In summary, a new, easy route to synthesize mesoporous carbon–silica composites (CSCs) is presented. Vinasse was used as a carbon source and Na2SiO3 was used as low-cost silica source. TEOS, a commonly used silica source, was used for comparison. The resulting Na2SiO3-based composite (CSC_Na) had a moderate BET surface area of 313 m2/g, a moderate pore volume of 0.39 cm3/g and an average pore diameter of 5.00 nm. The CSC_Na was thermally stable and the adsorption capacity of ibuprofen was strongly influenced by the porous structure and surface chemistry. The excellent capacity of this composite to act as an adsorbent of ibuprofen (406 mg/g) was confirmed. The similar physicochemical properties and adsorption performance of CSC_Na, when compared to CSC_TEOS, make the low-cost Na2SiO3 an attractive alternative silica source over more expensive TEOS. It can be envisaged that the synthesis of carbon–silica composite from biomass-based waste products paves the way towards low-cost production of biobased products. It is also expected that this simple synthetic method will encourage the extensive applications of carbon–silica composites for gas separation, electrode materials and other applications.

Author Contributions

Conceptualization, Y.N.; methodology, Y.N.; formal analysis, Y.N, J.T.N.K. and S.B.; investigation, T.S., K.M., P.T., W.R. and K.W.; writing—original draft preparation, Y.N.; writing—review and editing, J.T.N.K.; visualization, Y.N.; project administration, Y.N. and S.B.; funding acquisition, Y.N. All authors have read and agreed to the published version of the manuscript.

Funding

This work was funded by the Office of National Higher Education Science Research and Innovation Policy Council (NXPO) via PMU Flagship of grant number C10F630230 and Faculty of Engineering, Khon Kaen University.

Institutional Review Board Statement

Not applicable.

Informed Consent Statement

Not applicable.

Data Availability Statement

The data presented in this study are available on request from the corresponding author.

Acknowledgments

The authors acknowledge Nontipa Supanchaiyamat and Andrew J. Hunt, Department of Chemistry, Faculty of Science, Khon Kaen University for SEM-EDX characterization. The authors would like to thank Tippawan Ponnikorn, Chaiwat Rattanet and Ronnachai Songkran, Department of Chemical Engineering, Faculty of Engineering, Khon Kaen University, for research assistance.

Conflicts of Interest

The authors declare no conflict of interest.

References

  1. Oba, S.N.; Ighalo, J.O.; Aniagor, C.O.; Igwegbe, C.A. Removal of Ibuprofen from Aqueous Media by Adsorption: A comprehensive review. Sci. Total Environ. 2021, 780, 146608. [Google Scholar] [CrossRef] [PubMed]
  2. Fröhlich, A.C.; dos Reis, G.S.; Pavan, F.A.; Lima, É.C.; Foletto, E.L.; Dotto, G.L. Improvement of Activated Carbon Characteristics by Sonication and Its Application for Pharmaceutical Contaminant Adsorption. Environ. Sci. Pollut. Res. 2018, 25, 24713–24725. [Google Scholar] [CrossRef] [PubMed]
  3. Ulfa, M.; Prasetyoko, D. Drug Loading-Release Behaviour of Mesoporous Materials SBA-15 and CMK-3 using ibuprofen molecules as drug model. J. Phys. Conf. Ser. 2019, 1153, 012065. [Google Scholar] [CrossRef]
  4. Shen, S.-C.; Ng, W.K.; Chia, L.S.O.; Dong, Y.-C.; Tan, R.B.H. Applications of Mesoporous Materials as Excipients for Innovative Drug Delivery and Formulation. Curr. Pharm. Des. 2013, 19, 6270–6289. [Google Scholar] [CrossRef] [PubMed] [Green Version]
  5. Xu, H.; Zhang, H.; Huang, Y.; Wang, Y. Porous Carbon/silica Composite Monoliths Derived from Resorcinol-formaldehyde/TEOS. J. Non-Cryst. Solids 2010, 356, 971–976. [Google Scholar] [CrossRef]
  6. Wu, T.; Ke, Q.; Lu, M.; Pan, P.; Zhou, Y.; Gu, Z.; Cui, G. Recent Advances in Carbon-Silica Composites: Preparation, Properties, and Applications. Catalysts 2022, 12, 573. [Google Scholar] [CrossRef]
  7. Furtado, A.M.B.; Wang, Y.; LeVan, M.D. Carbon Silica Composites for Sulfur dioxide and Ammonia Adsorption. Micropor. Mesopor. Mater. 2013, 165, 48–54. [Google Scholar] [CrossRef]
  8. Fu, L.; Zhu, J.; Huang, W.; Fang, J.; Sun, X.; Wang, X.; Liao, K. Preparation of Nano-Porous Carbon-Silica Composites and Its Adsorption Capacity to Volatile Organic Compounds. Processes 2020, 8, 372. [Google Scholar] [CrossRef] [Green Version]
  9. Fernandes, B.S.; Vieira, J.P.F.; Contesini, F.J.; Mantelatto, P.E.; Zaiat, M.; da Cruz Pradella, J.G. High Value Added Lipids Produced by Microorganisms: A Potential Use of Sugarcane Vinasse. Critical Reviews in Biotechnology 2017, 37, 1048–1061. [Google Scholar] [CrossRef]
  10. Ponnikorn, T.; Knijnenburg, J.T.N.; Macquarrie, D.J.; Ngernyen, Y. Novel Mesoporous Carbon-Silica Composites from Vinasse for the Removal of Dyes from Aqueous Silk Dyeing Wastes. Eng. Appl. Sci. Res. 2022, 49, 707–719. [Google Scholar]
  11. Nandan, D.; Sreenivasulu, P.; Konathala, L.N.S.; Kumar, M.; Viswanadham, N. Acid Functionalized Carbon-Silica Composite and Its Application for Solketal Production. Micropor. Mesopor. Mater. 2013, 179, 182–190. [Google Scholar] [CrossRef]
  12. Zhang, S.; Gao, Y.; Dan, H.; Xu, X.; Yue, Q.; Yan, J.; Wang, W.; Gao, B. Effect of Washing Conditions on Adsorptive Properties of Mesoporous Silica Carbon Composites by In-situ Carbothermal Treatment. Sci. Total Environ. 2020, 716, 136770. [Google Scholar] [CrossRef] [PubMed]
  13. Noa-Bolaño, A.; Pérez-Ones, O.; Zumalacárregui-de Cárdenas, L.; Pérez-de los Ríos, J.L. Simulation of Concentration and Incineration as an Alternative for Vinasses’ treatment. Rev. Mex. Ing. Química 2020, 19, 1265–1275. [Google Scholar] [CrossRef]
  14. Abdus-Salam, N.; Buhari, M. Adsorption of Alizarin and Fluorescein Dyes on Adsorbent prepared from Mango Seed. Pac. J. Sci. Technol. 2014, 15, 232–244. [Google Scholar]
  15. Asgari, M.; Anisi, H.; Mohammadi, H.; Sadighi, S. Designing a Commercial Scale Pressure Swing Adsorber for Hydrogen Purification. Pet. Coal 2014, 56, 552–561. [Google Scholar]
  16. Shweta, K.; Jha, H. Rice Husk Extracted Lignin−TEOS biocomposites: Effects of Acetylation and Silane Surface Treatments for Application in Nickel Removal. Biotechnol. Rep. 2015, 7, 95–106. [Google Scholar] [CrossRef] [Green Version]
  17. Yang, Z.; Xia, Y.; Mokaya, R. Periodic Mesoporous Organosilica Mesophases are Versatile Precursors for the Direct Preparation of Mesoporous Silica/Carbon Composites, Carbon and Silicon Carbide Materials. J. Mater. Chem. 2006, 16, 3417–3425. [Google Scholar] [CrossRef]
  18. Baccar, R.; Sarrà, M.; Bouzid, J.; Feki, M.; Blánquez, P. Removal of Pharmaceutical Compounds by Activated Carbon Prepared from Agricultural By-product. Chem. Eng. J. 2012, 211-212, 310–317. [Google Scholar] [CrossRef]
  19. Ai, T.; Jiang, X.; Zhong, Z.; Li, D.; Dai, S. Methanol-modified Ultra-fine Magnetic Orange Peel Powder Biochar as an Effective Adsorbent for Removal of Ibuprofen and Sulfamethoxazole from Water. Adsorpt. Sci. Technol. 2020, 38, 304–321. [Google Scholar] [CrossRef]
  20. Altowayti, W.A.H.; Othman, N.; Al-Gheethi, A.; bini Mohd Dzahir, N.H.; Asharuddin, S.M.; Alshalif, A.F.; Nasser, I.M.; Tajarudin, H.A.; AL-Towayti, F.A.H. Adsorption of Zn2+ from synthetic Wastewater Using Dried Watermelon Rind (D-WMR): An Overview of Nonlinear and Linear Regression and Error Analysis. Molecules 2021, 26, 6176. [Google Scholar] [CrossRef]
  21. Guo, L.; Li, G.; Liu, J.; Meng, Y.; Xing, G. Nonlinear Analysis of the Kinetics and Equilibrium for Adsorptive Removal of Cd(II) by starch Phosphate. J. Dispers. Sci. Technol. 2012, 33, 403–409. [Google Scholar] [CrossRef]
  22. Ni, W.; Xiao, X.; Li, Y.; Li, L.; Xue, J.; Gao, Y.; Ling, F. DETA Impregnated Attapulgite Hybrid ZIF-8 Composite as an Adsorbent for the Adsorption of Aspirin and Ibuprofen in Aqueous Solution. New J. Chem. 2021, 45, 5637–5644. [Google Scholar] [CrossRef]
  23. Salim, N.A.A.; Puteh, M.H.; Khamidun, M.H.; Fulazzaky, M.A.; Abdullah, N.H.; Yusoff, A.R.M.; Zaini, M.A.A.; Ahmad, N.; Lazim, Z.M.; Nuid, M. Interpretation of Isotherm Models for Adsorption of Ammonium onto Granular Activated Carbon. Biointerface Res. Appl. Chem. 2021, 11, 9227–9241. [Google Scholar] [CrossRef]
  24. Anah, L.; Astrini, N. Isotherm Adsorption Studies of Ni(II) ion Removal from Aqueous Solutions by Modified Carboxymethyl Cellulose Hydrogel. IOP Conf. Ser. Earth Environ. Sci. 2018, 160, 012017. [Google Scholar] [CrossRef]
  25. Du, Y.-D.; Zhang, X.-Q.; Shu, L.; Feng, Y.; Lv, C.; Liu, H.-Q.; Xu, F.; Wang, Q.; Zhao, C.C.; Kong, Q. Safety Evaluation and Ibuprofen Removal via an Alternanthera philoxeroides-based biochar. Environ. Sci. Pollut. Res. 2021, 28, 40568–40586. [Google Scholar] [CrossRef]
  26. Guedidi, H.; Reinert, L.; Soneda, Y.; Bellakhal, N.; Duclaux, L. Adsorption of Ibuprofen from Aqueous Solution on Chemically Surface-Modified Activated Carbon Cloths. Arab. J. Chem. 2017, 10, S3584–S3594. [Google Scholar] [CrossRef] [Green Version]
  27. Xiong, P.; Zhang, H.; Li, G.; Liao, C.; Jiang, G. Adsorption Removal of Ibuprofen and Naproxen from Aqueous Solution with Cu-doped Mil-101(Fe). Sci. Total Environ. 2021, 797, 149179. [Google Scholar] [CrossRef]
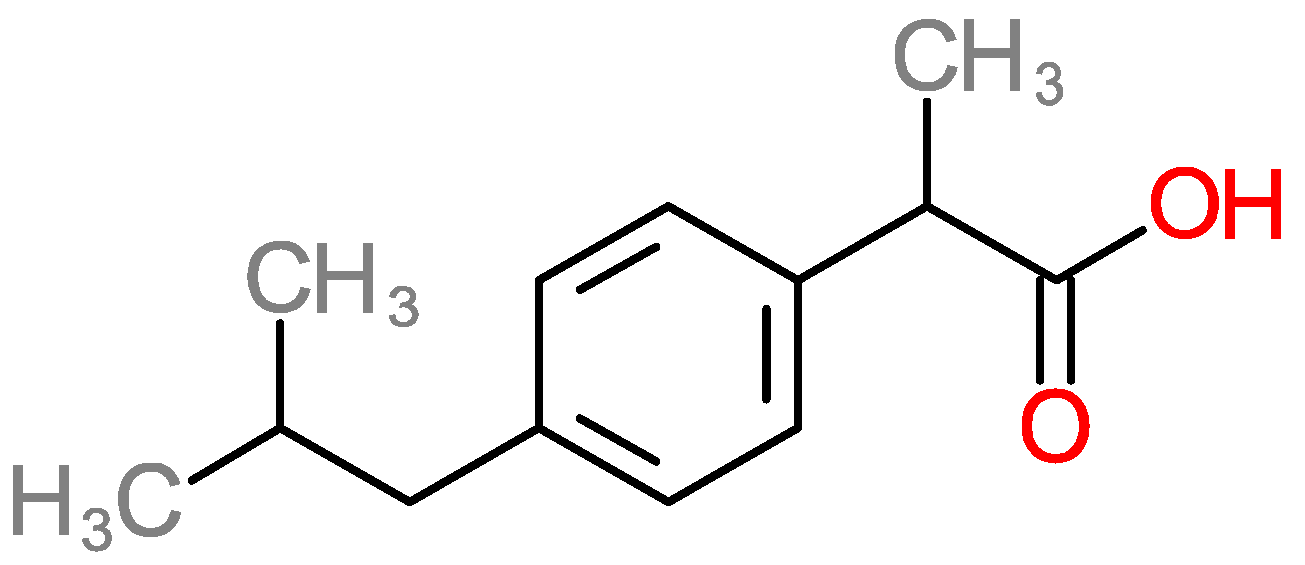
Figure 1. Chemical structure of ibuprofen.
Carbon 08 00051 g001
Figure 2. Effect of vinasse to silica source ratio on specific surface area of carbon–silica composites synthesis from: (a) Na2SiO3; (b) TEOS.
Carbon 08 00051 g002
Figure 3. N2 adsorption (closed symbol)/desorption (open symbol) isotherms of CSCs synthesized under optimum conditions.
Carbon 08 00051 g003
Figure 4. FTIR spectra of synthesized carbon–silica composites.
Carbon 08 00051 g004
Figure 5. Thermogravimetric analysis of carbon–silica composites under: (a) N2; (b) air atmosphere.
Carbon 08 00051 g005
Figure 6. SEM micrographs and EDX analysis of carbon–silica composites synthesized from: (a) Na2SiO3; (b) TEOS.
Carbon 08 00051 g006
Figure 7. Effect of adsorption time on ibuprofen adsorption (C0 = 30 mg/L).
Carbon 08 00051 g007
Figure 8. Effect of pH value on IBP adsorption (C0 = 30 mg/L; t = 60 min).
Carbon 08 00051 g008
Figure 9. Effect of initial concentration on IBP adsorption (C0 = 5–100 mg/L; pH = 2; t = 60 min).
Carbon 08 00051 g009
Figure 10. Nonlinear kinetic models of IBP adsorption using CSCs: (a) pseudo-first-order; (b) pseudo-second-order.
Carbon 08 00051 g010
Figure 11. Adsorption isotherms for IBP adsorption: (a) Langmuir model; (b) Freundlich model.
Carbon 08 00051 g011
Table 1. Textural properties of composites synthesized under optimum conditions.
CompositeSBET (m2/g)Vmic (cm3/g)Vmeso (cm3/g)VT (cm3/g)DP (nm)
CSC_Na3130.120.270.395.00
(31%)(69%)
CSC_TEOS4560.200.100.302.62
(67%)(33%)
Table 2. Physicochemical properties of composites synthesized under optimum conditions.
CompositeYield (wt.%)Moisture (wt.%)Ash (wt.%)pHpHpzcBulk Density (g/cm3)
CSC_Na6.3312.9744.391.852.200.66
TEOS4.0016.6730.082.822.700.86
Table 3. Kinetic model parameters for the adsorption of IBP on CSCs.
Adsorbentqe,exp
(mg/g)
Pseudo-First-OrderPseudo-Second-Order
qe
(mg/g)
k1
(1/min)
R2qe
(mg/g)
k1
(g/(mg·min)
R2
CSC_Na124122.370.3180.996125.520.0070.997
CSC_TEOS130127.860.3320.995131.140.0070.998
Table 4. Langmuir and Freundlich adsorption isotherm constants for IBP adsorbed by CSCs.
AdsorbentLangmuirFreundlich
qmax
(mg/g)
KL
(L/mg)
R2KF
((mg/g)(L/mg)1/n)
1/nR2
CSC_Na4060.6010.992148.5600.3330.869
CSC_TEOS4180.8800.998220.1000.2110.914
Table 5. Adsorption capacities of IBP for various adsorbents.
AdsorbentMaximum Adsorption Capacity (mg/g)Reference
CSC_Na406Present study
CSC_TEOS418Present study
Sonicated activated carbon134[20]
Alternanthera philoxeroides-based biochar172[25]
ATP@ZIF-8-DETA-20 composite218[2]
Surface modified activated carbon cloth492[26]
Cu-doped Mil-101(Fe)497[27]
Publisher’s Note: MDPI stays neutral with regard to jurisdictional claims in published maps and institutional affiliations.