


Abstract
This paper studies the dynamics of a low-density gas directly injected onto a flat wall, focusing on the influence of different pressure ratios (PRs) and plate position. Due to safety reasons, Helium (He) was employed as substitute to reproduce the mixing characteristics of hydrogen. A Nd:YAG laser has been used to generate the luminous background in the constant volume chamber (CVC) and vegetable oil particles as trackers to identify the induced flow-field. Two configurations were investigated: the first, with a flat wall perpendicularly positioned at an axial distance of 10 mm from the injector tip, and the second with the same plate at 30 mm downstream of the injector, inclined at 30°. The pressure of injection was swept from 20 to 50 bar, while the backpressure inside the CVC ranged from 2 to 6 bar to enable the reproduction of five different values of PRs: 3, 4, 7, 10 and 17. The comparison of the results in the two configurations has highlighted the role of the plate at short distance in decelerating the jet speed (230 m/s to 160 m/s) while improving the vorticity intensity (+10%). In addition, a stagnation region was observed to form on the flat wall, downstream of the injector axis for 10 mm configuration. In this area the velocity ranged from 50% to 60% compared to the average jet speed. This phenomenon was noted to be less pronounced with the 30 mm, 30° configuration that led to a more contained speed reduction to 150–160%.
1. Introduction
Nowadays, and for the coming decades, the energy transition is and will represent one of the major global challenges, requiring a collective effort to gradually detach from hydrocarbon-based technologies and move toward more sustainable energy sources. Regardless of the different political or ideological perspectives on the matter [1], the evidence for climate change has been extensively demonstrated by many studies [2,3], with the subsequent growing concerns by governments and the inevitable adoption of more stringent regulations on polluting emissions [4]. In this framework, hydrogen is increasingly considered as a viable option for decarbonizing those sectors where direct electrification or other low-carbon options might not be technically or economically feasible [5]. Among these applications, hydrogen employment in internal combustion engines (ICEs) has become a widely stressed argument in the scientific literature, demonstrating both its advantages and technical challenges [6]. However, its unique physical properties contribute to leave some aspects open to free interpretation, particularly regarding the air–fuel mixing, which is of paramount importance in DI engines [7,8]. Mixing efficiency becomes even more critical for a gas like hydrogen, whose wide flammability range and low ignition energy contribute to make this fuel prone to undesired abnormal combustion phenomena [9]. Considering a direct injection (DI) engine, the jet development depends on several factors: PR (Pinj/Pch), chamber geometry and jet–jet interaction in case of complex nozzle cap patterns. These parameters play a pivotal role in determining the combustion and emission performance, enhancing homogeneous distribution of the fresh charge and avoiding the formation of fuel-rich pockets that could contribute to the rise in NOx emissions [10]. In this context, the same properties of hydrogen that offer benefits, such as rapid flame speed, increased octane number and absence of carbon molecules, also pose the necessity for careful management. For these reasons, its use in enclosed spaces requires many precautions and the adoption of several safety devices [11]. Therefore, helium, which is the second lightest element with the closest molecular mass weight to that of hydrogen, has been chosen as a substitute to mimic the mixing properties in non-reactive conditions.
A large number of investigations involving the use of helium are present in the literature; from the simulation of hydrogen gas dispersion in enclosed spaces [12,13] to its application in the aerospace sector. Oamjee A. et al. in [14] demonstrated how helium returns a qualitative understanding of the global mixing parameters compared to hydrogen, with a good agreement in terms of jet penetration while underestimating the dispersion, leading to an overall loss of about 10% in the mixing efficiency. Other studies compared multiple candidates to evaluate the temporal evolution of the jet with that of observed by using hydrogen. Breda S. et al. in [15] proposed the use of three gases: Argon (Ar), Helium (He) and Nitrogen (N2) as substitute for Hydrogen (H2). The results clearly showed the similarity of jet morphology between He and H2, thus confirming the suitability of He as an inert gas for the characterization of a H2 injector. However, the number of such type of investigations is limited in the literature and often focus on the use of simplified nozzle cap geometries [16,17].
The present investigation aims at evaluating the dynamics underlying the jet–wall interaction, isolating it from the turbulent motions typical of a real DI engine [18,19], where the PR continuously changes throughout the cycle. Particular emphasis was therefore given to the role of injector-plate position by investigating two different configurations inside the CVC: the first, with a flat wall perpendicularly positioned at 10 mm downstream the injector tip, and the second with the same plate at 30 mm and inclined at 30° with respect to the horizontal line. PIV analysis was employed to obtain semi-quantitative information about the flow-field induced by the jet injection, through the use of a cross-correlation algorithm [20]. The acquired data were therefore post-processed by using an open-source tool: PIVlab v2.61 in MATLAB R2022b [21]. The luminous background used to identify the oil particles entered in the constant volume chamber (CVC) was generated by an Nd:YAG laser. The use of an external high-speed camera enables the production of in-series pairs of frames, in which the position of the seeded oil particles is used to determine their displacement. The PIV analysis allows for a non-intrusive approach, making this technique an ideal tool for this type of investigation [22,23]. Previous activities, involving the use of different nozzle caps and operating conditions, highlighted the effect of PR in determining the velocity of propagation of the jet [24,25]. It was observed that once PR exceeded the critical value (≈2 for helium), and the flow became choked, the pattern of development of the jet did not change substantially. Instead, PR was noted to play a key role in determining the position of the vortex rings and the extension of the steady-state region. Based on this understanding, the present investigation aims at studying the dynamic interaction of helium jets with a flat wall. The experiments were conducted by using a constant volume chamber pressurized at 2, 4 and 6 bar, and the pressure of injection was swept from 20 to 50 bar (all values refer to the gauge pressure); thus, the PRs examined ranged from 3 to 17. A custom 10-holes cap was used to reproduce complex multi-jet interactions with the flat wall. Precisely, experiments were focused on examining the velocity of propagation of the jets along the flat wall and the position of the vortex rings. Accordingly, the main objectives of this study are
- Characterization of the jet–wall interaction produced by using 10-holes custom cap.
- Evaluation of the PR influence on jet speed, vorticity intensity and flow-field distribution.
2. Influence of Gas Properties
The present study is meant to provide insights into the jet development behavior of helium gas due to its physical properties comparable to those of hydrogen. Considering the non-reactive nature of the investigation discussed in this article, Table 1 compares some of the main physical properties of these two gases. Although helium is the second lightest element after hydrogen, some discrepancies in mass-related parameters can be noted. Despite this, helium remains the best candidate to mimic hydrogen distribution behavior.
Table 1.
Helium and hydrogen physical properties (* 288 K and 1 atm, ** in air).
Due to the lower density and molecular weight, hydrogen accelerates more than helium when subjected to the same PR, resulting in a faster jet propagation. In this context, it is useful to introduce the critical PR. This parameter represents the threshold above which the flow becomes choked. Specifically, the achievement of choked conditions is defined in Equation (1) as follows:
where “∗” indicates the minimum ratio to achieve sonic conditions, while γ is the specific heat ratio (1.66 for He and 1.41 for H2). Applying the above equation, the critical pressure ratio is approximately ≈2.0 for helium and 1.9 for hydrogen; thus, confirming the close similarity in key transport-related properties, ensuring that helium remains a physically consistent and scientifically robust surrogate for hydrogen in non-reactive studies.
3. Experimental Setup
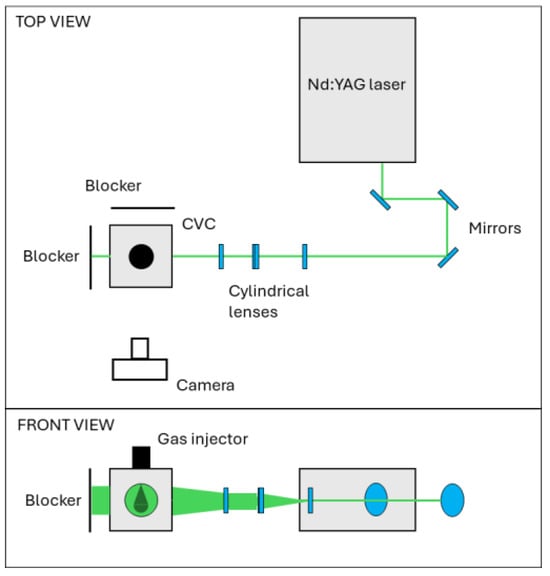
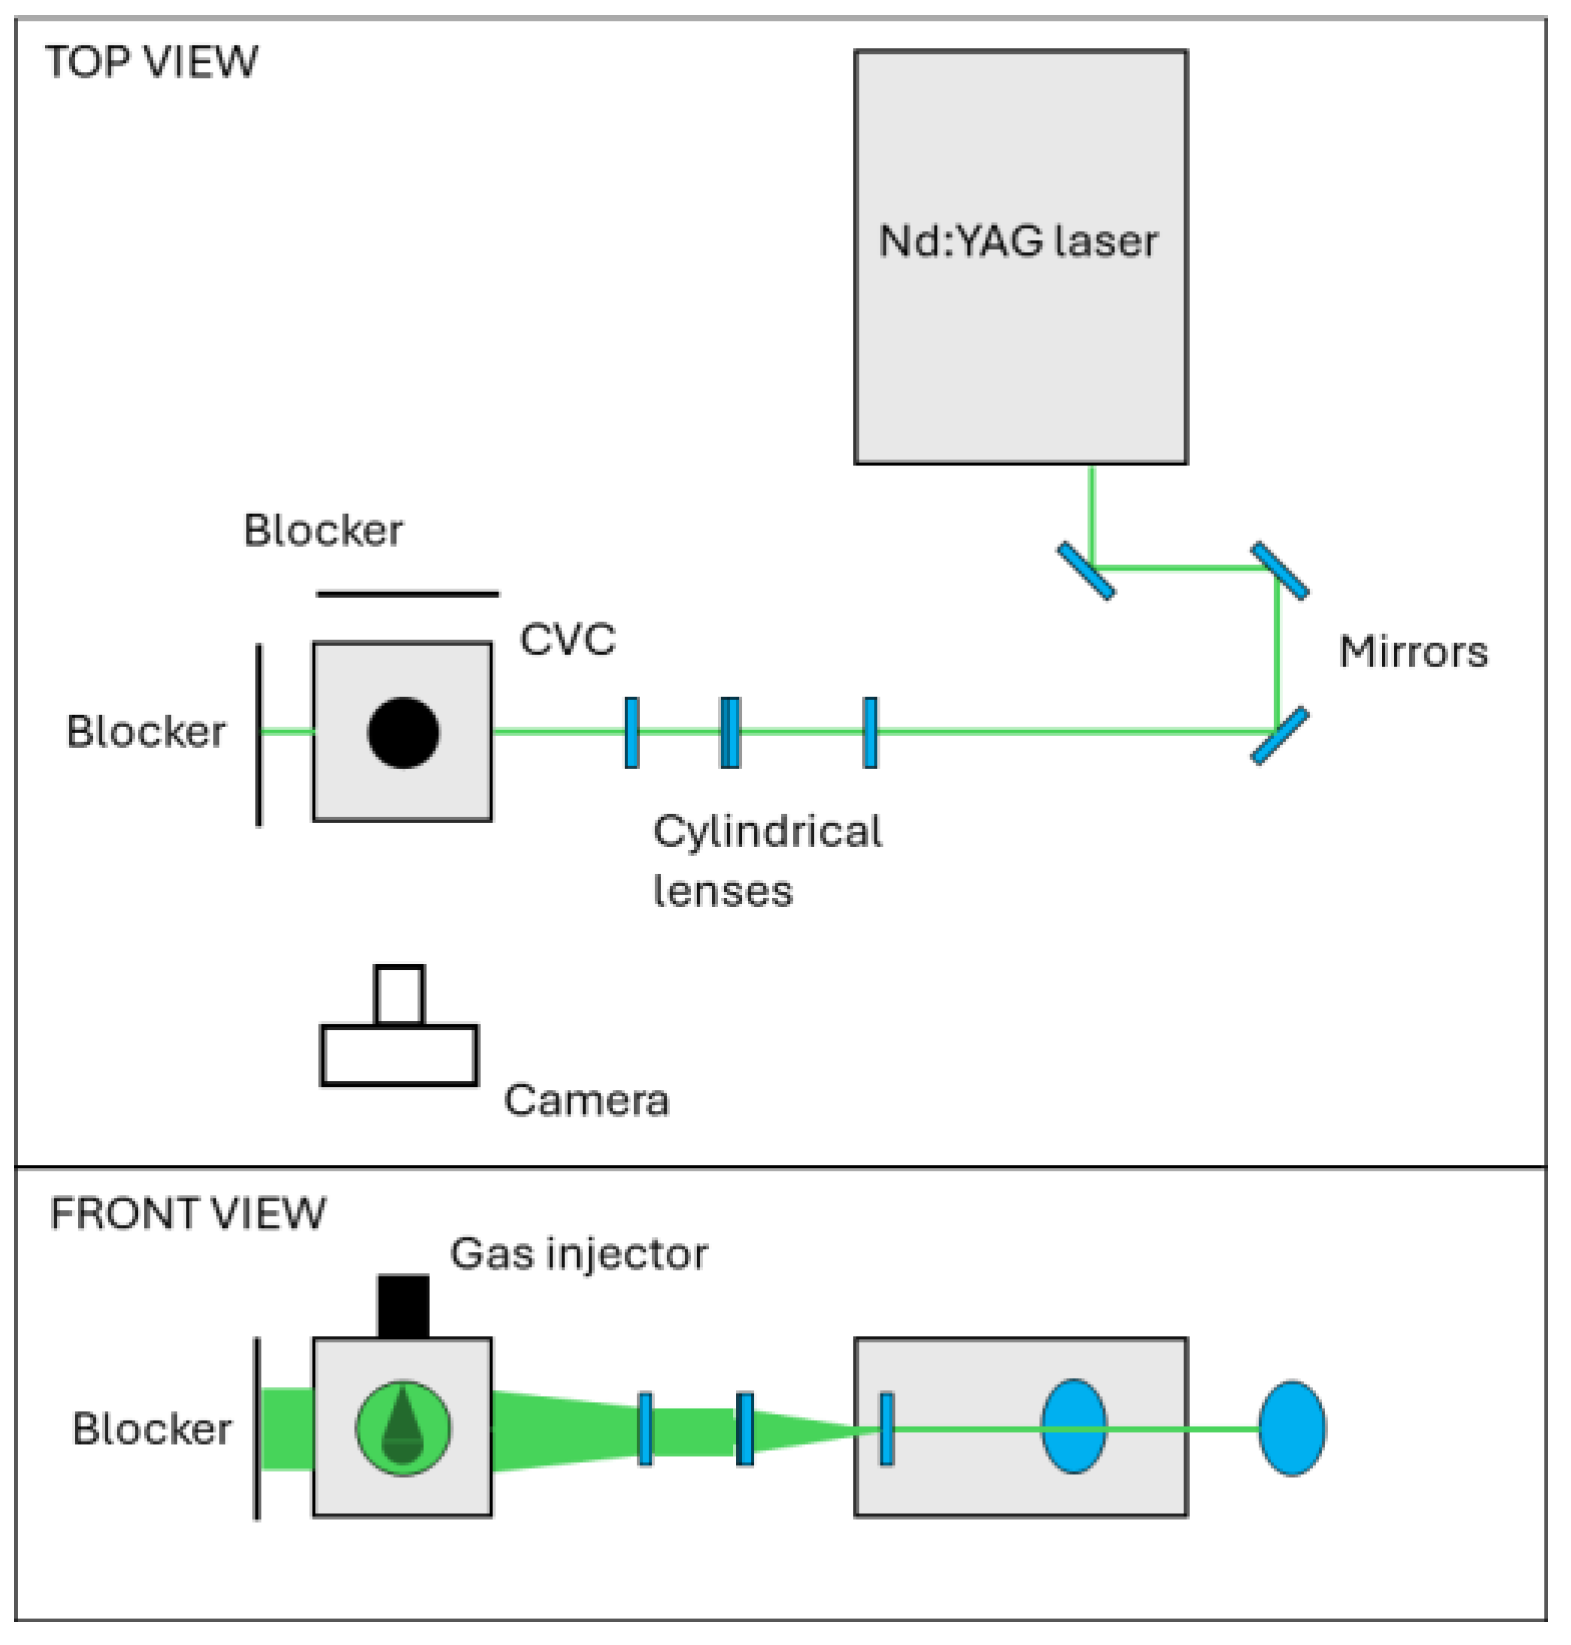
Figure 1 shows a schematic representation of the setup used. The experiments were conducted in a constant volume chamber (CVC) that can be pressurized up to 8 bar via an external line connected to the compressed airflow system of the laboratory. Specifically, the air is supplied through a pipe positioned below the top wall, away from the injector axis. Due to the absence of a preheating system, all test points were recorded at room temperature, i.e., 293 K. The CVC has an estimated internal volume of 35 L; therefore, during the experiments the jet can be considered in a quiescent state. Optical access to the CVC was made possible by four circular windows positioned on the side walls, each one with an inner diameter of 130 mm. For the present study, two of these windows were obscured by using laser beam stoppers. A dual cavity Nd:YAG laser (Spectra Physics, Quanta Ray PIV-400, Milpitas, CA, USA) was employed for the generation of the luminous background. Specifically, two pulsed signals of light with a wavelength of 532 nm were emitted by the laser to illuminate the two-dimensional cross-section of the flow, with a nominal energy of approximately of 60 mJ and a duration of 6 ns. Since it was not possible to know a priori the correct time delay between the two pulses, the time separation was determined by linearly sweeping it from 1 to 15 µs at an intermediate pressure ratio, i.e., PR = 10. Considering the reduction in spurious vectors as indicator, a final value of 3 µs was chosen. Then, the two pulsed signals pass through three cylindrical lenses; the first is a concave lens with a focal length of −50 mm, the others are two identical large lenses with a +500 mm focal length. The resulting laser sheet has a thickness of approximately 0.4 mm in correspondence with the injector axis. For each experiment the air was passed through the PIV seeder (LaVision Aerosol generator, Noble Park North, Australia) in order to provide a consistent amount of tracker particles for all tests. In particular, the oil particles are introduced inside the CVC through a perforated hollow toroidal tube located on the upper wall. This system allows for a supply of the trackers without affecting the jet distribution. According to the manufacturer’s specifications, the PIV seeder was set to operate in order to produce particles with a diameter of 400 nm ± 200 nm.
Figure 1.
Schematic overview of the experimental setup: top view (top) and front view (bottom).
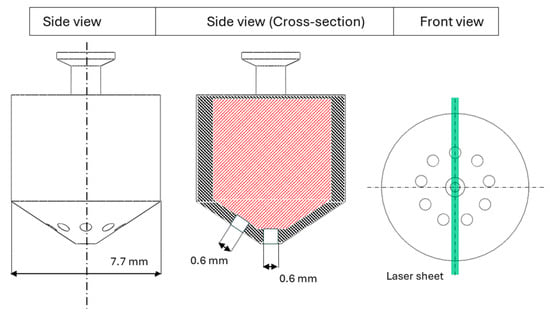
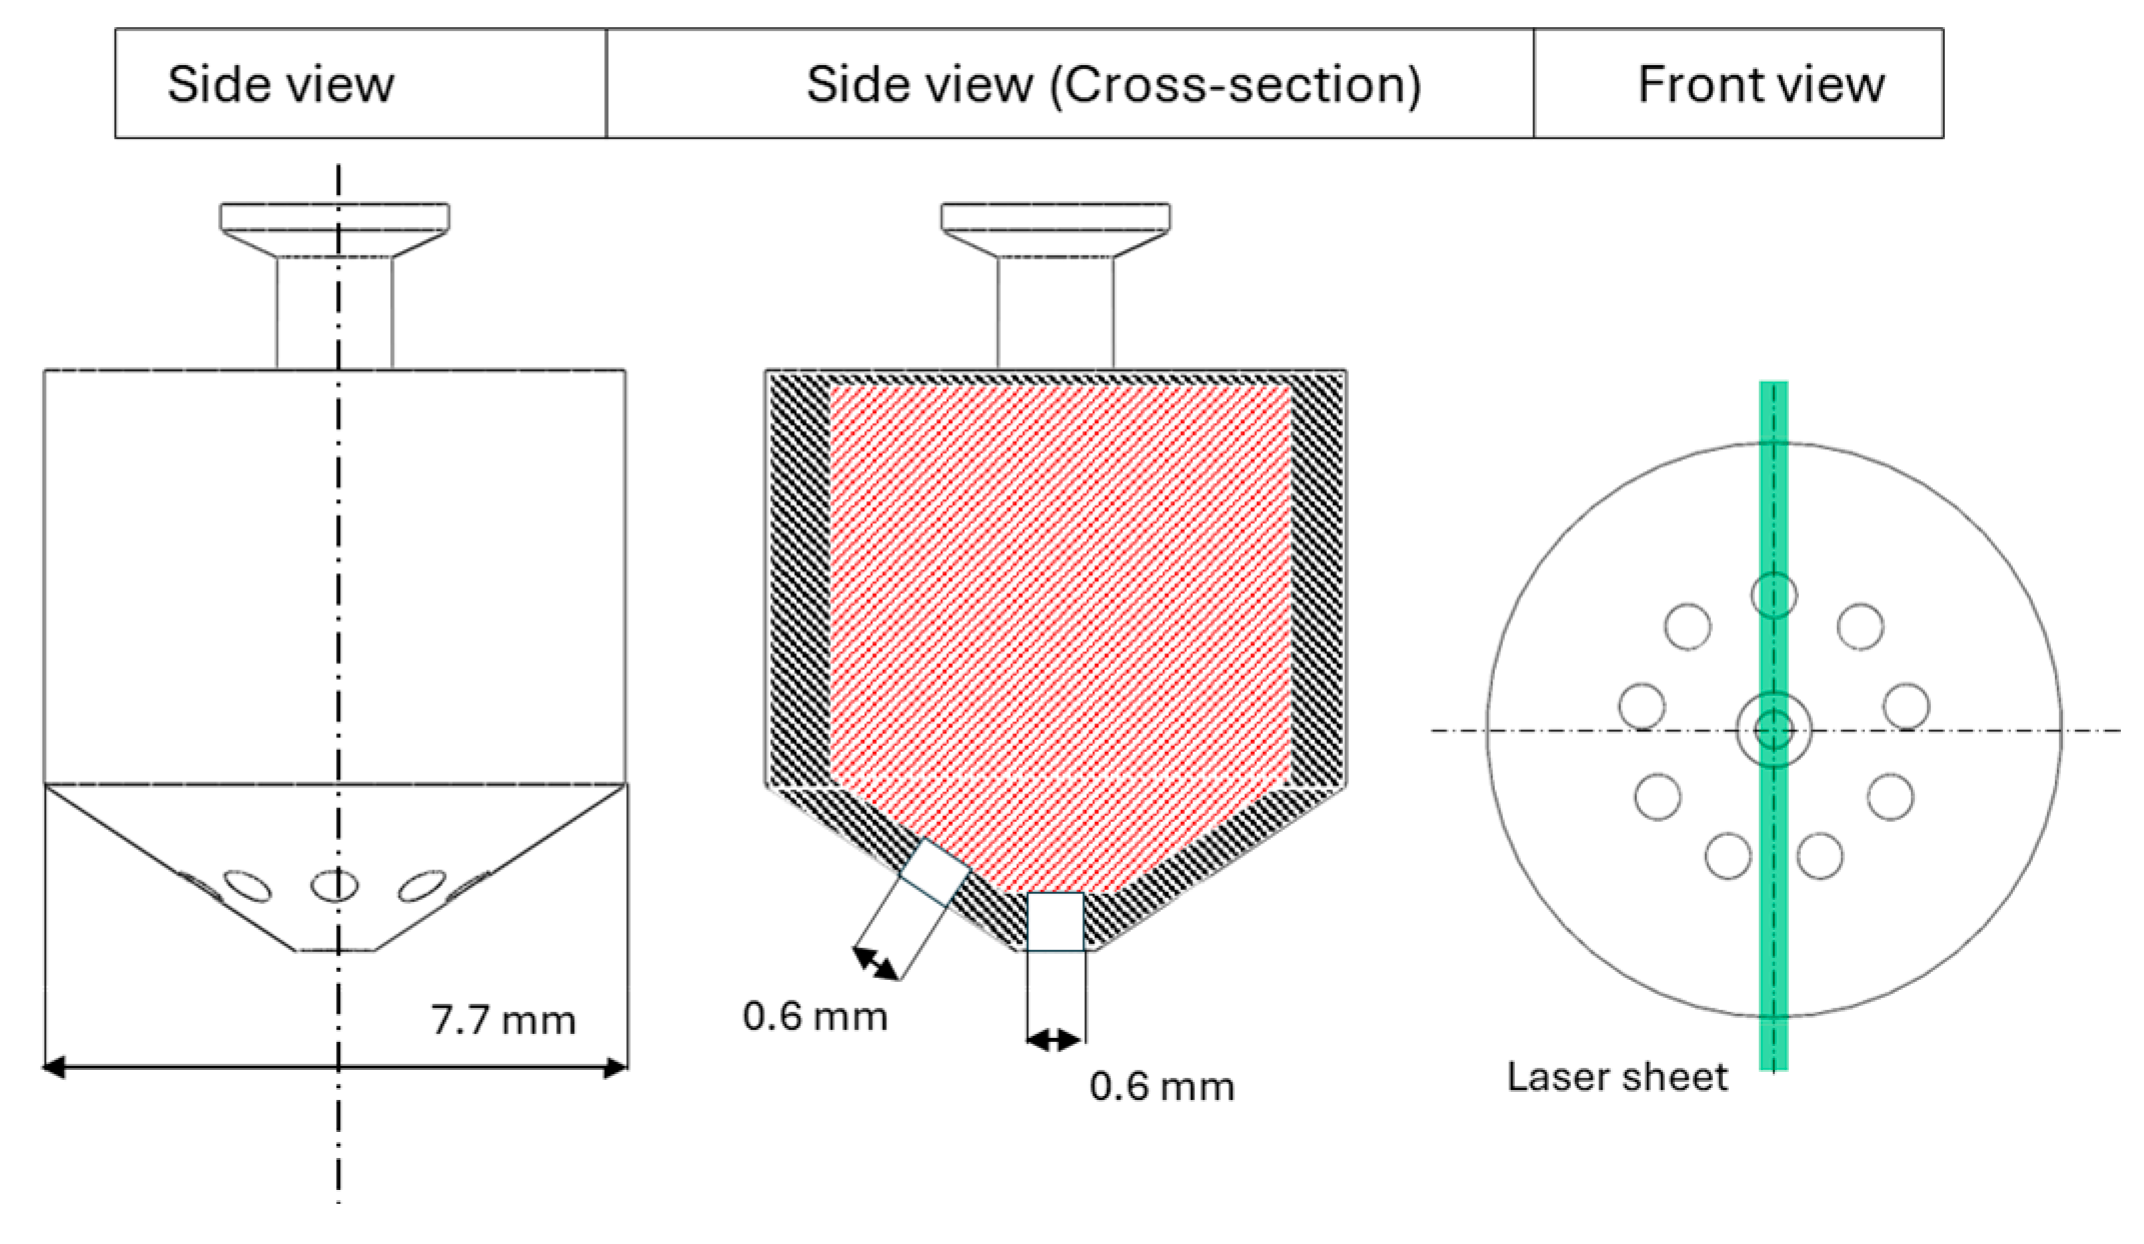
The resulting images of scattered light were recorded using an interline-transfer camera (TSI 630090, Shoreview, MN, USA) with a resolution of 2352 × 1768 pixels and 16-bit concentration per pixel. The frequency of acquisition was synchronized with the injection trigger, which for the present study was set equal to 0.3 Hz to ensure the return to the quiescent state of the environment inside the CVC between successive injections. For each test point 20 pairs of frames were recorded, with the first useful images recorded at 0.6 ms after start of energization (aSOE) and the injection duration was held constant at 3.5 ms for all conditions examined. Helium was supplied from compressed T-cylinder at 200 bar. The supply line is connected to the injector mounted on the top wall of the CVC. The delivery pressure was regulated using a manual valve while the fluctuations were monitored by a piezoresistive sensor. During tests, the pressure was observed to suffer a maximum oscillation of less than 4%, influencing in a negligible way on the flow-rate characteristics. A GDTech injector was used for all test points, featuring a customized nozzle cap with 10 holes. Of these, nine holes feature axes inclined at 30° with respect to the main injector axis, while the last one is aligned axially. Each orifice has a diameter of 0.6 mm, while due to confidentiality reasons, further details on the internal geometry cannot be provided. Considering the geometry of the nozzle cap, the laser sheet intersects the nozzle cap capturing the one axially aligned orifice and one side-orifice, while passing between two orifices on the opposite side, as illustrated in Figure 2.
Figure 2.
Nozzle cap body featuring 10 holes, each one with a diameter of 0.6 mm. Red dashed area refers to the geometry specifics covered by confidentiality (GDTech Company, Houston, TX, USA).
4. Methodology
In this section, the methodology used to post-process the recorded images is described and the uncertainty parameters are analyzed.
4.1. Image Post-Processing Procedure
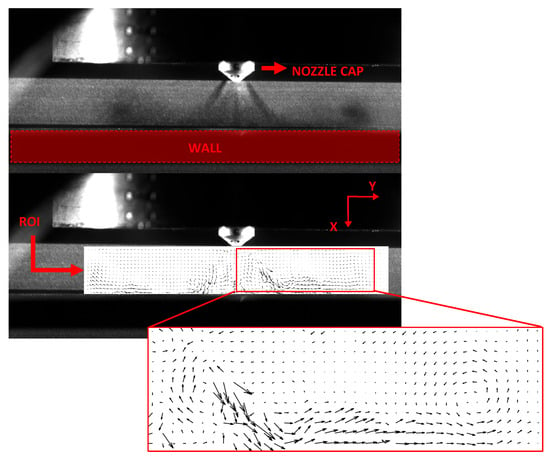
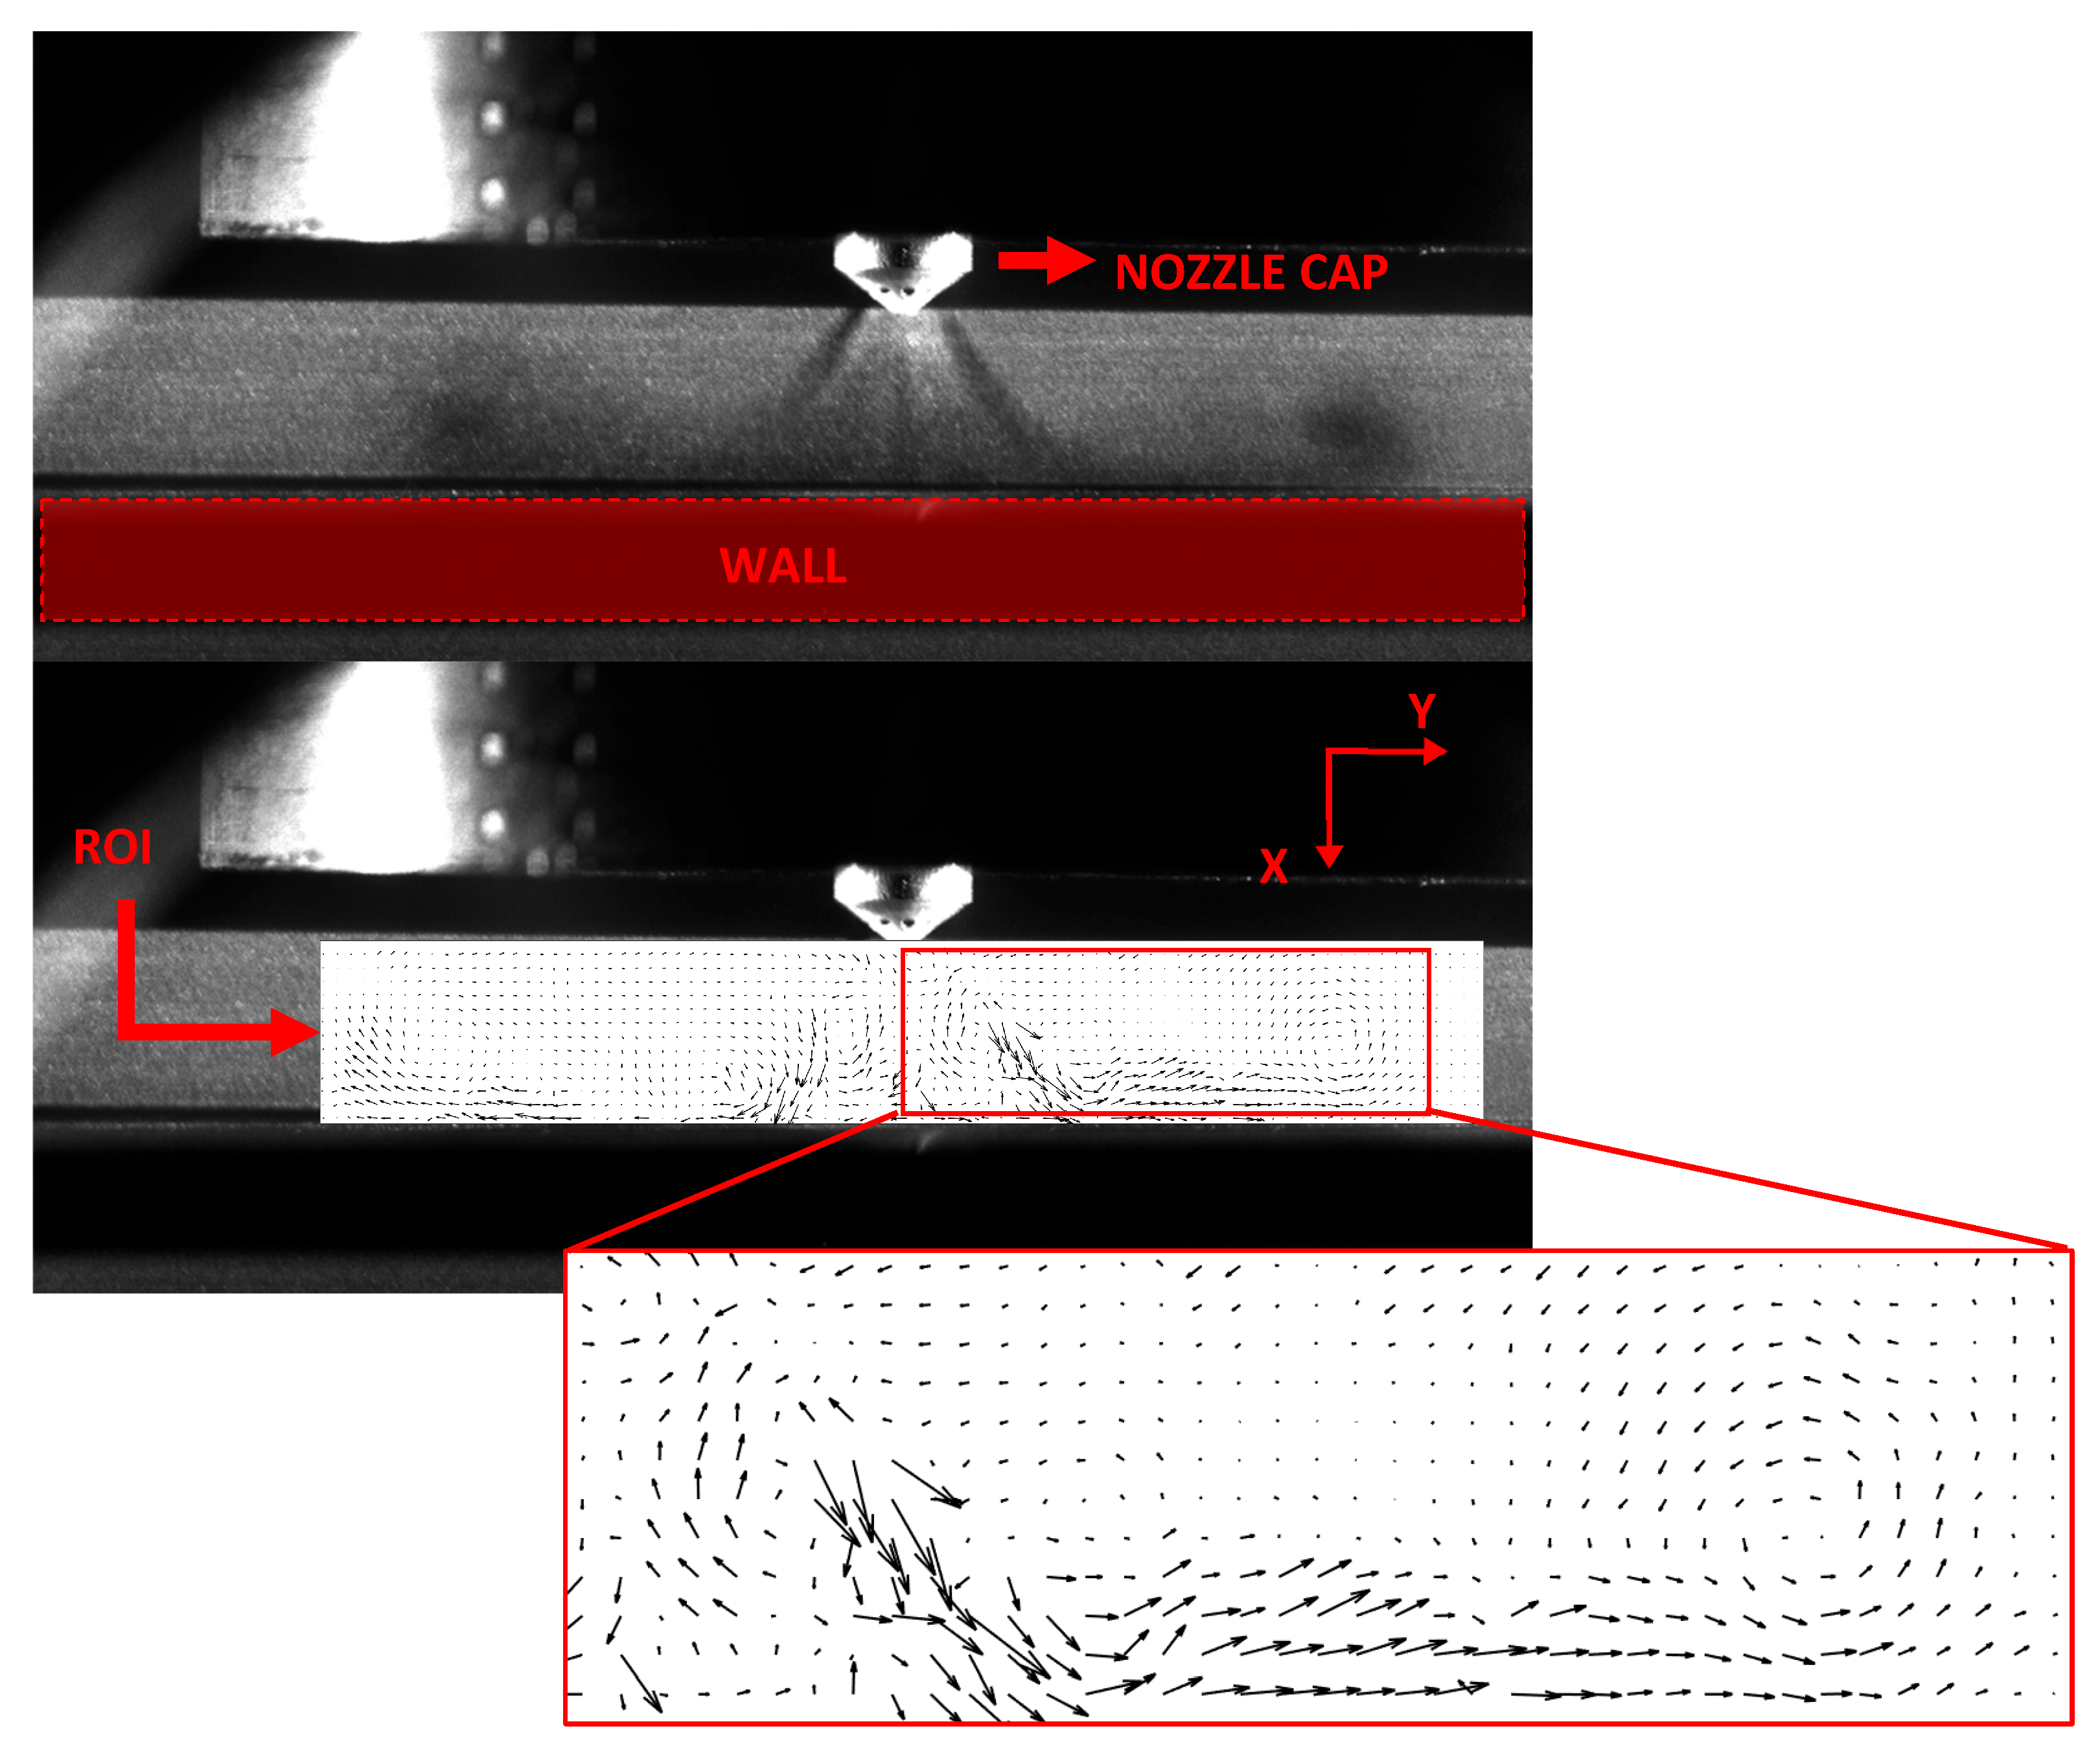
The images acquired by the camera were processed by using an open-source tool, PIVlab v2.61, Matlab R2022b (Natick, MA, USA). The vector plots were obtained by applying a cross-correlation algorithm to evaluate the tracker particles displacement between consecutive frames. Next, for each experimental condition, the raw scattered-light images were post-processed to improve their quality. Specifically, the jets have been put in the foreground by using the contrast limited adaptive histogram equalization (CLAHE) and auto-contrast (AC) filtering. The first is an image pre-processing technique that elaborates several histograms, each corresponding to a distinct region of the raw image and uses them to redistribute the luminous values of the image [26]. Conversely, the AC filter performs a global linear stretch and offsets the image intensity range, adjusting highlights and shadows to improve the contrast of the examined image. Subsequently, the so obtained pairs of frames were investigated by using a multi-step process by changing the size of the interrogation area (IA). This window is defined as the area used by the software to perform the cross-correlation analysis. For the present work, the IA was set equal to 32 × 32 pixels, then refined to 16 × 16 pixels with a 50% overlap in horizontal and vertical directions. The diameter of the nozzle cap was used to calibrate the spatial resolution of the PIV analysis, resulting in a pixel-to-millimeter ratio of approximately 21 px/mm. Given the dimensions of the IA and the diameter of the single hole (one PIV grid point every 0.76 mm), the current setup would not be able to provide accurate information on the flow field close to the injector tip. To this end, it is worth highlighting that the present investigation analyzes the jet downstream of the nozzle, where the jet is much wider than the nozzle diameter. Figure 3 illustrates the example of background-removal operation (top) and corresponding vector field obtained by a single pair of frames for the 10 mm configuration. Considering the two-dimensional nature of the PIV analysis, the coordinate system was set to generate an x–y plane whose origin (0, 0) corresponds to the nozzle cap end, while the x-axis is aligned with the main injector axis.
Figure 3.
Representation of PIV helium jet image: background removal (top) and corresponding vector plot (bottom). 10 mm configuration.
4.2. Uncertainty Analysis
For all test points, since it was not possible to completely avoid the presence of spurious vectors, two filters were applied to improve the PIV analysis. First, a standard deviation filter was applied to the raw vector field to remove vectors whose magnitude exceeded the threshold defined as
where Vmean is the average velocity calculated over the total spatial grid, n the user-imposed multiplier and σ the standard deviation. For the present study, n was set equal to 10. Vectors exceeding this threshold were replaced by the mean value of the neighboring cells. A second filter, based on a local median operator, was then applied. In a two-dimensional analysis, this filter generates a moving average within a square-shaped window to smooth local spikes. For the present work, the size of this window has been set equal to 6 × 6 cells. However, it should be noted that both filters were set to operate in a non-aggressive manner. This approach was made possible by the low number of spurious vectors compared to the spatial grid points, i.e., always <5%. As for the jet borders, unlike the Schlieren imaging [27], the PIV analysis does not allow direct identification of jet boundaries. The high pixel density and local inhomogeneity typical of this type of analysis led the software to interpret the data as point-like, making it impossible to identify a coherent boundary between the jet and the background. For this reason, several studies rely on indirect approaches to evaluate jet properties, based on the velocity field to estimate jet morphology. Specifically, although there are no global standards for the exact cut-off, values ranging from 20 to 30% of the peak velocity [28,29] are used to identify the borders, while higher limits are used to determine the jet core. This last is meant as the region of the jet structure that does not take part in the mixing process (≈100% fuel). For the present study, this threshold was set equal to 25%. However, it is worth highlighting that the PIV analysis provides an indirect measurement of flow velocity, as it returns the tracker displacement rather than that of the fuel itself. Consequently, the generated vector field is subject to a certain degree of uncertainty, which can be estimated from Taylor-series propagation and expressed by the equation:
where u is the measured velocity at coordinate (x, y), obtained by estimation of the displacement ∆X during the time interval ∆t, while Uu represents the corresponding uncertainty. The three variables refer to the uncertainty due to the displacement U∆X, laser pulse separation U∆t and magnification UM contributions. The last two parameters depend on laser characteristics (normally U∆t is around 1 ns, leading to a negligible error for most experiments) and on a correct calibration of the optical setup. Conversely, the first variable depends on the error between the real displacement (gas) and that measured (particles). Since it is not possible to know a priori the true displacement, the uncertainty quantification is assigned to different theoretical models or by specific experiments in controlled environments [30]. In this framework, the Stokes number (Stk) can be used to quantify a particle’s ability to follow the flow. It is defined as the ratio of the particle response time to the fluid characteristic time. Its formula is expressed as
where ρp is the tracker particle density (vegetable oil ≈ 900 kg/m3), dp2 the diameter (≈400 nm), U the velocity, μ the dynamic viscosity (1.98 × 10⁻⁵ Pa·s for helium) and L the characteristic length, which depends on the nozzle cap geometry. Considering the most severe conditions in terms of PR, i.e., 17, the measured speed was found to be approximately 230 m/s downstream of the injector cap. Considering a characteristic length equal to the equivalent diameter of all orifices of the nozzle cap (≈1.9 mm), Equation (3) returns a Stokes number value of around 0.05. This result suggests a good dynamic response of the trackers when subjected to sudden acceleration due to the gas injection.
5. Test Points
The test campaign examined a broad range of conditions by varying the pressure ratio (PR) from a minimum of 3 to a maximum of 17, obtained with a pressure of injection that swept across two values: 20–50 bar (gauge pressure), and a pressure inside the chamber that was increased from 2 to 4, and then 6 bar (gauge pressure). Table 2 summarizes the resulting values of PR examined.
Table 2.
Test points (* PRs calculated using absolute pressures).
In the following sections, the results are discussed with particular attention to the flow-field distribution. First, the jet speed evolution after the start of the energization (aSOE) of the injector is presented. Second, the jet–wall interaction is scrutinized by analyzing the velocity profiles measured at different distances from the plate. Finally, vorticity distribution and intensity are evaluated.
6. Jet Speed
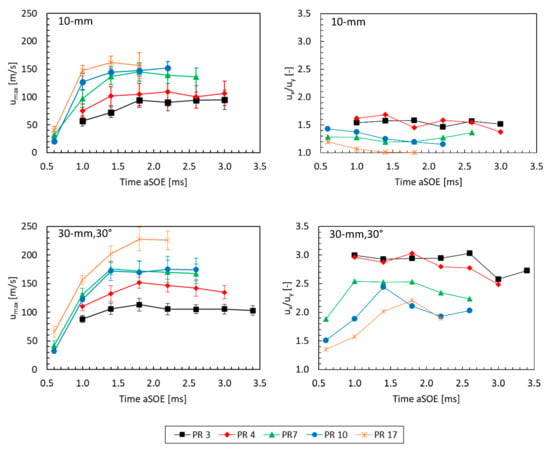
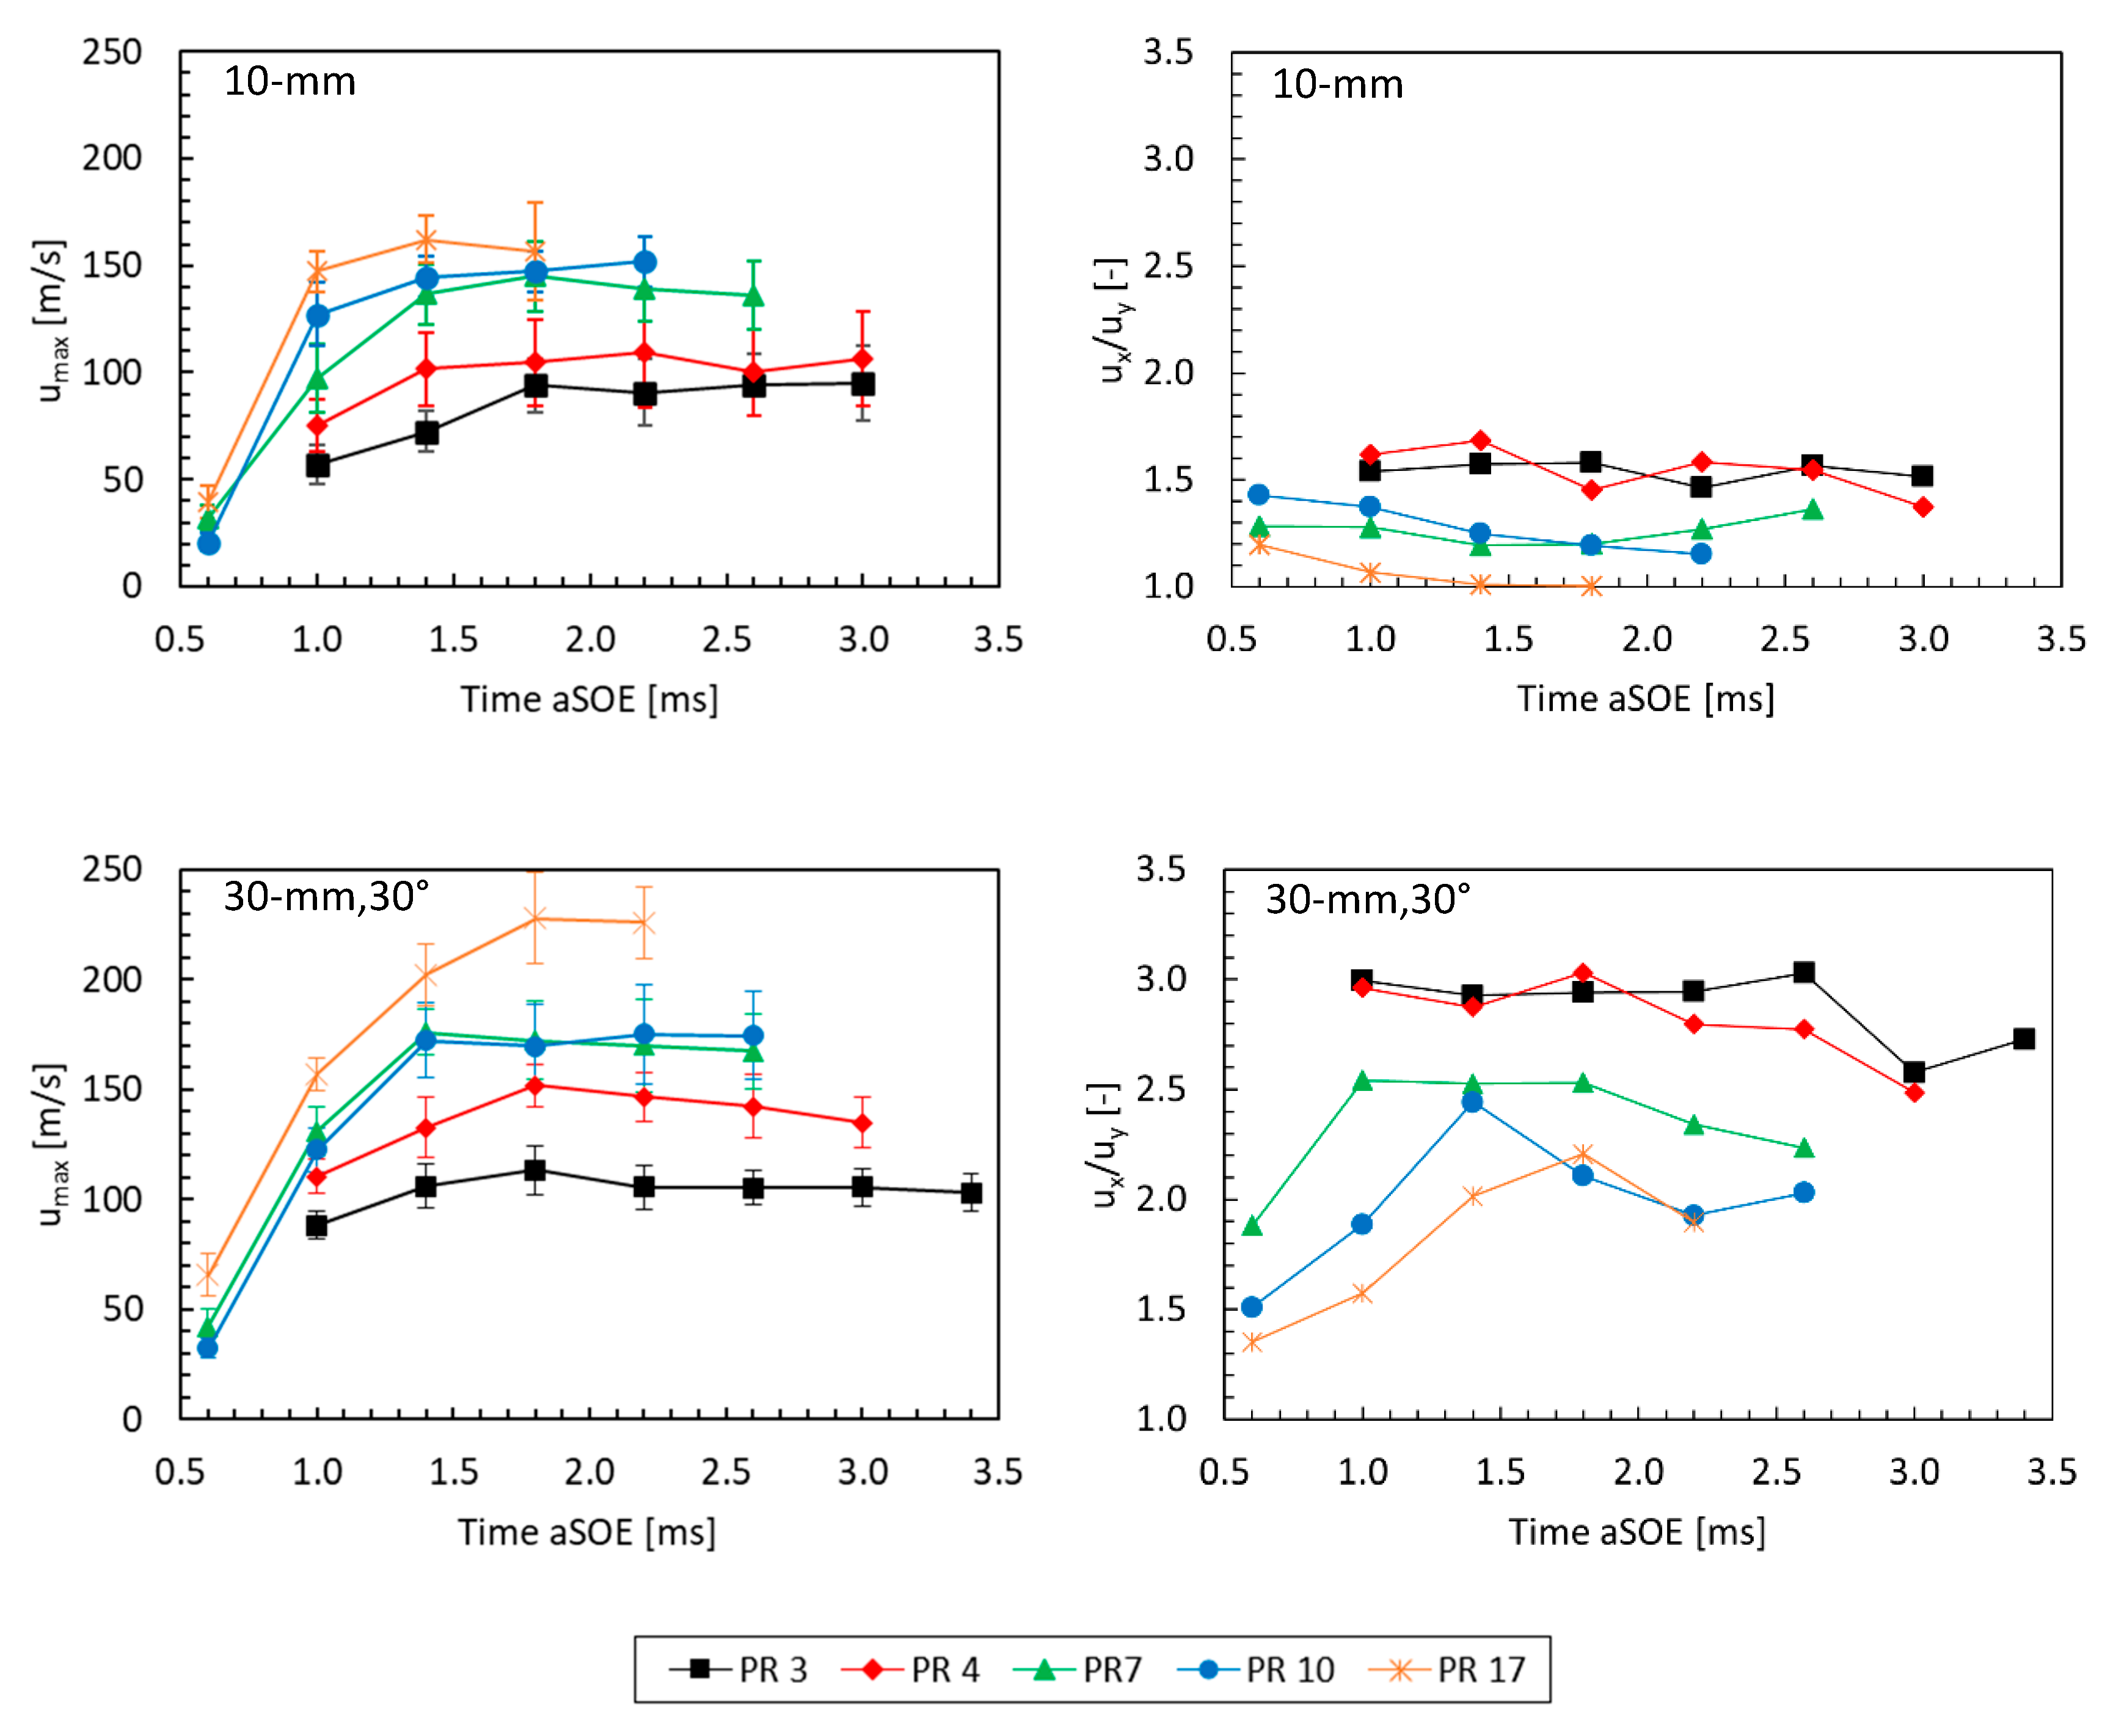
Figure 4 illustrates the influence of the pressure ratio (PR) on jet speed during different stages after injection for both configurations investigated in the present study. Given the ROI examined for this analysis, the trends shown in the graphs refer to the average values calculated from the peaks of each pair of frames. Specifically, the trend of the maximum jet velocity is shown in the graphs on the left column, while the ratio between the maxima of the x- and y-velocity components is illustrated in the graphs on the right column. Given the 10 mm configuration (Figure 4 top graphs), for the lower PR conditions, the structure of the jet observed after 0.6 ms aSOE influences only a small portion of the volume, resulting in a negligible distortion of the flow-field. Therefore, the data with PR = 3 and PR = 4 were investigated from 1.0 ms aSOE onwards. At early stages, the experiments conducted for PR = 7 to PR = 17 showed a rapid increase in velocity magnitude with speed sweeping from 35 to 45 m/s to 95–150 m/s. Subsequently, the profiles were noted to gradually increase and then stabilized on almost constant values. Compared to the data related to the 30 mm, 30° configuration (Figure 4 bottom graphs), the influence of the plate in decelerating the gas results is evident, with peak values that ranged from 90 m/s to 160 m/s. Considering the two-dimensional approach of the PIV analysis, the ratio between the speed components along x- and y-axes revealed the increasing capacity of the jet to propagate radially as the PR becomes higher. During jet–wall impingement the axial momentum of the jet is redirected along radial direction, while forming a stagnation zone downstream the main injector axis, in proximity of the wall surface (further details in next sections). However, to better interpret the ux/uy ratio profiles observed in Figure 4, it is of paramount importance to understand the conditions under which the jets reach the flat wall. In particular, it is necessary to account for the jet rectification phenomenon [31,32].
Figure 4.
Influence of PR on jet speed evolution and x-, y-components ratio for both 10 mm (top graphs) and 30 mm, 30° configurations (bottom graphs). The data refer to average values.
Considering the geometry used for this investigation and focusing on the jet produced by the single orifice inclined at 30°, immediately after injected inside the CVC the jet tends to correct its direction moving towards the main axis, due to the local drop of pressure generated by the central jet. In the current configuration, the presence of the flat wall at a close distance from the injector anticipates this deviation, then as the PR increases the jets gain momentum without having time to deviate, thus reaching the flat wall with a greater angle. As a consequence, due to the law of conservation of momentum, the jets are immediately redirected, contributing to the radial propagation. In line with these considerations, data in Figure 4 for 10 mm configuration (top right graph) show the noticeable role of radial component (uy) of velocity as PR increases. Particularly, the ux/uy ratio reaches its maximum value (≈1.7) for low PR conditions and decreases to 1 for PR = 17 condition during late stages of injection. Regarding the 30 mm, 30° configuration, the higher distance between the nozzle cap and the flat wall led to a substantial increase in jet speed. Except for PR = 17 condition, early-stage velocities are like those measured for the 10 mm configuration. To this end, the discrepancy recorded for PR = 17 at 0.6 ms aSOE can be related to the relatively small volume involved with the jet and the rapid increase in local acceleration which may result in a low number of tracker particles entrained in the structure. However, the longer distance between the injector and the plate contributes to an overall increase in jet speed; with increments ranging from 10% to 40% relative to 10 mm layout. Except for the test points examined with PR set equal to 7 and 10, all conditions showed clearly visible gaps in the speed profiles development, with stable values achieved during late stages of injection that ranged from 110 m/s (PR = 3) up to 230 m/s (PR = 17). In addition, the longer free path of the jet results in a marked decrease in radial propagation component, i.e., uy << ux.
Further, the investigations with the flat wall in 30 mm, 30° configuration showed the relatively low values of ux/uy ratio at early stages (for PR from 7 to 17), then rapidly increasing due to the dominance of rectification effect over radial propagation. Conversely, at low PR conditions it was not possible to gain insight at 0.6 ms aSOE, but the obtained ux/uy trends evidence the minor role of radial component even before the collision with the wall (uy ≈ 30% ux). This may be due to both rectification effect and the rate with which the jet dissipates the momentum by giving it to the surrounding air in the form of induced turbulent motions.
However, it should be noted that the ux/uy values measured at 0.6 ms aSOE differ from those for the 10 mm configuration, i.e., before the jets impinge on the flat wall. This discrepancy increases as the PR diminishes, with its maximum recorded for the experiments for PR = 7 (1.3→1.9). This behavior suggests that the presence of the flat wall at close distance to the nozzle cap affects the jet even before direct interaction occurs, producing a “cushion effect” characterized by a general slowdown of the penetration velocity of the jet head section. Together with previous configuration, these results demonstrate that wall geometry has a clear influence on jet behavior after impingement. The flat wall at short distance promotes the development of the radial mixing zone (RMZ) with a significant radial velocity, at expense of the region downstream the main injector axis. Here, the almost perpendicular angle of impingement leads to the formation of a stagnation area. In contrast, as the jets are free to distribute, more complex phenomena addressed to the jet rectification determine a narrow structure, limiting the projected area.
7. Jet–Wall Interaction
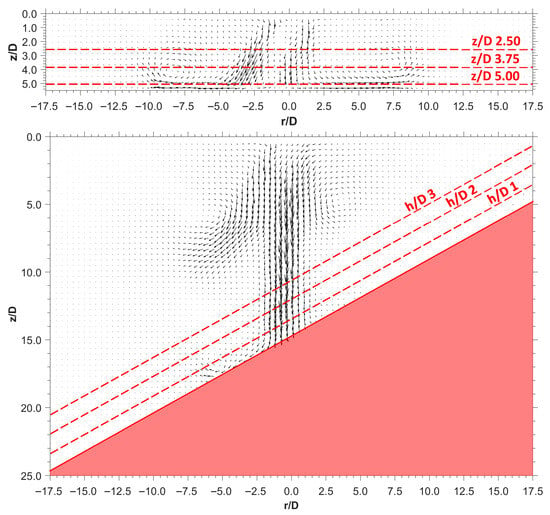
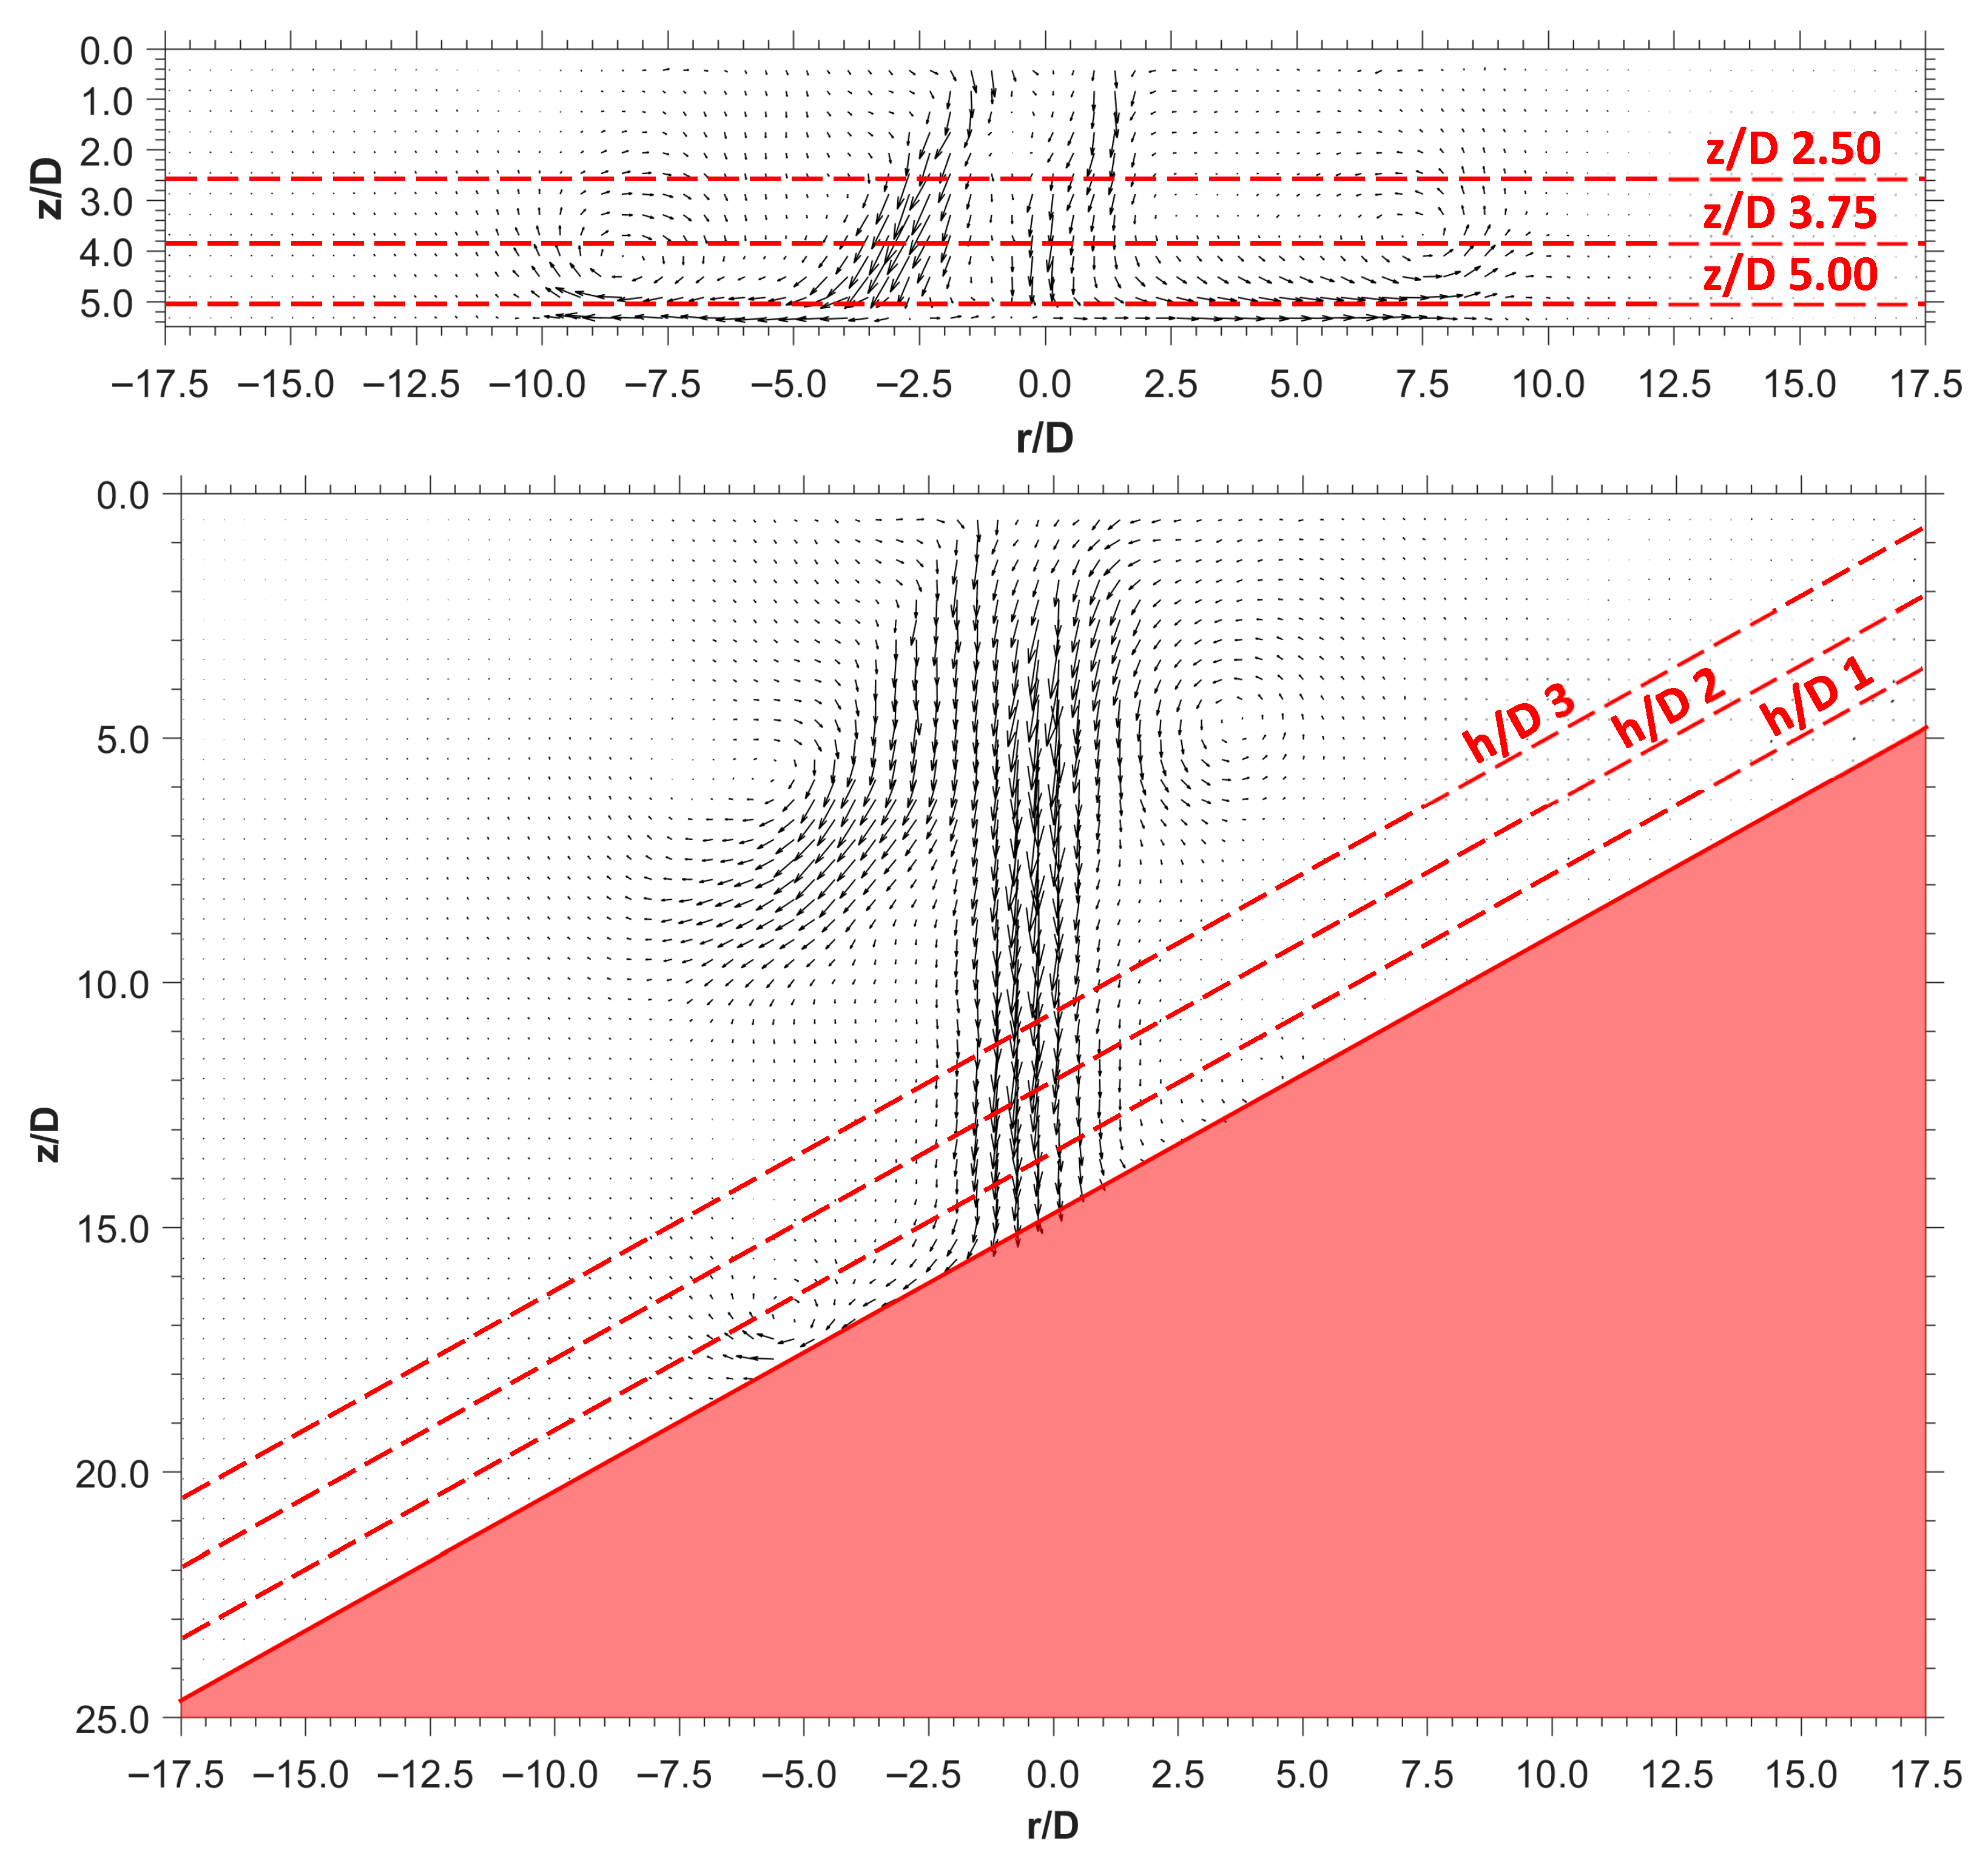
Considering the nozzle equivalent diameter D (≈1.9 mm), calculated as one orifice whose area is equal to the sum of all 10 holes of the customized nozzle cap, Figure 5 illustrates the x–y plane dimensions normalized with respect to the nozzle cap characteristics. As for the 10 mm configuration, three different distances from the injector tip were defined to measure the speed profiles: z/D = 2.5, z/D = 3.75 and z/D = 5.0. Differently, for the 30 mm, 30° layout, the speed characteristics were measured at three different heights from the flat wall: h/D = 1, h/D = 2 and h/D = 3. It is important, however, to underline that the vector fields shown in the graph below refer to the average data, determined from the 20 pairs of frames recorded. Thus, these vector fields do not correspond to a real jet development sequence, rather, they represent probability-density plot. In addition, for each operating condition, the velocity profiles were normalized by the respective average speed values to facilitate comparison across PR conditions and configurations.
Figure 5.
Example of vector plot for both configurations at 1.4 ms aSOE: 10 mm (top) and 30 mm, 30° (bottom). The data refer to average values.
7.1. 10 mm
In Figure 6 are shown, for comparison, the speed profiles for three representative PRs at different aSOE timings selected to show the after-impingement stages at similar radial propagation of the jets. It should be noted that the data reported below have been normalized with respect to the mean value. Specifically, this parameter is obtained by calculating the average velocity within the jet edges, not across the entire ROI identified for each pair of frames. Indeed, using a global parameter would have been unsuitable, since most of the ROI remains unaffected by the jet, leading to the measurement of extremely low velocity values, resulting in out-of-scale ranges after normalization. Therefore, after calculating the maximum speed within the ROI, a 25% threshold was set to identify the jet edges. Subsequently, the average velocity is calculated using a script developed in Matlab.
Figure 6.
Influence of PR on speed profiles. Configuration: 10 mm. The data refer to average values.
Looking at Figure 6, the local velocity peaks measured outside the projected area of the jets reach their maximum magnitudes near the flat wall surface (z/D = 5.0), ranging from 90% to 150% of the calculated mean speed value of each examined condition. Differently, the speed values measured on the other profiles (z/D = 2.5 and z/D = 3.75) remain on lower values during all stages of injection (≈70%), suggesting a general loss of momentum of turbulent structures as they recoil on themselves. Considered the almost symmetric-sharp, the trend visible in Figure 6 can be addressed to the presence of a vortex ring surrounding the end of the jet while expanding of the flat wall. In addition, the PR was observed directly to influence the velocity as well as the “thickness” of gas layer sliding along the flat wall, slightly increasing the speed values measured at z/D = 2.5 and z/D = 3.75. However, while the presence of a nearby obstacle promotes the formation of radially outward-moving jets, it was noted the presence of a stagnation zone as the PR increases. Specifically, except the experiments for PR = 3 and PR = 4, the interaction of the jets with the wall highlighted a localized area downstream the injector axis characterized by an irregular trend of velocity featuring a relatively low magnitude, i.e., 50–60% compared to the mean values (Figure 6). In this region the abrupt deceleration of the central jet leads to a sudden increase in pressure, contributing to a partial confinement of the gas that does not actively take part in the mixing process. In terms of practical application, such as that for a DI engine, this result suggests the need for a more elaborate bowl geometry of the piston to redirect the jets in a more efficient way. This outcome gains even more value as this concentrated quantity of fresh charge, supposed to be hydrogen, can easily bring to the occurrence delayed or abnormal combustion, with consequent effects over NOx emissions and loss of performance.
7.2. 30 mm, 30°
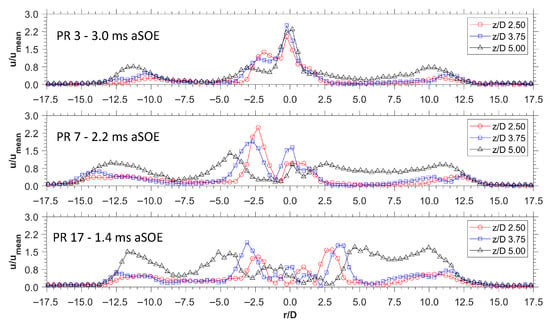
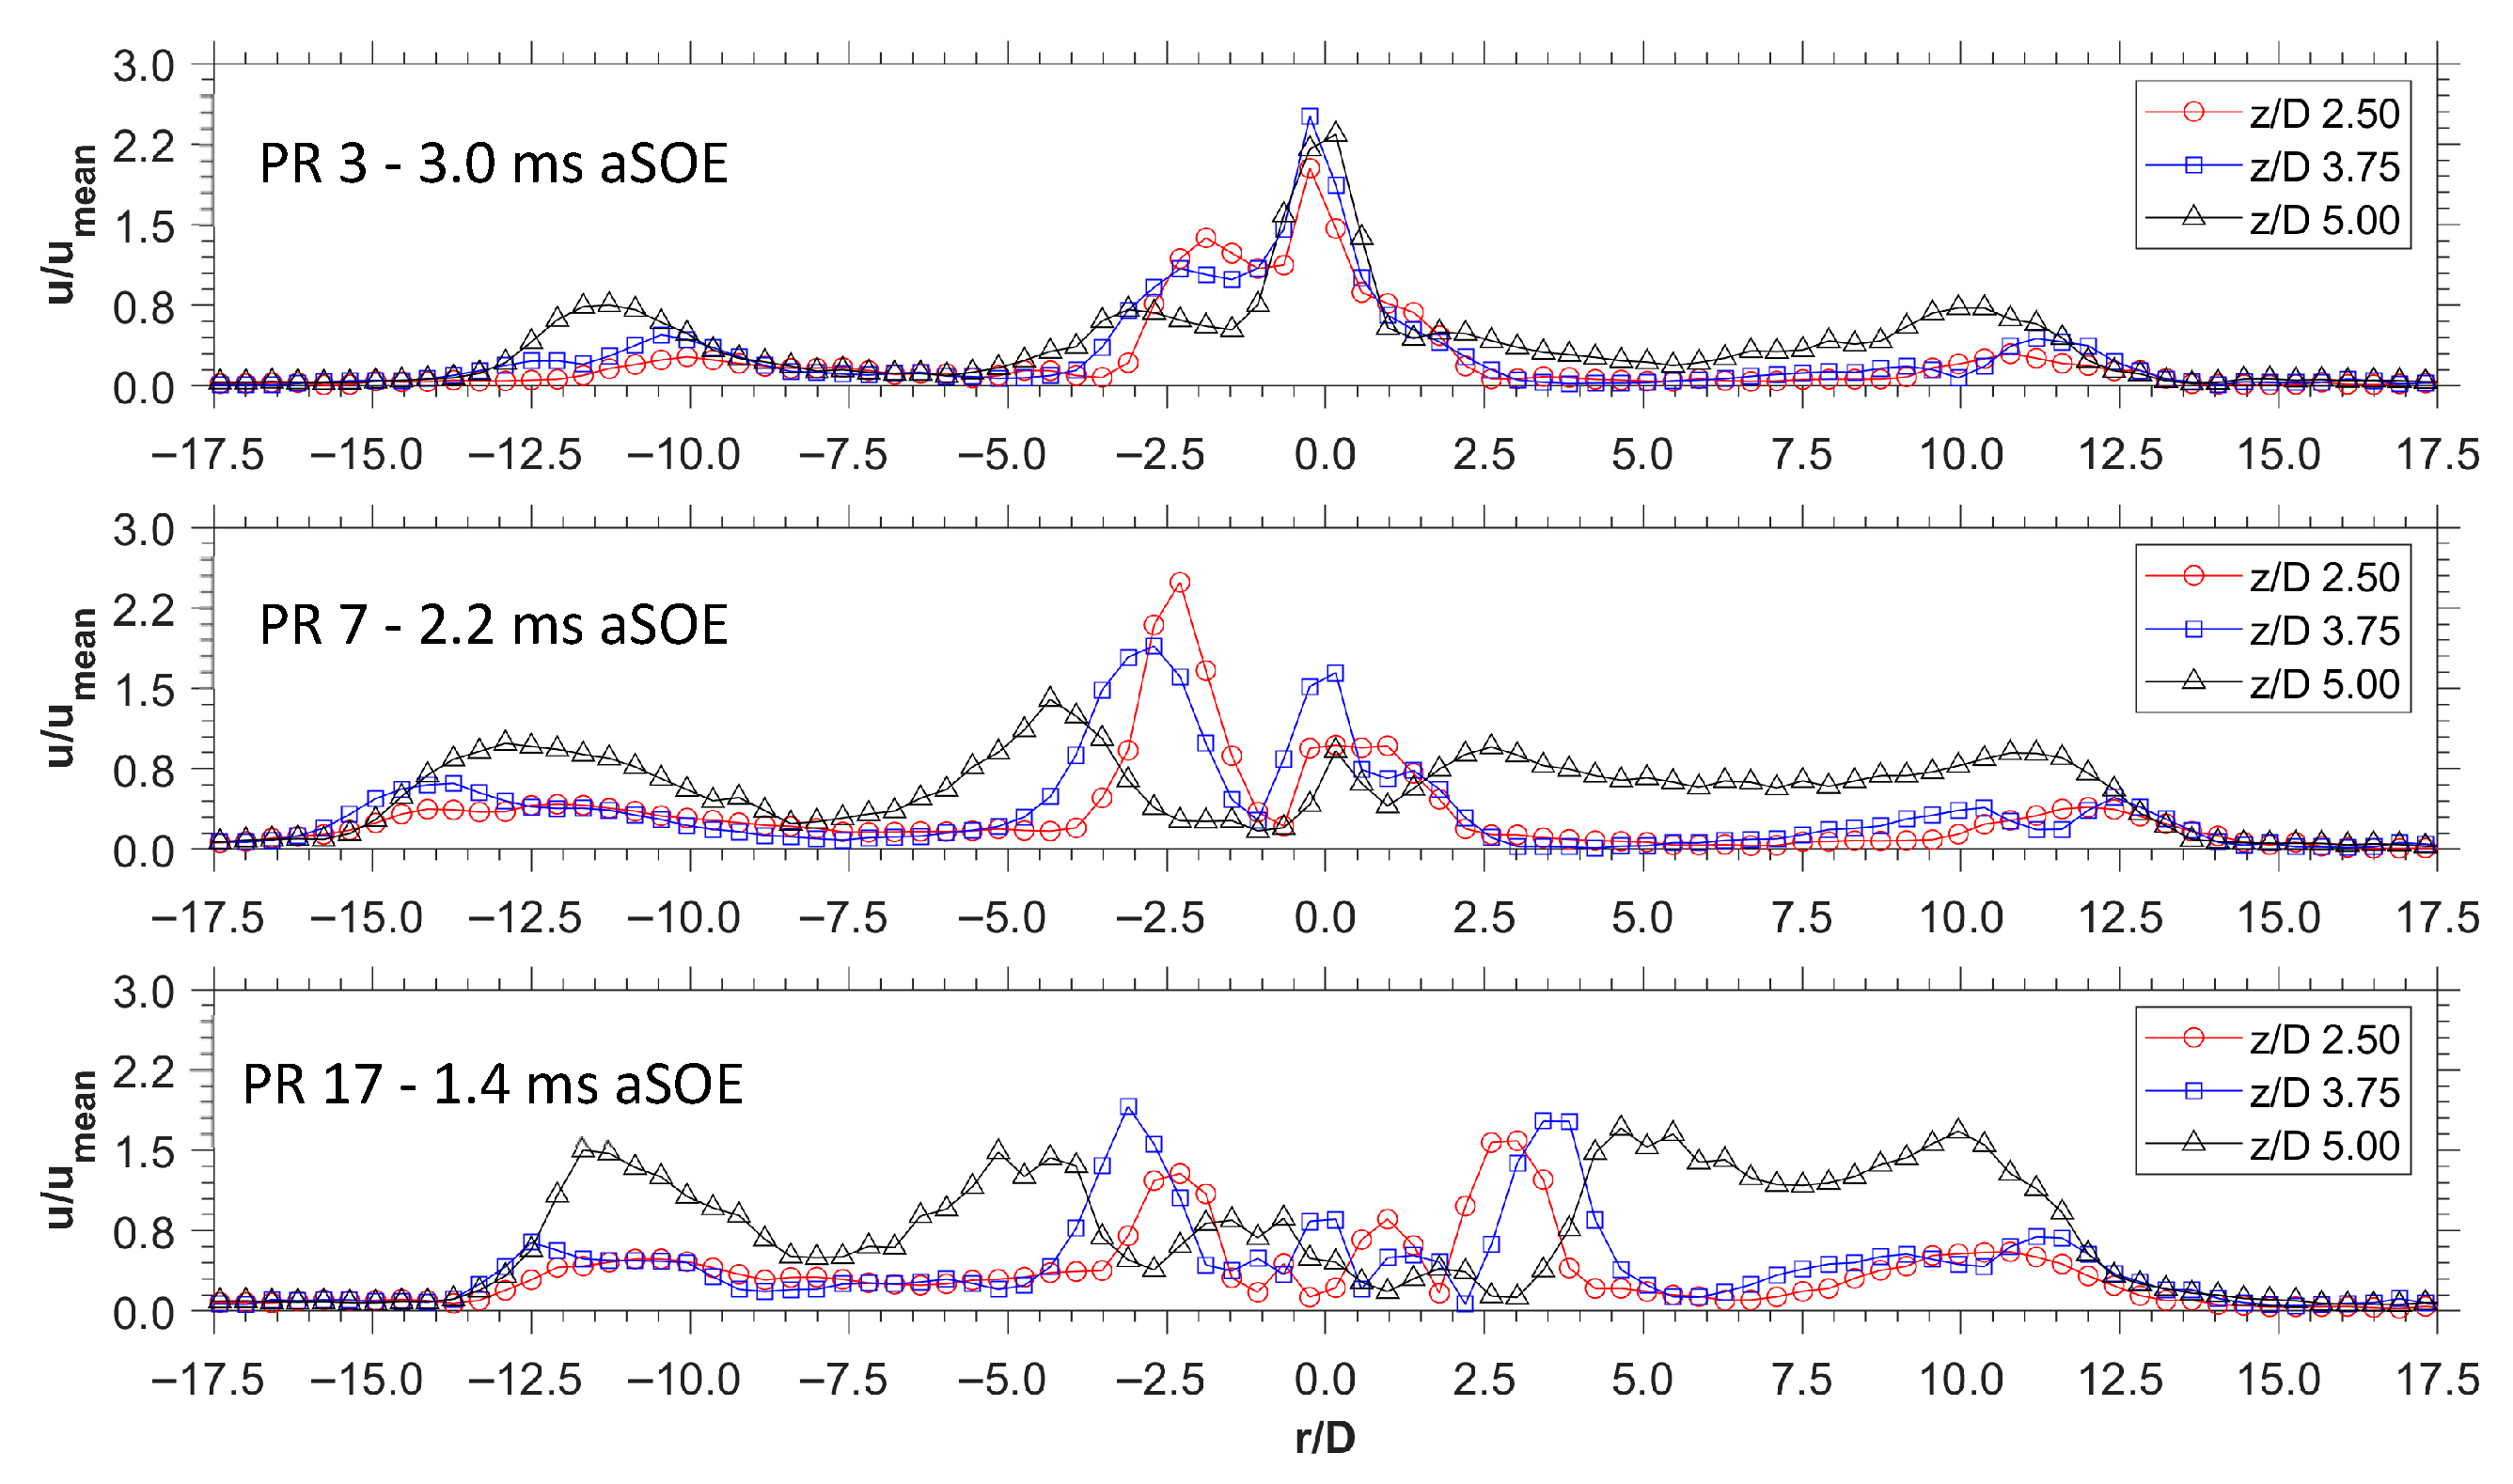
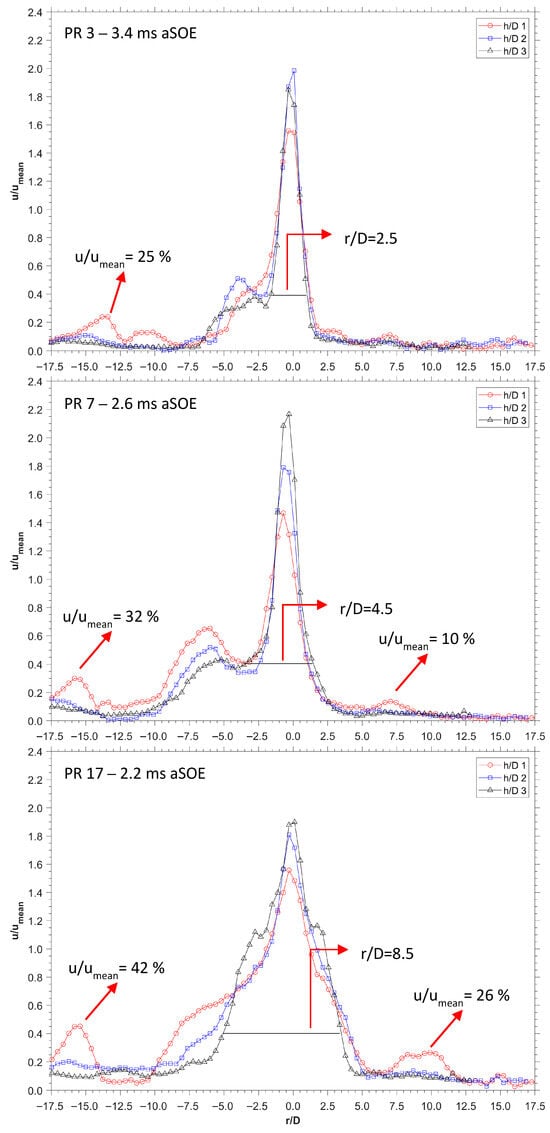
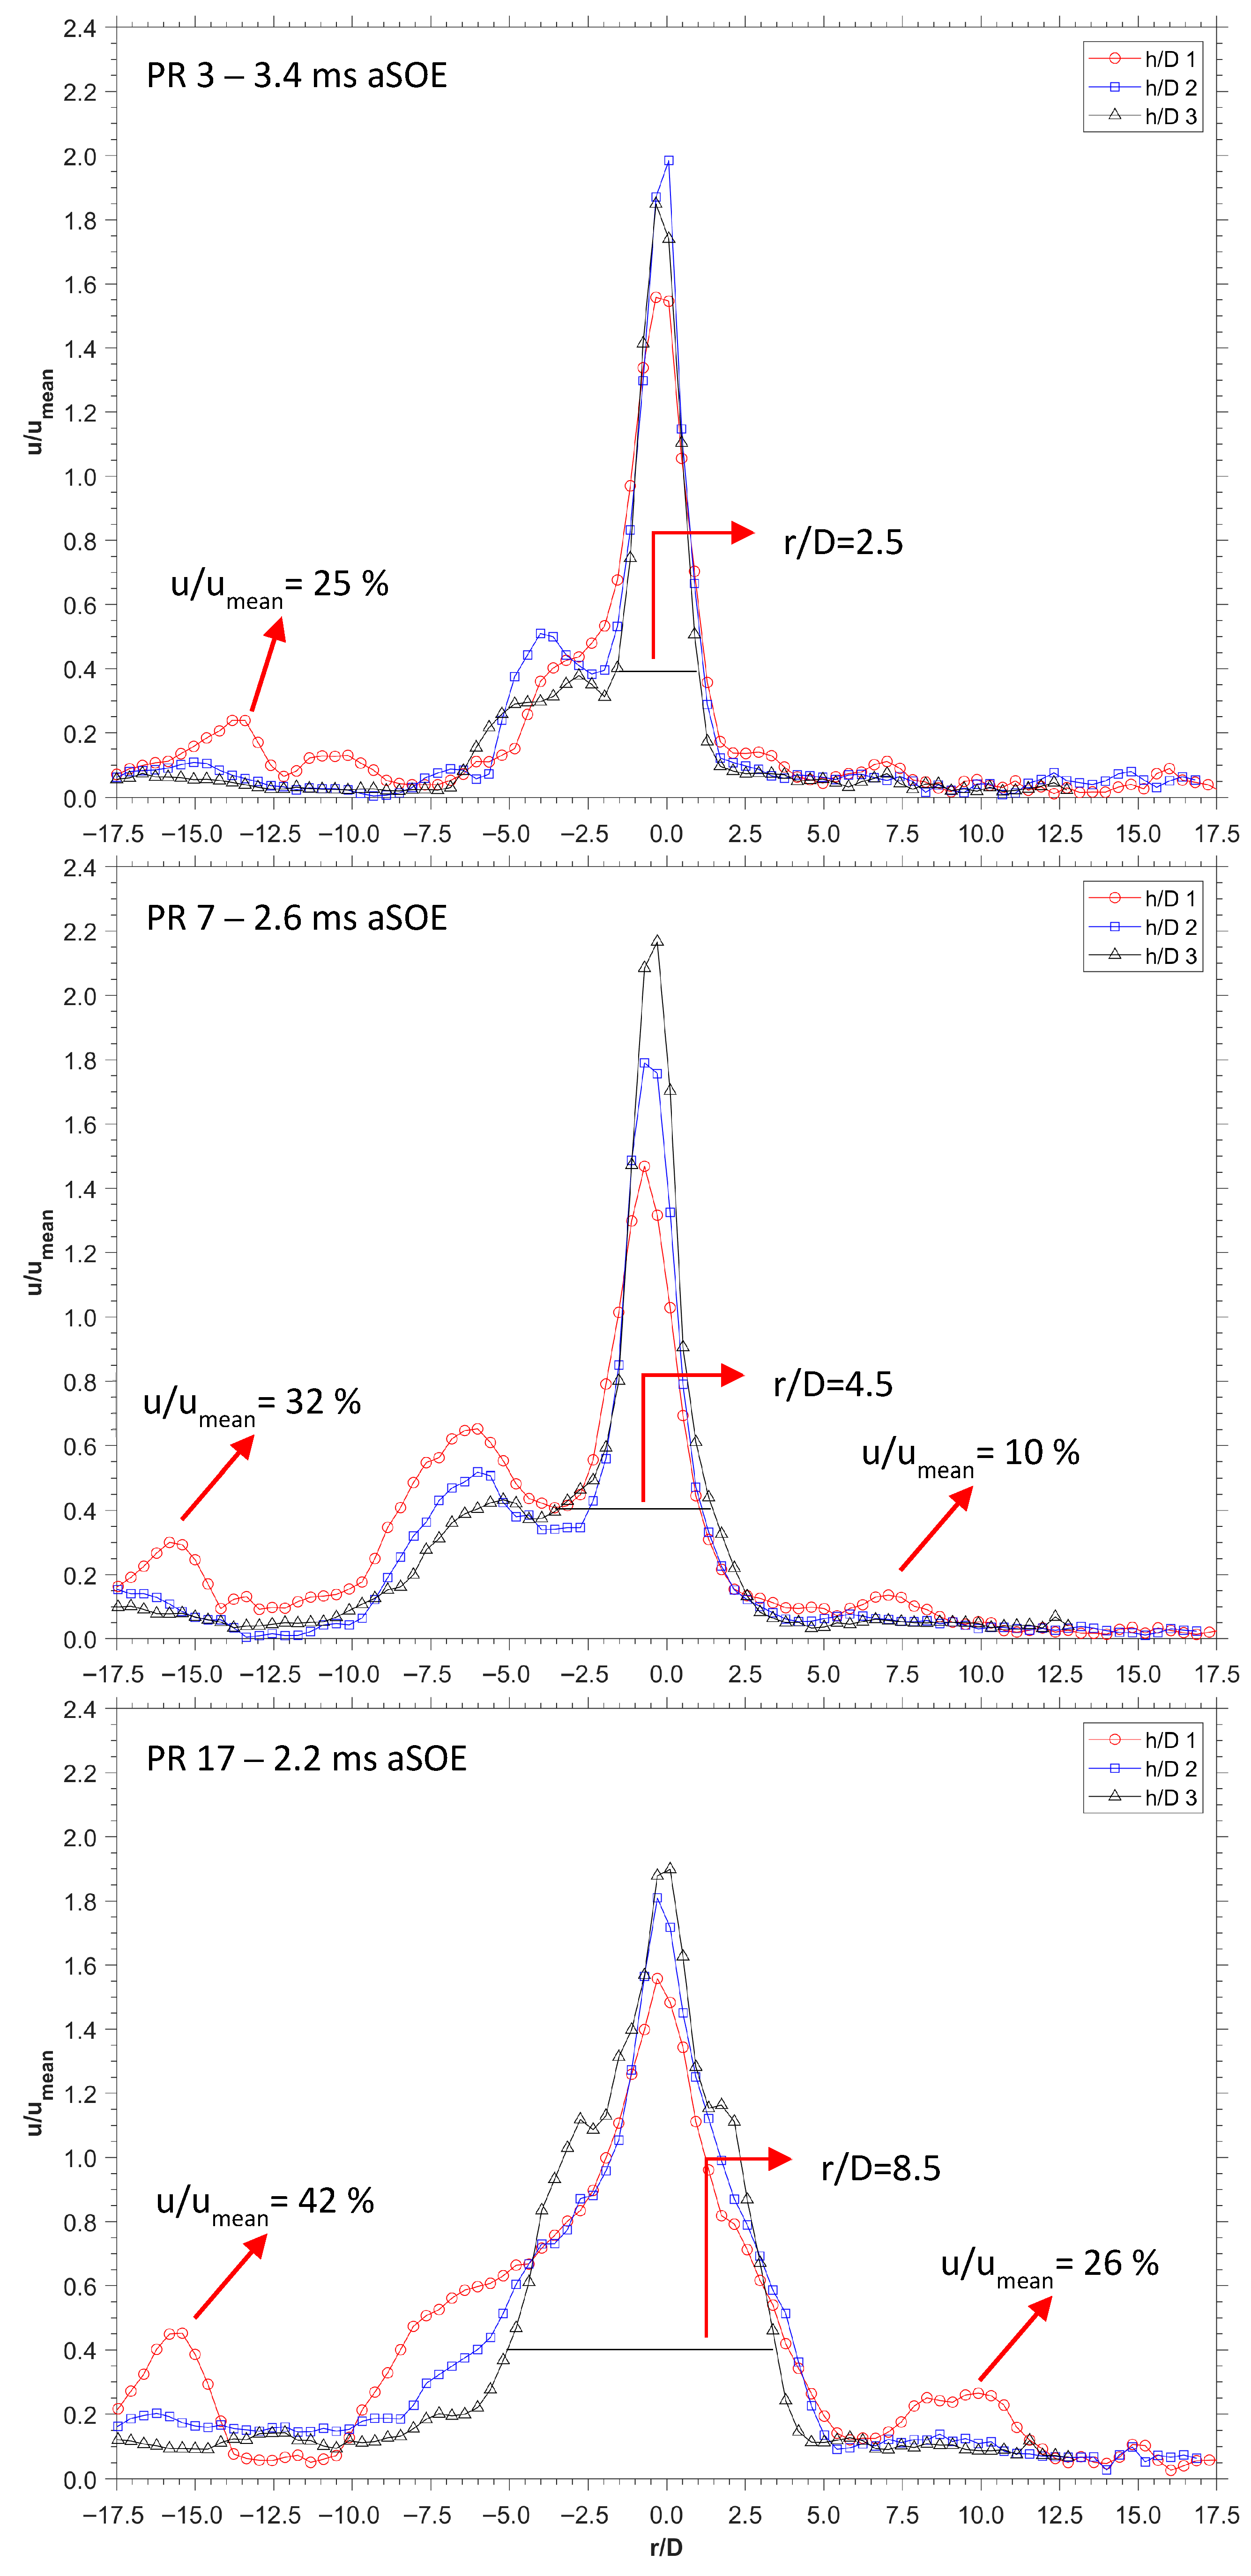
Considering the scenario involving an anticipated injection from a side-mounted injector, the 30 mm, 30° configuration can provide a first overview on the behavior of a jet impinging on an inclined wall. Similarly to the previous graphs, Figure 7 shows the influence of PR on speed profiles when the jet is at comparable development stages. The greater distance between the flat wall and the nozzle cap allows the jets for an initial free penetration, accompanied by a progressive increase in speed. In this configuration, the lateral jets were observed to deviate towards the axis of the injector, coinciding with the central jet, with speed depending on the PR. In line with the momentum conservation, higher values of the PRs allow for greater radial propagation, overcoming both backpressure resistance and counterbalancing the rectification effect. Consequently, the rise in PR contributes to a continuous growth of the area influenced by the gas. This behavior becomes appreciable when the jet is fully developed, with Figure 7 presenting the velocity measured at three different distances from the wall under three different PR conditions. For PR = 3 (Figure 7 top), the jets impinge on the flat wall involving a relatively small portion of air in mixing process (r/D = 2.5 at h/D = 3). Outside the projected area, a local velocity peak was identified along h/D = 1 line at coordinate r/D = 13.5, featuring a magnitude equal to 25% relative to the average speed, thus suggesting the presence of a vortex ring. As the pressure ratio increases, the dimension of the area projected over the plate increases, resulting in a greater amount of air involved in mixing processes at wall surface. Additionally, for PR = 7 (Figure 7 middle) two peaks in speed profiles were noted outside the projected area, at r/D = 7 and r/D = 16, with a relative magnitude of 10% and 32%. A further increase in PR led the lateral jet to keep their direction along their axis until the interaction with the flat wall, resulting in a greater projected area of the jet impinging on the surface. Specifically, the area involved by the jets impinging the flat wall passes from r/D = 2.5 for PR = 3, to r/D = 8.5 for PR = 17 (values measured along h/D = 3 with a u/umean threshold equal to 40%).
Figure 7.
Influence of PR on speed profiles; PR 3 (top), PR 7 (middle) and PR 17 (bottom). Configuration: 30 mm, 30°. The data refer to average values.
In contrast to the stagnation effect observed for the 10 mm configuration, the 30 mm, 30° configuration allows the jet to interact with the wall with a greater angle, resulting in a smoother “slip” of the gas along the wall surface, rather than an abrupt deceleration. To quantify this effective, considering the velocity measured along the closest line to the wall (h/D = 1) and focusing on the values in proximity of the injector axis, the measured speed lies in a range between 150 and 160% compared to the mean jet velocity. For comparison, considering both lines at z/D = 3.75 and z/D = 5.0 of 10 mm configuration, except the lowest PR condition, the speed reached a relative magnitude ranging from 50% to 60% along main injector axis (Figure 6). These results confirm the benefits due to the absence, or significantly reduced, area of stagnation as the plate is moved away. On the other hand, greater is the distance of the injector from the flat wall, the lower the ability of the jets to promote the formation of vortices on the plate. In quantitative terms, considering the speed values, with 30 mm, 30° configuration (Figure 7), the spikes observed outside the projected area ranged from 10% to 42%; thus, well below the values calculated for 10 mm configuration, i.e., 90–150%. Assuming two well-distinct scenarios of injection strategies, these findings demonstrate the critical role of injection timing over jet propagation and post-collision characteristics, highlighting the capacity of generating significant turbulence in proximity of the wall surface depending on the piston position.
8. Vorticity
The vorticity is defined as the pseudovector describing the local spinning motion of a random point immersed in a flow. Mathematically, the vorticity intensity ω [s−1] is expressed by the equation
where ∇ is the nabla operator and v the flow velocity. In a two-dimensional analysis this equation becomes
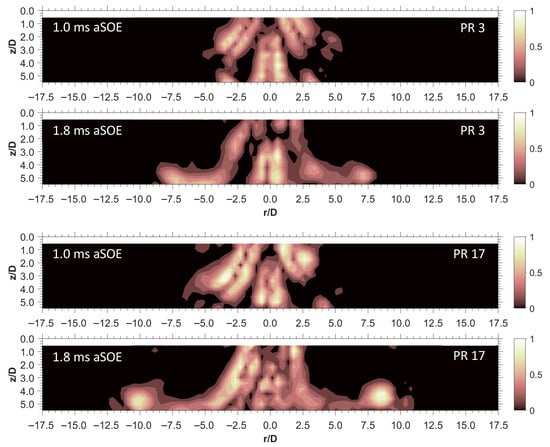
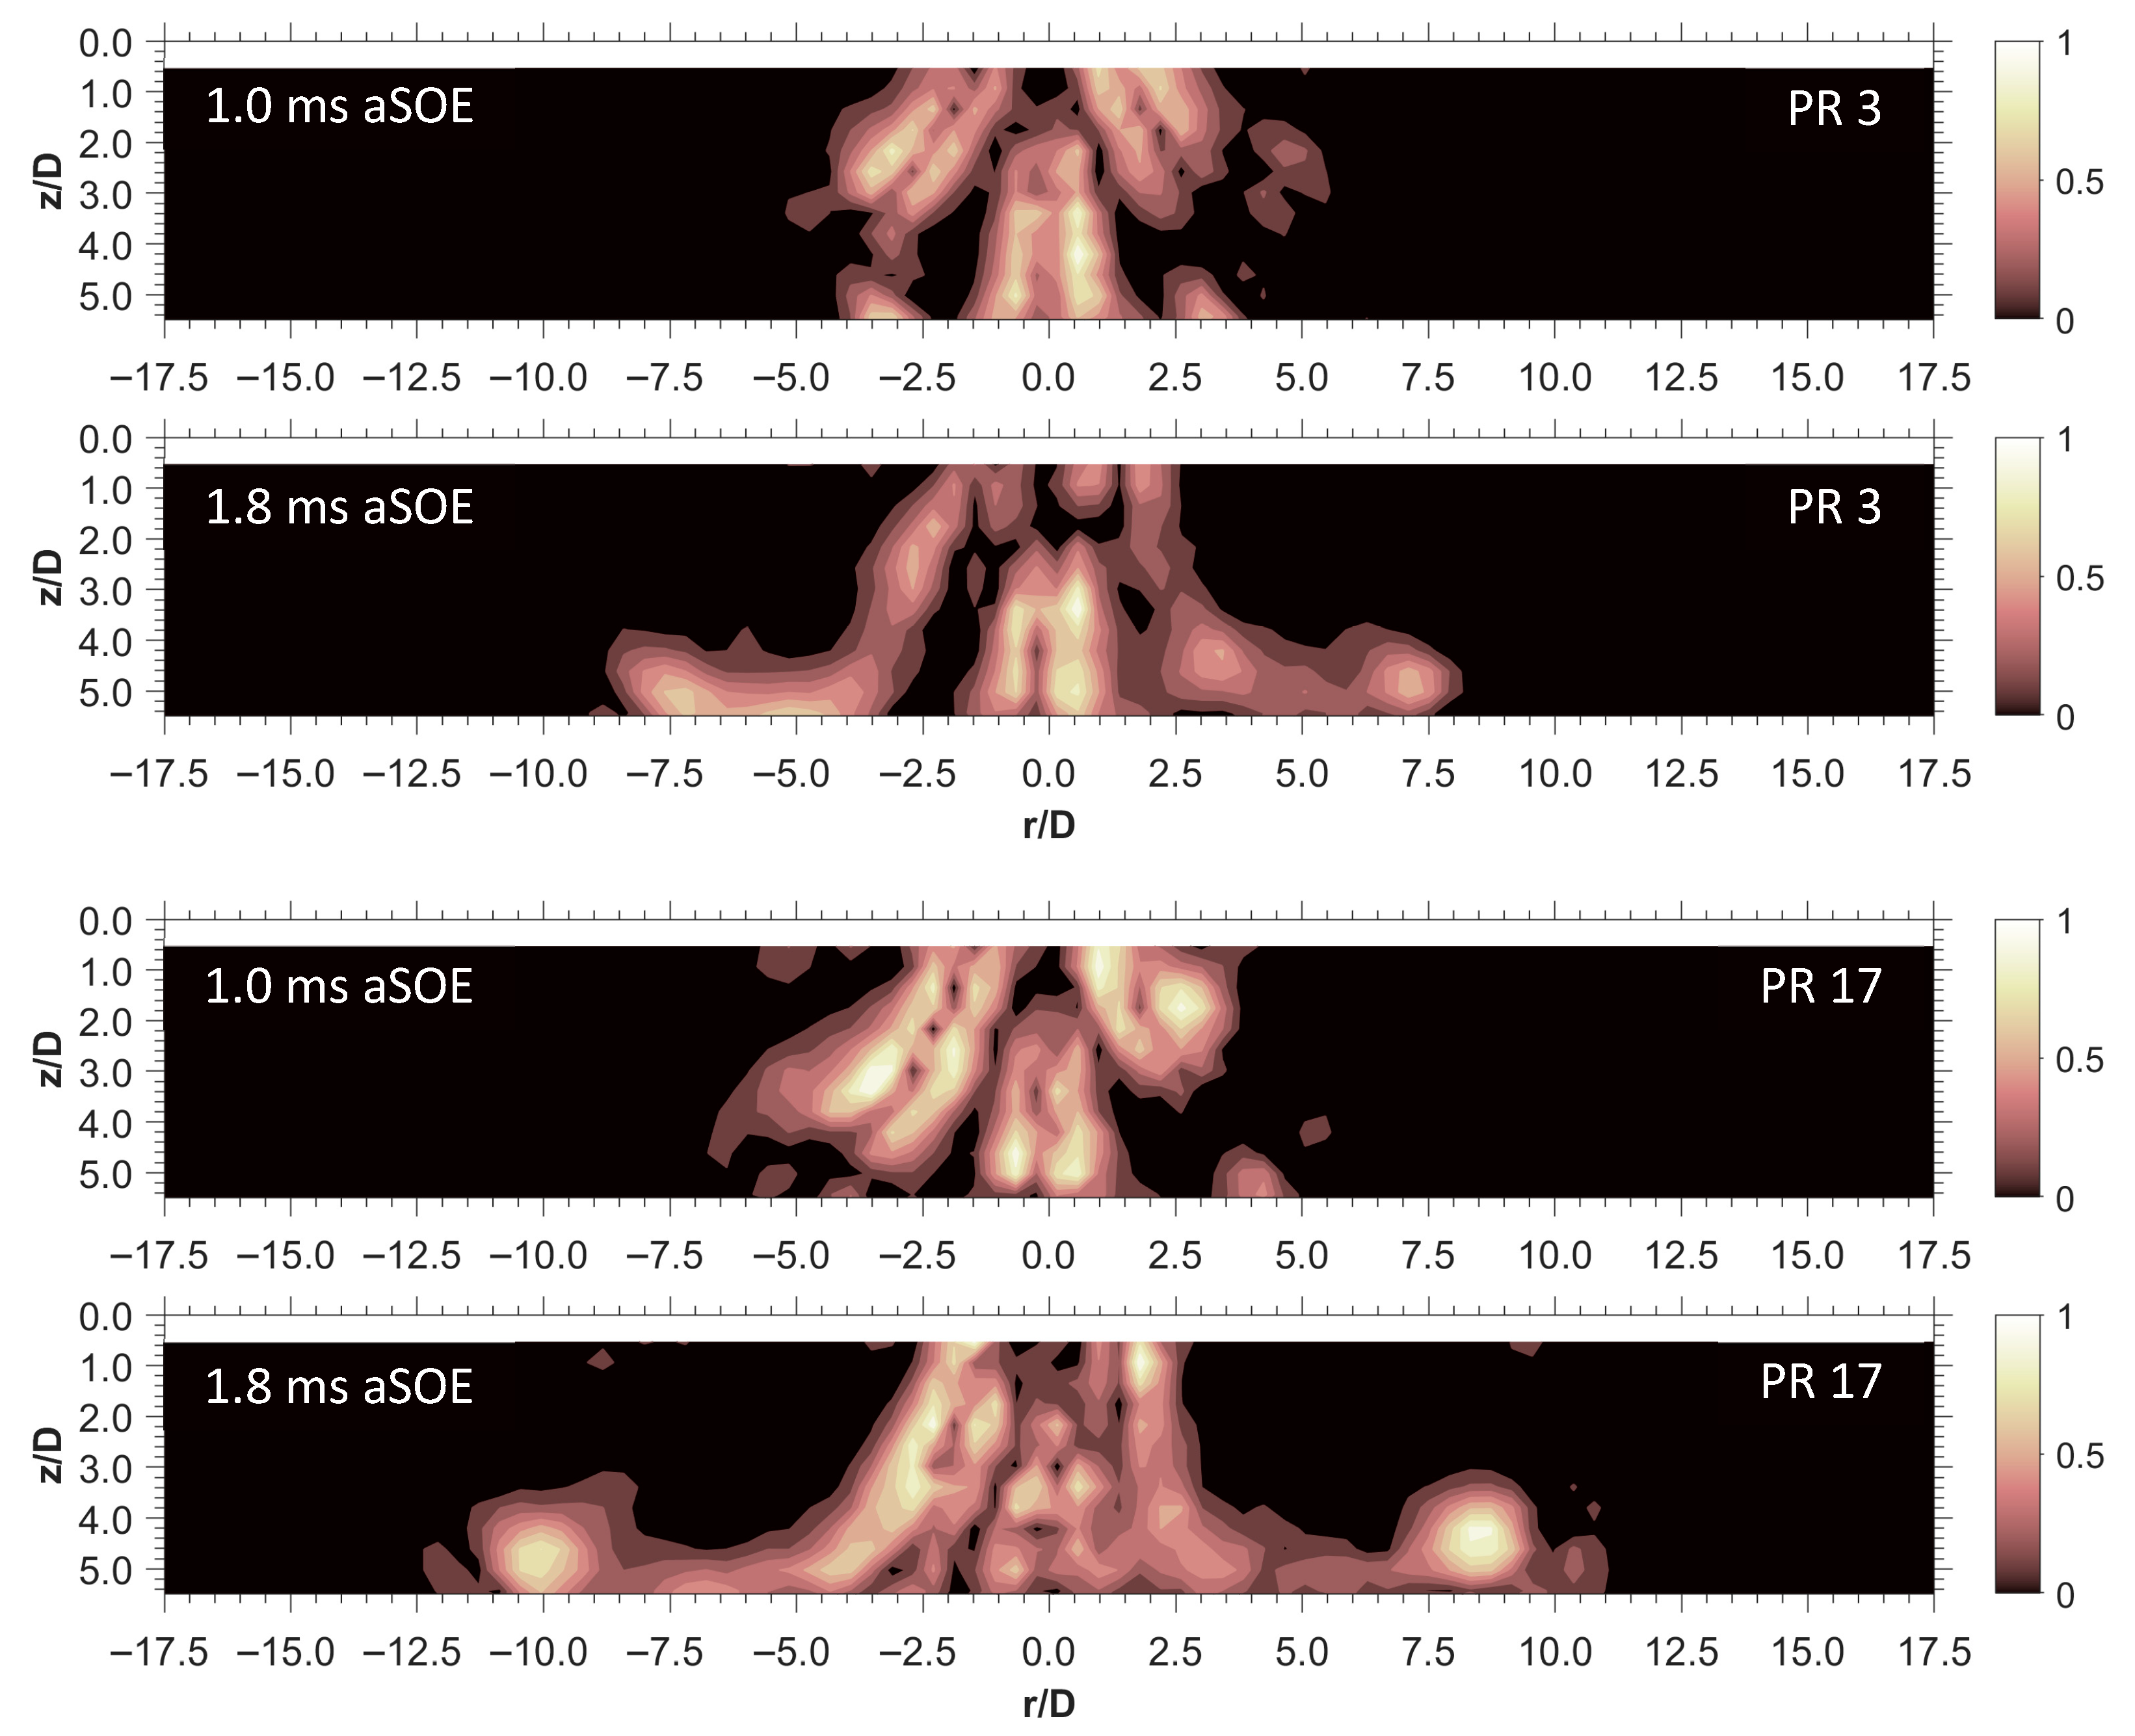
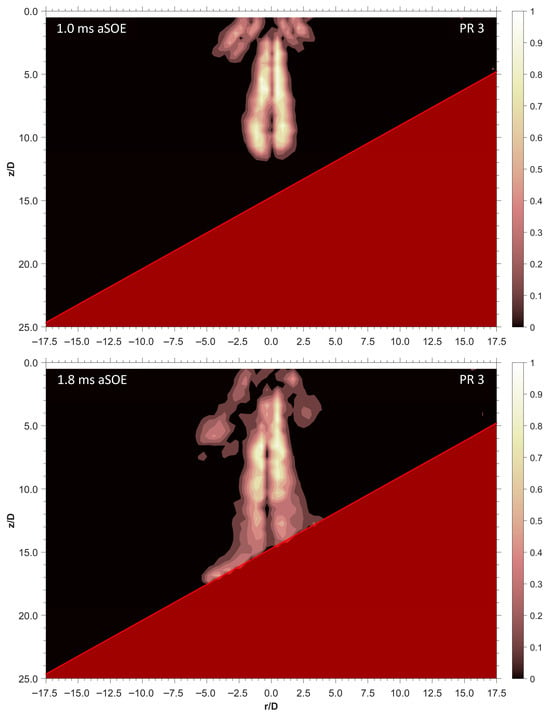
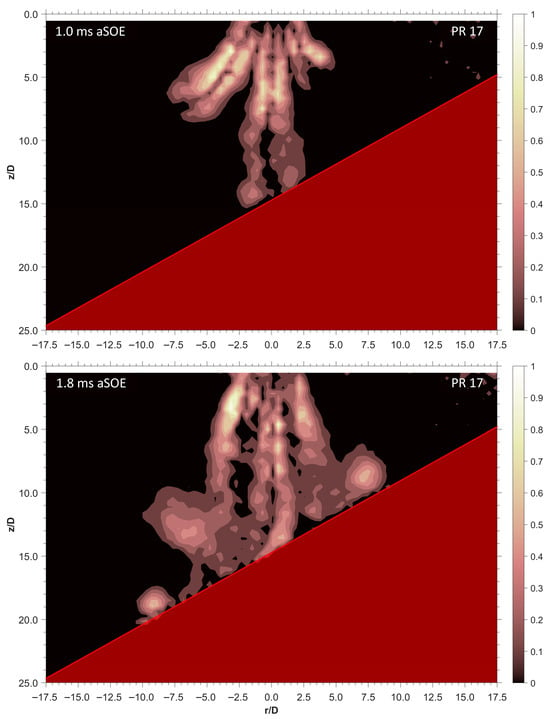
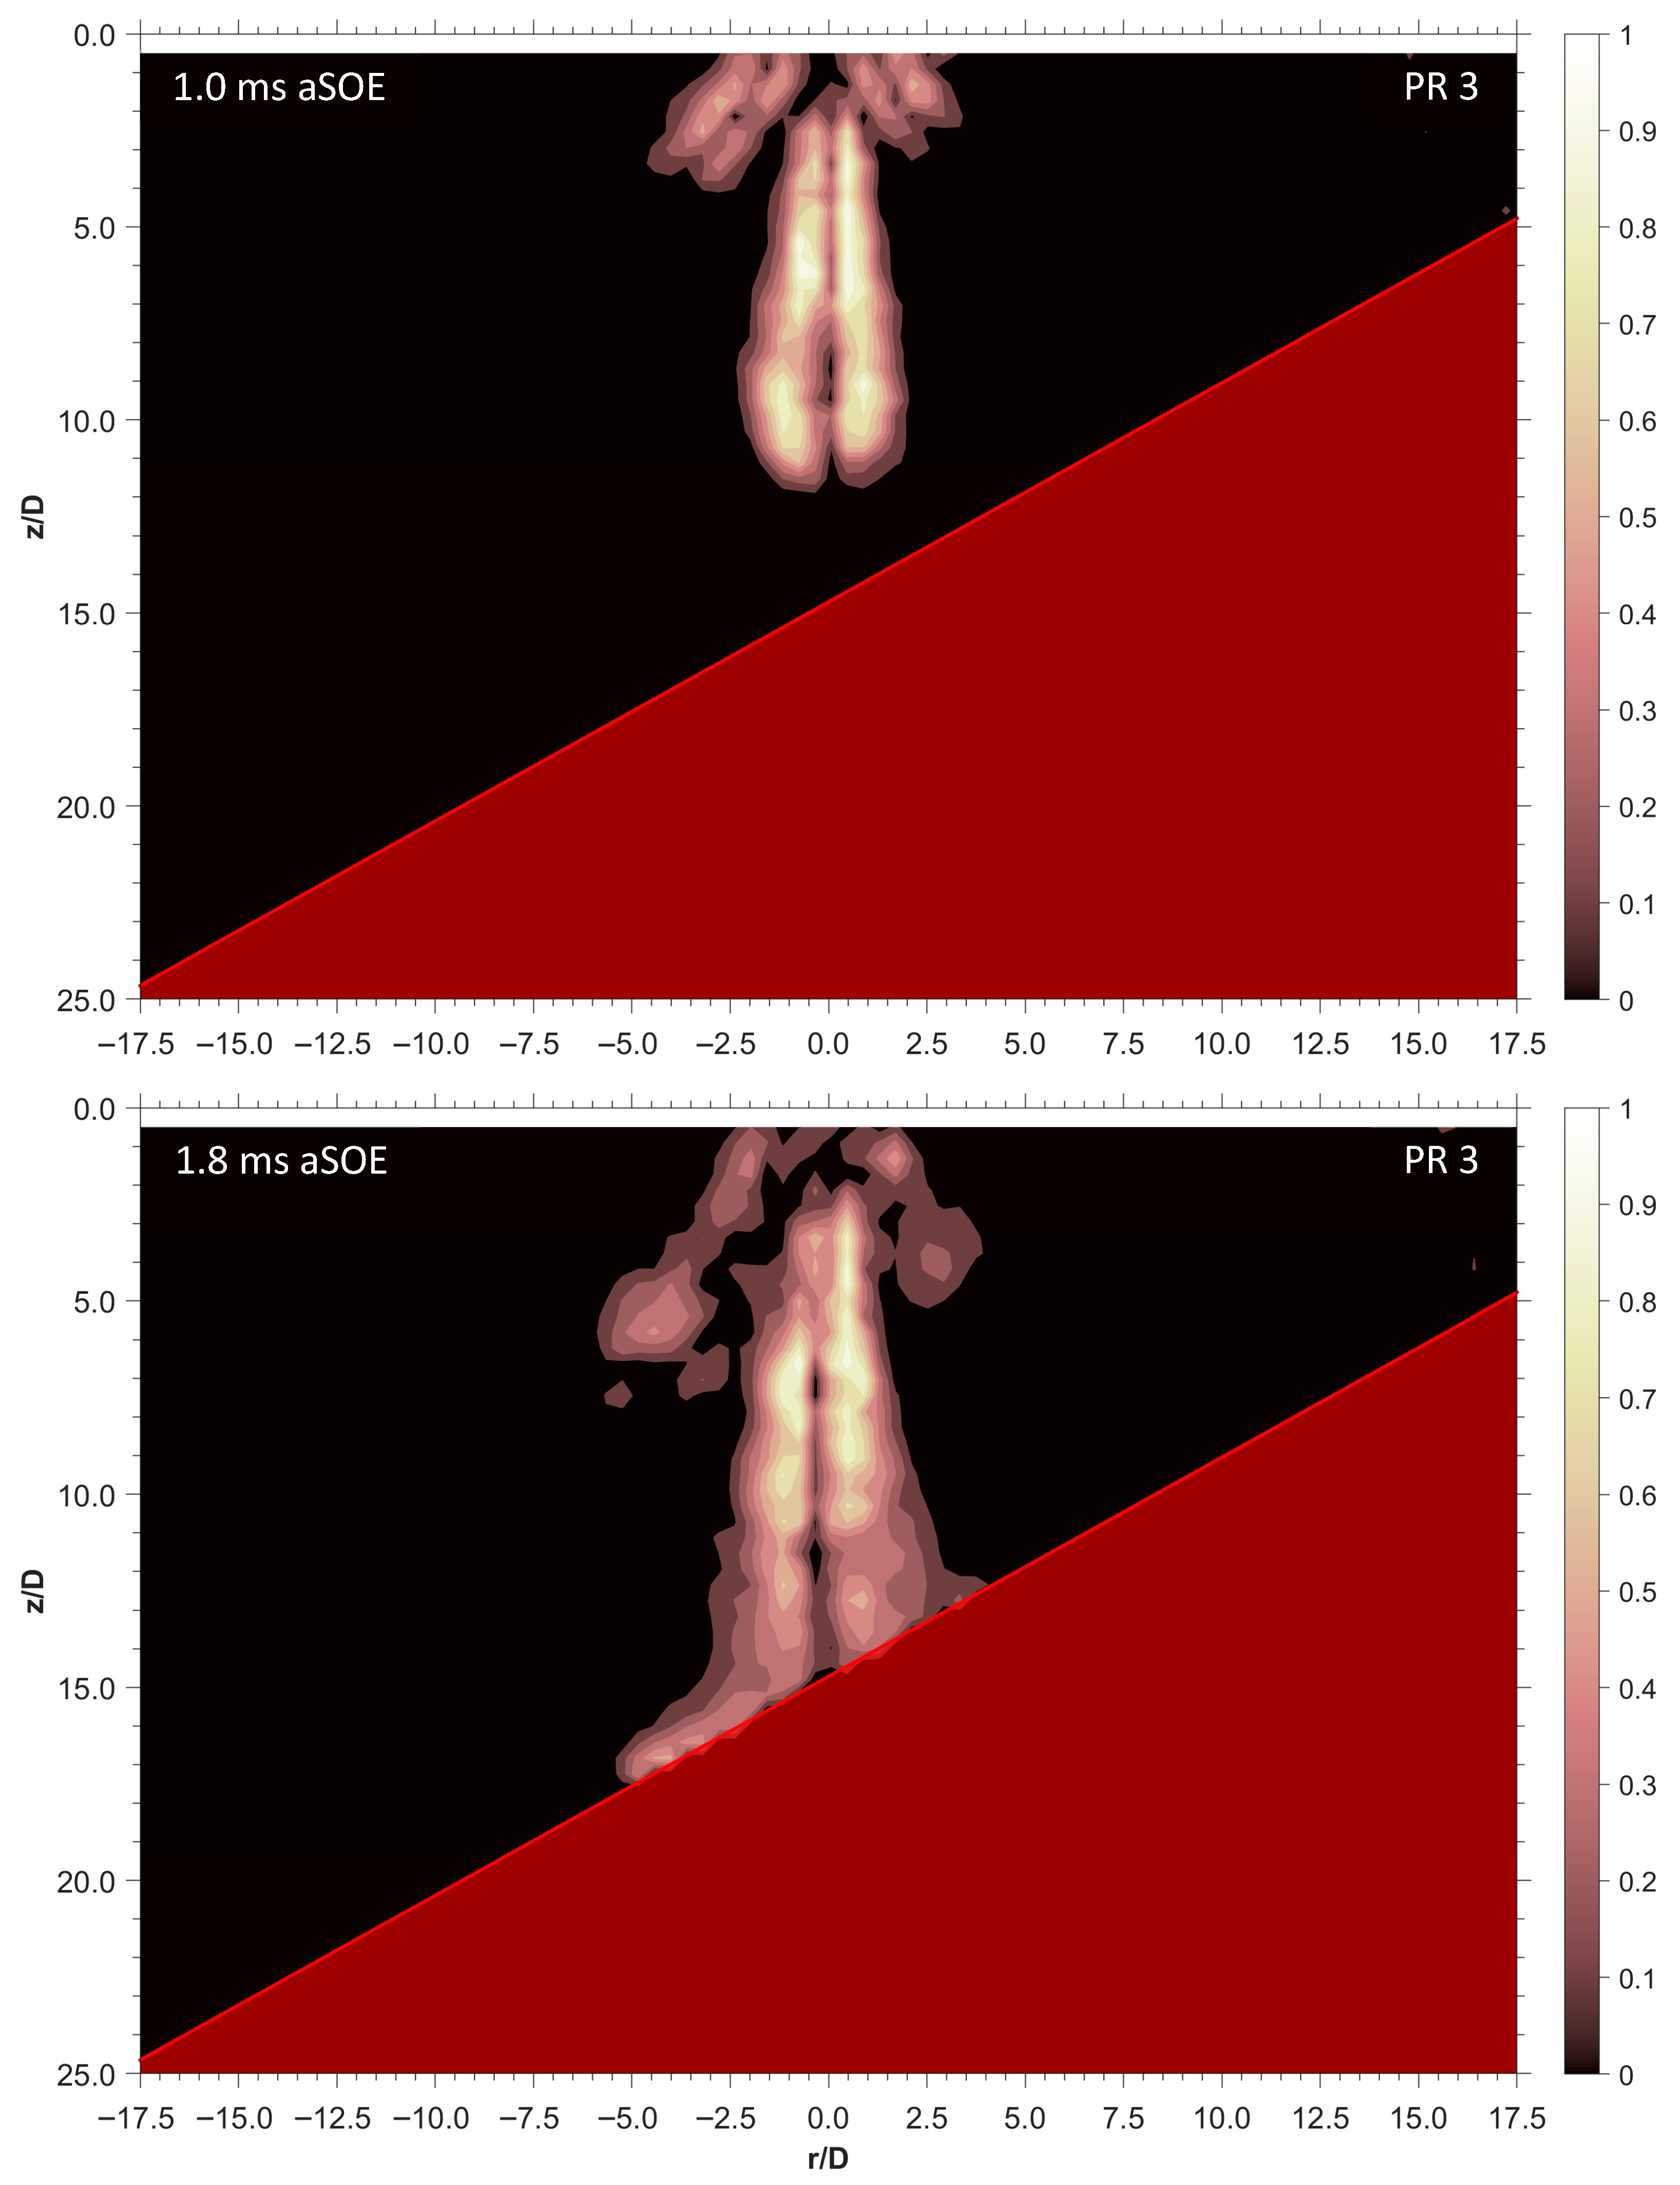
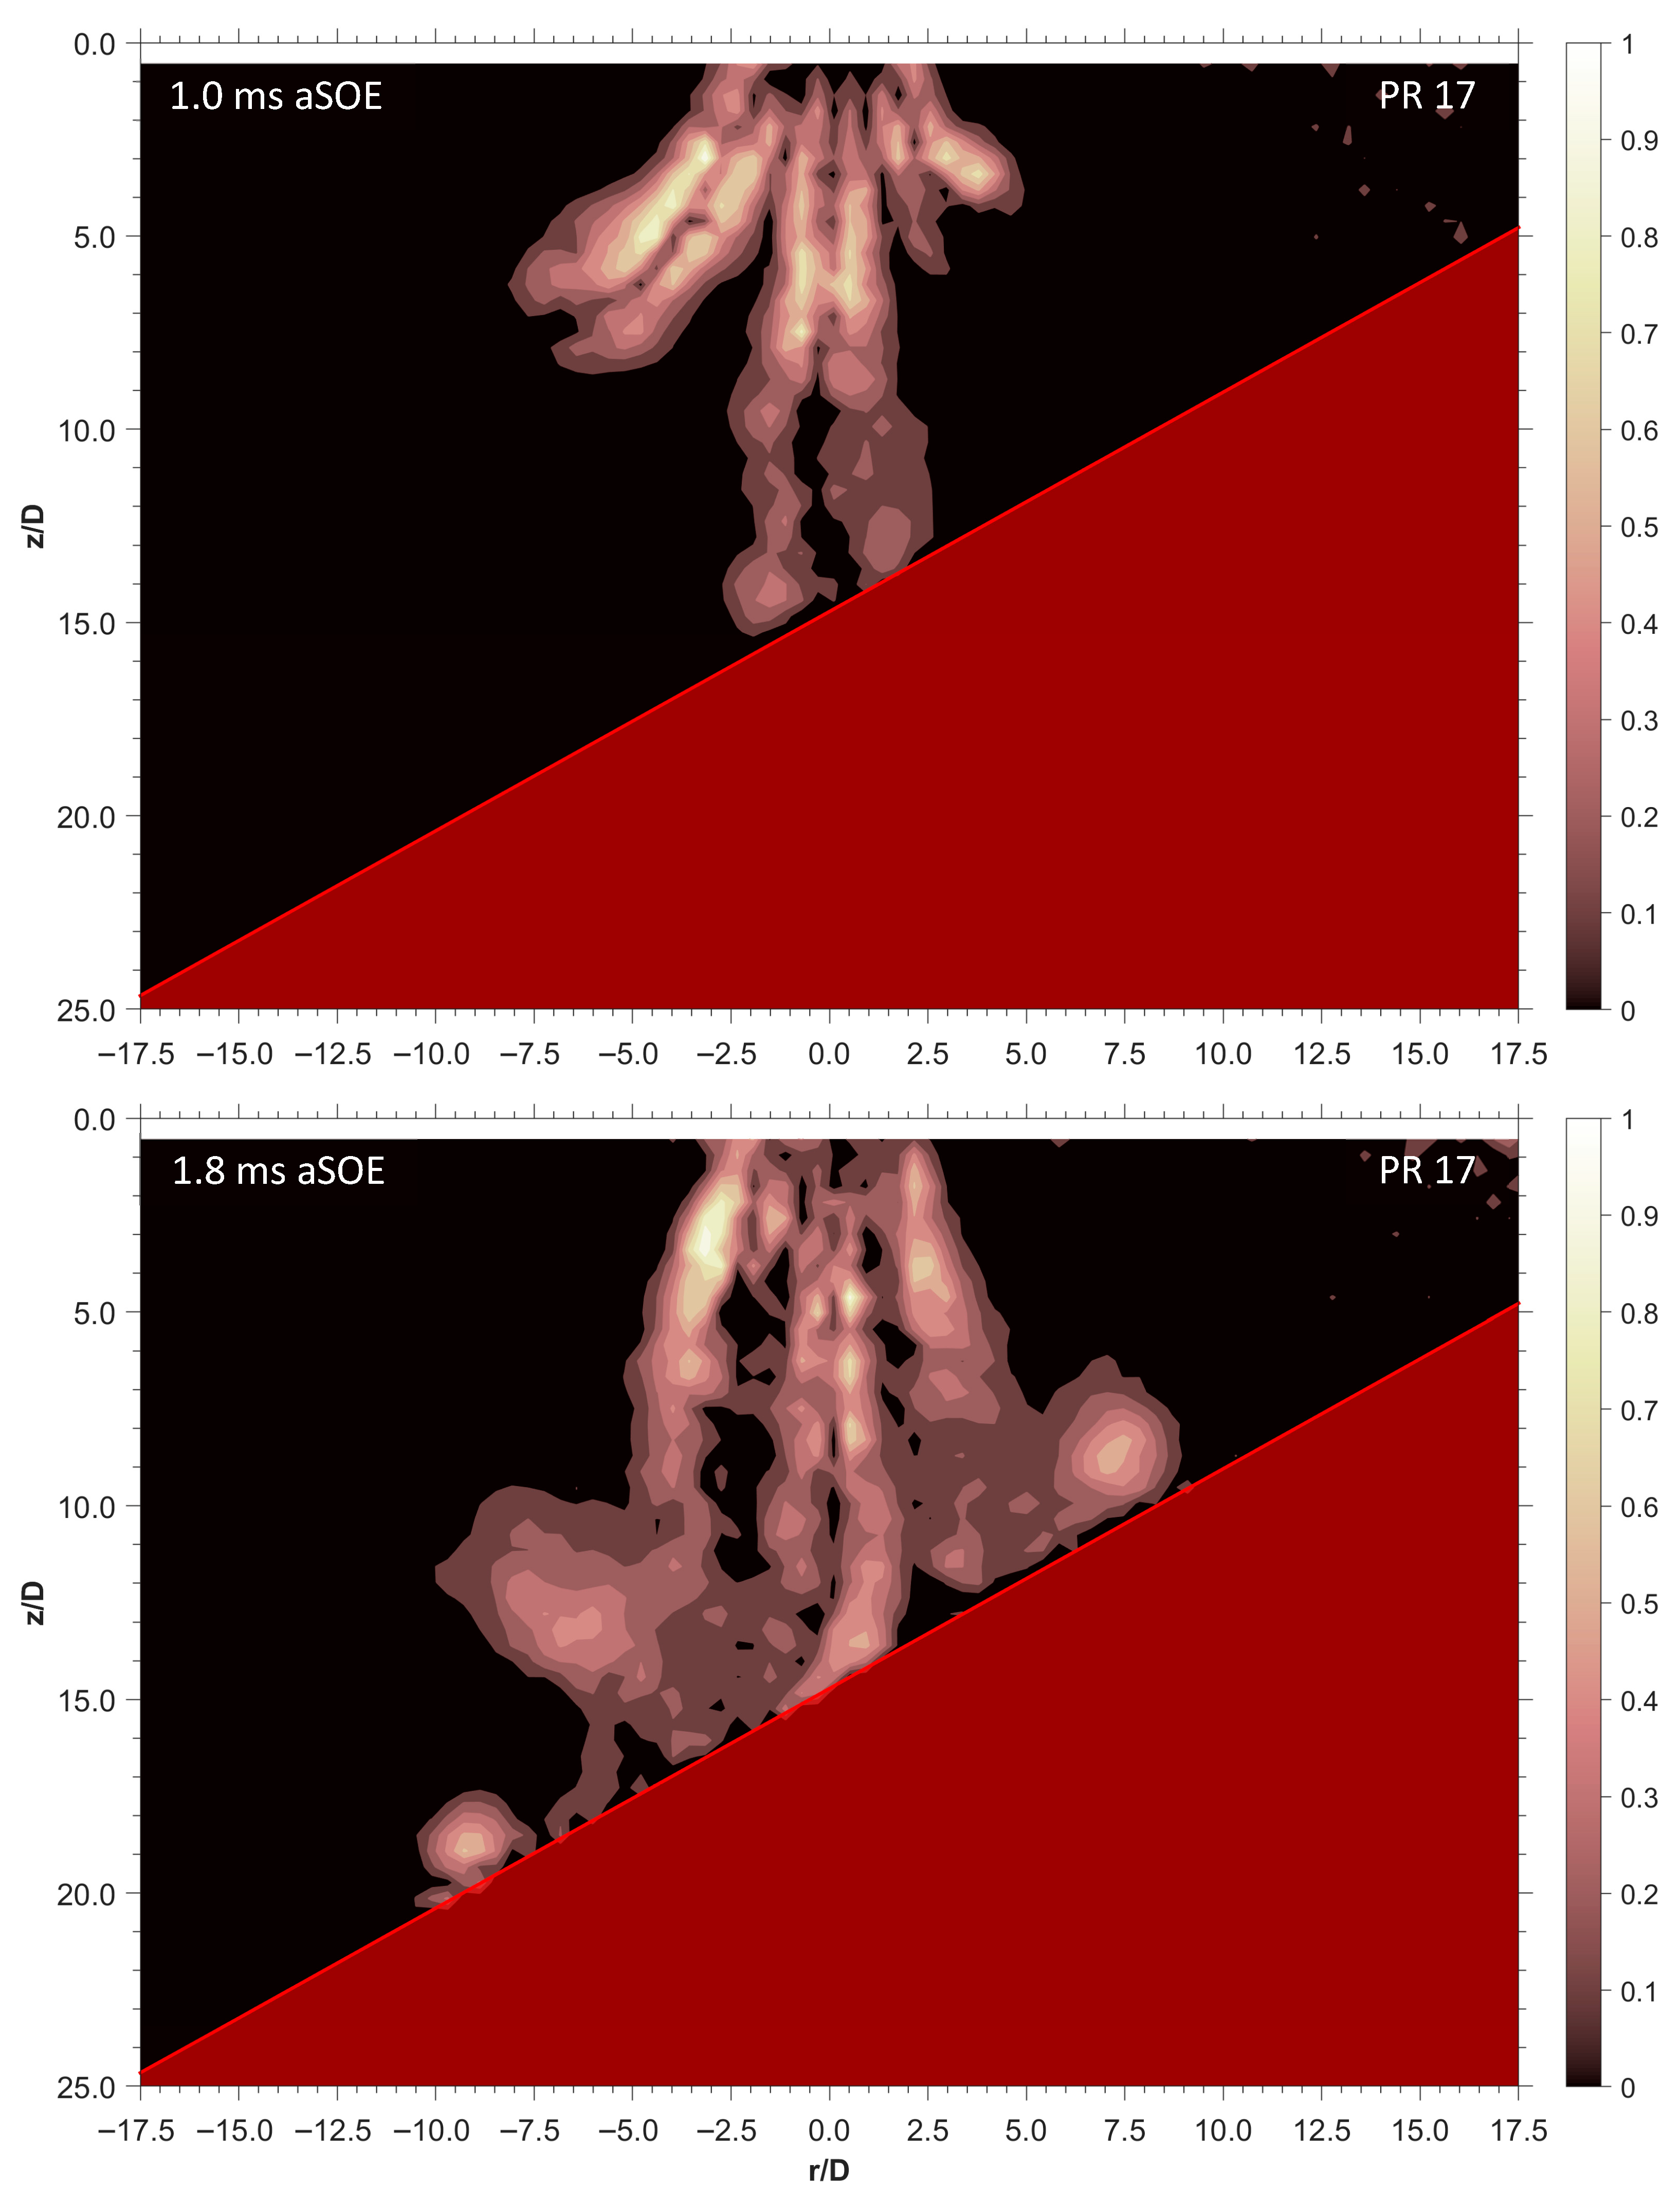
where ez is the versor along the z-axis. The above formula is therefore used to measure vortex-rings intensities by using the velocity field and determining the presence of instantaneous radii of rotation in the spatial grid discretized by the PIV analysis. Based on Equation (6), Figure 8 and Figure 9 present the comparison of vorticity fields development under two PR conditions during different stages of injection, i.e., 1.0 and 1.8 ms aSOE. To highlight the discrepancies in jet behavior, the two operating conditions at the extremes of test campaign are shown, i.e., PR = 3 and PR = 17. However, it is worth noting that the color scale used to normalize the intensity refers to the two different maximum values calculated for both conditions; therefore, similar gradients between the figures should not be confused for close values. Additionally, since vorticity features opposite peaks, due to the occurrence of clockwise and anticlockwise motions, it was not possible to normalize the data with respect to the average values of each condition investigated. Rather, all results on vorticity intensity values have been converted into absolute values and the distribution graphs normalized to the maximum of each test. This approach ensures that different configurations do not bias the interpretation of jet distribution behavior, especially in the post-collision phase.
Figure 8.
Example of jet vorticity development for PR = 3 and PR = 17. 10 mm configuration, timings aSOE: 1.0 and 1.8 ms. The data refer to average values.
Figure 9.
Example of jet vorticity development for PR = 3 and PR = 17. 30 mm, 30° configuration, timings aSOE: 1.0 and 1.8 ms. The data refer to average values.
For 10 mm configuration, under low PR condition, the jet impingement on the plate led to the generation of vortex rings moving radially outward (Figure 8). Because of the shorter path of the orifice aligned with the injector axis, the central jet approaches the plate first, inducing the formation of two vortex rings. In the post-collision phase, these structures are further accelerated by the lateral jets, keeping a relative intensity of around 30–50% during all injection stages. Downstream the injector, near to the wall, no stagnation region can be observed for PR = 3 because of the low momentum of the jet. In contrast, the most severe pressure conditions investigated (PR = 17) showed the formation of a stagnation zone near the flat wall surface. Specifically, downstream the injector axis, due to the abrupt decrease in velocity and increase in pressure, the gas seemed to be confined in a relatively small volume; therefore, resulting in the formation of a rich pocket. In this region (r/D ± 1.5, z/D ≥ 3.75), the vorticity intensity measured is around of 10–30% relative to the peak. This condition lasts for a variable interval, after which the fresh charge coming from the injector seems to be able to create a constant recirculation of charge. To this end, the results suggest that the presence stagnation region influences the mixing efficiency of high-pressure conditions during early- to mid-stages of injection. Regarding the vortex rings at the jet ends, for PR 3, these developed with an intensity between 40% and 50% of the maximum. Conversely, as PR increased, these structures showed an intensity up to approximately 60–70% of the peak. Furthermore, the size of the vortices increased with PR, involving a larger portion of the area above the plate, from z/D ≥ 4 of PR 3 to z/D ≥ 3 of PR 17 condition.
Adjusting the position of the plate to increase the length along which the gas can extend freely can provide a more comprehensive understanding of the jet behavior. Graphs shown in Figure 9 illustrate how at early stages the vorticity peaks are identified along jet borders, influencing small volumes of surrounding air. In detail, for PR = 3, the increased backpressure promotes a confinement of the vorticity, in contrast, for PR = 17, the jets distribution appears more dispersive, without providing a clear distinction between affected and un-affected areas. To this end, it is important to highlight that the difference in gradients between the two PR conditions do not correspond to a real difference in terms of magnitude, as each vorticity field shown in Figure 9, as well as those in Figure 8, has been normalized with respect to the peak recorded by each test point. As the jet approaches the plate, rapid gas deceleration and shear layer growth are observed near the surface. To this end, it should be noted that the highest values of vorticity gradients (>80%) are localized relatively close to the nozzle cap and that the local drop in pressure generated by the high-speed causes air entrainment by the rear area into the jet. At low PR, the area affected by the jet confirms to be relatively small, while at higher PR this was noted to increase up to the PR = 17 condition where the lateral jets were noted to last for all stages of injection, without merging with the central jet but assuming a bell-shape profile. To this end, these results well match the assumptions made on jet rectification. In addition, according to the considerations over reduced speed values observed in proximity of the plate surface (30 mm, 30° configuration), both vortices returned lower magnitude compared to those noted at 10 mm configuration. As a title of example, under PR 17 condition, after 1.8 ms aSOE, the vortices formed on the plate were observed to have an intensity ranging from 30% to 50%, well below the 60–70% of the 10 mm configuration.
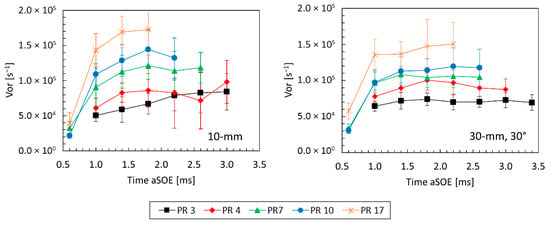
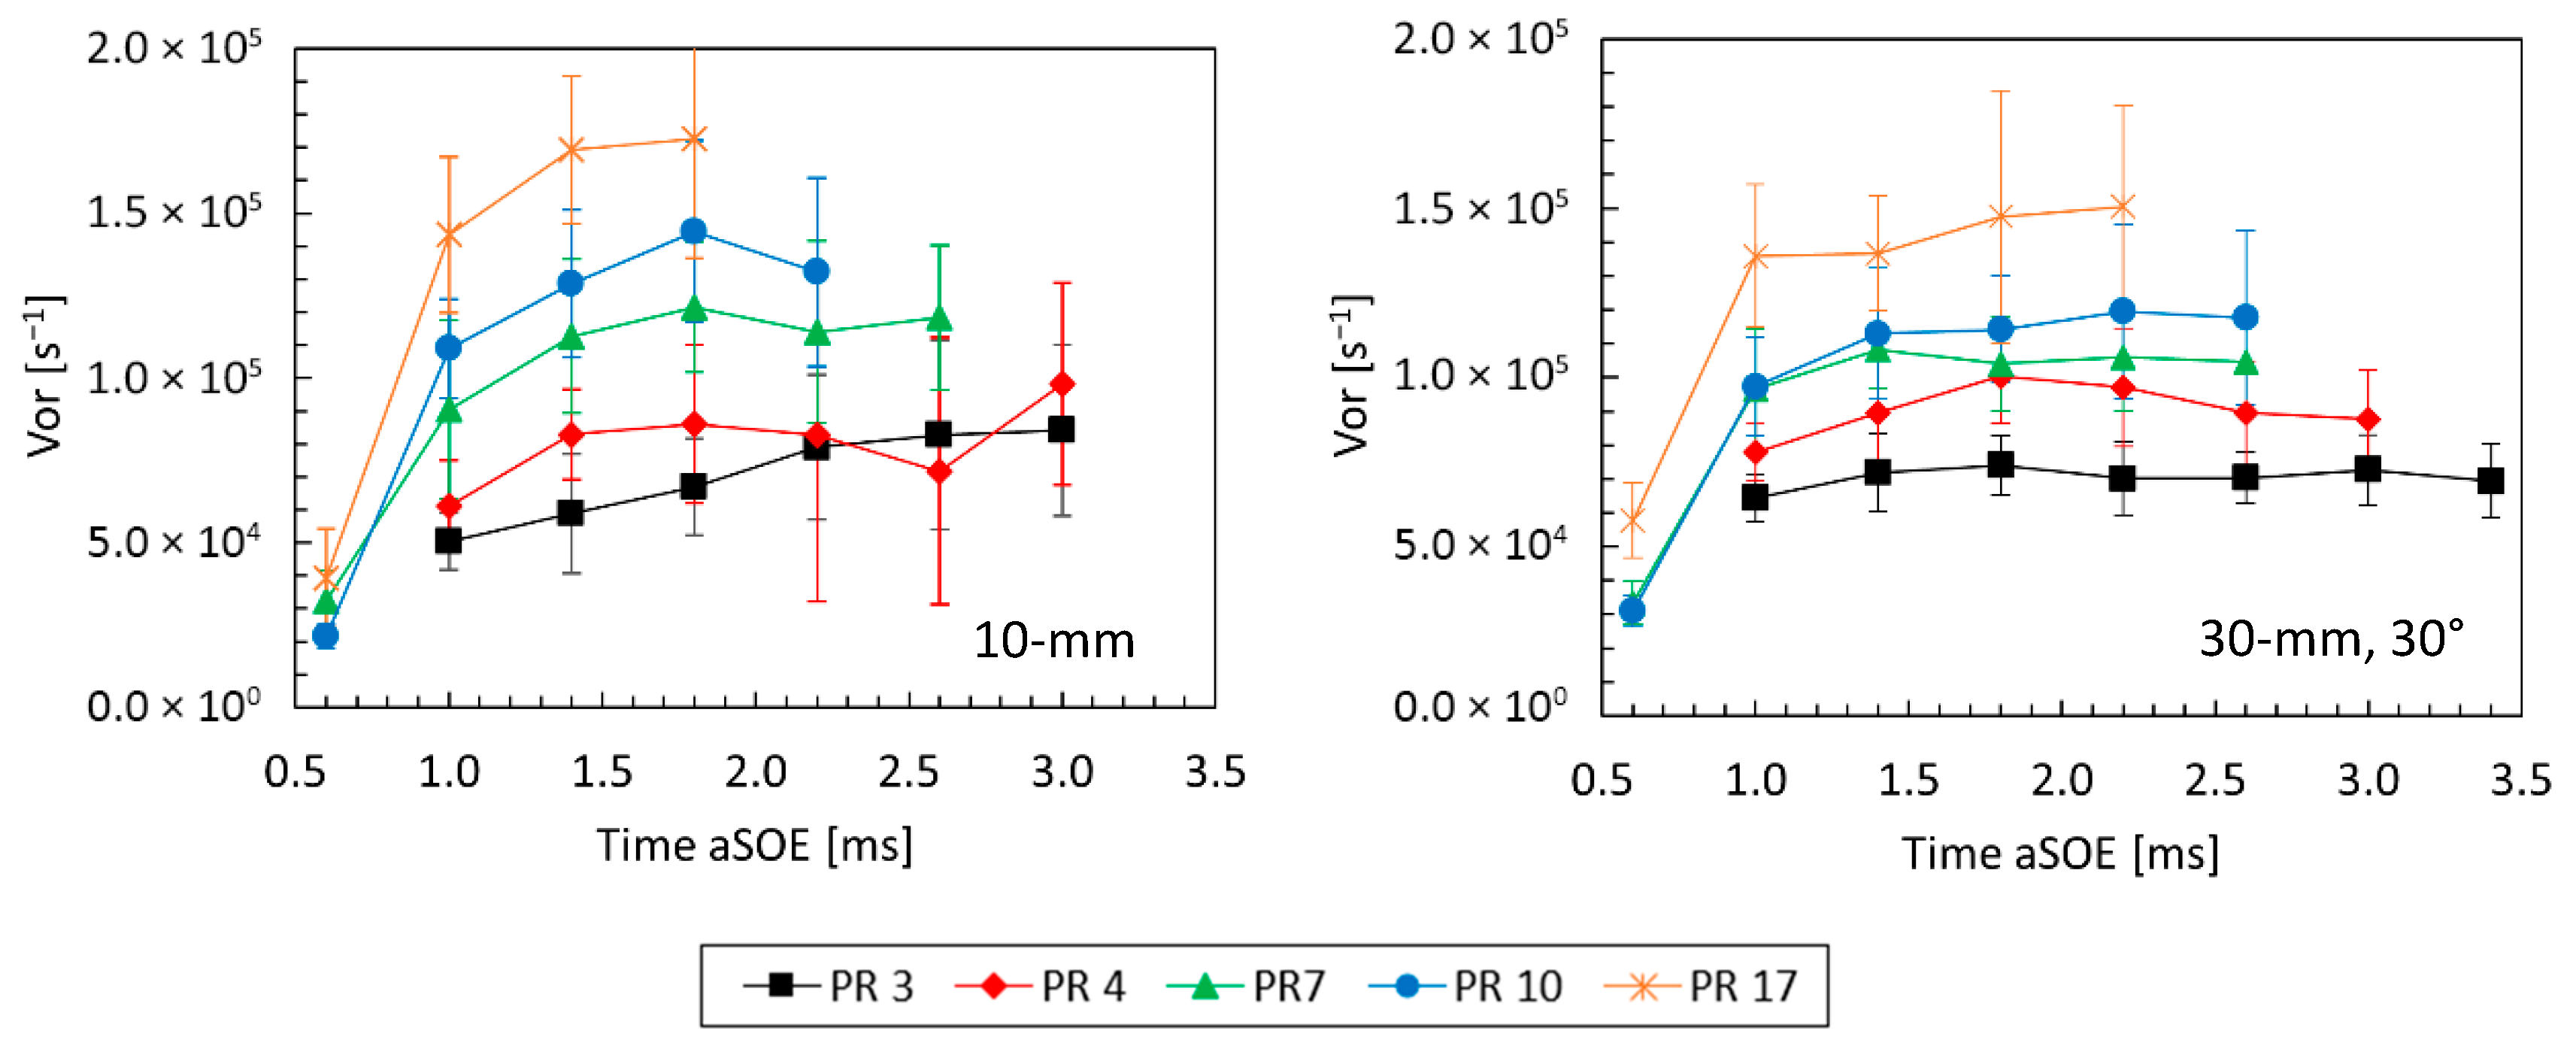
For a more quantitative understanding, the graphs in Figure 10 illustrate the influence of PR on the vorticity intensity peaks measured for both configurations. Specifically, under low PR conditions (PR = 3 and PR = 4), the vorticity intensity values were noted to lie on comparable ranges (6 × 10⁻⁴ s−1–9 × 10⁻⁴ s−1). Differently, for higher PRs an increase of approximately 10% was noted for the experiments carried out with the plate at short distance from the injector. Nevertheless, the increased levels of vorticity are accompanied by an increased instability, with the standard deviation measured on the 20 pair of frames that varies from 15% to 35% (10 mm layout). In contrast, the tests performed with the plate at 30 mm, 30°, revealed reduced levels of variation with the standard deviation ranging from 7% (PR↓) to 15% (PR↑); thus, suggesting a more reproducible development pattern of the vortex rings.
Figure 10.
Influence of PR on vorticity intensity: 10 mm (left) and 30 mm, 30° (right). The data refer to average values.
9. Conclusions
The present work proposes a detailed investigation of the phenomena underlying the jet–wall interaction dynamics. Specifically, the two configurations examined made it possible to obtain information on PR influence, as well as the role of flat wall in determining the jet behavior, with particular focus to the post-collision phase. The experiments were therefore carried out in a constant volume chamber (CVC), supported by PIV analysis. The flat wall was positioned inside the CVC at different distances from the injector tip to emulate two injection strategy scenarios: a late injection (10 mm) and early injection (30 mm, 30°). Specifically, for the 10 mm configuration, as the oblique jets impinged on the flat wall, it was noted a sudden redirection of the flow; thus, involving a great amount of air into the mixing process and contributing to the formation of two vortex rings at the jet ends. Specifically, outside the projected area on the flat wall, the velocity intensity varied from 90% to 150% of the average jet velocity. On the other hand, with the plate at a short distance, the collision of the central jet caused an abrupt increase in local pressure, thus contributing to the formation of a stagnation area characterized by a relatively low speed (50–60%) and vorticity values (10–30%). In contrast, with the plate positioned at 30 mm, inclined at 30°, the longer distance enabled for a free propagation of the jet, at early stages, leading to an increase in velocity up to ≈40% for PR = 17 condition.
Another aspect of interest regarded the jet rectification effect, which became appreciable during experiments performed with 30 mm, 30° configuration. In detail, for low PR conditions the lateral jets were noted to deviate towards the main central axis, reducing the projected area of the jet. In contrast, the experiments conducted at higher PRs showed an improved capacity of the side jets to extend along their own axes. Nevertheless, despite the improved speed of the jets, the inclination of the plate enabled a smooth slip of the gas on the surface, avoiding the formation of the stagnation region and causing a more contained reduction in velocity to approximately 150–160% relative to the operating condition average speed. The results obtained by this study summarize the necessity for sophisticated piston bowl geometries, depending on the injection timing and duration, providing a detailed overview on transient behavior of jet–wall interaction. A short distance, typical of delayed injection strategies, suggests the use of waved, bowl-shaped surfaces, avoiding perpendicular interaction between jet and wall, while promoting the out-moving radial propagation of the gas. Differently, longer distances prioritize the use of high PR to mitigate the rectification effect in order to enhance the projected area of gas impinging on the surface and counterbalance the lower intensity of the vortices formed during the post-collision phase.
Author Contributions
Conceptualization, M.A. and S.S.M.; methodology, G.C.; software, G.C.; validation, G.C.; formal analysis, G.C.; investigation, G.C.; resources, S.S.M. and A.I.; data curation, G.C.; writing—original draft preparation, G.C.; writing—review and editing, M.A.; visualization, G.C.; supervision, M.A., S.S.M. and A.I.; project administration, M.A. and S.S.M. All authors have read and agreed to the published version of the manuscript.
Funding
This research received no external funding.
Institutional Review Board Statement
Not applicable.
Informed Consent Statement
Not applicable.
Data Availability Statement
Data availability under request.
Acknowledgments
The authors gratefully acknowledge J Gust Richert stiftelse and Chalmers AoA Transport for financial support, as well as the support of the European Union, NextGenerationEU—in the framework of the National Sustainable Mobility Center—MOST, CN00000023, Italian Ministry of University and Research Decree n. 1033—17 June 2022, Spoke 12, CUP B43C22000440001.
Conflicts of Interest
The authors declare no conflicts of interest.
Abbreviations
The following abbreviations are used in this manuscript:
| AC | Auto Contrast filter |
| aSOE | after Start Of Energization |
| CLAHE | Contrast Limited Adaptive Histogram Equalization |
| CVC | Constant Volume Chamber |
| DI | Direct Injection |
| IA | Interrogation Area |
| ICEs | Internal Combustion Engines |
| PIV | Particle Image Velocimetry |
| PR | Pressure Ratio |
| ROI | Region Of Interest |
| RMZ | Radial Mixing Zone |
| Stk | Stokes Number |
References
- Berkebile-Weinberg, M.; Goldwert, D.; Doell, K.C.; Van Bavel, J.J.; Vlasceanu, M. The differential impact of climate interventions along the political divide in 60 countries. Nat. Commun. 2024, 15, 3885. [Google Scholar] [CrossRef] [Scilit]
- Rawat, A.; Kumar, D.; Khati, B.S. A review on climate change impacts, models, and its consequences on different sectors: A systematic approach. J. Water Clim. Change 2024, 15, 104–126. [Google Scholar] [CrossRef] [Scilit]
- Nimma, D.; Devi, O.R.; Laishram, B.; Ramesh, J.V.N.; Boddupalli, S.; Ayyasamy, R.; Tirth, V.; Arabi, A. Implications of climate change on freshwater ecosystems and their biodiversity. Desalination Water Treat. 2025, 321, 100889. [Google Scholar] [CrossRef] [Scilit]
- Wu, T.; Yi, M.; Zhang, Y. Towards cities’ green growth: The combined influence of economic growth targets and environmental regulations. Cities 2024, 146, 104759. [Google Scholar] [CrossRef] [Scilit]
- Shan, R.; Kittner, N. Sector-specific strategies to increase green hydrogen adoption. Renew. Sustain. Energy Rev. 2025, 214, 115491. [Google Scholar] [CrossRef] [Scilit]
- Musy, F.; Ortiz, R.; Ortiz, I.; Ortiz, A. Hydrogen-fuelled internal combustion engines: Direct injection versus port-fuel injection. Int. J. Hydrogen Energy 2024, 137, 925–938. [Google Scholar] [CrossRef] [Scilit]
- Millo, F.; Piano, A.; Roggio, S.; Pastor, J.; Micó, C.; Lewiski, F.; Pesce, F.; Vassallo, A.; Bianco, A. Mixture formation and combustion process analysis of an innovative diesel piston bowl design through the synergetic application of numerical and optical techniques. Fuel 2022, 309, 122144. [Google Scholar] [CrossRef] [Scilit]
- Kim, D.; Shin, J.; Kim, J.; Park, J.; Son, Y.; Park, S. Effects of spray pattern and piston shape on in-cylinder flow in a two-cylinder spray-guided gasoline direct-injection optical engine. Appl. Therm. Eng. 2023, 234, 121272. [Google Scholar] [CrossRef] [Scilit]
- Onorati, A.; Payri, R.; Vaglieco, B.; Agarwal, A.; Bae, C.; Bruneaux, G.; Canakci, M.; Gavaises, M.; Günthner, M.; Hasse, C.; et al. The role of hydrogen for future internal combustion engines. Int. J. Engine Res. 2022, 23, 529–540. [Google Scholar] [CrossRef] [Scilit]
- Zhou, F.; Wu, C.; Fu, J.; Liu, J.; Duan, X.; Sun, Z. Abnormal combustion and NOx emissions control strategies of hydrogen internal combustion engine. Renew. Sustain. Energy Rev. 2025, 219, 115847. [Google Scholar] [CrossRef] [Scilit]
- Sisman, O.; Erkovan, M.; Kilinc, N. Hydrogen sensors for safety applications. In Towards Hydrogen Infrastructure; Elsevier: Amsterdam, The Netherlands, 2024; pp. 275–314. [Google Scholar] [CrossRef] [Scilit]
- He, J.; Kokgil, E.; Wang, L.L.; Ng, H.D. Assessment of similarity relations using helium for prediction of hydrogen dispersion and safety in an enclosure. Int. J. Hydrogen Energy 2016, 41, 15388–15398. [Google Scholar] [CrossRef] [Scilit]
- Giannissi, S.G.; Tolias, I.C.; Melideo, D.; Baraldi, D.; Shentsov, V.; Makarov, D.; Molkov, V.; Venetsanos, A.G. On the CFD modelling of hydrogen dispersion at low-Reynolds number release in closed facility. Int. J. Hydrogen Energy 2021, 46, 29745–29761. [Google Scholar] [CrossRef] [Scilit]
- Oamjee, A.; Sadanandan, R. Suitability of helium gas as surrogate fuel for hydrogen in H2-Air non-reactive supersonic mixing studies. Int. J. Hydrogen Energy 2022, 47, 9408–9421. [Google Scholar] [CrossRef] [Scilit]
- Breda, S.; Magnani, M.; Martino, M.; Fontanesi, S.; Postrioti, L. Experimental and numerical characterization of a single-hole LPDI Hydrogen injector: Identification of a suitable inert replacement for Hydrogen jet studies. Fuel 2025, 399, 135626. [Google Scholar] [CrossRef] [Scilit]
- Holtzer, B.B.B.D.; Tartakovsky, L. Influence of Turbulent gaseous jet configuration on entrainment—A Comparative Schlieren study. Exp. Therm. Fluid Sci. 2025, 168, 111523. [Google Scholar] [CrossRef] [Scilit]
- Yin, Y.; Lei, Y.; Shen, H.; Yi, Y.; Zhao, T.; Qiu, T. Modeling investigation on transient behaviors of gaseous ammonia jet flow with direct injection. Fuel 2024, 358, 129997. [Google Scholar] [CrossRef] [Scilit]
- Menaca, R.; Liu, X.; Mortellaro, F.; Medda, M.; Im, H.G. A Computational Study of Hydrogen Mixing and Combustion in a High-Speed Direct-Injection Spark-Ignition Engine. In Proceedings of the 17th International Conference on Engines and Vehicles, Capri, Italy, 14 September 2025. [Google Scholar] [CrossRef] [Scilit]
- Gong, M.; Lundgren, M.; Eismark, J.; Andersson, M. Optical Investigation of DI Hydrogen Jet Development and Jet-Wall Interactions Under Engine-Like Conditions. In Proceedings of the WCX SAE World Congress Experience, Detroit, MI, USA, 8 April 2025. No. 2025-01-8456. [Google Scholar] [CrossRef] [Scilit]
- Gong, M.; Lundgren, M.; Eismark, J.; Andersson, M.; Kimber, M.L. Turbulent Mixing Process of a Round Jet with Slot Lobes. J. Fluids Eng. 2021, 143, 031502. [Google Scholar] [CrossRef] [Scilit]
- Thielicke, W.; Sonntag, R. Particle Image Velocimetry for MATLAB: Accuracy and Enhanced Algorithms in PIVlab. J. Open Res. Softw. 2021, 9, 12. [Google Scholar] [CrossRef] [Scilit]
- Jena, A.; Singh, A.P.; Agarwal, A.K. Challenges and opportunities of particle imaging velocimetry as a tool for internal combustion engine diagnostics. In Novel Internal Combustion Engine Technologies for Performance Improvement and Emission Reduction; Springer: Berlin/Heidelberg, Germany, 2021; pp. 43–77. [Google Scholar] [CrossRef] [Scilit]
- Srivastava, S.; Sheridan, A.M.; Henneke, M.; Raza, M.S.; Sallam, K.A. The Structure of Inclined Choked Gas Jet. ASME J. Fluids Eng. 2022, 144, 101301. [Google Scholar] [CrossRef] [Scilit]
- Cecere, G.; Andersson, M.; Merola, S.; Irimescu, A. Characterization of Low-Density Gaseous Jet Structure and Vorticity Using PIV Technique. In Proceedings of the 17th International Conference on Engines and Vehicles, Capri, Italy, 14 September 2025. No. 2025-24-0067. [Google Scholar] [CrossRef] [Scilit]
- Cecere, G.; Andersson, M.; Merola, S.S.; Irimescu, A.; Vaglieco, B.M. Analysis of Vorticity and Velocity Fields of Jets from Gas Injector Using PIV. Appl. Sci. 2025, 15, 6180. [Google Scholar] [CrossRef] [Scilit]
- Zuiderveld, K.J. Contrast Limited Adaptive Histogram Equalization. In Graphics Gems; Elsevier: Amsterdam, The Netherlands, 1994. [Google Scholar] [CrossRef] [Scilit]
- Pellessier, J.E.; Dillon, H.E.; Stoltzfus, W. Schlieren Flow Visualization and Analysis of Synthetic Jets. Fluids 2021, 6, 413. [Google Scholar] [CrossRef] [Scilit]
- Gevorkyan, L.; Shoji, T.; Peng, W.Y.; Karagozian, A.R. Influence of the velocity field on scalar transport in gaseous transverse jets. J. Fluid Mech. 2018, 834, 173–219. [Google Scholar] [CrossRef] [Scilit]
- Duda, D.; Yanovych, V.; Tsymbayuk, V.; Uruba, V. PIV measurement of near shear layer of a circular jet. In EPJ Web of Conferences; EDP Sciences: Les Ulis, France, 2024; p. 299. [Google Scholar] [CrossRef] [Scilit]
- Sciacchitano, A. Uncertainty quantification in particle image velocimetry. Meas. Sci. Technol. 2019, 30, 092001. [Google Scholar] [CrossRef] [Scilit]
- Yeganeh, M.; Akram, M.S.; Cheng, Q.; Karimkashi, S.; Kaario, O.; Larmi, M. Experimental study of hydrogen jet dynamics: Investigating free momentum and impingement phenomena. Int. J. Hydrogen Energy 2024, 68, 1423–1437. [Google Scholar] [CrossRef] [Scilit]
- Barbosa, F.V.; Teixeira, S.F.C.F.; Teixeira, J.C.F. Flow dynamics and heat transfer characterization of confined multiple jets impinging on a complex surface. Exp. Fluids 2023, 64, 153. [Google Scholar] [CrossRef] [Scilit]

Disclaimer/Publisher’s Note: The statements, opinions and data contained in all publications are solely those of the individual author(s) and contributor(s) and not of MDPI and/or the editor(s). MDPI and/or the editor(s) disclaim responsibility for any injury to people or property resulting from any ideas, methods, instructions or products referred to in the content. |
© 2026 by the authors. Licensee MDPI, Basel, Switzerland. This article is an open access article distributed under the terms and conditions of the Creative Commons Attribution (CC BY) license.