Article

ElectroHydroDynamic Manipulation of Rising Bubbles
1
Departamento de Ciencias de la Energía y Mecánica, Universidad de las Fuerzas Armadas—ESPE, Sangolquí 171103, Ecuador
2
CIAM, Universidad de las Fuerzas Armadas—ESPE, Sangolquí 171103, Ecuador
*
Author to whom correspondence should be addressed.
Fluids 2026, 11(4), 102; https://doi.org/10.3390/fluids11040102
Submission received: 19 January 2026 / Revised: 2 April 2026 / Accepted: 13 April 2026 / Published: 17 April 2026

Abstract

This study examines the electrohydrodynamic (EHD) behavior of air bubbles rising in deionized water under a non-uniform electric field, with particular emphasis on the influence of applied voltage (0.5–3.0 kV) and gas flow rates of 30 and 40 mL min 1 (corresponding to Reynolds numbers of R e g = 107 –142) on bubble dynamics. High-speed imaging reveals bubbles with equivalent diameters in the range of d e q 0.8 –3.5 mm, enabling a detailed characterization of their deformation, trajectory, and interfacial response under coupled hydrodynamic and electric stresses. At R e g = 107 , bubbles exhibited stable vertical trajectories with negligible lateral displacement, whereas at R e g = 142 , inertial and wake effects induced deviations. Increasing B o E reduced lateral displacement, restoring alignment with the electric field. Bubble rise velocities increased by ∼20–30% with applied voltage due to polarization-driven EHD forces. A transition from hydrodynamically dominated to EHD-dominated regimes was identified. While polarization forces govern the initial bubble motion under a strong electric field, bubbles progressively transition downstream to a hydrodynamic regime as the electric field weakens, reducing the influence of polarization effects. These findings provide quantitative insight into coupled hydrodynamic–electrohydrodynamic interactions and support the development of predictive models for controlling bubble trajectories, with implications for electrically tunable multiphase and microfluidic systems.

1. Introduction

The manipulation of fluids using an electric field, commonly referred to as electrohydrodynamics (EHD), has emerged as a powerful approach for controlling multiphase flows at the microscale. In such systems, electric field can generate characteristic flow patterns, deform droplets and bubbles, and influence coalescence and breakup phenomena [1,2,3]. These capabilities have enabled a wide range of applications, including advanced electrospraying and electrospinning for precise material synthesis, electrocoalescence for water–oil separation [4], electrowetting in microfluidic and display technologies [5], and enhanced heat and mass transfer processes [6]. Despite these advances, the fundamental understanding of bubble motion under an electric field—particularly the interplay between hydrodynamic forces, bubble–bubble interactions, and polarization effects—remains limited.
The formation characteristics of bubbles play a fundamental role in determining their subsequent motion, a phenomenon widely documented under normal conditions [7,8,9]. A critical aspect of bubble dynamics under EHD is the existence of distinct motion regimes [10,11]. At low Reynolds numbers, bubble motion is predominantly hydrodynamic dominated, where wake interactions from leading bubbles significantly influence trailing bubbles [12]. In contrast, at higher electric field, polarization forces dominate, giving rise to an electrohydrodynamic dominated regime that significantly alter bubble size and departure frequency, suggesting a strong correlation between bubble formation and subsequent motion [13,14]. A particularly compelling application of EHD is the control of gas bubble dynamics, where an external electric field introduces interfacial forces that modify bubble shape, trajectory, and terminal velocity [15]. This is especially relevant in environments with reduced or negligible buoyancy, such as microgravity [16,17]. Studies consistently show that increased voltage has been linked to higher detachment frequencies, smaller equivalent diameters, and, in some cases, fragmentation of larger bubbles due to localized convection [6]. Numerical analyses further reveal that the bubble aspect ratio increases with a stronger electric field [18]. Other investigations show that a vertical electric field accelerates bubble rise, whereas a horizontal field decelerates it [19,20]. Moreover, an appropriately applied electric field can enable precise control of droplet and bubble morphology by balancing electrical stresses with wall-induced effects [21], as well as by regulating the onset and development of Rayleigh–Taylor instabilities [22].
Despite these advances, several critical knowledge gaps remain regarding the influence of EHD effects on bubble trajectories—a factor with important implications for practical applications. In electrochemical reactors, batteries, precise control of bubble motion can enhance gas–liquid mass transfer and reaction efficiency, while in bioreactors it can improve oxygen delivery and mixing. Similarly, in advanced manufacturing processes such as microfluidic templating, nanoparticle synthesis, and electrochemical deposition, EHD-mediated bubble control enables improved precision and uniformity. To address these challenges, this study presents a detailed experimental investigation of bubble behavior under a controlled electric field. A custom-built apparatus was designed to generate bubbles under adiabatic conditions from a 0.3 mm orifice within a liquid-filled chamber, while a uniform DC electric field was applied across the test region in both positive and negative polarities.

2. Experimental Condition

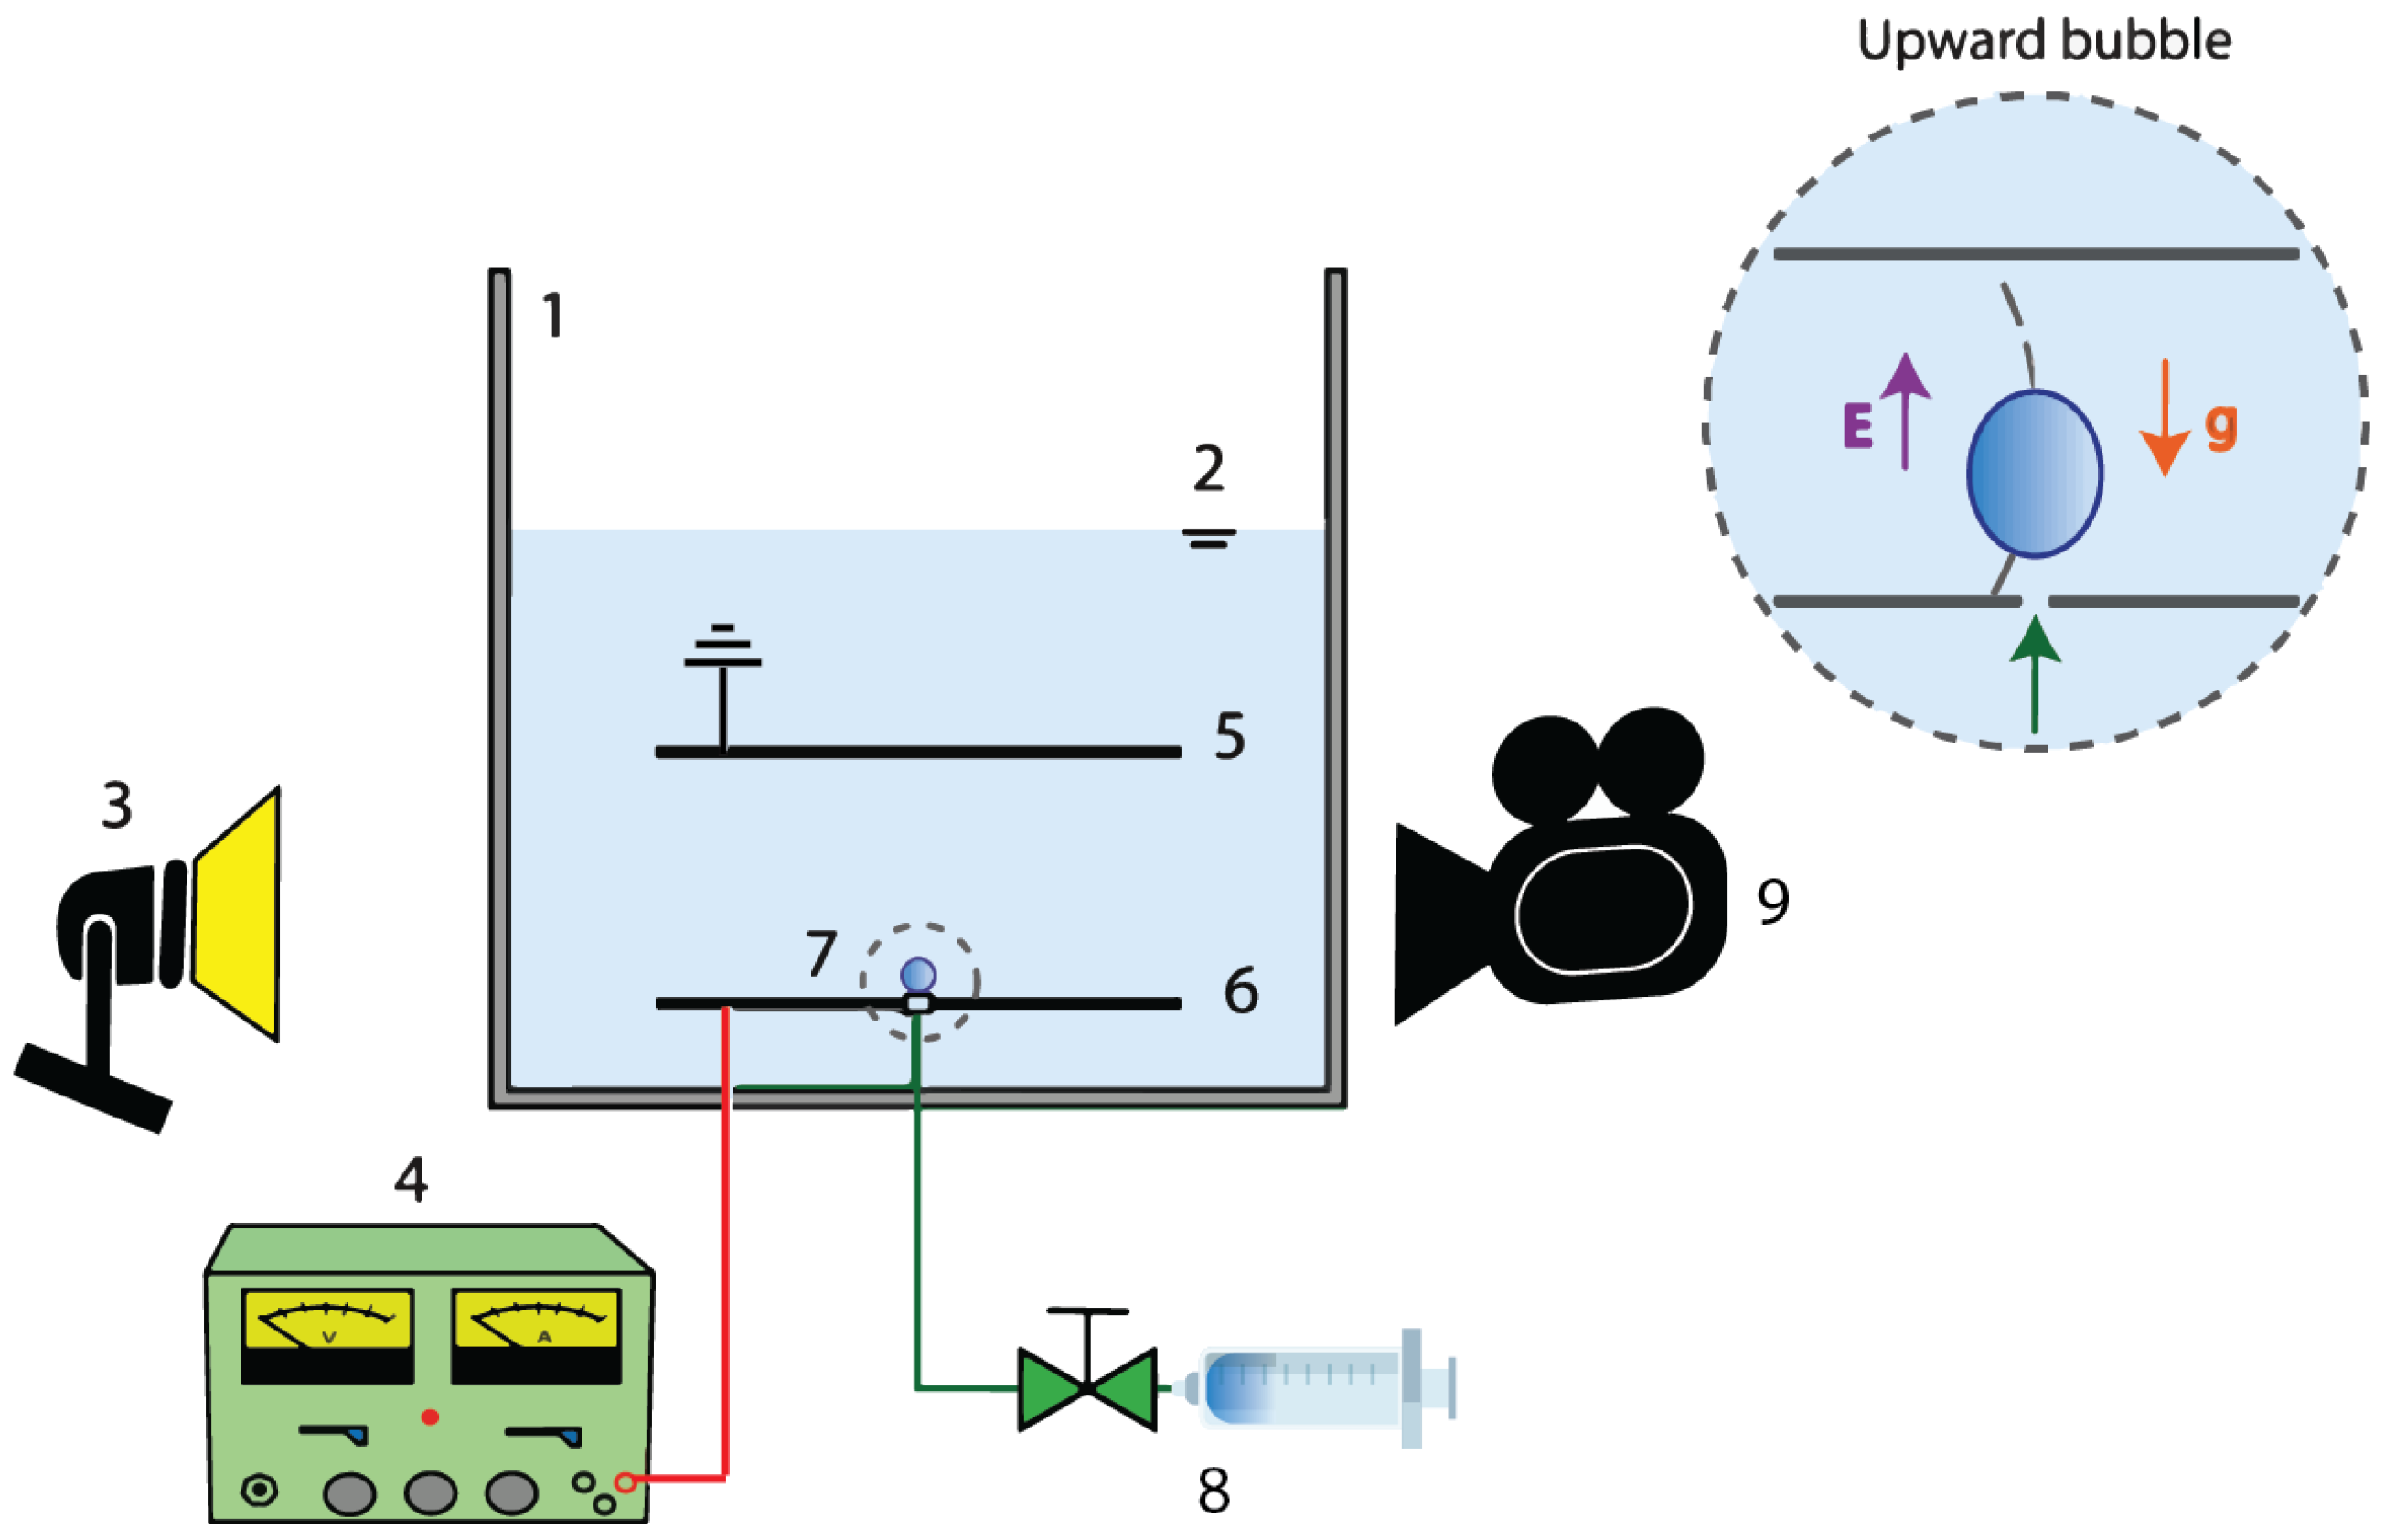
To investigate EHD-induced bubble dynamics under an external electric field, a custom experimental setup—hereafter referred to as the bubble reactor—was developed. The system was designed, constructed, and assembled at the Universidad de las Fuerzas Armadas ESPE. A schematic of the setup is presented in Figure 1, where the main components are labeled as follows: (1) glass vessel, (2) liquid level, (3) LED light, (4) high-voltage power supply, (5) upper electrode, (6) lower electrode, (7) capillary tip, (8) syringe pump, and (9) high-speed camera.
The core of the setup is a glass vessel (20 cm internal length), selected for its mechanical stability and optical clarity. The vessel was filled with the working fluid. All experiments were conducted at a controlled room temperature of 25 °C. The thermophysical properties of the working fluids are summarized in Table 1.
Bubble generation was carried out using a capillary tube (inner diameter, d i n = 0.3 mm) embedded at the center of a lower copper electrode plate (8 cm × 10 cm), with clean air supplied through a syringe pump to maintain a constant and controlled flow rate. A DC high-voltage power supply was used to impose the electric field, with the lower electrode biased at +0.5, +1.5, and +3.0 kV and the upper electrode grounded (0 V). The 50 mm electrode spacing resulted in a nominal average electric field, with significant local intensification near the capillary orifice. Bubble formation, growth, and detachment were recorded with a Phantom V2512 high-speed camera operating at 600 frames per second and a resolution of 1280 × 800 pixels (approximately 23 pixels/mm), with illumination provided by an adjustable LED light source to enhance image contrast. The recorded sequences were analyzed using a custom digital processing algorithm to accurately identify bubble onset and detachment, enabling calculation of bubble lifetime, morphology, centroid position, and axial dimensions, with all experiments conducted under ambient laboratory conditions. The governing dimensionless parameters considered in this study include the electrical Bond number, defined as the ratio of electric force to surface tension,
B o E = d i n ε l E 2 σ ,
where ε l is the liquid permittivity, and the E is the external electric field, defined as E = ϕ / L , where ϕ is the applied electric potential and L is the distance between the electrodes. The influence of the gas flow is characterized by the Reynolds number.
R e g = Q g d i n , ν g ,
where ν g is the kinematic viscosity of the gas and Q g is the gas flow rate, while the effect of liquid properties is captured by the Morton number,
M o = μ l 4 ( ρ l ρ g ) g ρ l 2 σ 3 ,
where μ l is the liquid viscosity, ρ l and ρ g are the liquid and gas densities, respectively, and g is the gravitational acceleration. It is important to highlight that the Morton number remains constant in all experiments, with a fixed value of M o = 1.6 × 10 11 . The rising velocity follows the model proposed in [23]:
U = sin 1 1 γ 2 γ 1 γ 2 1 γ 2 8 σ ρ l d e q γ 4 / 3 + Δ ρ g d e q 2 ρ l γ 2 / 3 1 γ 2
where γ denotes the bubble aspect ratio. For further details, see [23].

3. Results

The behavior of gas bubbles was investigated under varying flow rates and applied electric fields. It is important to note that electrolysis-driven bubble formation and fouling effects were not considered in this study. Experiments were conducted at two gas flow rates (30 and 40 mL/min) and three electric potentials (0.5, 1.5, and 3.0 kV). Bubble geometry was quantified using the aspect ratio, defined as the ratio of the major to minor axis. The bubble volume was estimated by modeling the bubble as a prolate spheroid, V B = π 6 h w 2 , where h and w denote the major and minor axes of the bubble, respectively, was estimated by modeling the bubble as a prolate spheroid. The equivalent diameter was then calculated as d e q = 6 V B π 3 .
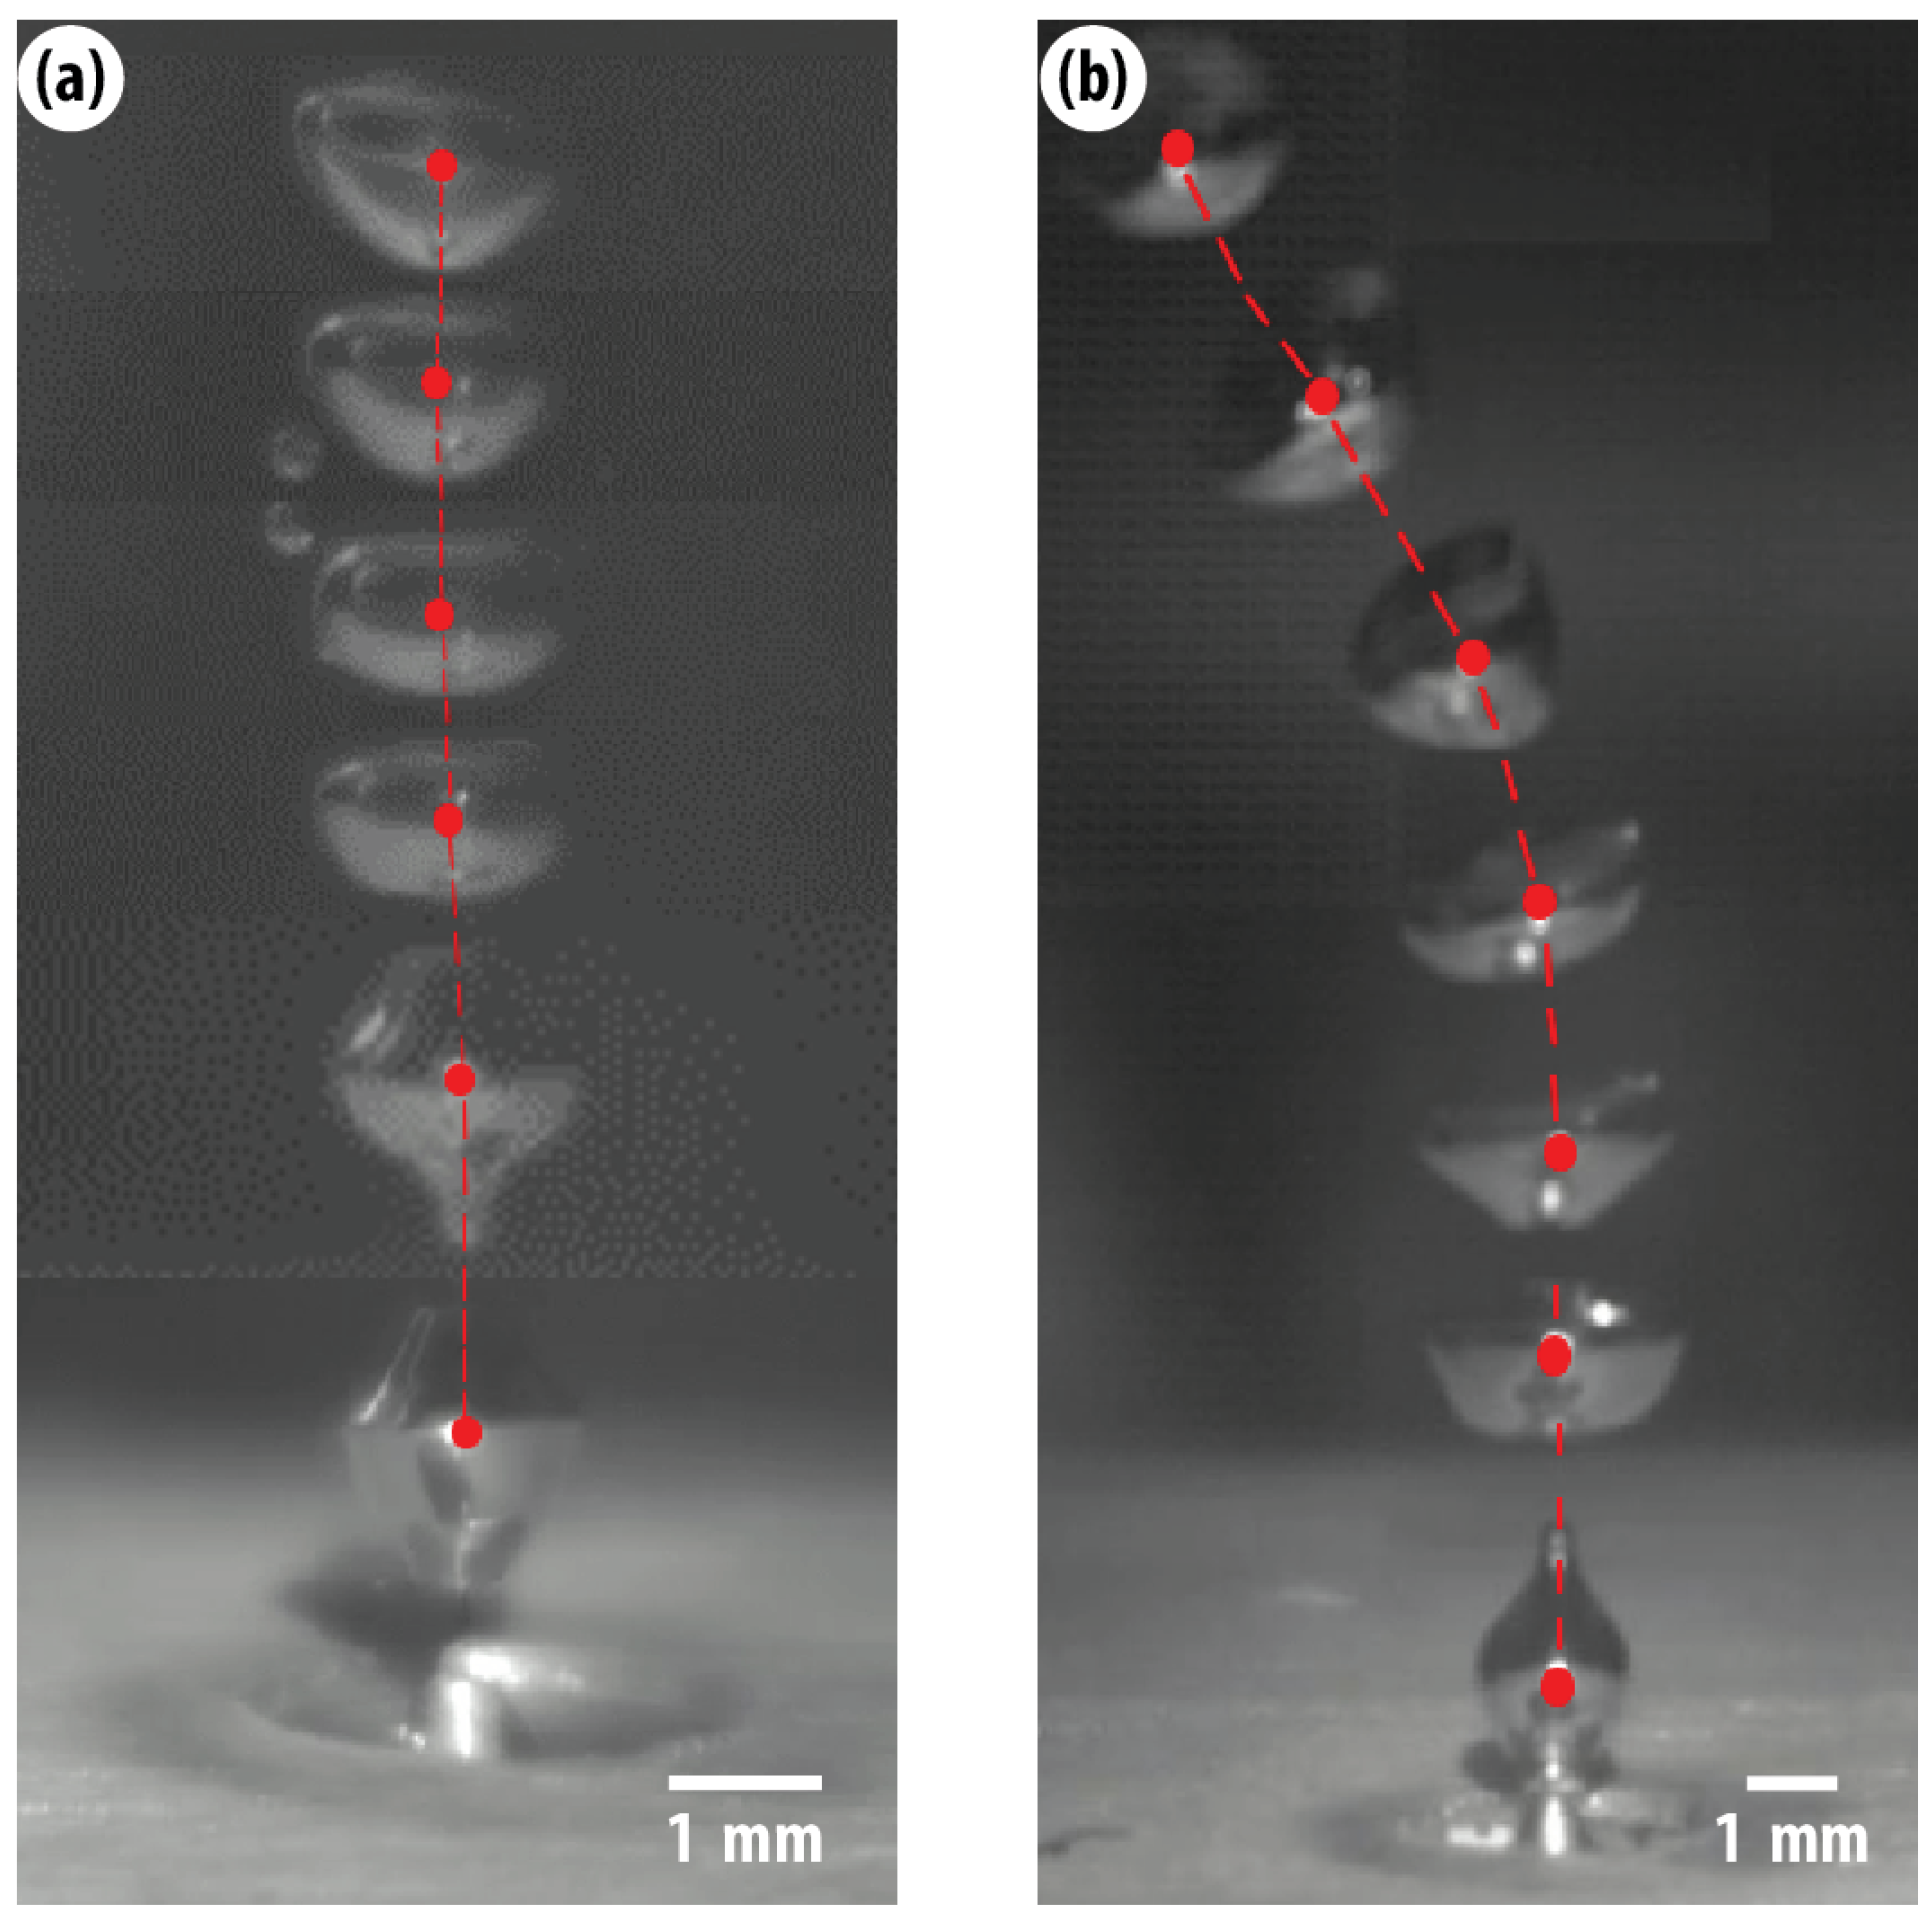
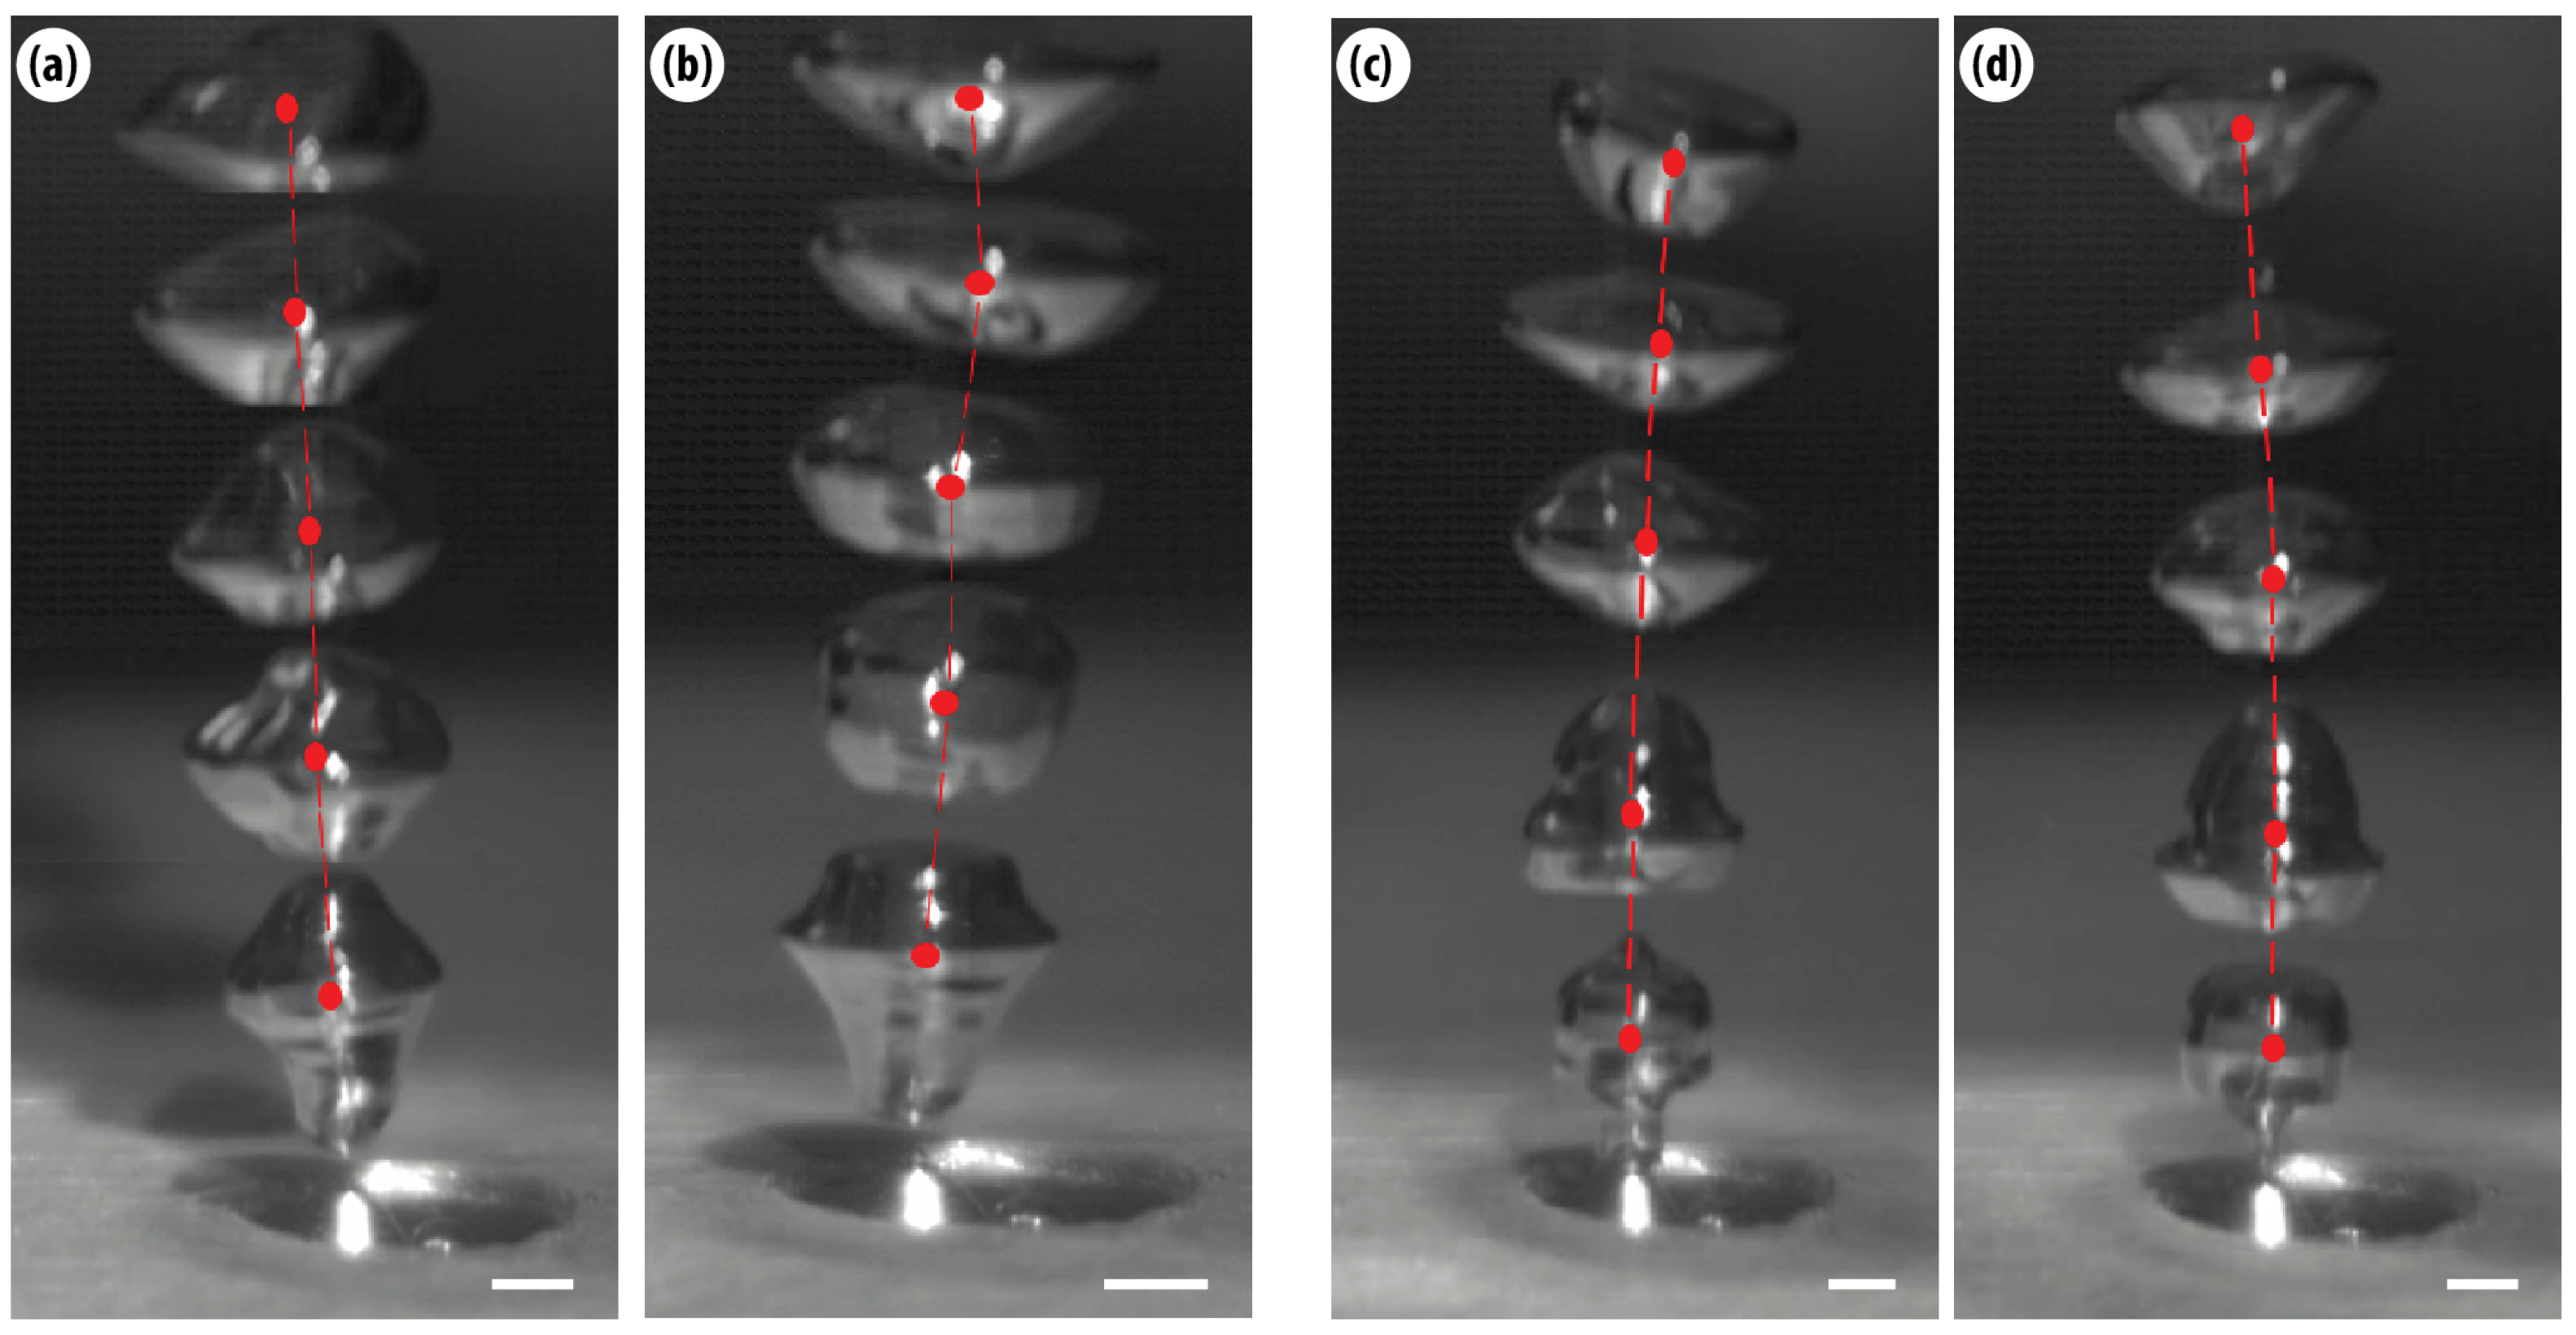
Figure 2 presents the bubble trajectory patterns, which are primarily governed by the flow rate; the gas Reynolds numbers are R e g = 107 (Figure 2a) and R e g = 142 (Figure 2b). The Bond number is fixed at B o E = 0.3 . At the lower Reynolds number, bubbles ascend along nearly vertical, symmetric paths from the bottom to the upper electrode, maintaining stable trajectories even as B o E increases (Figure 3a,b). In contrast, at higher flow rates, the trajectories deviate significantly from the vertical, with bubbles migrating toward the channel walls, as shown in Figure 2b. This displacement indicates that increased velocity amplifies inertial effects, destabilizing the vertical rise and promoting asymmetric motion. Under these conditions ( R e g = 142 ), hydrodynamic forces outweigh the electric force, leaving the field insufficient to constrain bubble dynamics; consequently, the wake of a leading bubble can cause substantial deviations of trailing bubbles from the tube axis [14]. In contrast, when the Bond number is increased, bubbles realign with the electric field lines, reducing lateral drift and restoring a predominantly vertical trajectory (Figure 3c,d).
The observed behavior emerges from the competition between hydrodynamic forces and electric-field-induced interfacial stresses at the air–water interface. In the absence of an electric field, bubble motion is governed by inertia and viscosity, leading to wake-driven instabilities and lateral deviations. The application of an electric field fundamentally alters this balance by inducing polarization at the interface due to the strong dielectric contrast between air and water.
In this sense, the resulting electric force can be expressed as F e = ρ e E 1 2 ( E · E ) ε + 1 2 ε 0 [ ( E · E ) ε ρ l T ρ l ] , where ρ e is the free charge density, E is the electric field vector, ε represents the material permittivity and ε 0 is the vacuum permittivity. Under the present conditions, the Coulomb contribution is negligible, and the system is instead governed by polarization forces that scale with the electric field intensity.
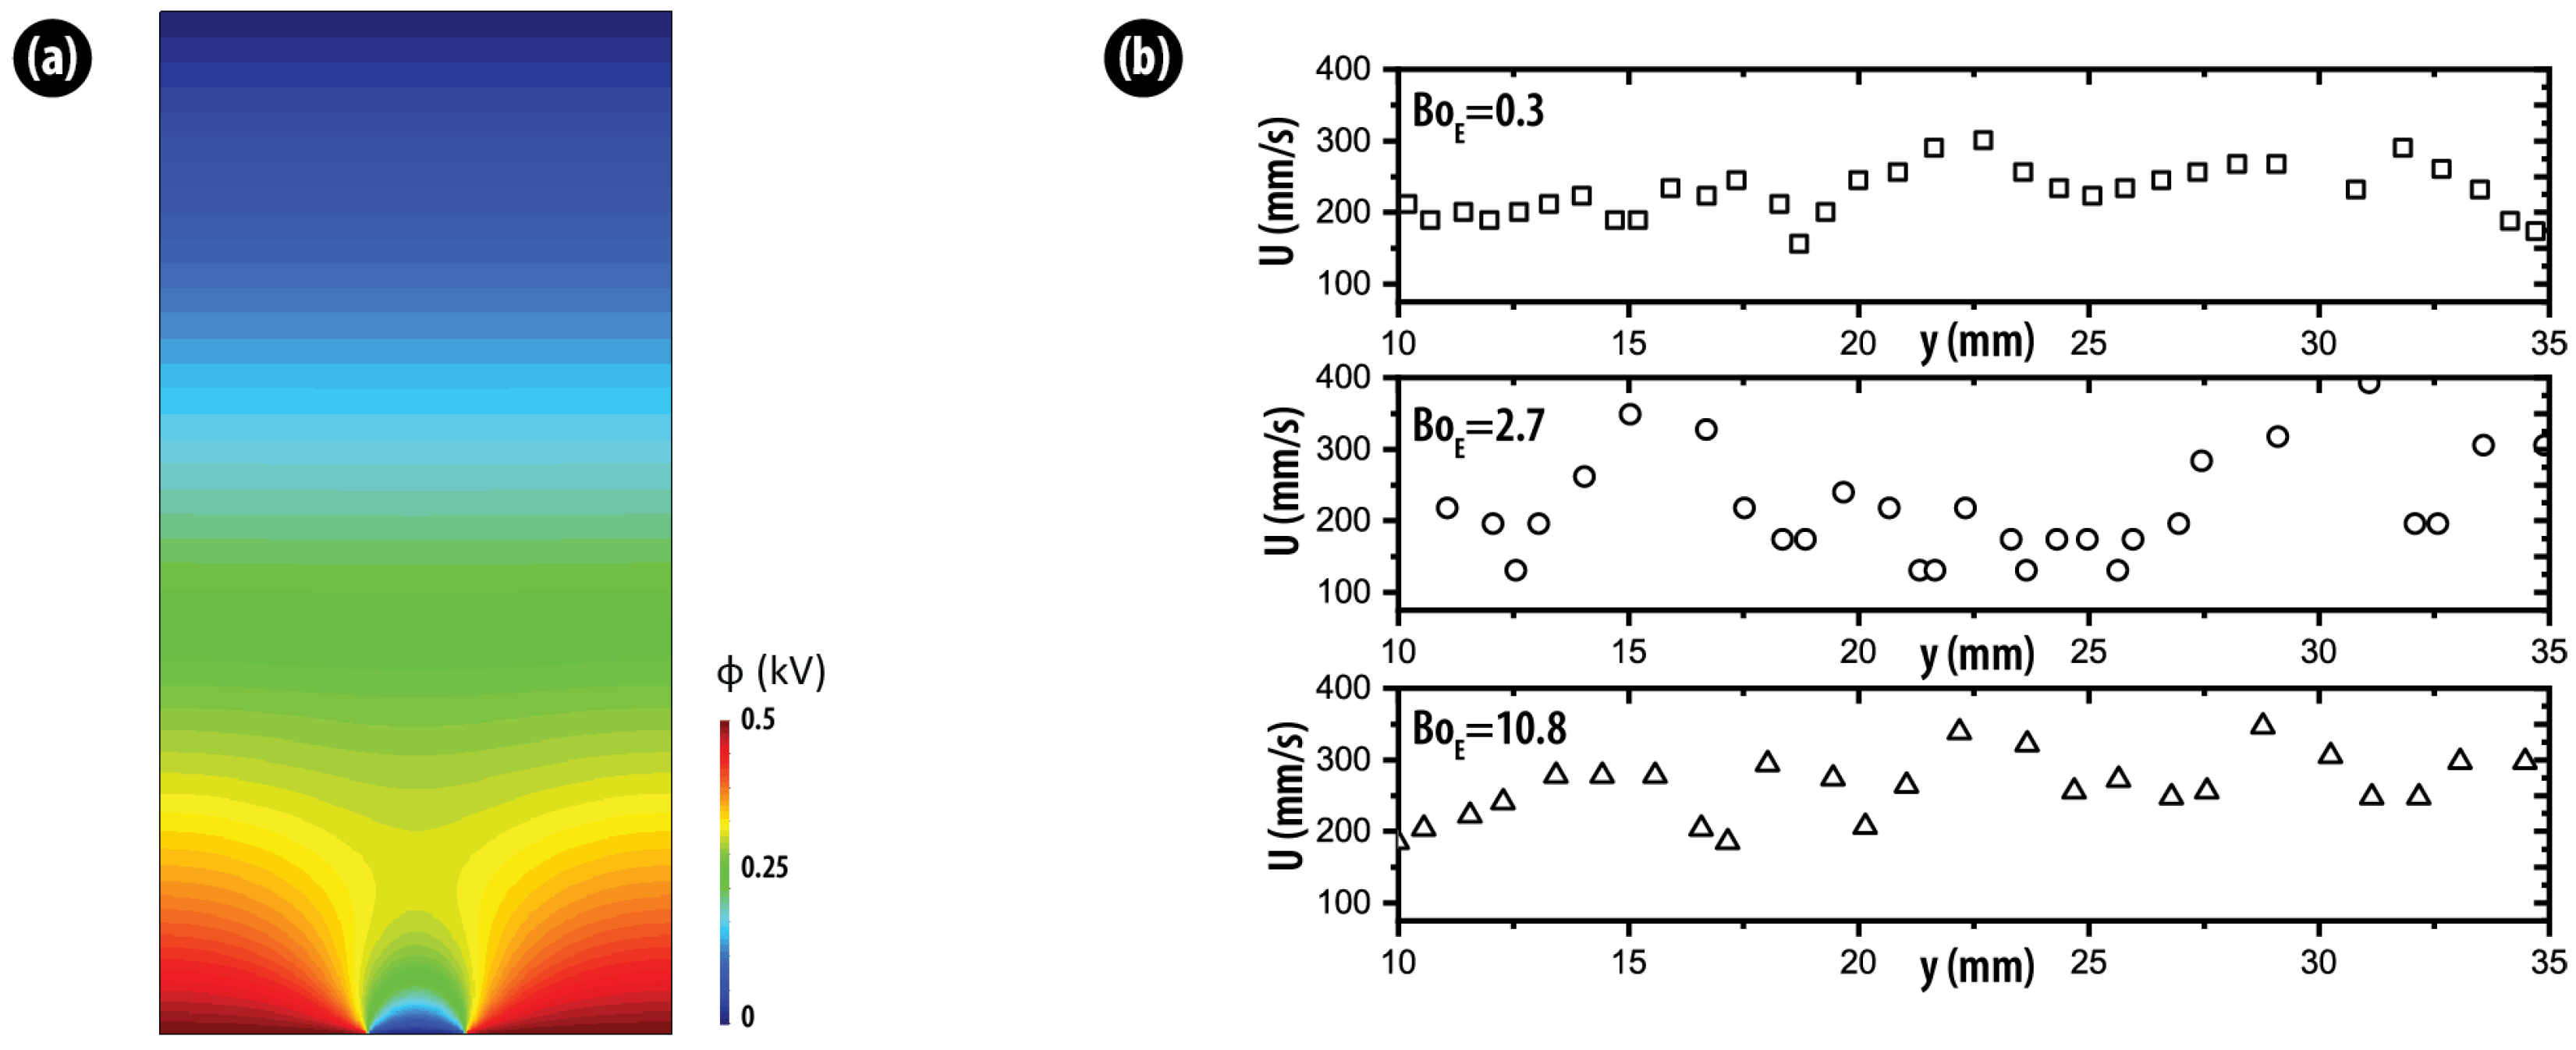
The electrode–orifice geometry imposes a highly non-uniform electric potential (Figure 4a), generating strong electric field gradients and associated dielectrophoretic forces that scale with ( E 2 ) . A lateral displacement of the bubble disrupts the symmetry of the electric stress distribution, producing a restoring force that drives realignment with the field lines and progressively suppresses transverse motion [24]. This transition in dynamics reflects a competition between hydrodynamic and electric stresses: at a low electric Bond number, wake-induced instabilities dominate and give rise to lateral oscillations, whereas increasing B o E leads to electric stresses overcoming capillary resistance, damping perturbations, and ultimately constraining the motion to a stable, nearly vertical trajectory.
Another effect of increasing B o E is the enhancement of bubble velocity. Figure 4b shows measurements of the vertical velocity, U y , as a function of vertical position, y, at R e g = 107 for three electric Bond numbers, B o E = 0.3 , 2.7, and 10.8. The results reveal that velocity increases with both height and applied potential. This acceleration is attributed to stronger induced dipole interactions and more pronounced polarization gradients around the bubble at higher field strengths, which augment dielectrophoretic forces and thereby accelerate the upward motion. To further support this observation, the relationship between the average rising velocity and the applied Bond number was investigated. As shown in the plot, increasing the applied electric field consistently increases the average rising velocity, regardless of the gas flow rate (30, 35, and 40 mL/min). This behavior underscores the dominant influence of the electric field on bubble dynamics. The enhancement in rising velocity with higher voltage is attributed to the amplification of electrohydrodynamic and dielectrophoretic forces, which accelerate the bubble by modifying interfacial stress distributions and inducing flow in the surrounding medium. A similar finding was also reported by [17].
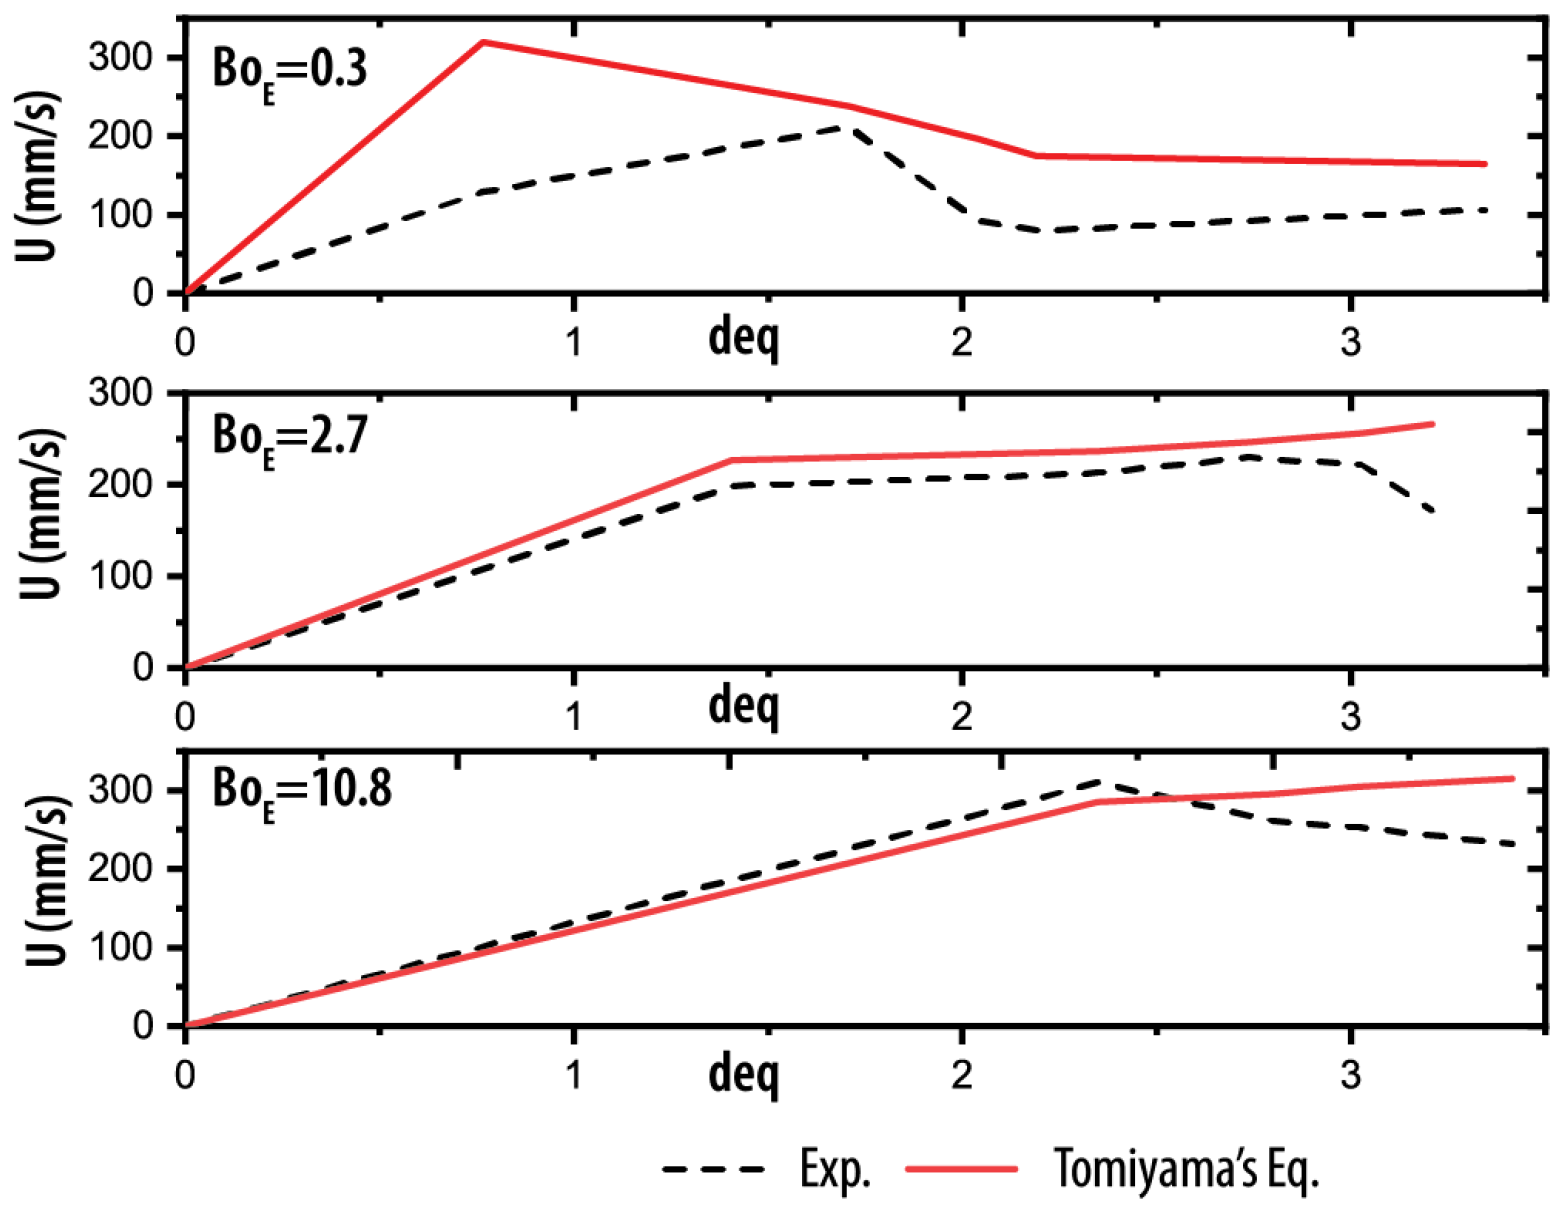
In a separate analysis, the measured velocities exhibit a trend consistent with theoretical predictions, as shown in Figure 5. The dashed line represents the experimental results, while the solid red line corresponds to the theoretical predictions based on Tomiyama’s equation (Equation (4)). This discrepancy is primarily due to the wake generated by leading bubbles, which strongly influences trailing ones, producing a velocity distribution that lies above the predicted curves for most bubbles. In contrast, under electrohydrodynamically dominated conditions, the experimental results agree more closely with theory. This agreement can be attributed to collective wake effects and bubble–bubble interactions, which modify bubble size and dynamic properties, thereby influencing their velocities. Similar observations were reported by [14].

4. Conclusions

The present study demonstrates that bubble generation and motion in deionized water under a non-uniform electric field are strongly influenced by both applied voltage and gas flow rate. A Reynolds number of R e g = 107 was identified, separating two distinct regimes: a hydrodynamic-dominated regime, where wake interactions from leading bubbles significantly affect trailing ones, and an electrohydrodynamic-dominated regime, where polarization forces govern bubble trajectories and suppress lateral deviations. The results further reveal that, although polarization forces dominate the initial motion in the EHD regime, bubbles detached from chains eventually recover hydrodynamic characteristics. In addition, the vertical velocities of rising bubbles exhibit trends consistent with Tomiyama’s model, but remain slightly higher due to persistent bubble–bubble interactions at low B o E and low R e g . Overall, these findings provide valuable insights into the mechanisms governing bubble motion in coupled hydrodynamic–electrohydrodynamic systems and contribute to the development of predictive models for controlling bubble trajectories and minimizing lateral deviation in practical applications.

Author Contributions

Conceptualization, C.N.-M.; methodology, C.N.-M., F.A., B.C. and J.P.; validation, C.N.-M.; formal analysis, C.N.-M.; investigation, A.A., J.B., F.A., B.C., J.P., C.P. and W.S.; writing—original draft preparation, A.A., L.C. and C.N.-M.; writing—review and editing, C.P., W.S. and C.N.-M.; visualization, A.A. and F.A.; supervision, L.C. and C.N.-M. All authors have read and agreed to the published version of the manuscript.

Funding

This research received no external funding.

Institutional Review Board Statement

Not applicable.

Informed Consent Statement

Not applicable.

Data Availability Statement

The data that support the findings of this study are available on request from the corresponding author.

Acknowledgments

The authors would like to express their sincere appreciation to Edwing Quinga, and Diego Diaz for their dedicated support and valuable contributions to the laboratory work. Their assistance was instrumental in the successful execution of the experimental procedures.

Conflicts of Interest

The authors declare no conflicts of interest.

References

  1. Melcher, J. Review of the IUTAM—IUPAP Symposium on Electrohydrodynamics. J. Fluid Mech. 1970, 40, 641–655. [Google Scholar]
  2. Thaokar, R.; Kumaran, V. Electrohydrodynamic instability of the interface between two fluids confined in a channel. Phys. Fluids 2005, 17, 084104. [Google Scholar] [CrossRef]
  3. Anand, V.; Juvekar, V.A.; Thaokar, R.M. Coalescence, partial coalescence, and noncoalescence of an aqueous drop at an oil–water interface under an electric field. Langmuir 2020, 36, 6051–6060. [Google Scholar] [CrossRef] [PubMed]
  4. Huang, X.; He, B.; Xu, Z.; Pei, H.; Ruan, Y.J. Electro-coalescence in step emulsification: Dynamics and applications. Lab A Chip 2020, 20, 592–600. [Google Scholar] [CrossRef]
  5. Mugele, F.; Baret, J.C. Electrowetting: From basics to applications. J. Phys. Condens. Matter 2005, 17, R705. [Google Scholar] [CrossRef]
  6. Wang, Q.; Zhang, G.; Wang, C.; Ma, R.; Yao, W. The electrically induced bubble behaviors considering different bubble injection directions. Int. J. Heat Mass Transf. 2017, 104, 729–742. [Google Scholar] [CrossRef]
  7. Jones, T.B. Electrohydrodynamically enhanced heat transfer in liquids—A review. Adv. Heat Transf. 1979, 14, 107–148. [Google Scholar]
  8. Liu, L.; Yan, H.; Zhao, G. Experimental studies on the shape and motion of air bubbles in viscous liquids. Exp. Therm. Fluid Sci. 2015, 62, 109–121. [Google Scholar] [CrossRef]
  9. Aguirre, V.A.; Castillo, B.A.; Narvaez, C.P. Numerical simulation of a bubble rising in an environment consisting of Xanthan gum. Math. Methods Comput. Tech. Sci. Eng. 2017, 1872, 020022. [Google Scholar]
  10. Karp, J.R.; Lecordier, B.; Shadloo, M.S. Electrohydrodynamic flows inside a neutrally buoyant leaky dielectric drop. Phys. Fluids 2024, 36, 053323. [Google Scholar] [CrossRef]
  11. Narvaez-Munoz, C.; Hashemi, A.R.; Hashemi, M.R.; Segura, L.J.; Ryzhakov, P.B. Computational electrohydrodynamics in microsystems: A review of challenges and applications. Arch. Comput. Methods Eng. 2025, 32, 535–569. [Google Scholar] [CrossRef]
  12. Zhang, W.; Wang, J.; Li, B.; Liu, H.; Mulbah, C.; Wang, D.; Yongphet, P. EHD effects on periodic bubble formation and coalescence in ethanol under non-uniform electric field. Chem. Eng. Sci. 2020, 215, 115451. [Google Scholar] [CrossRef]
  13. Shin, W.T.; Yiacoumi, S.; Tsouris, C. Experiments on electrostatic dispersion of air in water. Ind. Eng. Chem. Res. 1997, 36, 3647–3655. [Google Scholar] [CrossRef]
  14. Zhang, W.; Wang, J.; Li, B.; Yu, K.; Wang, D.; Yongphet, P.; Xu, H.; Yao, J. Experimental investigation on bubble coalescence regimes under non-uniform electric field. Chem. Eng. J. 2021, 417, 127982. [Google Scholar] [CrossRef]
  15. Kweon, Y.; Kim, M. Experimental study on nucleate boiling enhancement and bubble dynamic behavior in saturated pool boiling using a nonuniform dc electric field. Int. J. Multiph. Flow 2000, 26, 1351–1368. [Google Scholar] [CrossRef]
  16. Basu, D. Effect of electric field on boiling hysteresis in carbon tetrachloride. Int. J. Heat Mass Transf. 1973, 16, 1322–1324. [Google Scholar] [CrossRef]
  17. Di Marco, P.; Grassi, W.; Memoli, G.; Takamasa, T.; Tomiyama, A.; Hosokawa, S. Influence of electric field on single gas-bubble growth and detachment in microgravity. Int. J. Multiph. Flow 2003, 29, 559–578. [Google Scholar] [CrossRef]
  18. Cho, H.; Kang, I.; Kweon, Y.; Kim, M. Numerical study of the behavior of a bubble attached to a tip in a nonuniform electric field. Int. J. Multiph. Flow 1998, 24, 479–498. [Google Scholar] [CrossRef]
  19. Yang, Q.; Li, B.Q.; Shao, J.; Ding, Y. A phase field numerical study of 3D bubble rising in viscous fluids under an electric field. Int. J. Heat Mass Transf. 2014, 78, 820–829. [Google Scholar] [CrossRef]
  20. Feng, Y.; Li, H.; Guo, K.; Lei, X.; Zhao, J. Numerical investigation on bubble dynamics during pool nucleate boiling in presence of a non-uniform electric field by LBM. Appl. Therm. Eng. 2019, 155, 637–649. [Google Scholar] [CrossRef]
  21. Narváez-Muñoz, C.; Dialami, N.; Guerrero, B.; Carrión, L.; Medina, E. Electrohydrodynamic manipulation of droplets in confined spaces: Impact of geometric eccentricities and material properties. In The European Physical Journal Special Topics; Springer: Berlin/Heidelberg, Germany, 2025; pp. 1–13. [Google Scholar]
  22. Narváez-Muñoz, C.; Hashemi, M.R.; Almeida, F.; Alexis, F.; Ryzhakov, P.B. Computational study of electrohydrodynamic regimes on planar films. Phys. Fluids 2025, 37, 072017. [Google Scholar] [CrossRef]
  23. Tomiyama, A.; Celata, G.; Hosokawa, S.; Yoshida, S. Terminal velocity of single bubbles in surface tension force dominant regime. Int. J. Multiph. Flow 2002, 28, 1497–1519. [Google Scholar] [CrossRef]
  24. Brown, C.V.; Edwards, A.M.; Roberts, A.; Newton, M.I.; Sage, I.C.; Ledesma-Aguilar, R.; McHale, G. Bubble control, levitation, and manipulation using dielectrophoresis. Adv. Mater. Interfaces 2021, 8, 2001204. [Google Scholar] [CrossRef]
Figure 1. Schematic representation of the experimental system. The system comprises: (1) glass vessel, (2) liquid level, (3) LED illumination source, (4) high-voltage power supply, (5) upper electrode, (6) lower electrode, (7) capillary tip, (8) syringe pump, and (9) high-speed camera.
Fluids 11 00102 g001
Figure 2. Bubble trajectory patterns at B o E = 0.3 for two gas Reynolds numbers: (a) R e g = 107 , and (b) R e g = 142 . A scale bar is presented in each figure for reference.
Fluids 11 00102 g002
Figure 3. Effect of increasing the Bond number on bubble trajectories. (a,b) Trajectories at R e g = 107 for B o E = 2.7 and B o E = 10.8 , respectively. (c,d) Trajectories at R e g = 142 for B o E = 2.7 and B o E = 10.8 , respectively. All scale bars, 1 mm.
Fluids 11 00102 g003
Figure 4. Electrohydrodynamic effects on bubble dynamics. (a) Electric potential distribution generated by the electrode–orifice geometry. (b)Experimental measurements (open symbols) of bubble rise velocity as a function of vertical position for varying electric Bond numbers ( B o E ), at a fixed gas Reynolds number ( R e g = 107 ).
Fluids 11 00102 g004
Figure 5. Equivalent diameter ( d e q ) versus bubble velocity at R e g = 107 . Dashed line: experimental data; solid red line: Tomiyama’s prediction.
Fluids 11 00102 g005
Table 1. Thermophysical properties of working fluids at 25 °C.
PropertyUnitWaterAir
Density, ρ kg/ m 3 9971.184
Dynamic viscosity, μ Pa·s 8.90 × 10 4 1.85 × 10 5
Surface tension, σ N/m0.0728-
Electrical conductivity, κ μS/cm 0.04-
Disclaimer/Publisher’s Note: The statements, opinions and data contained in all publications are solely those of the individual author(s) and contributor(s) and not of MDPI and/or the editor(s). MDPI and/or the editor(s) disclaim responsibility for any injury to people or property resulting from any ideas, methods, instructions or products referred to in the content.