1. Introduction
Organic liquids such as chlorinated solvents and hydrocarbon fuels remain primary contaminants of concern at numerous sites across the globe. The presence of these contaminants poses serious risks to human health, water resources, and the environment at many sites. The magnitude and rate of dissolution of these organic immiscible liquids, typically referred to as nonaqueous-phase liquids (NAPLs), into soil porewater and groundwater is a primary factor influencing their contribution to contamination and associated risk. As such, there is great interest in characterizing and quantifying the interfaces between these organic liquids and water. X-ray microtomography (XMT) is an advanced tool suitable for characterizing fluid–fluid interfacial areas in porous media. For example, many studies have used X-ray microtomography (XMT) to characterize air-water and organic liquid–water interfacial areas for porous media (see compilation tables in [
1,
2]).
The vast majority of XMT studies to date have employed small column devices that comprise small sample volumes of approximately 200 mm
3. This is partly due to the limited ability of the X-ray to penetrate the sample, as well as field-of-view constraints. A key consideration for any characterization method is whether the imaged volume satisfies the representative elementary volume (REV) requirement for accurate determination of the characteristic of interest. The adequacy of imaged volumes in XMT imaging has been investigated primarily for porosity and permeability (e.g., [
3,
4,
5,
6,
7,
8,
9]). Multiple studies have demonstrated that REV requirements for porosity are met with volumes of a few mm
3 (e.g., [
4,
6,
8,
10]). Borges et al. [
10] conducted an analysis of REV for investigating tortuosity and characterizing the inner structure of a natural soil. The authors suggest that an REV is only adequate if it meets the minimum size required to characterize all the properties of interest. The suggested volume for tortuosity (17,216 mm
3), for example, is much larger than those typically used for measuring interfacial areas. There are only a few imaging studies that address the REV needed to adequately characterize the fluid–fluid interface (e.g., [
6,
11,
12,
13,
14,
15]).
In general, REV investigations have employed the standard small XMT columns, where the property of interest is determined for smaller and smaller subsets of the imaged volume (e.g., [
6,
7,
16,
17]). An alternative means to evaluate scale effects is to image separate systems with much larger sample sizes and compare the results to those obtained for the standard XMT columns. A very few XMT studies have used larger columns for imaging. For example, Karpyn et al. [
12] investigated non-wetting phase distributions in a glass-beads medium using an IMT to image the entire length of the 9 cm long column (imaged volume of approximately 45,870 mm
3). McDonald et al. [
15] used an IMT to measure fluid saturations and fluid–fluid interfacial areas for a natural sand by imaging the entire 15 cm long column (imaged volume of approximately 76,000 mm
3). However, these studies did not compare results to those obtained for smaller systems.
The objective of this work is to evaluate the impact of sample size on REV attainment, specifically for NAPL–water interfacial area in a representative sand medium. This is accomplished by systematically comparing fluid–fluid interfacial areas measured in standard small columns and larger columns using both industrial and synchrotron XMT. Standard-sized small columns and significantly larger columns were imaged using the same IMT system. The larger column is representative of those traditionally used in immiscible-displacement and solute-transport studies, whereas the small column is representative of the sample size typically used in XMT studies. Additional small columns were imaged using synchrotron XMT (SMT) to evaluate the comparability between the different systems. The bulk densities, porosities, and interfacial areas for all three imaged sets are compared.
2. Materials and Methods
2.1. Materials
A well-sorted 40–50 mesh quartz sand (Accusand, Unimin Co., New Canaan, CT, USA) was used for the experiments. It has a particle density (ρ
p) of 2.64 g/cm
3, a median particle diameter (d
50) of 0.35 mm, and a uniformity coefficient (U = d
60/d
10) of 1.17. Reagent-grade trichloroethene (TCE) or tetrachloroethene (Sigma-Aldrich Co., St. Louis, MO, USA) was used as a model organic, non-wetting fluid. These two compounds are common contaminants of concern at many hazardous-waste-impacted sites. Iodobenzene (8%
vol./
vol.) was added to enhance image contrast between immiscible fluid and water. All experiments were conducted with a 5 mM CaCl
2 aqueous solution prepared with distilled–deionized water. Measurements conducted prior to the study indicated that the TCE–water interfacial tensions were similar in the presence and absence of the CaCl
2, and that the dopant had no measurable impact on the fluid distributions (e.g., [
18]).
2.2. Experiment Set-Up
Each column presented in this study was imaged at a single residual non-wetting saturation for consistency. A large glass chromatography column (L = 15 cm, din = 2.5 cm) and X-ray transparent aluminum columns (L = 4 cm, din = 0.72 cm) were used to obtain high-resolution XMT data using the same acquisition system. Polypropylene frits (10 μm pore size) placed within the end caps promoted uniform flow and stabilized the porous media within the column. A porous steel plate placed within the lower end cap was also used to promote uniform flow during imbibition. The glass columns were packed with sand to consistent bulk densities (1.73 ± 0.02 g/cm3) and porosities (0.34 ± 0.01) under slurry conditions, using de-aired water to obtain water-saturated conditions. The column axes were labeled alphabetically beginning at the bottom/influent end of the column, to denote the scan intervals used for the imaging. The bulk density and porosity of the smaller aluminum columns were 1.67 ± 0.02 g/cm3 and 0.37 ± 0.01, respectively.
Data reported in Brusseau et al. [
11] are used to provide a comparison to the data obtained in the present study using IMT. They used SMT to measure eight fluid–fluid interfacial areas for an organic liquid (tetrachloroethene) and water system. The same sand was used for both the prior and current studies. An additional seven data sets were collected in the present study using the same procedure as employed by Brusseau et al. [
11]. In brief, the sand was packed into thin-walled aluminum columns (length ≈ 4.4 cm, inner diameter ≈ 0.6 cm). The SMT columns were dry packed, and the columns were subjected to saturation treatments described in [
11] under similar conditions used for the larger columns described above. The bulk densities and porosities for these samples were 1.71 g/cm
3 (±0.04) and 0.35 (±0.02) (
Table 1). Three different NAPL saturations were used for the imaging of the large columns and the small columns imaged by SMT: low (~0.12), moderate (~0.22), and higher (≥0.3).
2.3. X-Ray Microtomography (XMT) Imaging
High-resolution XMT imaging was conducted for seven large glass chromatography columns and two smaller aluminum columns at the Environmental Molecular Sciences Laboratory (EMSL) at Pacific Northwest National Laboratory. In both cases, the entire column length was scanned at one time, with a resolution of ~22 μm/pixel. A voltage of 170 kV was used with a tungsten filament to generate X-rays. The detector collected 3143 projections for every 360 degrees of rotation, and four frames were collected for each partial degree of rotation. These frames were then statistically averaged to reduce noise. Reconstruction of each projection was performed using the CT-Pro software version 2.0, which employs a filtered back-projection method. Details on the instrumentation and methods for the imaging are described in [
14,
15].
Additional data for smaller columns presented in this study were collected using a synchrotron X-ray microtomography system. The imaging was conducted at the GeoSoilEnviro Consortium for Advanced Radiation Sources (GSECARS) BM-13D beamline at the Advanced Photon Source, Argonne National Laboratory, Lemont, IL, USA. The field of view for each section was approximately 5 mm. The resolution was ~11 µm/pixel. In a few instances, multiple sections of the column were imaged from the center of the column to increase the imaged sample volume. Combined, the imaged sections were approximately 4–10 mm long. Independent sets of images were collected from three columns packed with dry porous media, which were used to measure the specific surface area of the solid phase, similar to prior studies (i.e., [
11,
16]).
Methods for collecting three-dimensional images of geologic and environmental samples using synchrotron X-ray microtomography, specific to the instrumentation at GSECARS, have been previously presented (e.g., [
11,
16,
18]). The original gray-scale projections were preprocessed with GSECARS-developed software version 1.7.4 [
19,
20]. Further details regarding the facility are available at the GSECARS webpage (
http://cars9.uchicago.edu/software/tomography.html, accessed on 14 March 2014).
2.4. Quantification of Interfacial Areas
The software package Blob3D version 1.0, which was specifically developed for high-resolution X-ray microtomography applications [
21], was used for additional image data processing and extraction of quantitative information. A global thresholding technique was employed, whereby the average gray-scale value of each phase was used to determine the threshold for a given image set. This was done to create an array of binary images wherein voxels considered to be organic liquid were assigned a gray-scale of 255 (white), and all other phases were assigned unique gray-scale values between 255 and 0 (black). One set of specific thresholds was determined for an entire set of images collected for a column. And a specific set was developed for each column to account for potential small variations in imaging conditions during the entire measurement period.
Once the thresholds were determined, the image sets were processed by Blob3D to identify and assign each voxel to a specific phase. Contiguous voxels of a given phase were combined to form three-dimensional units. The volume of all voxels comprising each contiguous organic liquid unit (i.e., “blob”) was determined, and the sum of individual blob volumes was used to calculate the total organic liquid volume. The isosurface smoothing option was used within Blob3D to minimize pixilation of smooth surfaces attributed to the finite imaging resolution and data segmentation. This pixelation can artificially increase the interfacial area, and the smoothing function reduces the impact of the pixelation. A single setting was used for the isosurface smoothing for each set of images. The results of prior studies have demonstrated that these methods produce accurate characterization of non-wetting fluid volumes, surface areas, and interfacial areas (e.g., [
11,
14,
18,
22]).
The total surface area of non-wetting fluid was used to determine the total non-wetting/wetting interfacial area (Anw). This is based on the assumption that all porous medium grains are solvated by water. This approach provides a measure of total non-wetting/wetting interfacial area, including area associated with capillary domains (e.g., menisci), and area associated with immiscible liquid in contact with water films. Interfacial areas and surface-area/volume ratios were calculated (total surface area of immiscible liquid divided by the total immiscible liquid volume) for each individual organic liquid. This measurement normalizes for the amount of fluid present. The total surface area of the organic liquid was used to determine the total interfacial area. The total specific organic-liquid interfacial area (Anw, cm−1) was determined by dividing the total measured organic-liquid interfacial area by the volume of the porous medium in the imaged domain, to facilitate comparison between interfacial area values obtained using different methods and at varying immiscible liquid saturations.
3. Results and Discussion
3.1. XMT Imaging of Large and Small Columns
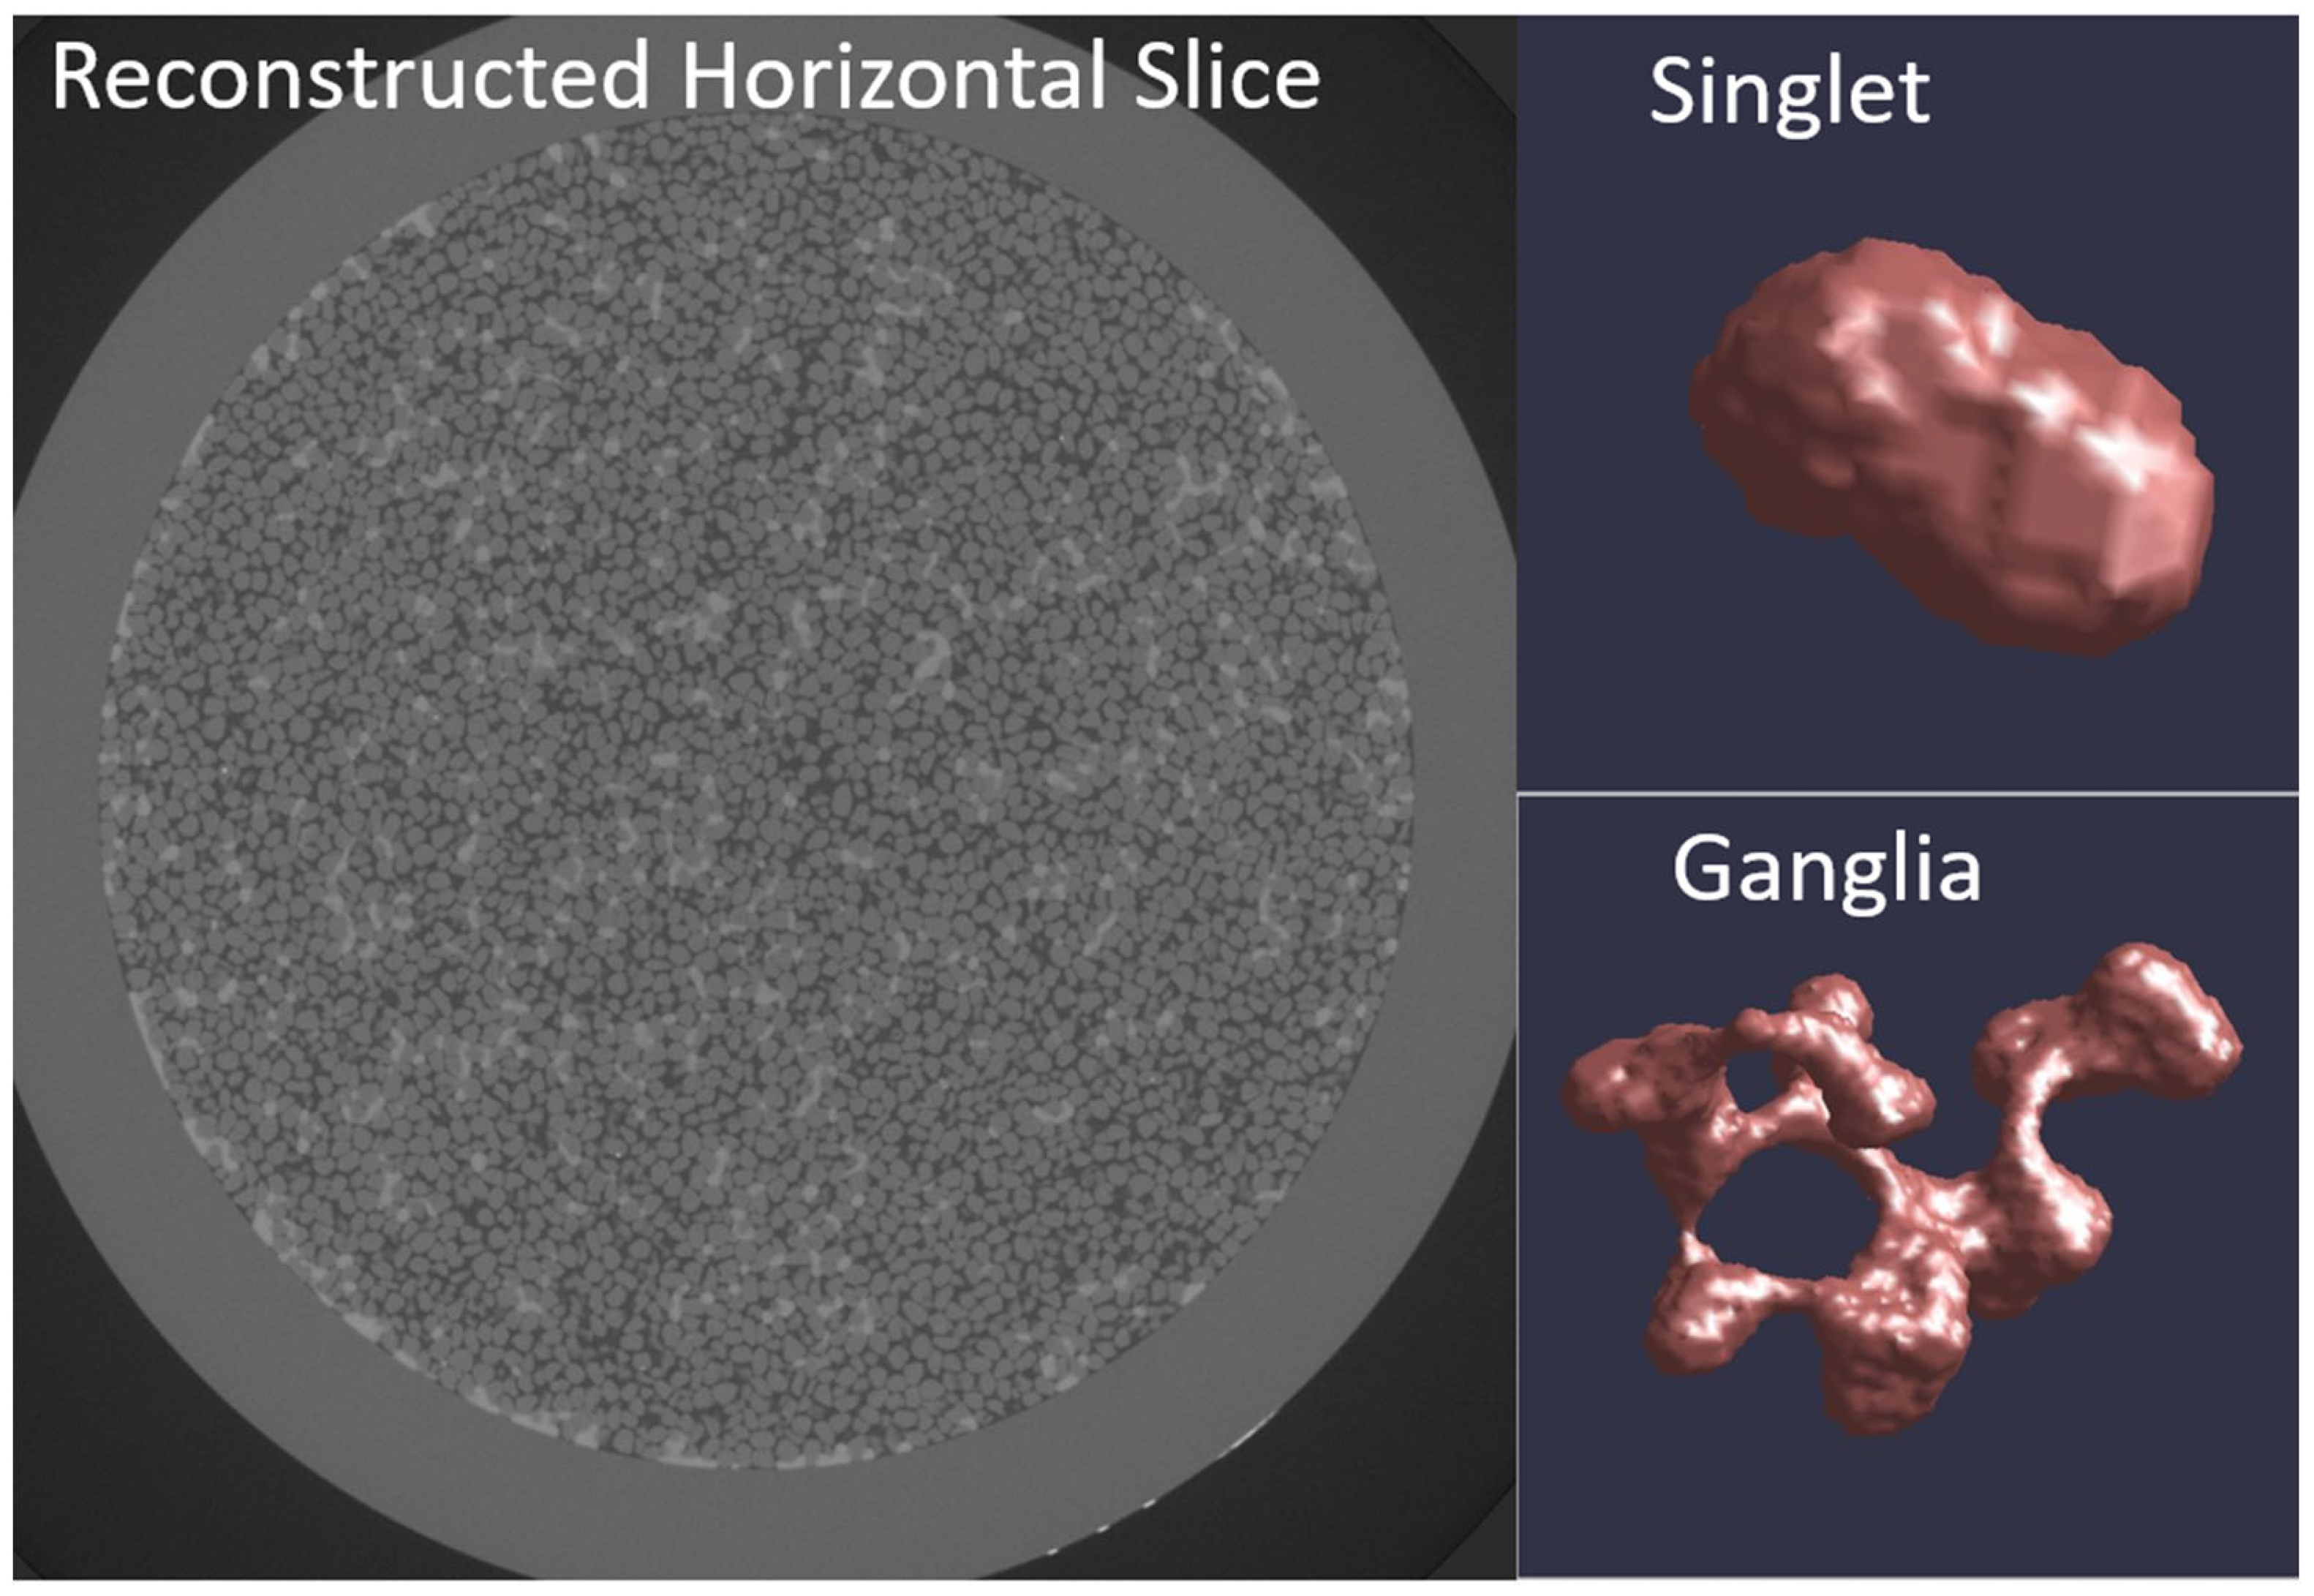
Images obtained of the large columns using IMT showed that air, water, TCE, and sand were readily differentiated (
Figure 1). TCE was well distributed radially through the columns, and there appeared to be little preferential accumulation along the column walls. Organic liquid blobs ranged in size from small, spherical singlets to larger ganglia (
Figure 1), which is consistent with previous work (e.g., [
22]). Minimal amounts of air were present in the columns, with volumes < 0.2 cm
3. This represents less than 0.3% of the column volume and less than 1% of the pore volume.
The total final imaged volume (V
sample) was 76,000 mm
3.
Table 1 shows the physical properties of each packed column determined gravimetrically prior to injection with immiscible (non-wetting) fluid. The mean bulk density for all experiments was 1.73 (±0.02) g/cm
3 with a corresponding porosity (
n) of 0.34 (±0.01). The low 95% confidence interval for all seven experiments indicates the column preparations were reproducible.
The total (wetting/non-wetting) specific interfacial areas (A
nw) are shown in
Table 1 for each residual saturation (S
n). The mean non-wetting/wetting interfacial areas measured for the large columns for the low and moderate NAPL saturations (S
n), are 11.3 cm
−1 (S
n = 0.13) and 15.3 cm
−1 (S
n = 0.22), respectively. The large volume of this column required dividing the imaged volume into smaller domains for processing. The impact of artificial surface areas added to each subdomain was evaluated by comparing the magnitudes of these areas to those of the interfacial areas within the porous medium. The analysis revealed that these artificial boundaries correspond to approximately 1% of the total non-wetting/wetting interfacial area in each column. Therefore, the impact of the artificial boundaries is considered to be negligible.
Two smaller columns were also imaged using the same instrument as used for the larger columns. The total final imaged volume (Vsample) was 1246 mm3, which is ~60 times smaller than the larger columns. The average bulk density of ((1.73 ± 0.02) g/cm3) and porosity (0.34 ± 0.01) are equal to those obtained for the larger columns. The low variability in the physical properties observed for both large and small columns suggests robust preparation of the sand packs.
The total (non-wetting/wetting) specific interfacial areas (A
nw) for the small columns are also shown in
Table 1. The mean A
nw for the two columns is 16.7 cm
−1 for a mean S
n of 0.24. This compares very well to the mean obtained for the large columns at the moderate S
n. The results suggest that the macroscopic parameters in question determined with the smaller columns are representative of the properties for the larger columns evaluated in this study.
3.2. Synchrotron-XMT Imaging
An additional seven small-column SMT data sets were obtained and combined with the data reported by Brusseau et al. [
11] for comparison to the IMT data. The synchrotron columns (SMT) have an effective volume of 216 mm
3. The mean bulk density is 1.71 (±0.04) g/cm
3, and the mean porosity is 0.35 (±0.02) for all 15 data sets (8 sets from Brusseau et al. [
11] and 7 additional data sets). The low 95% confidence interval indicates that the column preparations are reproducible. Furthermore, these values are consistent with the properties determined for the IMT-imaged columns.
Table 2 shows the total specific interfacial area (A
nw) for each S
n determined for the 7 new measurements. The mean non-wetting/wetting interfacial areas measured for the low and moderate NAPL saturations (S
n), are 9.4 cm
−1 (S
n = 0.12) and 16.9 cm
−1 (S
n = 0.21), respectively. Notably, the interfacial areas measured at the moderate S
n for the SMT columns are consistent with those measured for the small columns (16.7 cm
−1, S
n = 0.24) and the larger columns (15.3 cm
−1, S
n = 0.22) imaged by IMT. In addition, the interfacial areas measured at the lower S
n for the small columns imaged by SMT (9.4 cm
−1, S
n = 0.12) are consistent with those of the larger column (11.3 cm
−1, S
n = 0.13). The small difference in imaging resolution between the IMT and SMT does not appear to have had a significant effect on the results, given the comparable measurements.
3.3. Quantitative Analysis of Results
The interfacial areas measured at all S
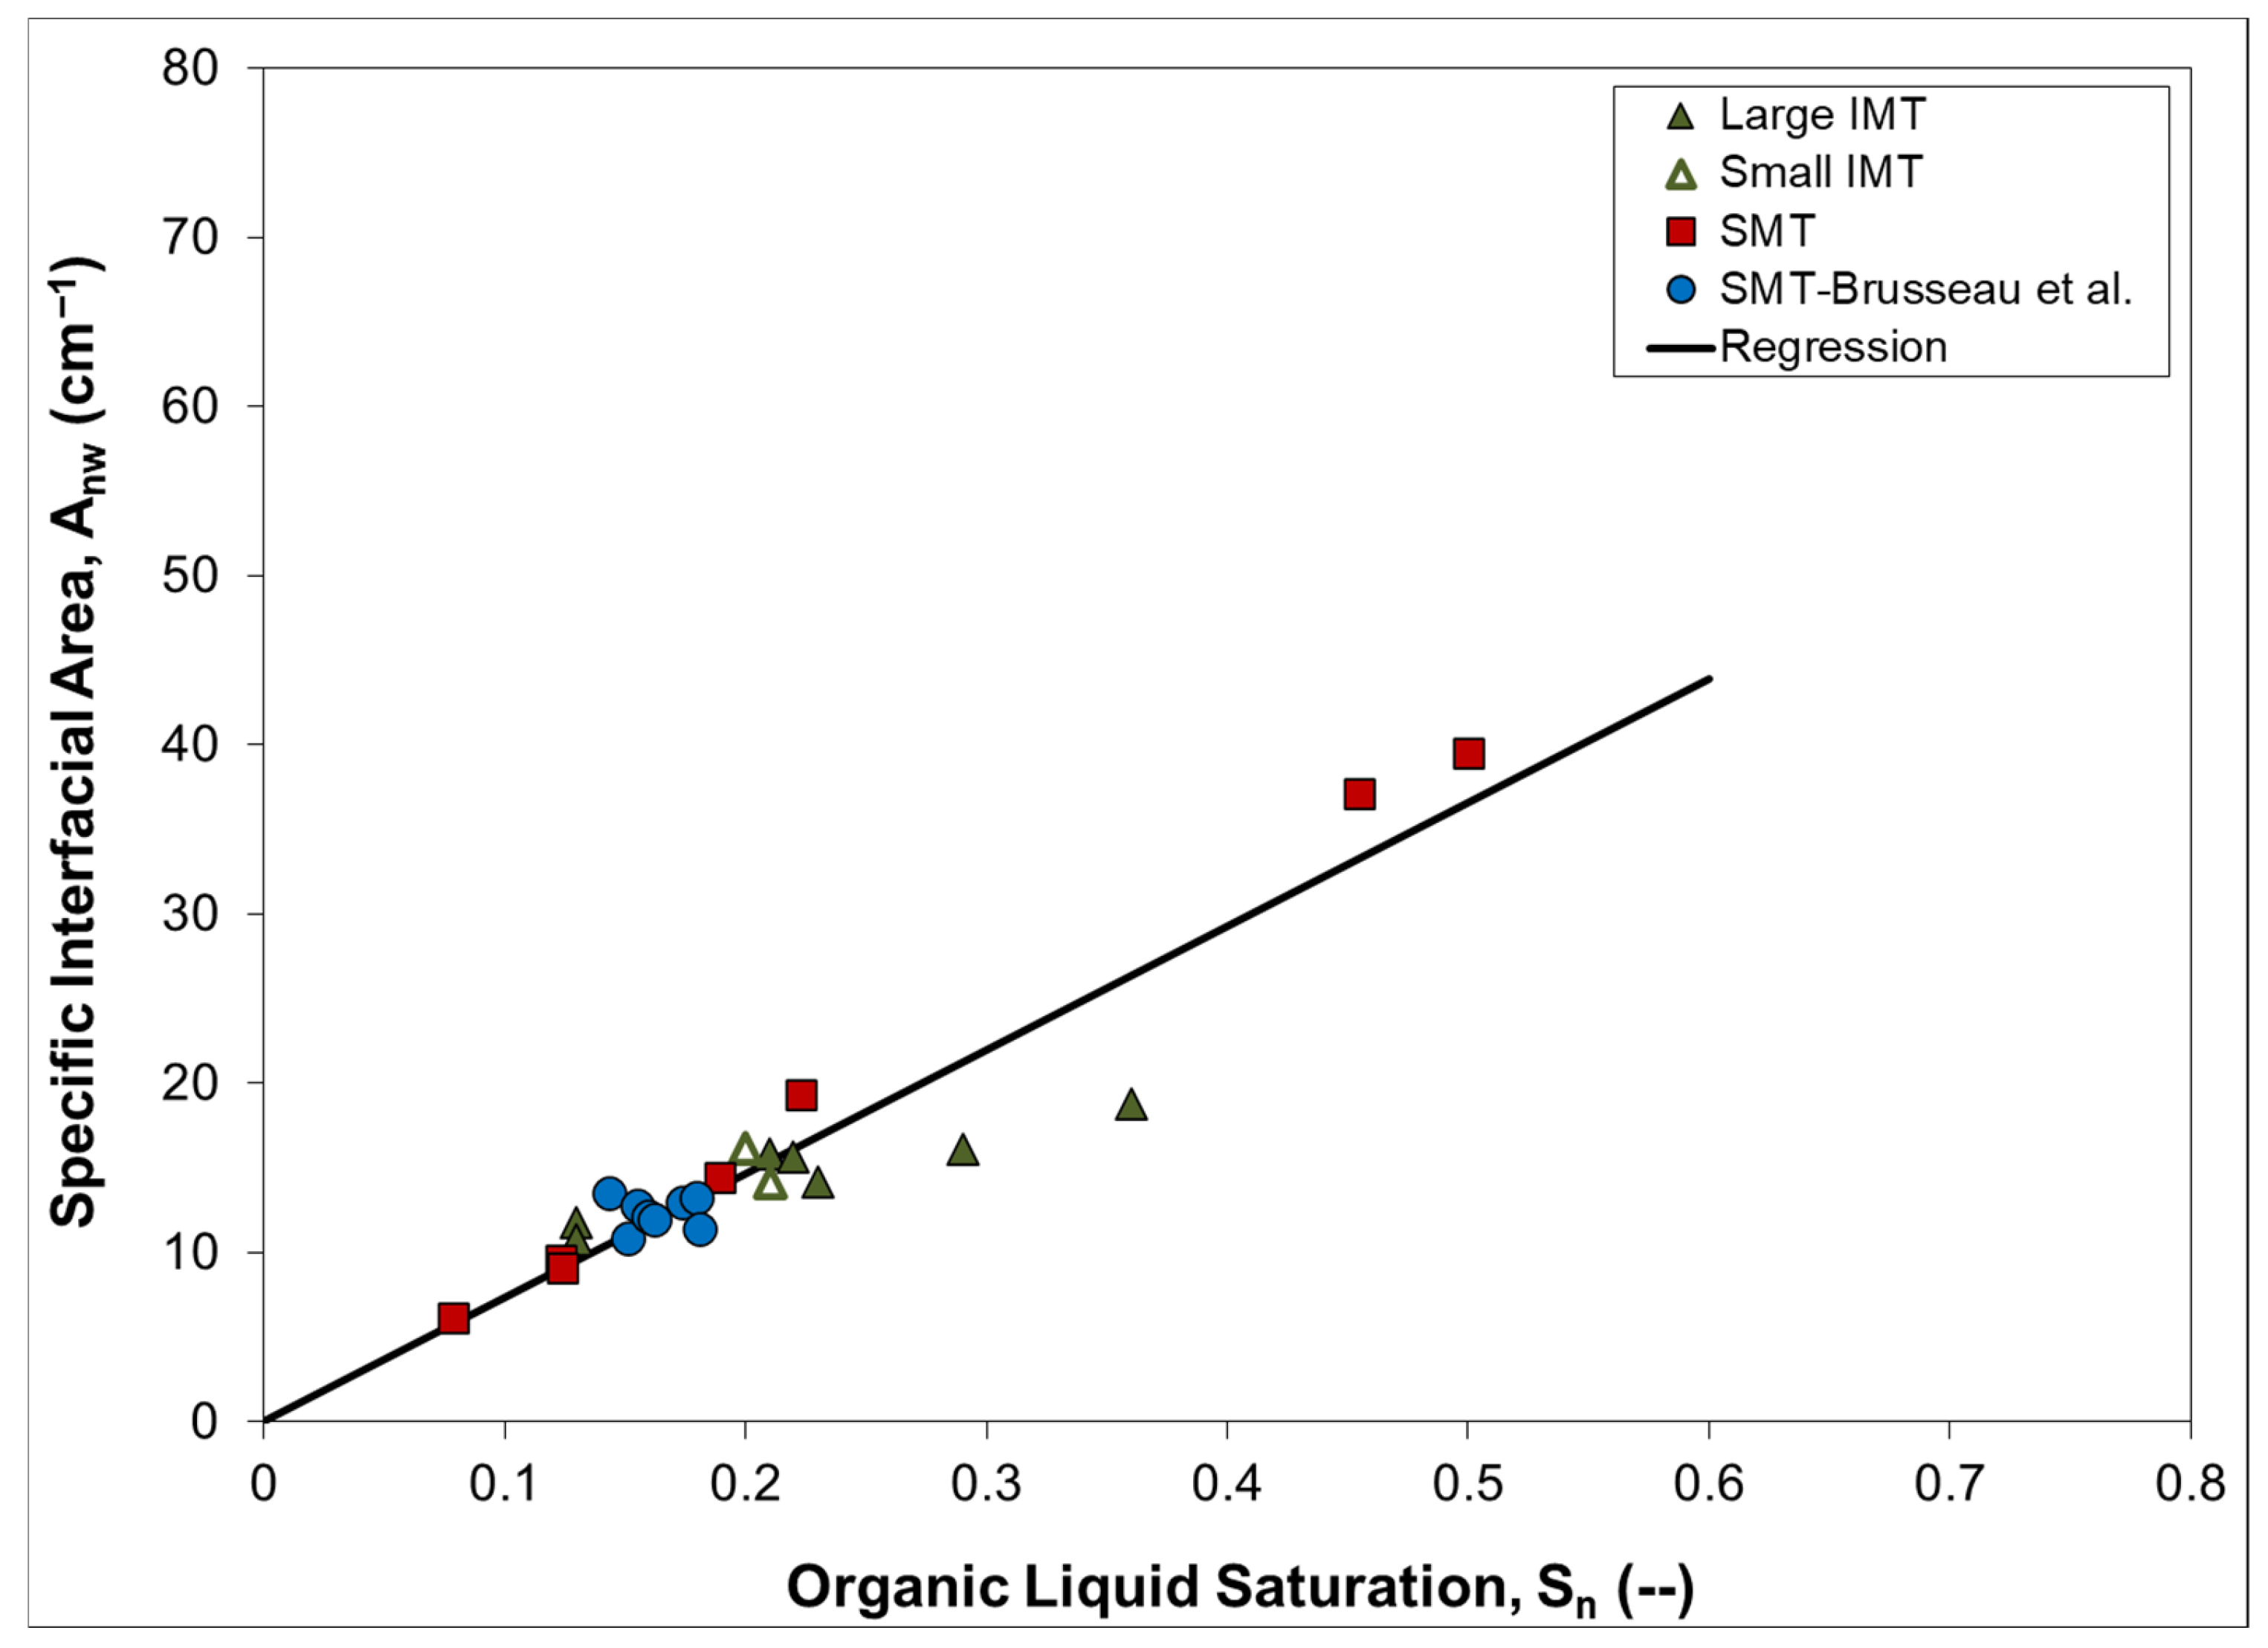
n values are presented in
Figure 2, combining all data sets, including those measured at higher S
n values. It is observed that the measurements for all systems are reasonably represented by a single regression function. The function has a root-mean square error (RMSE) of 2.5, a normalized RMSE (NRMSE) of 0.075, and a mean absolute percentage error (MAPE) of 10.7%. These statistical performance measures indicate that the measured interfacial areas are quite consistent both within each column type and across all types. The individual percentage errors for all regression-predicted values are within a factor of 2 or less of the MAPE, with two exceptions. The percentage errors for the two largest S
n-value (0.29 and 0.36) data points of the large IMT column exceed the MAPE by a factor of 3 or more. This larger deviation was not observed for the higher-S
n data of the small SMT columns. This may indicate greater imaging and/or image processing uncertainty at higher saturations of immiscible liquid for the large column. Additional investigation is needed to further evaluate this observation. Overall, these results suggest that the small imaged volumes associated with typical SMT columns used for characterization of fluid–fluid interfacial area are sufficient to establish REV conditions for this porous medium.
4. Conclusions
This work investigates the impact of imaged volume size on the measurement of NAPL-water interfacial areas in a sand by XMT. The bulk densities, porosities, and fluid saturations determined for the different systems were comparable. The mean interfacial areas measured for the large columns imaged by IMT for the low and moderate Sns were 11.3 cm−1 (Sn = 0.13) and 15.3 cm−1 (Sn = 0.22), respectively. The mean interfacial areas measured at the moderate Sn for the two small columns imaged by IMT (16.7 cm−1, Sn = 0.24) and imaged by SMT (16.9 cm−1, Sn = 0.21) are consistent with those of the larger column. In addition, the mean interfacial area measured at the lower Sn for the two small columns imaged by SMT (9.4 cm−1, Sn = 0.12) is consistent with that of the larger column. The statistical analyses demonstrated that the measurements obtained for the different column systems were generally consistent.
Overall, the results indicate that the REV requirements for quantification of the NAPL-water interfacial area are met for the employed porous medium with the small columns typically used for XMT characterization. Further investigation is needed to evaluate REV requirements for more heterogeneous porous media that consist of greater grain-size distributions. Additionally, research is needed in particular for media containing substantial amounts of silt- and clay-sized particles.
Author Contributions
M.L.B. conceptualized the study. All authors contributed to the study design. Material preparation and data collection were performed by J.B.A., K.M. and K.C.C. Data analysis was performed by J.B.A. and M.L.B. The first draft of the manuscript was written by J.B.A. and all authors commented on previous versions of the manuscript. All authors have read and agreed to the published version of the manuscript.
Funding
This research was supported by the NIEHS-Superfund Research Program (Grant P42 ES 04940).
Institutional Review Board Statement
Not applicable.
Informed Consent Statement
Not applicable.
Data Availability Statement
All processed data are provided in the tables and figures presented in the manuscript.
Acknowledgments
We thank the reviewers for their constructive comments, which have helped to improve the clarity of the work. We thank Mark Rivers (GSECars) for their assistance. Imaging data collected at the Environmental Molecular Sciences Laboratory, Pacific Northwest National Laboratory (EMSL), located at the Pacific Northwest National Laboratory (Proposal # 44728). Use of the Advanced Photon Source, an Office of Science User Facility operated for the U.S. Department of Energy (DOE) Office of Science by Argonne National Laboratory, was supported by the U.S. DOE under Contract No. DE-AC02-06CH11357. We acknowledge the support of GeoSoilEnviroCARS (Sector 13), which is supported by the National Science Foundation—Earth Sciences (EAR-1128799), and the Department of Energy, Geosciences (DE-FG02-94ER14466).
Conflicts of Interest
The authors declare no conflict of interest.
References
- Brusseau, M.L.; Araujo, J.B.; Narter, M.; Marble, J.C.; Bigler, M. Microtomographic Measurements of Total Air-Water Interfacial Areas for Soils. Water Resour. Res. 2024, 60, e2023WR036039. [Google Scholar] [CrossRef] [Scilit]
- Brusseau, M.L.; Narter, M.; Schnaar, G.; Araujo, J.B.; Marble, J.C. Fluid/Fluid interfacial areas measured for different non-wetting/wetting fluid pairs in natural porous media. Environments 2025, 12, 380. [Google Scholar] [CrossRef] [Scilit]
- Auzerais, F.M.; Dunsmuir, J.; Ferreol, B.B.; Martys, N.; Olson, J.; Ramakrishnan, T.S.; Rothman, D.H.; Schwartz, L.M. Transport in sandstone: A study based on three dimensional microtomography. Geophys. Res. Lett. 1996, 23, 705–708. [Google Scholar] [CrossRef] [Scilit]
- Razavi, M.R.; Muhunthan, B.; Al Hattamleh, O. Representative elementary volume analysis of sands using X-ray computed tomography. Geotech. Test. J. 2007, 30, 212–219. [Google Scholar] [CrossRef] [Scilit]
- Porter, M.L.; Wildenschild, D. Image analysis algorithms for estimating porous media multiphase flow variables from computed microtomography data: A validation study. Comput. Geosci. 2010, 14, 15–30. [Google Scholar] [CrossRef] [Scilit]
- Costanza-Robinson, M.S.; Estabrook, B.D.; Fouhey, D.F. Representative elementary volume estimation for porosity, moisture saturation, and air-water interfacial areas in unsaturated porous media: Data quality implications. Water Resour. Res. 2011, 47, W07513. [Google Scholar] [CrossRef] [Scilit]
- Ozelim, L.C.D.M.; Cavalcante, A.L.B. Representative Elementary Volume Determination for Permeability and Porosity Using Numerical Three-Dimensional Experiments in Microtomography Data. Int. J. Geomech. 2018, 18, 04017154. [Google Scholar] [CrossRef] [Scilit]
- Wang, J.P.; Lambert, P.; De Kock, T.; Cnudde, V.; Bertrand, F. Investigation of the effect of specific interfacial area on strength of unsaturated granular materials by X-ray tomography. Acta Geotech. 2019, 14, 1545–1559. [Google Scholar] [CrossRef] [Scilit]
- Huang, R.; Herring, A.L.; Sheppard, A. Effect of Saturation and Image Resolution on Representative Elementary Volume and Topological Quantification: An Experimental Study on Bentheimer Sandstone Using Micro-CT. Transp. Porous Media 2021, 137, 489–518. [Google Scholar] [CrossRef] [Scilit]
- Borges, J.A.R.; Pires, L.F.; Cássaro, F.A.M.; Roque, W.L.; Heck, R.J.; Rosa, J.A.; Wolf, F.G. X-ray microtomography analysis of representative elementary volume (REV) of soil morphological and geometrical properties. Soil Tillage Res. 2018, 182, 112–122. [Google Scholar] [CrossRef] [Scilit]
- Brusseau, M.L.; Janousek, H.; Murao, A.; Schnaar, G. Synchrotron X-ray microtomography and interfacial partitioning tracer test measurements of NAPL-water interfacial areas. Water Resour. Res. 2008, 44, W01411. [Google Scholar] [CrossRef] [Scilit] [PubMed]
- Karpyn, Z.T.; Piri, M.; Singh, G. Experimental investigation of trapped oil clusters in a water-wet bead pack using X-ray microtomography. Water Resour. Res. 2010, 46, W04510. [Google Scholar] [CrossRef] [Scilit]
- Ghosh, J.; Tick, G.R. A pore scale investigation of crude oil distribution and removal from homogeneous porous media during surfactant-induced remediation. J. Contam. Hydrol. 2013, 155, 20–30. [Google Scholar] [CrossRef] [Scilit]
- Carroll, K.C.; McDonald, K.; Marble, J.; Russo, A.E.; Brusseau, M.L. The impact of transitions between two-fluid and three-fluidphases on fluid configuration and fluid-fluid interfacial areain porous media. Water Resour. Res. 2015, 51, 7189. [Google Scholar] [CrossRef] [Scilit] [PubMed]
- McDonald, K.; Carroll, K.C.; Brusseau, M.L. Comparison of fluid-fluid interfacial areas measured with X-ray microtomography and interfacial partitioning tracer tests for the same samples. Water Resour. Res. 2016, 52, 5393–5399. [Google Scholar] [CrossRef] [Scilit]
- Culligan, K.A.; Wildenschild, D.; Christensen, B.S.B.; Gray, W.G.; Rivers, M.L.; Tompson, A.F.B. Interfacial area measurements for unsaturated flow through a porous medium. Water Resour. Res. 2004, 40, W12413. [Google Scholar] [CrossRef] [Scilit]
- Mukunoki, T.; Miyata, Y.; Mikami, K.; Shiota, E. X-ray CT anaysis of pore structure in sand. Solid Earth 2016, 7, 929–942. [Google Scholar] [CrossRef] [Scilit]
- Schnaar, G.; Brusseau, M.L. Characterizing pore-scale dissolution of organic immiscible liquid in natural porous media using synchrotron X-ray microtomography. Environ. Sci. Technol. 2006, 40, 6622–6629. [Google Scholar] [CrossRef] [Scilit]
- Rivers, M.L. tomoRecon: High-speed tomography reconstruction on workstations using multi-threading. Proc. SPIE 2012, 8506, 169–181. [Google Scholar]
- Rivers, M.L.; Citron, D.T.; Wang, Y.B. Recent developments in computed tomography at GSECARS. Dev. X-Ray Tomogr. 2010, VII, 7804. [Google Scholar]
- Ketcham, R.A.; Meth, C.; Hirsch, D.M.; Carlson, W.D. Improved methods for quantitative analysis of three-dimensional porphyroblastic textures. Geosphere 2005, 1, 42–59. [Google Scholar] [CrossRef] [Scilit]
- Schnaar, G.; Brusseau, M.L. Pore-scale characterization of organic immiscible-liquid morphology in natural porous media using synchrotron X-ray microtomography. Environ. Sci. Technol. 2005, 39, 8403–8410. [Google Scholar] [CrossRef] [Scilit]
| Disclaimer/Publisher’s Note: The statements, opinions and data contained in all publications are solely those of the individual author(s) and contributor(s) and not of MDPI and/or the editor(s). MDPI and/or the editor(s) disclaim responsibility for any injury to people or property resulting from any ideas, methods, instructions or products referred to in the content. |