


Abstract
Starch nanocrystals (SNCs) to stabilize high internal phase emulsions (HIPEs) always suffer low production efficiency from acid hydrolysis. Due to its small granule size, Quinoa starch (QS) was selected to produce SNCs as a function of acid hydrolysis time (0–4 days), and their structural changes and potential application as HIPEs’ stabilizers were further explored. With increasing the acid hydrolysis time from 1 day to 4 days, the yield of QS nanocrystals decreased from 30.4% to 10.8%, with the corresponding degree of hydrolysis increasing from 51.2% to 87.8%. The occurrence of QS nanocrystals was evidenced from the Tyndall effect and scanning electron microscopy with particle size distribution. The relative crystallinity of QS subjected to different hydrolysis times (0–4 days) increased from 22.27% to 26.18%. When the acid hydrolysis time of QS was 3 and 4 days, their HIPEs showed self-standing after inversion, known as high internal phase emulsion gels (HIPE gels), closely related to their densely packed interfacial architecture around oil droplets, seen on an optical microscope, and relatively high apparent viscosity. This study could provide a theoretical guidance for the efficient production and novel emulsification of SNCs from QS to HIPE gels.
1. Introduction
High internal phase emulsions (HIPEs), known as high-concentration emulsions or gel-like emulsions, have internal phase volume fractions exceeding the close-packing limit (~74%), which leads to semi-solid characteristics and high loading capacities for hydrophobic bioactive compounds [1]. They have been explored as substitutes for mayonnaise [2] and inks for 3D food printers [3]. Notedly, high internal phase Pickering emulsions (HIPPEs) stabilized by solid particles (including nano and microparticles) instead of conventional surfactants showed many more advantages including requiring lower amounts of stabilizer, higher stability against coalescence, higher storage stability, and less environmental pollution as compared to HIPEs [4], thus attracting increased research attention. Natural solid particles used in HIPPEs absorb irreversibly at the interface and form rigid protective layers around droplets and produce characteristically stable emulsions [5]. Food-grade HIPPEs produced using particles derived from polysaccharides have been used for specific applications in food, medical, material, and cosmetic products due to their unique properties [6].
As biodegradable and inexpensive natural biopolymers, starch granules are becoming a promising particle stabilizer for HIPEs after modification. Among starch modifications, acid hydrolysis of native starch to obtain starch nanocrystals (SNCs) is an efficient method used in the industry for chemical modification of starch particles [7]. Platelet-like SNCs with a size of 40–100 nm prepared by sulfuric acid hydrolysis of waxy maize starch could form stable O/W emulsions of 50% (v/v) paraffin liquid [8]. They have further been used to stabilize stable and gel-like HIPEs at a concentration of 1.0% (w/w) and internal phase of 75–85% (v/v) soy oil [9]. However, the low yield and time-consuming preparation of SNCs has limited their applications in Pickering stabilizers for emulsions and fillers for reinforcing natural rubber or biodegradable films [10]. Dufresne, Cavaille and Helbert [11] reported that SNCs could be obtained from hydrolyzing potato starch (5%, w/w) in a 2.2 M HCl suspension at 35 °C for 15 days. SNCs could also be prepared from hydrolyzing waxy maize starch (10%, w/w) with 3.16 M H2SO4 at 40 °C for 6 days [8]. The structure and properties of SNCs were affected by the starch source, acid type, concentration, and hydrolysis parameters (temperature and time) [7]. Among numerous starch sources, Quinoa starch (QS) showed a novel potential for SNCs’ production with a higher yield and shorter time due to its small granule size (0.5–3 μm) and low amylose content (7–26%), which could facilitate the acid hydrolysis reaction. Velásquez-Castillo, Leite, Ditchfield, do Amaral Sobral and Moraes [12] investigated different acid hydrolysis temperatures (30, 35 and 40 °C) on the kinetics and physicochemical properties of nanocrystal production and found that QS nanocrystals produced at 35 and 40 °C could be used as reinforcements in nanocomposite materials or as colloidal stabilizing agents.
Although some attempts have been made to obtain QS nanocrystals by acid hydrolysis, detailed investigations on the effect of hydrolysis time on the production efficiency combined with structural changes in QS and their potential in the application of HIPEs have not been conducted, and even fewer have been presented on high internal phase emulsion gels (HIPE gels). Hence, the present work aims to study the production efficiency (yield and degree of hydrolysis) and structural characteristics (particle morphology with size distribution, FT-IR and XRD pattern) of QS nanocrystals from acid hydrolysis as a function of hydrolysis time (0–4 days referred to as QS, QS-1, QS-2, QS-3 and QS-4, respectively). Subsequently, their potential as HIPEs’ stabilizers was investigated from aspects of the emulsions’ appearance, morphology and apparent viscosity, and their possible mechanism for HIPE gels stabilized by QS nanocrystals was further elucidated. This study could provide a theoretical guidance for the efficient production and novel emulsification of QS nanocrystals for HIPE gel applications.
2. Results and Discussion
2.1. Yield and Degree of Hydrolysis (DH)
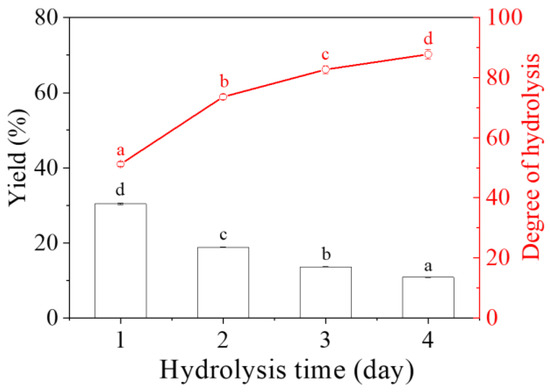
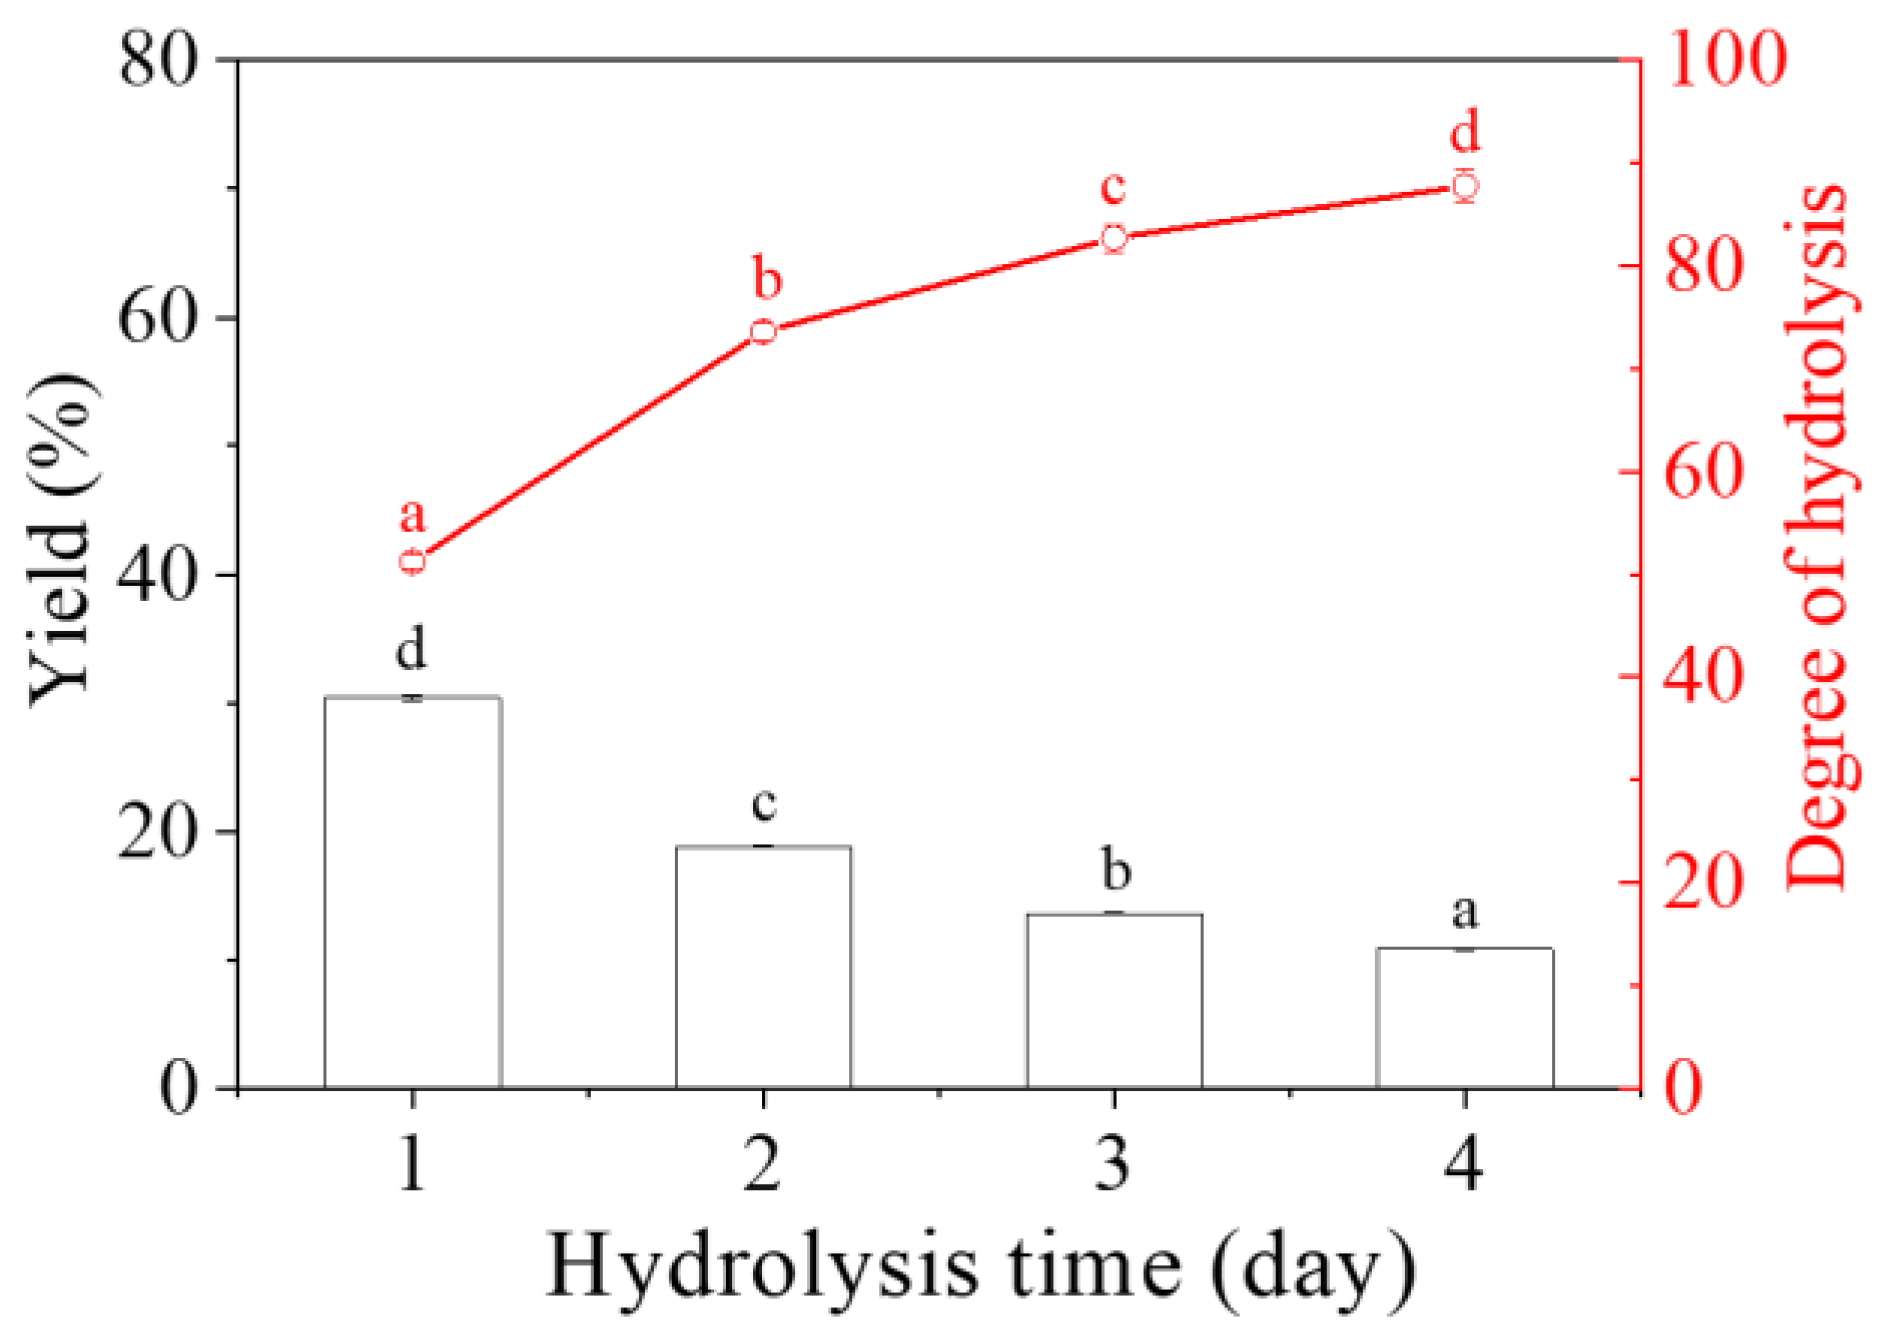
Figure 1 shows the yield of QS nanocrystals and DH of QS as a function of hydrolysis time (1–4 days). As the hydrolysis time increased from 1 day to 4 days, the yield of QS nanocrystals decreased significantly from 30.4% to 10.8% (p < 0.05), which was most certainly a result of the significantly increasing DH from 51.2% to 87.8% (Table S1). Similarly, Velásquez-Castillo, Leite, Ditchfield, do Amaral Sobral and Moraes [12] also found that the yield of QS nanocrystals was 6.8% with a DH of 91.0% at 40 °C on day 5, despite slight differences in acid hydrolysis parameters, mainly including reaction temperature and time. This result was different from that of nanocrystals from other starch sources (normal maize, 14.1%; potato, 8.8%; and tapioca, 15.1%) [13], which should be closely related to the molecular structure of starch. Fast (amylose chains with DP > ~300 and amylopectin long intra-cluster branches) versus slow (amylose chains with DP < ~300) distinct kinetics phases existed for maize, sago and high amylose maize starch during the hydrolysis process, while only a single first-order kinetics phase was involved for that of waxy maize starch [14].
Figure 1.
Yield of QS nanocrystals and DH of QS as a function of hydrolysis time (1–4 days). Different superscript letters (a–d) were used to represent statistical significance among different samples (p < 0.05).
2.2. Tyndall Effect
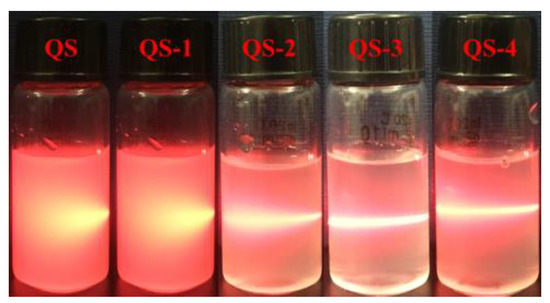
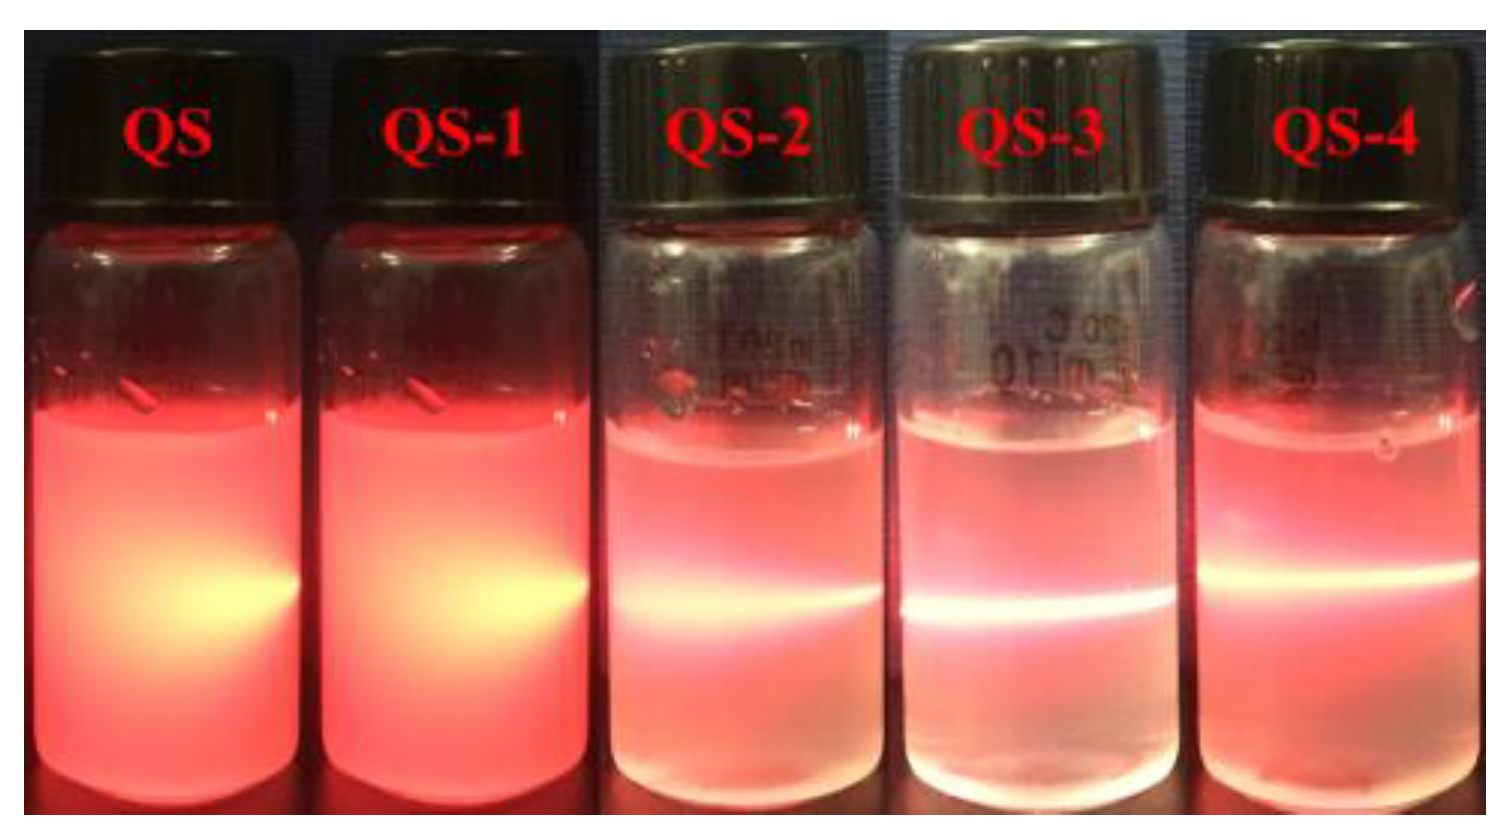
Figure 2 exhibits the Tyndall effect of QS as a function of hydrolysis time (0–4 days). For QS and QS-1, the micro-sized starch particles substantially prevented the laser beam from going through the suspension, resulting in a short light path with a conical beam. With an increase in acid hydrolysis time from 2 days, apparent Tyndall light scattering with a brighter and longer light optical path was observed (Figure 2-Q2), implying the presence of nano-sized starch particles. This phenomenon was also observed for waxy maize SNCs with ultrasonic-assisted production [15] and tapioca starch suspensions induced from wet-media milling [16], which is closely related to their nanoparticle size distribution and cluster size of aggregated nanoparticles [17].
Figure 2.
Tyndall effect of QS as a function of hydrolysis time (0–4 days).
2.3. Particle Morphology
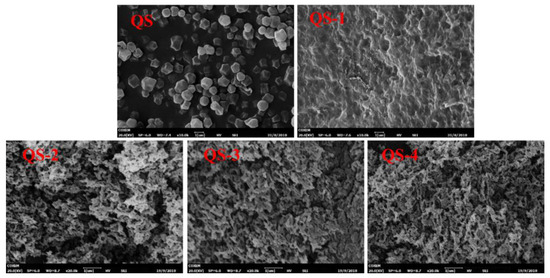
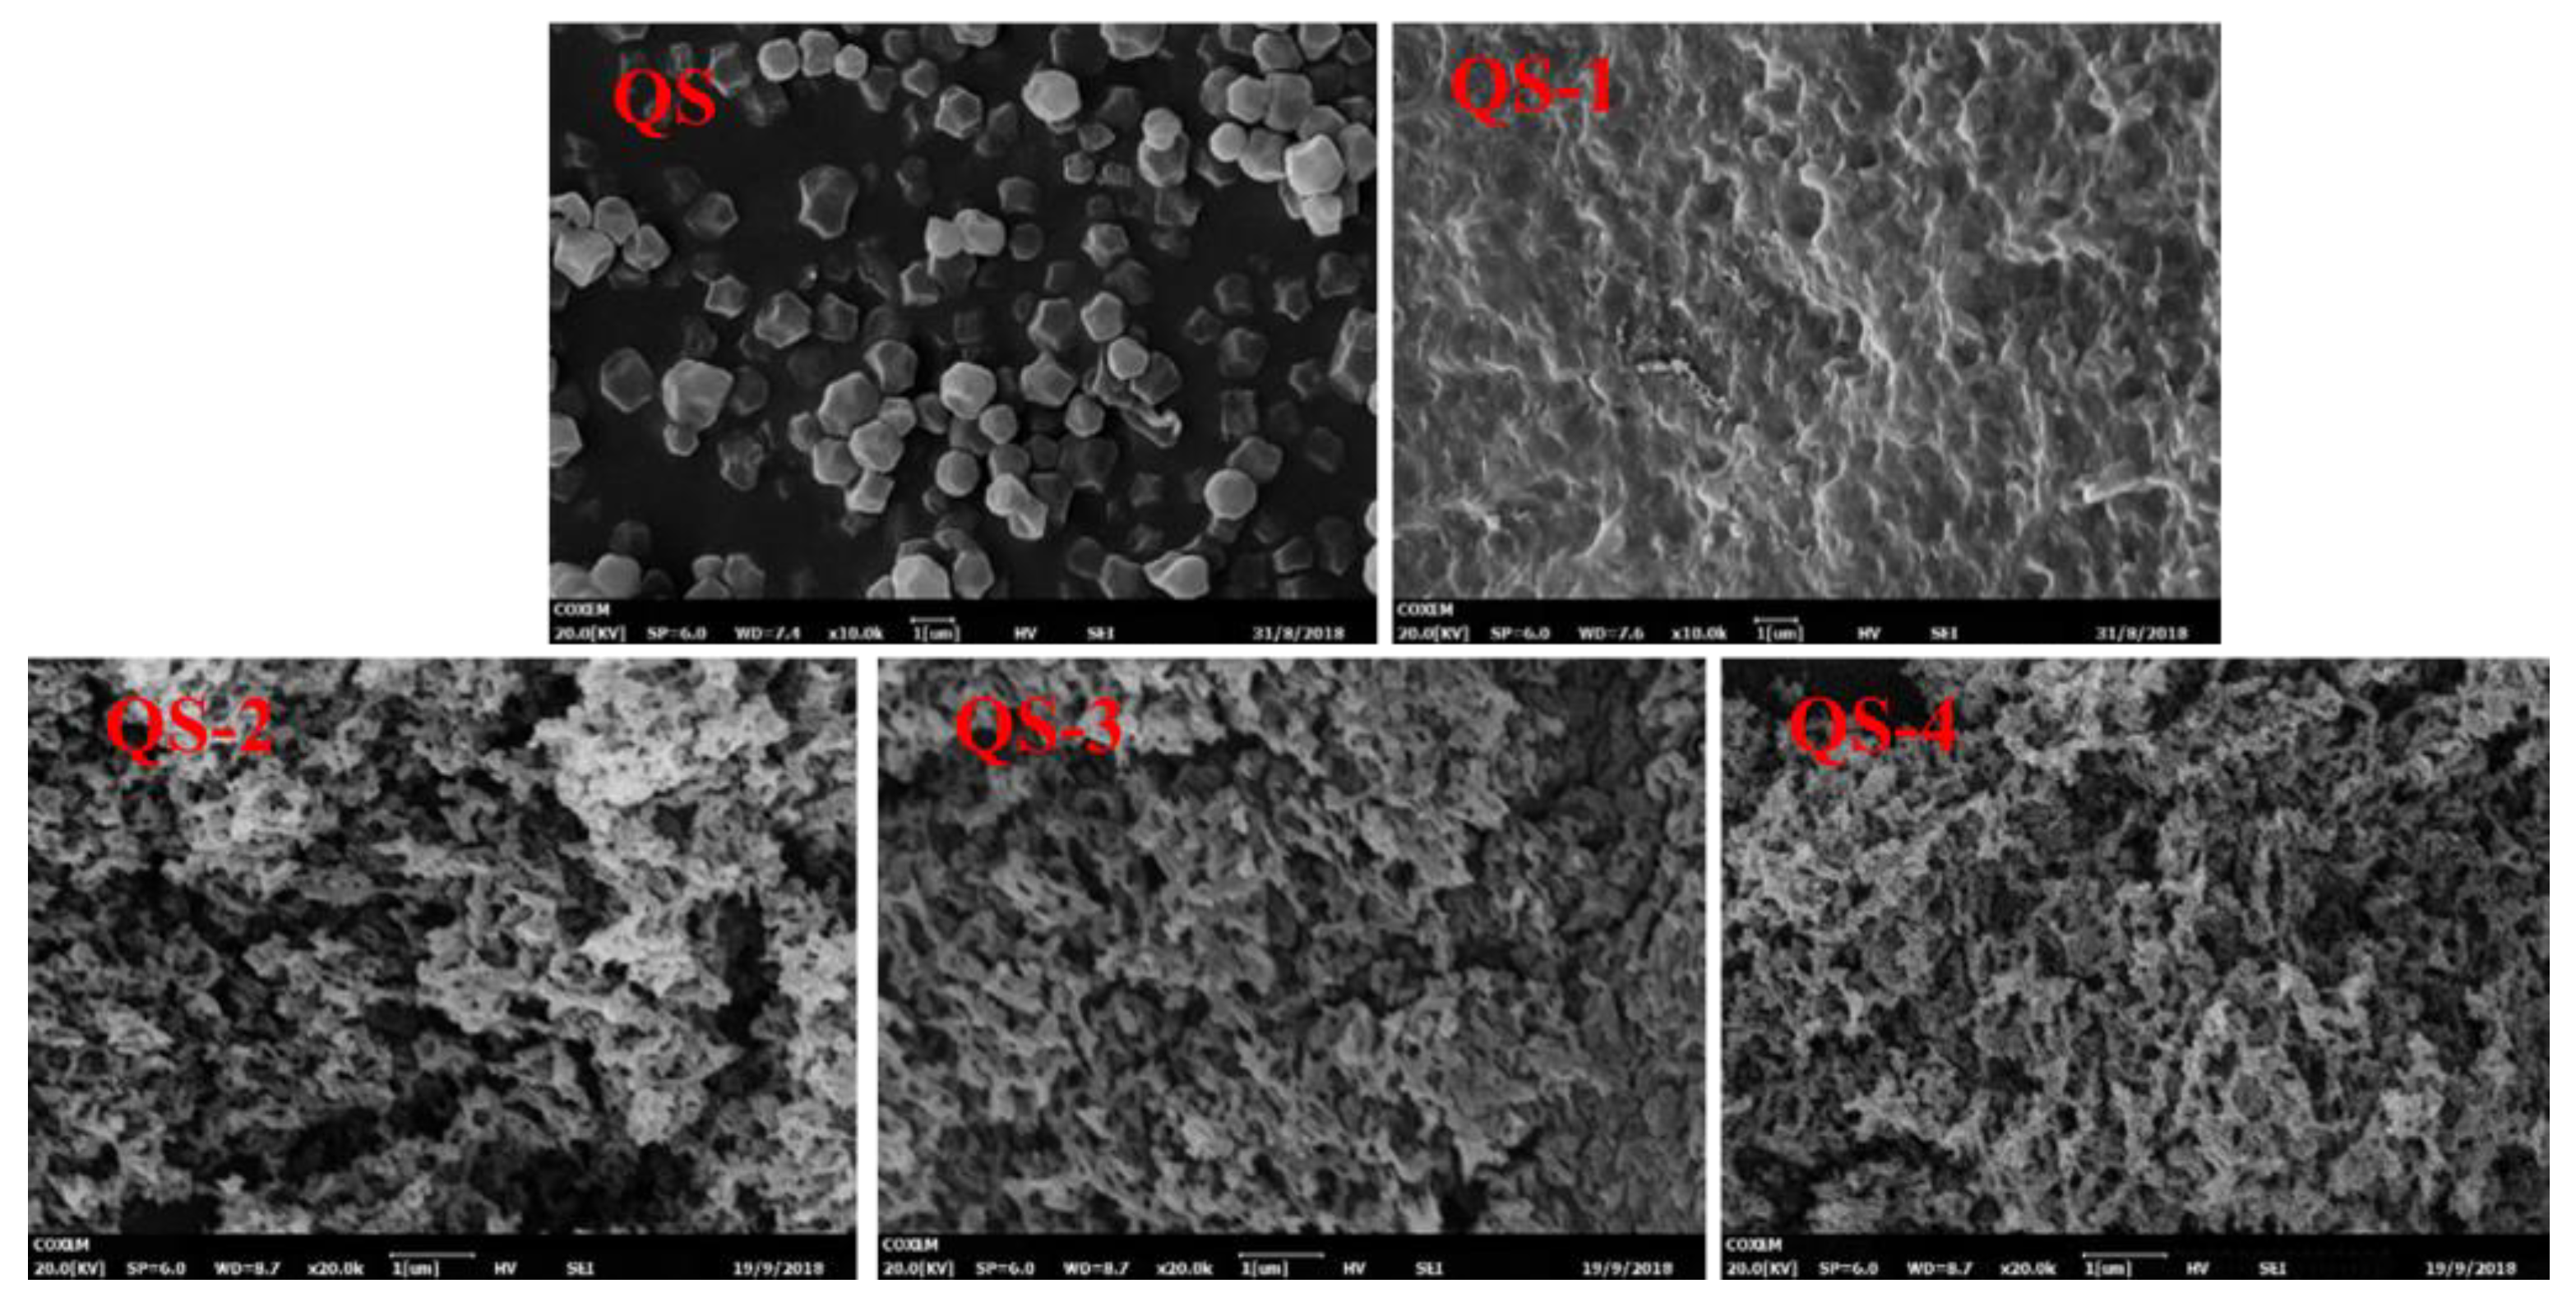
Figure 3 presents the SEM images of QS as a function of hydrolysis time (0–4 days). Native QS granules showed polygonal and irregular shapes, consistent with the previous study [18]. After 1 day of acid hydrolysis, the particle size of QS-1 became smaller with a serious aggregated surface as compared to that of QS. Notedly, more nano-sized particles with enormous pores were observed for QS-2, QS-3 and QS-4, resulting from the difference in DH. As reported previously, a low degree of hydrolysis did not significantly alter the granular morphology of starch with a roughened outer surface, extensive hydrolysis resulted in damage to the internal part of starch granules, and more extensive hydrolysis led to the destruction of starch granules into platelet nanocrystals [7]. The particle morphology of SNCs varied with starch sources (different in shape, size, surface features and more fine structures) and degree of acid hydrolysis [19].
Figure 3.
SEM images of QS as a function of hydrolysis time (0–4 days).
2.4. Particle Size Distribution
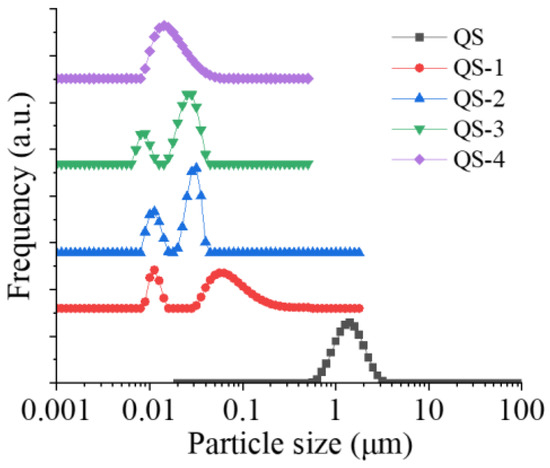
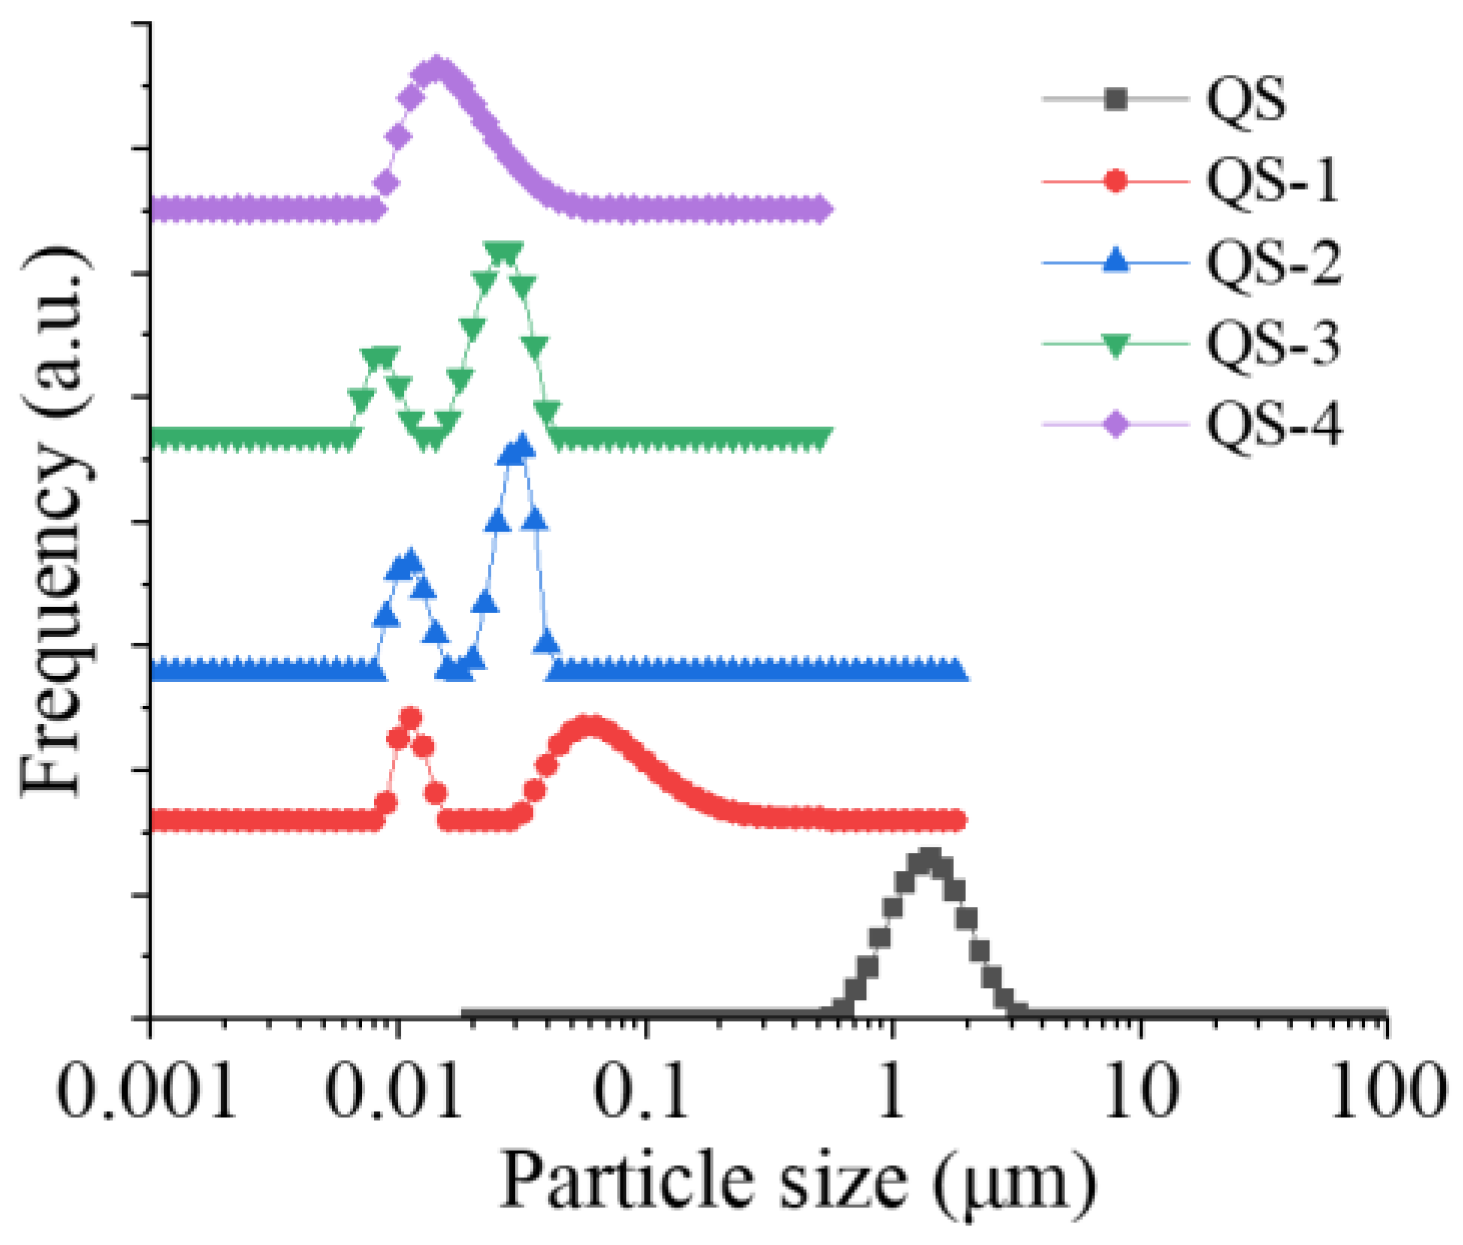
Figure 4 presents the particle size distribution of QS as a function of hydrolysis time (0–4 days). There was only one unimodal peak around 1.5 μm for the particle size distribution of QS, similar to the previous study [20]. With the hydrolysis time increasing from 1 day to 3 days, both the main peak around 100 nm and a new peak around 20 nm shifted progressively in the direction of lower particle size, indicating the occurrence of acid hydrolysis [12]. As the hydrolysis time further increased to day 4, only one peak around 20 nm was observed, which may be due to the mostly completed acid hydrolysis, as evidenced by the data of DH. Similarly, a bimodal size distribution around ~100 nm and ~400–900 nm was also reported for QS nanocrystals produced at 35 and 40 °C [12]. The smaller size of QS nanocrystals in comparison to other SNCs from different sources and acid hydrolysis parameters could impart desirable and beneficial properties in nanocomposites.
Figure 4.
Particle size distribution of QS as a function of hydrolysis time (0–4 days).
2.5. Fourier Transform Infrared (FT-IR) Pattern
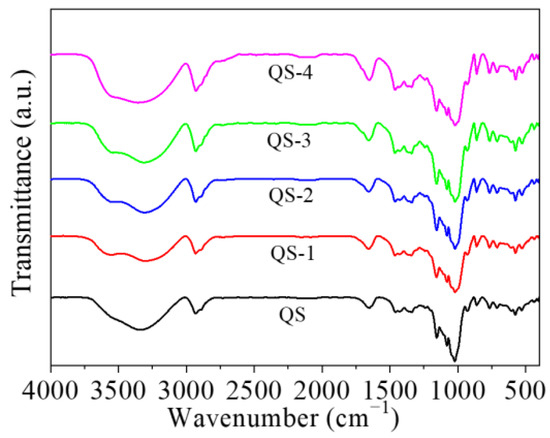
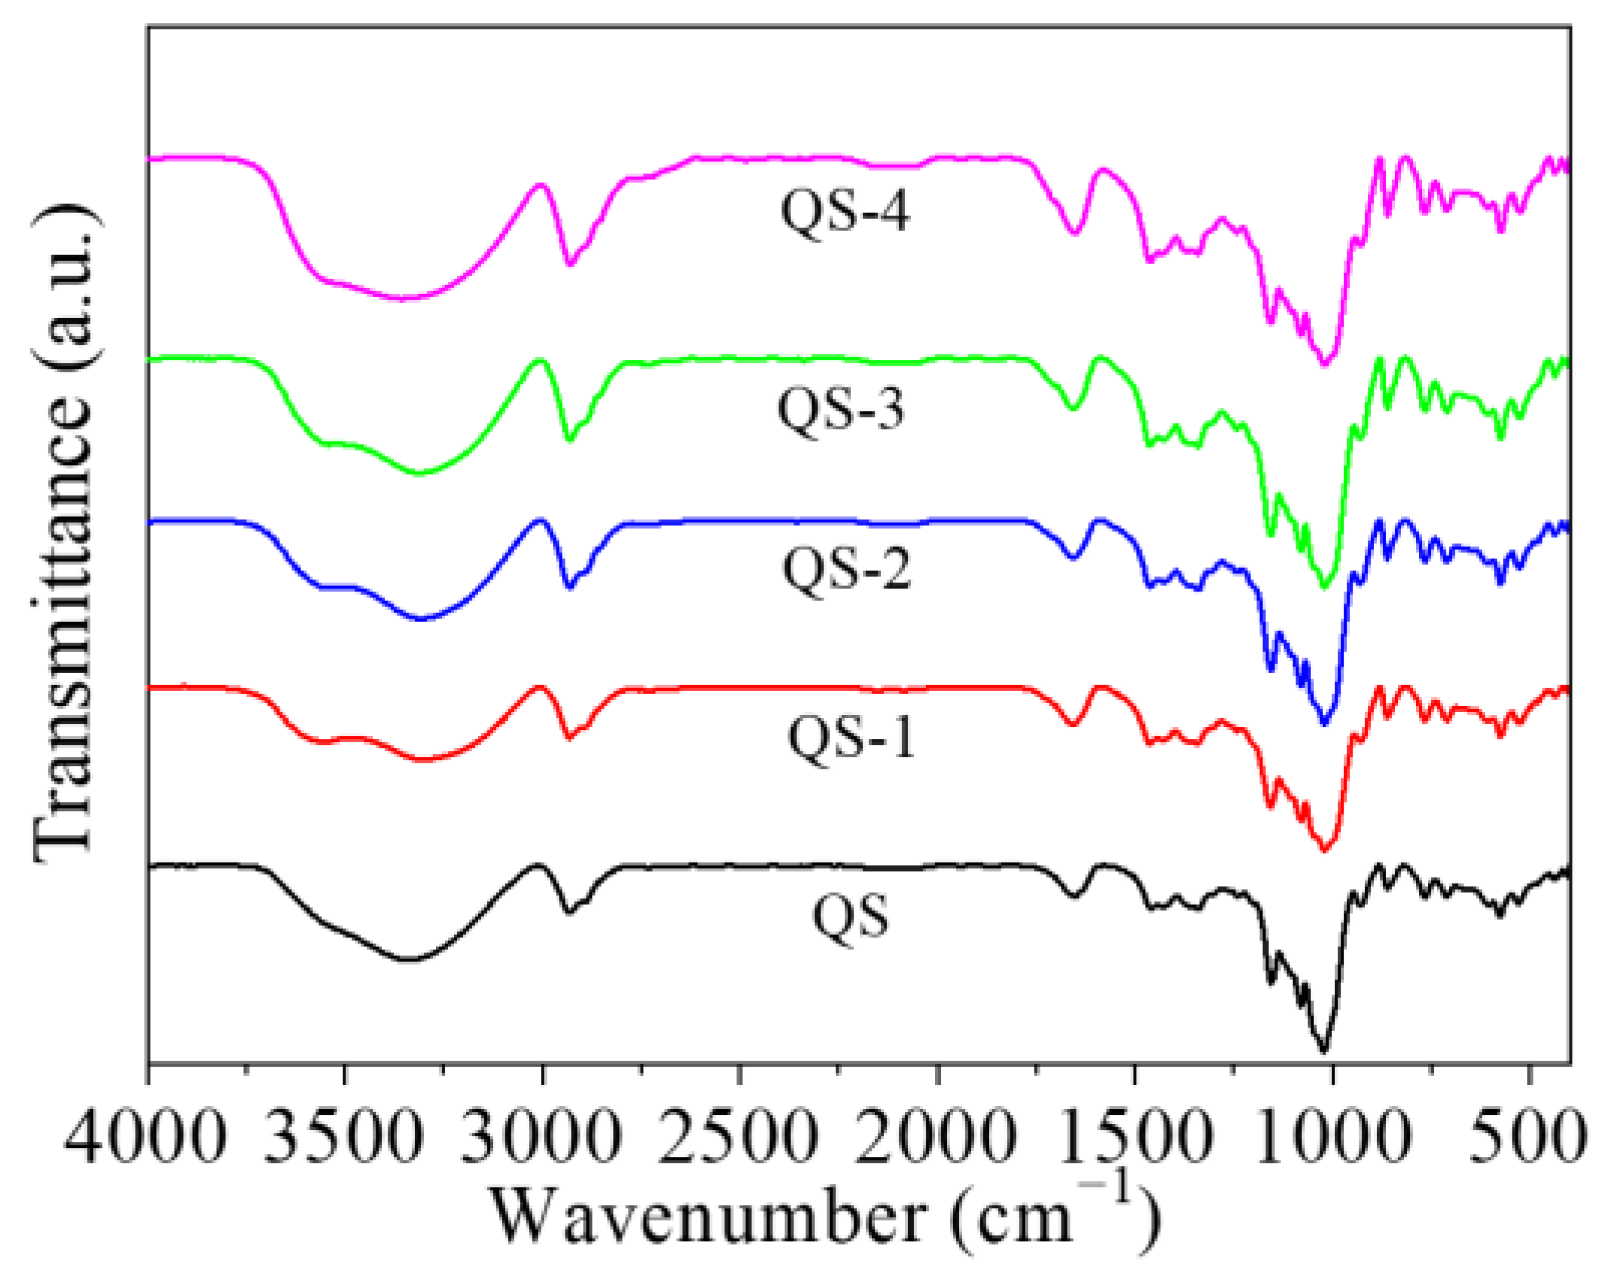
Figure 5 presents the FT-IR pattern of QS as a function of hydrolysis time (0–4 days). Regardless of hydrolysis time, QS nanocrystals showed similar QS FT-IR characteristics, implying the main functional groups of QS remained during the hydrolysis process. Similar results were also reported for nanocrystals acid-hydrolyzed from waxy maize starch [21] and acorn starch [22]. Notably, an increase in intensity in the bands from 3600–3650 cm−1 to 3500–3600 cm−1 with an increasing hydrolysis time (0–4 days) was observed, which could be ascribed to the hydrolysis-induced changes in the hydrogen bonds of starch molecules [23]. During acid hydrolysis, starch macromolecules broke into small fragments with the breakage of α-1,4 and α-1,6 glycosidic bonds, resulting in enhanced -OH groups [24]. The variation in the region ~900 cm−1 could be associated with the disappearance of an amorphous fraction and the presence of more ordered structures [12].
Figure 5.
FT-IR pattern of QS as a function of hydrolysis time (0–4 days).
2.6. X-ray Diffraction (XRD) Pattern
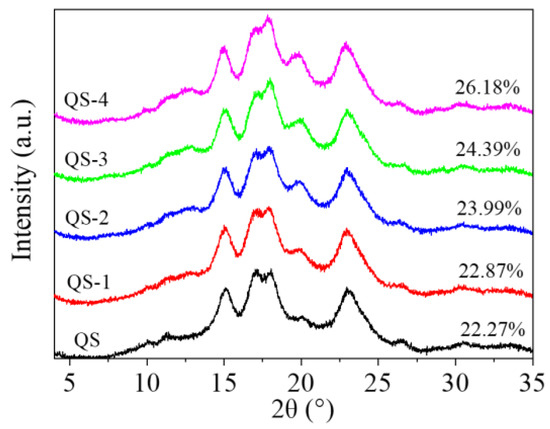
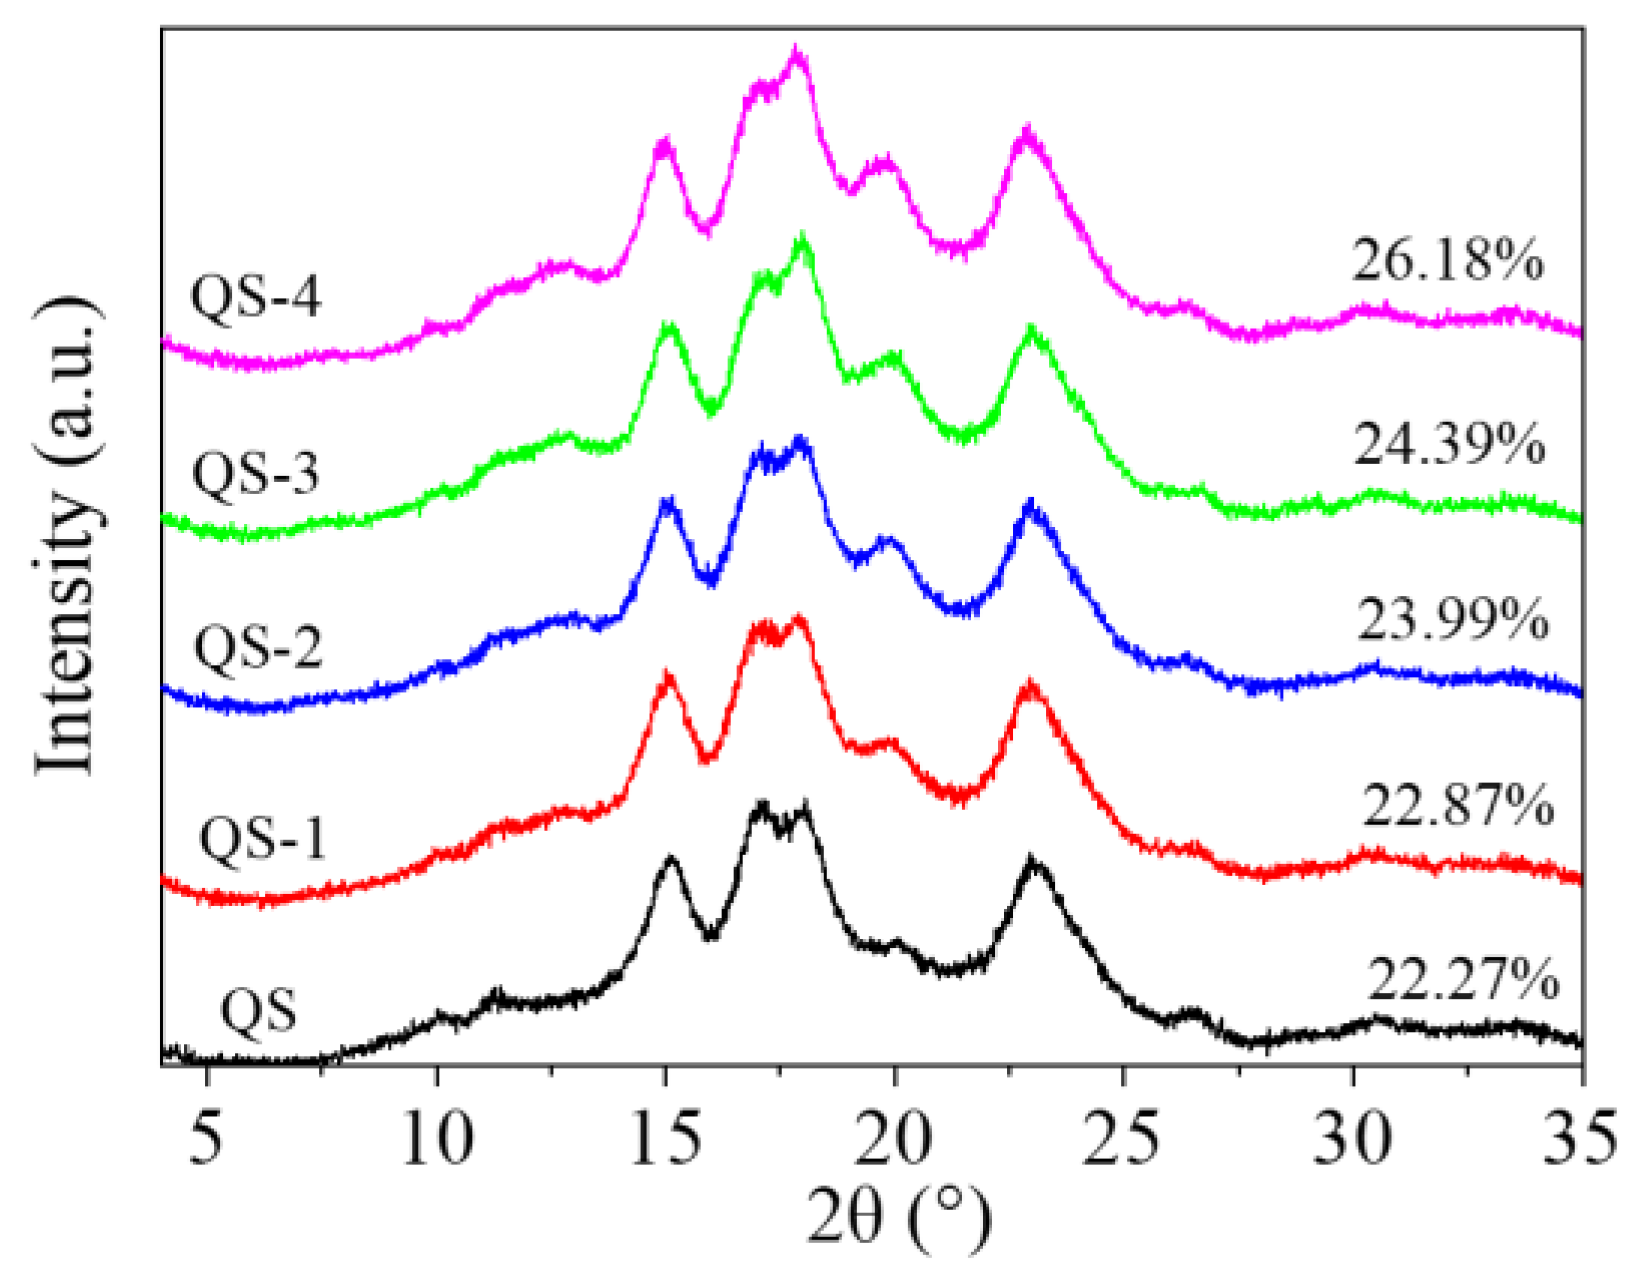
Figure 6 exhibits the XRD pattern of QS as a function of hydrolysis time (0–4 days). Native QS and QS nanocrystals had an A-type crystalline pattern at ~17°, 18° and 23°. The relative crystallinity of QS subjected to hydrolysis times (0–4 days) increased from 22.27% to 26.18% with an unchanged A-type crystalline pattern. Generally, acid hydrolysis could increase the relative crystallinity of starch granules but it did not change the crystalline polymorphs of A- and B-type starch, although it did change the transition of XRD patterns from A to C or A to B for barley and tapioca starches after acid hydrolysis [7]. During acid hydrolysis of starch, the amorphous region was preferentially damaged due to the water absorption [7], leaving a dense packing of starch chains, responsible for their increased relative crystallinity. Additionally, QS-4 showed a lower relative crystallinity (26.18%) as compared to that of maize starch (~50%) after 10 days of acid hydrolysis [25], which could be due to the difference in the chain length distribution of amylopectin [24]. Regardless of acid hydrolysis parameters, it was too short to rearrange the double helix structure for a high ratio of short-to-long chains and a high percentage of A-chains in the crystalline regions of starch granules [26].
Figure 6.
XRD pattern of QS as a function of hydrolysis time (0–4 days).
2.7. HIPE Appearance
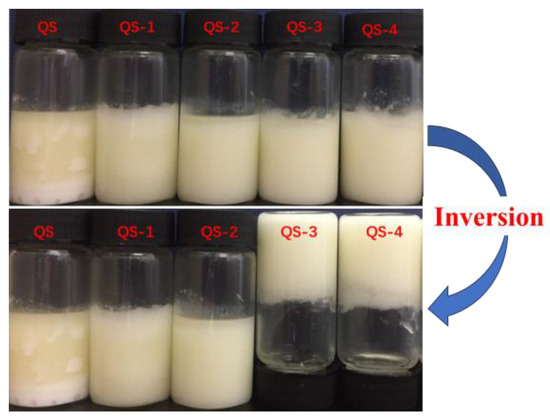
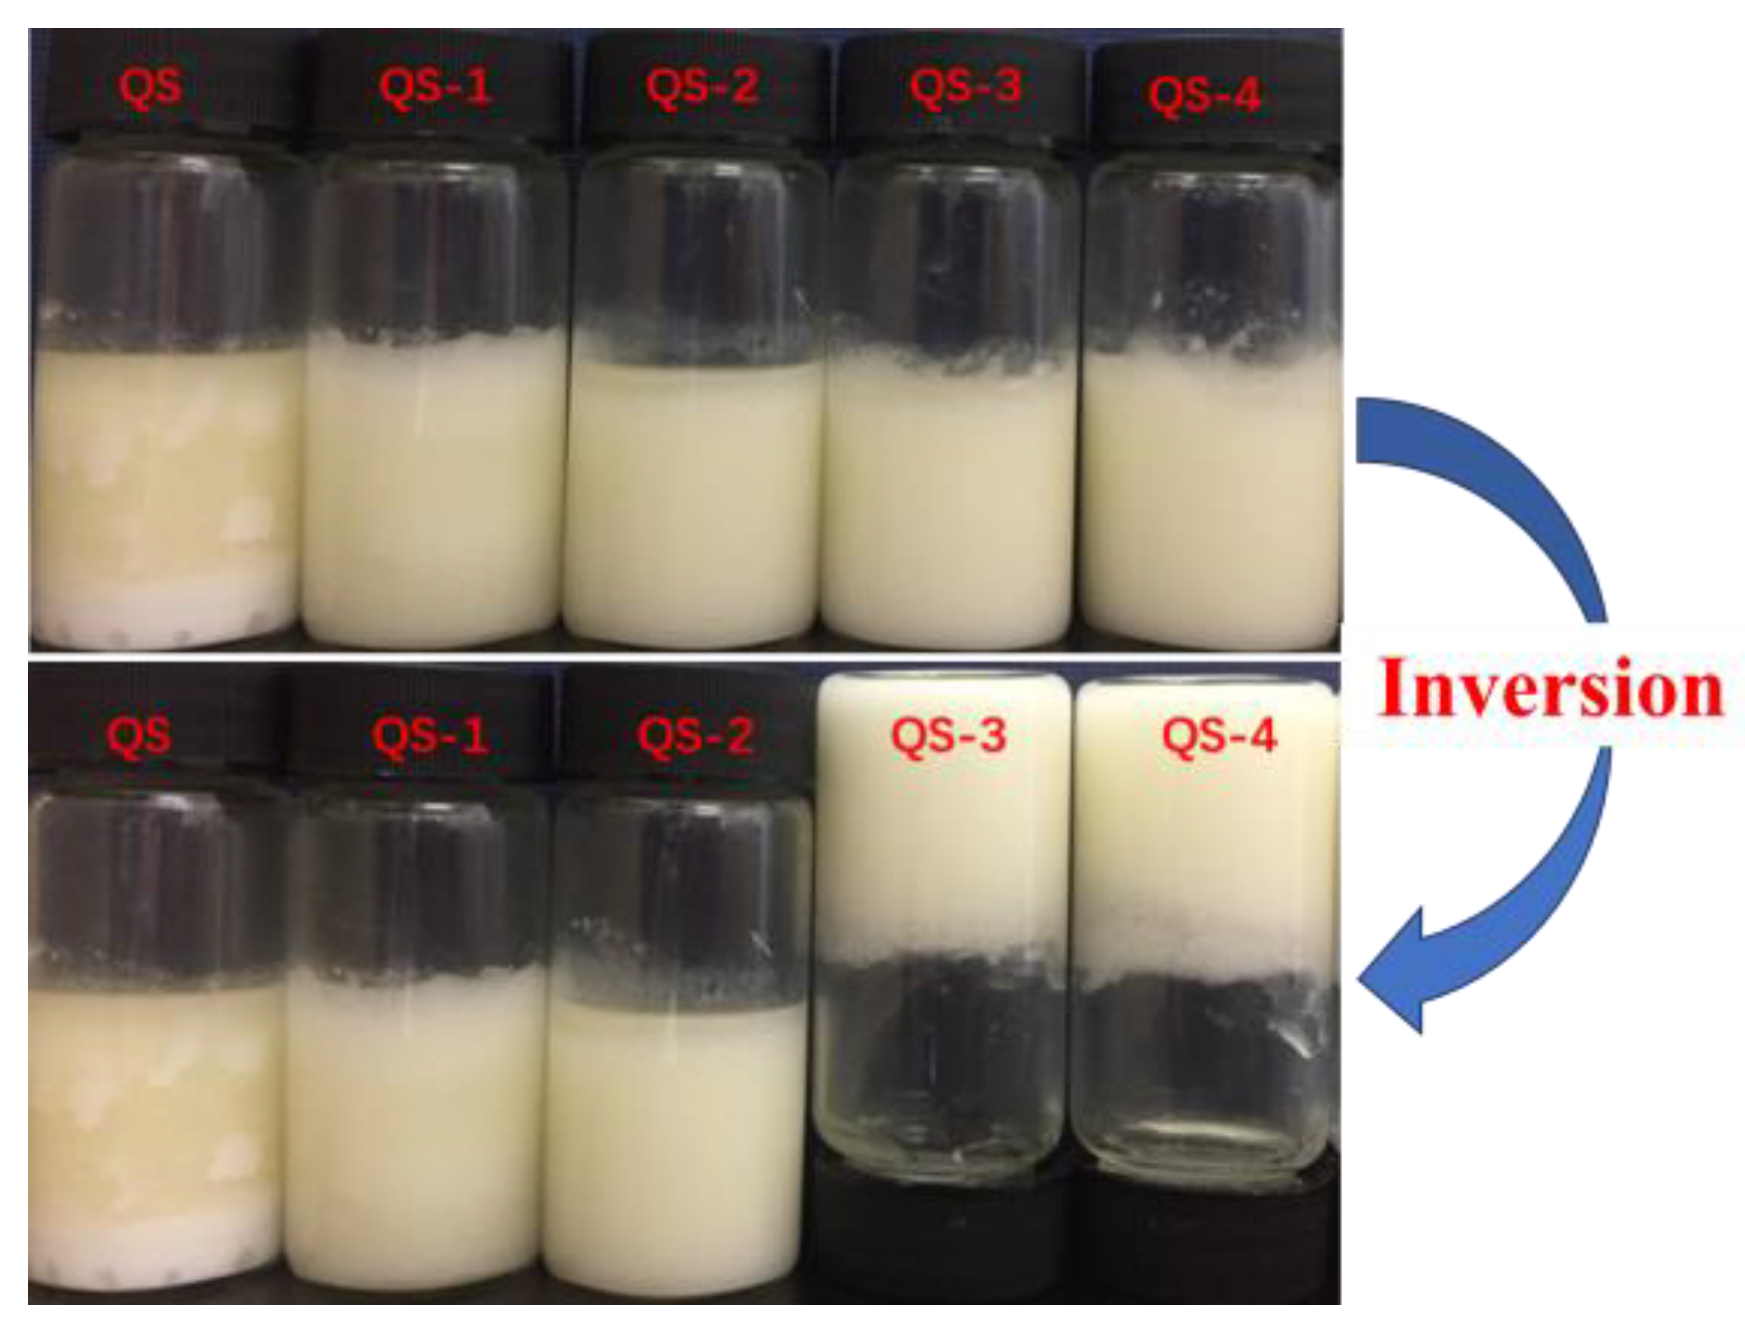
Figure 7 shows the appearance of HIPEs stabilized by QS as a function of hydrolysis time (0–4 days). Native QS was not a good emulsifier for HIPEs due to the severe oiling off at the top phase of fresh emulsions. With hydrolysis time increasing, oiling off was improved with the presence of a white emulsion layer for QS-1 and QS-2. Notedly, the emulsions stabilized by QS-3 and QS-4 were self-standing since they were immobile after inversion, which is a typical feature of emulsion gels, referred to as high internal phase emulsion gels (HIPE gels) [20]. Similar results could be found in the previous reports for SNCs from waxy maize starch [8,9]. Yang, Zheng, Zheng, Liu, Wang and Tang [9] also found that stable and gel-like HIPEs stabilized by SNCs from waxy maize starch could be fabricated at appropriate conditions, such as with high oil phase values of 0.75–0.85, the absence of NaCl, and pH values of 5.0–10.0, with a given particle concentration of 1.0%. Gel-like emulsions or emulsion gels have been widely used in the food, pharmaceutical and cosmetic industries as carriers of bioactive substances and fat substitutes due to their unique three-dimensional droplet structures and elastic–viscous properties [1,27].
Figure 7.
Appearance of HIPEs stabilized by QS as a function of hydrolysis time (0–4 days).
2.8. HIPE Morphology
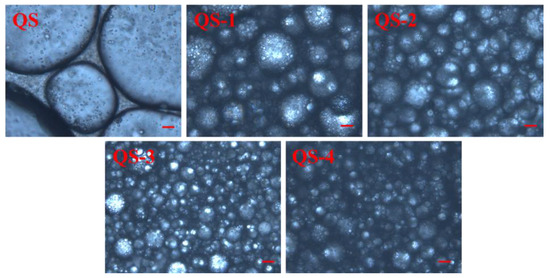
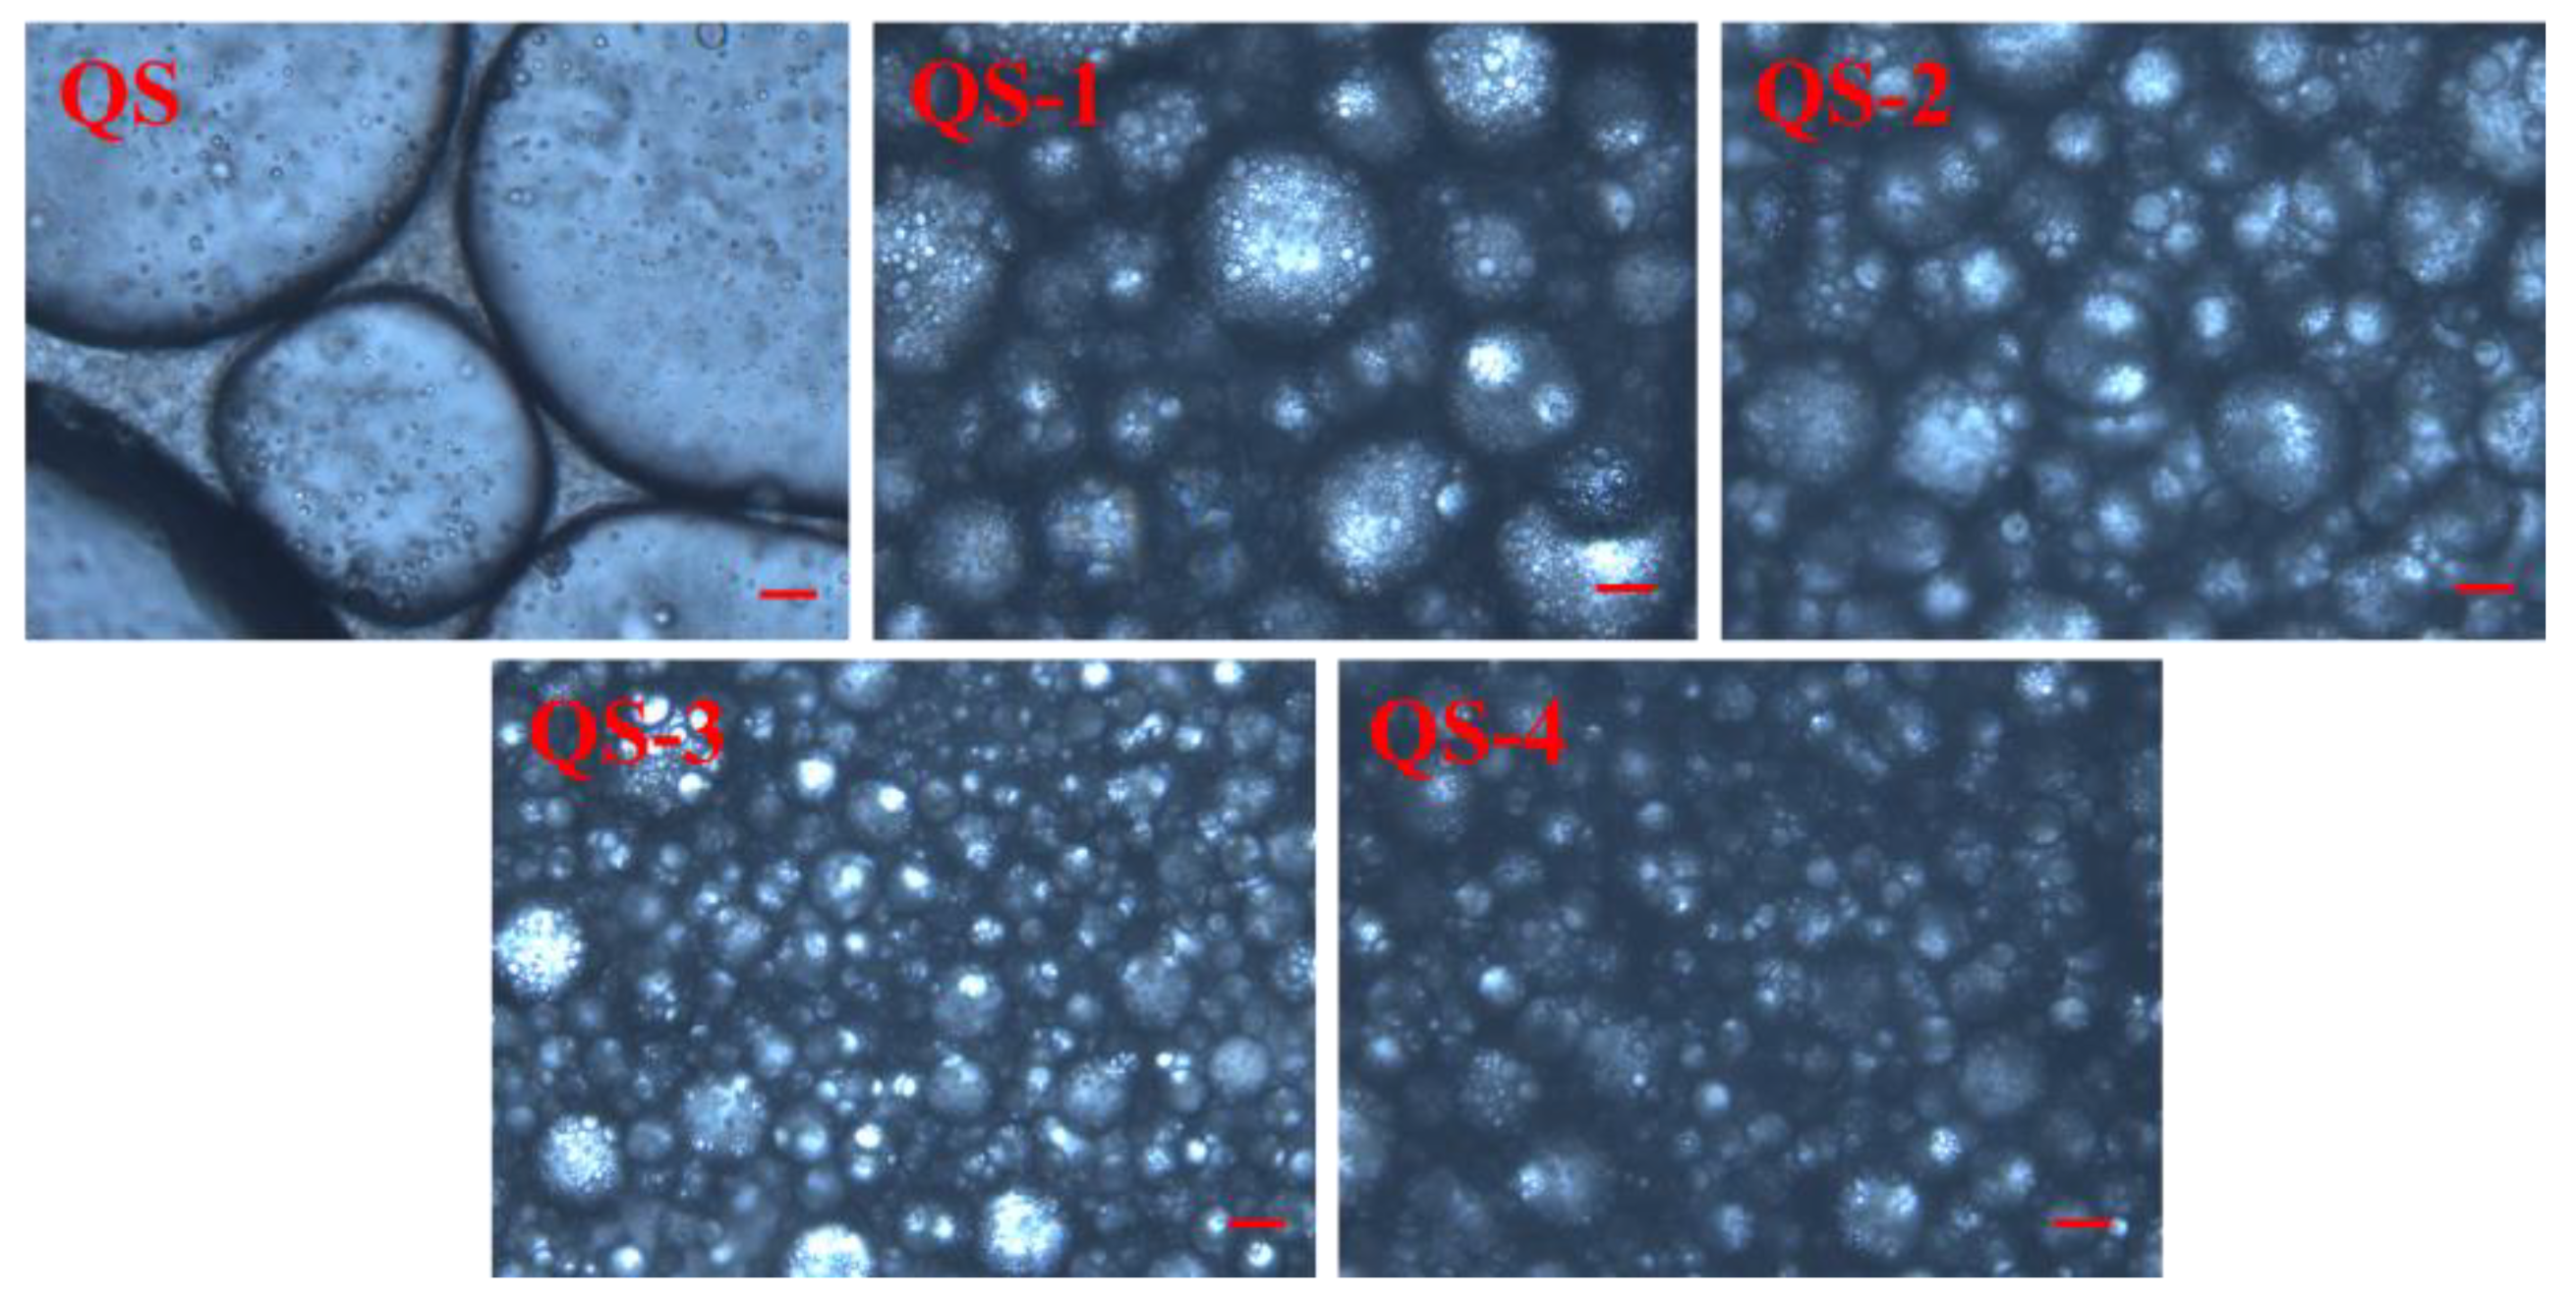
Figure 8 presents the morphology of HIPEs stabilized by QS as a function of hydrolysis time (0–4 days). A poor emulsification with big and irregular oil droplets could be observed for QS; it could be improved obviously by acid hydrolysis, especially for QS-3 and QS-4, resulted from aggregated regular droplets with micron-scale and densely packed interfacial architectures surrounding the droplets. This result should be responsible for the formation of HIPE gels stabilized by QS nanocrystals in Figure 7. Regarding the efficient emulsification concentration for stabilizing HIPEs, QS-4 (1.0%) showed an obvious advantage as compared to SNCs from acorn starch (2.5%) [22] and sago starch (3.5%) [28]. Their varied emulsion morphology could be jointly influenced by particle size, wettability and emulsification parameters [9,29].
Figure 8.
Morphology of HIPEs stabilized by QS as a function of hydrolysis time (0–4 days). (Bar is 10 μm.)
2.9. HIPE Apparent Viscosity
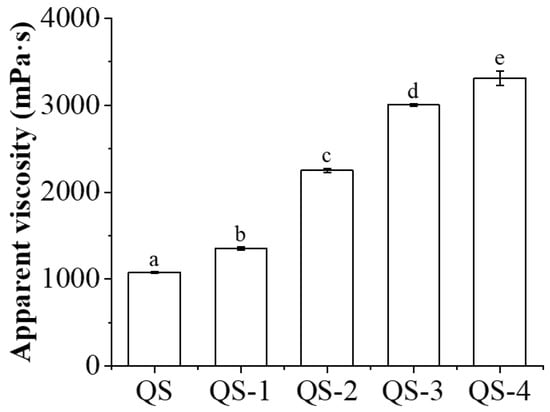
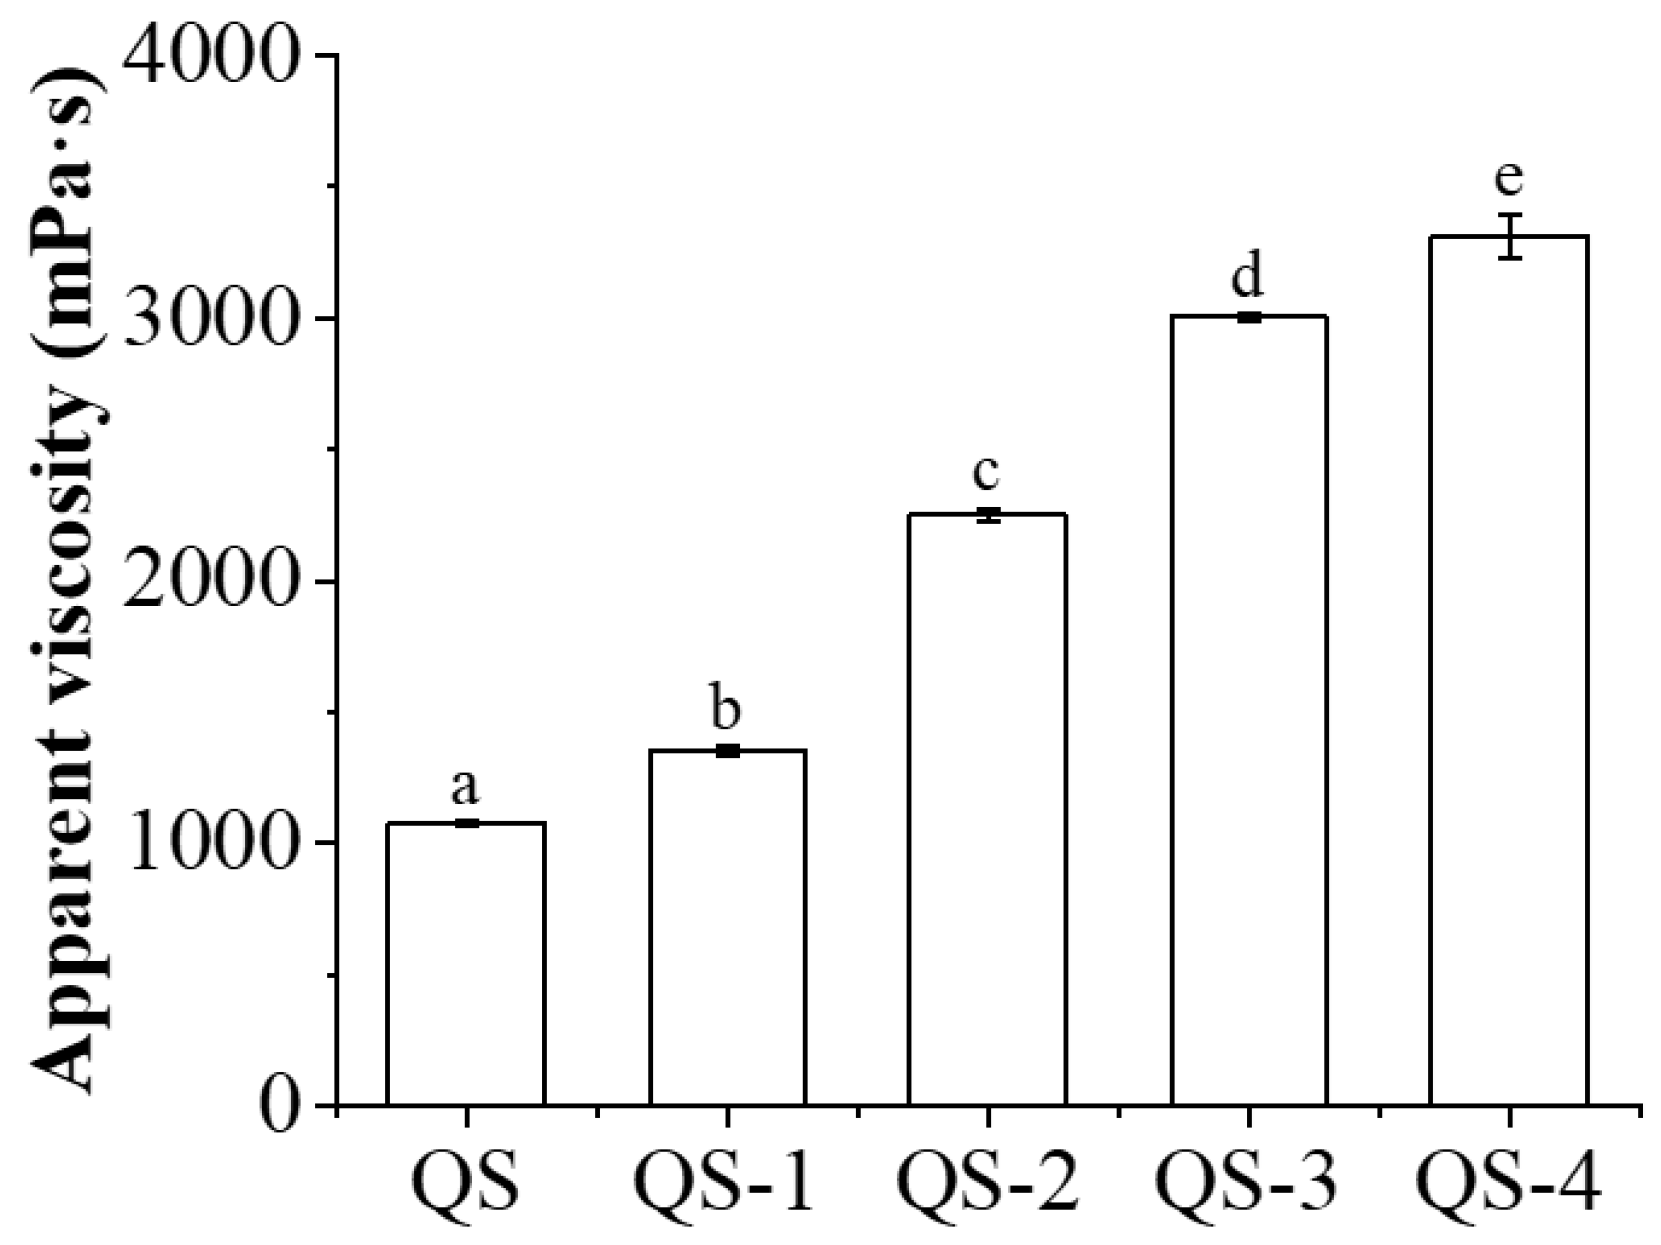
Figure 9 shows the apparent viscosity of HIPEs stabilized by QS as a function of hydrolysis time (0–4 days). The apparent viscosity of HIPEs stabilized by native QS was 1080 mPa·s, which is lower than that of octenyl succinic anhydride (OSA)-modified waxy maize starch (3918 mPa·s) [30], which should be related to their emulsification performance and parameters (such as concentration and oil fraction) [31]. As the hydrolysis time increased from 1 day to 4 days, their apparent viscosity values increased from 1353.3 mPa·s to 3313.3 mPa·s (Table S2), implying their enhanced droplet network, evidenced by Figure 8. Similar results were observed for starch nanocrystals prepared from ultrasonic-assisted acetic acid [32]. The apparent viscosity could also be affected by the size of the starch molecules, wherein it demonstrated a significantly positive correlation with average whole molecular size, average chain length and degree of substitution for OSA-modified starch [30].
Figure 9.
Apparent viscosity of HIPEs stabilized by QS as a function of hydrolysis time (0–4 days). Different superscript letters (a–e) were used to represent statistical significance among different samples (p < 0.05).
2.10. Possible Mechanism for HIPE Gels Stabilized by QS Nanocrystals
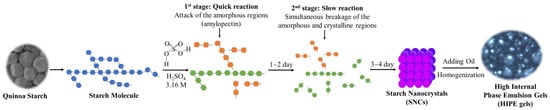
The use of SNCs as stabilizers for HIPEs is highly feasible due to their unique characteristics, including a nano-sized scale and hydrophobic nature, and their active surface resulting from different acid hydrolyses [29]. As reported previously [19,33], the first stage for acid hydrolysis of starch granules is a quick reaction, wherein the amorphous regions mainly consisting of amylopectin are attacked; the following second stage is simultaneous breakage of the amorphous and crystalline regions including amylose and amylopectin. In this regard, the small size of starch granules could be a novel candidate for nanocrystal production with a higher yield and a shorter time. Therefore, QS subjected to different acid hydrolysis times (0–4 days) and their effects on the formation of HIPEs were further explored. As expected, with the increasing hydrolysis time of QS, obvious decreasing trends were observed for yield (Figure 1), particle size (Figure 3 and Figure 4) and relative crystallinity (Figure 6), with increasing DH (Figure 1) and active surface groups (Figure 5). All of the above changes should be responsible for the performance of HIPEs, including typical features of emulsion gels (Figure 7), known as high internal phase emulsion gels (HIPE gels), the densely packed interfacial architecture surrounding oil droplets (Figure 8), and the enhanced apparent viscosity (Figure 9) for QS-3 and 4. Based on the abovementioned results, a possible mechanism for HIPE gels stabilized by QS nanocrystals, with varying hydrolysis times, was proposed in Figure 10.
Figure 10.
Possible mechanism for HIPE gels stabilized by QS nanocrystals with varying hydrolysis times.
3. Conclusions
This study investigated the effect of hydrolysis time (0–4 days) on the production efficiency and structural changes of QS nanocrystals from acid hydrolysis, and their potential application as HIPE stabilizers was further explored. After 4 days of hydrolysis time, QS-4 showed the highest DH of 87.8%, the lowest yield of 10.8%, the smallest particle size of around 20 nm and the highest relative crystallinity of 26.18%. In addition, QS-3 and QS-4 stabilizing HIPEs were self-standing since they were immobile after inversion, known as high internal phase emulsion gels (HIPE gels), resulting from their densely packed interfacial architecture and aggregated oil droplets. The optimal emulsification parameters, with stability evaluations (such as zeta potential and droplet size changes), for QS nanocrystals and their practical application as HIPE gels in food and cosmetic products is worth further research.
4. Materials and Methods
4.1. Materials
Quinoa seed was kindly provided by Yuechen Agricultural Technology Co., Ltd. (Xinzhou, China). QS with a purity of 98.6% was obtained using a wet-milling method [18]. H2SO4 (purity of 98%) was purchased from Sigma Aldrich. Corn oil was obtained from a local supermarket (Yangzhou, China). All other chemicals used in this study were of reagent grade.
4.2. QS Nanocrystal Preparation
QS nanocrystals were produced by acid hydrolysis according to a previous report [9] with minor modifications. QS suspension (14.7%, w/v) was prepared with 3.16 M H2SO4 solution and incubated at 40 °C with magnetic stirring at 200 rpm for 0–4 days. When the hydrolysis reaction was completed, the above suspension was centrifuged at 10,000 rpm for 10 min, and the supernatant was analyzed to determine the total sugar content using the phenol-sulfuric method. The degree of hydrolysis (DH) was determined by the following equation.
The above residue after centrifugation was repeatedly washed with distilled water until it was neutral and then freeze-dried to obtain QS nanocrystals. The yield was calculated by the following equation.
4.3. Tyndall Effect Observation
A sample suspension (2%, w/v) was prepared for observing the Tyndall effect by a light beam incident from the right side and then photographed [15,34].
4.4. SEM Observation
The sample was adhered to the aluminum stub using double-sided carbon tape and then sprayed with gold under vacuum. The microscopic appearance was observed by an SEM (COXEM, Daejeon, Republic of Korea) at an acceleration voltage of 20 kV [20].
4.5. Particle Size Determination
The sample was dispersed in deionized water (0.1%, w/v) with ultrasonic treatment for 3 min and then measured for particle size distribution using a nanoparticle analyzer (HORIBA, SZ-100Z, Tokyo, Japan) according to a previously described method [35].
4.6. FT-IR Analysis
The sample with KBr (1:150, w/w) was pressed into 1 mm pellets for FT-IR (Vector 33, Bruker Optics, Ettlingen, Germany) analysis over the wavenumber range of 400–4000 cm−1 [34,35].
4.7. XRD Analysis
All the samples were moisture balanced in a desiccator containing saturated BaCl2 solution for 3 days before analysis [12]. An X-ray diffractometer (D8 Advance, Bruker, Berlin, Germany) from 4 to 35° 2θ at 0.5 °/min using γ = 0.154 nm Cu K radiation at 40 kV and 30 mA was used, and then the XRD pattern was analyzed by Jade software 6.5 version for the relative crystallinity [18].
4.8. HIPE Preparation
The sample suspension (0.2 g; 14.8 mL) was mixed with corn oil (5.2 mL) and homogenized at 20,000 rpm for 1 min using a high-speed shear homogenizer (Heidolph, Schwabach, Germany) to obtain the HIPEs with a concentration of 1.0% and oil fraction of 74% [36]. Aliquots (10 mL) of the above HIPEs were accurately transferred into glass tubes and sealed for further examination.
4.9. Appearance and Microscopic Observation
Each fresh HIPE appearance was photographed using a digital camera (EOS 200D II, Canon, Tokyo, Japan). Optical microscopic observation of HIPE was performed using an Olympus BH-2 light microscope (Olympus Co., Tokyo, Japan) [37].
4.10. Apparent Viscosity Measurement
The apparent viscosity of freshly prepared HIPEs was measured at 600 rpm of shear speed using a digital rotational viscometer (NDJ-5S, Shanghai Changji Geological Instrument Co., Ltd., Shanghai, China) as described before [30].
4.11. Statistical Analysis
All measurements were conducted in triplicate, and the results are presented as mean ± standard deviation. One-way analysis of variance and Duncan’s multiple-range test (p < 0.05) were used for significant differences among groups.
Supplementary Materials
The following supporting information can be downloaded at: https://www.mdpi.com/article/10.3390/gels10090559/s1, Table S1: Yield of QS nanocrystals and DH of QS as a function of hydrolysis time (1–4 days) with statistical analysis; Table S2: Apparent viscosity of HIPEs stabilized by QS as a function of hydrolysis time (0–4 days) with statistical analysis.
Author Contributions
S.L.: Conceptualization, methodology, formal analysis, writing—original draft, funding acquisition; C.S.: Investigation, formal analysis, writing—original draft; Y.S.: Formal analysis, visualization; E.L.: Writing—review and editing, visualization; P.L.: Conceptualization, writing—review and editing, project administration, supervision; J.W.: Conceptualization, writing—review and editing, funding acquisition, project administration, supervision. All authors have read and agreed to the published version of the manuscript.
Funding
This work is supported by the National Natural Science Foundation of China (82000791), the Natural Science Foundation of Jiangsu Province (BK20220585), the China Postdoctoral Science Foundation (2022M712692), the Yangzhou Key R&D Plan (Social Development) Project (YZ2022076), the “Shuangchuang” Doctor Talent Support Program of Jiangsu Province (JSSCBS20221323), Yangzhou “Lvyangjinfeng” Talent Support Program (YZLYJFJH2021YXBS172), the “QingLan” Talent Support Program of Yangzhou University, and the Open Funding Project of Key Laboratory of Functional Foods, Ministry of Agriculture and Rural Affairs/Guangdong Key Laboratory of Agricultural Products Processing (202105).
Institutional Review Board Statement
Not applicable.
Informed Consent Statement
Not applicable.
Data Availability Statement
The datasets generated for this study are available on request to the corresponding author.
Conflicts of Interest
The authors declare no conflicts of interest.
References
- Gao, H.; Ma, L.; Cheng, C.; Liu, J.; Liang, R.; Zou, L.; Liu, W.; McClements, D.J. Review of recent advances in the preparation, properties, and applications of high internal phase emulsions. Trends Food Sci. Technol. 2021, 112, 36–49. [Google Scholar] [CrossRef] [Scilit]
- Liu, X.; Guo, J.; Wan, Z.-L.; Liu, Y.-Y.; Ruan, Q.-J.; Yang, X.-Q. Wheat gluten-stabilized high internal phase emulsions as mayonnaise replacers. Food Hydrocoll. 2018, 77, 168–175. [Google Scholar] [CrossRef] [Scilit]
- Li, X.; Xu, X.; Song, L.; Bi, A.; Wu, C.; Ma, Y.; Du, M.; Zhu, B. High internal phase emulsion for food-grade 3D printing materials. ACS Appl. Mater. Interfaces 2020, 12, 45493–45503. [Google Scholar] [CrossRef] [Scilit]
- Weiss, J.; Ahmad, T.; Zhang, C.; Zhang, H. A review of recent progress on high internal-phase Pickering emulsions in food science. Trends Food Sci. Technol. 2020, 106, 91–103. [Google Scholar]
- Shi, A.; Feng, X.; Wang, Q.; Adhikari, B. Pickering and high internal phase Pickering emulsions stabilized by protein-based particles: A review of synthesis, application and prospective. Food Hydrocoll. 2020, 109, 106117. [Google Scholar] [CrossRef] [Scilit]
- Pang, B.; Liu, H.; Zhang, K. Recent progress on Pickering emulsions stabilized by polysaccharides-based micro/nanoparticles. Adv. Colloid Interface Sci. 2021, 296, 102522. [Google Scholar] [CrossRef] [Scilit] [PubMed]
- Wang, S.; Copeland, L. Effect of acid hydrolysis on starch structure and functionality: A review. Crit. Rev. Food Sci. Nutr. 2015, 55, 1081–1097. [Google Scholar] [CrossRef] [Scilit]
- Li, C.; Sun, P.; Yang, C. Emulsion stabilized by starch nanocrystals. Starch-Stärke 2012, 64, 497–502. [Google Scholar] [CrossRef] [Scilit]
- Yang, T.; Zheng, J.; Zheng, B.-S.; Liu, F.; Wang, S.; Tang, C.-H. High internal phase emulsions stabilized by starch nanocrystals. Food Hydrocoll. 2018, 82, 230–238. [Google Scholar] [CrossRef] [Scilit]
- Dufresne, A. Crystalline starch based nanoparticles. Curr. Opin. Colloid Interface Sci. 2014, 19, 397–408. [Google Scholar] [CrossRef] [Scilit]
- Dufresne, A.; Cavaille, J.-Y.; Helbert, W. New nanocomposite materials: Microcrystalline starch reinforced thermoplastic. Macromolecules 1996, 29, 7624–7626. [Google Scholar] [CrossRef] [Scilit]
- Velásquez-Castillo, L.E.; Leite, M.A.; Ditchfield, C.; do Amaral Sobral, P.J.; Moraes, I.C.F. Quinoa starch nanocrystals production by acid hydrolysis: Kinetics and properties. Int. J. Biol. Macromol. 2020, 143, 93–101. [Google Scholar] [CrossRef] [Scilit] [PubMed]
- Xu, Y.; Sismour, E.N.; Grizzard, C.; Thomas, M.; Pestov, D.; Huba, Z.; Wang, T.; Bhardwaj, H.L. Morphological, structural, and thermal properties of starch nanocrystals affected by different botanic origins. Cereal Chem. 2014, 91, 383–388. [Google Scholar] [CrossRef] [Scilit]
- Li, C.; Hu, Y. Effects of acid hydrolysis on the evolution of starch fine molecular structures and gelatinization properties. Food Chem. 2021, 353, 129449. [Google Scholar] [CrossRef] [Scilit]
- Boufi, S.; Haaj, S.B.; Magnin, A.; Pignon, F.; Impéror-Clerc, M.; Mortha, G. Ultrasonic assisted production of starch nanoparticles: Structural characterization and mechanism of disintegration. Ultrason. Sonochem. 2018, 41, 327–336. [Google Scholar] [CrossRef] [Scilit] [PubMed]
- Li, X.; Fan, M.; Huang, Q.; Zhao, S.; Xiong, S.; Zhang, B.; Yin, T. Effect of wet-media milling on the physicochemical properties of tapioca starch and their relationship with the texture of myofibrillar protein gel. Food Hydrocoll. 2020, 109, 106082. [Google Scholar] [CrossRef] [Scilit]
- Hada, A.-M.; Suarasan, S.; Muntean, M.; Potara, M.; Astilean, S. Aptamer-conjugated gold nanoparticles for portable, ultrasensitive naked-eye detection of C-reactive protein based on the Tyndall effect. Anal. Chim. Acta 2024, 1307, 342626. [Google Scholar] [CrossRef] [Scilit]
- Junejo, S.A.; Wang, J.; Liu, Y.; Jia, R.; Zhou, Y.; Li, S. Multi-Scale Structures and Functional Properties of Quinoa Starch Extracted by Alkali, Wet-Milling, and Enzymatic Methods. Foods 2022, 11, 2625. [Google Scholar] [CrossRef] [Scilit]
- Li, C.; Guo, Y.; Chen, M.; Wang, S.; Gong, H.; Zuo, J.; Zhang, J.; Dai, L. Recent preparation, modification and application progress of starch nanocrystals: A review. Int. J. Biol. Macromol. 2023, 250, 126122. [Google Scholar] [CrossRef] [Scilit]
- Li, S.; Zhang, B.; Tan, C.P.; Li, C.; Fu, X.; Huang, Q. Octenylsuccinate quinoa starch granule-stabilized Pickering emulsion gels: Preparation, microstructure and gelling mechanism. Food Hydrocoll. 2019, 91, 40–47. [Google Scholar] [CrossRef] [Scilit]
- Li, S.; Zhou, W.; Huang, C.; Hu, Y.; Gao, Q.; Chen, Y. Rapid preparation of starch nanocrystals by the mixed acid of sulfuric acid and hydrochloric acid. Int. J. Biol. Macromol. 2023, 232, 123402. [Google Scholar] [CrossRef] [Scilit] [PubMed]
- Guo, C.; Geng, S.; Shi, Y.; Yuan, C.; Liu, B. Effect of sulfuric acid hydrolysis on the structure and Pickering emulsifying capacity of acorn starch. Food Chem. X 2024, 22, 101277. [Google Scholar] [CrossRef] [Scilit]
- Mukurumbira, A.; Mariano, M.; Dufresne, A.; Mellem, J.J.; Amonsou, E.O. Microstructure, thermal properties and crystallinity of amadumbe starch nanocrystals. Int. J. Biol. Macromol. 2017, 102, 241–247. [Google Scholar] [CrossRef] [Scilit] [PubMed]
- Jiang, F.; Du, C.; Zhao, N.; Jiang, W.; Yu, X.; Du, S.-k. Preparation and characterization of quinoa starch nanoparticles as quercetin carriers. Food Chem. 2022, 369, 130895. [Google Scholar] [CrossRef] [Scilit]
- de la Concha, B.B.S.; Agama-Acevedo, E.; Nuñez-Santiago, M.C.; Bello-Perez, L.A.; Garcia, H.S.; Alvarez-Ramirez, J. Acid hydrolysis of waxy starches with different granule size for nanocrystal production. J. Cereal Sci. 2018, 79, 193–200. [Google Scholar] [CrossRef] [Scilit]
- Li, G.; Zhu, F. Amylopectin molecular structure in relation to physicochemical properties of quinoa starch. Carbohydr. Polym. 2017, 164, 396–402. [Google Scholar] [CrossRef] [Scilit] [PubMed]
- Zhi, L.; Liu, Z.; Wu, C.; Ma, X.; Hu, H.; Liu, H.; Adhikari, B.; Wang, Q.; Shi, A. Advances in preparation and application of food-grade emulsion gels. Food Chem. 2023, 424, 136399. [Google Scholar] [CrossRef] [Scilit] [PubMed]
- Azfaralariff, A.; Fazial, F.F.; Sontanosamy, R.S.; Nazar, M.F.; Lazim, A.M. Food-grade particle stabilized pickering emulsion using modified sago (Metroxylon sagu) starch nanocrystal. J. Food Eng. 2020, 280, 109974. [Google Scholar] [CrossRef] [Scilit]
- Almeida, R.L.J.; Santos, N.C.; Monteiro, S.S.; Rios, N.S.; dos Santos, E.S. Exploring the potential of native and modified starch and starch nanocrystals in Pickering emulsions: Current advances, future perspectives, and challenges. Food Biosci. 2024, 61, 104675. [Google Scholar]
- Han, H.; Zhang, H.; Li, E.; Li, C.; Wu, P. Structural and functional properties of OSA-starches made with wide-ranging hydrolysis approaches. Food Hydrocoll. 2019, 90, 132–145. [Google Scholar] [CrossRef] [Scilit]
- Nilsson, L.; Zielke, C. Starch-based food emulsifiers. In Starch in Food; Elsevier: Amsterdam, The Netherlands, 2024; pp. 525–543. [Google Scholar]
- Zhu, Y.; Du, C.; Jiang, F.; Hu, W.; Yu, X.; Du, S.-k. Pickering emulsions stabilized by starch nanocrystals prepared from various crystalline starches by ultrasonic assisted acetic acid: Stability and delivery of curcumin. Int. J. Biol. Macromol. 2024, 267, 131217. [Google Scholar] [CrossRef] [Scilit]
- Kim, H.Y.; Lee, J.H.; Kim, J.Y.; Lim, W.J.; Lim, S.T. Characterization of nanoparticles prepared by acid hydrolysis of various starches. Starch-Stärke 2012, 64, 367–373. [Google Scholar] [CrossRef] [Scilit]
- Zhang, J.; Zhang, M.; Bai, X.; Zhang, Y.; Wang, C. The impact of high hydrostatic pressure treatment time on the structure, gelatinization and thermal properties and in vitro digestibility of oat starch. Grain Oil Sci. Technol. 2022, 5, 1–12. [Google Scholar] [CrossRef] [Scilit]
- Li, S.; Huang, L.; Zhang, B.; Chen, C.; Fu, X.; Huang, Q. Fabrication and characterization of starch/zein nanocomposites with pH-responsive emulsion behavior. Food Hydrocoll. 2021, 112, 106341. [Google Scholar] [CrossRef] [Scilit]
- Li, S.; Zhang, B.; Li, C.; Fu, X.; Huang, Q. Pickering emulsion gel stabilized by octenylsuccinate quinoa starch granule as lutein carrier: Role of the gel network. Food Chem. 2019, 305, 125476. [Google Scholar] [CrossRef] [Scilit] [PubMed]
- Li, S.; Li, C.; Yang, Y.; He, X.; Zhang, B.; Fu, X.; Tan, C.P.; Huang, Q. Starch granules as Pickering emulsifiers: Role of octenylsuccinylation and particle size. Food Chem. 2019, 283, 437–444. [Google Scholar] [CrossRef] [Scilit] [PubMed]

Disclaimer/Publisher’s Note: The statements, opinions and data contained in all publications are solely those of the individual author(s) and contributor(s) and not of MDPI and/or the editor(s). MDPI and/or the editor(s) disclaim responsibility for any injury to people or property resulting from any ideas, methods, instructions or products referred to in the content. |
© 2024 by the authors. Licensee MDPI, Basel, Switzerland. This article is an open access article distributed under the terms and conditions of the Creative Commons Attribution (CC BY) license (https://creativecommons.org/licenses/by/4.0/).