


Abstract
The development of intrusion detection and network security solutions for securing Internet of Things (IoT) networks is constrained by the limited availability of representative network security datasets. Many existing datasets rely on centralised traffic collection and do not capture the non-Independent and Identically Distributed (non-IID) characteristics inherent to edge environments. To address this limitation, this work presents a device-level IoT network dataset generated using the open-source Gotham testbed, a virtualised smart city environment. Network traffic is collected in a distributed manner at the interfaces of 78 heterogeneous IoT devices operating across multiple protocols, including MQTT, CoAP, and RTSP. The dataset comprises over 31.8 million packet-level records, each described by 22 features. It includes both benign traffic and multiple attack classes, namely Network Scanning, Brute Force, Infection, Denial of Service (DoS), and Command and Control (C&C) Communication. Ground-truth labels are assigned using a deterministic process based on orchestration logs. The dataset preserves device-level traffic distributions and captures non-IID characteristics without artificial partitioning. It is publicly available and can be used to support reproducible evaluation of intrusion detection approaches and network analysis tasks in both centralised and distributed learning settings.
Dataset: Belarbi, O., Spyridopoulos, T., Anthi, E., Rana, O., Carnelli, P., & Khan, A. (2025). A Device-Level IoT Network Traffic Dataset with Distributed Capture and Non-IID Characteristics [Data set]. Zenodo. https://doi.org/10.5281/zenodo.14502760 (accessed on 18 April 2026).
Dataset License: Creative Commons Attribution 4.0 International (CC BY 4.0) license.
1. Summary
The development of Intrusion Detection Systems (IDSs) for Internet of Things (IoT) environments depends on the availability of representative network security datasets. However, many existing datasets rely on centralised traffic collection and simplified configurations, which do not fully capture the characteristics of real-world IoT deployments. Most datasets are collected in small- to medium-scale environments and lack the structured topologies and configurations observed in large-scale deployments [1]. In many cases, devices are connected to a single Local Area Network (LAN), limiting their ability to reflect the distributed nature of modern IoT systems [1].
Additionally, existing datasets often overlook the heterogeneity of IoT systems, failing to include diverse IoT devices, communication protocols, and traffic patterns [2]. As a result, they do not adequately represent the diversity of behaviours observed in real deployments. These limitations are particularly relevant in distributed learning scenarios, where data is inherently decentralised and associated with individual devices. In such settings, each node is expected to learn from its own local data distribution. In practice, researchers frequently partition centralised datasets to simulate heterogeneity; however, such partitioning may not accurately reflect the statistical properties of naturally distributed data. These observations highlight the need for datasets that preserve device-level traffic traces and local data distributions at the point of collection, rather than reconstructing them from aggregated traffic.
To address these limitations, this work presents a device-level IoT network dataset generated using the open-source Gotham testbed [3]. The dataset captures traffic from 78 heterogeneous IoT devices operating across multiple protocols, including MQTT, CoAP, and RTSP. It includes both benign activity and malicious traffic corresponding to Network Scanning, Brute Force, Infection, Denial of Service (DoS), and Command and Control (C&C) Communication.
A defining characteristic of the dataset is its distributed data collection methodology. Instead of relying on centralised packet capture, network traffic is collected directly at the interface connecting each IoT device to its gateway. Each device maintains its own traffic trace, reflecting edge deployments where data is generated and processed locally. This approach preserves device-level traffic distributions and naturally captures non-Independent and Identically Distributed (non-IID) characteristics without requiring post hoc artificial partitioning.
The dataset contains over million packet-level records, provided in both Packet Capture (PCAP) and Comma Separated Values (CSV) formats. Each record is described by 22 features spanning frame, network, and transport layers, and is associated with a categorical label representing benign or malicious activity. Ground-truth labels are generated using a deterministic process based on testbed orchestration logs, combining temporal alignment with flow-level verification.
All data generation, processing, and labelling scripts are publicly available, enabling reproducibility and facilitating the extension of the dataset with additional devices or attack scenarios. The dataset can be used in centralised, distributed, and federated learning settings and supports network security and traffic analysis tasks under heterogeneous IoT conditions.
The public release of this dataset provides several benefits to the research community:
- –
- It provides a reusable device-level IoT network traffic dataset collected from heterogeneous devices in a virtualised smart city testbed.
- –
- It preserves native device-level traffic distributions through distributed packet capture, enabling evaluation under naturally heterogeneous conditions without artificial dataset partitioning.
- –
- It provides both raw PCAP files and processed CSV files, allowing researchers to either reproduce the feature extraction pipeline or directly use the structured packet-level representation.
- –
- It includes deterministic ground-truth labels derived from orchestration logs using temporal alignment and flow-level verification, supporting reproducible network security and traffic analysis experiments.
The remainder of this article is organised as follows. Section 2 describes the dataset structure, feature schema, device characteristics, and label distribution. Section 3 presents the methods used to generate, collect, process, label, and validate the data. Section 4 provides practical usage notes to help researchers access, interpret, and work with the dataset. Section 5 discusses the limitations of the dataset. Section 6 concludes the article and outlines future extensions of the dataset.
2. Data Description
2.1. Dataset Overview
The dataset consists of network traffic collected from 78 heterogeneous IoT devices operating within a virtualised smart city environment orchestrated by the open-source Gotham testbed [3]. It comprises over million packet-level records, where each row represents a single network packet characterised by 22 features along with a label field. The dataset supports multi-class intrusion detection and includes 6 distinct labels representing benign activity and different stages of cyber attacks. These labels are: Benign, Network Scanning, Brute Force, Infection, DoS, and C&C Communication. The dataset is publicly available via the Zenodo repository [4].
2.2. Dataset Structure and File Organisation
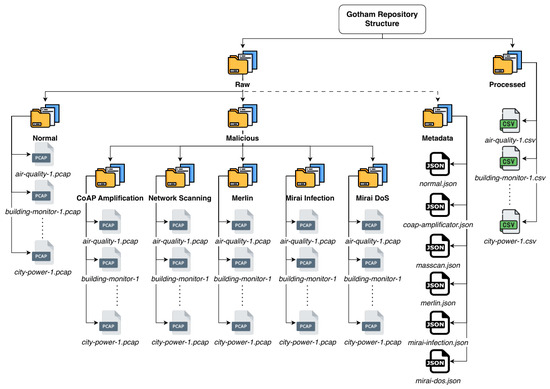
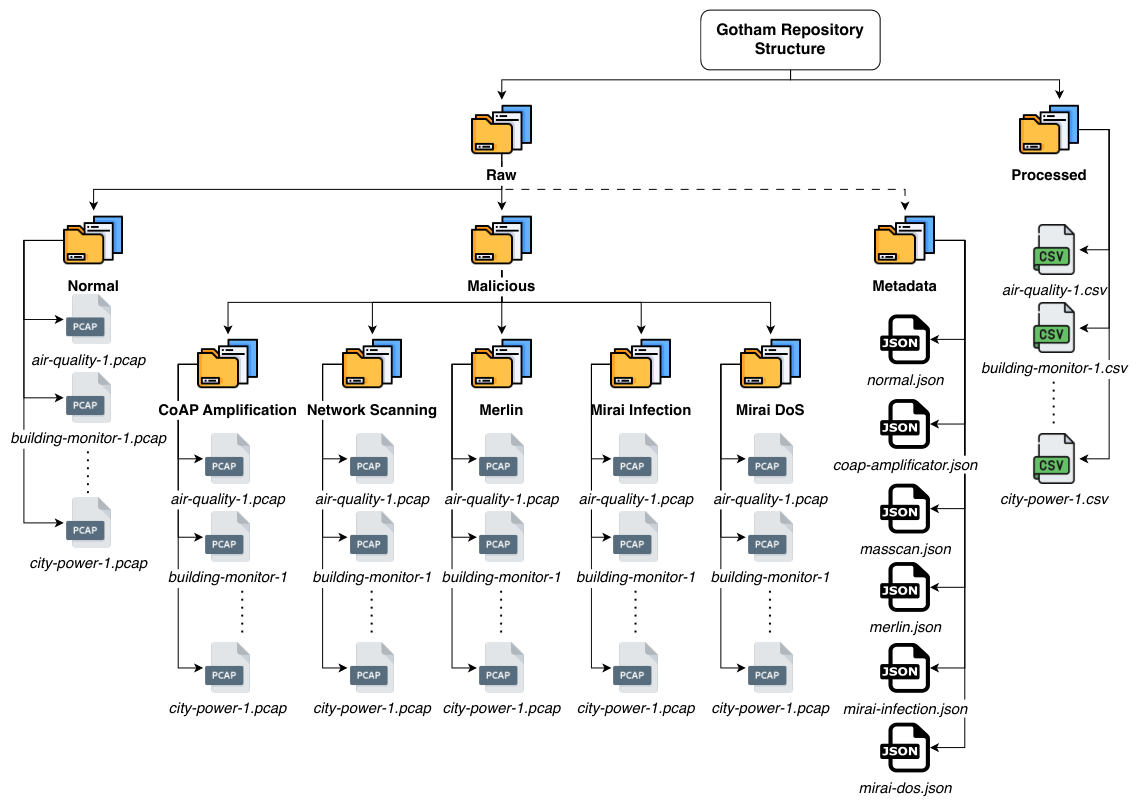
The dataset is organised into a hierarchical directory structure designed to support scalability and facilitate both centralised and distributed analysis. Figure 1 illustrates the overall organisation of the data repository.
Figure 1.
Directory structure of the Gotham dataset repository, illustrating the organisation of raw PCAP captures and processed CSV feature sets.
At the root level, the dataset is divided into two primary folders:
- Raw Data: This folder contains the original PCAP files of network traces. Each PCAP file corresponds to the network traffic for a specific IoT device during a given scenario. Subfolders are categorised by scenario:
- –
- Normal: Contains PCAP files representing benign traffic.
- –
- Malicious: Contains PCAP files categorised by attack type (e.g., Mirai DoS, CoAP amplification).
- –
- Metadata: Contains JSON files used for labelling the network traffic. The metadata provides contextual information, such as device IP addresses, timestamps, and scenario descriptions, ensuring accurate and reproducible labelling.
- Processed Data: This folder contains CSV files derived from the Raw Data. Each CSV file includes feature vectors extracted from network packets, converting unstructured packet data into a structured format ready for training IDSs in both centralised and distributed settings.
Table 1 provides an overview of the dataset structure, including file paths, naming patterns, descriptions, and file sizes.
Table 1.
The dataset public repository structure and file summary.
2.3. Processed CSV Files and Feature Schema
The preprocessed CSV files provide a structured packet-level representation of the captured network traffic. Each CSV file corresponds to a single IoT device and is derived directly from its associated PCAP file through a consistent feature extraction pipeline. Each row represents an individual network packet, described by a set of features and an associated label.
Table 2 summarises all extracted features, including their protocol layer, data type, and semantic description. The feature schema is identical across all devices to ensure consistency and to enable cross-device comparative analysis as well as distributed learning workflows.
Table 2.
The dataset feature set list.
All CSV files are UTF-8 encoded and use comma-separated formatting. Numerical features (e.g., packet length, port numbers, and header fields) are represented as integer or floating-point values, while categorical features (e.g., protocol identifiers, flags, and addresses) are stored as string-encoded values. Temporal information is captured using timestamp values with microsecond-level precision. No additional preprocessing, normalisation, or encoding is applied to the released data, allowing users to adapt the feature representation to their specific analysis or modelling requirements. Furthermore, all records correspond to valid network packets, as malformed or non-IP traffic is filtered during the feature extraction process.
The resulting tabular format provides a direct mapping from raw packet captures to structured feature representations, enabling their use in statistical analysis and machine learning-based intrusion detection tasks.
2.4. IoT Device Characteristics
The dataset reflects the activity of 78 IoT devices using multiple application protocols, including MQTT, CoAP, and RTSP. These devices are distributed across four distinct network segments, with each segment representing a different operational area. Further details on the network topology are provided in Section 3. Table 3 summarises the benign-phase traffic extracted from the raw PCAP captures, reporting device types, application protocols, and aggregated packet and byte statistics prior to any preprocessing or feature extraction.
Table 3.
Benign traffic statistics extracted from the raw PCAP captures, summarising device types, communication protocols, and aggregated packet and byte volumes.
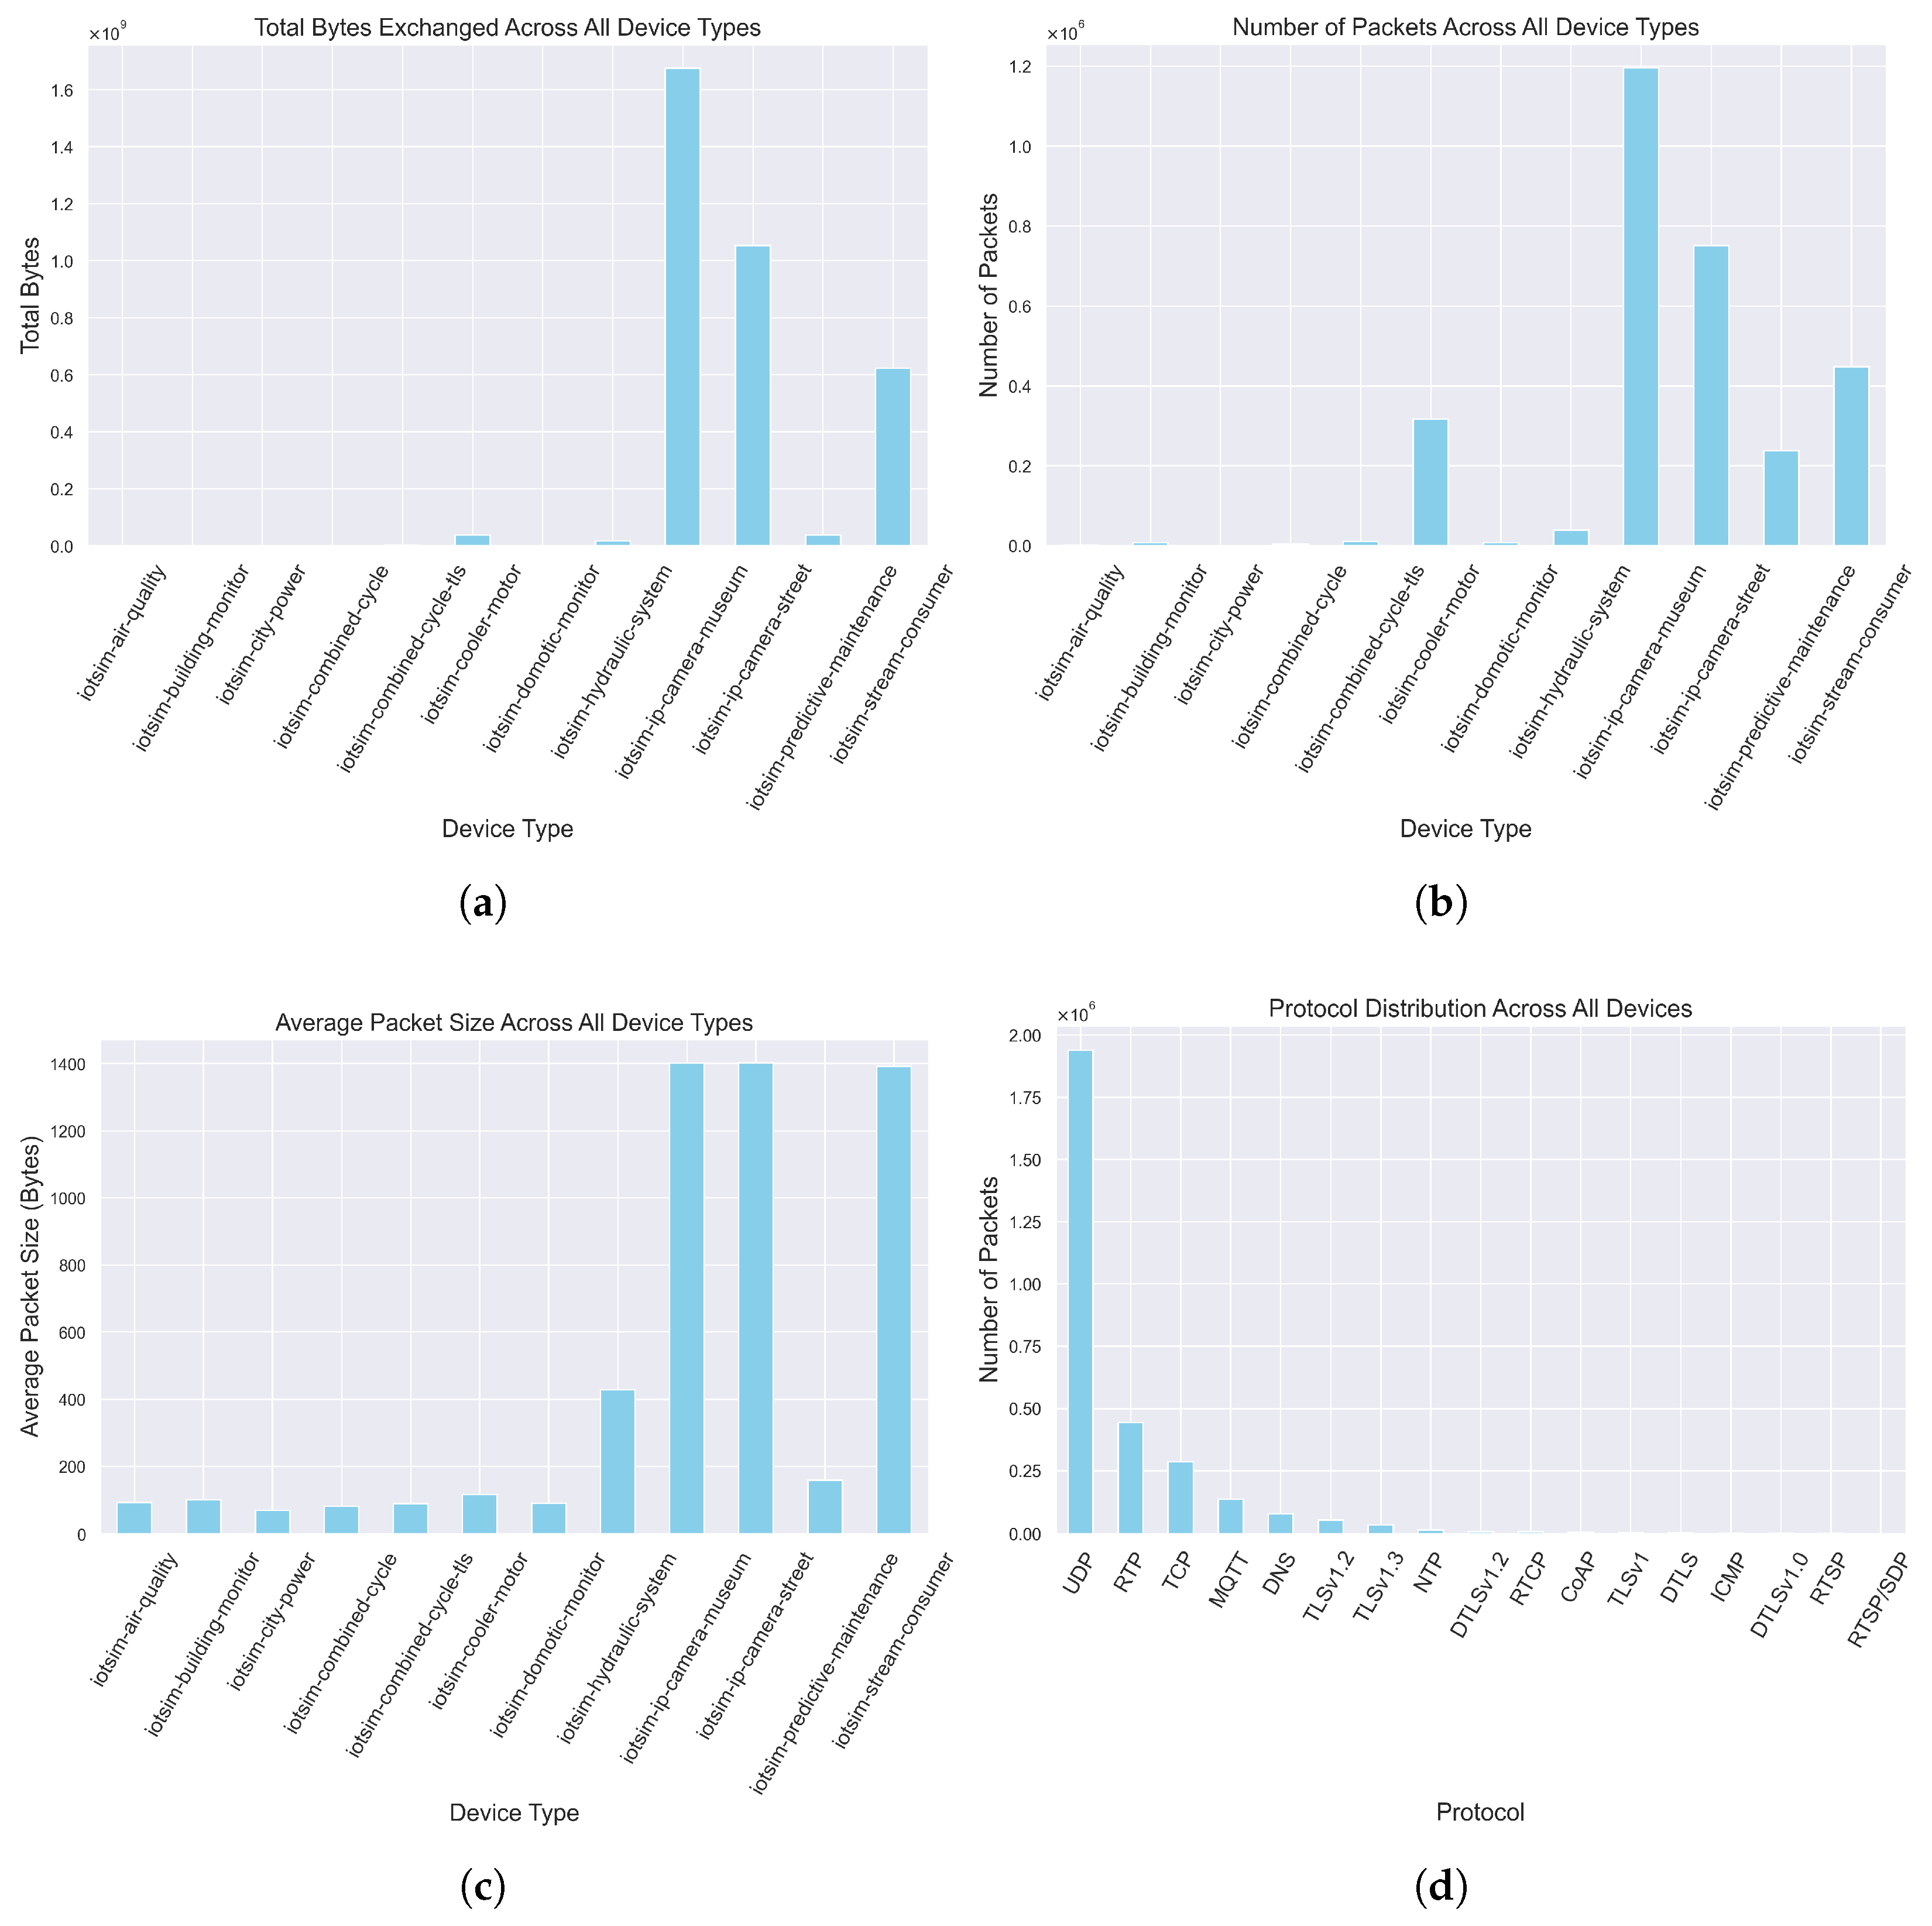
The traffic characteristics vary across device types and protocols. MQTT-based devices generate moderate traffic volumes, while CoAP devices typically produce lower volumes of traffic. In contrast, RTSP devices, such as IP cameras, exhibit significantly higher network activity, with packet counts exceeding 1 million. Overall, during the benign phase, the 78 devices generate 3,134,004 packets and approximately GB of network traffic.
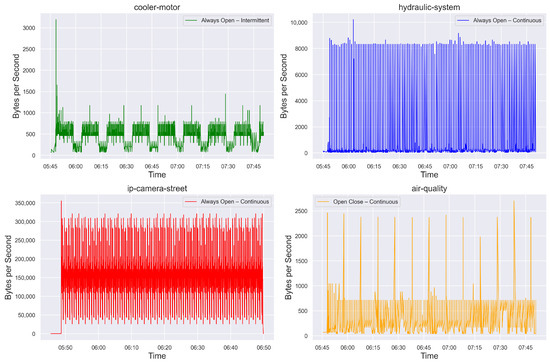
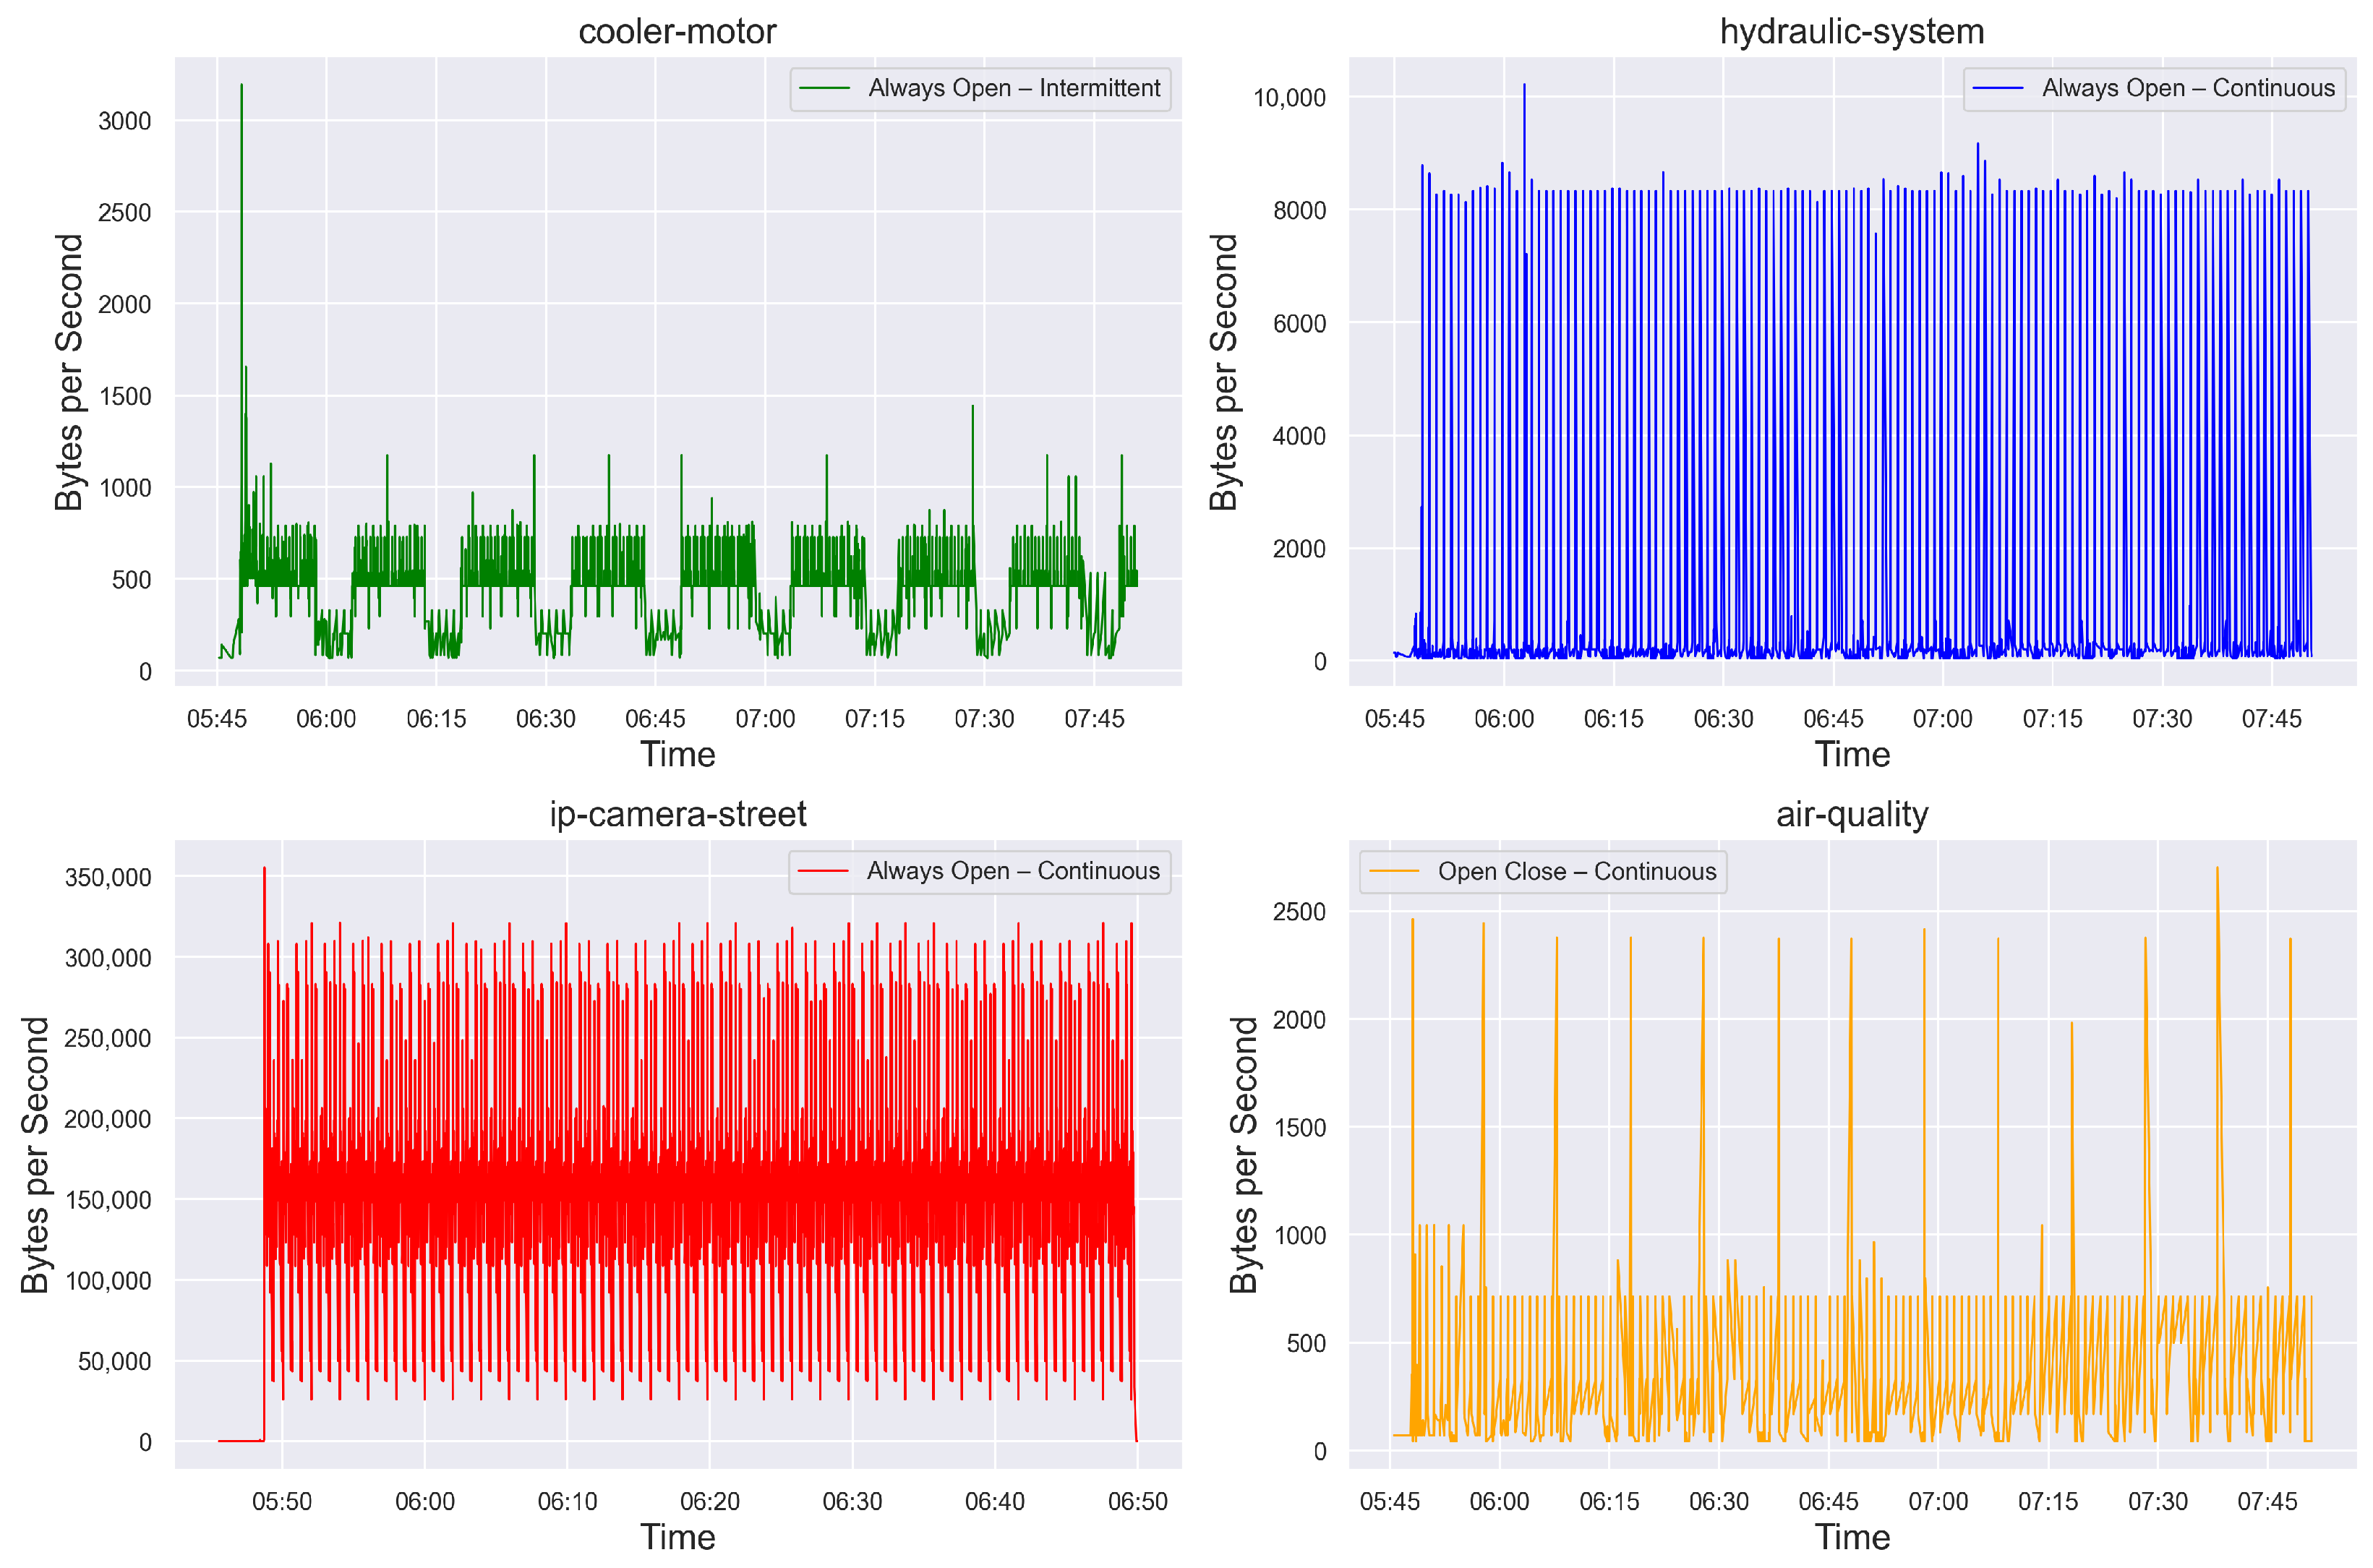
IoT devices transmit data based on specific behaviours. We characterise these profiles using two parameters: Transmission Mode and Transmission Periodicity.
- –
- Transmission Mode: In the Open-close mode, a device establishes a new connection with the cloud each time it needs to send telemetry data, transmits the data, and then closes the connection. In contrast, the Always-open mode involves the device opening a single, persistent connection with the cloud at the start and maintaining it by periodically sending telemetry data and keep-alive messages.
- –
- Transmission Periodicity: Continuous mode implies that the device transmits telemetry data at regular intervals without interruption. In the Intermittent mode, the device cycles between active and inactive periods. During active periods, data is transmitted similarly to the Continuous mode, whereas inactive periods only generate background traffic, with no telemetry payload.
These behavioural differences contribute to variability in traffic distributions across devices. As a result, the dataset exhibits heterogeneous and non-IID characteristics, which are relevant for evaluating intrusion detection systems under realistic deployment conditions.
Figure 2.
Heterogeneous network behaviours: Always-open—Continuous, Always-open—Intermittent, Open-close—Continuous, Open-close—Intermittent modes.
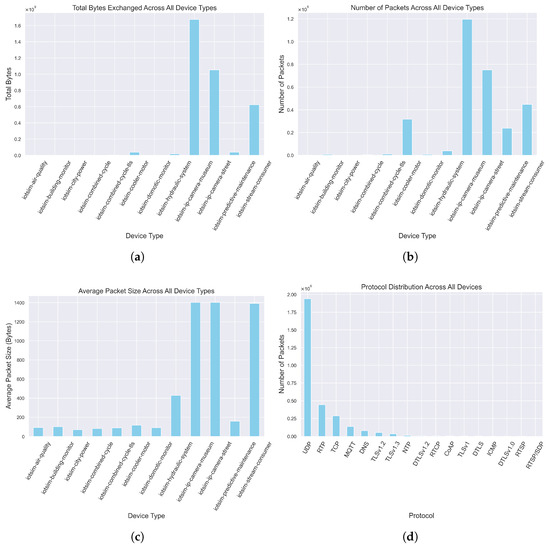
Figure 3.
Network traffic characteristics across the IoT device types: (a) number of packets generated by each device type; (b) total number of bytes exchanged by each device type; (c) average packet size for each device type; (d) distribution of network protocols across all devices.
2.5. Label Distribution
Table 4 summarises the distribution of instances across the aggregated dataset classes. The dataset is dominated by DoS traffic, followed by benign traffic. Other attack categories, including Network Scanning, Brute Force, Infection, and C&C Communication, represent a smaller proportion of the dataset. An important characteristic of the dataset is its class imbalance. In particular, DoS traffic represents the dominant malicious class, whereas early-stage attack phases such as Infection and C&C Communication account for a much smaller proportion of the records. This imbalance reflects the operational behaviour of the generated attack scenarios: volumetric attacks naturally produce a high number of packets, while infection and command-and-control activities are shorter and less frequent. Researchers using this dataset should therefore account for this imbalance during model development and evaluation. Possible mitigation strategies include under-sampling of majority classes, over-sampling of minority classes, and cost-sensitive learning.
Table 4.
Distribution of instances across aggregated dataset labels. Percentages are computed relative to the total number of samples.
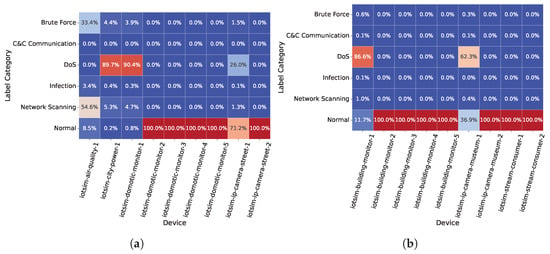
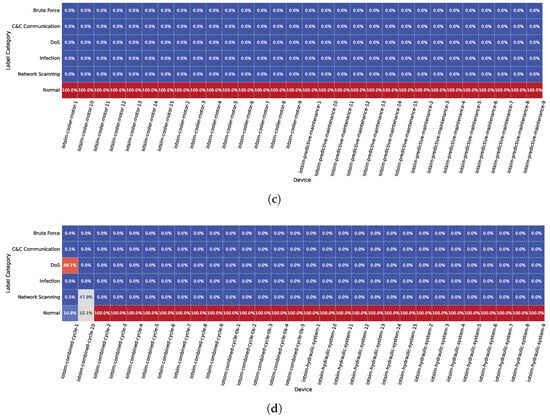
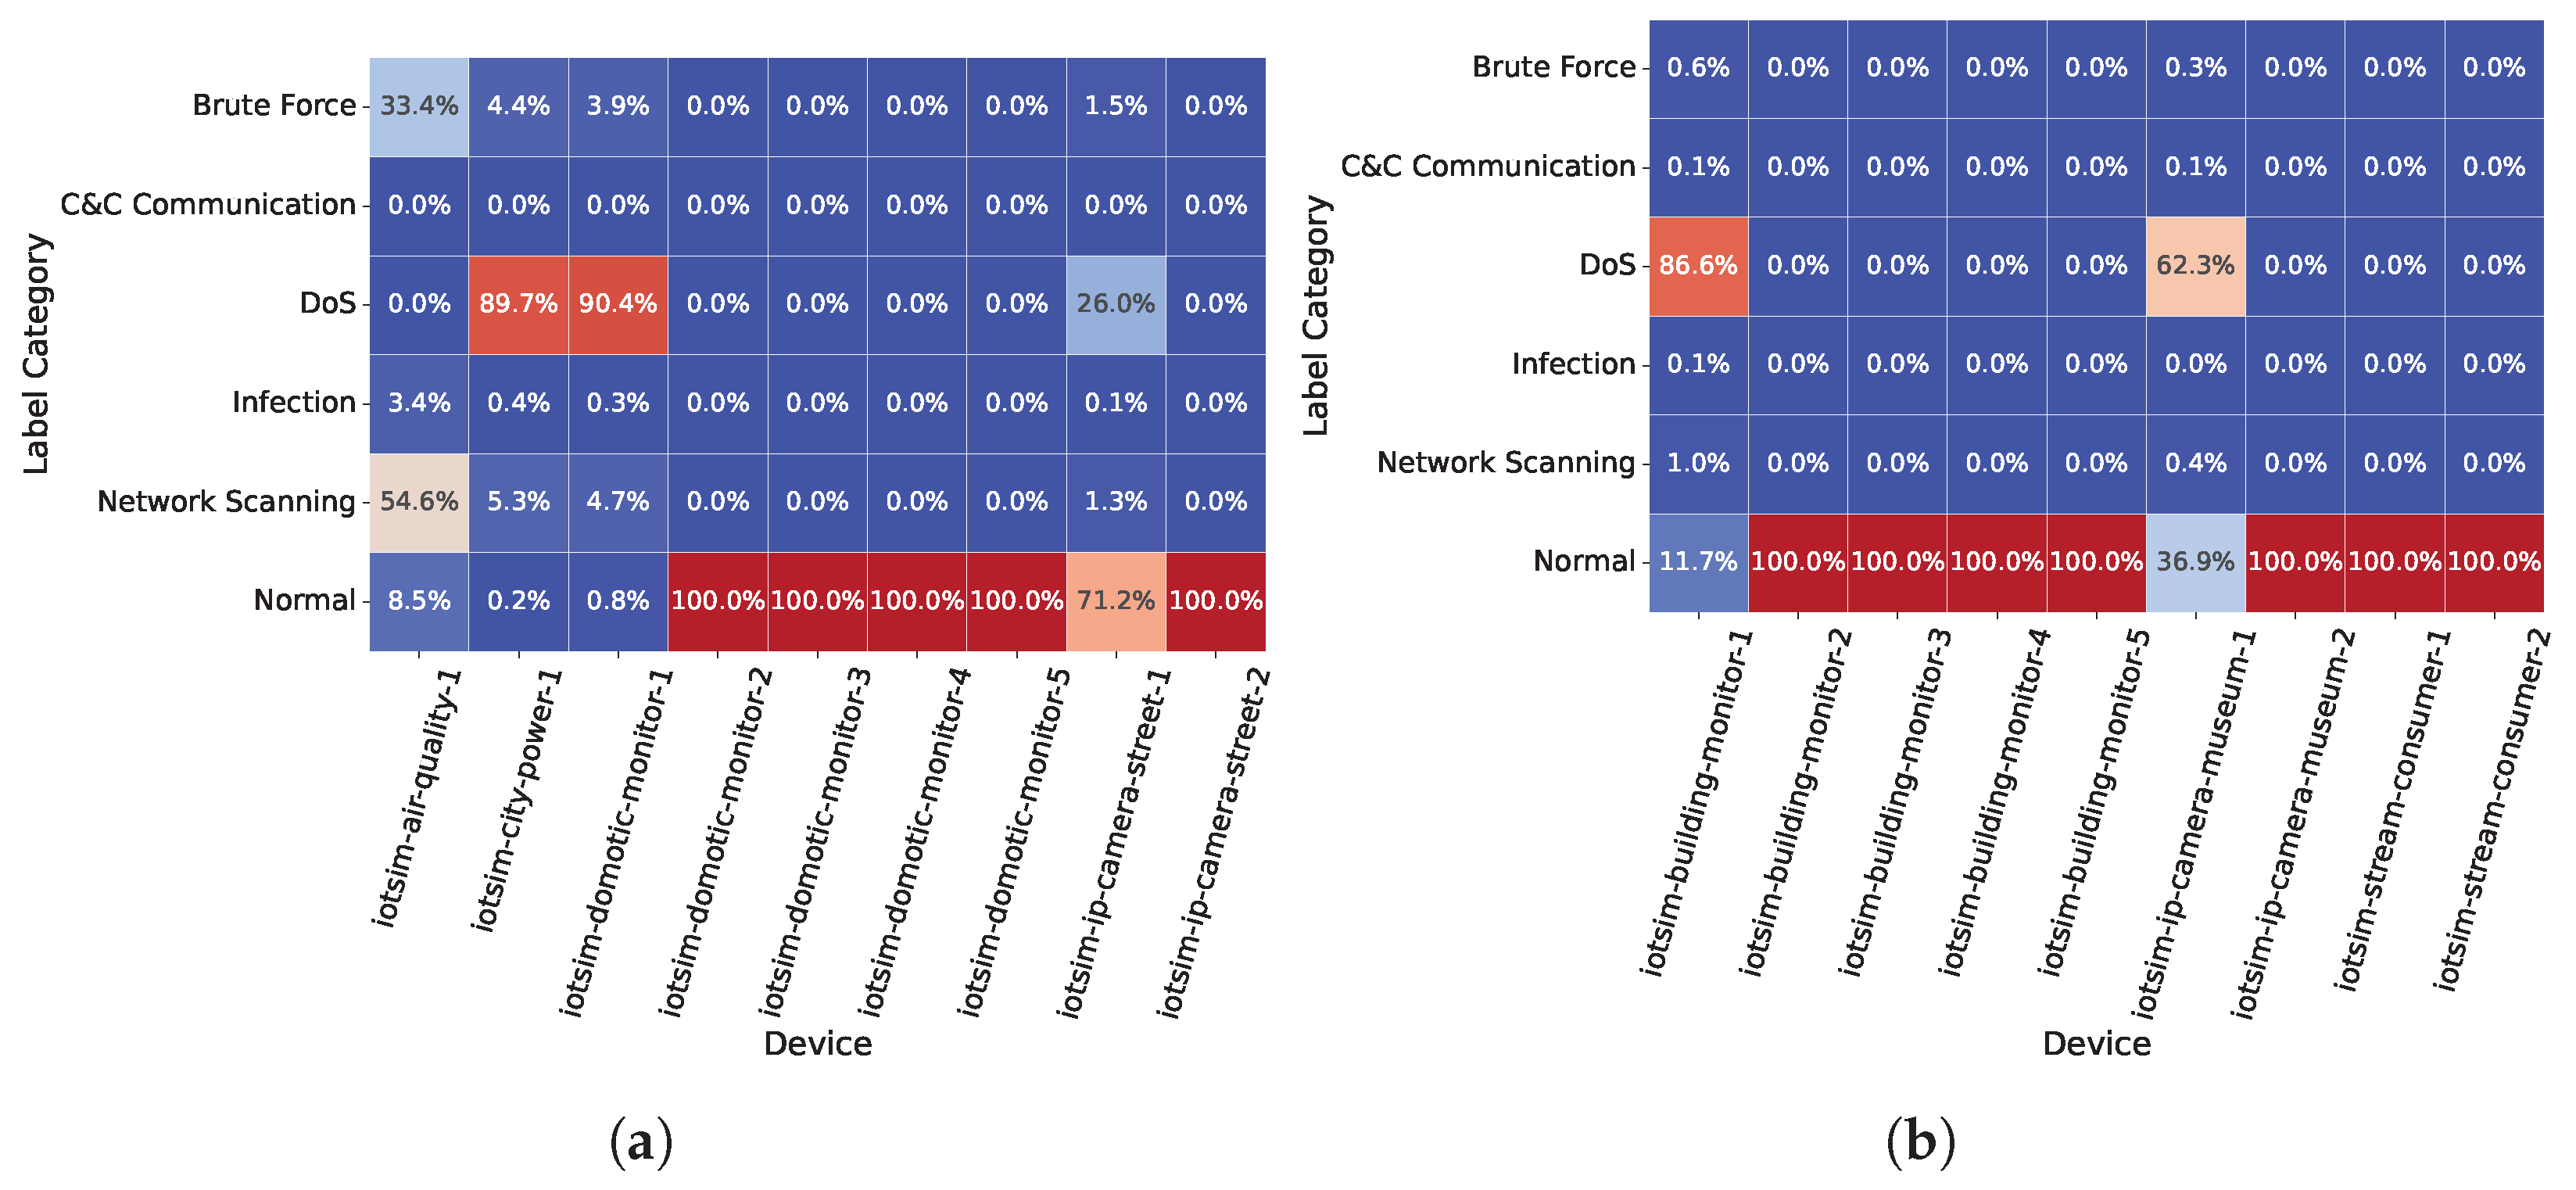
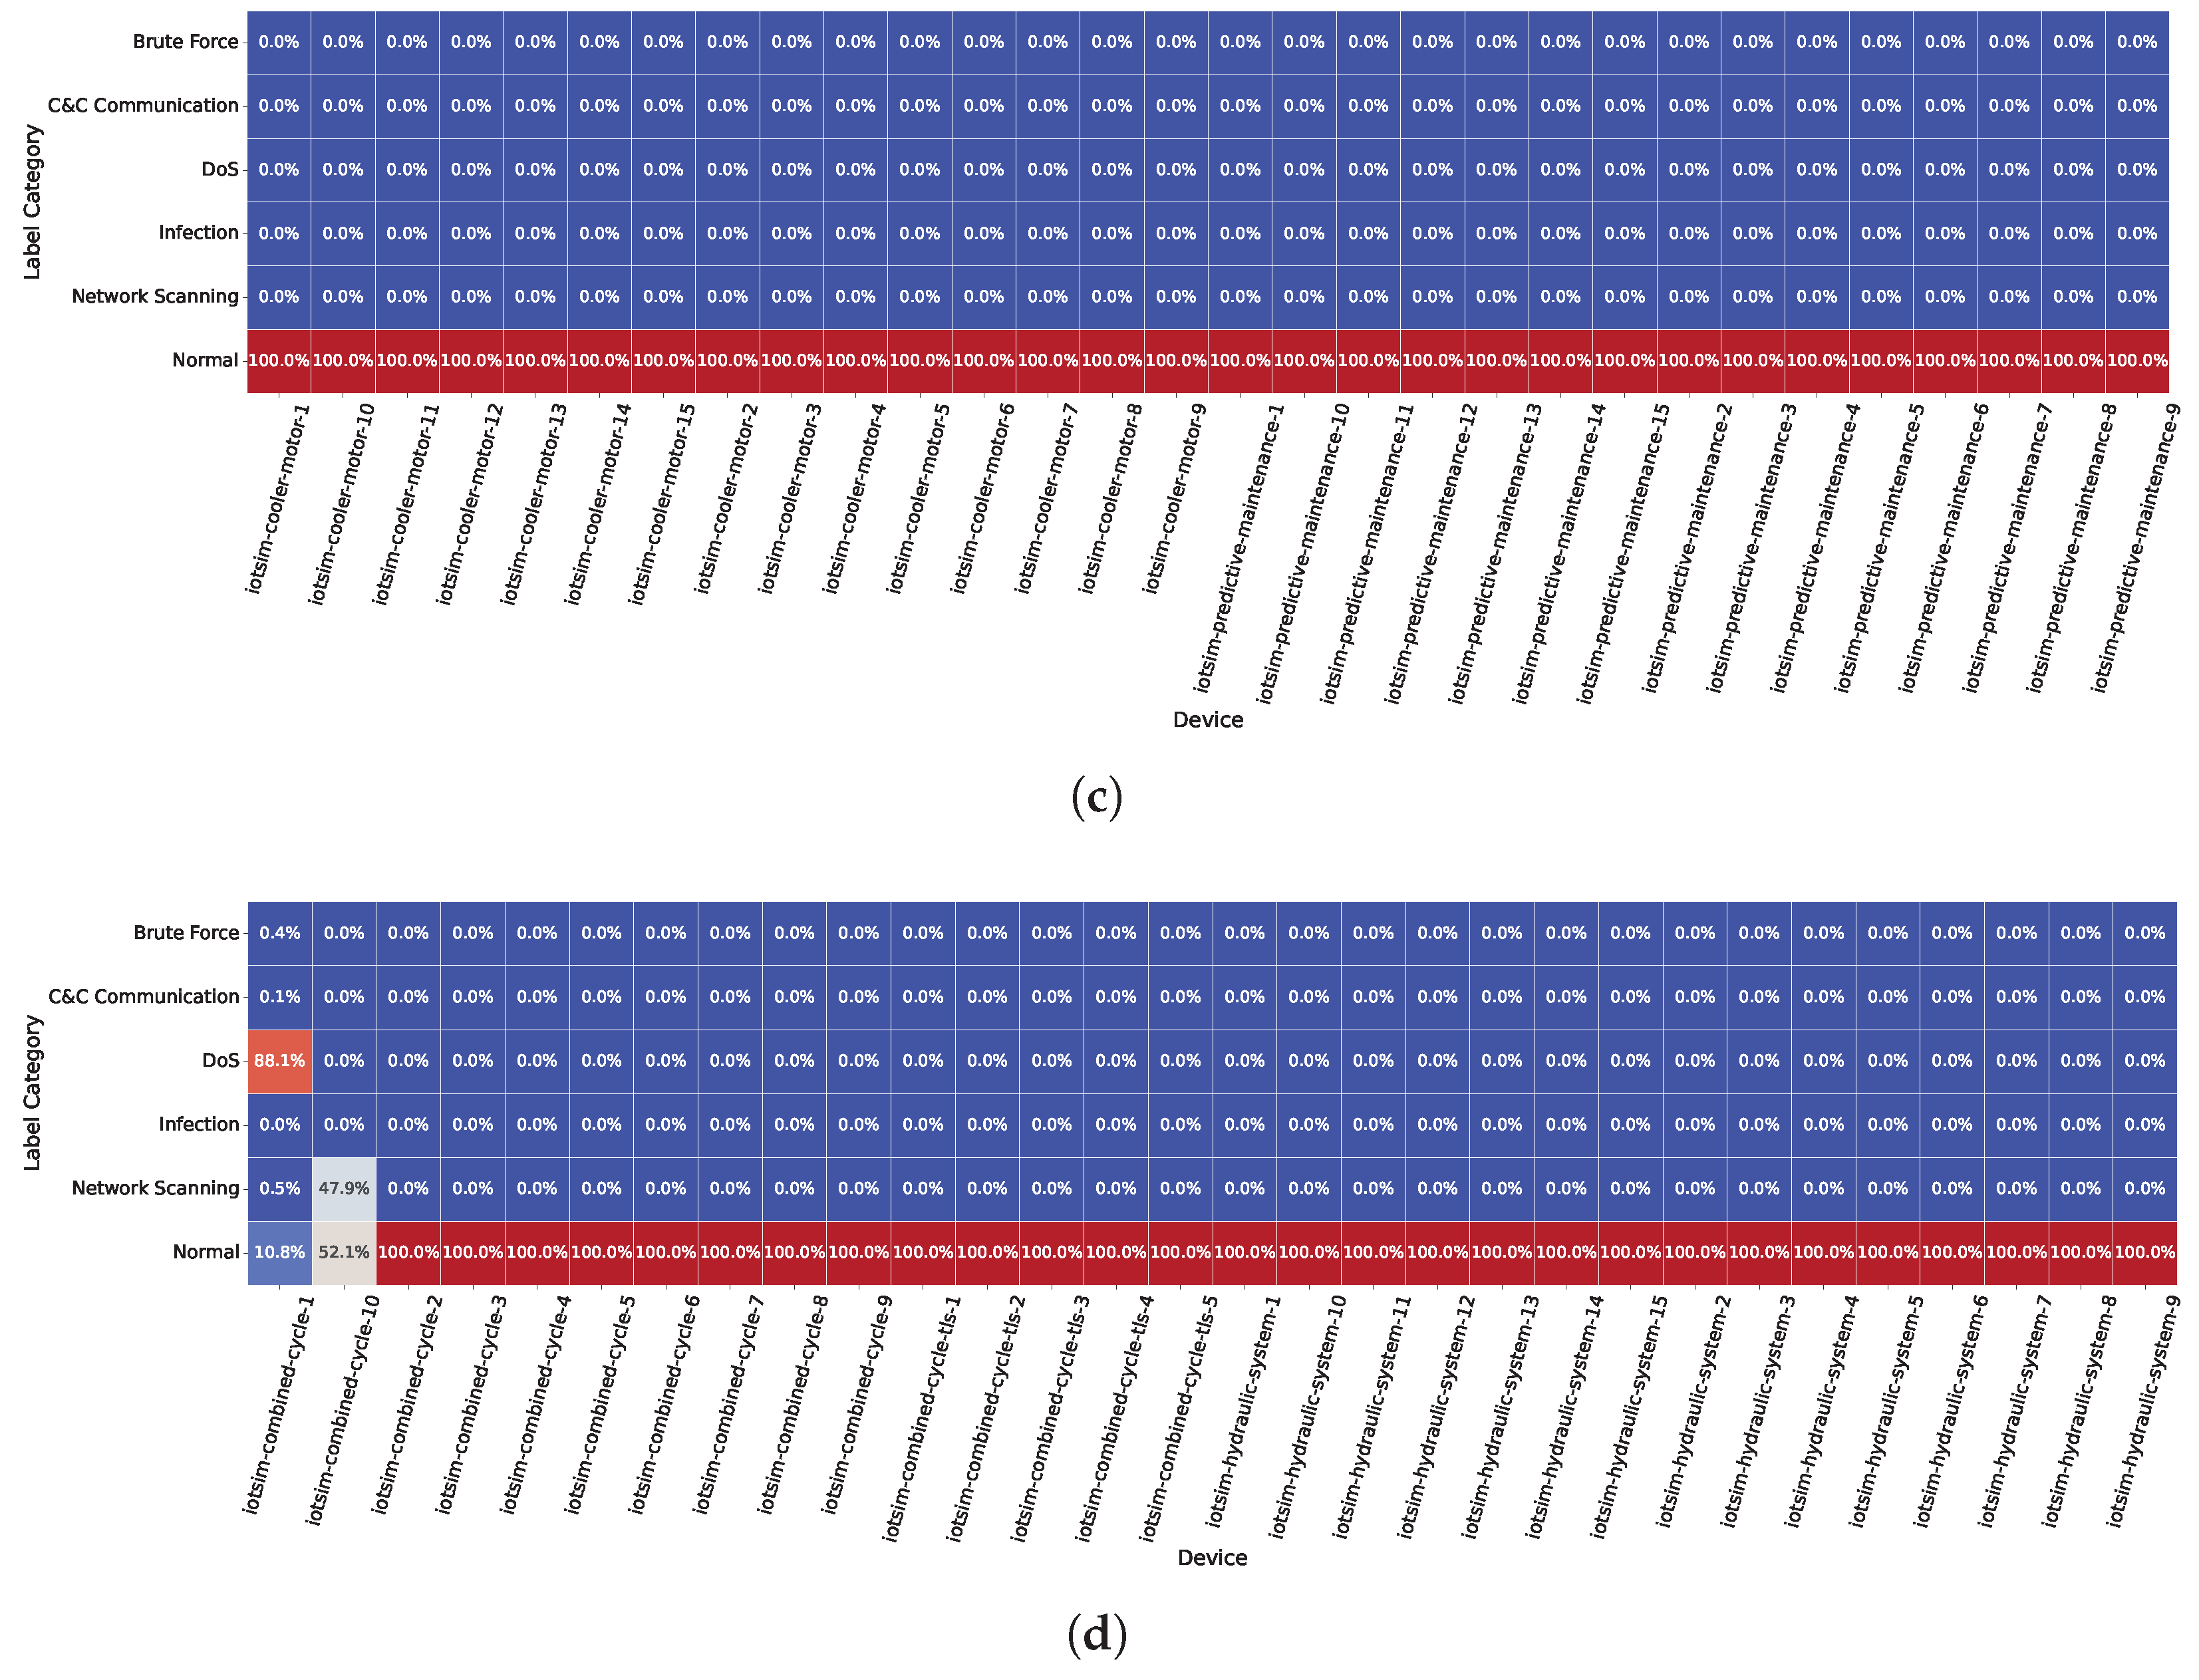
Figure 4 illustrates the per-device label distribution across the four network segments. The figure shows that the dataset is heterogeneous not only at the global class level, but also at the device level. Some devices contain only benign traffic, while others include different combinations of Network Scanning, Brute Force, Infection, DoS, and C&C Communication, depending on the attack scenarios executed in their corresponding segment. This distribution reflects the distributed nature of the dataset, where each device preserves its own local traffic profile rather than having its data derived from an artificially partitioned centralised dataset.
Figure 4.
Per-device label distribution across the four network segments: (a) label distribution in Network Segment 1; (b) label distribution in Network Segment 2; (c) label distribution in Network Segment 3; and (d) label distribution in Network Segment 4.
3. Methods
3.1. Testbed Overview and Network Structure
The dataset was generated using the open-source Gotham testbed [3], a virtualised smart city environment built on the GNS3 network emulator [5]. The testbed integrates heterogeneous edge nodes and cloud services to model a multi-zone urban deployment composed of residential, industrial, and public infrastructure segments. Each zone includes a mix of sensors, cameras, controllers, and embedded devices operating over protocols such as MQTT, CoAP, RTSP, DNS, and ICMP. This diversity of device types and protocol stacks reflects the variability typically observed in smart city deployments.
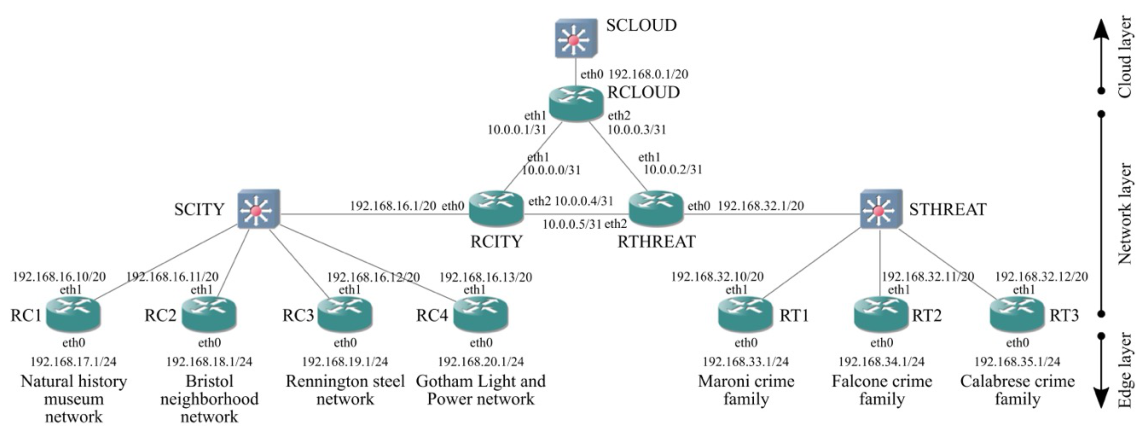
Figure 5 illustrates the high-level network topology of the testbed. The architecture is segmented into three primary networks—City, Cloud, and Threat—interconnected through 10 routers and 30 switches. The City network is further divided into four network segments, each representing a distinct operational area. These segments generate traffic patterns associated with different IoT applications, resulting in variability in communication behaviour across devices and network zones.
The configuration of the testbed is consistent across all experiments, ensuring that data collection was performed under controlled and reproducible conditions.
3.2. Threat Actors and Attack Scenarios
The testbed threat landscape was designed to emulate a range of attack scenarios commonly observed in IoT environments. We deployed three distinct threat actors orchestrating a series of attacks: (i) Mirai Botnet, (ii) Merlin, and (iii) Network Reconnaissance and Amplification. Each actor employed specific tools and techniques to execute their respective attacks across the network.
Figure 5.
High-level network architecture of the open-source Gotham testbed, illustrating the segmentation between city, cloud, and threat zones [3].
3.2.1. Mirai Botnet Attacks
The first threat actor emulated the Mirai malware ecosystem [6], a well-known IoT botnet that compromises vulnerable devices, recruits them into a botnet, and uses them to launch coordinated attacks. We utilised the open-source Mirai codebase [7] to reconstruct the full botnet architecture, including the C&C Server, Scan Listener, Loader, and Download Server. The attack scenario reproduced the main stages of the infection lifecycle, with the objective of automated propagation, credential compromise, C&C communication, and volumetric disruption. These stages produced network artefacts corresponding to the Network Scanning, Brute Force, Infection, C&C Communication, and DoS labels in the dataset.
- –
- Network Scanning: Mirai bots continuously scanned the network for open Telnet ports using TCP SYN packets.
- –
- Brute Forcing: If a bot found an open Telnet port, it attempted a dictionary-based brute-force attack with a default IoT credential list.
- –
- Mirai C&C Communication: Continuous keep-alive and command traffic between bots and the C&C server.
- –
- Reporting: Successful credentials were reported to the Scan Listener.
- –
- Ingress Tool Transfer: The Loader node connected to vulnerable nodes, downloaded the malicious binary, and executed it, effectively recruiting each node into the botnet.
- –
- Remote Command Execution: The C&C Server issued commands to bots to launch specific attack vectors.
- –
- DoS Attacks: The botnet executed volumetric attacks, including UDP plain floods, DNS water torture, and TCP SYN/ACK floods, in 10-s bursts.
3.2.2. Merlin-Based Attacks
The second threat actor leveraged the Merlin cross-platform C&C server [8], a post-exploitation command-and-control framework that enables remote agent communication and command execution. Merlin agents and hping3 were used to generate C&C and DoS traffic. The Merlin C&C channel was configured to support multiple HTTP versions, namely HTTP/1.1, HTTP/2, and HTTP/3, enabling remote command execution on compromised devices. This scenario generated traffic artefacts corresponding to C&C Communication, Ingress Tool Transfer, Remote Command Execution, and DoS activity.
- –
- Merlin C&C Communication: Periodic communication between Merlin agents and the C&C server over HTTP-based channels. Unlike Mirai’s simple TCP beaconing, this traffic used standard web protocols to reduce the effectiveness of simple port- or protocol-based filtering rules.
- –
- Ingress Tool Transfer: The C&C channel was used to transfer the hping3 packet generator to compromised devices.
- –
- Remote Command Execution: Commands from the Merlin C&C server triggered attacks on demand.
- –
- DoS Attacks: The compromised nodes executed high-velocity flooding attacks (ICMP echo request, UDP, TCP SYN/ACK) at rates exceeding 5000 packets per second with 1-millisecond intervals to stress network bandwidth.
3.2.3. Network Reconnaissance and Amplification Attacks
The third threat actor modelled pre-exploitation reconnaissance and amplification abuse using Nmap, Masscan, and AMP-Research [9].
- –
- Network-Wide Scanning: Network-wide scanning was conducted with Masscan for specific TCP ports at varying rates (100, 1000 and 10,000 packets/s), while comprehensive UDP port scanning was conducted using Nmap.
- –
- CoAP Amplification Attack: The attacker sent small spoofed requests to a CoAP-enabled device for 15 s, causing it to reply with significantly larger responses directed at a victim node. This reflection attack emulates a common vector for amplifying DDoS bandwidth consumption in IoT networks.
3.3. Data Collection
Data acquisition was conducted in a fully distributed manner to reflect edge-based collection scenarios. Instead of monitoring network traffic at central aggregation points, we captured network traffic at the virtual network interface connecting each IoT device to its respective gateway. This design preserved device-level traffic visibility and maintained non-IID characteristics across nodes, making the dataset inherently suitable for IDS and Federated Learning (FL) research.
We utilised the tcpdump utility to capture full-packet network traffic and configured it for continuous acquisition without sampling. All captures were stored in raw PCAP format to prevent any loss of header information or payload data. This process resulted in separate PCAP files for each of the 78 devices during every distinct network event. To maintain temporal consistency, all devices and infrastructure components were synchronised via an Network Time Protocol (NTP) server, ensuring consistent timestamps across distributed capture points.
To guarantee the integrity of ground-truth attribution, the data collection process followed a two-phase acquisition protocol:
- –
- Phase 1. Benign Baseline: Initially, the testbed operated without adversarial activity for a duration of approximately two hours. This phase captured routine device-to-cloud communications, such as MQTT keep-alive, CoAP sensor readings, RTSP streaming, and DNS queries. This phase established a behavioural baseline used to characterise legitimate IoT traffic profiles and normal operational patterns.
- –
- Phase 2. Adversarial Scenarios: Subsequently, specific attack scenarios (as detailed in Section 3.2) were executed sequentially. Each attack window lasted between 1.0 and 1.5 h. By running attacks sequentially, we prevented the overlapping of attack signatures, thereby simplifying the ground-truth attribution and ensuring that specific network artefacts could be directly correlated with a single attack type.
The resulting raw data consists of PCAP files hierarchically organised by device identifier and capture phase. This organisation supports traceability between raw traffic and experimental conditions, and facilitates reproducible data processing and extension of the dataset.
3.4. Feature Extraction
Following the data collection phase, the raw PCAP files were processed to extract structured packet-level features. An automated Python (version 3.11.2) script iterated through the directory of raw captures and invoked tshark, a network protocol analyser, to extract selected fields from the frame, network, and transport layers. This extraction process converted the hierarchical packet data into device-specific tabular CSV files.
To ensure dataset consistency, the extraction logic applied a strict protocol filter. The pipeline retained only packets containing valid IP headers (IPv4/IPv6) and transport-layer headers (TCP/UDP) where the IoT device was a direct participant. Consequently, lower-layer control frames (e.g., ARP), extraneous broadcast noise, and malformed packets were automatically discarded. This ensured that the resulting dataset reflects a consistent and semantically valid packet-level representation suitable for network security analysis.
The resulting CSV files contain the 22 extracted features described in detail in Table 2. The extracted features were selected to provide a reproducible packet-level representation of the captured traffic while avoiding model-specific preprocessing. The feature set focuses on fields that can be directly extracted from raw PCAP files using standard packet-analysis tools and that describe frame-level, network-layer, and transport-layer properties. This selection captures information commonly used in network security analysis and intrusion detection while remaining applicable across heterogeneous IoT protocols and attack traffic. No normalisation, encoding, aggregation, or feature selection is applied to the released CSV files, allowing researchers to adapt the representation to their own workflows.
3.5. Data Labelling
The labelling process established ground-truth by assigning each network packet to either a benign or an attack class label. Unlike real-world datasets, where labelling may rely on heuristics or manual inspection, we developed a custom extraction pipeline to derive deterministic ground-truth from the testbed orchestration logs. These logs recorded the start and end timestamps, attack type, and attacker IP address for each executed attack scenario.
Ground-truth labels were generated using a deterministic, rule-based pipeline implemented in Python. This pipeline synchronised the processed CSV traffic data with the metadata logs and applied distinct logic depending on the capture phase:
- Benign Phase Labelling: All traffic captured during the designated “Benign Phase” was automatically labelled as Benign, as no attacks were active during this interval.
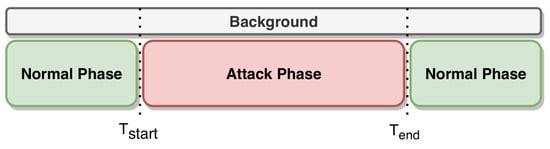
- Attack Phase Labelling: During attack intervals, packets were cross-referenced against the metadata. To ensure precise attribution and avoid mislabelling background traffic, a packet was labelled as malicious only if it satisfied two simultaneous conditions:
- Temporal Correlation: The packet’s timestamp fell within the active window of a logged attack scenario.
- Flow Verification: The packet’s flow characteristics were consistent with the corresponding attack scenario, including the expected attacker and victim IP addresses, communication ports, and traffic direction.
Packets failing to meet both conditions, even during an attack phase, were retained as Benign background traffic.
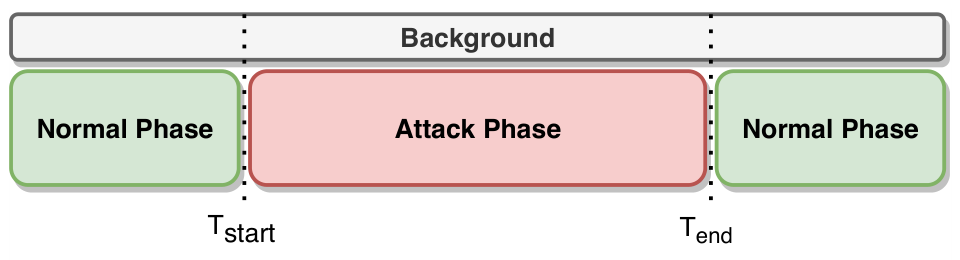
Figure 6 illustrates the temporal alignment mechanism used to associate packets with attack intervals.
Figure 6.
Timing-synchronised labelling strategy.
The output of this methodology is a comprehensive set of CSV files containing network packets labelled with extracted features. These files facilitate the development of ML and DL-based IDSs capable of operating in both centralised and distributed learning settings.
3.6. Data Validation
The technical quality and reliability of the dataset were ensured through controlled data generation, deterministic labelling, and reproducible processing steps. Ground-truth labels were derived from testbed orchestration logs containing precise timestamps, attack types, and attacker identifiers. Furthermore, each raw PCAP file was associated with a specific IoT device, capture interface, and experimental scenario, ensuring traceability between the generated traffic and the corresponding testbed configuration.
The labelling process combined temporal alignment with flow-level verification. Temporal alignment was used to match packet timestamps with the execution windows recorded in the orchestration logs, while flow-level verification checked that the observed source and destination addresses, ports, and communication direction were consistent with the expected attacker and victim for each scenario. This process enabled accurate attribution of malicious traffic while preserving benign background activity occurring during the same capture period.
Temporal consistency across distributed capture points was maintained through network-wide synchronisation using an NTP server, ensuring that packet timestamps were comparable across devices. The consistency between raw PCAP files and processed CSV files was also checked by preserving packet-level correspondence and applying the same feature schema across all device-specific captures. Finally, data quality was improved by filtering out malformed packets and non-IP traffic. Only packets containing valid IP (IPv4/IPv6) and transport-layer (TCP/UDP) headers were retained, resulting in a consistent and semantically valid representation of network activity.
3.7. Reproducibility
To ensure the consistency of the emulation environment, all experiments were conducted using an AMD Ryzen™ 7 5800H (8-core, 16-thread) with 32 GB of RAM, running Ubuntu 24.04 LTS. The complete data generation, feature extraction, and labelling scripts are publicly available on GitHub at https://github.com/othmbela/gotham-network-packet-labeller (accessed on 18 April 2026). This repository includes instructions and configurations to facilitate use and customisation. Researchers can use these scripts to reproduce the dataset end-to-end or adapt the workflow to generate customised datasets from their own PCAP traces.
4. User Notes
To support practical use of the dataset, we provide an example implementation of an intrusion detection model trained under a federated learning setup. In this example, each IoT device is treated as an independent data source, and model training is performed locally before aggregating updates at a central server. The implementation includes data loading, preprocessing, and model training steps, and is available as Jupyter notebooks in the public repository1. These notebooks can be executed in a Google Colab environment and serve as a practical starting point for experimenting with the dataset. This example is intended for demonstration purposes only. Users are encouraged to adapt the workflow, explore alternative models, and design evaluation strategies suited to their specific research objectives.
5. Limitations
Although the Gotham testbed provides a controlled, reproducible, and scalable environment for generating distributed IoT network traffic, the use of virtualisation also introduces limitations. The current dataset does not explicitly model all phenomena observed in physical IoT deployments, such as hardware-specific jitter, wireless channel impairments, physical-layer anomalies, sensor noise, or environmental interference. These factors may affect traffic timing, packet loss, latency, and protocol behaviour in real deployments. Therefore, the dataset should be viewed as a reproducible benchmark for studying distributed network security and traffic analysis under heterogeneous and non-IID traffic distributions, rather than as a complete substitute for physical testbed measurements. Complementary validation on physical or hybrid deployments remains necessary when assessing robustness under deployment-specific conditions.
6. Conclusions
This paper presented a device-level IoT network traffic dataset generated using the open-source Gotham testbed. The dataset contains traffic from 78 heterogeneous IoT devices operating across various protocols and includes benign traffic and multiple attack classes. Unlike datasets collected only at centralised monitoring points, the presented dataset captures traffic directly at each device interface, preserving local traffic distributions and non-IID characteristics. The dataset is released in both raw PCAP and processed CSV formats, with deterministic labels derived from orchestration logs using temporal alignment and flow-level verification.
The dataset is intended to support reproducible research on IoT network security, traffic analysis, and learning under heterogeneous data distributions. Its device-level organisation enables researchers to evaluate centralised, distributed, and federated learning methods without relying on artificial partitioning of centralised data. Future extensions will consider additional device types, attack scenarios, hybrid physical–virtual deployments, and further empirical baselines for distributed network security evaluation.
Author Contributions
Conceptualisation, O.B.; methodology, O.B. and T.S.; software, O.B.; data curation, O.B.; validation, T.S.; writing—original draft, O.B.; writing—review and editing, T.S., E.A., O.R., P.C. and A.K.; supervision, T.S. All authors have read and agreed to the published version of the manuscript.
Funding
This research received no external funding.
Institutional Review Board Statement
Not applicable.
Informed Consent Statement
Not applicable.
Data Availability Statement
Dataset is available online at https://doi.org/10.5281/zenodo.14502760 (accessed on 18 April 2026).
Conflicts of Interest
Pietro Carnelli and Aftab Khan were employed by Toshiba Europe Ltd. Othmane Belarbi’s PhD studentship was part-funded by Toshiba Europe Ltd. The remaining authors declare that the research was conducted in the absence of any commercial or financial relationships that could be construed as a potential conflict of interest.
Abbreviations
The following abbreviations are used in this manuscript:
| IoT | Internet of Things |
| PCAP | Packet Capture |
| DoS | Denial of Service |
| C&C | Command and Control |
| CSV | Comma Separated Values |
| FL | Federated Learning |
| LAN | Local Area Network |
| IDS | Intrusion Detection System |
| AI | Artificial Intelligence |
| ML | Machine Learning |
| DL | Deep Learning |
| DNN | Deep Neural Network |
| DT | Decision Tree |
| RF | Random Forest |
| SVM | Support Vector Machine |
| kNN | k-Nearest Neighbors |
| NTP | Network Time Protocol |
Note
| 1 | https://github.com/othmbela/gotham-network-packet-labeller (accessed on 18 April 2026). |
References
- Alex, C.; Creado, G.; Almobaideen, W.; Alghanam, O.A.; Saadeh, M. A Comprehensive Survey for IoT Security Datasets Taxonomy, Classification and Machine Learning Mechanisms. Comput. Secur. 2023, 132, 103283. [Google Scholar] [CrossRef] [Scilit]
- Nazir, A.; He, J.; Zhu, N.; Wajahat, A.; Ma, X.; Ullah, F.; Qureshi, S.; Pathan, M.S. Advancing IoT security: A systematic review of machine learning approaches for the detection of IoT botnets. J. King Saud Univ.-Comput. Inf. Sci. 2023, 35, 101820. [Google Scholar] [CrossRef] [Scilit]
- Sáez-de Cámara, X.; Flores, J.L.; Arellano, C.; Urbieta, A.; Zurutuza, U. Gotham Testbed: A Reproducible IoT Testbed for Security Experiments and Dataset Generation. IEEE Trans. Dependable Secur. Comput. 2024, 21, 186–203. [Google Scholar] [CrossRef] [Scilit]
- Belarbi, O.; Spyridopoulos, T.; Anthi, E.; Rana, O.; Carnelli, P.; Khan, A. A Device-Level IoT Network Traffic Dataset with Distributed Capture and Non-IID Characteristics. Zenodo 2025. [Google Scholar] [CrossRef]
- Grossmann, J. Graphical Network Simulator 3. 2024. Available online: https://www.gns3.com (accessed on 7 December 2024).
- Antonakakis, M.; April, T.; Bailey, M.; Bernhard, M.; Bursztein, E.; Cochran, J.; Durumeric, Z.; Halderman, J.A.; Invernizzi, L.; Kallitsis, M.; et al. Understanding the Mirai Botnet. In Proceedings of the 26th USENIX Security Symposium (USENIX Security 17), Vancouver, BC, USA, 16–18 August 2017; pp. 1093–1110. Available online: https://www.usenix.org/conference/usenixsecurity17/technical-sessions/presentation/antonakakis (accessed on 7 December 2024).
- Gamblin, J. Leaked Mirai Source Code for Research/IOC Development Purposes. 2024. Available online: https://github.com/jgamblin/Mirai-Source-Code (accessed on 7 December 2024).
- Tuyl, R.V. Merlin is a Cross-Platform Post-Exploitation HTTP/2 Command & Control Server and Agent Written in Golang. 2024. Available online: https://github.com/Ne0nd0g/merlin (accessed on 7 December 2024).
- Phenomite. Research on UDP/TCP Amplification Vectors, Payloads and Mitigations Against Their Use in DDoS Attacks. 2024. Available online: https://github.com/Phenomite/AMP-Research (accessed on 7 December 2024).

Disclaimer/Publisher’s Note: The statements, opinions and data contained in all publications are solely those of the individual author(s) and contributor(s) and not of MDPI and/or the editor(s). MDPI and/or the editor(s) disclaim responsibility for any injury to people or property resulting from any ideas, methods, instructions or products referred to in the content. |
© 2026 by the authors. Licensee MDPI, Basel, Switzerland. This article is an open access article distributed under the terms and conditions of the Creative Commons Attribution (CC BY) license.