A Multi-Metric NDVI-Derived Dataset of Vegetation Dynamics and Land Surface Phenology in Southern and Central Europe (1982–2022)



Abstract
1. Summary
2. Data Description
- 01_Long_term_Monthly_Mean_NDVI_1982_2022/This component contains 12 GeoTIFF files representing long-term monthly mean NDVI climatologies computed over the entire 1982–2022 period.Contents: 12 GeoTIFFs (one per month).Values: NDVI (dimensionless).Naming convention: Long_term_NDVI_monthlymean_1982_2022_MM.tif, where MM indicates the month from 01 to 12.
- 02_Decadal_Monthly_Mean_NDVI/Contents: 48 GeoTIFFs organized in four decadal sub-folders:NDVI_monthlymean_1982_1992/,NDVI_monthlymean_1993_2002/,NDVI_monthlymean_2003_2012/,and NDVI_monthlymean_2013_2022/.Each period includes 12 monthly composites derived from temporally averaged NDVI values.Values: NDVI (dimensionless).Naming convention: NDVI_monthlymean_YYYY_YYYY_MM.tif, where YYYY_YYYY indicates the multi-year period and MM indicates the month.
- 03_Phenological_Clusters_Map/A single GeoTIFF raster mapping the five eco-phenological regions characterized by similar seasonal NDVI dynamics derived from K-means clustering of long-term NDVI seasonal profiles.Contents: 1 GeoTIFFName: NDVI_phenological_clusters_k5_Europe.tifValues: Categorical integers from 1 to 5, representing eco-phenological regions.
- 04_Land_Surface_Phenology_Metrics_and_Shifts/
- -
- 4.1_LSP_Metrics:
This sub-component includes 16 GeoTIFF layers representing phenological metrics computed for four decadal periods. Metrics include: Start of Season (SOS), Peak of Season (POS), End of Season (EOS), Length of Season (LOS).Content: 16 GeoTIFFs (SOS, POS, EOS, LOS for the four decadal periods).Naming convention: GIMMS_NDVI_<METRIC>_<THRESHOLD>_<YYYY_YYYY>_Europe.tif.SOS, POS, and EOS values represent month of the year from 1 to 12.LOS values represent the number of months.Thresholds: 20% for SOS; 30% for EOS/LOS. No threshold suffix is included for POS, as it corresponds to the annual maximum NDVI.- -
- 4.2_Phenological_Shifts:
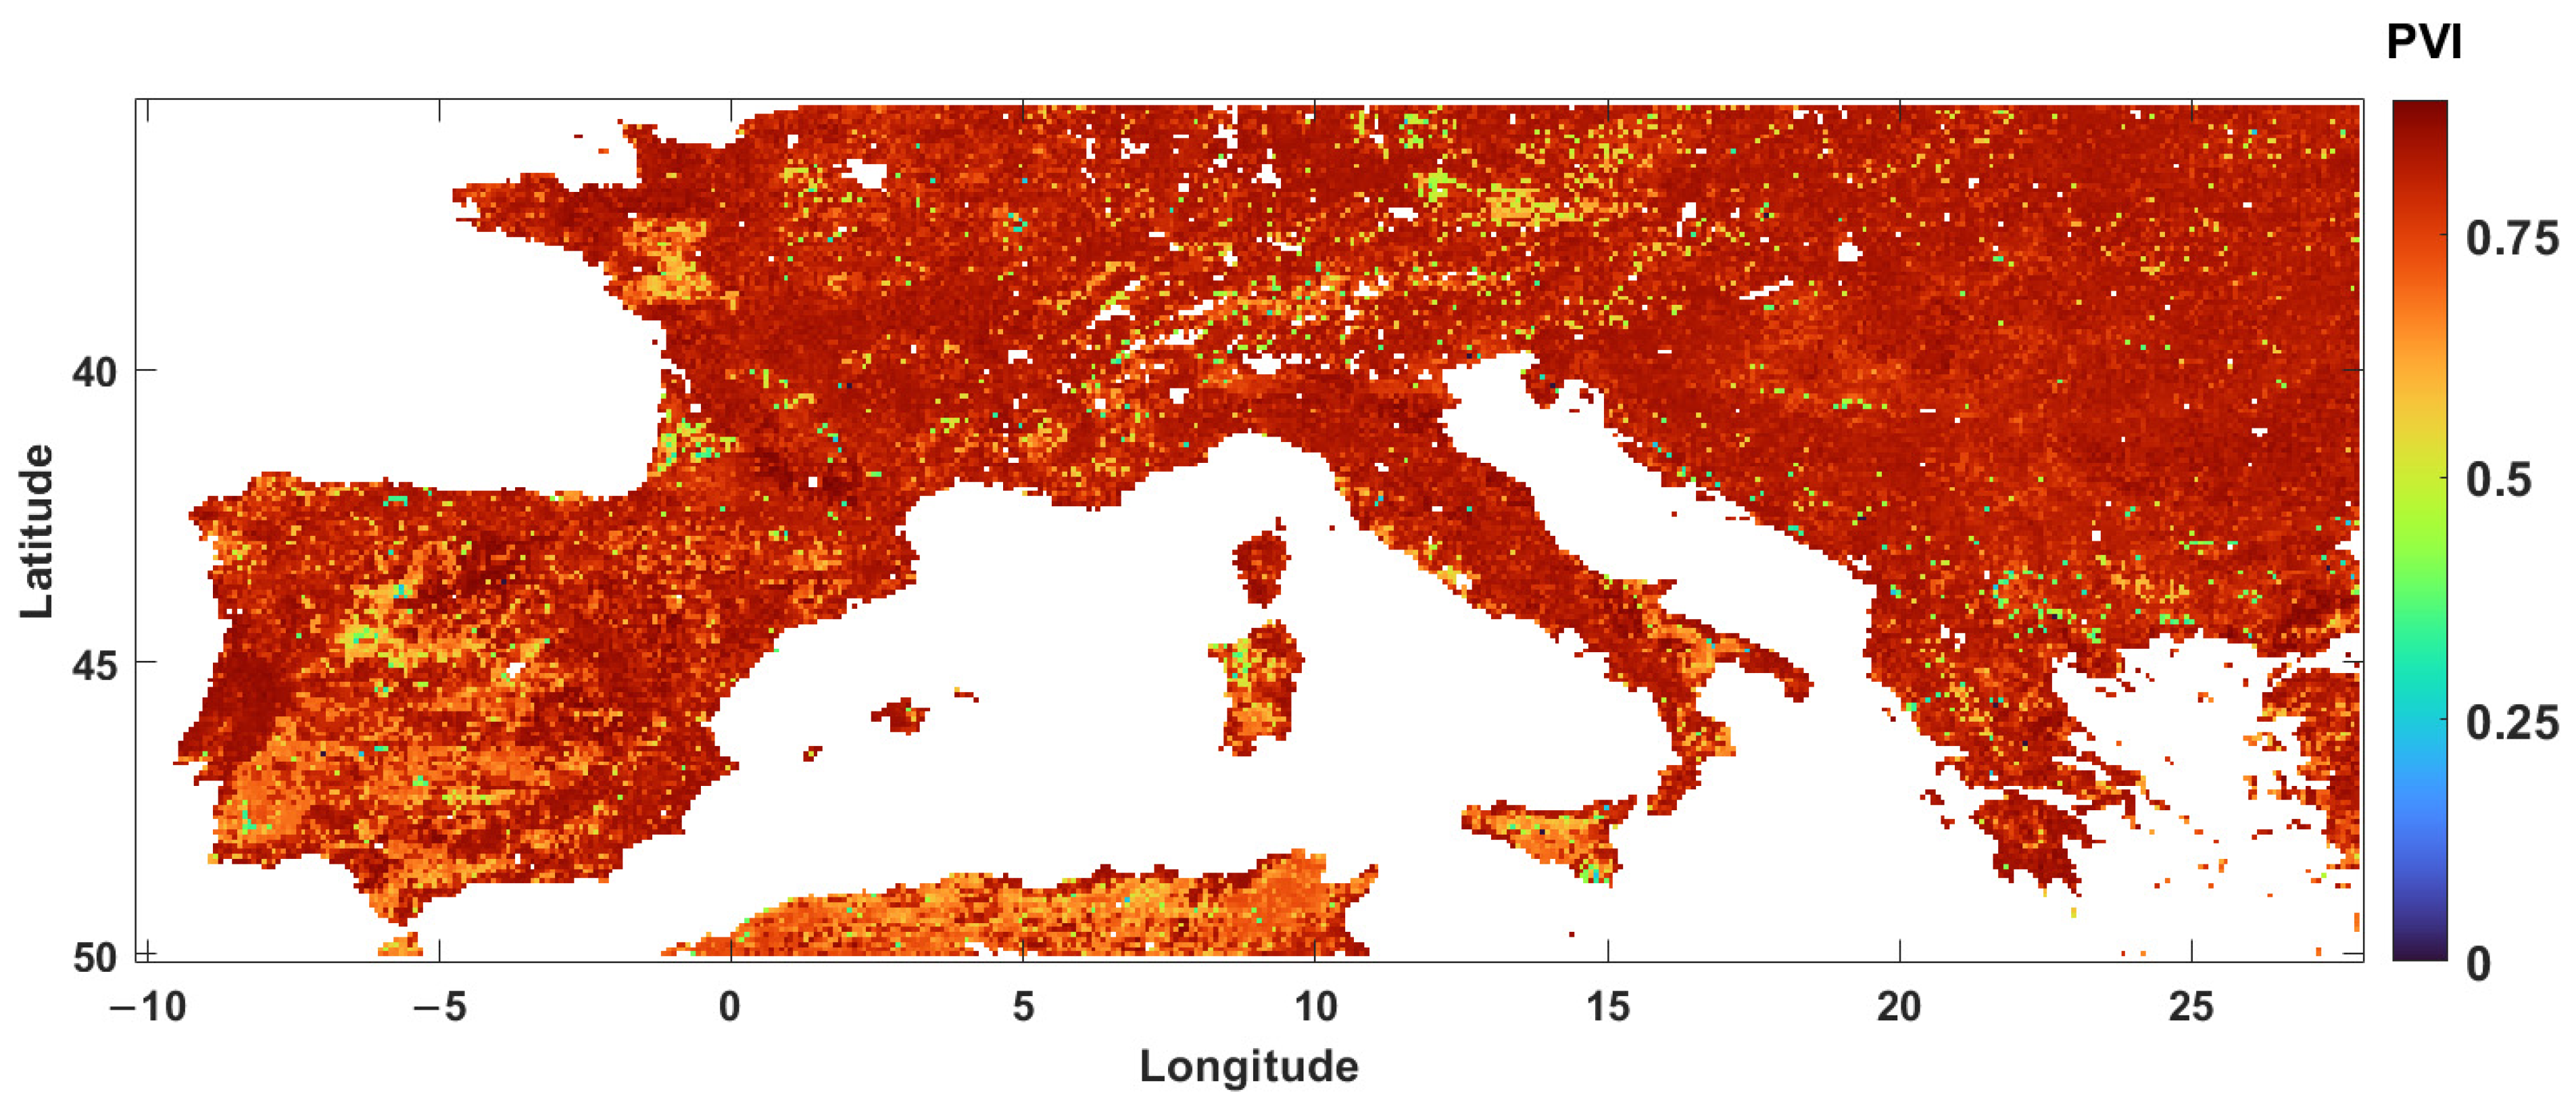
Content: 4 GeoTIFF files showing inter-decadal differences between the first decade, 1982–1992, and the last decade, 2013–2022. These layers quantify long-term shifts in phenological timing.Values: signed monthly differences (−6 to +5 months)Naming convention: GIMMS_NDVI_delta_<METRIC>_<THRESHOLD>_2013_2022_minus_1982_1992_Europe.tif.Values represent the signed monthly difference (ranging from −6 to +5 months), computed using a cyclic difference approach to correctly account for transitions across the calendar-year boundary. - 05_Phenology_Variability_Index_PVI/The Phenology Variability Index (PVI) is derived from variability in SOS, POS, and EOS across ten four-year intervals.Contents: 1 GeoTIFFName: NDVI_Phenology_Variability_Index_PVI_Europe.tifValues: Dimensionless index in the range [0–1). Values ≥ 0.5 indicate higher phenological variability. A representative spatial distribution of the PVI across the study area is shown in Figure 1.
- 06_Mann_Kendall_Theil_Sen_Trend_Analysis/Contents: 1 CSV file following RFC 4180 standard.Name: MK_TheilSen_results.csvColumns: Cluster (C1–C5), Month (Jan–Dec), SenSlope (NDVI units/year), p_value (significance), N (observations).Rows: The table contains a header row of column names followed by 60 data rows, corresponding to all combinations of the five eco-phenological clusters (C1–C5) and the twelve calendar months (January–December).This table provides a complete statistical characterization of monthly NDVI trends aggregated at cluster level.
- Root Files:README.md: Comprehensive guide to the dataset structure, file content, nomenclature, and technical specifications.
3. Methods
3.1. Data Acquisition and Pre-Processing
- Spatial Clipping and Geo-referencing: Global rasters were clipped to the Southern and Central European study area (10° W–28° E; 35° N–50° N). The study area was limited to 35–50° N, where data completeness and NDVI reliability are more suitable for long-term phenological analyses, while reducing the influence of persistent snow cover and prolonged winter data gaps at higher latitudes. Spatial referencing information was extracted from the source files to ensure that all derived products maintain the original spatial alignment and the WGS84 (EPSG:4326) geographic coordinate system.
- Bit-level Quality Control (QC): A multi-criteria filtering protocol was applied by deconstructing the three-digit quality flag provided in the auxiliary band of the PKU GIMMS data. For each pixel, the flag value was decomposed into its three functional components: the consolidation method, the GIMMS-specific quality, and the MODIS-derived quality. Pixels were retained only if all three components simultaneously met the criteria for “good quality” or “estimated data” as defined by the original data providers. In all other cases (such as detected snow, persistent cloud cover, or marginal data) the pixel was assigned a null value (NaN).
- Temporal Aggregation (MVC): Following the filtering stage, the semi-monthly NDVI maps were aggregated into monthly composites using the Maximum Value Composite (MVC) method. For each pixel, the monthly value was determined by selecting the highest NDVI value from the two available semi-monthly observations. This procedure effectively minimizes residual atmospheric noise and cloud contamination not captured by the initial quality flags.
3.2. Long-Term and Decadal Means
3.3. Eco-Phenological Clustering (K-Means)
- Feature Selection: The input features were the 12-dimensional long-term monthly mean NDVI values (1982–2022). This allows the algorithm to distinguish regions based on their characteristic seasonal profiles;
- Optimization of K: A range of K (3 to 10) was evaluated using the CVIK Toolbox [4], which allowed for the computation of 19 Cluster Validity Indices (CVIs) to assess the optimal partition. The final selection of K = 5 was based on a majority consensus among these indices;
- Data Masking: Pixels with missing values (NaN) in any of the 12 monthly layers (e.g., due to persistent snow cover or coastal artifacts) were excluded from the clustering process.
3.4. Extraction of Land Surface Phenology (LSP) Metrics and Shifts
- Start of Season (SOS): First month exceeding 20% of the annual NDVI range;
- Peak of Season (POS): Month of maximum NDVI;
- End of Season (EOS): First month after POS where NDVI drops below 30% of the range;
- Length of Season (LOS): Number of months between SOS and EOS.
3.5. Phenology Variability Index (PVI)
3.6. Statistical Trend Analysis
3.7. Data Quality, Noise, and Limitations
3.8. Ethics Statement
4. User Notes
Author Contributions
Funding
Data Availability Statement
Acknowledgments
Conflicts of Interest
Abbreviations
| AVHRR | Advanced Very High Resolution Radiometer |
| CRS | Coordinate Reference System |
| CVI | Cluster Validity Index |
| EOS | End of Season |
| EPSG | European Petroleum Survey Group (identifier namespace for coordinate reference systems) |
| LOS | Length of Season |
| LSP | Land Surface Phenology |
| MK | Mann–Kendall |
| MVC | Maximum Value Composite |
| NDVI | Normalized Difference Vegetation Index |
| PKU GIMMS | Peking University Global Inventory Monitoring and Modelling Studies |
| POS | Peak of Season |
| PVI | Phenology Variability Index |
| QC | Quality Control |
| SOS | Start of Season |
References
- Samela, C.; Imbrenda, V.; Coluzzi, R.; Lanfredi, M. Four decades of vegetation phenology across Europe using PKU GIMMS NDVI: Assessing timing, stability and spatial patterns. Int. J. Appl. Earth Obs. Geoinf. 2026, 146, 105041. [Google Scholar] [CrossRef]
- Samela, C.; Imbrenda, V.; Coluzzi, R.; Lanfredi, M. European NDVI-Derived Phenology Dataset (1982–2022) [Data Set]; Zenodo: Brussel, Belgium, 2026. [Google Scholar] [CrossRef]
- Li, M.; Cao, S.; Zhu, Z.; Wang, Z.; Myneni, R.B.; Piao, S. Spatiotemporally consistent global dataset of the GIMMS Normalized Difference Vegetation Index (PKU GIMMS NDVI) from 1982 to 2022. Earth Syst. Sci. Data 2023, 15, 4181–4203. [Google Scholar] [CrossRef]
- José-García, A.; Gómez-Flores, W. CVIK: A Matlab-based cluster validity index toolbox for automatic data clustering. SoftwareX 2023, 22, 101359. [Google Scholar] [CrossRef]
- Høgda, K.A.; Karlsen, S.R.; Solheim, I. Climatic change impact on growing season in Fennoscandia studied by a time series of NOAA AVHRR NDVI data. In Proceedings of the IEEE International Geoscience and Remote Sensing Symposium (IGARSS 2001); IEEE: Piscataway, MJ, USA, 2001; Volume 3, pp. 1338–1340. [Google Scholar]
- Delbart, N.; Kergoat, L.; Le Toan, T.; Lhermitte, J.; Picard, G. Determination of phenological dates in boreal regions using normalized difference water index. Remote Sens. Environ. 2005, 97, 26–38. [Google Scholar] [CrossRef]
- Zhang, X.; Friedl, M.A.; Schaaf, C.B.; Strahler, A.H.; Hodges, J.C.; Gao, F.; Reed, B.C.; Huete, A. Monitoring vegetation phenology using MODIS. Remote Sens. Environ. 2003, 84, 471–475. [Google Scholar] [CrossRef]
- Zeng, L.; Wardlow, B.D.; Xiang, D.; Hu, S.; Li, D. A review of vegetation phenological metrics extraction using time-series, multispectral satellite data. Remote Sens. Environ. 2020, 237, 111511. [Google Scholar] [CrossRef]
- Wang, X.; Xiao, J.; Li, X.; Cheng, G.; Ma, M.; Zhu, G.; Altaf Arain, M.; Andrew Black, T.; Jassal, R.S. No trends in spring and autumn phenology during the global warming hiatus. Nat. Commun. 2019, 10, 2389. [Google Scholar] [CrossRef] [PubMed]
- Chen, S.; Fu, Y. Vegetation phenology data based on GIMMS4g NDVI from 1982 to 2020. Sci. Data 2024, 11, 142. [Google Scholar]


| Dataset Component | Format | Spatial Resolution | CRS | Temporal Coverage | Description |
|---|---|---|---|---|---|
| 01_Long_term_Monthly_Mean_NDVI_1982_2022 | GeoTIFF | 0.0833° (~9 km) | EPSG:4326 | 1982–2022 | 12 long-term monthly NDVI composites. |
| 02_Decadal_Monthly_Mean_NDVI | GeoTIFF | 0.0833° (~9 km) | EPSG:4326 | Four decades (1982–2022) | 48 monthly NDVI composites divided into four decades (1982–1992; 1993–2002; 2003–2012; 2013–2022). |
| 03_Phenological_Clusters_Map | GeoTIFF | 0.0833° (~9 km) | EPSG:4326 | 1982–2022 | Categorical map (K = 5) of phenologically coherent regions identified via K-means. |
| 04_Land_Surface_Phenology_Metrics_and_Shifts | GeoTIFF | 0.0833° (~9 km) | EPSG:4326 | Four decades (1982–2022) | 16 decadal metrics (SOS, POS, EOS, LOS) and 4 inter-decadal shift maps (Delta). |
| 05_Phenology_Variability_Index_PVI | GeoTIFF | 0.0833° (~9 km) | EPSG:4326 | 1983–2022 | Pixel-wise index [0–1) describing the interannual variability of phenological timing. |
| 06_Mann_Kendall_Theil_Sen_Trend_Analysis | CSV | N/A | N/A | 1982–2022 | Cluster-level Mann–Kendall and Theil–Sen statistics for monthly NDVI trends. |
Disclaimer/Publisher’s Note: The statements, opinions and data contained in all publications are solely those of the individual author(s) and contributor(s) and not of MDPI and/or the editor(s). MDPI and/or the editor(s) disclaim responsibility for any injury to people or property resulting from any ideas, methods, instructions or products referred to in the content. |
© 2026 by the authors. Licensee MDPI, Basel, Switzerland. This article is an open access article distributed under the terms and conditions of the Creative Commons Attribution (CC BY) license.
Share and Cite
Samela, C.; Lanfredi, M.; Coluzzi, R.; Imbrenda, V. A Multi-Metric NDVI-Derived Dataset of Vegetation Dynamics and Land Surface Phenology in Southern and Central Europe (1982–2022). Data 2026, 11, 206. https://doi.org/10.3390/data11080206
Samela C, Lanfredi M, Coluzzi R, Imbrenda V. A Multi-Metric NDVI-Derived Dataset of Vegetation Dynamics and Land Surface Phenology in Southern and Central Europe (1982–2022). Data. 2026; 11(8):206. https://doi.org/10.3390/data11080206
Chicago/Turabian StyleSamela, Caterina, Maria Lanfredi, Rosa Coluzzi, and Vito Imbrenda. 2026. "A Multi-Metric NDVI-Derived Dataset of Vegetation Dynamics and Land Surface Phenology in Southern and Central Europe (1982–2022)" Data 11, no. 8: 206. https://doi.org/10.3390/data11080206
APA StyleSamela, C., Lanfredi, M., Coluzzi, R., & Imbrenda, V. (2026). A Multi-Metric NDVI-Derived Dataset of Vegetation Dynamics and Land Surface Phenology in Southern and Central Europe (1982–2022). Data, 11(8), 206. https://doi.org/10.3390/data11080206