


Abstract
This work presents conditioned and normalized vibration signal datasets acquired from the spanwise axis of the three blades of a rotating bladed system operating at a constant rotational speed of 240 rpm. The conditioned dataset was obtained using piezoelectric accelerometers mounted at the blade roots. The accelerometer output signals were conditioned and recorded by a dedicated data acquisition system. The signals were acquired under both healthy and damaged operating conditions. Baseline vibration signals were first recorded with all three blades in a healthy condition. Subsequently, cracks were deliberately introduced at three different locations along the blade span—the root, middle, and tip zones. Each crack location was independently evaluated on each of the three blades, resulting in a comprehensive dataset that includes healthy operation and all combinations of blade–damage locations. The datasets enable analysis of the system’s vibratory response and of dynamic information propagation toward the blade root, depending on the crack zone. Their main contribution is to provide reliable experimental data for the development, validation, and benchmarking of vibration-based diagnostic and structural health monitoring techniques. Furthermore, the datasets serve as valuable resources for advancing early crack detection strategies and enhancing the reliability of rotating industrial equipment with blades, such as fans, compressors, turbines, and aerogenerators.
Dataset: The data presented in this study are openly available in Mendeley data at https://data.mendeley.com/datasets/9m4rk6b4r8/2 (accessed on 5 August 2026).
Dataset License: CC BY 4.0
1. Summary
Rotating industrial equipment with blades, such as fans, compressors, turbines, and aerogenerators, plays a fundamental role in modern manufacturing and energy systems. These blades are commonly designed with structural characteristics similar to cantilever beams, in which one end is fixed at the root, and the other remains free, making them highly susceptible to vibration-induced stresses, fatigue, and crack initiation during operation. Blade cracking is one of the most common and recurrent types of damage in fans. These defects may occur at different locations along the blade cross-section, leading to fractures, shear failures, unwanted vibrations, and accelerated wear of other components. The presence of cracks in rotating blades can significantly alter their dynamic behavior, leading to changes in natural frequencies, mode shapes, and vibration responses that may compromise efficiency, safety, and reliability [1]. Therefore, the monitoring, detection, and precise localization of cracks in such components have become critical tasks in predictive maintenance and structural health monitoring. Several approaches have been developed to investigate the influence of cracks on the dynamic behavior of rotating blades. For example, a discrete mathematical model of fan blades was theoretically analyzed to determine the relationship between the location and depth of a crack and the fan blade’s natural frequency [2]. Another approach to understanding the crack propagation mechanism involves numerical simulations combining finite element analysis and fracture mechanics. An example of this is a co-simulation approach that combines FRANC3D 2025 and ABAQUS to study crack propagation in an axial-flow fan blade subjected to centrifugal, aerodynamic, and combined loads [3]. Similarly, the damage identification of blades by vibrational analysis and numerical analysis is carried out using the ANSYS Workbench program to simulate a Finite Element Method model, and the results are compared to the experimental analysis, where fault simulation machinery equipment was used to determine the vibration responses of healthy and defective blades [4].
Beyond structural modeling, vibration-based condition monitoring has emerged as one of the most effective non-destructive techniques for identifying structural damage in rotating systems. By analyzing variations in vibration signatures, it is possible to detect the early stages of crack propagation before catastrophic failure occurs. The finite element model and online vibration monitoring of rotating fan blades were used to detect and classify damage level [5]. A simple method was developed to detect damage in fan blades using a discrete mathematical model, changes in natural frequencies, and structure analysis [6]. The detection of cracks in the centrifugal pump impeller blades using the vibration analysis technique was investigated using both time- and frequency-domain methods [7]. A research work applied an adaptive stochastic resonance method to diagnose a crack fault in a centrifugal fan using blade vibration signals [8]. The automatic detection technology for fan blade cracks and the multi-scale feature fusion were studied [9].
However, the complexity of rotating blade dynamics, combined with operational noise and varying boundary conditions, makes accurate crack identification challenging. This has led to the development of studies that integrate artificial intelligence techniques for the condition monitoring of rotating systems. An example of this type of study can be found in datasets for wind turbine blade fault detection [10]. In that study, the reported dataset includes various blade fault conditions, including cracks. However, the crack damage is limited to a single location on the blade. It is always introduced in the same blade, thereby restricting the representation of different crack locations and blade-to-blade variability. The specific application of each dataset determines the methodology and the resulting dataset characteristics, such as sensor placement. For instance, vibration measurements obtained from a single sensor monitoring the entire system differ substantially from measurements acquired using dedicated sensors mounted on each blade.
In particular, the crack location along the blade span strongly influences the dynamic response, underscoring the need for robust experimental data to improve diagnostic accuracy. For that, an experimental dataset of vibration signals acquired at the blade root is especially valuable because this region serves as the primary transmission path for structural vibrations and is also one of the most critical zones for stress concentration. Collecting vibration data from blades containing cracks at different locations along their length allows the establishment of reliable damage patterns and supports the development of advanced diagnostic methodologies based on signal processing, modal analysis, and artificial intelligence techniques. Such datasets not only enable the validation of numerical and finite element models but also provide a foundation for intelligent fault-detection systems capable of classifying crack severity and predicting structural degradation under real operating conditions. A comparative study of vibration, based on machine learning algorithms for crack identification and location in operating wind turbine blades, was developed using the provided dataset [11].
In this work, the authors provide publicly available conditioned and normalized datasets simulating crack failure conditions at different regions along the rotating blades of an industrial fan. The vibration signals were measured under both healthy and damaged operating conditions. The healthy subset consists of baseline spanwise vibration signals recorded with all three blades in an undamaged condition. The damaged subset comprises vibration signals obtained after introducing controlled structural cracks at three predefined locations along the blade span: the root, middle, and tip regions. Each damage location was evaluated independently on each of the three blades while the rotating system was in operation.
Spanwise vibration signals were measured, conditioned, and acquired from blades using three piezoelectric triaxial accelerometers, a conditioning stage based on threeinstrumentation amplifier modules, a data acquisition (DAQ) HAT (model MCC 118), and a Raspberry Pi Model 4B+. The vibration sensors used in this study were TE Connectivity 830M1-500 accelerometers, manufactured by TE Connectivity, Galway, Ireland. The signal-conditioning stage employed AD620 instrumentation amplifiers manufactured by Analog Devices, Inc., Wilmington, Massachusetts, USA. One accelerometer was mounted at the root of each blade to capture both rotational excitations and the blades’ structural dynamics. The rotor operates at a rotational speed of 240 rpm. The signals were sampled at 1 kHz, and 7680 sampling segments, each of 0.5 s, were acquired for each experimental case. The conditioned and collected dataset was normalized using the absolute maximum method.
The main innovation of the datasets lies in their capability to capture real-time vibration signals directly at the root of each blade, reducing the need for extensive instrumentation. Additionally, the conditioned and normalized datasets provide vibration signal files representing healthy condition and all combinations of three blade crack locations, enabling their use in structural health monitoring, fault diagnosis, damage localization, and machine learning applications.
2. Data Description
The datasets contain conditioned and normalized vibration signal files acquired using a dedicated data acquisition system during the experimental evaluation of an operating three-bladed rotating system. Spanwise vibration signals were acquired under both healthy and damaged operating conditions. Initially, baseline measurements were collected with all three blades undamaged to establish the reference condition. Controlled cracks were then intentionally introduced at three distinct locations along each blade’s span, corresponding to the root, middle, and tip regions. To isolate the effect of each damage scenario, only one crack was introduced and evaluated at a time on a single blade, while the remaining two blades were kept in a healthy condition. This procedure was repeated independently for each crack location and for each of the three blades, resulting in a comprehensive dataset that includes the healthy condition and all individual blade–damage location combinations. They consist of 10 experimental cases, which are described in Section 3.
The vibration responses were measured using a single piezoelectric accelerometer mounted at the root of each blade to capture the spanwise dynamic response at a constant rotational speed.
The dataset includes the conditioned signals obtained directly from the data acquisition system, preserving the measured time-domain responses without any feature extraction or signal processing beyond signal conditioning, digitization, and storage. In addition, a normalized version of the dataset is provided to facilitate comparative analyses, feature extraction, and the development of machine learning models by reducing the influence of differences in signal amplitude for structural damage detection and localization.
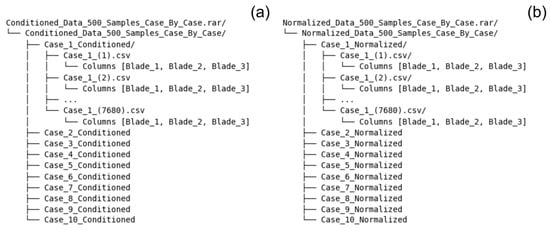
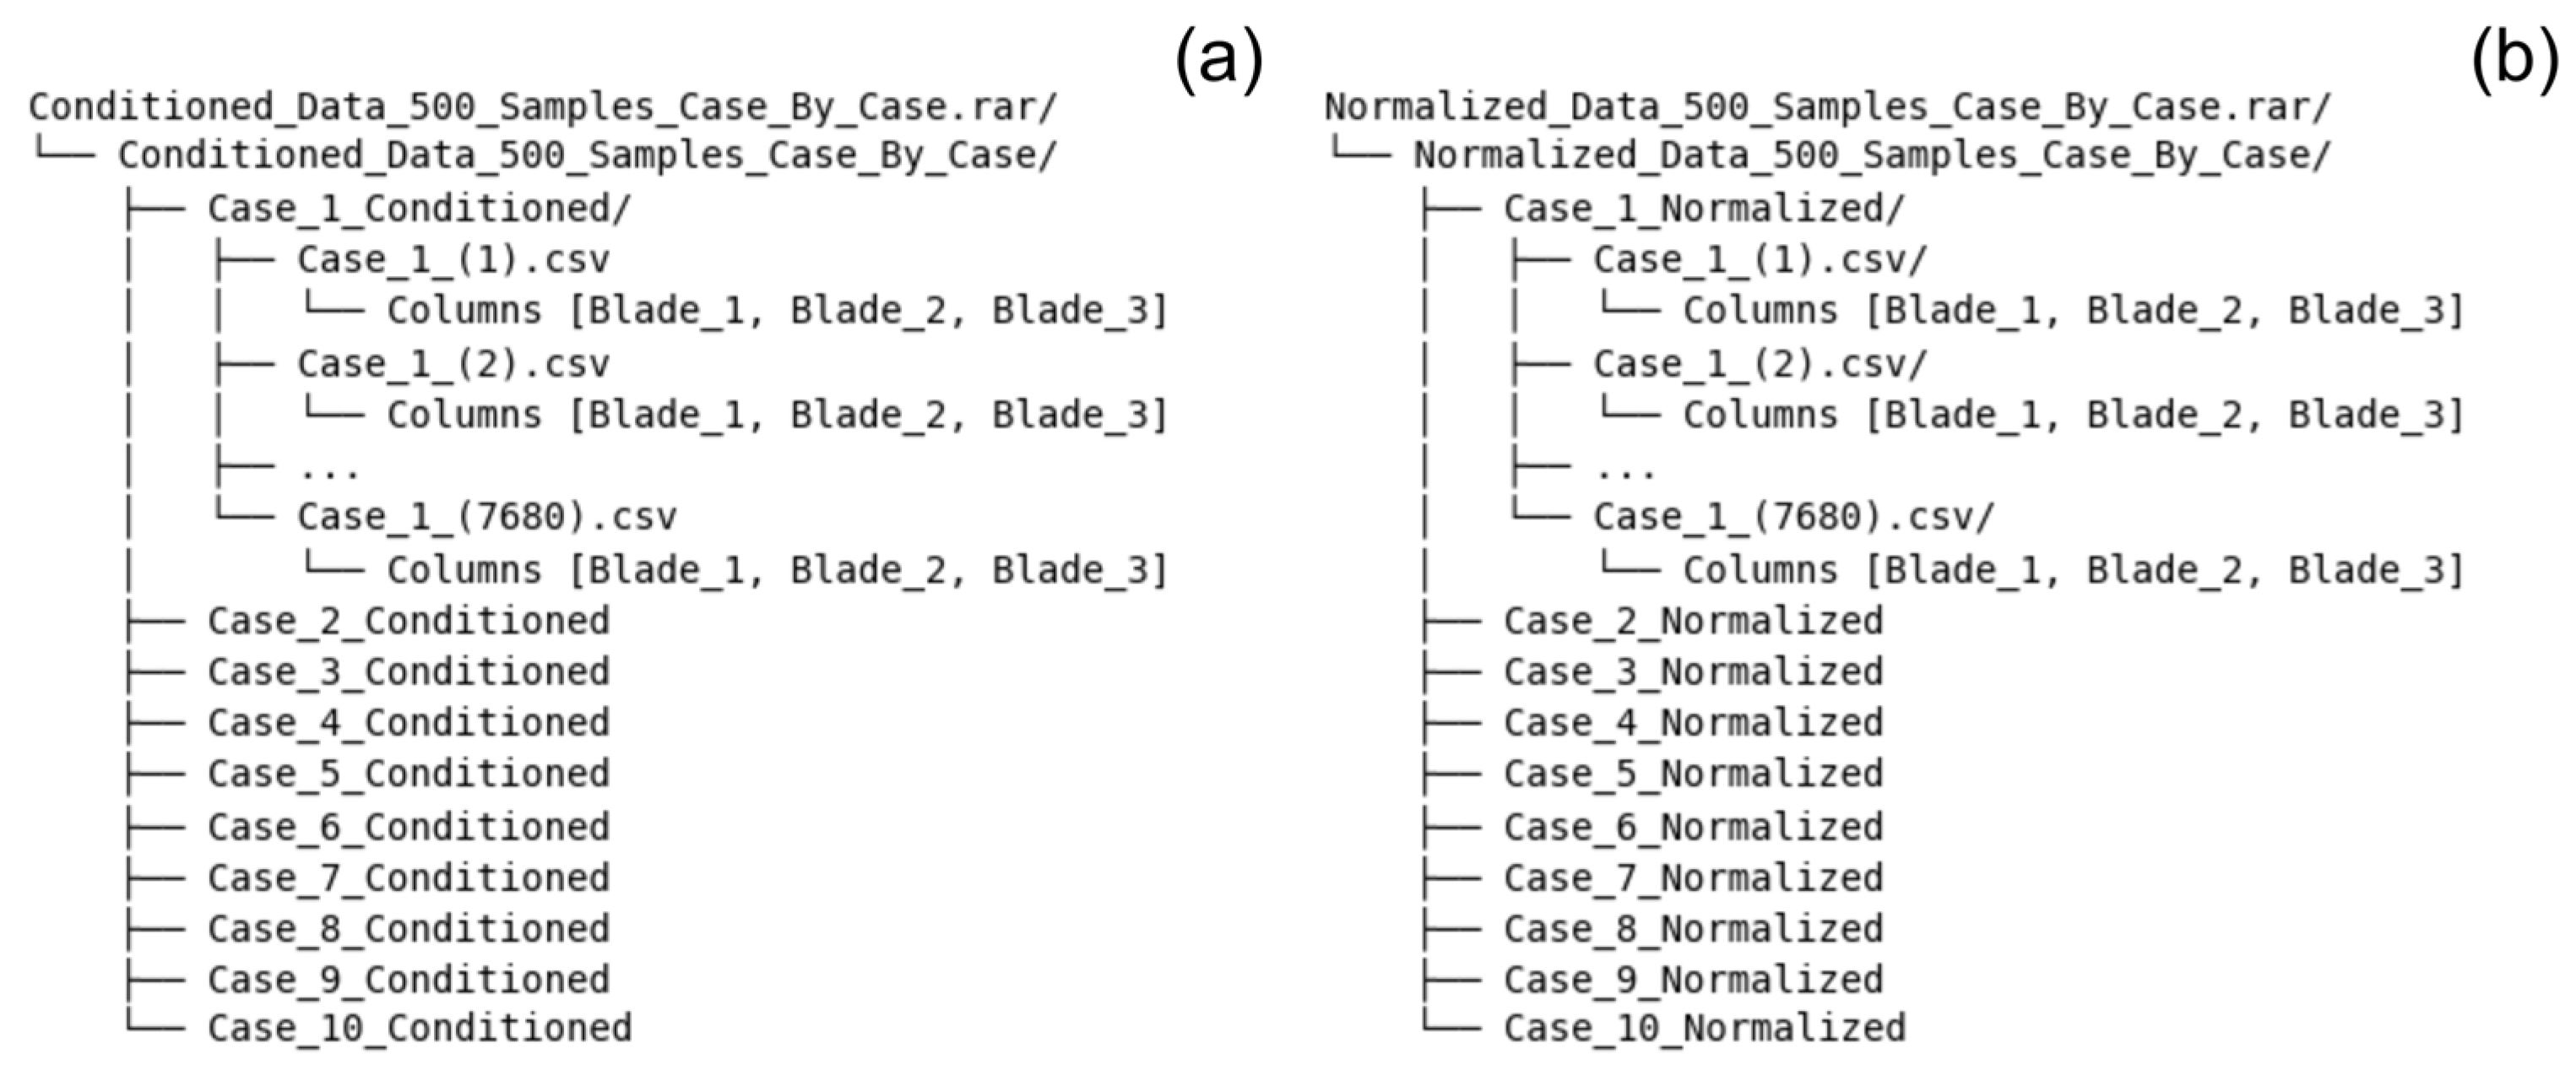
The datasets are available in the Mendeley repository [12]. Data are provided in CSV-format files. Figure 1 presents the directory structure of the released dataset as an ASCII tree diagram.
Figure 1.
ASCII tree representation of the directory structure of the (a) conditioned dataset, and (b) normalized dataset.
The conditioned dataset comprises a total of 76,800 files, evenly distributed across the 10 experimental cases, with 7680 files corresponding to each case. Each file in the conditioned dataset contains three columns: the voltage amplitudes of the signals measured at the output of the sensing and conditioning stage for each blade (blades 1, 2, and 3). These signals are proportional to the measured vibration acceleration and were acquired directly by the data acquisition system without conversion to physical acceleration or displacement units. Each column comprises 500 samples with a sampling period of 1 ms, corresponding to 0.5 s of data acquisition. The files were not acquired as segmented records; instead, continuous signals consisting of 5000 samples were initially recorded and subsequently segmented into files containing 500 samples each.
The conditioned dataset includes the following file folders:
- Case_1_Conditioned: 7680 files containing conditioned vibration signals acquired with blades 1, 2, and 3 in the healthy condition.
- Case_2_Conditioned: 7680 files containing conditioned vibration signals acquired with blade 1 cracked at the tip, and blades 2 and 3 are uncracked.
- Case_3_Conditioned: 7680 files containing conditioned vibration signals acquired with blade 1 cracked in the middle, and blades 2 and 3 are uncracked.
- Case_4_Conditioned: 7680 files containing conditioned vibration signals acquired with blade 1 cracked at the root, and blades 2 and 3 are uncracked.
- Case_5_Conditioned: 7680 files containing conditioned vibration signals acquired with blade 2 cracked at the tip, and blades 1 and 3 are uncracked.
- Case_6_Conditioned: 7680 files containing conditioned vibration signals acquired with blade 2 cracked in the middle, and blades 1 and 3 are uncracked.
- Case_7_Conditioned: 7680 files containing conditioned vibration signals acquired with blade 2 cracked at the root, and blades 1 and 3 are uncracked.
- Case_8_Conditioned: 7680 files containing conditioned vibration signals acquired with blade 3 cracked at the tip, and blades 1 and 2 are uncracked.
- Case_9_Conditioned: 7680 files containing conditioned vibration signals acquired with blade 3 cracked in the middle, and blades 1 and 2 are uncracked.
- Case_10_Conditioned: 7680 files containing conditioned vibration signals acquired with blade 3 cracked at the root, and blades 1 and 2 are uncracked.
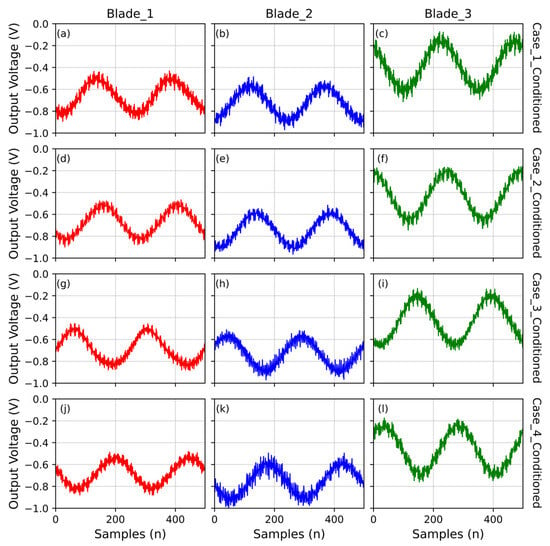
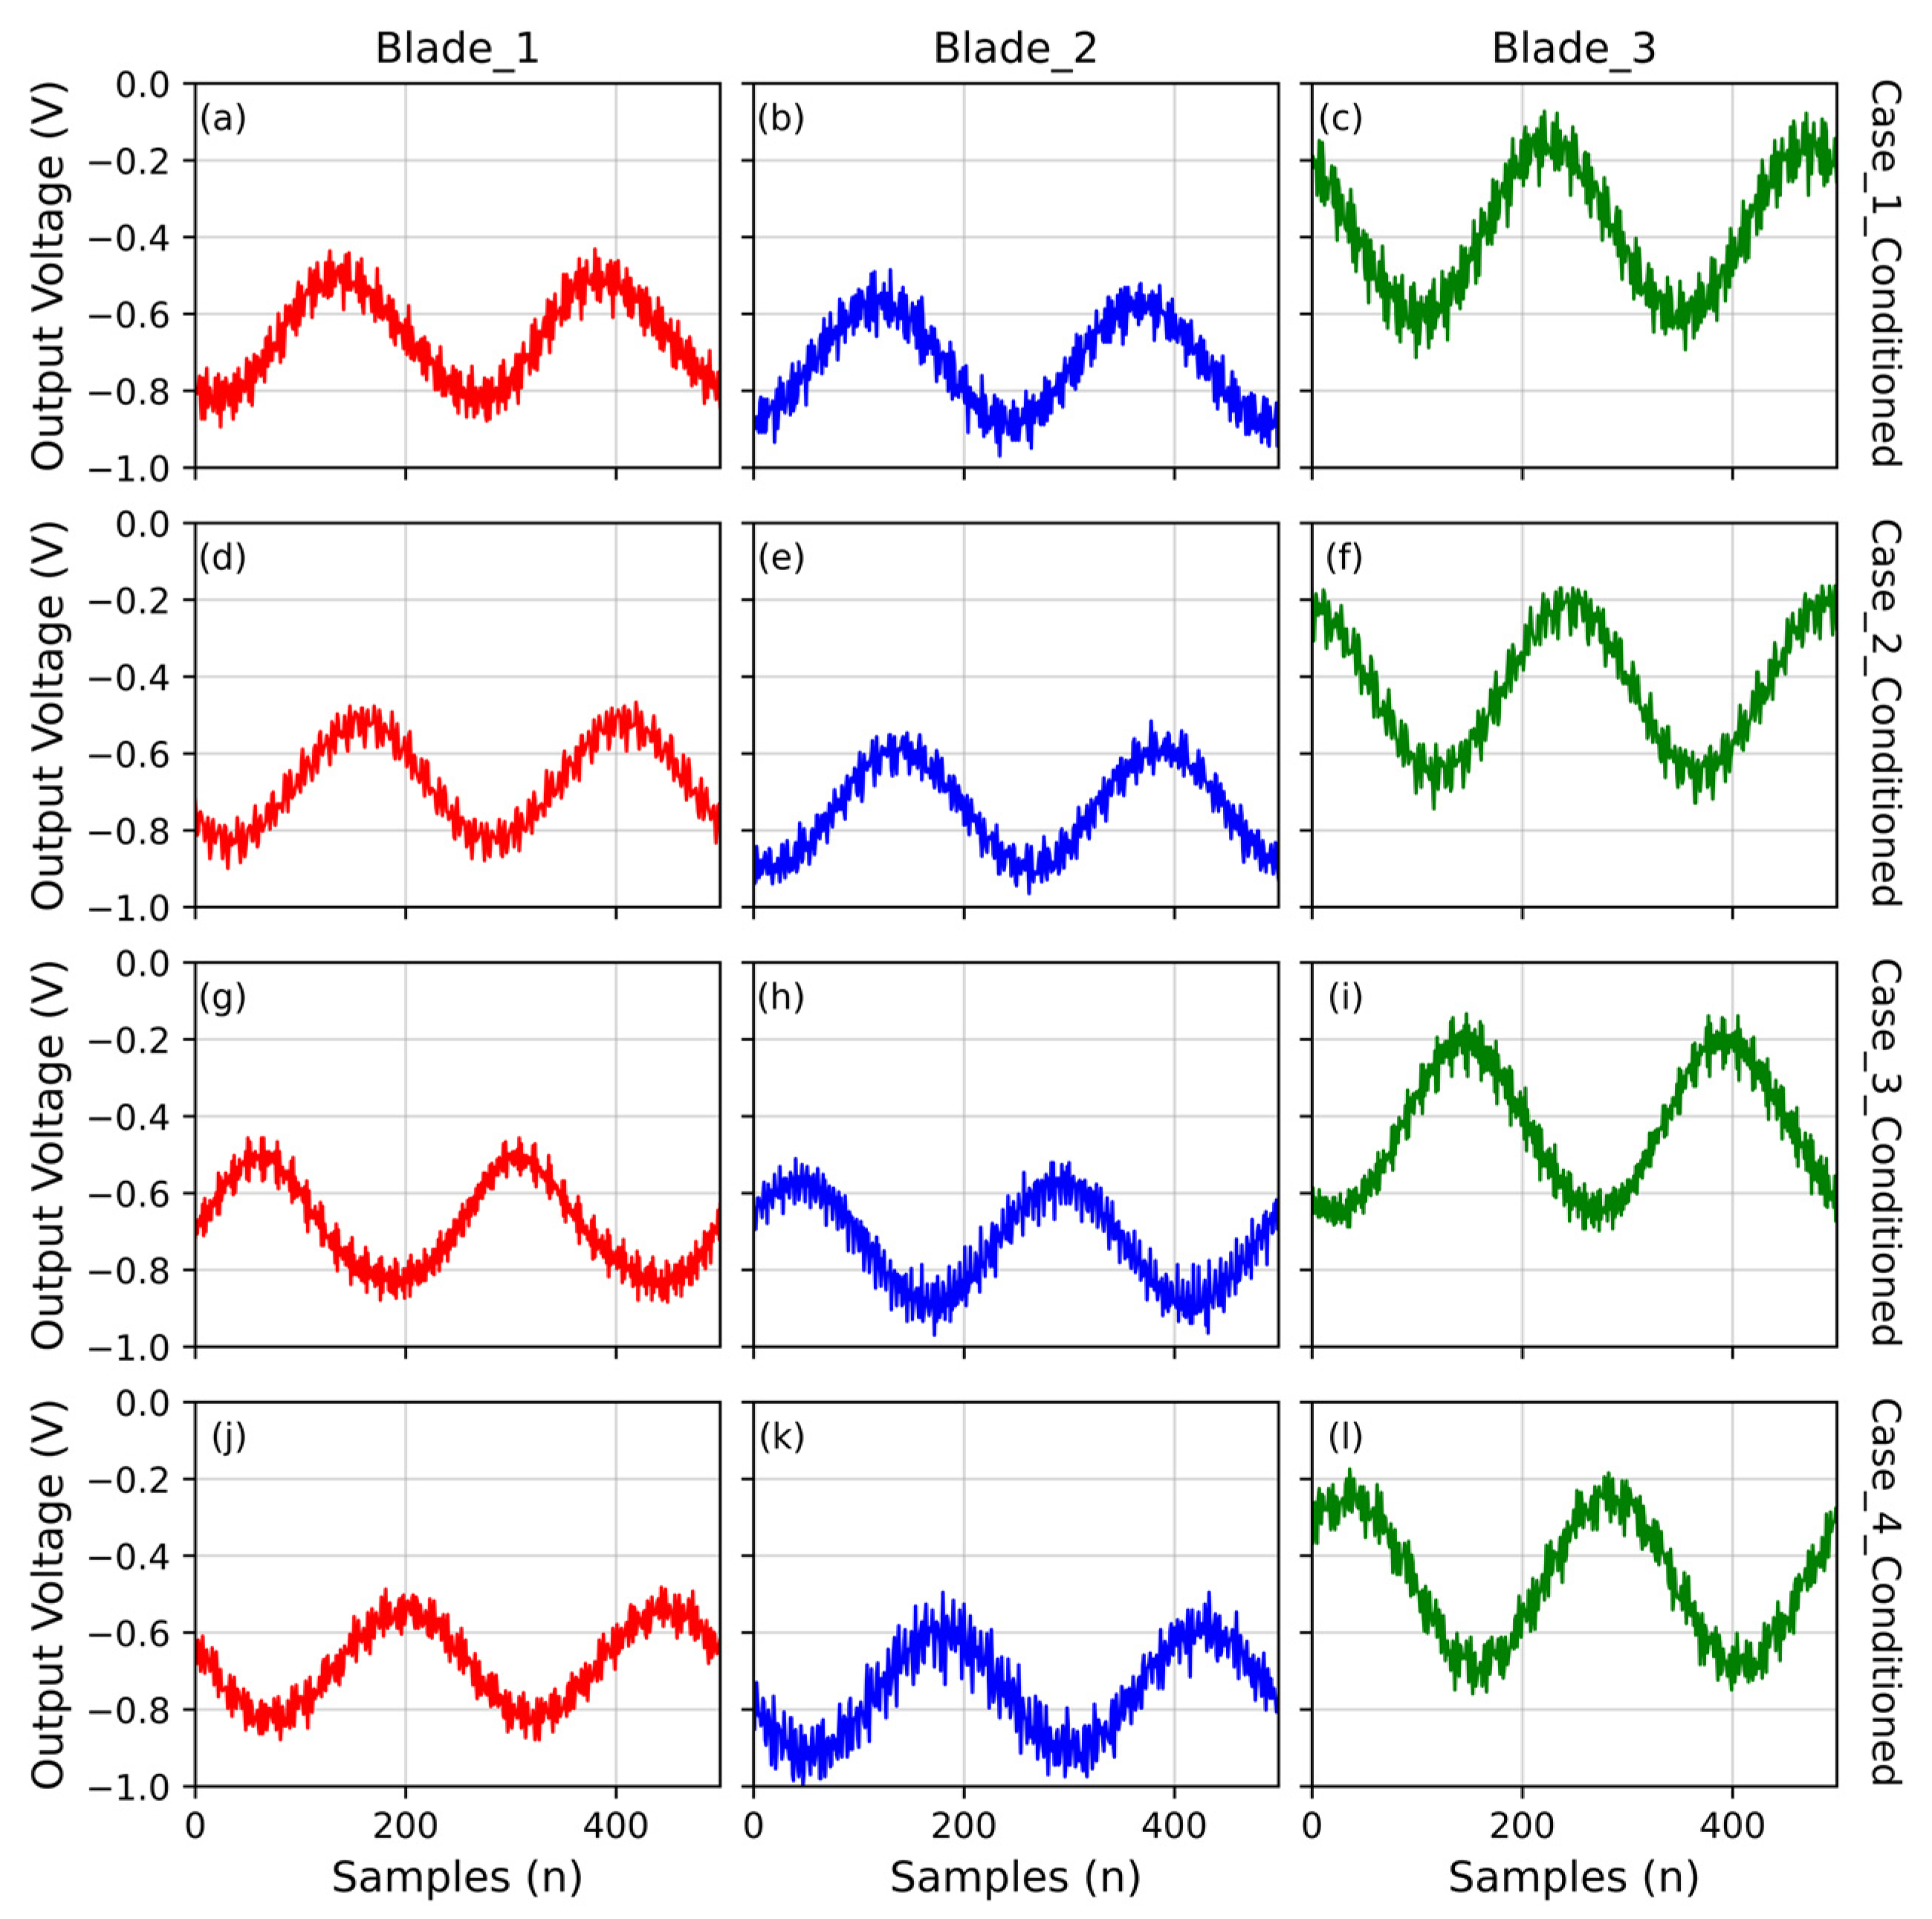
Plots of the conditioned time-series data for Case_1_Conditioned to Case_4_Conditioned were generated to provide an overview of the behavior of the acquired and segmented signals, as shown in Figure 2.
Figure 2.
Conditioned plots of the time-series data: (a) Blade 1 of Case_1_Conditioned, (b) Blade 2 of Case_1_Conditioned, and (c) Blade 3 of Case_1_Conditioned, (d) Blade 1 of Case_2_Conditioned, (e) Blade 2 of Case_2_Conditioned, (f) Blade 3 of Case_2_Conditioned, (g) Blade 1 of Case_3_Conditioned, (h) Blade 2 of Case_3_Conditioned, (i) Blade 3 of Case_3_Conditioned, (j) Blade 1 of Case_4_Conditioned, (k) Blade 2 of Case_4_Conditioned, and (l) Blade 3 of Case_4_Conditioned.
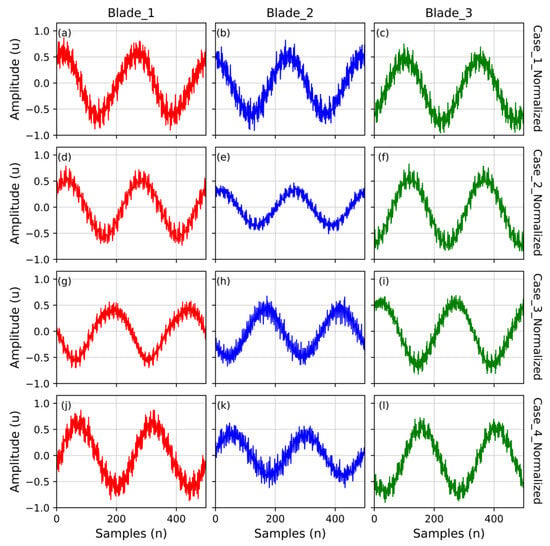
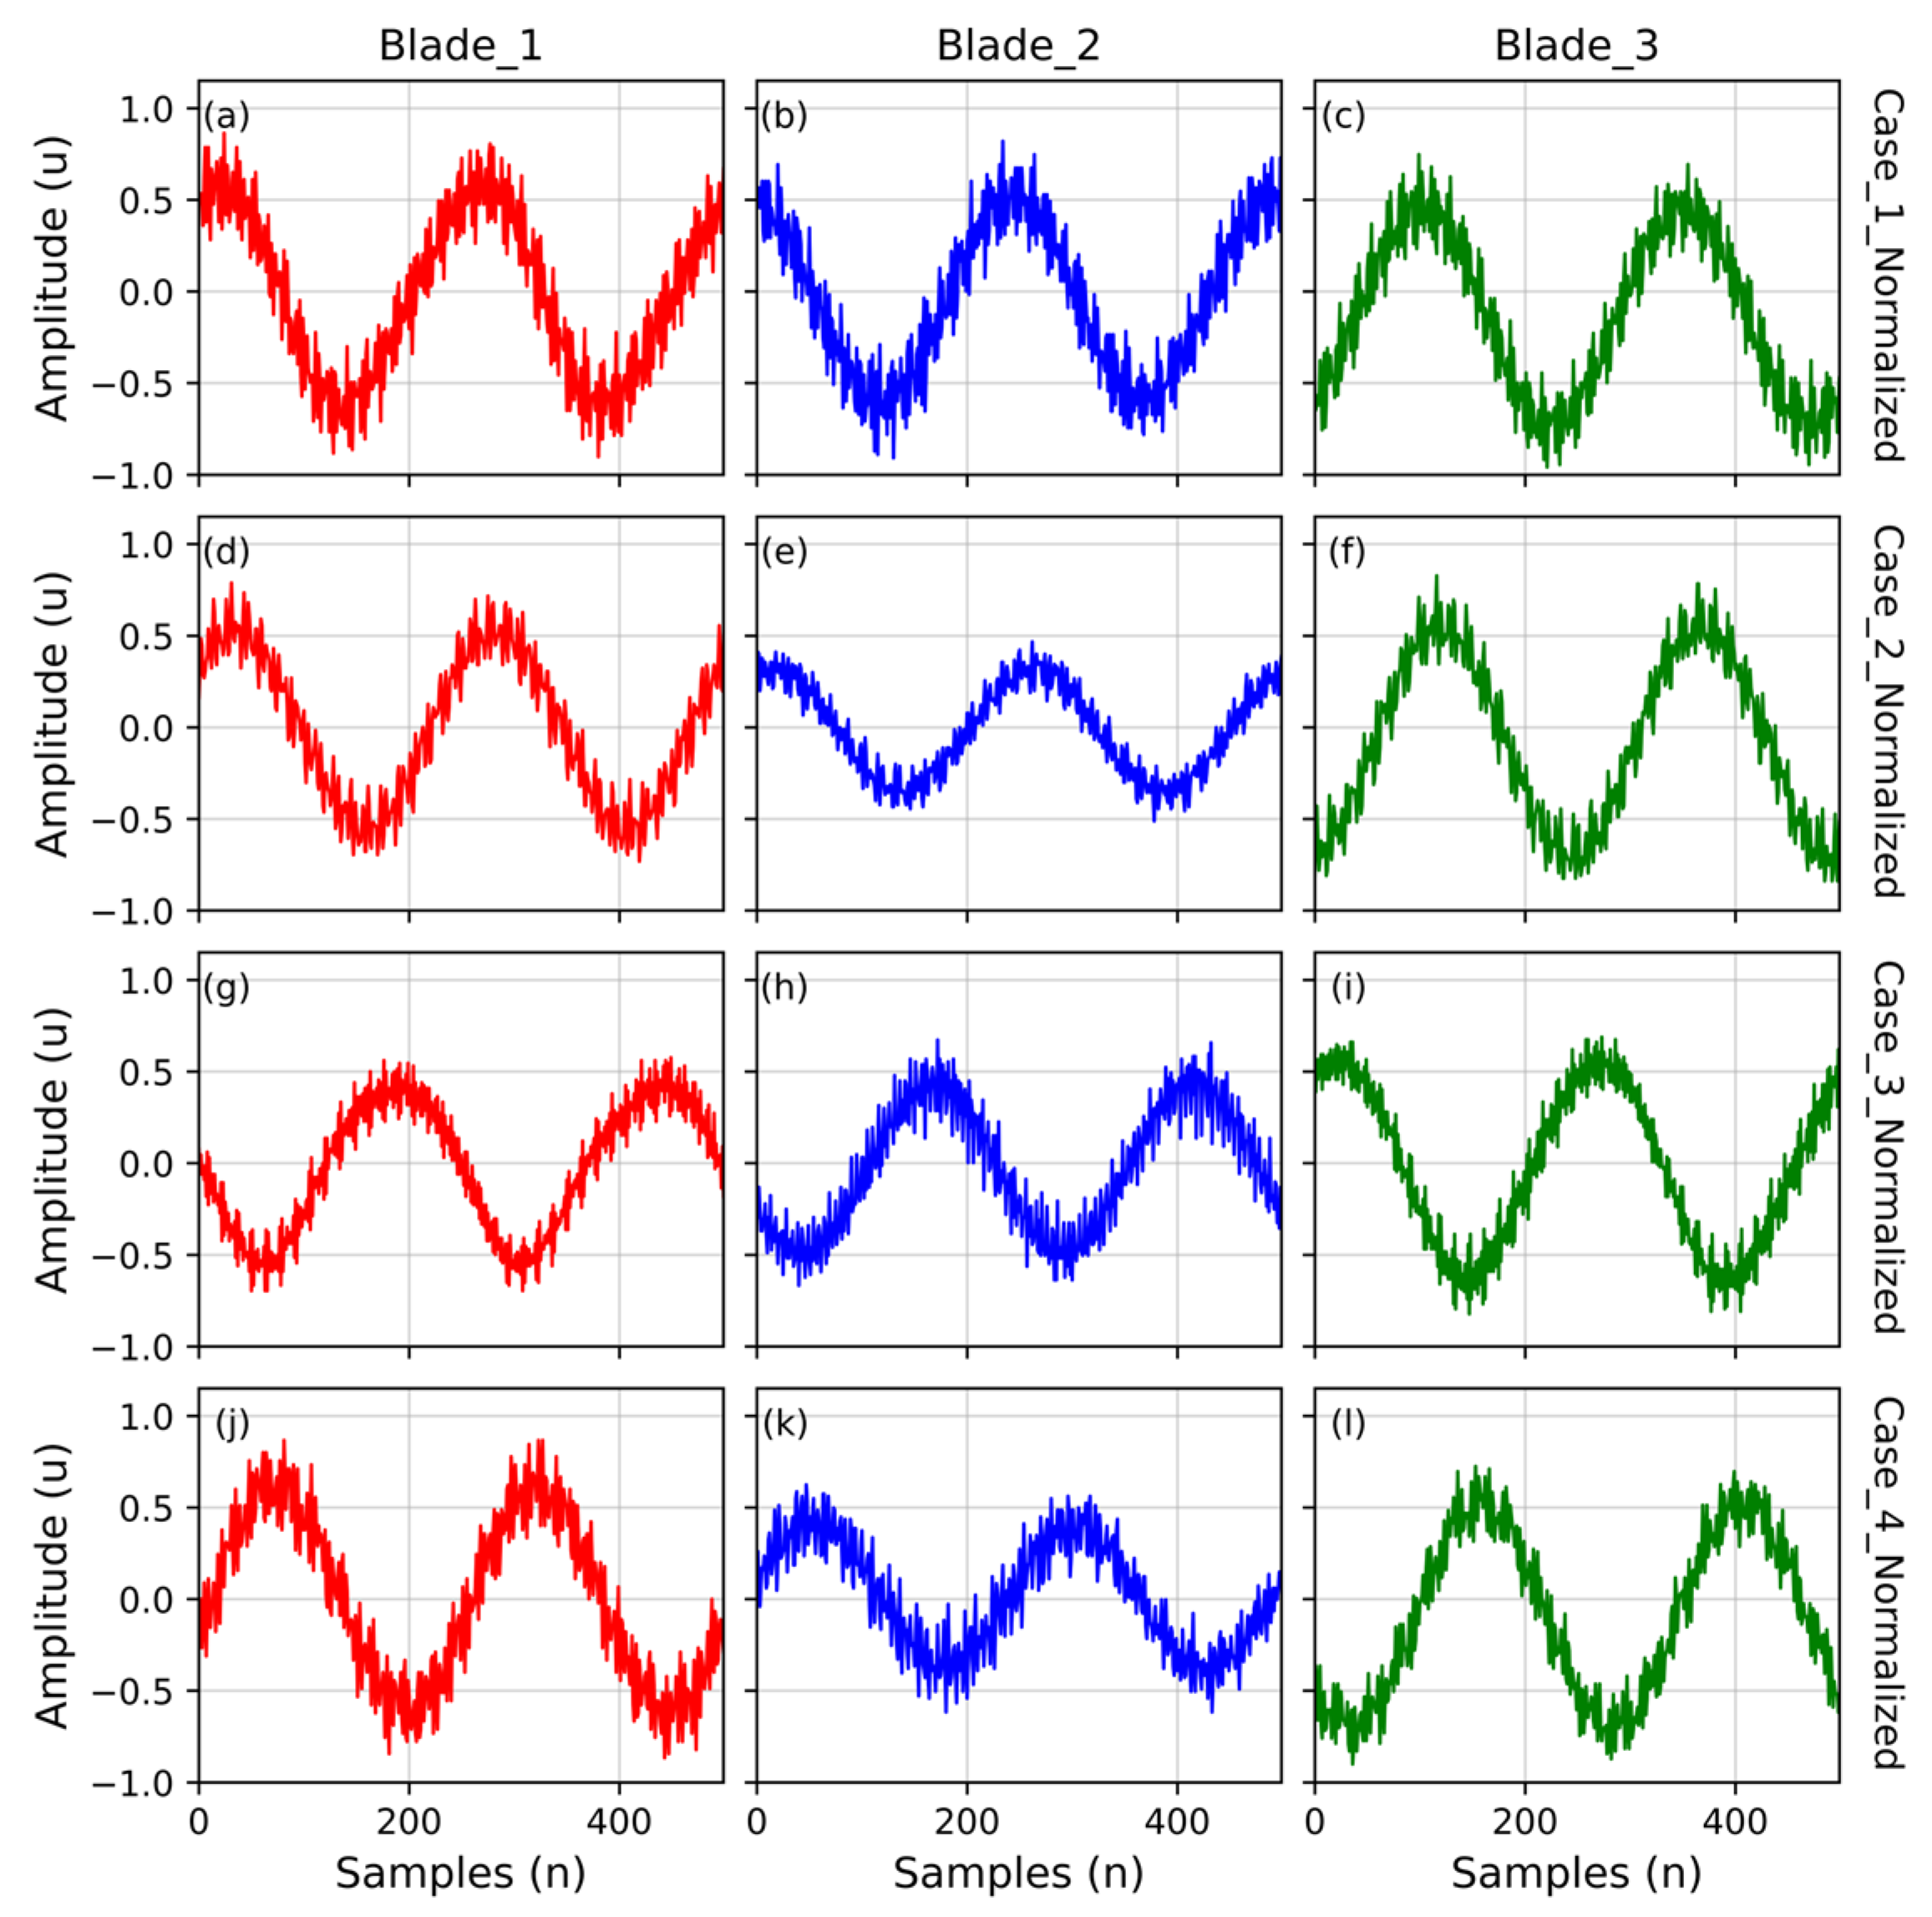
On the other hand, the normalized dataset comprises the conditioned dataset’s normalized signals. The normalization was performed using the absolute maximum (Max Absolute) Scaling Method. The Max Absolute Normalization is a data preprocessing technique that scales numerical data to the range (−1, 1) by dividing each feature value by its maximum absolute value. In this work, the normalization was applied independently to every 0.5 s acquisition segment. Because each segment corresponds to an independent measurement acquired during the experimental tests, its own maximum absolute value was used as the scaling factor. This technique preserves the sign of the data and is especially useful for sparse data, as it does not shift the data center, so zero values remain zero. Figure 3 shows the normalized plots of the time-series data file of Case_1_Normalized to Case_4_Normalized.
Figure 3.
Normalized plots of the time-series data: (a) Blade 1 of Case_1_Normalized, (b) Blade 2 of Case_1_Normalized, and (c) Blade 3 of Case_1_Normalized, (d) Blade 1 of Case_2_Normalized, (e) Blade 2 of Case_2_Normalized, (f) Blade 3 of Case_2_Normalized, (g) Blade 1 of Case_3_Normalized, (h) Blade 2 of Case_3_Normalized, (i) Blade 3 of Case_3_Normalized, (j) Blade 1 of Case_4_Normalized, (k) Blade 2 of Case_4_Normalized, and (l) Blade 3 of Case_4_Normalized.
The normalized dataset includes the following file folders:
- Case_1_Normalized: 7680 files containing normalized vibration signals acquired with Blades 1, 2, and 3 in the healthy condition.
- Case_2_Normalized: 7680 files containing normalized vibration signals acquired with blade 1 cracked at the tip, and blades 2 and 3 are uncracked.
- Case_3_Normalized: 7680 files containing normalized vibration signals acquired with blade 1 cracked in the middle, and blades 2 and 3 are uncracked.
- Case_4_Normalized: 7680 files containing normalized vibration signals acquired with blade 1 cracked at the root, and blades 2 and 3 are uncracked.
- Case_5_Normalized: 7680 files containing normalized vibration signals acquired with blade 2 cracked at the tip, and blades 1 and 3 are uncracked.
- Case_6_Normalized: 7680 files containing normalized vibration signals acquired with blade 2 cracked in the middle, and blades 1 and 3 are uncracked.
- Case_7_Normalized: 7680 files containing normalized vibration signals acquired with blade 2 cracked at the root, and blades 1 and 3 are uncracked.
- Case_8_Normalized: 7680 files containing normalized vibration signals acquired with blade 3 cracked at the tip, and blades 1 and 2 are uncracked.
- Case_9_Normalized: 7680 files containing normalized vibration signals acquired with blade 3 cracked in the middle, and blades 1 and 2 are uncracked.
- Case_10_Normalized: 7680 files containing normalized vibration signals acquired with blade 3 cracked at the root, and blades 1 and 2 are uncracked.
3. Experimental Design, Materials and Methods
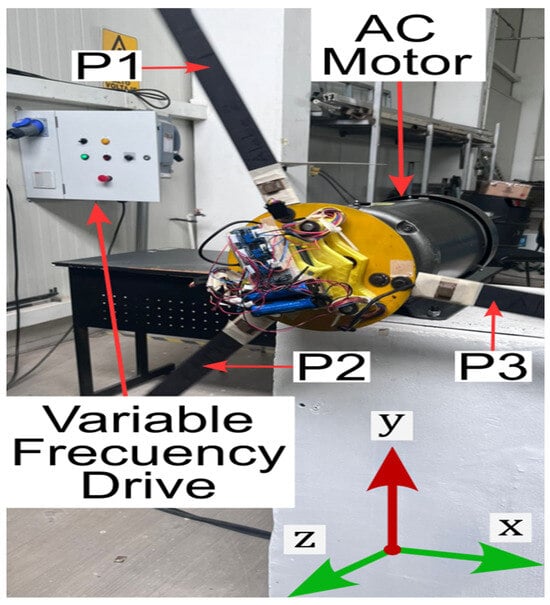
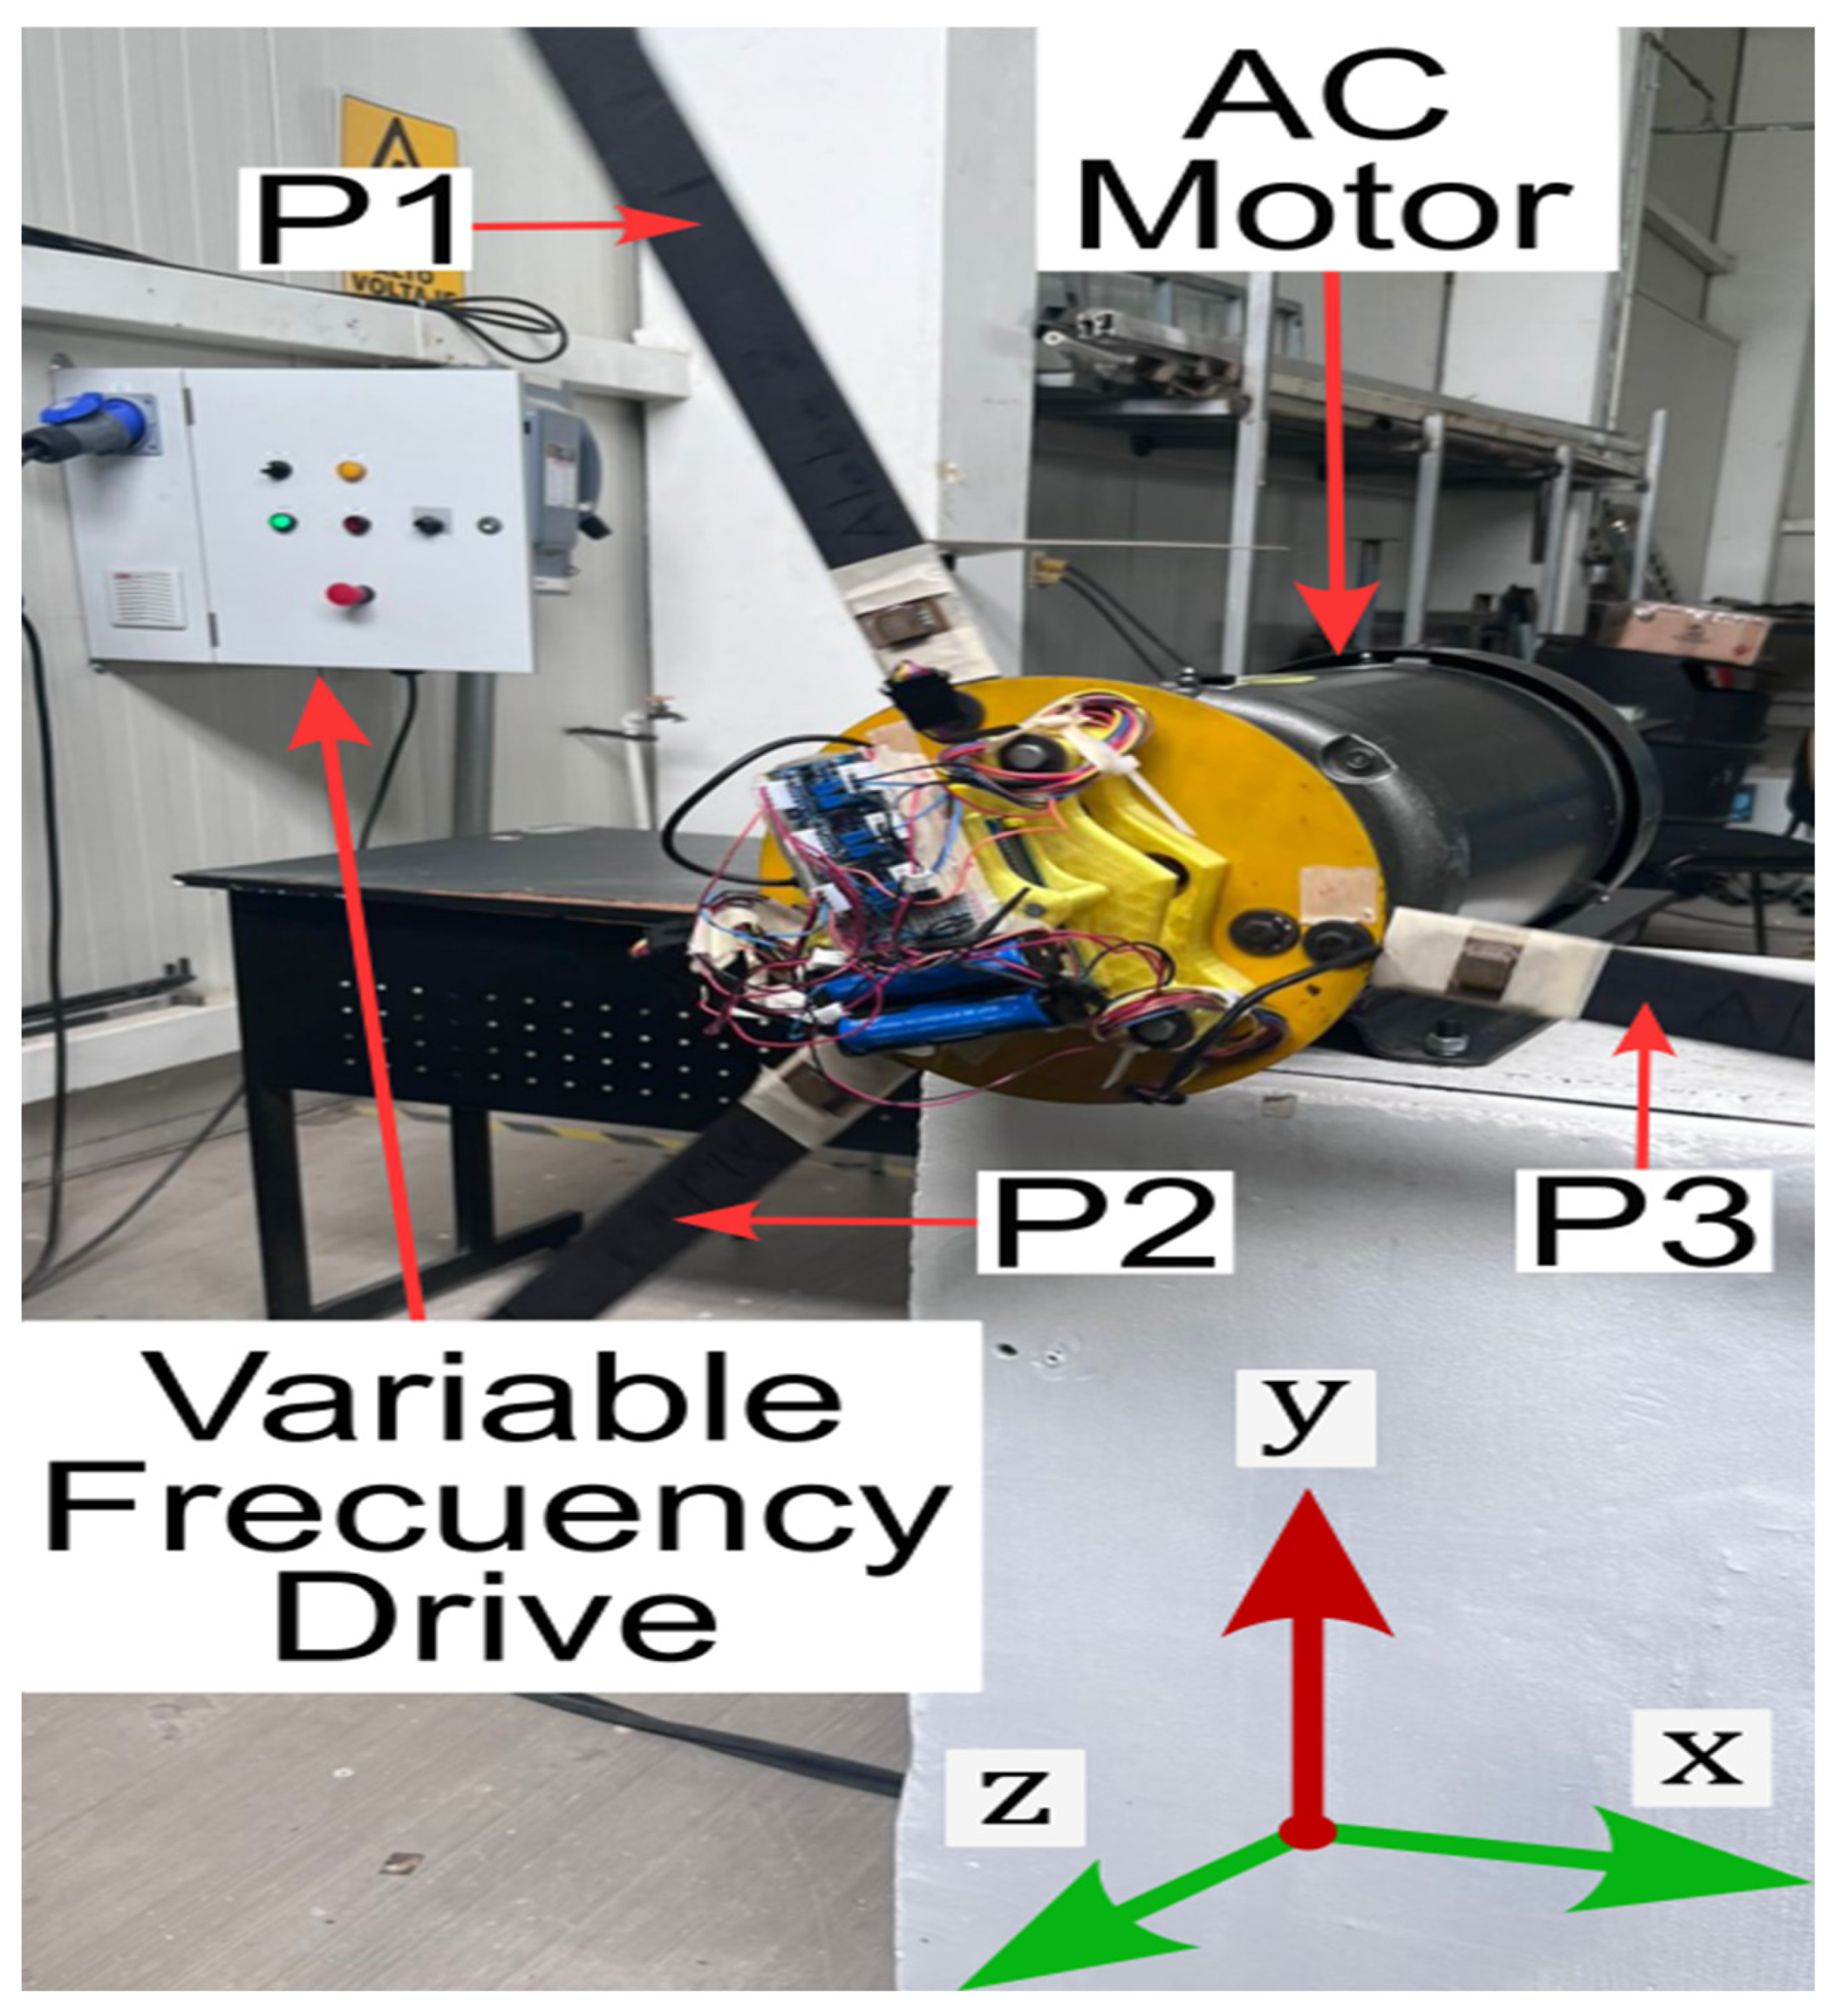
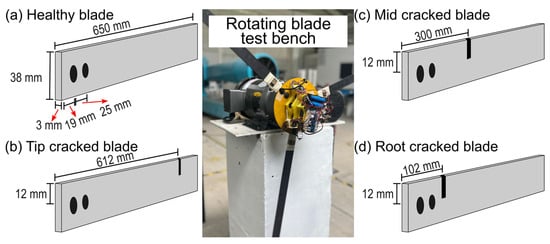
To generate the datasets, experimental tests were conducted on a fan test bench in a laboratory under semi-controlled conditions (Figure 4). ASTM A36 steel slabs serve as simplified blade profiles. The datasets were developed to support the design and evaluation of innovative methods and algorithms, particularly in artificial intelligence, for monitoring rotating fan blades. The information provided can help develop more effective algorithms that automatically detect failures while the fans remain operational. These algorithms will identify the specific blade that has failed and pinpoint the location of the crack. These capabilities are especially valuable in industrial environments for managing and scheduling maintenance tasks, preventing accidents, and reducing costs.
Figure 4.
Fan test bench.
Researchers and professionals in the industrial sector may find these datasets particularly useful for studying the relationship between vibration signals and the presence of cracks across different blade zones of a fan under operational conditions.
3.1. Experimental Setup
The experimental setup is divided into two parts: a fan test bench (Figure 4) and a data acquisition system (DAS). The fan test bench simulates a rotating fan, so a rotating stimulus is applied to the blades. The fan test bench comprises a concrete block supporting a 3 HP AC motor, a variable-frequency drive, a hub, a mounting disc, and three simplified fan blade profiles, as shown in Figure 4.
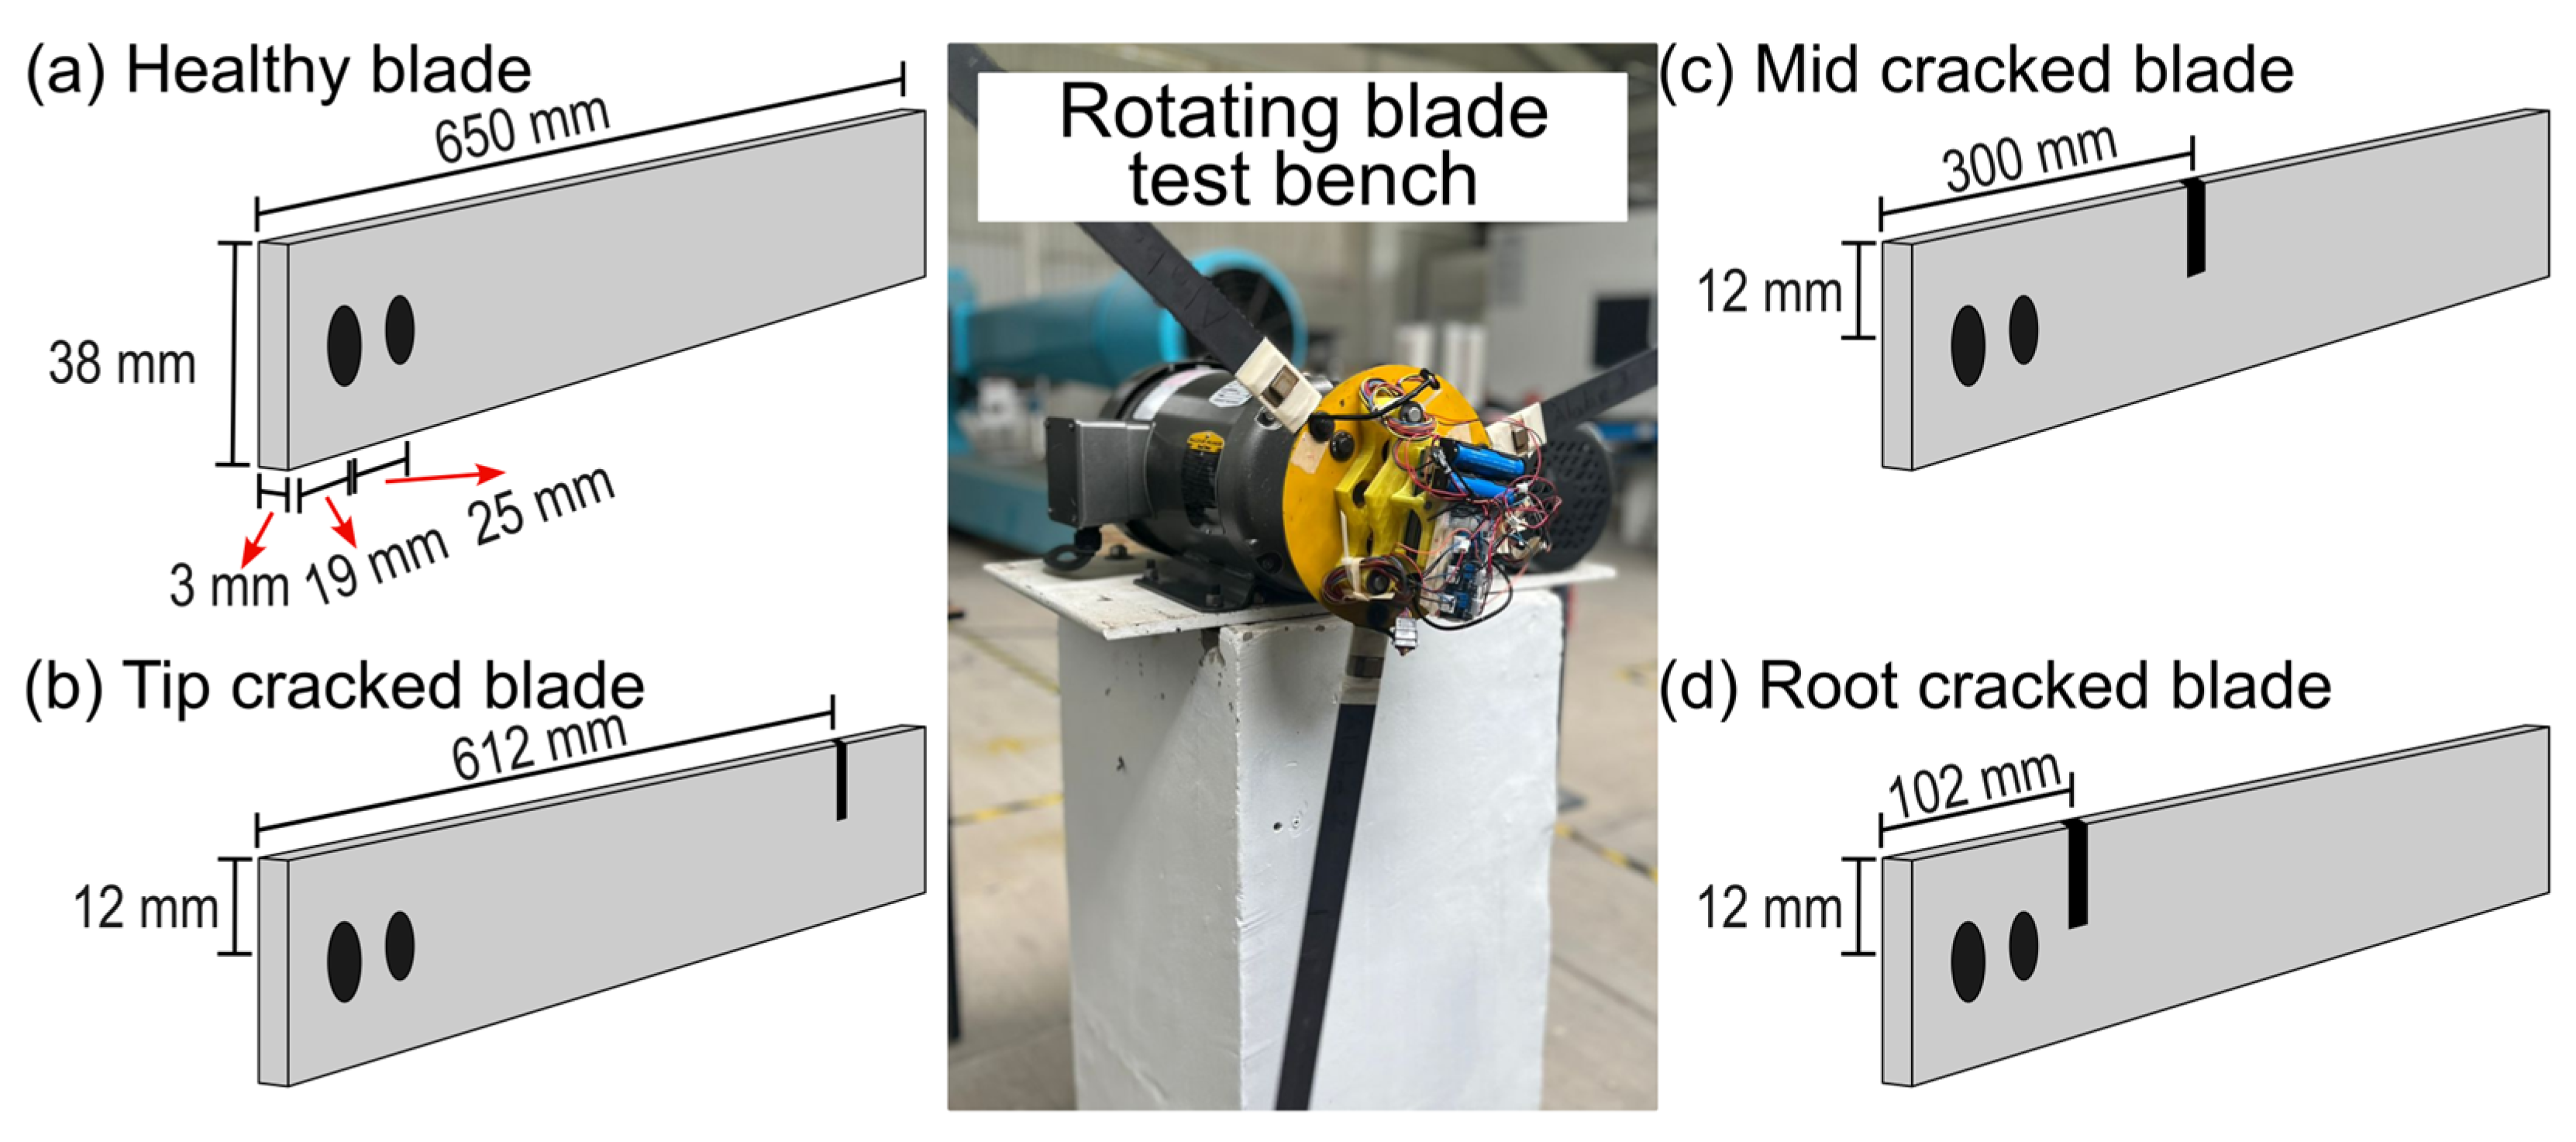
ASTM A36 steel slabs serve as simplified blade profiles. Each slab has a mass of 650 g and dimensions of 650 mm in length, 38 mm in width, and 3 mm in thickness (Figure 5). The moment of inertia , the constant of end condition is , the Young’s modulus of elasticity is , the cross-sectional area of the slab is , and the density of the material is . Each blade’s transverse section was divided into four distinct zones: tip, middle, root, and fixation.
Figure 5.
Dimensions of used blades: (a) uncracked, (b) tip cracked blade, (c) mid cracked blade, and (d) root cracked blade.
Six blades were used for the experimental procedure: three uncracked blades (UC1, UC2, UC3), one with a root crack (CR), one with a mid-blade crack (CM), and one with a tip crack (CT). Each blade was fixed using two 6 mm drill holes. The first hole was positioned 19 mm from the blade edge, spaced 25 mm apart, as shown in Figure 5a. The blades were selected to have comparable mass and geometric dimensions, thereby minimizing variability associated with manufacturing tolerances.
Cracks were intentionally introduced to simulate realistic damage scenarios. For this process, incisions measuring 1 mm in thickness and 12 mm in depth were made. The cracked zones of the blades were located at different distances from the fixation zone, as shown in Figure 5. There are no established standards or regulations for the dimensions of manually induced cracks in blades. In this study and similar research, the induced crack size was intentionally selected to reflect observed damage patterns. This was done by making cross-cuts in the blade laminate.
On the other hand, the second part of the experimental setup is the DAS, which comprises three accelerometers model TE Connectivity 830M1-500, a conditioning stage based on three AD620 operational amplifiers modules, a DAQ HAT model MCC 118, a Raspberry Pi Model 4B+, a power bank, and two batteries of 4 volts.
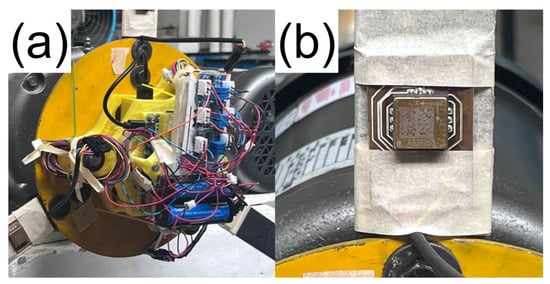
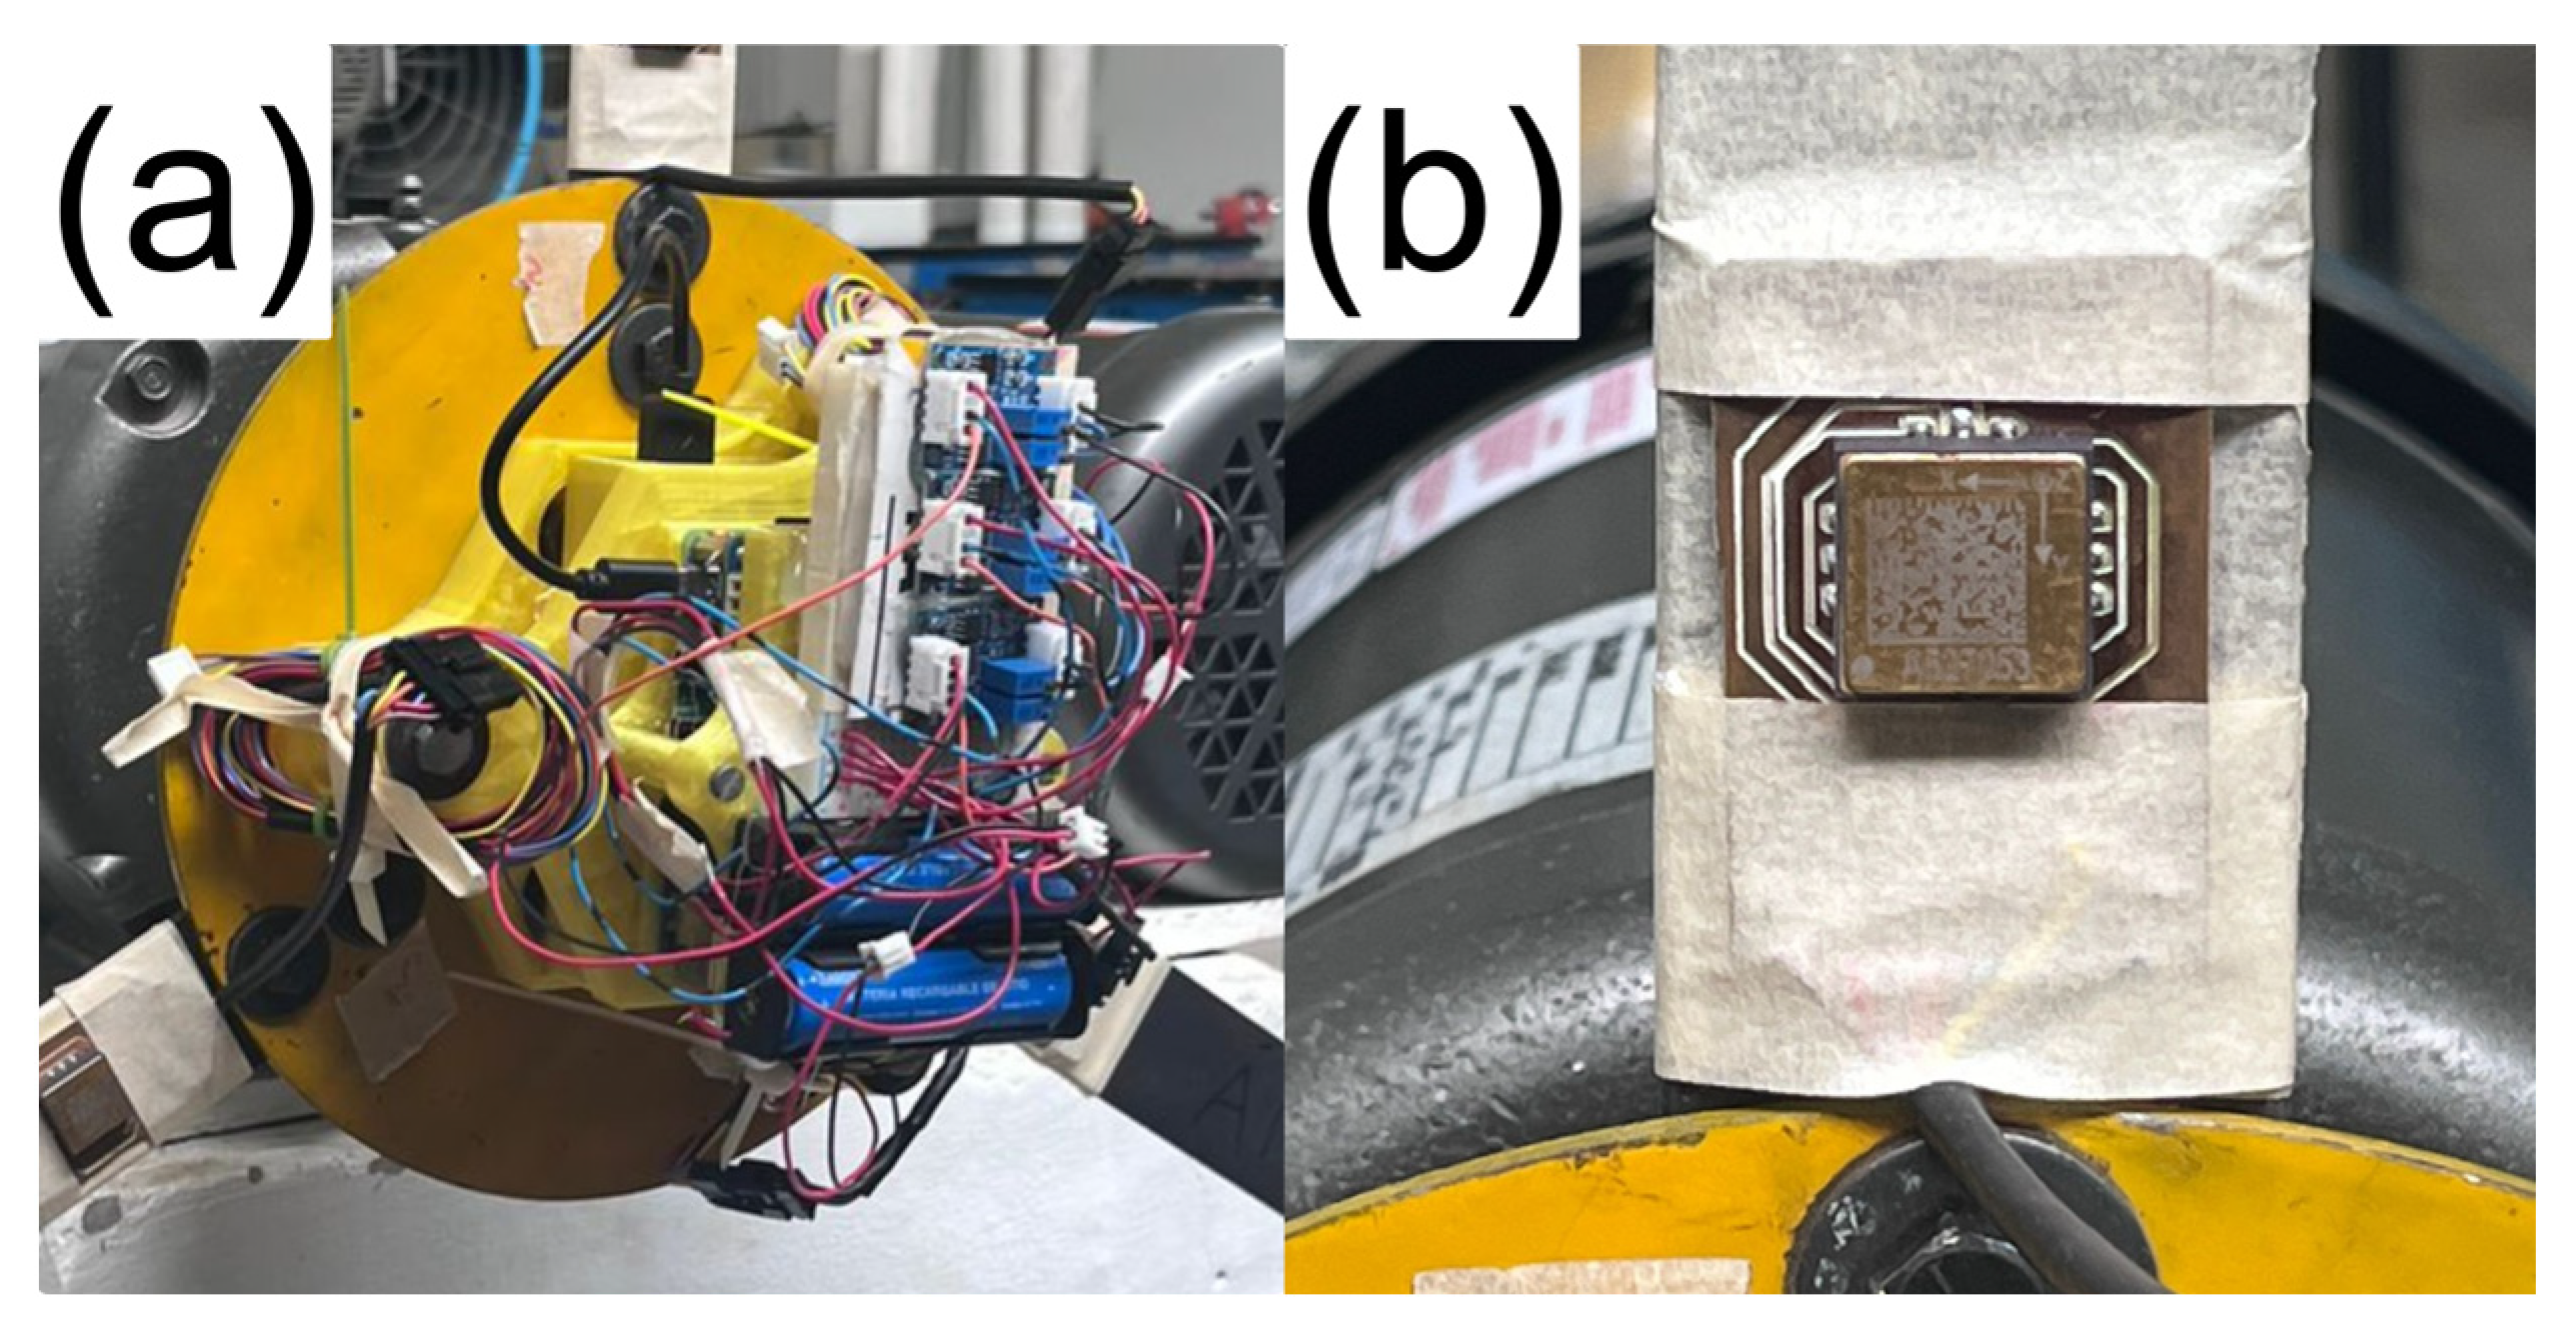
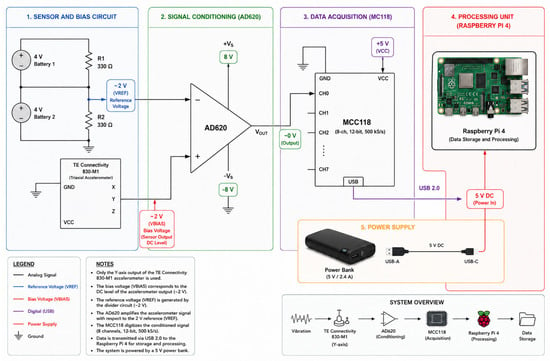
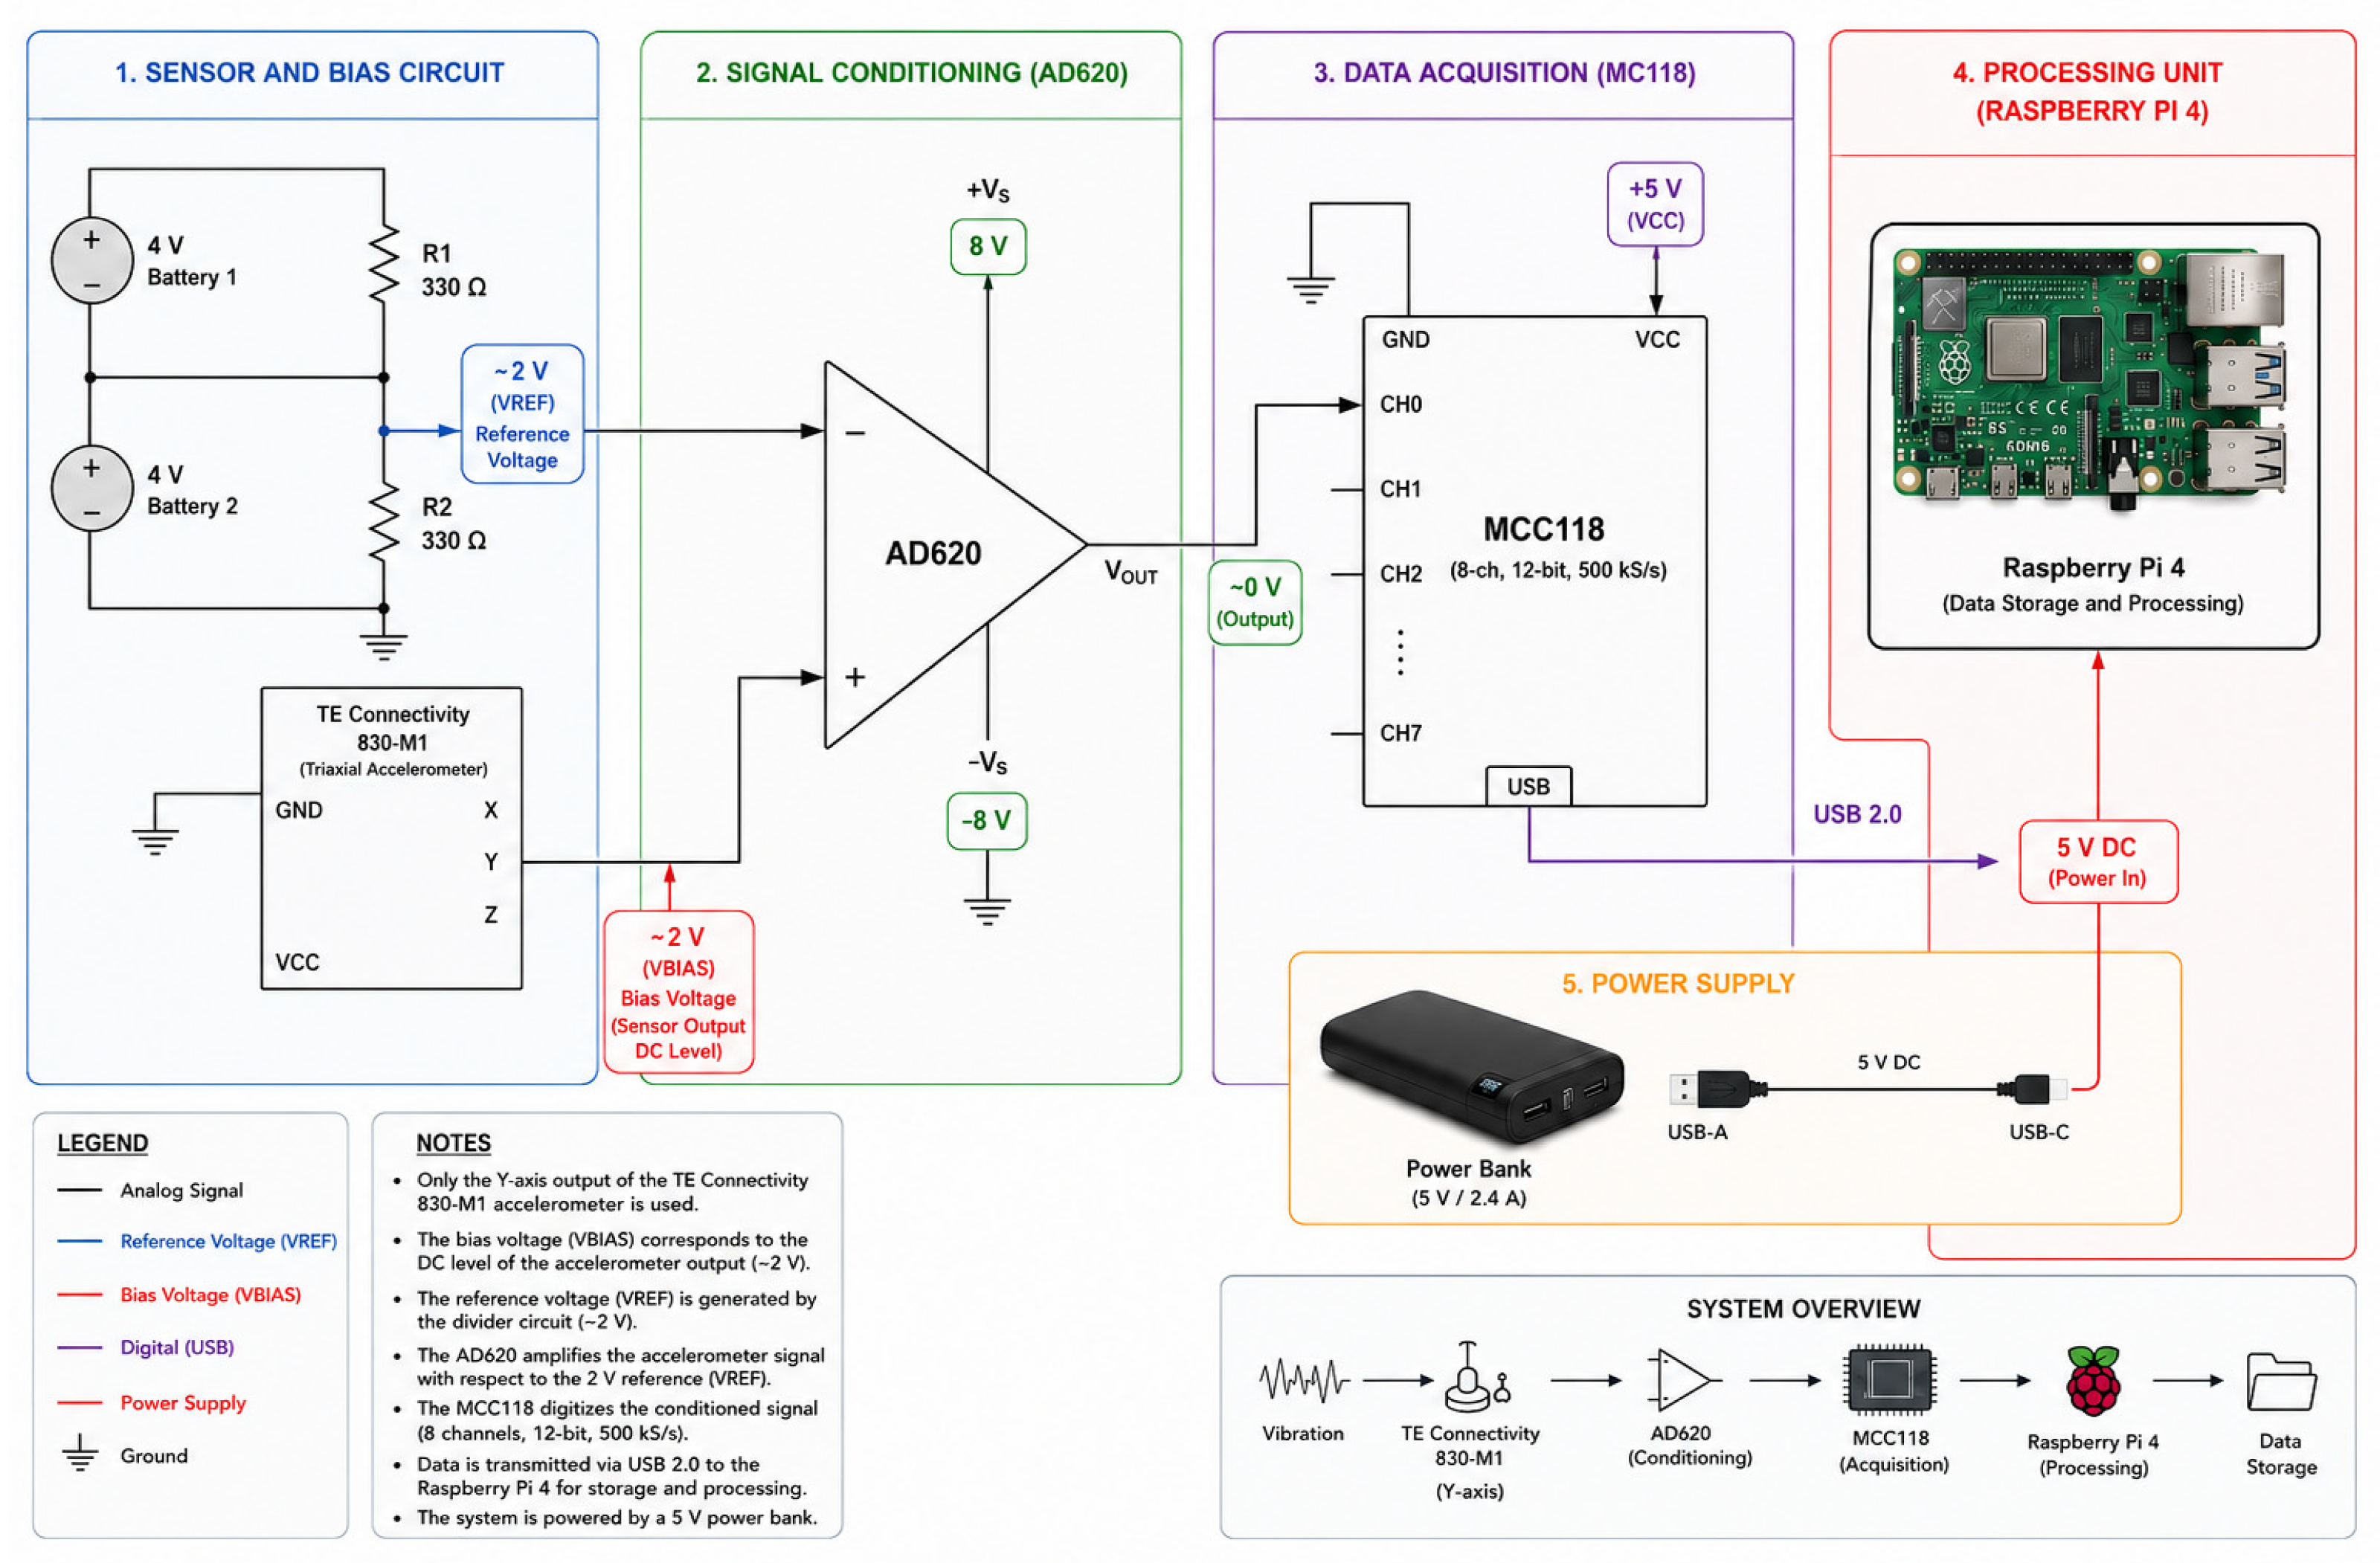
As illustrated in Figure 6a, the DAS and the three steel slabs are attached to the mounting disc. Each accelerometer is attached to the root blades (Figure 6b). The connection diagram of the DAS component is shown in Figure 7. Since the three accelerometers use the same signal-conditioning and acquisition configuration, Figure 7 shows the connection for only one accelerometer for clarity and to avoid unnecessary duplication. The figure is intended solely to illustrate the interconnection of the components within the data acquisition system, as the remaining two accelerometers are connected using the same configuration.
Figure 6.
Data acquisition system elements: (a) a data conditioner and acquisitor, and (b) an accelerometer.
Figure 7.
Connection diagram of the data acquisition system components.
The TE Connectivity 830M1-500 is a triaxial piezoelectric accelerometer designed for condition monitoring and vibration analysis. It measures dynamic acceleration simultaneously along three orthogonal axes (X, Y, and Z) using piezoelectric shear-mode sensing elements integrated into a compact ceramic package. The accelerometer consists of three electrically isolated piezoelectric crystals, each dedicated to one measurement axis and connected to an independent output terminal. As a result, each axis provides an independent signal, minimizing cross-axis interference and preventing output signal mixing. The sensor provides a wide frequency bandwidth (2 Hz–15 kHz), making it particularly suitable for rotating machinery diagnostics, modal analysis, and structural health monitoring.
Unlike MEMS accelerometers, the 830M1-500 is optimized for dynamic rather than static acceleration measurements. Consequently, it exhibits excellent high-frequency performance, low noise, and high long-term stability, making it well suited for vibration-based fault diagnosis.
The 830M1-500 does not output a raw piezoelectric charge signal like traditional charge-mode piezoelectric accelerometers. Instead, it outputs conditioned analog voltage signals (sensitivity of 2.5 mV/g), making it straightforward to interface with data acquisition systems such as DAQ boards or other analog-input hardware.
In this experimental setup, the 830M1-500 operated at an excitation voltage of 4 V; accordingly, the Vbias was 2 V.
The selection of the accelerometer model for acquiring vibration signals from rotating fan blades is typically justified by its dynamic performance, robustness, and measurement reliability in harsh rotating environments. The accelerometer parameters are listed in Table 1.
Table 1.
Accelerometer 830M1-500 key parameters.
The output of each TE Connectivity 830M1-500 triaxial piezoelectric accelerometer was connected to a single AD620 instrumentation amplifier module for signal conditioning prior to digitization. The AD620 amplifies the low-level sensor output while offering high common-mode rejection and low input offset, enabling reliable vibration measurements under the noisy operating conditions associated with rotating machinery, preserving the integrity of the vibration signal. This combination enables reliable acquisition of high-quality data, which is essential for detecting subtle changes in blade dynamics associated with faults such as cracks or imbalance.
The AD620 instrumentation amplifier module also removes the Vbias from the sensors. For that purpose, the batteries were connected to a voltage-divider circuit to obtain a 2-volt reference signal for the AD620 input, as shown in Figure 7.
The Diligent MCC 118, DAQ HAT for Raspberry Pi, is a multichannel acquisition card supporting sampling rates up to 100 kHz per channel and allows stacking of up to eight identical cards. Due to the multiplexed architecture, a base delay of 8 µs occurs between consecutive channels, which represents a negligible 0.8% of the 1000 µs sampling period. The DAQ parameters are summarized in Table 2. For this study, the sampling rate was set to 1 kHz. Additionally, a 10,000 mAh power bank powers the data acquisition system, conditioning stage, and sensors. Data acquisition and storage routines were implemented in Python (version 3.12.1).
Table 2.
DAQ HAT model MCC 118 key parameters.
3.2. Experimental Procedure
The experimental setup was configured to ensure the mechanical stability of the data acquisition system throughout all experimental trials. All acquisition components were rigidly secured with the same mounting configuration throughout the data collection process, thereby preventing relative movement among the sensors, wiring, and the rotating system. Prior to the experimental tests, the hub plate was evaluated independently to verify the absence of abnormal vibration behavior. Although a formal dynamic balancing procedure could not be performed due to the unavailability of specialized equipment, a static balancing procedure was implemented to reduce rotor mass imbalance. The same rotor assembly and mounting configuration were maintained for all experimental conditions, ensuring that any residual imbalance remained constant throughout the data acquisition process. Consequently, variations observed in the measured vibration signals can be primarily attributed to the introduced fault conditions rather than to changes in the experimental setup or rotor balance.
To generate the two datasets under crack-blade conditions, it is first necessary to obtain a dataset in which all blades are healthy and the rotor is balanced. The balancing process in a fan is performed to reduce or eliminate mass imbalance in the rotating components, mainly the blades and rotor. When the mass distribution is not uniform about the axis of rotation, centrifugal forces arise during operation, leading to excessive vibration and other problems. Therefore, the balancing process is essential for maintaining the performance, reliability, and durability of fans, especially in high-speed or continuous-operation applications.
In this work, a static balancing process was carried out. For this process, the healthy, uncracked blades, labeled UC1, UC2, and UC3, were bolted to their assigned hub positions, identified as P1, P2, and P3 (Figure 4). The configuration assigned is as follows: UC1 bolted to P1, UC2 bolted to P2, and UC3 bolted to P3 (see Table 3). Then the rotor was placed on low-friction supports or balancing rails that allowed it to rotate freely. If one side of the rotor were heavier, it would rotate until the heavier part moved downward. This indicated the location of the unbalanced mass. To correct the imbalance, small balancing weights were added to the opposite side. The procedure was repeated until the rotor remained stationary at any angular position, indicating that the mass was evenly distributed about the axis. Once balancing is complete, the uncracked blades assigned to each hub position (Table 3) are not exchanged or replaced with another uncracked blade, as doing so would require repeating the balancing process. As an additional measure, the hub plate was rectified to improve geometric accuracy, and it was tested without blades to verify the absence of abnormal vibration. The same bolts and fastening torque were maintained through all experiments. Consequently, any residual imbalance produced by manufacturing tolerances or the fastening system remained constant through the acquisition process.
Table 3.
Blade condition, labels, and positions of the blade.
After the balancing process, the conditioned vibration signals of the spanwise axis from each of the three blades during rotor operation were acquired and recorded. The vibration signal was measured using a piezoelectric accelerometer attached with epoxy resin to the root of each blade, and the wire was protected with tape. The sensor cable was routed along the blade surface and mechanically secured using adhesive and tape to prevent relative motion during rotor operation. The remaining cable was fixed to the DAS support structure and routed as close as possible to the rotation axis, minimizing centrifugal loading and cable-induced vibration. This ensures no relative movement of the sensors and wiring during rotor operation.
Spanwise vibration signals were acquired using accelerometers mounted at the root of each blade under both healthy and damaged operating conditions. Baseline vibration measurements were first acquired with all three blades undamaged to establish the reference state. Subsequently, the controlled cracks were introduced sequentially at three predefined spanwise locations on each blade, namely the TC, MC, and RC regions (see Section 3.1). To ensure that the dynamic response associated with each damage condition could be evaluated independently, a single crack was induced on only one blade at a time. In contrast, the other two blades remained undamaged throughout the test. This experimental protocol was repeated for every crack location on each of the three blades, yielding a comprehensive dataset comprising the healthy condition and all possible combinations of individual blade–damage locations. In total, the dataset consists of 10 experimental cases (see Table 4). For each case study, there are 7680 files; each file contains 3 data columns with 500 samples corresponding to the output-voltage vibration of the three blades.
Table 4.
Case studies of the blade’s conditions.
The dataset includes multiple case studies because blades, even those produced by the same manufacturer, may exhibit different behaviors when developing a crack-monitoring system based on vibration signals. This variability is influenced by operational and physical factors, which may lead to phenomena such as wake effects or structural differences among the blades.
During the experimental testing of a cracked blade, the two healthy (uncracked) blades must remain in the same positions as those assigned during balancing (Table 3). At the same time, the third blade is replaced with one of the three types of cracked blade: TC, MC, or RC. Table 4 presents all the case studies of the cracked zones in the three blades. To illustrate, the blade bolted to P1 is MC, while the blades bolted to P2 and P3 remain uncracked and are referred to as UC2 and UC3, respectively (case 3). In case 10, the blade bolted to P3 is RC, while the blades bolted to P1 and P2 are uncracked, labeled UC1 and UC2, respectively.
To ensure the reliability and repeatability of the acquired data, a verification procedure was performed before acquiring and storing each block of 1500 files. The procedure included verifying the calibration and secure mounting of the piezoelectric accelerometers, inspecting the blade profiles and their fastening system, verifying the calibration of the signal conditioning modules, checking the power supply, and confirming the proper operation of the data acquisition system. These verification procedures were carried out under both static and dynamic operating conditions, as appropriate.
Following system verification, the test bench was operated until the control system reached steady-state conditions. Once stable operation was achieved, the output voltage signals corresponding to the vibration response of the evaluated operating condition were acquired and stored by the data acquisition system.
After acquiring all the case studies, the conditioned and stored data were normalized. The normalization was performed using the absolute maximum (Max Absolute) Scaling Method. The technique was implemented in Python using the scikit-learn (version 1.4) library.
The vibration signals were recorded under the following experimental conditions:
- Conditioned and normalized vibration samples were collected at 1 kHz.
- Data acquisition began two minutes after the test bench started operating, allowing the system to reach a steady, optimal speed. During this period, a preliminary capture was performed to verify the status of the acquisition system.
- Vibrations in the Y- direction of the blades were recorded.
- The sampling size for each case studied (Table 4) was 500 samples per sensor (0.5 s of acquisition). Data segments were saved in individual files.
- After acquiring the signals from the selected case study (Table 4), another case study was randomly selected under the same experimental conditions as previously described.
- The accelerometers implemented were not removed from the tested blade. Instead, they were detached from the hub prior to decoupling it from the rotor. Subsequently, the accelerometers were reattached to the blade associated with the new case being evaluated. This procedure ensures that the signals captured in each case remain consistent, as the positions of each sensor are preserved.
For all the experiments, the rotational speed of the blade was 240 rpm, which is a rotational frequency of about 4 Hz (Equation (1)).
The vibration response measured at the blade roots is expected to contain contributions from both rotational excitations and the structural dynamics of the blades.
The primary rotational excitation frequencies are integer multiples of the shaft rotational frequency (1X), namely 4, 8, 12, 16, 20, and 24 Hz. Since the rotor consists of three equally spaced blades, the blade passing frequency is given by
where is the number of blades. The and its higher harmonics are expected to constitute the dominant deterministic components of the measured vibration signals.
The 0.5 s of acquisition time corresponds to approximately two rotor revolutions at the operating speed of 240 rpm. However, the purpose of the dataset is not limited to the analysis of the rotor rotational frequency.
The measured vibration signals contain multiple frequency components originating from the dynamic response of the rotating bladed system, including blade structural vibrations, higher-order harmonics, and other dynamic phenomena associated with the rotating assembly. Consequently, although each segment contains approximately two rotor revolutions, it includes substantially more cycles for these higher-frequency components, which are relevant to vibration-based damage detection and structural health monitoring. This is shown in Figure 1 and Figure 2.
In addition, the 0.5 s segment length was selected as a compromise between capturing representative vibration information and generating a sufficiently large number of samples for data-driven approaches. The complete dataset was originally acquired as continuous records of 5000 samples, which were subsequently segmented into non-overlapping windows of 500 samples. This segmentation facilitates the development and benchmarking of signal-processing and machine-learning algorithms while preserving the dynamic characteristics of the measured vibration signals.
From a structural perspective, each blade can be modeled as a cantilever beam subjected to centrifugal loading. Considering the mechanical properties of ASTM A36 steel (Young’s modulus of 200 GPa and density of 7850 kg/m3), the first bending natural frequency of the stationary blade is expected to lie between approximately 10 Hz and 14 Hz. In contrast, the second and third bending modes are anticipated within the ranges of 60 Hz to 90 Hz and 170 Hz to 250 Hz, respectively. During rotation, centrifugal forces introduce axial tensile stresses that increase the effective bending stiffness of the blades, producing the well-known centrifugal stiffening effect. Consequently, the natural frequencies are expected to increase by approximately 3% to 15%, depending primarily on the blade mounting radius and the boundary conditions.
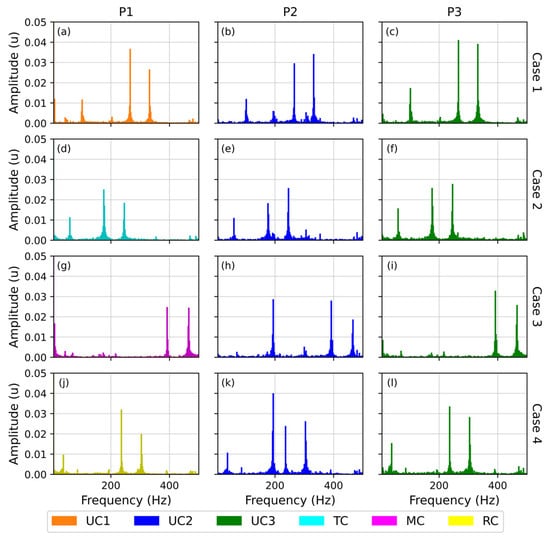
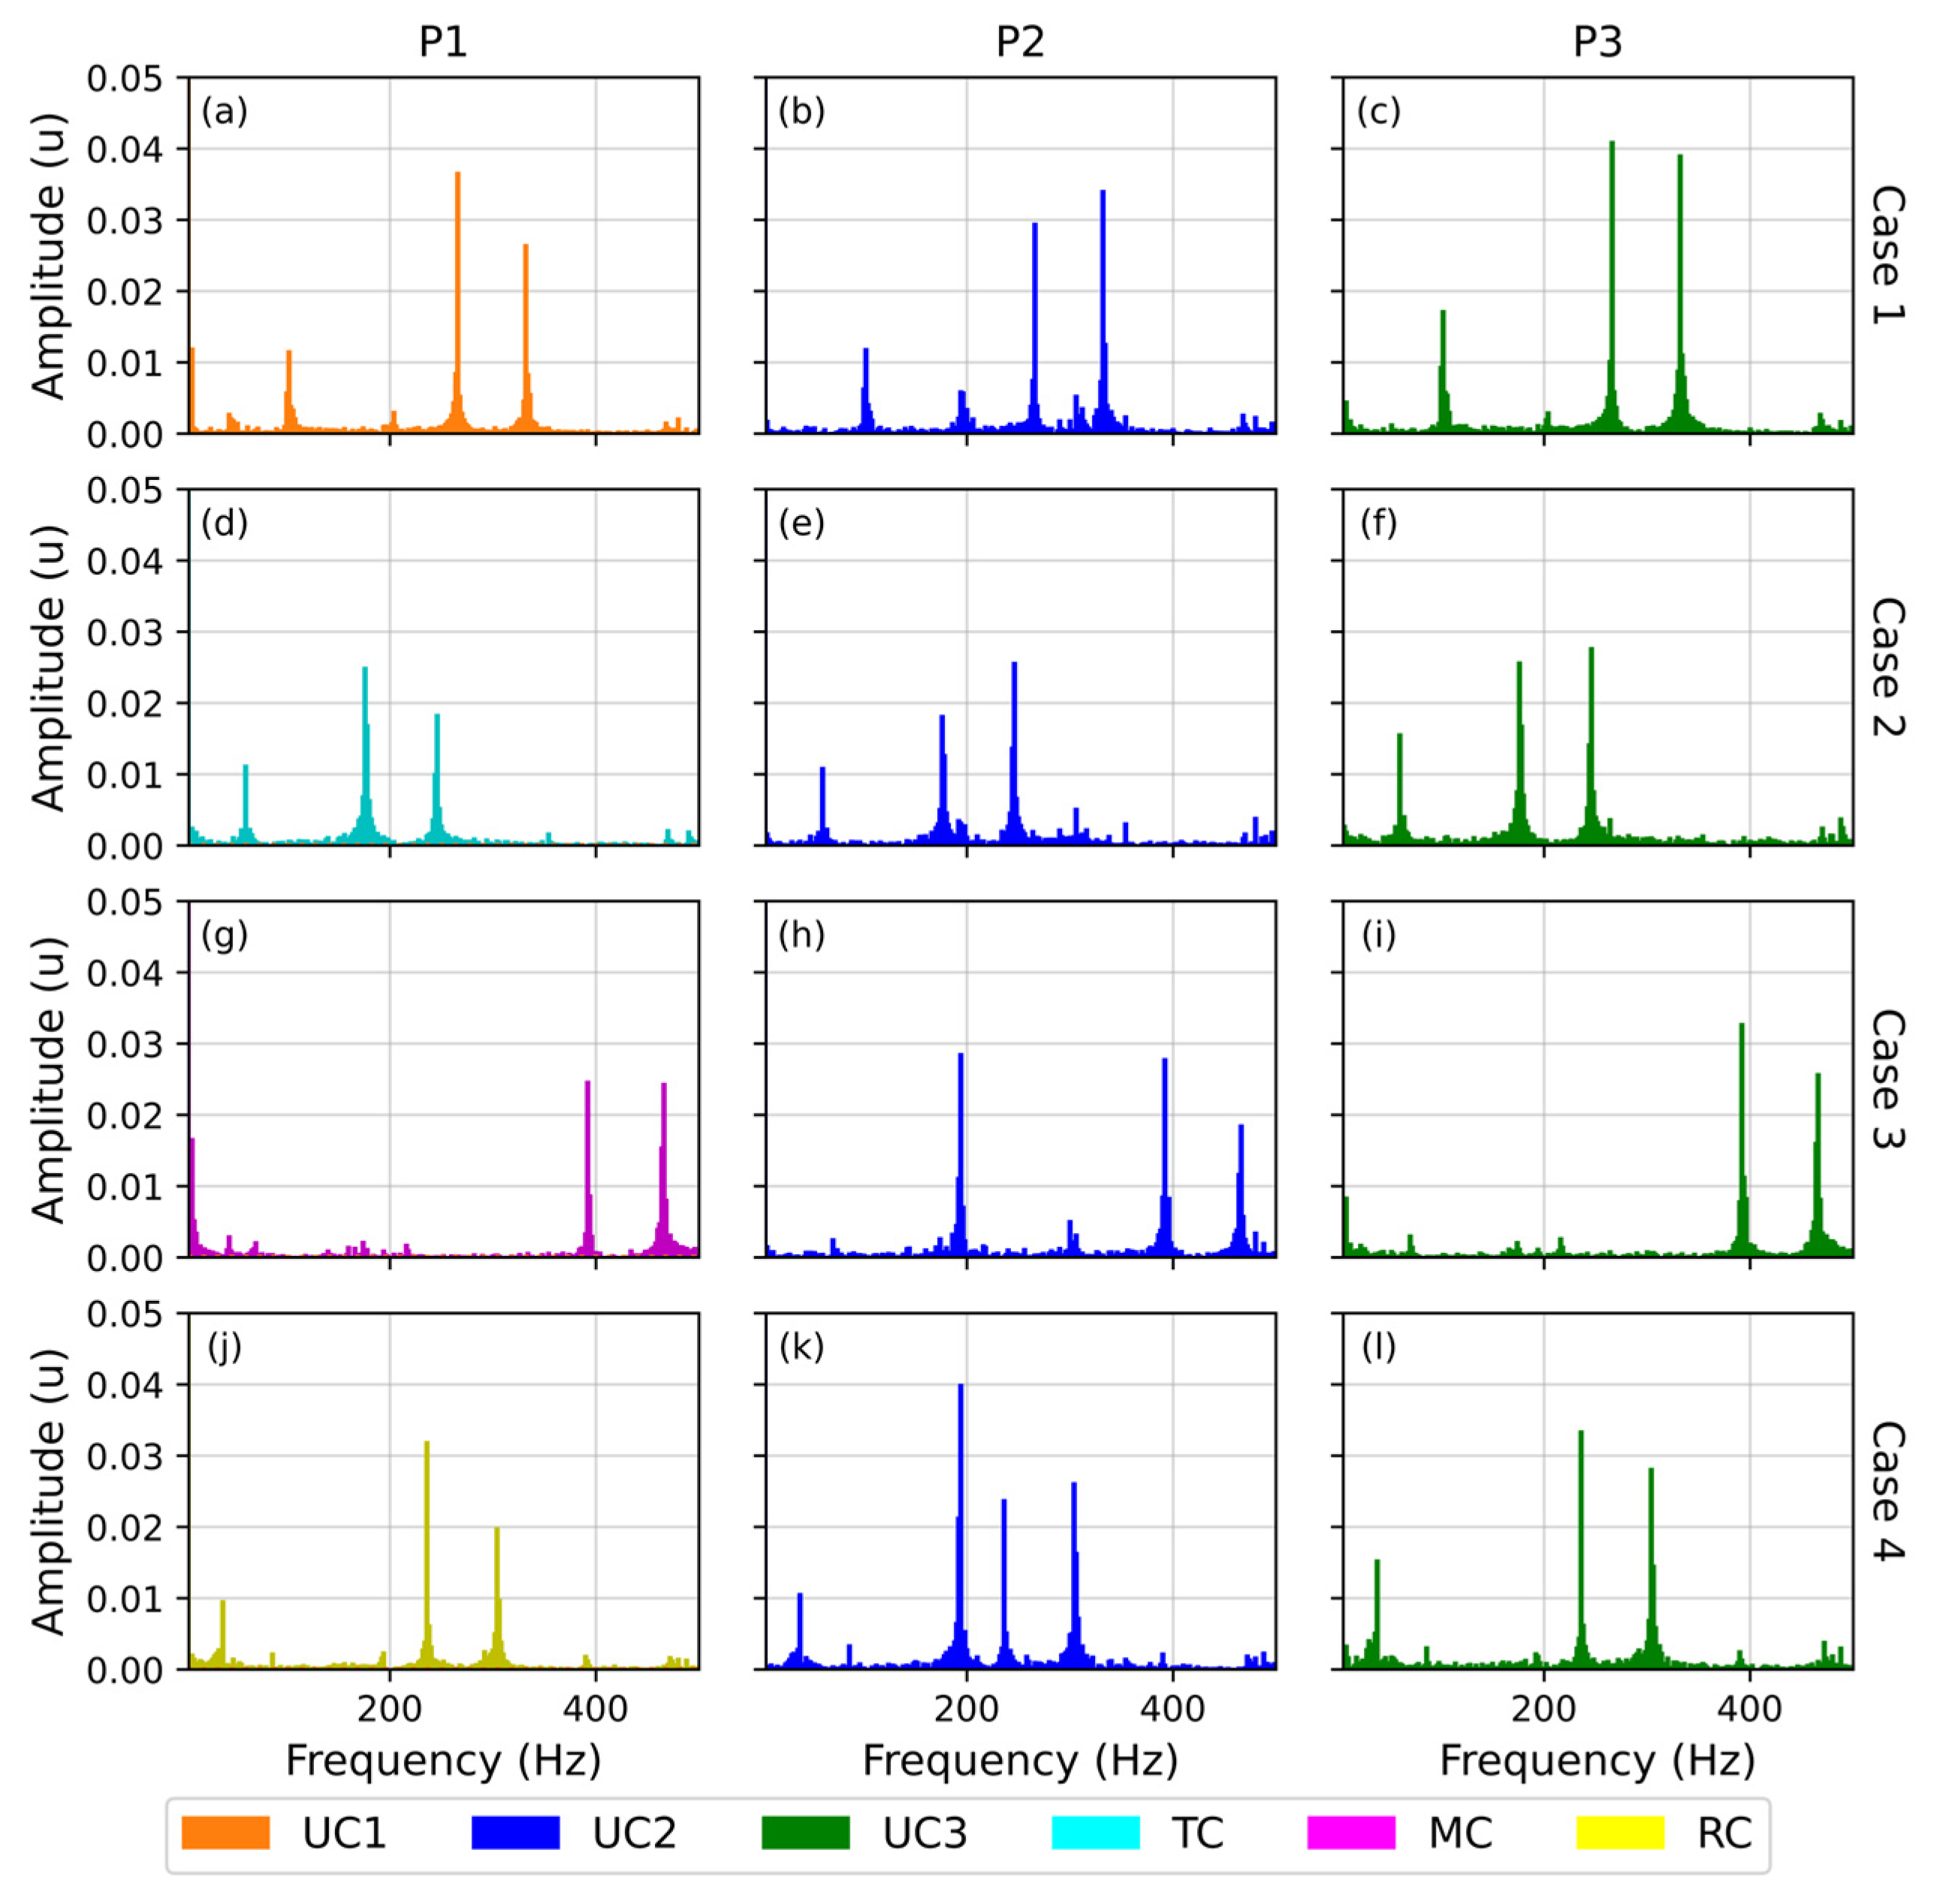
Accordingly, the frequency spectrum obtained from an accelerometer installed at the blade root is expected to exhibit distinct peaks at the shaft rotational frequency (4 Hz), its harmonics, the blade passing frequency (12 Hz), and the higher structural modes. Under damaged conditions, additional spectral features may appear, including reductions in the first bending natural frequency, increases in vibration amplitudes near resonance, sidebands around the blade passing frequency and its harmonics, and increased broadband vibration energy resulting from the nonlinear behavior introduced by crack propagation.
To accurately characterize both the excitation frequencies and the structural dynamic response, vibration measurements should be acquired over a frequency range extending to at least 300 Hz. This bandwidth encompasses the rotational harmonics, the first three bending modes, and the spectral components commonly associated with structural damage, providing sufficient information for frequency-domain analysis and machine-learning-based crack detection. For that, the vibration samples were collected at 1 kHz.
Figure 8 presents the frequency-domain representation of the conditioned vibration signals for Cases 1–4 described in Table 4. Figure 8a–c correspond to Case 1 and show the frequency spectra of healthy blades 1, 2, and 3, respectively. Figure 8d–f correspond to Case 2, where Blade 1 contains a tip crack (TC), while blades 2 and 3 remain healthy. Figure 8g–i correspond to Case 3, where Blade 1 contains a middle crack (MC), whereas blades 2 and 3 remain in the healthy condition. Finally, Figure 8j–l correspond to Case 4, in which blade 1 contains a root crack (RC), while Blades 2 and 3 remain healthy. These spectra demonstrate the presence of the rotational harmonics, the first three bending modes, and the spectral components commonly associated with structural damage.
Figure 8.
Plots of the normalized frequency spectrum data: (a) UC1 of Case_1_Conditioned, (b) UC2 of Case_1_Conditioned, (c) UC3 of Case_1_Conditioned, (d) TC of Case_2_Conditioned, (e) UC2 of Case_2_Conditioned, (f) UC3 of Case_2_Conditioned, (g) MC of Case_3_Conditioned, (h) UC2 of Case_3_Conditioned, (i) UC3 of Case_3_Conditioned, (j) RC of Case_4_Conditioned, (k) UC2 of Case_4_Conditioned, and (l) UC3 of Case_4_Conditioned.
3.3. Benchmark Analysis
To demonstrate the applicability of the proposed dataset, a baseline machine learning benchmark was conducted using the normalized vibration dataset. The benchmark is based on the methodology presented in our previous comparative study, in which vibration signals acquired from the same experimental platform were used to develop and evaluate machine learning models for crack diagnosis [11].
The benchmark involved extracting time-domain statistical features from each vibration segment using the TSFresh version 0.21.2 feature-extraction library. The extracted features were subsequently normalized and used to train several supervised machine learning classifiers, including Decision Tree (DT), Support Vector Machine (SVM), K-Nearest Neighbors (KNN), and Multilayer Perceptron (MLP). Among the evaluated models, the KNN classifier achieved the best overall performance for crack identification.
Using the proposed dataset, the baseline KNN model achieved an overall classification accuracy of 99.86%, with precision 99.87%, recall 99.877%, and F1-score 99.87% (see Table 5). These results demonstrate that the vibration signals contained in the dataset provide sufficient discriminative information to distinguish between healthy and cracked operating conditions.
Table 5.
Results of metrics calculated during tests of the best machine learning models for each algorithm used with the normalized dataset.
The purpose of this benchmark is not to establish the highest achievable diagnostic performance, but rather to provide a reproducible baseline for future studies. Researchers may employ the proposed dataset to evaluate alternative feature extraction techniques, signal processing methods, deep learning architectures, or machine learning algorithms and compare their performance against this reference benchmark.
4. User Notes
These datasets include conditioned and normalized vibration signals recorded at the roots of rotating blades, covering both healthy and cracked conditions across different cross-sectional areas.
The datasets currently include only crack damage, which represents one of several possible damage types in blades. Additional damage mechanisms, such as fatigue, weld cracking, erosion, deformation, and corrosion, in conventional fans will be addressed in future work.
It should be noted that the artificial cuts used in this work represent controlled damage scenarios rather than naturally propagated fatigue cracks. Therefore, the effects of crack width, depth, orientation, irregular crack geometry, and manufacturing variability were not investigated. Future studies will incorporate these factors to further assess the robustness of the proposed damage detection methodology under more realistic operating conditions.
The provided datasets provide a basis for future research, allowing variables such as temperature, humidity, load variation, and other real-world factors to be included.
The dataset provides a valuable experimental resource for advancing early crack detection strategies. Nevertheless, its direct applicability to full-scale wind turbine blades requires further validation under representative operational and environmental conditions. The laboratory test bench was not intended to replicate the complete structural and operational characteristics of utility-scale wind turbines. Instead, it provides a controlled environment for investigating the vibration response of rotating bladed systems with localized structural damage. Consequently, the simplified steel blades differ from wind turbine blades in terms of material properties, geometry, structural scale, loading conditions, rotational speed, and boundary conditions. The objective of this work is therefore not to reproduce the dynamic behavior of a full-scale wind turbine, but to provide a reliable experimental benchmark for the development and evaluation of vibration-based structural health monitoring methodologies. The proposed dataset may serve as a preliminary benchmark for methodologies that can be validated later on full-scale wind turbine blades under realistic operating conditions. However, such validation is beyond the scope of the present study.
Author Contributions
Conceptualization, J.B.R.-O.; methodology, J.B.R.-O.; software, A.S.-A.; validation, P.Y.S.-C.; formal analysis; investigation, P.Y.S.-C.; resources, E.N.H.-E.; data curation, A.S.-A.; writing—original draft preparation, P.Y.S.-C.; writing—review and editing, A.S.-A.; visualization, J.R.-R.; supervision, J.B.R.-O.; project administration, E.N.H.-E. and A.L.-L.; funding acquisition, P.Y.S.-C. All authors have read and agreed to the published version of the manuscript.
Funding
This research was funded by the Secretaría de Ciencia, Humanidades, Tecnología e Innovación (SECIHTI), Convocatoria de Ciencia de Frontera 2023; grant number CF-2023-I-2533.
Data Availability Statement
The dataset can be found at https://data.mendeley.com/datasets/9m4rk6b4r8/1 (accessed on 5 August 2026).
Acknowledgments
The authors would like to acknowledge the Secretaría de Ciencia, Humanidades, Tecnología e Innovación (SECIHTI), and the Sistema Nacional de Investigadoras e Investigadores (SNII).
Conflicts of Interest
The authors declare no conflicts of interest.
Abbreviation
The following abbreviation is used in this manuscript:
| DAS | Data acquisition system |
References
- Lei, Y.; Lin, J.; He, Z.; Zuo, M.J. A review on empirical mode decomposition in fault diagnosis of rotating machinery. Mech. Syst. Signal Process. 2013, 35, 108–126. [Google Scholar] [CrossRef] [Scilit]
- Fu, S.; Gao, Y. Fan blade crack diagnosis method study. Adv. Mech. Eng. 2016, 8, 1–8. [Google Scholar] [CrossRef] [Scilit]
- Ben Hassen, M.; Ben-Elechi, S.; Mrad, H. Crack propagation in axial-flow fan blades under complex loading conditions: A FRANC3D and ABAQUS co-simulation approach. Appl. Sci. 2025, 15, 1597. [Google Scholar] [CrossRef] [Scilit]
- Patil, A.K.; Jamadar, I.; Suresha, B. Numerical and experimental study of vibrations caused by defects in fan blades. J. Mines Met. Fuels 2023, 71, 770–775. [Google Scholar]
- Smith, W.G.; Heyns, P.S. Fan blade damage detection using on-line vibration monitoring. R D J. 2002, 18, 3. [Google Scholar]
- Yu, M.; Fu, S.; Gao, Y.; Zheng, H.; Xu, Y. Crack detection of fan blade based on natural frequencies. Int. J. Rotating Mach. 2018, 2018, 2095385. [Google Scholar] [CrossRef] [Scilit]
- Abdulkarem, W.; Amuthakkannan, R.; Al-Raheem, K.F. Centrifugal pump impeller crack detection using vibration analysis. In Proceedings of the 2nd International Conference on Research in Science, Engineering and Technology (ICRSET’2014), Dubai, United Arab Emirates, 21–22 March 2014. [Google Scholar]
- Hu, B.; Li, B. Blade crack detection of centrifugal fan using adaptive stochastic resonance. Shock Vib. 2015, 2015, 954932. [Google Scholar] [CrossRef] [Scilit]
- Ma, W.; Qi, Y.; Tang, H. Automatic detection technology of fan blade cracks based on multi-scale feature fusion under intelligent technology. In Proceedings of the 2022 International Conference on Artificial Intelligence and Autonomous Robot Systems (AIARS), Bristol, UK, 29–31 July 2022; IEEE: New York, NY, USA, 2022; pp. 126–130. [Google Scholar]
- Ogaili, A.A.F.; Jaber, A.A.; Hamzah, M.N. Wind Turbine Blades Fault Diagnosis Based on Vibration Dataset Analysis. Data Brief 2023, 49, 109414. [Google Scholar] [CrossRef] [Scilit] [PubMed]
- Salgado-Ancona, A.; Sevilla-Camacho, P.Y.; Robles-Ocampo, J.B.; Rodríguez-Reséndiz, J.; De la Cruz-Arreola, S.; Hernández-Estrada, E.N. Comparative study of vibration-based machine learning algorithms for crack identification and location in operating wind turbine blades. AI 2025, 6, 242. [Google Scholar] [CrossRef] [Scilit]
- Sevilla Camacho, P.Y.; Robles Ocampo, J.B. Raw and Normalized Vibration Signals of Blades with Different Cracked Zones in Rotating Bladed System. Mendeley Data V1. 2026. Available online: https://data.mendeley.com/datasets/9m4rk6b4r8/1 (accessed on 5 August 2026).

Disclaimer/Publisher’s Note: The statements, opinions and data contained in all publications are solely those of the individual author(s) and contributor(s) and not of MDPI and/or the editor(s). MDPI and/or the editor(s) disclaim responsibility for any injury to people or property resulting from any ideas, methods, instructions or products referred to in the content. |
© 2026 by the authors. Licensee MDPI, Basel, Switzerland. This article is an open access article distributed under the terms and conditions of the Creative Commons Attribution (CC BY) license.