


Abstract
Grazing systems, commonly considered less productive than indoor livestock farming, account for most farms and agricultural land worldwide. Beyond feeding livestock, they fulfil essential environmental, economic, and social functions that are particularly relevant to sustainable development in the context of climate change, resource constraints, and population growth. By relying on circular resource use and promoting ecological processes, grazing systems can offset methane emissions from livestock through soil carbon sequestration while preserving biodiversity, maintaining landscapes, and reducing fire risks. In order to assess whether grazing systems are actually less productive than indoor systems, data from comparative trials assessing these two feeding environments published over 40 years were used as the basis for a meta-analysis published in 2014. This analysis showed that animal performance on pasture was equivalent to that indoors, despite the supplementation provided primarily to indoor feeding environments. Given the economic and environmental context and the challenges related to the sustainable development of livestock farming, here, we present this 2014 data to encourage its equitable reuse and contribute to a better overall assessment of grazing in current debates, considering all aspects, including animal performance. Furthermore, supplementing this initial dataset with additional data will lead to an even more comprehensive evaluation of these grass-based livestock systems.
Dataset Licence: CC-BY 2.0
1. Summary
Grazing livestock systems are often perceived as less productive than indoor livestock farming systems. Nevertheless, they remain the dominant form of livestock production worldwide, representing about 90% of farms and covering nearly 67% of global agricultural land [1,2]. Beyond their role in food production, grazing systems fulfil key environmental, societal and economic functions, making them highly relevant to sustainable development in both temperate or tropical regions, particularly in the context of climate change, increasing resource constraints and a growing global population [3,4].
Although livestock contributes to methane emissions, grazing and mixed-crop livestock systems can contribute to climate mitigation through soil carbon sequestration, stimulated by manure deposition and trampling under appropriate adaptive grazing management [5,6]. At the same time, they contribute to a wide range of ecosystem services, including biodiversity conservation, landscape maintenance, and fire risk reduction.
Beyond their environmental functions, pasture-based livestock systems are deeply embedded in rural territories and local social structures. Through the conversion of non-human-edible biomass into nutrient-dense animal products, ruminants improve resource-use efficiency and food provision [7,8,9]. These systems also support rural economies and contribute to the preservation of cultural landscapes and traditional agricultural practices [10].
Pasture-based farming systems contribute to economic sustainability through the efficient use of locally available forage resources and reduced reliance on external inputs. By converting low-value, non-human-edible biomass into animal products, ruminants enhance resource-use efficiency while limiting feed–food competition for arable land [8]. However, realizing the full potential of grazing as a lever for sustainable development under increasing climatic constraints requires the overcoming of persistent challenges, notably soil degradation and overgrazing [5]. Effective grazing management therefore emerges as a critical prerequisite for balancing livestock production, ecosystem functioning, and long-term sustainability. Because ecological, socio-economic, and climatic conditions vary widely across territories, management strategies must be context-specific rather than universally applied [11,12]. Practices that generate positive outcomes in one setting may prove ineffective or impractical or may even produce undesirable trade-offs in another.
Yet, beyond the challenge of improving grazing management, a more fundamental issue concerns the perceived productivity of grazing systems. The widespread perception that grazing systems are less productive than indoor livestock systems continues to shape livestock management strategies and policy orientations, despite growing evidence that grazing systems can serve as key drivers of agroecological transition [13]. And in this context, organizational innovations may also represent a promising avenue for enhancing the effectiveness, adaptability, and perceived performance of grazing-based livestock systems, thereby supporting their broader contribution to sustainable development [5].
To address this issue, we compiled data from the literature, analyzing 93 publications from nearly 29 countries, comprising a total of 248 treatments comparing ruminant feeding on pasture and indoors. Based on these data, we carried out a meta-analysis [14] following established methodological standards [15,16], which highlighted that pasture-fed animals can achieve the same performance as indoor-fed animals, when the diet is similar.
We present this dataset here, in accordance with the FAIR principles of open science [17], to facilitate its reuse and support research on the role of grazing in sustainable livestock systems. Indeed, since ruminant feeding practices have changed little, the information available in this database, collected over more than 40 years, should make it possible to evaluate these farming systems according to their productivity, while taking into account other aspects, including environmental ones. Furthermore, the addition to this initial database of more recent studies published between 2012 and 2026 (although fewer in number due to stricter regulations on animal experimentation) should refine the evaluation of grazing systems. Such integrated analyses are essential for reconciling food security concerns with environmental and social issues [18].
2. Data Description
2.1. Dataset Summary
The PASTorIN dataset (comparing the performance of PASTure-fed versus INdoor-fed animals) was compiled from data collected in the published literature and comprises 39 variables. PASTorIN is presented in four files.
Two of these files are in CSV (Comma-Separated Value) format, the first providing detailed information on the variables included (PASTORIN_1_VARIABLES), and the second (PASTorIN_2_DATA) providing, for each of the 39 variables, the extracted or calculated values (from tables and figures) measured for the 248 treatments (one treatment per line) reported in the 93 annotated publications. These variables have been organized into five categories (cf. below, PASTorIN_1_VARIABLES).
A third file (PASTorIN_3_MAP (.shp) provides the geographical origin of the data collected in SHP format (a vector data storage format used to archive the location, shape and attributes of geographical entities).
A fourth file (PASTorIN_4_REFERENCES, Word format) contains the list of the 93 references used from the literature, with their DOI.
2.2. PASTorIN_1_VARIABLES
This file provides for each of the 39 variables considered in this dataset, all the information necessary for understanding by future users (one row per variable), namely:
- Variable names.
- The category to which they belong, in relation to the information provided and numbered from 1 to 5, namely, 1_general_information, 2_animal_characteristics, 3_diet_characteristics_ &_ feeding modalities, 4_intake_digestibility_&_ingestive_behaviour, 5_carcass characteristics. These five categories are detailed below in the description of PASTorIN_2_DATA.
- The type of the variable, i.e., whether it is numeric or not.
- The unit when the variable is numeric. The unit indicated results from a harmonization of the set of values and units provided in the 94 publications involved. The unit for non-numerical variables is indicated as “not available,” abbreviated as ‘’n_a.”
- A detailed description of each variable.
The 39 variables listed within the first column of PASTorIN _1_VARIABLES correspond to the 39 column headers in PASTorIN _2_DATA.
2.3. PASTorIN_DATA
This file contains 248 rows (for the 248 treatments tested, comparing the two feeding systems, pasture or barn, combined with various other effects) and 39 columns (for the 39 identified variables) measured during experiments described in the 93 annotated publications. Some publications present data from several treatments tested, with up to 15 different treatments in some of them (see Chapman, 1972, cited in PASTorIN_4_REFERENCES).
Furthermore, some of the treatments tested and their associated measures were sometimes the subject of multiple publications by the same author, generally in the same year (this was the case for nine authors). In these instances, the data for a given treatment, reported for the 39 variables in the corresponding 39 columns, may originate from several publications). This also explains the difference between the number of authors for the same year listed in PASTor IN_MAP (N = 84 in the fourth and fifth columns of the file) and the number of publications listed in PASTor IN_REFERENCES (N = 93). The reported values were generally extracted from tables and figures available in publications or calculated when possible. These values were organized into five categories of information.
The first category, “1_general_information,” includes 5 columns, including information on the publication, the author, the year, and the ex-experimental feeding environment as described in Section 3 of the publications in question.
The second category, “2_animal_characteristics,” gathers information into 11 columns, preceded by the number 2, concerning species, breed, sex, age and physiological stage, as well as all details relating to live weight and average daily gain. The statistics for the numerical data in this second category are detailed below in Table 1, first for cattle and then for small ruminants (sheep and goats).
Table 1.
Descriptive statistics of animal characteristics (numerical data).
The third category, “3_dietary_characteristics_and_feeding_methods,” details, through 13 columns, whether the rations are composed of forage, grass, and/or legumes (whose characteristics are detailed in the first 11 columns), with or without supplements/additives (detailed in the following 2 columns). Statistics for the main numerical variables describing the rations, including their chemical composition, are presented in Table 2.
Table 2.
Descriptive statistics for the numerical variables characterizing the diets.
The fourth category, “4_feed intake_digestibility_&_feeding behaviour,” includes data in three columns on the feed intake and digestibility measured in the publications, as well as data on feeding behaviour, particularly grazing time; this variable was the best documented in all 93 annotated publications. The numerical data are detailed for cattle on the one hand and for small ruminants (sheep and goats) on the other (see Table 3 below).
Table 3.
Descriptive statistics for intake, digestibility, and feeding behaviour data.
The data for the fifth category, “5_carcass_characteristics,” occupies the last 7 columns of the PASTorIN_2_DATA dataset. The descriptive statistics are detailed below (Table 4) for cattle or small ruminants, as was the case for categories 2 and 3.
Table 4.
Descriptive statistics of carcass characteristics.
2.4. PASTorIN_3_MAP
This dataset contains geodetic data from the 62 experimental sites that served as study locations in the 93 publications used. Some experimental sites were indeed used for several independently published trials. Furthermore, some authors spread the data obtained during the same trial across two publications released in the same year; thus, in 9 cases, two references published in the same year by the same author contributed to the completeness of a single row for the 39 variables recorded. Consequently, the PASTORIN_3_MAP file actually contains 84 author names (cf. columns 4 and 5).
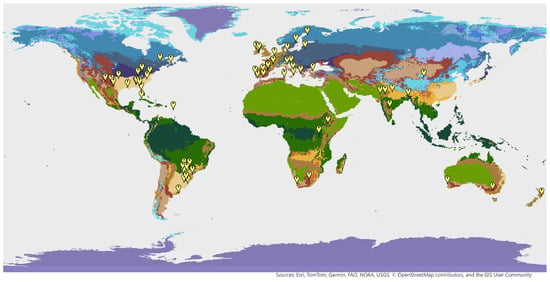
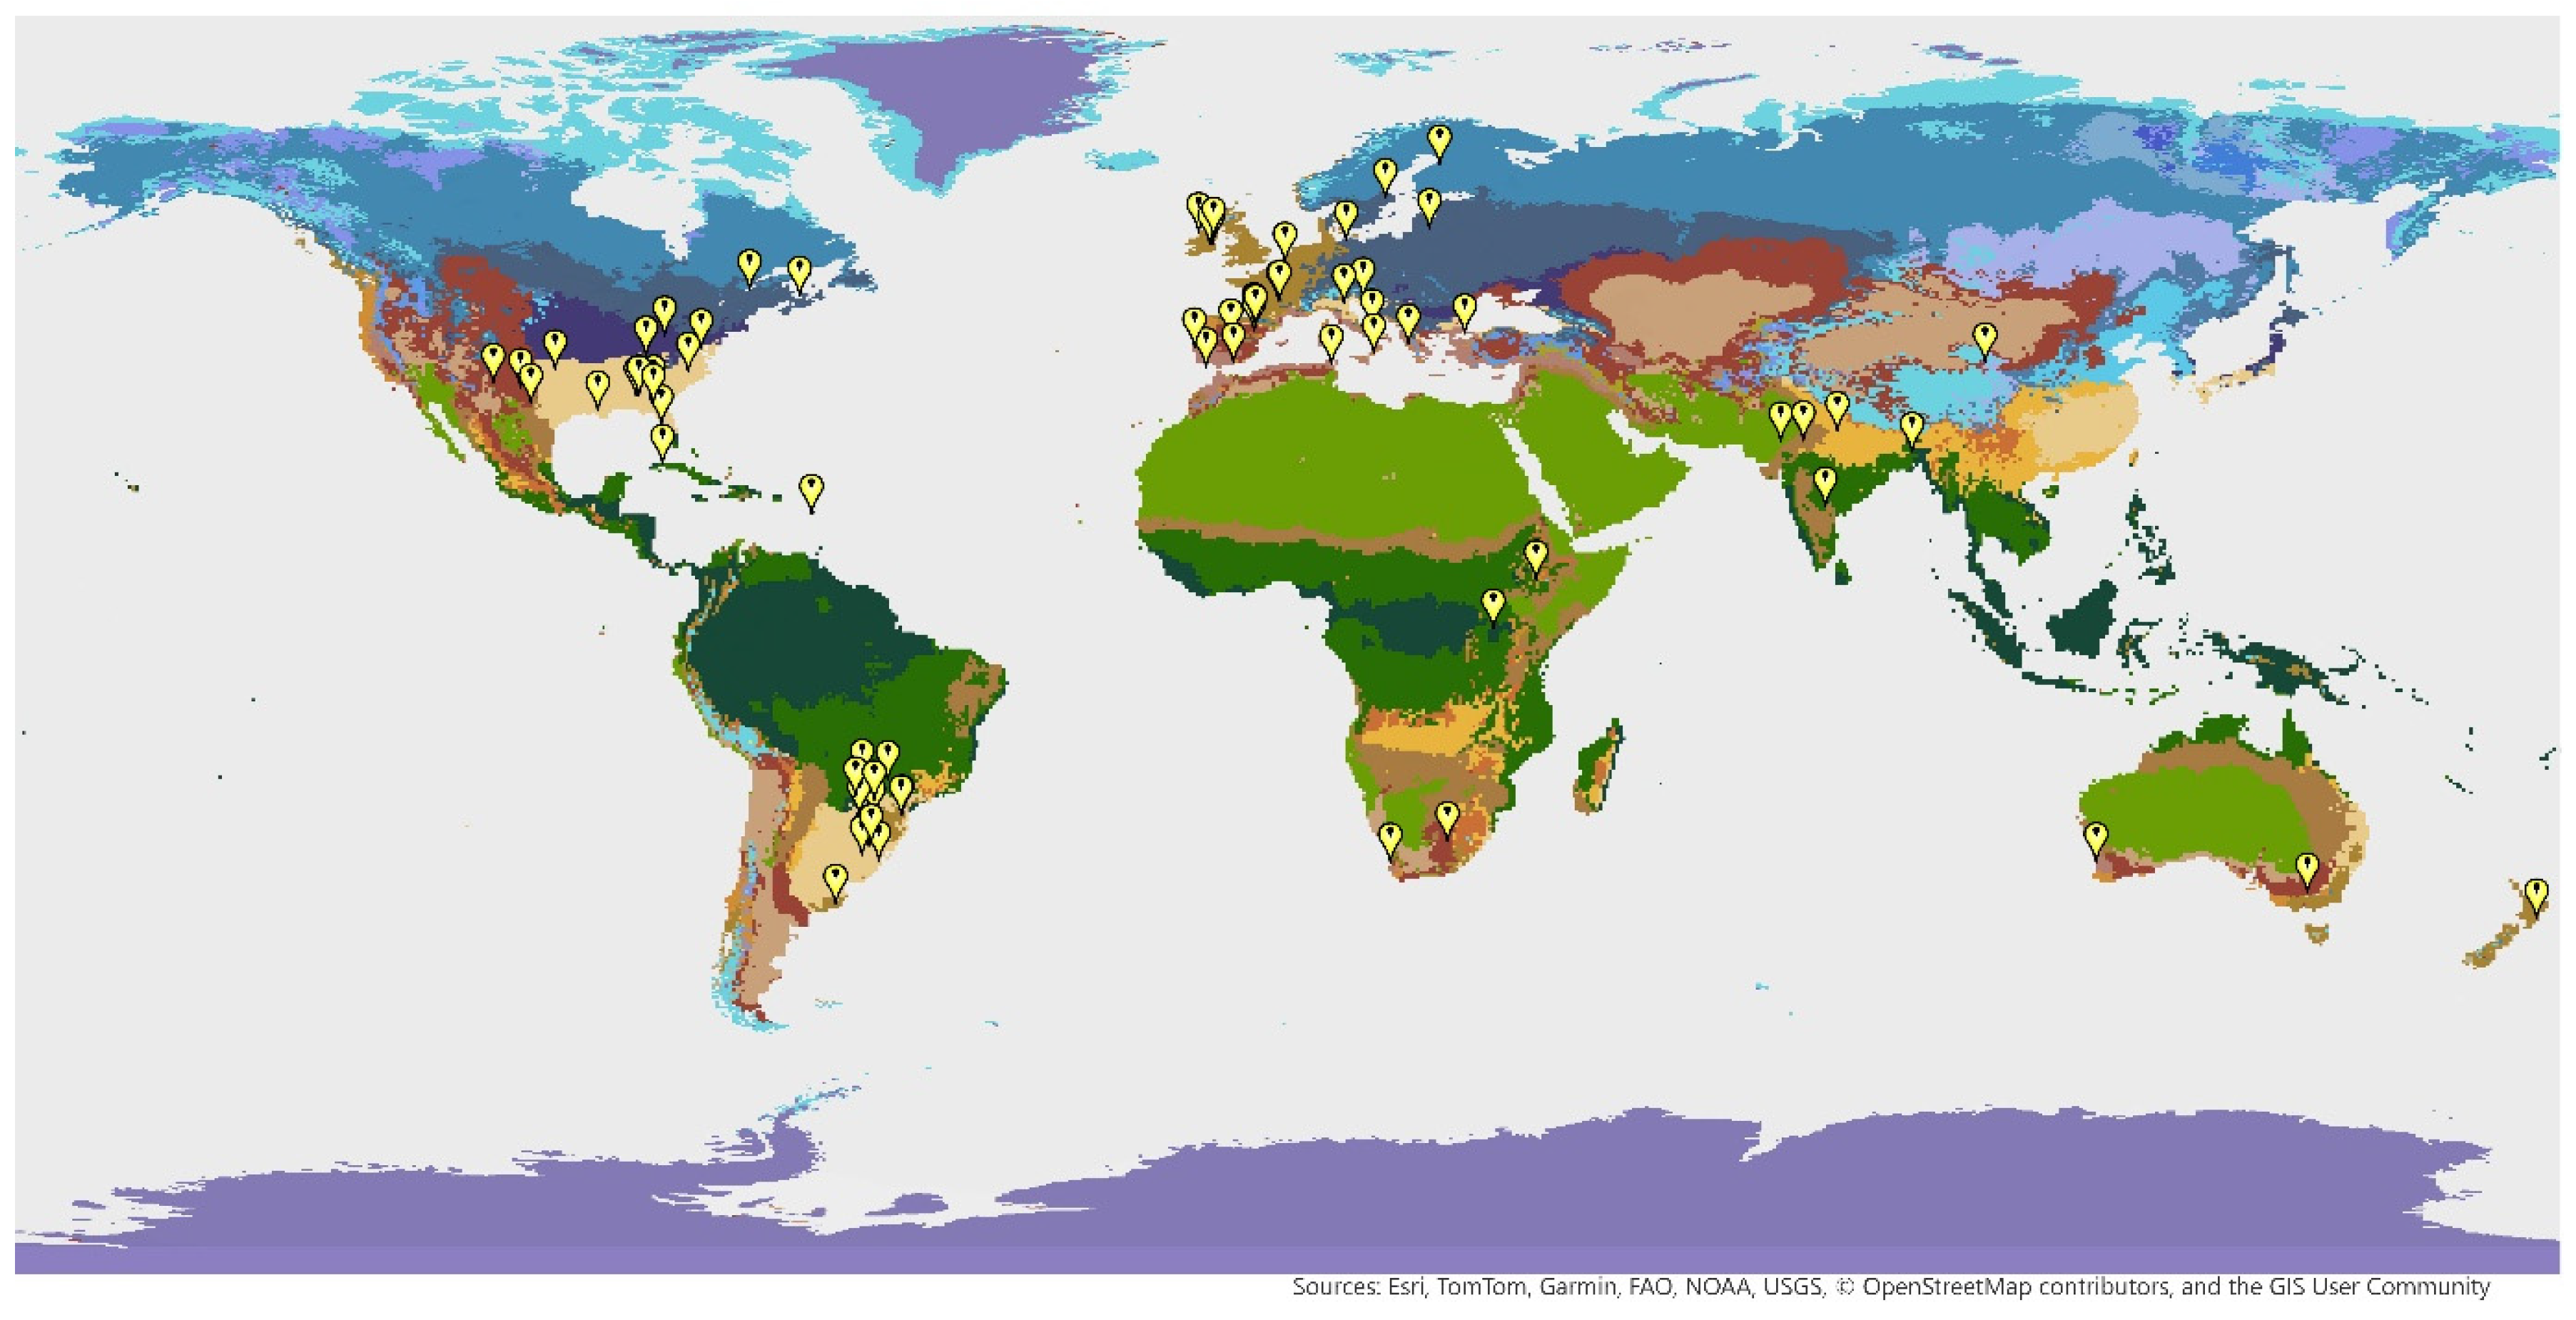
Figure 1 illustrates the geographical location of these 62 sites, spread across 29 countries, with 69% and 31% located in temperate and tropical zones, respectively. The geodetic coordinates provided in the PASTorIN_3_MAP dataset generally correspond to the experimental sites where the animals under study were fed. However, in certain publications, some ambiguity remains between the coordinates of the actual experimental site and those of (i) the institute or university that sponsored the study or (ii) the slaughterhouse where carcass measurements were undertaken.
Figure 1.
Screenshot of the Shapefile map from the PASTorIN_4_MAP file, illustrating the geographical and climatic distribution of the 67 experimental sites included in the dataset.
The Shapefile format of PASTorIN_3_MAP allows for the data presented in this Data Paper to be combined with other cartographic sources (e.g., vegetation, land use), thereby facilitating their subsequent use within various analytical frameworks or modelling projects focusing on animal performance.
In the context of Open Science, which promotes the reuse of data for future meta-analyses and Data Papers, a standardized procedure for reporting the geographical location of experimental sites could usefully be included in the author guidelines of scientific journals.
2.5. PASTorIN_4_REFERENCES
This file lists the detailed references of the 93 annotated publications, as well as their DOI, in order to facilitate access to the full texts, with the aim of supplementing PASTorIN_2_Data as much as possible with information not yet collected but relevant for future users, for example, certain measurement methods that have not yet been detailed or the fertilization practices used to feed animals in certain areas.
3. Methods
3.1. Data Collection
The data in the PASTorIN database were collected from publications identified using multidisciplinary bibliographic database as the Web of Science (www.webofscience.com) and CABI (www.cabi.org) by employing, either alone or in combination, the following keywords: enclosure, feedlot, feeding trough, indoors, housing, grazing, foraging, ranching, feeding system, feeding strategy, cattle, sheep and goats.
Using these bibliographic databases, more than 1300 publications were initially identified, to which were added further publications cited within those initially identified. After reviewing all the publications selected in this way, only those in which the two feeding environments were directly compared were finally retained, regardless of the original language. Publications were excluded from our final selection if (1) the full text of the article was not available, (2) the feeding environments (at pasture or indoors) were not studied simultaneously and for the same type of animals, (3) contradictory data were provided for each feeding environment, or (4) there were inconsistencies in the reported values.
3.2. Data Harmonization and Coding
As this dataset was compiled from a large number of previously analyzed and published studies (listed in the PASTorIN_4_REFERENCES file), we carefully standardized the units of the various variables, retaining, as far as possible, the unit most frequently used in the selected publications. In parallel, each publication was coded individually, considering each experiment within the same publication (a single publication could contain from 1 to 15 experiments; see, e.g., Chapman et al., 1972). This coding aims to allow for the analysis of data from different sources, while considering all the factors tested within a meta-design that is therefore neither orthogonal nor balanced.
The experimental conditions and methods specific to each study were thus coded. The types of housing designated in the selected publications by the terms “barn,” “pen,” “fattening pen,” “intensive fattening pen,” “metabolic cage,” “sheepfold,” or “stable” have been grouped under the generic term “indoor,” with “pasture” being the other modality for the variable “feeding environment.” Each treatment corresponded to the average of a group of animals of a given species, at a given physiological stage, of a given sex, and for a given feeding environment (pasture vs. indoor). This information is described via the category “1_general_information” of the file PASTorIN_1_VARIABLES. Further information on the methods used to measure the different variables measured in each study is available in the PDF files listed in PASTorIN_4_REFERENCES.
Regarding animal characteristics, the species and breed of the animal were coded, as were the sex and physiological stage, and the latter was subject to specific harmonization. Initial, final, and/or average live weight was recorded to account for specific individual effects. Growth performance was assessed using average daily gain as the key indicator. To enable comparisons between species (cattle, sheep and goats) and between intra-species breeds, all weight-related parameters were normalized to the average live weight recorded during the experiment and expressed in grams per kilogram of live weight. These elements are described in the category “2_animal_characteristics” of the PASTorIN_1_VARIABLES file.
Diet characteristics and feeding modalities were detailed as much as possible from the information provided in the publications, then harmonized in order to specify, for the largest number of lines in the dataset, among other things, the dominant species, the feeding method (rationed or ad libitum), the presentation form (fresh or dry, chopped or not...), the addition of concentrates, and the type of concentrates, etc. The classifications concentrate_energy or concentrate_protein correspond to the primary raw material that contributes the most to the energy or nitrogen in the concentrates, respectively. The supplement type corresponds mainly to the addition of growth promoters. All this information was detailed in the “3_diet_characteristics_&_feeding_modalities” category of the file PASTorIN_1_VARIABLES and in Table 2.
The data collected on feed intake, digestibility, and feeding behaviour were generally quite limited compared to the growth performances data. Furthermore, feed intake and digestibility were sometimes expressed relative to dry matter (DM) or organic matter (OM), without it being possible to standardize all values in either of these units. Regarding feeding behaviour, the measurements reported in the publications were highly variable (frequency of bites, total number of bites per day, etc.), and ultimately, only the grazing duration could be retained in the database. All relevant information can be found in the category “4_intake_digestibility_&_ingestive_behaviour” of the PASTorIN_1_VARIABLES and in Table 3.
Slaughter characteristics included slaughter live weight (SLW; kg), hot carcass weight (HCW; kg), cold carcass weight (CCW; kg), hot carcass dressing percentage (%), and cold carcass dressing percentage (%). If the hot or cold carcass dressing percentages were missing, they were, if possible, calculated as follows: 100 × HCW/SLW or 100 × CCW/SLW. Due to the very low quantity of data on the carcass proportion of fat, muscle and bones, these were discarded from the database. These characteristics are detailed in the category “5_carcass_characteristics” 5 of PASTorIN_VARIABLES and in Table 4.
Author Contributions
B.M.: Conceptualization, Data collection, Data Curation, Coding, Writing—Original Draft, Writing—Review & Editing, Supervision. S.I.: Data Processing and Mapping Geolocation data management and processing; spatial consistency validation and quality control; data processing and mapping; precise identification of experimental sites. B.V.: Data Curation/Processing (particularly data relating to growth and carcasses), Writing—Review and Editing. All authors have read and agreed to the published version of the manuscript.
Funding
This research received no external funding.
Institutional Review Board Statement
Not applicable.
Informed Consent Statement
Informed consent was obtained from all subjects involved in the study.
Data Availability Statement
Data freely available via data.gouv.fr at https://entrepot.recherche.data.gouv.fr/dataset.xhtml?persistentId=doi:10.57745/R7IYDP, accessed on 30 June 2026.
Acknowledgments
We would like to pay tribute to Daniel Sauvant, who sadly passed away on 19 May 2022, for his open-mindedness throughout the initial stages of this work, which enabled us to benefit from his experience in meta-analysis.
Conflicts of Interest
This research did not benefit from any specific grant from public, commercial, or non-profit funding bodies.
References
- Food and Agriculture Organization. GLEAM 3.0 Assessment of greenhouse gas emissions and mitigation potential. In Global Livestock Environmental Assessment Model (GLEAM); FAO: Rome, Italy, 2023; Available online: https://foodandagricultureorganization.shinyapps.io/GLEAMV3_Public (accessed on 30 June 2026).
- Fernandes, M.; Tedeschi, L.O. ASAS-NANP symposium: Mathematical modeling in animal nutrition: Application of modeling innovations to support satellite remote sensing for sustainable grazing cattle management. J. Anim. Sci. 2025, 103, skaf137. [Google Scholar] [CrossRef] [Scilit] [PubMed]
- United Nations. Goal 2: End Hunger, Achieve Food Security and Improved Nutrition, and Promote Sustainable Agriculture; Department of Economic and Social Affairs: New York, NY, USA, 2024; Available online: https://sdgs.un.org/goals/goal2 (accessed on 30 June 2026).
- Caton, J.S.; Lalman, D.L.; Tedeschi, L.O. Galyean Appreciation Club review: Knowledge gaps in the nutrition of grazing beef cattle. J. Anim. Sci. 2025, 103, skaf172. [Google Scholar] [CrossRef] [Scilit] [PubMed]
- Wróbel, B.; Waldemar Zielewicz, W.; Staniak, M. Challenges of pasture feeding systems—Opportunities and constraints. Agriculture 2023, 13, 974. [Google Scholar] [CrossRef] [Scilit]
- Maree, E.; Blignaut, J.; Gilliland, J.; Lee, M.R.F.; Manzano, P.; McCosker, T.; du Toit, L.; Truter, W.; Weinheimer, B.; Polkinghorne, R. Ruminant livestock farmers and industry are leading innovation to deliver human nutrition and improved environmental outcomes through sector lifecycle collaboration: A review of case studies. Anim. Front. 2025, 15, 55–71. [Google Scholar] [CrossRef] [Scilit] [PubMed]
- Godde, C.M.; Mason-D’Croz, D.; Mayberry, D.E.; Thornton, P.K.; Herrero, M. Impacts of climate change on the livestock food supply chain; a review of the evidence. Glob. Food Secur.-Agric. Policy Econ. Environ. 2021, 28, 17. [Google Scholar] [CrossRef] [Scilit] [PubMed]
- Katiyatiya, C.L.F.; Ncanywa, T. Harnessing Opportunities, Constraints, and Implications of Integrating Environmental Conservation with Sustainable Ruminant Production. Environments 2025, 12, 308. [Google Scholar] [CrossRef] [Scilit]
- Belk, K.; Ederer, P.; Leroy, F. The societal role of meat and livestock-what the science says. Anim. Front. 2025, 15, 3–7. [Google Scholar] [CrossRef] [Scilit]
- Genest-Richard, P.; Devillers, N.; Halde, C.; Tremblay, S.; Mundler, P. The humans behind the herd: Are alternative livestock farms agroecological from a socioeconomic perspective? J. Rural. Stud. 2025, 119, 103711. [Google Scholar] [CrossRef] [Scilit]
- Herrero, M.; Thornton, P.K.; Mason-D’Croz, D.; Palmer, J.; Bodirsky, B.L.; Pradhan, P.; Barrett, C.B.; Benton, T.G.; Hall, A.; Pikaar, I.; et al. Articulating the effect of food systems innovation on the Sustainable Development Goals. Lancet Planet. Health 2021, 5, E50–E62. [Google Scholar] [CrossRef] [Scilit] [PubMed]
- Kazanski, C.E.; Balehegn, M.; Jones, K.; Bartlett, H.; Calle, A.; Garcia, E.; Hawkins, H.J.; Mayberry, D.; McDonald-Madden, E.; Odadi, W.O.; et al. Context is key to understand and improve livestock production systems. Glob. Food Secur.-Agric. Policy Econ. Environ. 2025, 45, 100840. [Google Scholar] [CrossRef] [Scilit]
- Altieri, M.A.; Nicholls, C.I. Agroecology: Challenges and opportunities for farming in the Anthropocene. Int. J. Agric. Nat. Resour. 2020, 47, 204–215. [Google Scholar] [CrossRef] [Scilit]
- Agastin, A.; Sauvant, D.; Naves, M.; Boval, M. Influence of trough versus pasture feeding on average daily gain and carcass characteristics in ruminants: A meta-analysis. J. Anim. Sci. 2014, 92, 1173–1183. [Google Scholar] [CrossRef] [Scilit] [PubMed]
- Sauvant, D.; Schmidely, P.; Daudin, J.J.; St-Pierre, N.R. Meta-analyses of experimental data in animal nutrition. Animal 2008, 2, 1203–1214. [Google Scholar] [CrossRef] [Scilit] [PubMed]
- Sauvant, D.; Letourneau-Montminy, M.P.; Schmidely, S.; Boval, M.; Loncke, C.; Daniel, J.B. Review: Use and misuse of meta-analysis in Animal Science. Animal 2020, 14, 207–222. [Google Scholar] [CrossRef] [Scilit] [PubMed]
- Wilkinson, M.D.; Dumontier, M.; Aalbersberg, I.J.; Appleton, G.; Axton, M.; Baak, A.; Blomberg, N.; Boiten, J.W.; Santos, L.B.D.; Bourne, P.E.; et al. Comment: The FAIR Guiding Principles for scientific data management and stewardship. Sci. Data 2016, 3, 160018. [Google Scholar] [CrossRef] [Scilit] [PubMed]
- Dhar, A.R. Building Climate-Resilient Food Systems Through the Water-Energy-Food-Environment Nexus. Environments 2025, 12, 167. [Google Scholar] [CrossRef] [Scilit]

Disclaimer/Publisher’s Note: The statements, opinions and data contained in all publications are solely those of the individual author(s) and contributor(s) and not of MDPI and/or the editor(s). MDPI and/or the editor(s) disclaim responsibility for any injury to people or property resulting from any ideas, methods, instructions or products referred to in the content. |
© 2026 by the authors. Licensee MDPI, Basel, Switzerland. This article is an open access article distributed under the terms and conditions of the Creative Commons Attribution (CC BY) license.