


Abstract
Accurate estimation of depth–duration–frequency (DDF) curves is essential for hydrological analyses and flood-risk mitigation. Regionalization methods are particularly important in areas with limited observations, but their performance may deteriorate where topography and climate generate strong spatial variability. This study investigates the Gargano promontory in southern Italy, an area that is commonly treated as a single hydrologically homogeneous zone despite its marked morphological and climatic contrasts. Annual maximum rainfall data from eight rain gauges, together with topographic and climatic descriptors, were analyzed to assess whether local factors help explain the variability of DDF-curve parameters. The analysis focused on elevation, distance from the sea, and a wind-effect index derived from a digital elevation model. The results indicate that the regional behavior of extreme rainfall is not spatially uniform and that several DDF-curve parameters are influenced by local physiographic controls. Different controls emerge for different station groups, and a physiographically based subdivision of the Gargano promontory into windward and leeward sectors provides a more coherent representation of DDF-curve parameters than the currently adopted single-zone regionalization.
1. Introduction
The hydrological response of a region depends on the interaction among climatic, meteorological, geographic, and morphological factors. Reliable physically based or statistically consistent models therefore require datasets that are both sufficiently long and spatially representative [1]. However, the inherent spatial and temporal heterogeneity of extreme precipitation often challenges the predictive capability of standard hydrological models, making localized investigations essential to capture non-stationary climatic trends [2,3,4].
Regionalization approaches have long been used to support hydraulic design in data-scarce and ungauged basins [5]. Despite sparse monitoring networks, these methods often provide acceptable estimates of spatial rainfall variability at the regional scale [6,7]. Their performance can nevertheless deteriorate in areas with pronounced geographic and morphological contrasts, such as the Gargano promontory in southern Italy, where the distribution of extreme rainfall appears highly heterogeneous [8].
The Gargano promontory, often referred to as an “isolated” sub-regional system due to its prominent relief surrounded by the Adriatic Sea and the Tavoliere plain, acts as a major orographic barrier. This unique setting triggers localized convective mechanisms and severe mesoscale convective systems (MCS) that are rarely captured by macro-scale regional models [9]. In fact, although the classical linear theory of Smith and Barstad [10] and the recent applications by Abbate et al. [11] confirm elevation and orographic uplift as primary drivers of precipitation on windward slopes, these authors also highlight the structural limitations of a purely univariate approach in the presence of convective dynamics and complex morphologies.
The literature proposes two main strategies to address this issue: regression-based models that relate rainfall behavior to local physiographic controls, and non-parametric or hybrid spatial approaches [12,13,14,15,16,17,18]. Studies dealing with orographic effects are especially relevant in complex terrains, where topography and exposure to moist air masses can substantially modify sub-daily annual maxima [16,17,18]. Understanding these localized interactions is crucial, as the interplay between steep slopes and coastal air masses frequently results in high-intensity, short-duration events that pose severe risks to the territory, often influenced by rain-shadow effects on the leeward sides of the promontory [19].
Another critical issue in Gargano is the limited size of its catchments. Most basins have concentration times shorter than 1 h, rendering them highly vulnerable to flash floods, whereas the regional rainfall laws commonly adopted in engineering practice were developed for durations between 1 and 24 h [20]. As a result, indirect procedures such as the Bell method are usually required to extend DDF curves to sub-hourly durations, introducing additional uncertainty and potentially underestimating or overestimating the input for the design of risk mitigation works [21]. Since the 1990s, automatic rain gauges have progressively made annual maxima for short-duration rainfall events available (e.g., 5, 15, and 30 min), making it possible to reassess sub-hourly rainfall behavior in the area [22]. However, a comprehensive reassessment that systematically links these high-resolution temporal data with fine-scale spatial predictors is still lacking, leaving a non-negligible gap in local flood risk management strategies [23,24].
The objective of this study is to assess whether local physiographic and climatic factors can explain the spatial variability of DDF-curve parameters within the Gargano promontory and whether a physiographically based subdivision of the area provides a more coherent representation than the single homogeneous zone adopted by the current VAPI regionalization. By bridging the gap between high-resolution sub-hourly observations and local physiographic features, this work aims to provide a more reliable framework for flood risk mitigation and hydraulic infrastructure design in complex, data-scarce coastal environments.
2. Materials and Methods
2.1. Study Area
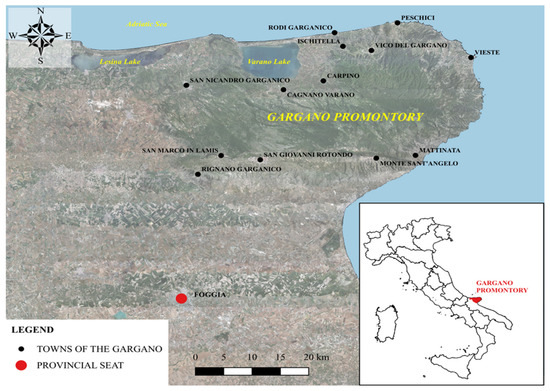
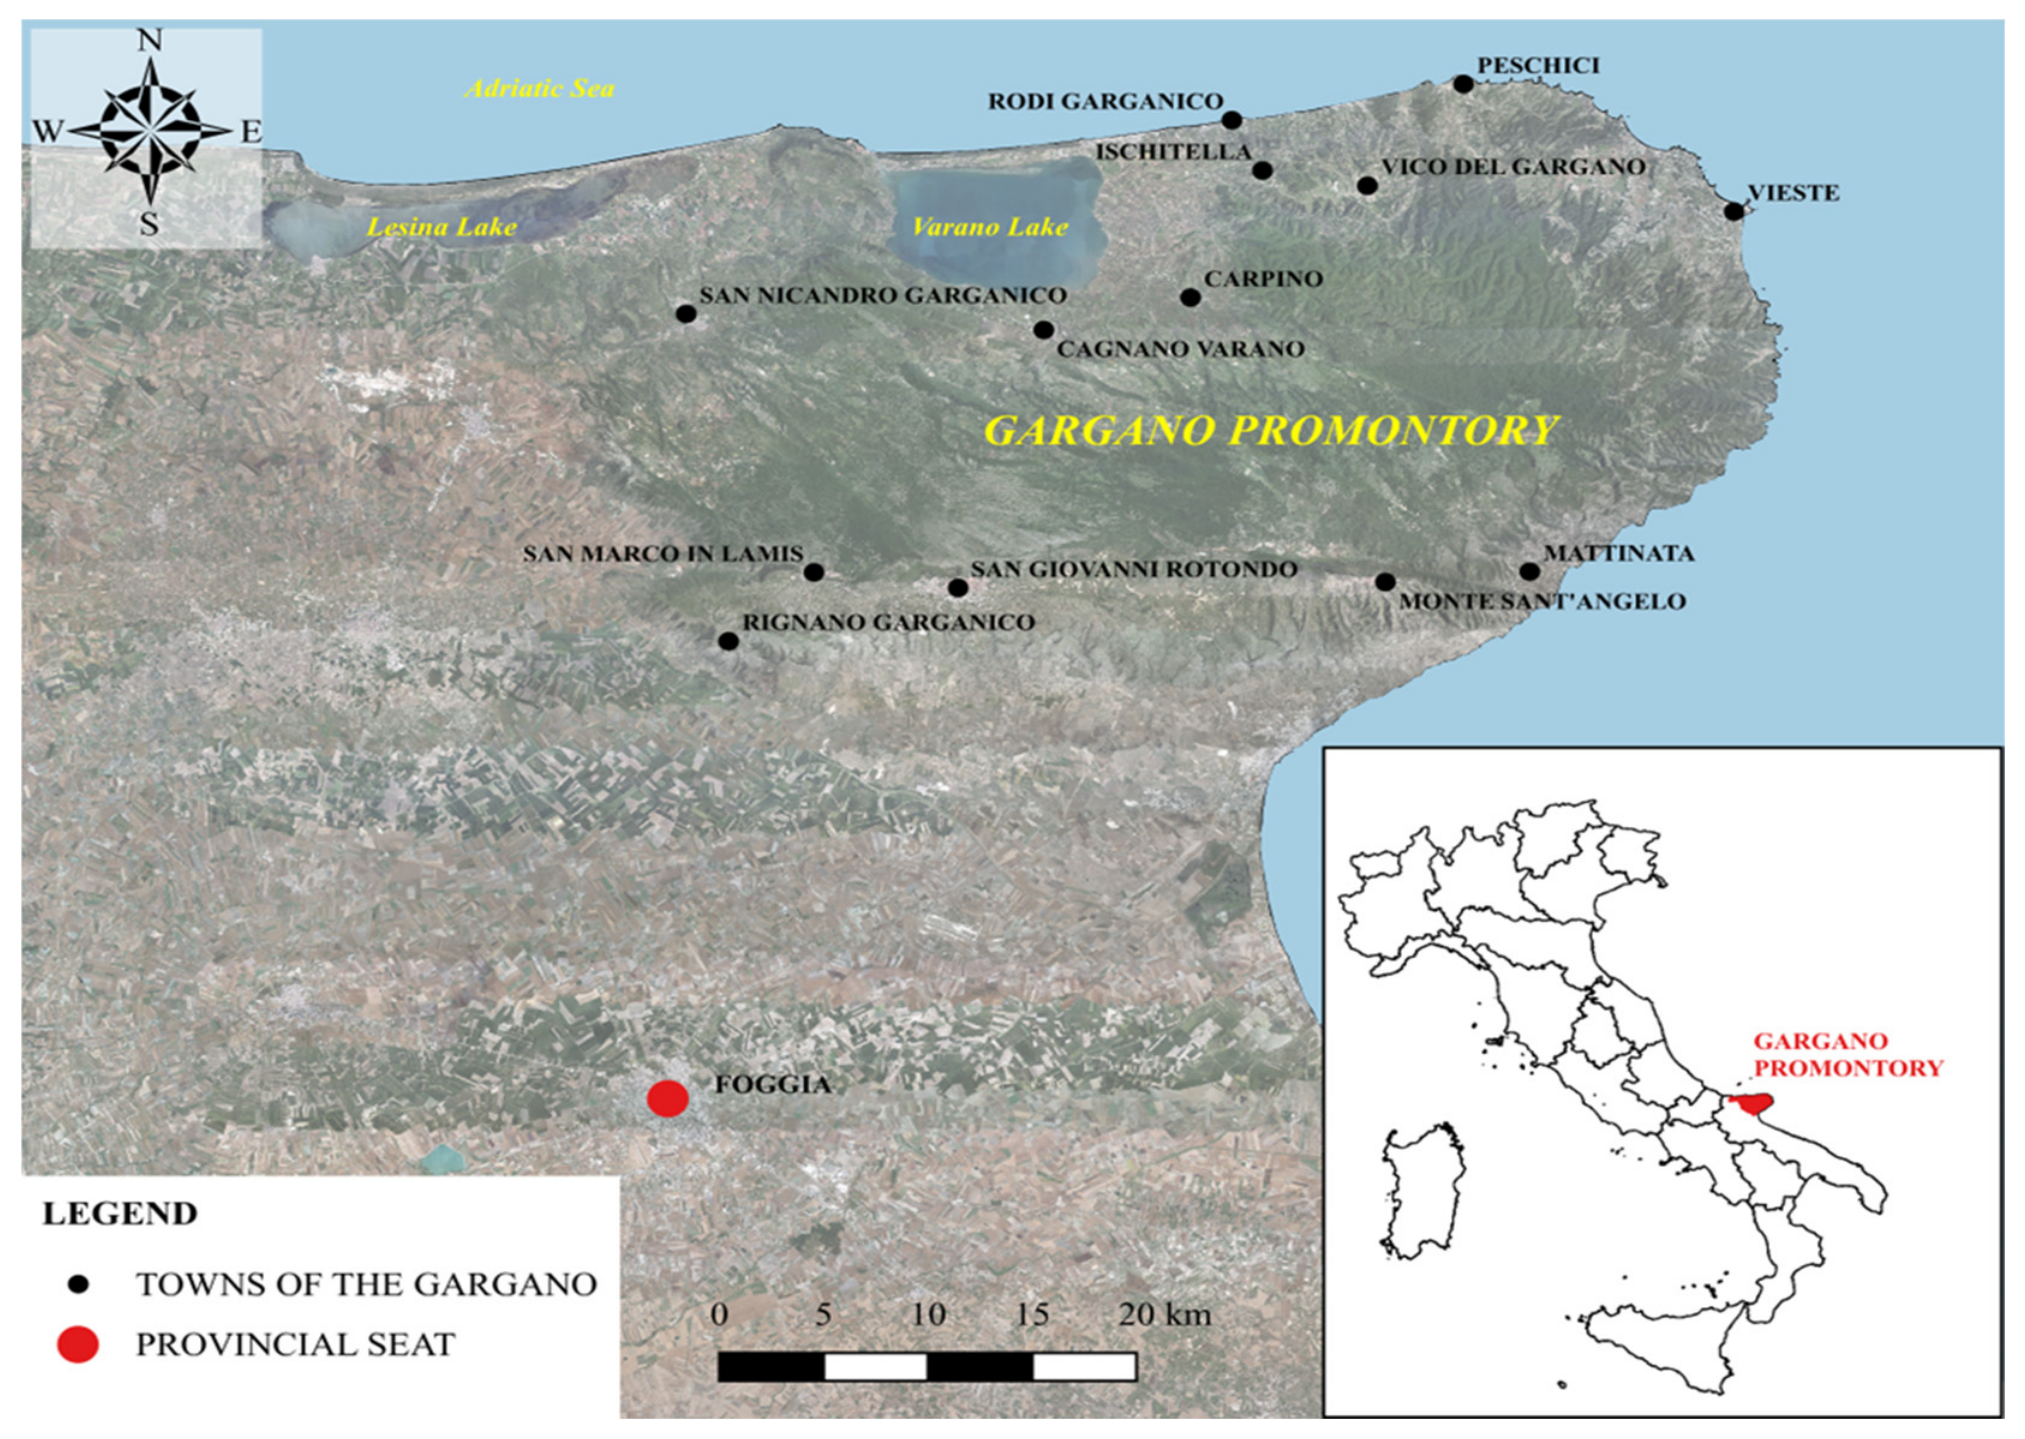
The study area (shown in Figure 1) comprises the Gargano promontory in the Province of Foggia (southern Italy). The promontory borders the Tavoliere delle Puglie plain to the south and southwest and is surrounded by the Adriatic Sea along the remaining sides. Its northwestern coastal sector includes the Lesina and Varano lagoon systems.
Figure 1.
Location of the Gargano promontory within the Apulia Region, southern Italy.
The Gargano promontory is an isolated carbonate mountain block covering about 1900 km2, with elevations ranging from sea level to 1055 m a.s.l. at Monte Calvo [25].
From a geostructural perspective, the Gargano belongs to the Apulian Foreland and is characterized by a lithostratigraphic succession more than 4000 m thick, composed mainly of Mesozoic–Cenozoic carbonate rocks arranged in a WNW-ESE anticline [26,27,28].
The resulting landscape is a limestone plateau where karst landforms, both surface and underground, are widespread, especially in the inner sectors of the promontory [28]. The slopes are steep and dissected by deep erosional-karst incisions that act as the beds of torrential streams [29,30].
The Gargano has often been described as a “biological island” because of the diversity of its environments and ecological niches [31,32]. The area belongs to the Regional Ecological Network and includes the Gargano National Park, seven State Nature Reserves, fourteen Sites of Community Importance, and three Special Protection Areas [30,32,33].
Climatically, the northern sector is generally more humid than the southern sector. Owing to the extensive coastline, sub-mountain climatic conditions coexist with typical Mediterranean environments [34].
The position of the promontory within the Adriatic basin and the WNW-ESE orientation of its ridges favor prevailing winds from the first and fourth quadrants [34]. Northern airflows, particularly Bora and Mistral episodes, enhance cooling and moisture advection along the northern side, whereas southwesterly and western flows affect the southern sector.
Annual temperatures range from winter averages close to 6 °C to summer values that can exceed 34 °C. Depending on elevation and distance from the sea, winter temperatures may locally fall below 0 °C [22,34,35].
The rainfall regime is typically Mediterranean, with abundant winter-spring precipitation and marked summer dryness [29]. Annual rainfall generally ranges from about 600–700 mm along the coast to approximately 1200 mm in the inner Foresta Umbra area [22]. The northern slope, more exposed to moist air masses from the Adriatic sector, records higher precipitation than the southern slope.
2.2. Rain Gauge Data
Rain gauge data were obtained from the Hydrological Annals made available by the Civil Protection Service of the Puglia Region [22]. The analysis considered 8 stations within the study area, corresponding to approximately 50 years of available observations and listed in Table 1.
Table 1.
Rain gauge stations.
Only stations with records longer than 20 years and complete annual maximum series for all analyzed durations were retained [36]. The dataset includes both sub-hourly and hourly durations, allowing a consistent comparison from short-duration events to 24 h rainfall.
2.3. The VAPI Method for the Regionalization of Extreme Rainfall
In Apulia, the probabilistic regional analysis of annual maximum rainfall depths for assigned durations is based on studies developed within the VAPI project (Valutazione delle Piene in Italia) [20,37].
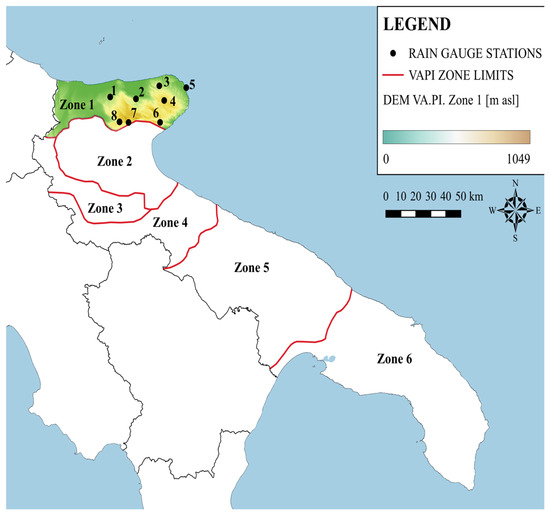
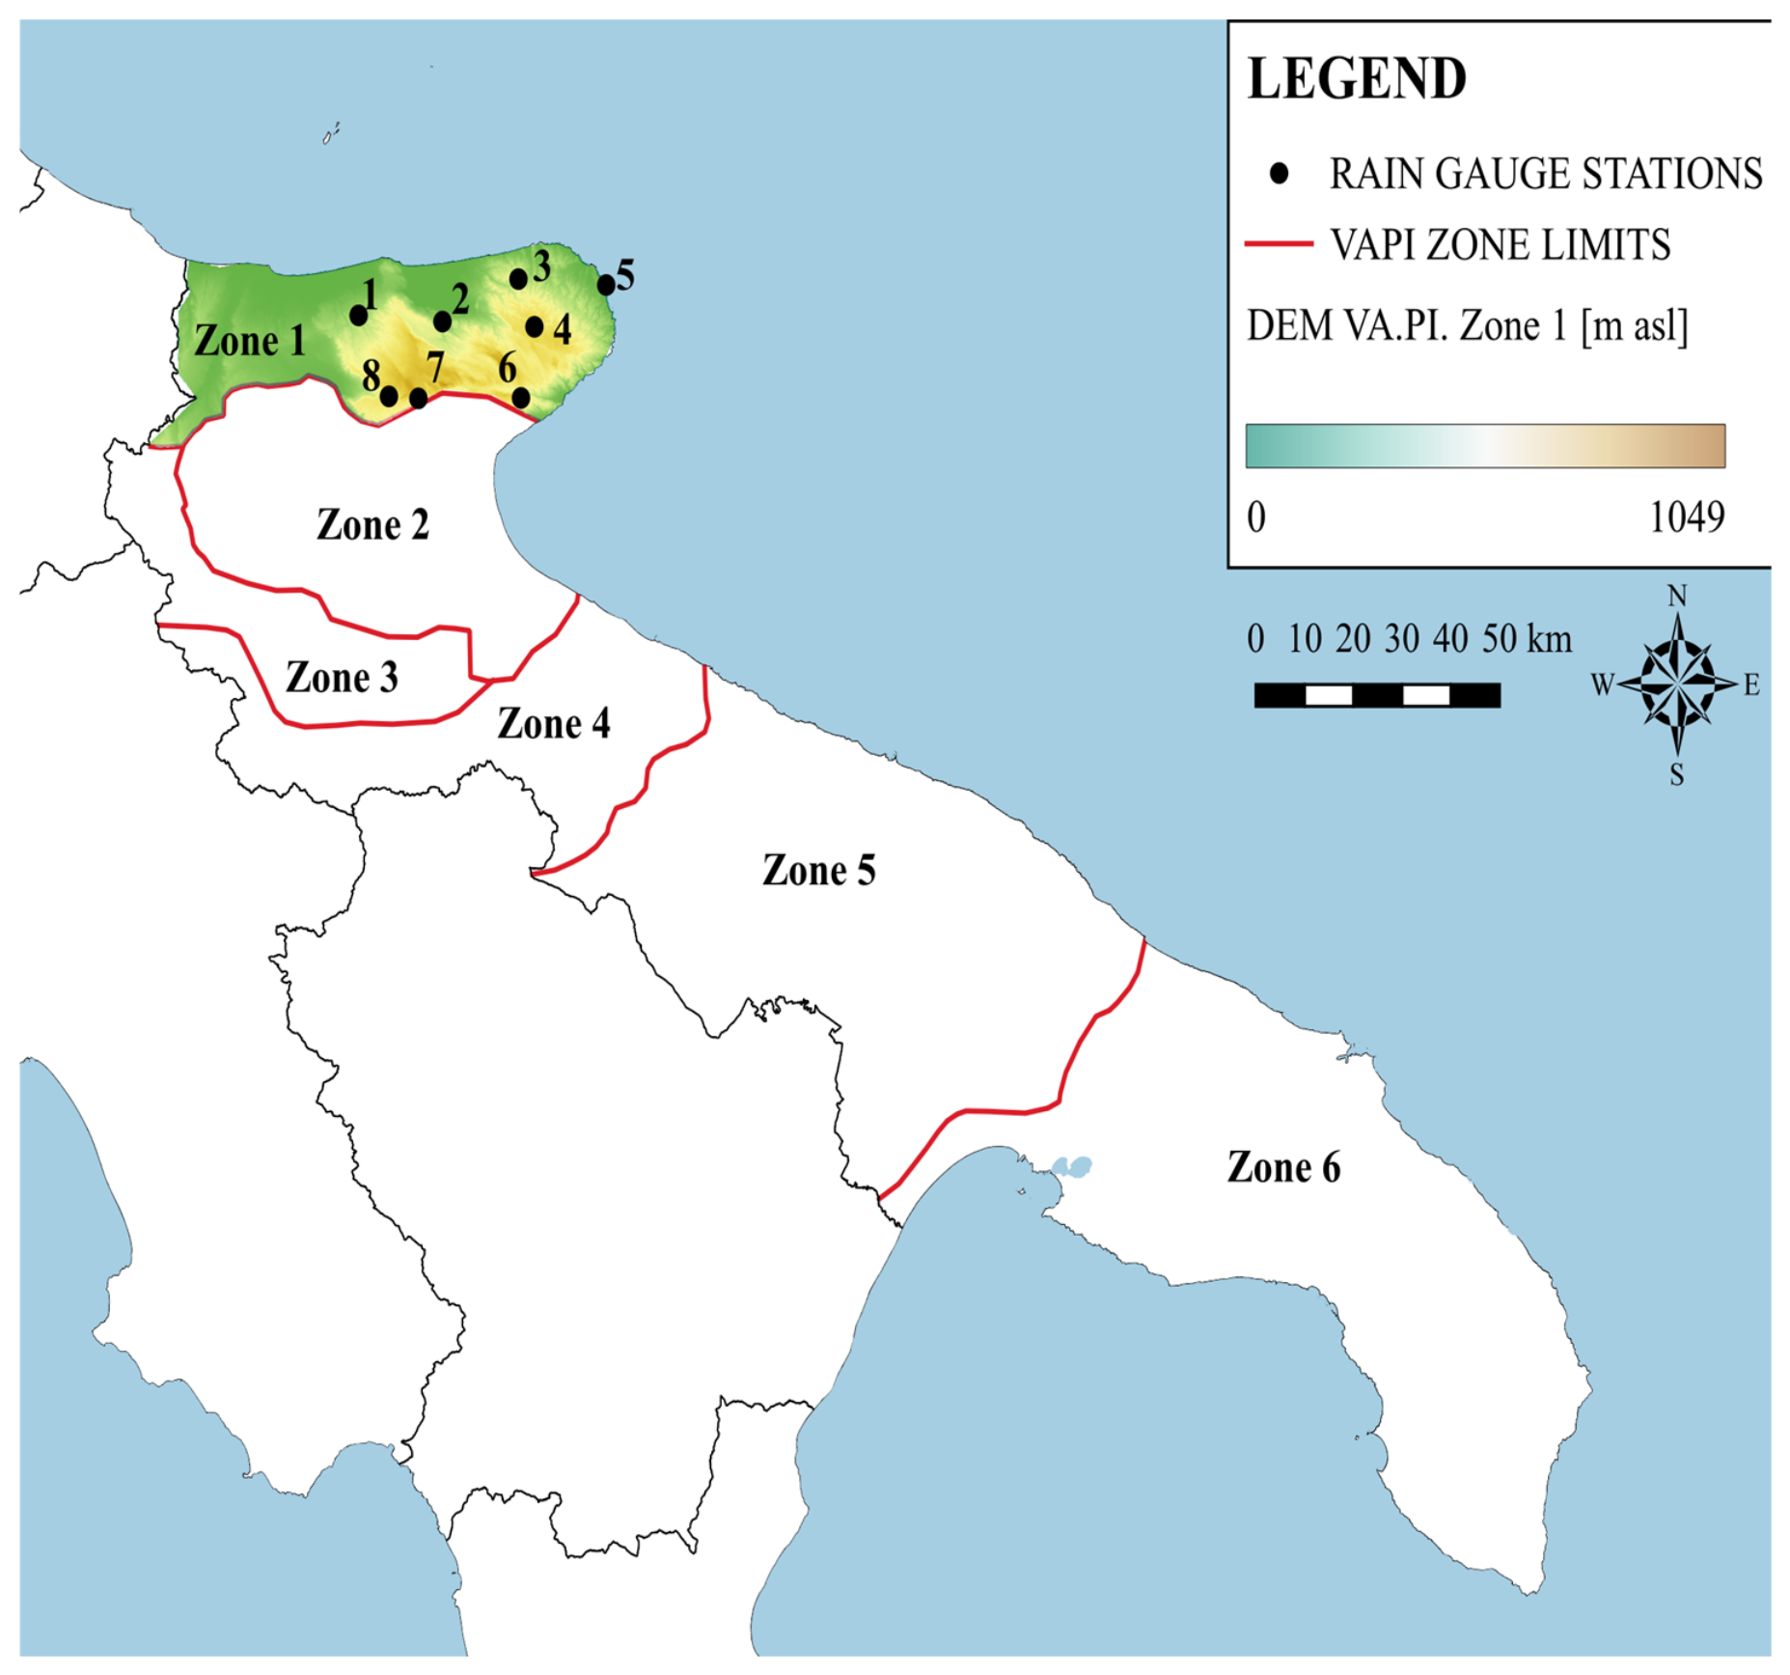
The VAPI framework adopts the two-component extreme value (TCEV) distribution and estimates parameters hierarchically at three regional levels [38,39]. For Apulia, the first regionalization level identifies a single homogeneous zone at the regional scale, whereas the second level distinguishes Northern Puglia, which includes the study area, from Central-Southern Puglia [37]. At the third level, the mean annual maximum rainfall depth is regionalized through regressions involving rainfall duration and elevation, leading to six homogeneous pluviometric sub-zones [37], represented in Figure 2.
Figure 2.
Location of the rain gauges and VAPI homogeneous sub-zones.
The entire study area falls within homogeneous sub-zone 1, whose equation is
where
- µ[h(t, z)] is the mean height of annual maximum rainfall (expressed in millimeters of precipitation);
- t is the assumed rainfall duration (h);
- z is the elevation above sea level (m).
Based on Equation (1), the relationship between the mean maximum annual rainfall and the given duration t is provided according to the original two-parameter formulation used in the VAPI project:
where
- The coefficient a (mm) represents the estimated value of the hourly mean of the annual maximum rainfall;
- The coefficient n is a scale parameter.
However, the two-parameter formulation is conventionally applied to durations between 1 and 24 h. For sub-hourly durations, direct application may be inadequate, and additional procedures are commonly adopted in engineering practice.
To extend the rainfall law to short durations, Bell’s methodology [21] is commonly used within the VAPI framework. Alternatively, studies developed for the neighboring Campania region [40] adopted a three-parameter formulation, which is more flexible for sub-hourly durations:
where
- The parameter μ(I0) (mm/h) represents the limit of the mean annual maximum rainfall intensity for duration tending to zero;
- The coefficients β and dc (temporal deformation coefficient, expressed in hours) are parameters to be estimated locally or through regional procedures.
For many years, the lack of sub-hourly observations prevented the regional estimation of the three-parameter law in Apulia. Consequently, its practical use remained limited to local applications.
This is particularly relevant in Gargano, where almost all hydrographic basins have concentration times shorter than 1 h because of their small extent and steep slopes.
In recent years, the installation of automatic rain gauges has increased the amount of available sub-hourly data, although the monitoring network is still sparse. This creates new opportunities for investigating hydrological mechanisms in the Gargano promontory.
2.4. Topographic Parameters
In this study, several topographic parameters were considered to describe the spatial variability of the maximum annual rainfall. Topographic and exposure-related variables were derived from the digital elevation model using SAGA GIS 9.82./QGIS 3.40 LTR “Bratislava” terrain analysis tools, including stations’ Elevation (EL), directional Sea Distance (SD), Wind Exposure Index (WEI), Topographic Position Index (TPI), Terrain Ruggedness Index (TRI), and Exposition (EX). These variables were used to characterize coastal proximity, terrain morphology, and surface orientation.
2.4.1. Digital Elevation Model and Elevation (EL) Parameter
Topographic processing was based on the TINITALY digital elevation model (DEM), version 1.1, produced by the Istituto Nazionale di Geofisica e Vulcanologia (INGV) [41].
TINITALY is a DEM in triangular irregular network format, subsequently converted to a 10 m grid for the entire Italian territory in the EPSG 4326, EPSG 32632, and EPSG 32633 reference systems [42]. The DEM was derived from several vector datasets using the DEST algorithm [43].
The Elevation parameter for each station was assumed from data provided by the Apulia Region Civil Protection Department [44].
2.4.2. Wind-Effect (WE) Parameter
The wind-effect (WE) parameter was computed with the Windward/Leeward module implemented in SAGA GIS [45,46]. WE is a dimensionless index: values lower than 1 indicate wind-shadow conditions, whereas values greater than 1 indicate areas exposed to the selected airflow [47].
In this study, WE was estimated with respect to the prevailing winds affecting the area, namely, flows from the fourth quadrants [34]. The algorithm was applied for the considered directions (135° from north), and the value obtained at each point was adopted as the representative WE parameter.
2.4.3. Sea Distance (SD) Parameter
This parameter represents the shortest distance from each station to the coastline, measured along a fixed azimuth of 135° clockwise from North. It is used to quantify directional proximity to the sea and may help capture gradients in coastal exposure.
The geomorphological and geometric rationale for calculating the Wind Effect (WE) and Sea Distance (SD) indices is based on the structural orientation of the Gargano promontory.
A fixed azimuth of 135° was adopted because the main mountain ridge follows a west-northwest–east-southeast (WNW–ESE) alignment, approximately corresponding to the 315–135° axis. This direction therefore represents the principal topographic alignment of the promontory and provides a consistent geometric reference for evaluating directional exposure and distance from the sea.
From a meteorological perspective, northerly airflows, such as Mistral winds approaching from approximately 315°, interact with the promontory along this same directional framework.
Using a 135° azimuth enables the analysis to capture the strongest spatial contrast between the northern windward slope, where stau mechanisms enhance orographic uplift and precipitation, and the southern leeward slope, where subsidence and foehn effects may reduce rainfall intensity.
For these reasons, the fixed azimuth provides a physically meaningful simplification. It represents the dominant structural and climatic gradient across the promontory while avoiding the need for a redundant sensitivity analysis involving multiple wind directions.
2.4.4. Wind Exposition Index (WEI) Parameter
The Wind Exposition Index is a terrain-based indicator of potential exposure to wind, commonly derived from topographic shielding, slope, aspect, and surrounding relief [46,48].
While real airflow patterns are strongly direction-dependent and turbulent, WEI offers a useful approximation of the area’s wind protection [49]. Higher values generally indicate more exposed locations, while lower values indicate more sheltered terrain.
2.4.5. Exposition (EX)
Exposition refers to the directional orientation of a slope surface, usually expressed as aspect [50]. It indicates the compass direction toward which the terrain faces and is important for modeling solar radiation, moisture, and microclimate effects. The result is commonly converted to degrees clockwise from north.
2.4.6. Terrain Ruggedness Index (TRI) Parameter
The Terrain Ruggedness Index quantifies local terrain heterogeneity by measuring the mean absolute elevation difference between a focal cell and its neighboring cells. TRI was developed by Riley [51] et al., and it is widely used as an indicator of roughness or surface irregularity [52]. Low values indicate flat areas and level surfaces, while high values denote ridge crests and steep terrain.
2.4.7. Topographic Position Index (TPI)
The Topographic Position Index measures the elevation of a cell relative to the mean elevation of its surrounding neighborhood [53,54,55]. Positive values indicate positions above the local mean, negative values indicate positions below it, and values near zero indicate relatively flat or intermediate terrain.
2.5. Methodological Framework
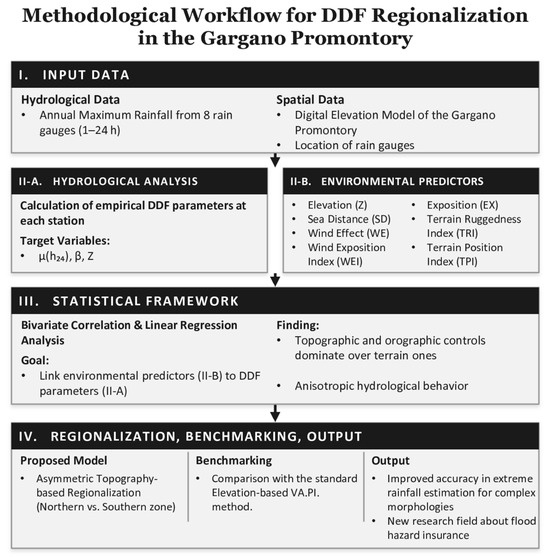
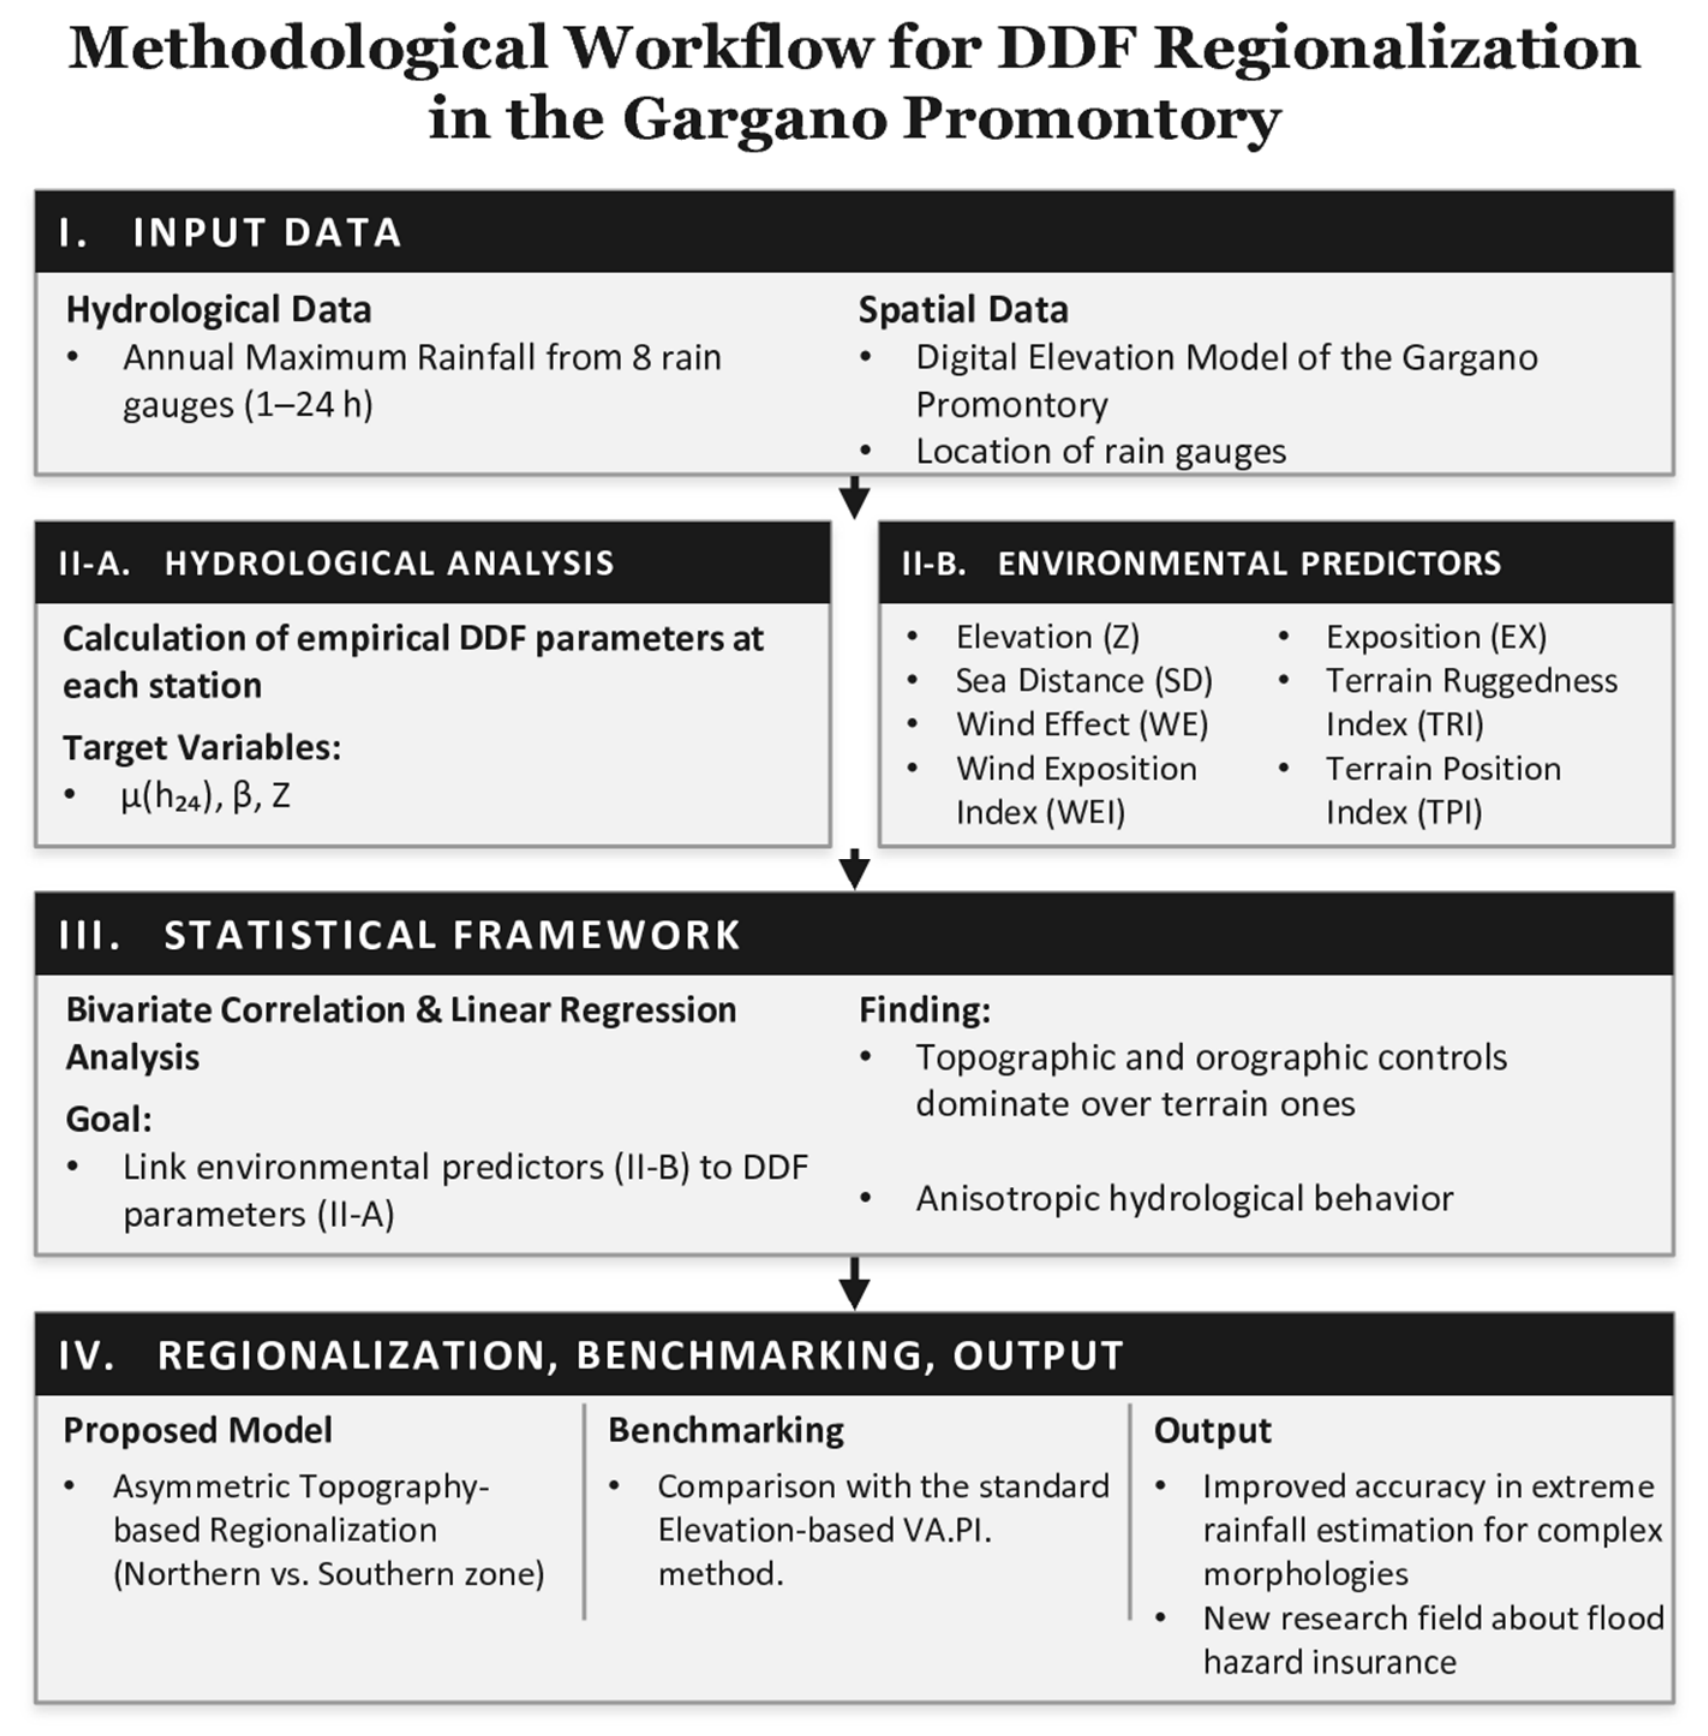
The methodological framework, organized into four consecutive phases, is summarized in Figure 3:
Figure 3.
Methodological workflow of the present study.
(I) Hydrological data processing: Extraction of the annual maximum rainfall series from the eight available rain gauge stations and estimation of the local DDF curve parameters (specifically β, Z, and μ(h24)).
(II) Predictor selection and spatial characterization: Identification and estimation of geomorphological and climatic predictors. These included macro-scale orographic descriptors (Elevation, Sea Distance, Wind Effect, Wind Exposition Index, and Exposition) and micro-scale topographic indices (Terrain Ruggedness Index and Topographic Position Index), selected to capture the spatial heterogeneity of the Gargano promontory.
(III) Statistical correlation analysis: Application of a parsimonious bivariate regression analysis to relate each physical predictor to the empirical DDF parameters. This approach avoids multivariate overfitting while identifying the dominant physical controls (macro-scale versus micro-scale).
(IV) Regionalization and model benchmarking: Development of a novel asymmetric regionalization scheme based on the statistically significant predictors (i.e., the macro-scale orographic controls). The performance of the proposed framework was then evaluated by comparison with the traditional elevation-based VAPI regionalization method.
3. Results
3.1. Parameter Estimation
The methodological framework was developed to evaluate whether the parameters of the DDF curves are associated with local topographic and climatic controls across the Gargano promontory, and to verify whether the VAPI. The project assumption of a single homogeneous zone for the entire Gargano, based exclusively on elevation, remains valid.
For each station, mean annual maxima were first computed for the available durations, from 5 min to 24 h, and then fitted through a log-log transformation.
By substituting the following relationships into Equation (3),
the following linear relationship is obtained:
As noted by Calenda et al. [39], Equation (3) is particularly suitable for average values and for a duration of 24 h. Because μ(h24) is easier to estimate than dc, the relationship can be rewritten as
The parameters β, Z, and μ(h24) were then estimated using the least-squares method [40]. Correlations between the estimated parameters and selected topographic or climatic indicators were assessed using three complementary statistical metrics: the Coefficient of Determination (R2) [56,57], the Mean Absolute Error (MAE) [58], and the Root Mean Square Error (RMSE) [59,60].
3.2. Correlation Analysis
To evaluate the spatial behavior of the estimated parameters (β, Z, and μ(h24)), correlation analyses were conducted under two distinct spatial partitioning hypotheses. Table 2 and Table 3 present the performance metrics (R2, MAE and RMSE) obtained for both scenarios. The first approach evaluates the study area under the assumption of a unique homogeneous rainfall zone, in direct analogy to the methodology established by the VAPI project. The second approach investigates a sub-regionalization scheme, wherein the territory is divided into two distinct climatological zones, designated as Zone 1 (Northern zone) and Zone 2 (Southern zone), delineated by the physical boundaries of the main watershed divide running in a West–East direction. In particular, Zone 1 includes the stations of Sannicandro Garganico, Cagnano Varano, Vico Garganico and Bosco Umbra Telemisura; Zone 2 comprises the stations of Vieste, Monte S. Angelo, S. Giovanni Rotondo and S. Marco in Lamis.
Table 2.
Correlation Analysis for the unique zone hypothesis. The formulas shown in bold have proven to be the most reliable and have been used in subsequent developments.
Table 3.
Correlation Analysis for the two zones hypothesis. The formulas shown in bold have proven to be the most reliable and have been used in subsequent developments.
This dual-assessment framework allows for the verification of whether accounting for macro-topographic barriers significantly reduces parameter estimation uncertainty compared to the traditional single-zone baseline.
For both the single-zone and the two-zone hypotheses, the parameter–indicator relationships showing the highest R2 values were identified. On the whole, a poor correlation for the parameters β, Z, and μ(h24) with the local topographic and climatic indicators can be observed in relation to the eight measurement stations present in the territory of the Gargano promontory. These results suggest that the assumption of a single homogeneous rainfall zone does not adequately represent the observed variability within the available dataset.
Overall, the strongest correlations for β and Z are associated with the Wind Effect (WE) indicator, whereas μ(h24) exhibits its highest correlation with the Exposition (EX) indicator.
Regarding the hypothesis of division into two homogeneous rainfall zones, a very strong correlation is observed for the three parameters β, Z, and μ(h24).
However, highly different behaviors are observed for the two hypothesized rainfall zones. In fact, in Zone 1, the parameters β and μ(h24) are correlated with the Wind Exposure Index (WEI), while the parameter Z correlates strongly with the station’s absolute elevation (EL).
Conversely, in Zone 2, a strong correlation is observed between parameter β and the Exposition (EX) indicator, between parameter Z and the Wind Effect (WE) indicator, and between parameter μ(h24) and the Sea Distance (SD) indicator.
As for the TPI and TRI indicators, no peak correlation is recorded with the parameters describing the DDF curve.
The initial selection of relationships was based on the coefficient of determination (R2) to identify models with the highest linear explanatory power. Then, to quantitatively assess the local accuracy and robustness of the model, the MAE and RMSE values were compared against the mean and standard deviation of the observed data. This approach allows us to (i) scale the absolute error against the actual magnitude of the parameter (through the mean value) and (ii) verify that the model’s residual uncertainty is significantly lower than the natural variability intrinsic to the investigated phenomenon (through the Standard Deviation value), aligning with standard hydrological validation practices [61].
Both under the hypothesis of a single rainfall zone and in the case of two zones, Table 4 summarizes the MAE, RMSE, Mean, and Standard Deviation (σ) values, only for the relationships that show the highest R2 value.
Table 4.
Comparison of R2, MAE, RMSE, Mean Values, and Standard Deviations.
The results reported above confirm the hypothesis of a poor fit for the single homogeneous rainfall zone assumption, while showing high reliability for the correlations expected under the hypothesis of two different rainfall zones. Specifically, in the case of a single homogeneous rainfall zone, the values of the MAE/Mean ratio range between 0.20 and 0.132, and the RMSE/σ ratio values range between 0.824 and 0.839. Both ranges demonstrate, respectively, that the mean absolute percentage error is excessive relative to the actual scale of the estimated parameter, and that the estimation error is comparable to the natural variability of the parameter. Conversely, under the hypothesis of two different homogeneous rainfall zones, the MAE/Mean ratio falls within the range of 0.004 to 0.018, while the RMSE/σ ratio ranges between 0.118 and 0.309. These results support the hypothesis that a two-zone subdivision may provide a more coherent representation of rainfall variability than a single homogeneous-zone assumption.
Consequently, based on the outcomes of the present study, it can be stated that, despite the assumptions of the VAPI. Project, the parameters of the DDF curves for the Gargano promontory are associated with multiple topographic and climatic parameters. These are mainly linked to slope exposure and position relative to the main watershed divide, and to windward/leeward conditions.
The value of absolute elevation, which is the only parameter considered in the VAPI project, retains limited relevance only for Zone 1, corresponding to the northern sector of the promontory. In contrast, rainfall in Zone 2 (the southern sector) is more strongly influenced by the distance from the coastline.
From an atmospheric physics and thermodynamic perspective, the statistical dominance of macro- and meso-scale parameters over micro-scale indices (TPI and TRI) can be explained by the spatial scale of the processes governing extreme precipitation.
Extreme rainfall events over the Gargano promontory are sustained by warm, moisture-rich marine air masses originating from the Adriatic Sea. At the macro-scale, Sea Distance (SD) influences the available atmospheric moisture, as marine air masses progressively lose water vapor through frictional effects and condensation while moving inland. At the same time, Elevation (EL) governs large-scale adiabatic cooling. As these air masses are forced to ascend the steep topographic barrier of the promontory, they expand and cool, reaching saturation and promoting condensation.
At the meso-scale, the interaction is controlled by the orientation of the main mountain slopes relative to the prevailing atmospheric circulation, producing pronounced stau and foehn effects. When prevailing northerly airflows (e.g., Mistral winds) reach the northern windward slopes, they undergo mechanically forced uplift, enhancing condensation and increasing rainfall intensity. Conversely, after crossing the main ridge and descending the southern leeward slopes, the air masses experience adiabatic warming associated with downslope flow (Föhn effect), which suppresses cloud formation and reduces rainfall intensity. Consequently, meso-scale parameters such as the Wind Effect (WE), Wind Exposition Index (WEI), and Exposition (EX) show high statistical significance because they effectively describe the relationship between terrain orientation and the prevailing airflow over several square kilometers.
Conversely, micro-scale indices such as TPI and TRI do not exhibit significant correlations with the DDF parameters because the atmospheric systems responsible for annual maximum rainfall events operate at much larger spatial scales. Convective storm cells and frontal systems typically extend over tens of kilometers horizontally and several kilometers vertically within the troposphere. Consequently, their dynamics are largely insensitive to local terrain irregularities represented by a 10 m DEM pixel. The turbulence generated by small ridges and depressions remains confined to the shallow atmospheric boundary layer and has little influence on the large-scale vertical motions responsible for cloud development and extreme precipitation.
Overall, the Gargano promontory behaves as a single, prominent orographic barrier to marine air masses. Its overall elevation (macro-scale) and slope orientation (meso-scale) largely determine the spatial distribution of extreme precipitation, whereas local terrain irregularities (micro-scale) have only a negligible influence on the hydrological processes investigated in this study.
Finally, the results provide further evidence of the need to move beyond the assumption adopted in the VAPI project that the Gargano promontory constitutes a single homogeneous rainfall zone.
From a geomorphological perspective, the negligible contribution of the Topographic Position Index (TPI) and the Terrain Ruggedness Index (TRI) can be explained by atmospheric physics and multi-scale orographic processes. The Gargano promontory behaves as a prominent, isolated topographic barrier rising abruptly from sea level.
Consequently, the dominant mechanisms governing extreme rainfall are controlled by large-scale orographic forcing rather than by localized surface roughness. This results in pronounced orographic uplift on the northern windward slopes and corresponding foehn-induced subsidence on the southern leeward slopes.
Morphological indices such as TPI and TRI are designed to quantify local terrain heterogeneity and roughness at the grid-cell scale. However, this small-scale variability exerts little influence on the dynamics of the large, moisture-rich air masses advected from the Adriatic Sea.
Instead, the interaction between these atmospheric systems and the terrain is primarily controlled by macro-scale physiographic factors, such as Sea Distance (SD) and Elevation (EL), and further modulated by meso-scale exposure characteristics, including the Wind Effect (WE), Wind Exposition Index (WEI), and Exposition (EX).
These results highlight a clear distinction between micro-scale terrain roughness, which has little influence on the DDF parameters, and the dominant macro- and meso-scale physiographic controls governing the spatial variability of extreme rainfall.
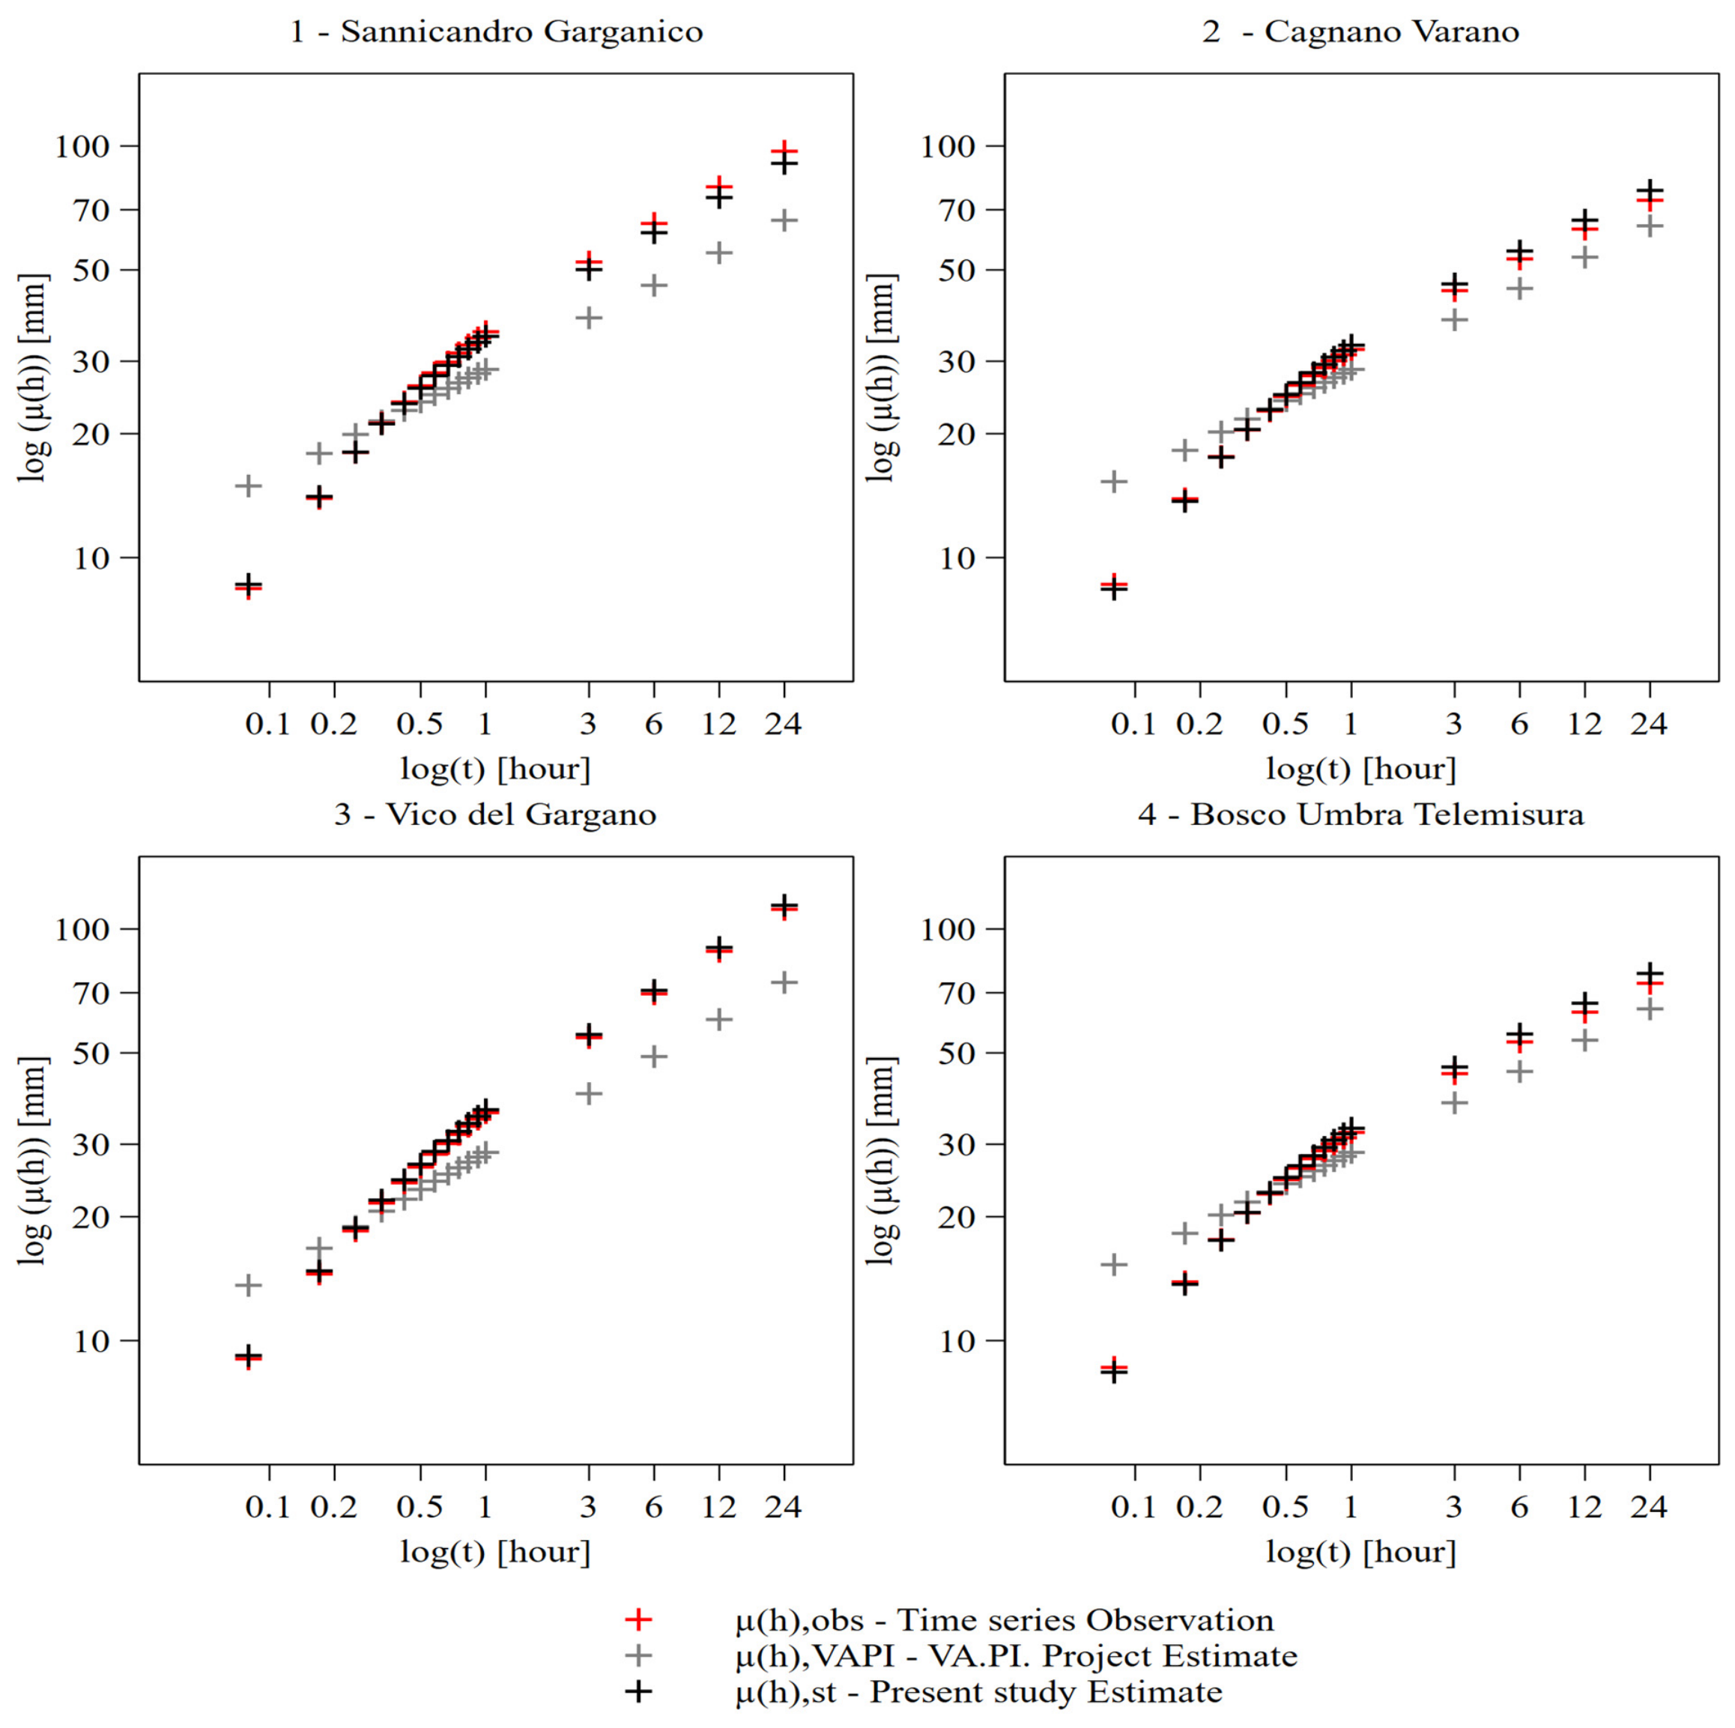
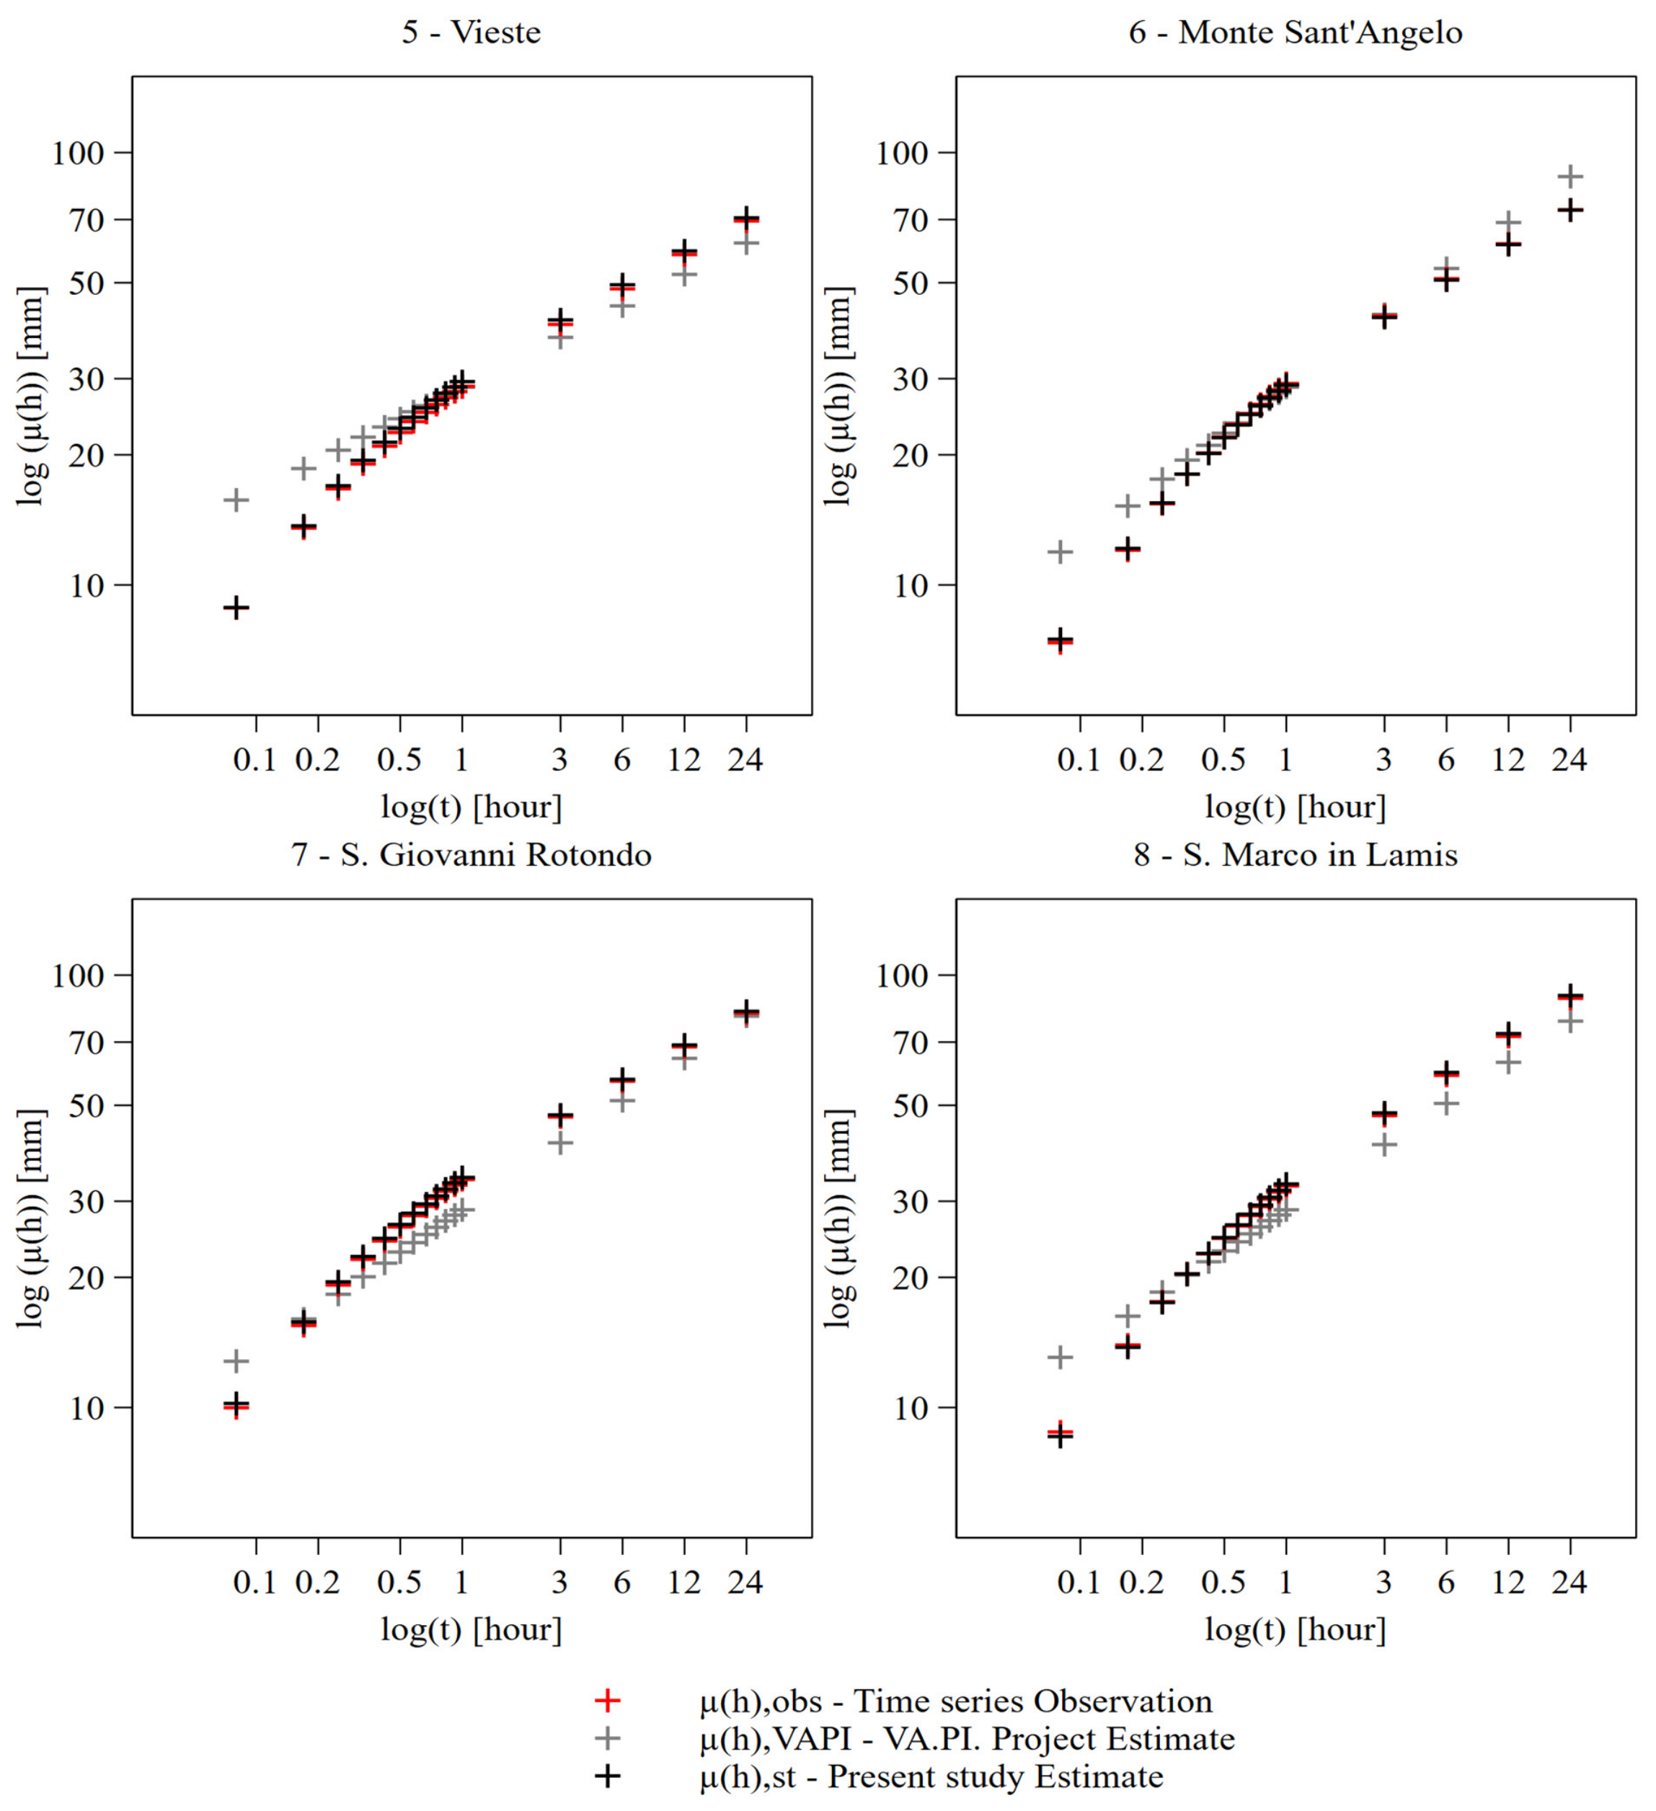
Using Equations provided for Zone 1 and Zone 2 in Table 4 and Equations (3), (6) and (8), it is possible to estimate the characteristic parameters μ(I0), β, and dc of the DDF curves for each station.
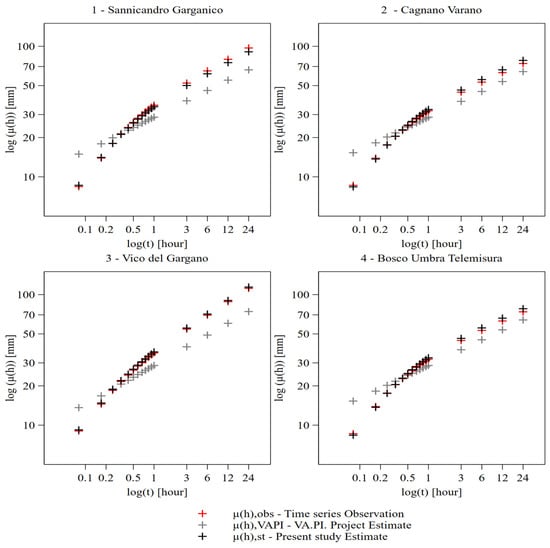
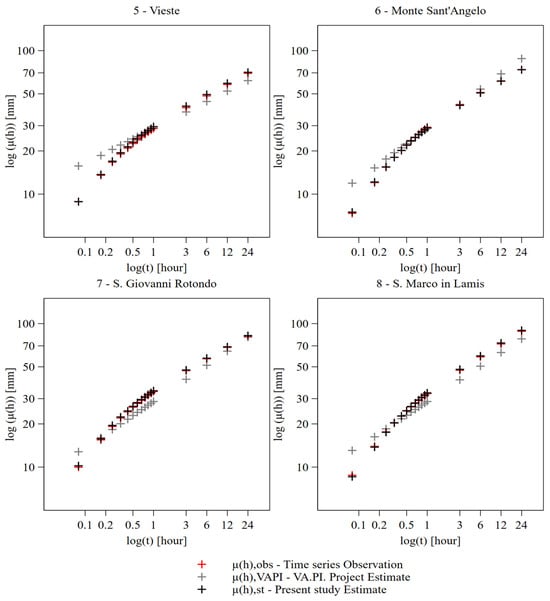
The performance of the resulting Depth-Duration curves was evaluated by comparing them, for each station, with (i) observed annual maximum rainfall depths derived from the hydrological annals and (ii) DDF curves estimated through the standard VAPI. methodology.
The results, reported in Figure 4, indicate that the relationships identified in this study between DDF-curve parameters and local climatic/topographic variables reproduce the observed annual maximum rainfall behavior more closely than the standard VAPI. Procedure.
Figure 4.
Depth–Duration curves for each station based on the annual maximum mean values, derived using the hydrological annals (time series observation), the standard VAPI methodology, and the methodology proposed in the present study.
To clarify the experimental design and address potential concerns regarding the limited number of rain gauge stations, two key methodological aspects should be highlighted.
First, given the availability of only eight stations, a parsimonious statistical framework was adopted to minimize the risk of overfitting.
Accordingly, complex multivariate regression models incorporating multiple topographic predictors were not employed. Instead, the analysis was based exclusively on simple bivariate linear regressions and correlation analyses relating individual DDF curve parameters (β, Z, and μ(h24)) to individual local physiographic indicators.
4. Discussion
This study provides preliminary evidence that local climatic and topographic controls influence the spatial variability of Depth–Duration–Frequency (DDF) curve parameters in the Gargano promontory. In particular, the combined effects of elevation, distance from the sea, wind exposure, and slope orientation appear to shape the local hydrological response and help explain the differences observed between station groups. Although the available dataset is still limited, the proposed relationships suggest useful indications for refining future regionalization schemes of extreme rainfall in the study area.
The main contribution of this study is not the introduction of topographic predictors per se, which have been widely investigated in the literature, but the identification of distinct physiographic controls governing DDF-curve parameters within the Gargano promontory. Classical hydrological literature has traditionally associated strong spatial variability in rainfall with extensive mountain ranges and high-altitude systems, such as the Alps or the Apennines in Italy. The Gargano promontory challenges this paradigm. It is an isolated carbonate massif, surrounded by the sea on three sides, with a maximum elevation only slightly exceeding 1000 m a.s.l. at Monte Calvo, but characterized by steep and abrupt morphological transitions. The results of this study suggest that this specific geometric configuration can generate marked micro-variability in DDF curve parameters, higher than that typically observed in orographically more homogeneous territories of comparable spatial extent. This represents a relevant contribution to the understanding of extreme rainfall patterns in Mediterranean coastal mountain environments.
The statistical results presented in this study indicate that the spatial distribution of extreme rainfall over the Gargano promontory is not solely controlled by elevation but is also strongly influenced by directional exposure and macro-scale topographic features. These statistical findings are consistent with the underlying atmospheric dynamics, highlighting a pronounced climatic asymmetry between the northern and southern sectors of the promontory.
This geographic contrast represents one of the principal findings and the main original contribution of the present study. The Gargano massif acts as a prominent topographic barrier protruding into the Adriatic Sea, intercepting moisture-rich maritime air masses. Consequently, the northern windward slopes are subjected to pronounced orographic uplift associated with the prevailing northerly and northwesterly airflows, resulting in enhanced extreme precipitation. In contrast, the southern leeward slopes lie within a rain-shadow region, where downslope flow and foehn effects reduce rainfall intensity. Recognizing and quantitatively characterizing this marked north–south asymmetry provides the physical basis for the proposed asymmetric regionalization scheme and explains why treating the entire promontory as a single homogeneous rainfall zone, as assumed in the current VAPI regionalization framework, does not adequately represent the observed spatial variability of extreme rainfall.
The methodological relevance of the proposed approach becomes evident when compared with the elevation-driven model adopted in the standard methodology of the VAPI. Project. Elevation-based approaches are supported by recent literature; for instance, Yao et al. [62] reported increasing evidence that precipitation-dependent wetting trends may be amplified with elevation. However, the results obtained for the Gargano area show that the application of a univariate elevation-based model leads to a spatial distribution mainly concentrated in the highest sectors. Conversely, the observed data indicate that the most severe DDF curves and extreme rainfall peaks are not necessarily located at maximum elevations, but rather along the northern coastal slopes exposed to prevailing weather systems. Therefore, in this specific context, absolute altitude alone loses predictive power unless it is included within a broader formulation that accounts for local exposure and wind-driven effects.
Several studies have explored the contribution of topographic variables to rainfall spatial interpolation in complex terrains. Kumari et al. [63] attempted to improve rainfall interpolation accuracy in mountainous areas by incorporating variables such as the Terrain Ruggedness Index. Ahmed et al. [64] enhanced spatial precipitation mapping by integrating terrain derivative indices with XGBoost machine learning techniques. Similarly, Diodato [65], in the Province of Benevento in the Campania Region, showed that topographic indices used as external information can improve the representation of precipitation spatial variability over small regions with complex terrain.
However, the statistical calibration performed in this study indicates that, for the Gargano promontory, the contribution of roughness, asperity, and general topographic indices is negligible. The main methodological improvement was obtained by excluding TRI and TPI in favor of a more parsimonious formulation based on the Wind Exposition Index, slope exposition, and wind effect. While roughness describes isotropic morphological complexity, the hydrological behavior of the Gargano promontory is intrinsically anisotropic. It responds to a clear functional distinction between windward and leeward slopes.
This finding also contrasts with the results of Buttafuoco and Lucà [66], who accounted for elevation and distance from the nearest coastline in the geostatistical mapping of mean annual precipitation and found no significant directional differences, suggesting isotropic behavior. In contrast, the present study highlights a marked anisotropic response in extreme rainfall patterns.
In the windward sector, the model identifies the Wind Exposition Index and elevation as the dominant drivers. The Gargano promontory acts as a mountainous protrusion that abruptly interrupts the fluid dynamics of humid air masses moving from the Adriatic Sea, particularly from the northern quadrants. These air masses impact the steep northern slopes of the promontory, producing intense orographic uplift. Although relief has only moderate altitude, the abrupt slope gradients promote rapid vertical ascent, with consequent adiabatic cooling and rainfall intensification. In this sector, direct thermodynamic forcing dominates: wind energy is converted into enhanced precipitation, contributing to the formation of intense rainfall events typical of Mediterranean cyclonic systems.
In the leeward sector, the governing mechanisms change substantially. Elevation becomes less explanatory, while exposure, wind effect, and distance from the sea become more relevant. Once humid air masses pass over the ridge, they undergo katabatic subsidence, producing warming and drying associated with a Föhn-like effect. Consequently, the southern and inland slopes of the Gargano are affected by a rainfall shadow during synoptic disturbances. Nevertheless, the combination of slope exposure, local thermal contrasts, and descending-air turbulence may generate favorable conditions for localized convective activity and isolated thunderstorms.
The implications of these findings extend beyond statistical hydrology and are relevant not only to hydrological research but also to flood risk management and public policy.
Recent flood events in Italy [67,68] have highlighted the need for more effective flood risk management strategies [69]. In the context of climate change, the increasing need to protect communities and infrastructure requires the implementation of both structural and non-structural flood risk mitigation measures. The findings of the present study can contribute to improving the hydrological information available for the design of structural mitigation works.
However, because complete protection against flooding cannot be achieved, effective risk management also requires the adoption of complementary non-structural measures, including insurance schemes to mitigate the economic impacts of natural disasters. In this context, recent Italian legislation [70,71] has introduced mandatory insurance coverage for businesses against natural hazards, including floods, increasing the need for accurate and physically based methods for flood risk assessment and quantification.
In addition, according to the Prime Ministerial Decree of 29 September 1998 [72], reference rainfall values associated with assigned return periods should be derived from the technical reports of the VAPI. Project made available by GNDCI-CNR for hydrological and hydraulic risk assessment. However, the present study shows that, in the Gargano area, the application of the standard method may lead to relevant distortions in rainfall-threshold estimation, with potential consequences for compensation policies and insurance pricing. In this sense, the contribution of this study can be relevant and makes evident the need for a new research field regarding the flood hazard insurance strategies.
The introduction of asymmetric DDF curves based on local topographic and climatological parameters has important implications for insurance risk assessment. First, micro-zonation is necessary to ensure tariff equity. The observed spatial variability suggests that risk classifications based on a single regional rainfall representation may overlook important local differences in hazard exposure between windward and leeward sectors. Second, improved local characterization of rainfall extremes may support more consistent risk assessment procedures within insurance frameworks.
Underestimating the orographic and coastal effects in the windward sector could expose insurers to sudden catastrophic losses not adequately covered by reserves. Conversely, overestimating risk in the leeward sector may produce premiums disproportionate to the actual hazard level, creating an unfair economic burden for local investors. The proposed methodology may therefore help reduce these distortions and support the economic sustainability of the insurance system.
Furthermore, insurance companies could link premium incentives to the actual implementation of mitigation measures based on locally estimated rainfall thresholds. In this way, mandatory insurance coverage could become not only a financial requirement but also a driver of territorial safety and risk reduction.
The adoption of more accurate models for estimating rainfall thresholds can also support local decision-makers in improving risk management policies, including both structural and non-structural mitigation measures. The geomorphological complexity of the Gargano territory has historically represented a significant constraint for effective local-scale planning.
Therefore, methodologies capable of explaining local rainfall-influence patterns may facilitate the identification of suitable mitigation strategies. From an engineering perspective, improved rainfall input estimation allows more reliable design and dimensioning of hydraulic and flood-mitigation works.
Conversely, standard approaches may underestimate design scenarios, especially along the northern coastline, where sensitive elements such as urban centers and transport infrastructure are already exposed to non-negligible hydraulic risk under the constraints defined by the local District Basin Authority.
Finally, the results are consistent with the findings of Apollonio et al. [24], who emphasized the need to expand the local rain gauge network for risk management of linear infrastructure in the northern Gargano region. The present study further supports this requirement by showing that the peculiar precipitation variability of the Gargano climate cannot be fully captured by standard spatial schemes.
Moreover, the proposed methodology may improve the assessment of the existing monitoring network and help identify priority locations for new instrumentation. Strengthening the rain gauge network would be particularly important for improving the estimation of sub-hourly rainfall extremes.
Unlike many previous studies focused on extensive mountain systems, the Gargano promontory represents a relatively small and isolated coastal massif. The results suggest that physiographic isolation, exposure to marine air masses, and abrupt topographic gradients may be as important as absolute elevation in controlling the spatial organization of rainfall extremes. This characteristic constitutes the principal scientific interest of the present case study.
The results should be interpreted considering the limited number of rain gauges available within the study area and the exploratory nature of the analysis. The identified relationships are specific to the Gargano promontory and should be verified using additional observations and independent datasets before being generalized to other regions. Nevertheless, the consistency of the identified physiographic patterns suggests that local climatic and topographic controls deserve consideration in future regionalization studies.
5. Conclusions
This study suggests that the spatial variability of DDF-curve parameters in the Gargano promontory is strongly influenced by local climatic and topographic controls. The results show that elevation alone is not sufficient to explain the distribution of extreme rainfall in the area. Instead, wind exposure, slope orientation, distance from the sea, and the distinction between windward and leeward sectors play a major role in shaping rainfall extremes.
The main contribution of this study is the identification of distinct physiographic controls on DDF-curve parameters within the Gargano promontory and the demonstration that a simple two-zone subdivision based on the main watershed divide provides a substantially better representation of observed rainfall variability than the currently adopted single-zone regionalization. This finding challenges the traditional assumption that strong rainfall spatial variability is mainly associated with extensive and high-altitude mountain systems.
The proposed parsimonious model, based on wind exposition, exposure, wind effect, and distance from the sea, provides a more physically consistent interpretation of the local rainfall regime than standard elevation-based approaches. In particular, the proposed model captures the anisotropic behavior of the Gargano promontory by distinguishing between enhanced orographic precipitation on the northern windward slopes and rain-shadow and convective processes affecting the southern and inland leeward sectors.
Although the empirical relationships identified in this study are specific to the geomorphological and climatic setting of the Gargano promontory, the proposed methodological framework has the potential to be applied to other regions with similar environmental characteristics. Future research should validate and extend the proposed approach by applying it to comparable Mediterranean environments, such as the Dalmatian coast or the coastal mountain ranges of Greece. Despite their local peculiarities, these regions share key physiographic characteristics with the Gargano, including karstic landscapes, steep coastal slopes, small catchments, and a high susceptibility to intense convective storms of marine origin.
From an applied perspective, these results have relevant implications for hydraulic risk assessment, land-use planning, engineering design, and insurance risk quantification. The use of standard DDF regionalization methods may lead to an underestimation of rainfall thresholds in the northern coastal sector and overestimation in more sheltered areas. Therefore, local-scale micro-zonation based on topographic and climatological controls is essential for improving both technical reliability and economic fairness.
Future developments should include the expansion of the rain gauge network, with particular attention to sub-hourly rainfall monitoring, and the extension of the analysis to the entire Province of Foggia, including the “Tavoliere delle Puglie” and “Monti Dauni” areas, corresponding to Zones 2 and 3 of the VAPI. Project. Further research should also investigate the first two levels of the VAPI regionalization framework to improve the transferability and operational applicability of the proposed methodology. Ultimately, this could support the development of practical guidelines for local authorities to integrate the proposed asymmetric DDF curves into regional flood risk management and hydraulic planning. Such an implementation would be particularly beneficial for the numerous small catchments of the Gargano promontory, which are highly vulnerable to flash floods.
With regard to insurance against climate change-related natural hazards, the assessment of the effects of recent regulatory measures is still at a preliminary stage and therefore lies beyond the scope of the present study. Nevertheless, this topic represents a promising direction for future research. Further studies could evaluate different insurance models and regulatory approaches, with the aim of improving the transparency, effectiveness, and resilience of insurance schemes for natural hazards.
Author Contributions
Conceptualization, C.A. and G.I.; methodology, A.P., C.A. and G.I.; formal analysis, A.P., C.A. and G.I.; investigation, C.A., G.I., A.P. and N.A.; data curation, C.A. and G.I.; writing—original draft preparation, C.A. and G.I.; writing—review and editing, C.A., G.I., A.P. and N.A.; supervision, C.A. All authors have read and agreed to the published version of the manuscript.
Funding
This research received no external funding.
Data Availability Statement
Data are available on request to the authors.
Conflicts of Interest
The authors declare no conflicts of interest.
References
- Song, J.-H.; Her, Y.; Suh, K.; Kang, M.-S.; Kim, H. Regionalization of a Rainfall-Runoff Model: Limitations and Potentials. Water 2019, 11, 2257. [Google Scholar] [CrossRef] [Scilit]
- Slater, L.J.; Anderson, B.; Buechel, M.; Dadson, S.; Han, S.; Harrigan, S.; Kelder, T.; Kowal, K.; Lees, T.; Matthews, T.; et al. Nonstationary Weather and Water Extremes: A Review of Methods for Their Detection, Attribution, and Management. Hydrol. Earth Syst. Sci. 2021, 25, 3897–3935. [Google Scholar] [CrossRef] [Scilit]
- Marra, F.; Koukoula, M.; Canale, A.; Peleg, N. Predicting Extreme Sub-Hourly Precipitation Intensification Based on Temperature Shifts. Hydrol. Earth Syst. Sci. 2024, 28, 375–389. [Google Scholar] [CrossRef] [Scilit]
- Tosunoglu, F.; Slater, L.J.; Kowal, K.M.; Gu, X.; Yin, J. Non-Stationary Modeling of Seasonal Precipitation Series in Turkey: Estimating the Plausible Range of Seasonal Extremes. Theor. Appl. Climatol. 2024, 155, 3071–3085. [Google Scholar] [CrossRef] [Scilit]
- De Luca, D.L.; Apollonio, C.; Petroselli, A. The Benefit of Continuous Hydrological Modelling for Drought Hazard Assessment in Small and Coastal Ungauged Basins: A Case Study in Southern Italy. Climate 2022, 10, 34. [Google Scholar] [CrossRef] [Scilit]
- Götzinger, J.; Bárdossy, A. Comparison of Four Regionalisation Methods for a Distributed Hydrological Model. J. Hydrol. 2007, 333, 374–384. [Google Scholar] [CrossRef] [Scilit]
- Guo, Y.; Zhang, Y.; Zhang, L.; Wang, Z. Regionalization of Hydrological Modeling for Predicting Streamflow in Ungauged Catchments: A Comprehensive Review. WIREs Water 2021, 8, e1487. [Google Scholar] [CrossRef] [Scilit]
- Westerberg, I.K.; Wagener, T.; Coxon, G.; McMillan, H.K.; Castellarin, A.; Montanari, A.; Freer, J. Uncertainty in Hydrological Signatures for Gauged and Ungauged Catchments. Water Resour. Res. 2016, 52, 1847–1865. [Google Scholar] [CrossRef] [Scilit]
- Miglietta, M.M.; Avolio, E.; Bracci, A.; Burlando, M.; Cairo, F.; Canepa, F.; Capozzi, V.; Carpentari, S.; Cassola, F.; Ceppi, A.; et al. Severe Convective Weather in Italy: Current Understanding and Research Priorities in the TIM Campaign. EGUsphere 2026. [Google Scholar] [CrossRef] [Scilit]
- Smith, R.B.; Barstad, I. A Linear Theory of Orographic Precipitation. J. Atmos. Sci. 2004, 61, 1377–1391. [Google Scholar] [CrossRef] [Scilit]
- Abbate, A.; Papini, M.; Longoni, L. Extreme Rainfall over Complex Terrain: An Application of the Linear Model of Orographic Precipitation to a Case Study in the Italian Pre-Alps. Geosciences 2020, 11, 18. [Google Scholar] [CrossRef] [Scilit]
- Wagener, T.; Wheater, H.S. Parameter Estimation and Regionalization for Continuous Rainfall-Runoff Models Including Uncertainty. J. Hydrol. 2006, 320, 132–154. [Google Scholar] [CrossRef] [Scilit]
- Claps, P.; Ganora, D.; Mazzoglio, P. Rainfall Regionalization Techniques. In Rainfall; Elsevier: Amsterdam, The Netherlands, 2022; pp. 327–350. [Google Scholar]
- Mazzoglio, P.; Butera, I.; Claps, P. A Local Regression Approach to Analyze the Orographic Effect on the Spatial Variability of Sub-Daily Rainfall Annual Maxima. Geomat. Nat. Hazards Risk 2023, 14, 2205000. [Google Scholar] [CrossRef] [Scilit]
- Yadav, M.; Wagener, T.; Gupta, H. Regionalization of Constraints on Expected Watershed Response Behavior for Improved Predictions in Ungauged Basins. Adv. Water Resour. 2007, 30, 1756–1774. [Google Scholar] [CrossRef] [Scilit]
- Furcolo, P.; Pelosi, A.; Rossi, F. Statistical Identification of Orographic Effects in the Regional Analysis of Extreme Rainfall. Hydrol. Processes 2016, 30, 1342–1353. [Google Scholar] [CrossRef] [Scilit]
- Pelosi, A.; Furcolo, P. An Amplification Model for the Regional Estimation of Extreme Rainfall within Orographic Areas in Campania Region (Italy). Water 2015, 7, 6877–6891. [Google Scholar] [CrossRef] [Scilit]
- Furcolo, P.; Pelosi, A. Orographic Effects on Extreme Rainfall at Different Durations: A Case Study in Campania Region (Southern Italy). J. Geosci. Environ. Prot. 2018, 6, 77–88. [Google Scholar] [CrossRef]
- Stockham, A.J.; Schultz, D.M.; Fairman, J.G.; Draude, A.P. Quantifying the Rain-Shadow Effect: Results from the Peak District, British Isles. Bull. Am. Meteorol. Soc. 2018, 99, 777–790. [Google Scholar] [CrossRef] [Scilit]
- Copertino, V.A.; Fiorentino, M. (Eds.) Valutazione Delle Piene in Puglia; Dipartimento di Ingegneria e Fisica Dell’ambiente, Università Degli Studi Della Basilicata Gruppo Nazionale per la Difesa Dalle Catastrofi Idrogeologiche: Potenza, Italy, 1994. [Google Scholar]
- Bell, F.C. Generalized Rainfall-Duration-Frequency Relationships. J. Hydraul. Div. 1969, 95, 311–328. [Google Scholar] [CrossRef] [Scilit]
- Sezione di Protezione Civile—Regione Puglia Annali Idrologici. Available online: http://www.protezionecivile.puglia.it (accessed on 20 May 2026).
- Vennari, C.; Salvati, P.; Bianchi, C.; Casarano, D.; Parise, M.; Basso, A.; Marchesini, I. AReGeoDatHa: Apulian Regional GeoDatabase for Geo-Hydrological Hazards. J. Environ. Manag. 2022, 322, 116051. [Google Scholar] [CrossRef] [Scilit]
- Apollonio, C.; Iemmolo, G.; Di Modugno, M.; Apollonio, M.; Petroselli, A.; Recanatesi, F.; Giannetta, D. A Multi-Parameter Approach to Support Sustainable Hydraulic Risk Analysis for the Protection of Transportation Infrastructure: The Case Study of the Gargano Railways (Southern Italy). Sustainability 2025, 17, 4151. [Google Scholar] [CrossRef] [Scilit]
- Caldara, M.; Caroli, I.; Simone, O. Holocene Evolution and Sea-Level Changes in the Battaglia Basin Area (Eastern Gargano Coast, Apulia, Italy). Quat. Int. 2008, 183, 102–114. [Google Scholar] [CrossRef] [Scilit]
- Billi, A.; Salvini, F. Sistemi Di Fratture Associati a Faglie in Rocce Carbonatiche; Nuovi Dati Sull’evoluzione Tettonica Del Promontorio Del Gargano. Ital. J. Geosci. 2000, 119, 237–250. [Google Scholar]
- Patacca, E.; Scandone, P. Geology of the Southern Apennines. In Results of the CROP Project, Sub-Project CROP-04 Southern Apennines (Italy); Mazzotti, A., Patacca, E., Scandone, P., Eds.; Special Issue; Bollettino della Società Geologica Italiana (Italian Journal of Geosciences): Roma, Italy, 2007; pp. 75–119. [Google Scholar]
- Pellicani, R.; Parisi, A.; Iemmolo, G.; Apollonio, C. Economic Risk Evaluation in Urban Flooding and Instability-Prone Areas: The Case Study of San Giovanni Rotondo (Southern Italy). Geosciences 2018, 8, 112. [Google Scholar] [CrossRef] [Scilit]
- Martinotti, M.E.; Pisano, L.; Marchesini, I.; Rossi, M.; Peruccacci, S.; Brunetti, M.T.; Melillo, M.; Amoruso, G.; Loiacono, P.; Vennari, C.; et al. Landslides, Floods and Sinkholes in a Karst Environment: The 1–6 September 2014 Gargano Event, Southern Italy. Nat. Hazards Earth Syst. Sci. 2017, 17, 467–480. [Google Scholar] [CrossRef] [Scilit]
- Regione Puglia (2015) Piano Paesaggistico Territoriale Regionale (PPTR). Deliberazione Della Giunta Regionale n. 176 del 16 Febbraio 2015. Available online: https://pugliacon.regione.puglia.it/services/pubblica/paesaggio-urbanistica/pttr/pptr-2015 (accessed on 12 May 2026).
- Sigismondi, A. L’Isola Biologica: La Fauna del Parco Nazionale del Gargano; Edizioni del Parco-Ente Parco Nazionale del Gargano: Monte Sant’Angelo, Italy, 2004. [Google Scholar]
- Cavuta, G.; Di Matteo, D. Il Parco Nazionale Del Gargano: La Protezione Della Diversità Dei Paesaggi. Geotema 2015, 49, 62–68. [Google Scholar]
- Bianchi, P.; Cappelletti, G.M.; Mafrolla, E.; Sica, E.; Sisto, R. Accessible Tourism in Natural Park Areas: A Social Network Analysis to Discard Barriers and Provide Information for People with Disabilities. Sustainability 2020, 12, 9915. [Google Scholar] [CrossRef] [Scilit]
- Ente Parco Nazionale del Gargano. Piano AIB per la Programmazione Delle Attività di Previsione, Prevenzione e Lotta Attiva Contro Gli Incendi Boschivi; Ente Parco Nazionale del Gargano: Monte Sant’Angelo, Italy, 2013. [Google Scholar]
- Cotecchia, V.; Simeone, V.; Gabriele, S. Caratteri Climatici Della Regione Puglia. In Memorie Descrittive Della Carta Geologica D’Italia; ISPRA Servizio Geologico d’Italia: Roma, Italy, 2014; Volume 92, pp. 338–369. [Google Scholar]
- Gioia, A.; Lioi, B.; Totaro, V.; Molfetta, M.G.; Apollonio, C.; Bisantino, T.; Iacobellis, V. Estimation of Peak Discharges under Different Rainfall Depth–Duration–Frequency Formulations. Hydrology 2021, 8, 150. [Google Scholar] [CrossRef] [Scilit]
- Rossi, F.; Villani, P. A Project for Regional Analysis of Floods in Italy. In Managing Hydro-Geological Disasters in a Vulnerable Environment; Andah, K., Ed.; CNR Publications: Perugia, Italy, 1998; pp. 141–168. [Google Scholar]
- Rossi, F.; Fiorentino, M.; Versace, P. Two-Component Extreme Value Distribution for Flood Frequency Analysis. Water Resour. Res. 1984, 20, 847–856. [Google Scholar] [CrossRef] [Scilit]
- Fiorentino, V.; Gabriele, S.; Rossi, F.; Versace, P. Hierarchical Approach for Regional Flood Frequency Analysis. In Regional Flood Frequency Analysis; Singh, V.P., Ed.; D. Reidel Publishing Company: Dordrecht, The Netherlands; Norwell, MA, USA, 1987; pp. 35–49. [Google Scholar]
- Rossi, F.; Villani, P. Valutazione Delle Piene in Campania; CNR-GNDCI (Gruppo Nazionale per la Difesa dalle Catastrofi Idrogeologiche): Salerno, Italy, 1995. [Google Scholar]
- Tarquini, S.; Nannipieri, L. The 10 M-Resolution TINITALY DEM as a Trans-Disciplinary Basis for the Analysis of the Italian Territory: Current Trends and New Perspectives. Geomorphology 2017, 281, 108–115. [Google Scholar] [CrossRef] [Scilit]
- Tarquini, S.; Isola, I.; Favalli, M.; Battistini, A.; Dotta, G. TINITALY, a Digital Elevation Model of Italy with a 10 Meters Cell Size, Version 1.1 2023; About 3000 M Grid Cells, in Total About 50 GB of Disk Memory, DEM: About 17 GB of Disk Memory, Shaded Relief Map: About 4.2 GB of Disk Memory, Slope Map: About 4.3 GB of Disk Memory, Sky View Factor (2.5 σ) Map: About 4.3 GB of Disk Memory, View Factor (Equal Area) Map: About 4.3 GB of Disk Memory, Openness Down Map: About 4.3 GB of Disk Memory, Hue-Saturation-Value Composition Image: About 12.7 GB of Disk Memory; Istituto Nazionale di Geofisica e Vulcanologia: Roma, Italy, 2023. [Google Scholar]
- Tarquini, S.; Isola, I.; Favalli, M.; Mazzarini, F.; Bisson, M.; Pareschi, M.T.; Boschi, E. TINITALY/01: A New Triangular Irregular Network of Italy. Ann. Geophys. 2007, 50, 407–425. [Google Scholar] [CrossRef] [Scilit]
- Protezione Civile Della Regione Puglia. Rete di Telemisura Meteo-Idro-Pluviometrica: Elenco e Anagrafica Delle Stazioni. Available online: https://reteidrometeo.protezionecivile.puglia.it/polarisopen/gis/map (accessed on 29 May 2026).
- Conrad, O.; Bechtel, B.; Bock, M.; Dietrich, H.; Fischer, E.; Gerlitz, L.; Wehberg, J.; Wichmann, V.; Böhner, J. System for Automated Geoscientific Analyses (SAGA) v. 2.1.4. Geosci. Model. Dev. 2015, 8, 1991–2007. [Google Scholar] [CrossRef] [Scilit]
- Böhner, J.; Antonić, O. Chapter 8 Land-Surface Parameters Specific to Topo-Climatology. In Developments in Soil Science; Elsevier: Amsterdam, The Netherlands, 2009; Volume 33, pp. 195–226. [Google Scholar]
- Gerlitz, L.; Conrad, O.; Böhner, J. Large-Scale Atmospheric Forcing and Topographic Modification of Precipitation Rates over High Asia–a Neural-Network-Based Approach. Earth Syst. Dynam. 2015, 6, 61–81. [Google Scholar] [CrossRef] [Scilit]
- Wanders, N.; Wada, Y.; Van Lanen, H.A.J. Global Hydrological Droughts in the 21st Century under a Changing Hydrological Regime. Earth Syst. Dynam. 2015, 6, 1–15. [Google Scholar] [CrossRef] [Scilit]
- Dobos, A.; Farkas, R.; Dobos, E. Terrain-Based High-Resolution Microclimate Modeling for Cold-Air-Pool-Induced Frost Risk Assessment in Karst Depressions. Climate 2025, 13, 205. [Google Scholar] [CrossRef] [Scilit]
- Zevenbergen, L.W.; Thorne, C.R. Quantitative Analysis of Land Surface Topography. Earth Surf. Processes Landf. 1987, 12, 47–56. [Google Scholar] [CrossRef] [Scilit]
- Riley, S.J.; DeGloria, S.D.; Elliot, R. Index That Quantifies Topographic Heterogeneity. Intermt. J. Sci. 1999, 5, 23–27. [Google Scholar]
- Durlević, U.; Valjarević, A.; Novković, I.; Ćurčić, N.B.; Smiljić, M.; Morar, C.; Stoica, A.; Barišić, D.; Lukić, T. GIS-Based Spatial Modeling of Snow Avalanches Using Analytic Hierarchy Process. A Case Study of the Šar Mountains, Serbia. Atmosphere 2022, 13, 1229. [Google Scholar] [CrossRef] [Scilit]
- Guisan, A.; Weiss, S.B.; Weiss, A.D. GLM versus CCA Spatial Modeling of Plant Species Distribution. Plant Ecol. 1999, 143, 107–122. [Google Scholar] [CrossRef] [Scilit]
- Wilson, J.P.; Gallant, J.C. (Eds.) Terrain Analysis: Principles and Applications; Wiley: New York, NY, USA; Weinheim, Germany, 2000. [Google Scholar]
- Weiss, A.D. Topographic Position and Landforms Analysis. In Proceedings of the Poster Presentation, ESRI User Conference; The Nature Conservancy (TNC), Northwest Division: San Diego, CA, USA, 2001. [Google Scholar]
- Wright, S. Correlation and Causation. J. Agric. Res. 1921, 20, 557. [Google Scholar]
- Chicco, D.; Warrens, M.J.; Jurman, G. The Coefficient of Determination R-Squared Is More Informative than SMAPE, MAE, MAPE, MSE and RMSE in Regression Analysis Evaluation. PeerJ Comput. Sci. 2021, 7, e623. [Google Scholar] [CrossRef] [Scilit] [PubMed]
- Willmott, C.J.; Matsuura, K. Advantages of the Mean Absolute Error (MAE) over the Root Mean Square Error (RMSE) in Assessing Average Model Performance. Clim. Res. 2005, 30, 79–82. [Google Scholar] [CrossRef] [Scilit]
- Chai, T.; Draxler, R.R. Root Mean Square Error (RMSE) or Mean Absolute Error (MAE)?–Arguments against Avoiding RMSE in the Literature. Geosci. Model Dev. 2014, 7, 1247–1250. [Google Scholar] [CrossRef] [Scilit]
- Legates, D.R.; McCabe, G.J. Evaluating the Use of “Goodness-of-fit” Measures in Hydrologic and Hydroclimatic Model Validation. Water Resour. Res. 1999, 35, 233–241. [Google Scholar] [CrossRef] [Scilit]
- Moriasi, D.N.; Arnold, J.G.; Van Liew, M.W.; Bingner, R.L.; Harmel, R.D.; Veith, T.L. Model Evaluation Guidelines for Systematic Quantification of Accuracy in Watershed Simulations. Trans. ASABE 2007, 50, 885–900. [Google Scholar] [CrossRef] [Scilit]
- Yao, J.; Yang, Q.; Mao, W.; Zhao, Y.; Xu, X. Precipitation Trend–Elevation Relationship in Arid Regions of the China. Glob. Planet. Change 2016, 143, 1–9. [Google Scholar] [CrossRef] [Scilit]
- Kumari, M.; Singh, C.K.; Basistha, A. Clustering Data and Incorporating Topographical Variables for Improving Spatial Interpolation of Rainfall in Mountainous Region. Water Resour. Manag. 2017, 31, 425–442. [Google Scholar] [CrossRef] [Scilit]
- Ahmed, P.B.S.; Mustafa, N.F.; Baban, M.H.M. Enhanced Spatial Precipitation Maps by Integrating XGBoost Machine Learning, Terrain Indices, and Optimal Interpolation. Theor. Appl. Climatol. 2026, 157, 270. [Google Scholar] [CrossRef] [Scilit]
- Diodato, N. The Influence of Topographic Co-Variables on the Spatial Variability of Precipitation over Small Regions of Complex Terrain. Int. J. Climatol. 2005, 25, 351–363. [Google Scholar] [CrossRef] [Scilit]
- Buttafuoco, G.; Lucà, F. Accounting for Elevation and Distance to the Nearest Coastline in Geostatistical Mapping of Average Annual Precipitation. Environ. Earth Sci. 2020, 79, 11. [Google Scholar] [CrossRef] [Scilit]
- Bendia, F.; Farabollini, P.; Materazzi, M.; Bufalini, M. The 15 September 2022 Floods in Northern Marche (Central Italy): Disaster Analysis, Case Studies and Mitigation Strategies for Hydro-Geomorphological Hazard. Nat. Hazards Earth Syst. Sci. 2026, 26, 1119–1140. [Google Scholar] [CrossRef] [Scilit]
- Ferrari, A.; Passadore, G.; Vacondio, R.; Carniello, L.; Pivato, M.; Crestani, E.; Carraro, F.; Aureli, F.; Carta, S.; Stumpo, F.; et al. Brief Communication: Hydrological and Hydraulic Investigation of the Extreme September 2024 Flood on the Lamone River in Emilia-Romagna, Italy. Nat. Hazards Earth Syst. Sci. 2025, 25, 2473–2479. [Google Scholar] [CrossRef] [Scilit]
- Valente, M.; Del Prete, C.; Facci, G.; Martino, A.; Grilli, G.R.; Bravi, F.; Reno, C.; Ragazzoni, L. The 2023 Floods in the Emilia-Romagna Region, Italy: A Retrospective Qualitative Investigation into Response Strategies and Criticalities. Int. J. Disaster Risk Reduct. 2025, 116, 105089. [Google Scholar] [CrossRef] [Scilit]
- Italia. Legge 30 Dicembre 2023, n. 213-Bilancio di Previsione Dello Stato per L’anno Finanziario 2024 e Bilancio Pluriennale per Il Triennio 2024–2026; Gazzetta Ufficiale della Repubblica Italiana: Roma, Italy, 2023. [Google Scholar]
- Italia. Ministero Dell’Economia e Delle Finanze Decreto 30 Gennaio 2025, n. 18-Regolamento Recante Modalità Attuative; Gazzetta Ufficiale della Repubblica Italiana: Roma, Italy, 2025. [Google Scholar]
- Italia. D.P.C.M. 29 Settembre 1998-Atto di Indirizzo e Coordinamento per la Perimetrazione Delle Aree a Rischio Idrogeologico; Gazzetta Ufficiale Della Repubblica Italiana: Roma, Italy, 1998. [Google Scholar]

Disclaimer/Publisher’s Note: The statements, opinions and data contained in all publications are solely those of the individual author(s) and contributor(s) and not of MDPI and/or the editor(s). MDPI and/or the editor(s) disclaim responsibility for any injury to people or property resulting from any ideas, methods, instructions or products referred to in the content. |
© 2026 by the authors. Licensee MDPI, Basel, Switzerland. This article is an open access article distributed under the terms and conditions of the Creative Commons Attribution (CC BY) license.