


Highlights
What are the main findings?
- Projected drought occurrence differs substantially between precipitation-based and climatic-water-balance indicators. SPI-based severe-drought occurrence generally decreases at the global scale, whereas SPEI-based severe- and extreme-drought occurrence increases across large parts of the world. The Mediterranean region, the Amazon and other parts of South America, southern Africa, parts of West and Central Asia, and Australia consistently emerge as major hotspots for increasing extreme-drought occurrence.
- The strongest increases are identified for SPEI-based extreme drought. Under SSP585, the global mean annual occurrence rate increases from 0.231 to 1.197 month/year for SPEI1 and from 0.207 to 1.716 month/year for SPEI3. Approximately 92.3% of analysed land grid cells show increasing SPEI3-based extreme-drought occurrence. Concurrent SPI-SPEI severe-drought occurrence decreases, whereas concurrent extreme-drought occurrence increases, indicating a redistribution of drought months toward the extreme severity class rather than a direct transition of individual severe-drought events.
What are the implications of the main findings?
- The contrasting responses of SPI and SPEI indicate that precipitation-based indicators alone may provide an incomplete assessment of future drought conditions. Drought-monitoring systems may therefore benefit from jointly reporting precipitation-based and potential-evapotranspiration-sensitive indicators, particularly under continued warming.
- A decline in severe-drought occurrence should not be interpreted as an overall reduction in drought pressure, because extreme-drought occurrence increases substantially in many regions. The identified hotspots and associated inter-model uncertainty provide evidence for prioritising regional drought preparedness, early warning, climate-service development, and long-term water-resource planning.
Abstract
Understanding how different drought indicators characterise future drought conditions is essential for climate monitoring and adaptation planning. This study quantified annual severe- and extreme-drought occurrence rates at the 1- and 3-month timescales using the Standardised Precipitation Index (SPI), the Standardised Precipitation Evapotranspiration Index (SPEI), and their concurrent signals. Historical conditions during 1951–2010 were compared with projections for 2041–2100 under SSP245 and SSP585 using an ensemble of 12 CMIP6 General Circulation Models. Inter-model uncertainty was assessed using the 5th and 95th ensemble quantiles. The results reveal marked contrasts between precipitation-based and potential-evapotranspiration-sensitive drought indicators. Globally, SPI-based severe-drought occurrence decreases under both scenarios, whereas SPI-based extreme-drought occurrence increases, particularly at the 3-month timescale under SSP585. Stronger and more spatially extensive increases are identified using SPEI. The global mean occurrence rate of SPEI1-based extreme drought increases from 0.231 month/year historically to 0.791 month/year under SSP245 and 1.197 month/year under SSP585. For SPEI3, the corresponding rate increases from 0.207 to 1.090 and 1.716 month/year, respectively, with approximately 92.3% of land grid cells showing increases under SSP585. Concurrent SPI-SPEI severe-drought occurrence decreases, while concurrent extreme-drought occurrence increases across approximately 70–77% of land grid cells. This contrast indicates a redistribution of concurrent drought months from the severe to the extreme severity class under a mutually exclusive classification scheme, particularly at the 3-month timescale. The Mediterranean region, the Amazon and other parts of South America, southern Africa, parts of West and Central Asia, and Australia consistently emerge as major hotspots. Ensemble-quantile results support the direction of increasing SPEI-based and concurrent extreme-drought occurrence, although substantial uncertainty remains in the magnitude of change. These findings demonstrate the value of jointly considering precipitation-based and evaporative-demand-sensitive indicators in drought monitoring and regional climate adaptation planning.
1. Introduction
Drought is among the most complex and least understood natural hazards, affecting more people and causing greater long-term economic losses than any other natural disaster. For example, the 2012–2017 California drought resulted in billions of dollars in agricultural losses, widespread water restrictions, and heightened wildfire risks, illustrating the multifaceted societal and environmental impacts of prolonged drought conditions [1,2]. Similarly, the 2010 Russian drought, characterised by extreme heatwaves and persistent rainfall deficits, caused economic damages exceeding USD 15 billion, including substantial reductions in grain production that triggered global food price spikes [3,4]. Moreover, the severe East African drought of 2011, driven by consecutive seasons of rainfall failure and aggravated by rising food prices, led to a widespread humanitarian crisis, affecting millions of people through famine, forced displacement, and loss of livelihoods [5,6,7]. These events highlight the devastating consequences of droughts and underscore the urgent need to better understand and predict drought occurrence rate, particularly under ongoing global climate change, which is expected to intensify hydrological extremes and exacerbate drought conditions worldwide.
Recent studies have consistently reported increases in the frequency, intensity, and duration of drought events, largely linking these trends to global warming. Sheffield and Wood [8] emphasised the growing vulnerability of terrestrial systems to drought as a result of altered hydrological cycles, while Dai [9] highlighted the critical role of rising temperatures in enhancing evapotranspiration and amplifying drought severity. In this context, standardised drought indices provide a consistent basis for comparing moisture anomalies across regions with different climatological conditions. The Standardised Precipitation Index (SPI) characterises precipitation deficits relative to the local historical climate and is widely used because of its limited data requirements, multiscalar structure, and spatial comparability [10]. It is particularly useful where precipitation variability is the primary climatic control on drought and where long, reliable precipitation records are available. However, because SPI does not account for changes in atmospheric water demand, it may provide an incomplete representation of drought development under sustained warming. Its estimation may also be less stable in highly arid regions or seasons characterised by frequent zero-precipitation months, where the fitted precipitation distribution becomes more influential.
The Standardised Precipitation Evapotranspiration Index (SPEI) retains the multiscalar and standardised characteristics of SPI but is calculated from the climatic water balance between precipitation and potential evapotranspiration (PET) [11]. It can therefore provide additional information in regions and periods where temperature-related evaporative demand contributes substantially to moisture deficits, including many arid, semiarid, Mediterranean, and seasonally water-limited environments. Nevertheless, SPEI is sensitive to the selected PET formulation and to uncertainties in the meteorological variables used to calculate PET. Consequently, SPI and SPEI should be viewed as complementary indicators: SPI isolates changes associated with precipitation supply, whereas SPEI reflects the combined influence of precipitation and estimated atmospheric evaporative demand [12]. The difference between the two indices is therefore particularly informative in climate-change assessments, although SPEI should not be interpreted as a direct measure of actual evapotranspiration, soil moisture, or hydrological drought [13,14,15,16,17]. The original SPEI formulation and subsequent methodological assessments emphasise both its value under warming and its sensitivity to PET estimation.
The interpretation of both indices also depends strongly on the accumulation timescale. Short accumulation periods, such as 1 month, represent immediate meteorological anomalies and rapidly developing climatic water deficits, whereas 3-month indices capture the persistence of deficits over a season and are often relevant to seasonal vegetation and agricultural water stress. Longer accumulation periods, commonly 6–12 months or more, are more closely related to slowly responding systems such as streamflow, reservoir storage, groundwater, and long-term ecosystem conditions, although the relevant response time varies among climates and catchments.
Previous applications have demonstrated that SPI- and SPEI-based assessments can produce substantially different climate-change signals. At the global scale, Nwayor and Robeson [18] showed that much of the terrestrial surface experienced positive SPI trends but negative SPEI trends during 1971–2022, indicating that increasing evaporative demand can alter the diagnosed direction of drought change. Bhardwaj et al. [19] further reported that, under 3 °C global warming, increases in drought severity covered a much larger proportion of land when evaluated using SPEI than when evaluated using SPI. These results suggest that reliance on a single indicator may obscure important components of future climatic water stress.
CMIP-based studies have also projected substantial but spatially heterogeneous changes in future drought. Global CMIP6 analyses have identified robust drying or increasing drought occurrence in regions including the Mediterranean, Central and South America, the Amazon, southern Africa, and Australia, with changes generally becoming stronger under higher-forcing scenarios [20]. At the same time, considerable uncertainty remains because precipitation, soil moisture, runoff, evaporative demand, and vegetation responses do not necessarily produce identical drought signals. Cook et al. [20] found widespread regional drying across multiple CMIP6 drought variables, including under intermediate mitigation pathways, while Ukkola et al. [21] showed that coherent regional changes in meteorological drought can emerge despite considerable uncertainty in mean precipitation projections. Most existing global CMIP assessments, however, have focused on individual indices, individual components of the hydrological cycle, or aggregated drought characteristics. Limited studies have compared SPI and SPEI using consistent thresholds and timescales, examined the months in which both indices identify the same severity class, and evaluated whether future changes differ between severe- and extreme-drought occurrence.
Concurrent SPI-SPEI occurrence provides a measure of agreement between a precipitation-based indicator and a climatic-water-balance indicator. Because precipitation is included in both indices, SPI and SPEI are not statistically independent, and their concurrence should not be interpreted as a compound hazard composed of two independent drivers. Instead, concurrent occurrence identifies months in which both indicators consistently diagnose the same drought-severity class. Nevertheless, systematic global assessments under future climate scenarios remain limited. Previous applications have also often focused on individual regions, including China [15,17] and Spain [22]. Consequently, insufficient attention has been given to: (i) global differences between precipitation-based and PET-sensitive drought projections; (ii) the frequency with which SPI and SPEI simultaneously identify the same severity class; (iii) future changes in the relative occurrence of severe- and extreme-drought months; and (iv) inter-model uncertainty in these multi-indicator signals.
To address these gaps, annual severe- and extreme-drought-month occurrence rates are quantified at the 1- and 3-month timescales using SPI and SPEI derived from 12 CMIP6 General Circulation Models. Concurrent SPI-SPEI drought occurrence is identified when both indices satisfy the same severity criterion at the same grid cell, calendar month, and accumulation timescale. Inter-model uncertainty is assessed using the 5th and 95th ensemble quantiles. Specifically, the objectives are to: (1) quantify and compare projected SPI- and SPEI-based severe- and extreme-drought occurrence; (2) assess changes in concurrent SPI-SPEI occurrence and in the relative balance between severe- and extreme-drought classes; (3) identify regional hotspots of projected change; and (4) evaluate the magnitude uncertainty and directional consistency of these changes across the multi-model ensemble.
The novelty of this study does not lie in the development of a new drought index or methodological framework. Rather, it lies in the consistent global multi-model comparison of SPI-, SPEI-, and concurrent SPI-SPEI-based drought occurrence across severity classes, accumulation timescales, and emissions scenarios, together with an explicit assessment of ensemble-quantile uncertainty and directional GCM agreement.
2. Materials and Methods
2.1. Global Climate Projection Data
In this study, climate simulations and projections from a suite of climate models from the Coupled Model Intercomparison Project Phase 6 (CMIP6) were employed to assess drought conditions under two Shared Socioeconomic Pathways (SSP245 and SSP585). These models represent a broad spectrum of geographical origins and resolutions, enabling a comprehensive analysis of projected climate impacts on drought severity and frequency. Table 1 outlines the specific CMIP6 models utilised, detailing their respective contributing country and spatial resolution. Monthly precipitation was obtained from the selected CMIP6 simulations, while PET data used for SPEI calculation were obtained from the CMIP6-derived evapotranspiration dataset.
Table 1.
CMIP6 climate models used in this study.
Those GCMs were selected based on the latest empirical assessments from relevant studies, which underscore the paramount importance of model performance in accurately simulating specific climate variables, such as precipitation patterns and temperature variability, crucial for drought studies [23,24,25,26,27,28,29]. These models hail from prestigious climate research institutes across the globe, each contributing unique insights into climate dynamics due to their varying resolutions and modelling approaches. Such diversity not only enriches our analysis but also enhances the reliability and robustness of our findings, offering a multifaceted view of potential future drought occurrence under different climate change scenarios.
CMIP6 future projections are organised within the Shared Socioeconomic Pathway–radiative forcing framework, in which each scenario combines a socioeconomic development narrative with an approximate level of effective radiative forcing reached by 2100 [30]. This study considers SSP245 and SSP585 to represent intermediate- and high-forcing climate futures, respectively. SSP245 follows the SSP2 “middle-of-the-road” narrative, under which social, economic, technological, and demographic trends broadly continue without pronounced shifts toward either sustainability or fossil-fuel-intensive development. Greenhouse gas emissions remain at intermediate levels, producing an effective radiative forcing of approximately 4.5 W m−2 by 2100 [16]. SSP585 follows the SSP5 “fossil-fuelled development” narrative, characterised by rapid economic growth, high energy and resource demand, and continued heavy reliance on fossil fuels, leading to an effective radiative forcing of approximately 8.5 W m−2 by 2100 [12,13].
The two scenarios were selected to examine the sensitivity of projected drought occurrence to substantially different levels of future climate forcing. Relative to SSP245, SSP585 generally produces stronger warming and a larger increase in atmospheric evaporative demand, although the magnitude and direction of regional precipitation changes remain heterogeneous across GCMs. Consequently, differences between the two scenarios should not be interpreted as deterministic forecasts or as probabilities of future occurrence. Instead, they represent conditional projections under alternative socioeconomic, emissions, and radiative-forcing pathways. The socioeconomic assumptions do not enter the drought-index calculations directly; rather, they influence the greenhouse gas forcing trajectories used by the GCMs, which in turn affect precipitation, temperature, and reference evapotranspiration.
Monthly rainfall data for both the historical period (1951–2010) and the future period (2041–2100) were sourced from the World Climate Research Programme (WCRP) (https://www.wcrp-climate.org/ (accessed on 20 February 2024)). These datasets facilitate the analysis of changes in the Standardised Precipitation Index (SPI) across both historical and projected future periods. However, to calculate the Standardised Precipitation Evapotranspiration Index (SPEI), data on potential evapotranspiration (PET) are essential. Various methods exist to calculate PET values using meteorological variables. In this research, PET data were acquired from Bjarke et al. [31], who provided global monthly estimates utilising the Penman-Monteith method, based on climate projections from several General Circulation Models (GCMs) in CMIP6 [31,32]. The PET dataset by Bjarke et al. [31,32] has been evaluated against widely used reference datasets, supporting its reliability for this analysis.
For each selected GCM, monthly precipitation was paired with the corresponding Penman–Monteith short-grass reference evapotranspiration (ET0) obtained from Bjarke et al. [31,32] using identical CMIP6 source, experiment, variant, and grid identifiers. The historical, SSP245, and SSP585 precipitation and ET0 data therefore originated from the same parent GCM simulations and native grids. Precipitation and ET0 were temporally aligned by calendar month and converted to consistent monthly water-depth units before calculating the climatic water balance, P − ET0. Model-specific calendars were accounted for during conversion from daily rates or fluxes to monthly totals. The land mask associated with each GCM was applied to both variables, and no additional bias correction was performed. SPI and SPEI were calculated separately for each GCM and land grid cell rather than from ensemble-mean climate fields. The model-specific results were subsequently remapped to the N80 Gaussian grid of MRI-ESM2-0 (320 × 160 grid cells; approximately 1.125° spatial resolution) using bilinear interpolation in Climate Data Operators. Ensemble means and the 5th and 95th quantiles were then calculated across the 12 model-specific results.
2.2. Standardised Precipitation Index (SPI)
Standardised Precipitation Index (SPI) is an indicator representing the probability of rainfall occurrence in a certain period of time in a region. It has the advantages of simple calculation and stability and eliminates the temporal and spatial differences in rainfall. It is sensitive to drought change and applicable to drought monitoring and assessment of climatic conditions above the monthly scale. For SPI, the Gamma probability distribution function was used to calculate the probability distribution of the precipitation in a specific month as follows [10,33]:
Equation (1) denotes the probability density function (PDF) of the Gamma distribution. β > 0 and γ > 0 are scale and shape parameters, respectively, calculated as follows:
In Equation (3), xi is the monthly precipitation, n refers to the sample size, and is the average of the precipitation samples. The cumulative probability function (CDF) of the Gamma distribution for the random variable x ≤ x0 can be derived as:
The Gamma distribution does not include the case of x = 0, and the probability distribution with the x = 0 cases would be modified as:
where q is the probability for zero precipitation, and F(x) is the CDF from the gamma distribution. The SPI can finally be derived as [34]:
where the constants are c0 = 2.515517, c1 = 0.802853, c2 = 0.010328, d1 = 1.432788, d2 = 0.189269, and d3 = 0.001308.
2.3. Standardised Precipitation Evapotranspiration Index (SPEI)
SPI has its limitations since it only considers precipitation in its calculation process and cannot fully reflect the impact of climate warming on drought [11]. Consequently, the Standardised Precipitation Evapotranspiration Index (SPEI) has been developed based on monthly water balance to reflect the impact of surface evaporation changes in order to compensate for the lack of SPI [11]. SPEI replaces the monthly rainfall in SPI with the difference between monthly rainfall and monthly potential evapotranspiration, takes into account the temperature factor, and introduces the influence of surface evaporation changes, which is more sensitive to the drought reaction caused by global temperature rise.
In order to estimate SPEI, the water balance difference between precipitation and potential evapotranspiration was fitted using the log-logistic probability distribution, with the CDF expressed as follows [35]:
where θ, σ, and α are location, scale and shape parameters. Based on the CDF F(x) of the log-logistic distribution, the SPEI can be easily standardised as [36]:
where W = for P ≤ 0.5 and P = 1 − F(x). If P > 0.5, P is replaced by 1 − P and the sign of the resultant SPEI is reversed. The constants are c0 = 2.515517, c1 = 0.802853, c2 = 0.010328, d1 = 1.432788, d2 = 0.189269, and d3 = 0.001308. Based on either SPI or SPEI, the drought severity can be classified into different severity levels as presented in Table 2.
Table 2.
Drought severity using SPI/SPEI indices [6].
For each GCM, land grid cell, accumulation timescale, and ending calendar month (January–December), the distribution parameters used to calculate SPI and SPEI were estimated exclusively from the historical reference period of 1951–2010. A separate gamma distribution was fitted to the accumulated precipitation values for each calendar month when calculating SPI, while a separate log-logistic distribution was fitted to the accumulated climatic water-balance values, P − ET0, for each calendar month when calculating SPEI. The resulting month-specific historical distribution parameters were retained unchanged and applied to the corresponding calendar months in both the historical and future series. Thus, future SPI and SPEI values were standardised relative to the same historical climatology and were not recalibrated separately under SSP245 or SSP585. This fixed-reference approach enables projected changes to be interpreted as changes in the frequency with which future climatic conditions cross drought thresholds defined relative to the historical climate. The fitting and standardisation procedures were conducted separately for each of the 12 GCMs before the model-specific drought-occurrence results were aggregated across the ensemble.
2.4. Drought Occurrence Assessment Through Multiple Drought Indicators
The annual drought-month occurrence rate (λ) was used to quantify the frequency of severe and extreme drought conditions based on SPI, SPEI, and their concurrent occurrence [6,17,37,38,39]. This metric represents the mean number of monthly index values satisfying a specified drought threshold per year and was calculated as follows:
where N represents the time period in years of site detection, n represents the number of drought months at the site during the time period, and λ is the drought months per year (month/year).
The annual drought-month occurrence rate measures how frequently monthly SPI or SPEI values cross a specified severity threshold during the analysis period. It should not be interpreted as the duration of individual drought episodes, the accumulated magnitude of precipitation or climatic-water-balance deficits, or the total annual water deficit. For the 3-month indices, each threshold-exceeding value represents a calendar month for which the preceding three-month accumulated condition satisfies the drought criterion; adjacent values are therefore temporally overlapping and do not represent independent drought events. Therefore, a threshold-exceeding SPI3 value represents a calendar month in which the preceding three-month climatic condition satisfies the specified drought criterion, rather than an independent three-month drought event. Similarly, SPEI-based occurrence reflects the frequency of standardised P − ET0 conditions relative to the historical reference climatology, rather than actual evapotranspiration, total water loss, or direct changes in terrestrial water storage.
In this study, the frequencies of severe drought (SD) and extreme drought (ED) under different climate conditions will be analysed through SPI and SPEI. The drought occurrence can be characterised by drought months per year as follows:
- (1)
- Severe drought frequency
- (2)
- Extreme drought
3. Results Analysis
3.1. Drought Occurrence Based on Standardised Precipitation Index
In this study, annual severe- and extreme-drought-month occurrence rates were quantified at the 1- and 3-month accumulation timescales under SSP245 and SSP585. The analysis was therefore designed specifically to assess short-term meteorological drought occurrence. The 1-month indices characterise immediate monthly precipitation and climatic-water-balance anomalies, whereas the 3-month indices represent the accumulation and persistence of these anomalies over a seasonal period. These timescales are relevant to rapidly developing meteorological drought, seasonal crop-water stress, and short-term drought monitoring and water management. Longer accumulation periods, such as 6–12 months or more, are more closely associated with slowly responding hydrological and ecological systems, including streamflow, reservoir storage, groundwater, and long-term ecosystem conditions. Their assessment would require additional hydrological and impact-based variables and is therefore beyond the scope of the present study. The annual occurrence rate represents the mean number of monthly index values satisfying a specified drought threshold per year and is expressed in drought-condition months per year.
In this study, the annual occurrence rates of severe and extreme drought conditions at the 1- and 3-month timescales were quantified under the SSP245 and SSP585 scenarios. These short timescales capture monthly to seasonal meteorological drought conditions that may affect crop growth, soil-water availability, and short-term water allocation. The annual occurrence rate represents the mean number of monthly index values satisfying a specified drought threshold per year and is expressed in drought-condition months per year (unit: months/year).
Based on the ensemble projections from 12 CMIP6 GCMs, Figure 1 presents the annual occurrence rates of SPI-based severe-drought conditions during the historical period (1951–2010) and the future period (2041–2100). The projected changes show pronounced regional heterogeneity. For SPI1, severe-drought occurrence decreases across many northern high-latitude regions, including northern Canada, Alaska, Greenland, and northern Eurasia, as well as parts of the Sahara and the Arabian Peninsula. In contrast, increases are concentrated in parts of South America, particularly the Amazon basin, southern Europe and the Mediterranean region, southern Africa, and Australia. These regional contrasts generally become more pronounced under SSP585. The SPI3 results show a broadly similar pattern but are smoother and more spatially coherent because of the 3-month accumulation window. Declining occurrence remains widespread across northern high-latitude regions, whereas increases extend across selected low- and mid-latitude areas. Overall, the spatial response is highly heterogeneous, with localised increases occurring alongside extensive regions of declining severe-drought occurrence.
Figure 1.
Ensemble-mean annual occurrence rates of SPI-based severe droughts in historical (1951–2010) and future periods (2041–2100) under SSP245 and SSP585. Severe drought is defined as −2.0 < SPI ≤ −1.5. Results are shown for the 1- and 3-month accumulation timescales and are expressed in drought-condition months per year (month/year). The ensemble mean was calculated across the 12 model-specific occurrence-rate fields at each grid cell.
At the global scale, the mean annual occurrence rate of SPI1-based severe-drought conditions decreases from 0.506 month/year during the historical period to 0.440 month/year under SSP245 and 0.444 month/year under SSP585. These changes correspond to reductions of approximately 13.2% and 12.3%, respectively. For SPI3, the global mean decreases from 0.522 month/year historically to 0.431 month/year under SSP245 and 0.455 month/year under SSP585, corresponding to reductions of approximately 17.5% and 12.8%, respectively. The reduction is therefore more pronounced for SPI3 under SSP245, whereas the higher future mean under SSP585 indicates that stronger forcing partly offsets the overall decline in severe-class occurrence in some regions.
Figure 2 further summarises the grid-cell changes in annual severe-drought occurrence rates relative to the historical period. The distributions are predominantly centred below zero, confirming that decreases are more widespread than increases at the global scale. Positive changes occur over approximately 28.6% and 31.9% of global grid cells for SPI1 under SSP245 and SSP585, respectively. For SPI3, the corresponding proportions are approximately 31.6% and 36.0%. Thus, although declining or unchanged occurrence rates dominate globally, the proportion of regions experiencing increases is consistently larger under SSP585 than under SSP245, particularly at the 3-month timescale.
Figure 2.
Kernel density distributions of grid-cell changes in the annual occurrence rates (ensemble-mean) of SPI-based severe-drought conditions under SSP245 and SSP585 relative to the historical period. Changes were calculated as the future ensemble-mean occurrence rate for 2041–2100 minus the historical ensemble-mean occurrence rate for 1951–2010 at each analysed land grid cell.
Because severe and extreme droughts are defined as mutually exclusive severity classes in this study, the projected decrease in severe-drought occurrence should not be interpreted as an overall reduction in drought conditions. In some regions, a decline in the frequency of severe-class months may occur concurrently with an increase in extreme-class months, indicating a redistribution of drought occurrence toward the more extreme category.
Figure 3 presents the ensemble-mean annual occurrence rates of SPI-based extreme-drought conditions (SPI ≤ −2.0) during the historical period and under SSP245 and SSP585. The projected spatial pattern broadly resembles that identified for SPI-based severe drought, but increases in the extreme-drought class are generally stronger and more spatially extensive. Extreme-drought occurrence remains broadly stable or decreases slightly across many northern high-latitude regions and parts of northern Africa and the Arabian Peninsula, whereas increases are concentrated in the low- and mid-latitude hotspots identified above. These increases become more pronounced under SSP585, particularly for SPI3. At the global scale, the mean annual occurrence rate of SPI1-based extreme-drought conditions increased from 0.277 month/year during the historical period to 0.311 month/year under SSP245 and 0.370 month/year under SSP585. For SPI3, the corresponding global mean increased from 0.275 month/year to 0.316 and 0.432 month/year, respectively. These results indicate that the intensification of extreme-drought occurrence is stronger at the 3-month timescale under SSP585.
Figure 3.
Ensemble-mean annual occurrence rates of SPI-based extreme droughts in historical (1951–2010) and future periods (2041–2100) under SSP245 and SSP585. Extreme drought is defined as SPI ≤ −2.0. Results are shown for the 1- and 3-month accumulation timescales and are expressed in drought-condition months per year (month/year). The ensemble mean was calculated across the 12 model-specific occurrence-rate fields at each grid cell.
Figure 4 presents the kernel density distributions of grid-cell changes in the annual occurrence rates of SPI-based extreme-drought conditions, calculated as the future occurrence rate minus the corresponding historical rate. For SPI1, the distributions under both scenarios are concentrated near zero, but exhibit extended positive tails, indicating that relatively large increases are concentrated in a limited number of regional hotspots. Positive changes occur in approximately 48.7% of the analysed land grid cells under SSP245 and 49.6% under SSP585. Thus, the global land area is almost evenly divided between grid cells showing increases and those showing little change or decreases, although the magnitude of positive changes is generally greater under SSP585.
Figure 4.
Kernel density distributions of grid-cell changes in the annual occurrence rates (ensemble-mean) of SPI-based extreme-drought conditions under SSP245 and SSP585 relative to the historical period. Changes were calculated as the future ensemble-mean occurrence rate for 2041–2100 minus the historical ensemble-mean occurrence rate for 1951–2010 at each analysed land grid cell.
The response is more pronounced at the 3-month timescale. Under SSP245, approximately 46.6% of land grid cells show higher SPI3-based extreme-drought occurrence rates than during the historical period. This proportion increases to approximately 53.3% under SSP585, indicating that more than half of the analysed land grid cells are projected to experience an increase in the annual occurrence rate of SPI3-based extreme-drought conditions. The SSP585 distribution also exhibits a broader positive tail than that under SSP245, suggesting stronger and more spatially heterogeneous increases in accumulated 3-month precipitation deficits.
Compared with the corresponding severe-drought results, increases in extreme-drought occurrence are substantially more widespread. Positive changes in severe-drought occurrence are limited to approximately 28.6–36.0% of land grid cells, whereas the corresponding proportions for extreme drought range from approximately 46.6% to 53.3%. This contrast indicates that projected changes are characterised not by a uniform increase in all drought categories, but by a redistribution of threshold-exceeding months toward the extreme-drought class, particularly for SPI3 under SSP585.
3.2. Drought Occurrence Based on Standardised Precipitation Evapotranspiration Index
While SPI characterises drought conditions based on precipitation anomalies alone, it does not explicitly account for atmospheric water demand. In contrast, the Standardised Precipitation Evapotranspiration Index (SPEI) incorporates potential evapotranspiration (PET), allowing drought conditions to be assessed from both supply and demand perspectives. This makes SPEI particularly relevant under warming climates, where increased temperatures can substantially enhance evaporative demand and intensify moisture deficits [11,14].
Figure 5 presents the ensemble-mean annual occurrence rates of SPEI-based severe-drought conditions during the historical period and under the future SSP245 and SSP585 scenarios. In contrast to the SPI-based results, future projections show a widespread increase in severe-drought occurrence across much of the low- and mid-latitude land area. Particularly high occurrence rates are projected across northern Africa, the Mediterranean region, the Middle East and Central Asia, as well as parts of South America, southern Africa, and Australia. By comparison, occurrence rates remain relatively low across several northern high-latitude regions, including northern Canada, Greenland, and the Russian Far East. The projected increase is more extensive and pronounced at the 3-month timescale than at the 1-month timescale. The SPEI3 results show a broader and more spatially coherent expansion of elevated occurrence across the same hotspot regions, indicating that accumulated 3-month climatic water deficits produce a stronger severe-drought signal than monthly anomalies alone.
Figure 5.
Ensemble-mean annual occurrence rates of SPEI-based severe droughts in historical (1951–2010) and future periods (2041–2100) under SSP245 and SSP585. Severe drought is defined as −2.0 < SPEI ≤ −1.5. Results are shown for the 1- and 3-month accumulation timescales and are expressed in drought-condition months per year (month/year). The ensemble mean was calculated across the 12 model-specific occurrence-rate fields at each grid cell.
At the global scale, the mean annual occurrence rate of SPEI1-based severe-drought conditions increases from 0.644 month/year during the historical period to 0.798 month/year under SSP245 and 0.814 month/year under SSP585. These values correspond to increases of approximately 23.9% and 26.4%, respectively. The increase is substantially greater for SPEI3, for which the global mean rises from 0.632 month/year historically to 0.916 month/year under SSP245 and 0.936 month/year under SSP585, representing increases of approximately 45.0% and 48.2%, respectively.
Figure 6 presents the kernel density distributions of grid-cell changes in the annual occurrence rates of SPEI-based severe-drought conditions, calculated as the future occurrence rate minus the corresponding historical rate. At the 1-month timescale, the distributions under both scenarios are concentrated near zero but extend considerably into the positive range. Positive changes are projected for approximately 54.9% of the analysed land grid cells under SSP245 and 55.4% under SSP585. Thus, slightly more than half of the grid cells show an increase in SPEI1-based severe-drought occurrence, although the concentration of the distributions near zero indicates that the changes remain relatively small across many regions.
Figure 6.
Kernel density distributions of grid-cell changes in the annual occurrence rates (ensemble-mean) of SPEI-based severe-drought conditions under SSP245 and SSP585 relative to the historical period. Changes were calculated as the future ensemble-mean occurrence rate for 2041–2100 minus the historical ensemble-mean occurrence rate for 1951–2010 at each analysed land grid cell.
The increase is substantially more spatially extensive at the 3-month timescale. Approximately 66.9% of land grid cells under SSP245 and 69.5% under SSP585 exhibit higher SPEI3-based severe-drought occurrence rates than during the historical period. Therefore, more than two-thirds of the analysed land grid cells are projected to experience an increase in the annual number of SPEI3 severe-drought months. The slightly higher proportion under SSP585 indicates a broader spatial expansion of increasing severe-drought occurrence under stronger climate forcing.
The wider and more complex distributions for SPEI3 also indicate greater spatial heterogeneity in the magnitude of projected changes. While some regions show little change or localised decreases, many grid cells exhibit moderate to substantial positive changes. Together with the increases in global mean occurrence rates shown in Figure 5, these results demonstrate that the projected intensification of SPEI-based severe-drought conditions is both stronger and more geographically widespread at the 3-month timescale.
Figure 7 presents the ensemble-mean annual occurrence rates of SPEI-based extreme-drought conditions (SPEI ≤ −2.0) during the historical period and under SSP245 and SSP585. During the historical period, extreme-drought occurrence is relatively low and spatially uniform across most land areas. Under future conditions, the spatial pattern broadly follows that identified for SPEI-based severe drought, but the increases are substantially stronger and more extensive in the extreme-drought class. Elevated occurrence expands across many low- and mid-latitude regions, including the major hotspot areas identified in Figure 5, whereas comparatively low rates persist across northern Canada, Greenland, northern Eurasia, and other high-latitude regions. The magnitude and spatial extent of the projected increases are greater under SSP585 and at the 3-month timescale.
Figure 7.
Ensemble-mean annual occurrence rates of SPEI-based extreme droughts in historical (1951–2010) and future periods (2041–2100) under SSP245 and SSP585. Extreme drought is defined as SPEI ≤ −2.0. Results are shown for the 1- and 3-month accumulation timescales and are expressed in drought-condition months per year (month/year). The ensemble mean was calculated across the 12 model-specific occurrence-rate fields at each grid cell.
At the global scale, the mean annual occurrence rate of SPEI1-based extreme-drought conditions increases from 0.231 month/year during the historical period to 0.791 month/year under SSP245 and 1.197 month/year under SSP585. These changes correspond to increases of approximately 242% and 417%, respectively. An even stronger increase is projected at the 3-month timescale: the global mean rises from 0.207 month/year historically to 1.090 month/year under SSP245 and 1.716 month/year under SSP585, representing increases of approximately 426% and 729%, respectively. The stronger response at the 3-month timescale indicates that accumulated climatic water deficits produce a more pronounced extreme-drought signal than monthly anomalies alone.
A notable feature of the projections is the changing balance between the mutually exclusive severe- and extreme-drought classes. Under SSP245, the global mean occurrence rate of SPEI1-based extreme drought reaches 0.791 month/year, nearly matching the corresponding severe-drought rate of 0.798 month/year. Under SSP585, the extreme-drought rate increases to 1.197 month/year, substantially exceeding the severe-drought rate of 0.814 month/year. At the 3-month timescale, extreme-drought occurrence exceeds severe-drought occurrence under both future scenarios, reaching 1.090 versus 0.916 month/year under SSP245 and 1.716 versus 0.936 month/year under SSP585. Because the two drought categories are defined as mutually exclusive classes, these results indicate a pronounced redistribution of threshold-exceeding months toward the extreme-drought category rather than a nested probability inversion.
Figure 8 presents the kernel density distributions of grid-cell changes in annual SPEI-based extreme-drought occurrence rates, calculated as the future rate minus the corresponding historical rate. The distributions are strongly concentrated on the positive side of zero, and exhibit extended positive tails, confirming that increases are both widespread and regionally substantial. For SPEI1, positive changes occur in approximately 89.3% of the analysed land grid cells under SSP245 and 89.1% under SSP585. Although the proportions are similar, the stronger positive tail under SSP585 indicates that the magnitude of increase is greater in many affected regions.
Figure 8.
Kernel density distributions of grid-cell changes in the annual occurrence rates (ensemble-mean) of SPEI-based extreme-drought conditions under SSP245 and SSP585 relative to the historical period. Changes were calculated as the future ensemble-mean occurrence rate for 2041–2100 minus the historical ensemble-mean occurrence rate for 1951–2010 at each analysed land grid cell.
At the 3-month timescale, approximately 89.9% of land grid cells under SSP245 and 92.3% under SSP585 show higher extreme-drought occurrence rates than during the historical period. Thus, more than nine-tenths of the analysed land grid cells are projected to experience an increase in SPEI3-based extreme-drought occurrence under SSP585. Compared with the corresponding severe-drought results, for which positive changes occur across approximately 54.9–69.5% of grid cells, the increase in extreme-drought occurrence is substantially more spatially extensive. Together, the spatial maps and distributional changes demonstrate a widespread shift toward more frequent extreme climatic water-deficit conditions, particularly at the 3-month timescale and under SSP585.
3.3. Concurrent SPI-SPEI Drought Occurrence
A concurrent severe-drought month was identified when SPI and SPEI simultaneously satisfied the severe-drought criterion at the same grid cell, timescale, and calendar month. Figure 9 presents the ensemble-mean annual occurrence rates of concurrent SPI-SPEI severe-drought conditions during the historical and future periods. Historical occurrence rates are relatively uniform across much of the global land area. Under both future scenarios, concurrent severe-drought occurrence decreases across most regions, with the reduction becoming stronger under SSP585 and at the 3-month timescale. The decreases are particularly widespread across northern mid- and high-latitude regions, whereas only localised areas retain historical levels or show limited increases. Overall, the future spatial pattern is dominated by a broad reduction in concurrent severe-drought occurrence.
Figure 9.
Ensemble-mean annual occurrence rates of concurrent SPI-SPEI severe droughts in historical (1951–2010) and future periods (2041–2100) under SSP245 and SSP585. Severe drought is defined as −2.0 < SPI ∩ SPEI ≤ −1.5. Results are shown for the 1- and 3-month accumulation timescales and are expressed in drought-condition months per year (month/year). The ensemble mean was calculated across the 12 model-specific occurrence-rate fields at each grid cell.
At the global scale, the mean annual occurrence rate of concurrent SPI1–SPEI1 severe-drought conditions decreases from 0.309 month/year during the historical period to 0.232 month/year under SSP245 and 0.198 month/year under SSP585. These values correspond to reductions of approximately 25.0% and 35.9%, respectively. A stronger decline is projected at the 3-month timescale, with the global mean decreasing from 0.303 month/year historically to 0.189 month/year under SSP245 and month/year under SSP585, representing reductions of approximately 37.5% and 49.9%, respectively. The lower concurrent occurrence rates relative to the individual SPI- and SPEI-based rates reflect the more restrictive requirement that both indicators simultaneously satisfy the same severity criterion.
Figure 10 further shows the kernel density distributions of grid-cell changes in concurrent severe-drought occurrence rates, calculated as the future rate minus the corresponding historical rate. The distributions are concentrated predominantly below zero, confirming that decreases are geographically more widespread than increases. For the 1-month timescale, positive changes occur in only approximately 21.7% of the analysed land grid cells under SSP245 and 16.3% under SSP585. At the 3-month timescale, the corresponding proportions decline to approximately 18.2% and 11.8%, respectively. Thus, under SSP585, fewer than one in eight land grid cells exhibit an increase in concurrent SPI3-SPEI3 severe-drought occurrence.
Figure 10.
Kernel density distributions of grid-cell changes in the annual occurrence rates (ensemble-mean) of concurrent SPI-SPEI severe-drought conditions under SSP245 and SSP585 relative to the historical period. Changes were calculated as the future ensemble-mean occurrence rate for 2041–2100 minus the historical ensemble-mean occurrence rate for 1951–2010 at each analysed land grid cell.
Figure 11 presents the ensemble-mean annual occurrence rates of concurrent SPI-SPEI extreme-drought conditions, defined as months in which both indices simultaneously satisfy the extreme-drought criterion at the same grid cell and timescale. Historical occurrence rates are relatively low across most global land areas. In contrast to the widespread decrease in concurrent severe-drought occurrence, concurrent extreme-drought occurrence increases across many low- and mid-latitude regions under both future scenarios. The strongest increases are concentrated in parts of South America, particularly the Amazon basin, the Mediterranean region, southern Africa, and Australia. These increases become stronger and more spatially coherent under SSP585 and at the 3-month timescale, whereas occurrence remains comparatively low across many northern high-latitude regions.
Figure 11.
Ensemble-mean annual occurrence rates of concurrent SPI-SPEI extreme droughts in historical (1951–2010) and future periods (2041–2100) under SSP245 and SSP585. Extreme drought is defined as SPI ∩ SPEI ≤ −2.0. Results are shown for the 1- and 3-month accumulation timescales and are expressed in drought-condition months per year (month/year). The ensemble mean was calculated across the 12 model-specific occurrence-rate fields at each grid cell.
At the global scale, the mean annual occurrence rate of concurrent SPI1-SPEI1 extreme-drought conditions increases from 0.129 month/year during the historical period to 0.227 month/year under SSP245 and 0.297 month/year under SSP585. These changes represent increases of approximately 75.3% and 129.4%, respectively. An even stronger increase is projected at the 3-month timescale, for which the global mean rises from 0.127 month/year historically to 0.259 month/year under SSP245 and 0.383 month/year under SSP585, corresponding to increases of approximately 104.7% and 202.1%, respectively. The stronger response at the 3-month timescale indicates that concurrent extreme climatic water deficits become more pronounced when anomalies are accumulated over a longer period.
These changes contrast sharply with the projected decline in concurrent severe-drought occurrence and reveal a clear shift in the relative balance between the severe- and extreme-drought classes. During the historical period, concurrent severe-drought occurrence was substantially higher than concurrent extreme-drought occurrence at both timescales, reaching 0.309 versus 0.129 month/year for the 1-month indices and 0.303 versus 0.127 month/year for the 3-month indices. At the 1-month timescale, the two classes become nearly equally frequent under SSP245, with occurrence rates of 0.232 and 0.227 month/year for severe and extreme droughts, respectively. Under SSP585, this balance reverses, with the extreme-drought rate increasing to 0.297 month/year, compared with only 0.198 month/year for severe droughts.
The shift is even more pronounced at the 3-month timescale. Although severe-drought occurrence was more than twice as high as extreme-drought occurrence during the historical period, the extreme-drought rate exceeds the severe-drought rate under both future scenarios, reaching 0.259 versus 0.189 month/year under SSP245 and 0.383 versus 0.152 month/year under SSP585. This progression from severe-drought dominance during the historical period to near parity or extreme-drought dominance under future conditions indicates a substantial redistribution of concurrent drought months toward the extreme severity class, particularly at the 3-month timescale and under SSP585.
Figure 12 further presents the kernel density distributions of grid-cell changes in concurrent extreme-drought occurrence rates, calculated as the future rate minus the corresponding historical rate. The distributions are predominantly located on the positive side of zero, and exhibit extended positive tails, indicating that increases are widespread but vary considerably in magnitude among regions. For the 1-month indices, positive changes occur in approximately 77.2% of the analysed land grid cells under SSP245 and 73.0% under SSP585. Although the proportion is slightly lower under SSP585, its larger global mean and extended positive tail indicate that increases tend to be more pronounced in the affected regions.
Figure 12.
Kernel density distributions of grid-cell changes in the annual occurrence rates (ensemble-mean) of concurrent SPI-SPEI extreme-drought conditions under SSP245 and SSP585 relative to the historical period. Changes were calculated as the future ensemble-mean occurrence rate for 2041–2100 minus the historical ensemble-mean occurrence rate for 1951–2010 at each analysed land grid cell.
At the 3-month timescale, approximately 70.1% of land grid cells under SSP245 and 70.9% under SSP585 show higher concurrent extreme-drought occurrence rates than during the historical period. These proportions contrast with those for concurrent severe drought, for which positive changes occur in only approximately 11.8–21.7% of grid cells. The simultaneous decrease in severe-class occurrence and increase in extreme-class occurrence indicates a substantial redistribution of concurrent drought months toward the extreme severity class, particularly under SSP585 and at the 3-month timescale. However, because individual drought events were not tracked through time, this result should not be interpreted as direct evidence that specific severe-drought events transition into extreme events.
In summary, the observed shift in patterns of concurrent drought-month occurrence for SPI- and SPEI-based severe and extreme drought months suggests that future climate change will alter the proportion of drought months falling into each severity grade, with a greater share shifting toward the extreme drought category. This pattern is consistent with the combined influence of rising temperatures, enhanced evapotranspiration, and evolving precipitation patterns under global warming. With the increase in temperatures, evapotranspiration rates are anticipated to rise, worsening water scarcity and generating more months classified as severe or extreme drought. Concurrently, altered precipitation patterns may reduce rainfall across numerous regions and further shrink available water supplies. Furthermore, these climatic changes will raise the proportion of extreme drought months at the cost of severe drought months. This projected shift in drought severity distribution highlights the critical need to develop adaptive strategies and resilience planning to mitigate the impacts of more frequent extreme drought months on ecosystems, water resources, agriculture, and human communities.
4. Discussion
4.1. Physical Interpretation and Comparison with Previous Studies
The marked contrast between the SPI- and SPEI-based projections is consistent with previous evidence that the inclusion of potential evapotranspiration can substantially alter the diagnosed drought response under climate warming. Nwayor and Robeson [18] found that large parts of the global land surface exhibited contrasting SPI and SPEI trends during 1971–2022, while Bhardwaj et al. [19] reported a substantially larger spatial extent of increasing drought severity based on SPEI than on SPI under higher levels of global warming. Global CMIP6 assessments have similarly shown that drought indicators incorporating atmospheric evaporative demand generally produce stronger and more spatially extensive future drying signals than precipitation-only indicators [16,19]. The present results extend these findings by showing that indicator choice affects not only the magnitude and spatial extent of projected drought occurrence, but also the relative balance between severe- and extreme-drought classes. In particular, the strong increase in SPEI-based extreme-drought occurrence, especially at the 3-month timescale under SSP585, indicates that a decline in severe-class occurrence should not be interpreted as an overall weakening of future drought conditions.
The principal hotspot regions identified in this study are also broadly consistent with previous CMIP6-based assessments. Cook et al. [20] reported robust future drying and increasing extreme-drought occurrence across regions including the Mediterranean, the Amazon, southern Africa, and Australia, while Ukkola et al. [21] identified particularly robust meteorological drought changes across the Mediterranean, Central and South America, southern and western Africa, and southern Australia. The recurrent appearance of these regions in the present SPI-, SPEI-, and concurrent-drought results therefore supports their identification as important areas of future drought intensification. In the Mediterranean region, the combined effects of projected precipitation reductions and regional warming may reinforce climatic water deficits. In southern Africa and Australia, extensive water-limited environments may be particularly sensitive to reduced precipitation and increasing atmospheric evaporative demand. For the Amazon, CMIP6 studies indicate considerable spatial and inter-model uncertainty, although stronger agreement has been reported for future rainfall reductions in eastern and southern Amazonia.
The substantially broader increases obtained using SPEI than SPI suggest that precipitation changes alone do not fully explain the projected patterns. Because SPEI incorporates PET, increasing atmospheric evaporative demand can intensify the climatic water deficit even where projected precipitation changes are comparatively moderate. Nevertheless, this difference should not be interpreted as a formal attribution of drought change to temperature or PET, because precipitation, PET, circulation, and land-surface feedbacks were not separately decomposed in the present study. Similarly, the concurrent SPI-SPEI results represent agreement between two related climatic drought indicators rather than a compound hazard composed of independent drivers. The regional mechanisms discussed above should therefore be regarded as literature-supported physical interpretations, while dedicated attribution analyses remain necessary to quantify the relative contribution of individual climatic drivers.
4.2. Uncertainties in Drought Occurrence from Ensemble Climate Projections
Uncertainty arising from differences among the 12 GCMs was evaluated using the 5th and 95th quantiles of the projected annual drought-month occurrence rates at each grid cell. These two quantiles characterise the lower and upper bounds of the central 90% of the model ensemble and are expressed in drought-condition months (month/year). The global values discussed below represent the spatial means of the grid-cell quantile fields rather than formal confidence intervals. Accordingly, they are used to evaluate the robustness of the direction of projected change and the inter-model uncertainty in its magnitude.
Figures S1–S4 illustrate the inter-model uncertainty in SPI-based drought occurrence using the 5th and 95th ensemble quantiles. For severe drought, the lower-quantile global means decrease under both future scenarios, from 0.408 to 0.297–0.285 month/year for SPI1 and from 0.430 to approximately 0.261 month/year for SPI3. In contrast, the upper-quantile estimates remain close to the historical level or increase slightly, particularly for SPI3 under SSP585, where the global mean reaches 0.674 month/year. This contrast indicates that the projected decline in SPI-based severe-drought occurrence is not uniform across the GCM ensemble.
Uncertainty is more pronounced for SPI-based extreme drought. Although the lower-quantile global means show slight decreases relative to the historical period, the upper-quantile estimates increase substantially, reaching 0.613 month/year for SPI1 and 0.799 month/year for SPI3 under SSP585. The 5th–95th quantile spread therefore widens markedly from the historical to future periods, particularly for SPI3 extreme drought, increasing from 0.151 month/year historically to 0.407 month/year under SSP245 and 0.625 month/year under SSP585. Spatially, the upper-quantile projections show broader and stronger increases across the Mediterranean region, South America, southern Africa, and Australia than the lower-quantile projections. These results suggest that both the magnitude and, in some regions, the direction of future SPI-based drought changes remain sensitive to the selected climate model, with uncertainty generally increasing under stronger forcing and at the 3-month timescale.
Figures S5–S8 show the inter-model uncertainty in SPEI-based drought occurrence using the 5th and 95th ensemble quantiles. In contrast to the mixed responses obtained from SPI, both quantiles indicate increasing SPEI-based severe-drought occurrence under future conditions. For SPEI1, the lower-quantile global mean increases from 0.554 month/year historically to 0.595 and 0.597 month/year under SSP245 and SSP585, respectively, while the upper-quantile mean rises from 0.734 to 1.015 and 1.049 month/year. The increase is stronger for SPEI3, with the lower quantile rising from 0.546 to 0.630–0.637 month/year, and the upper quantile increasing from 0.717 to 1.219–1.261 month/year. Spatially, elevated future occurrence is consistently identified across northern Africa, the Mediterranean region, the Middle East and Central Asia, South America, southern Africa, and Australia, although the affected areas are substantially broader under the upper-quantile projections.
The increase is more pronounced for SPEI-based extreme drought. Even the lower-quantile global means rise markedly, from 0.182 to 0.437 and 0.675 month/year for SPEI1 and from 0.158 to 0.552 and 0.948 month/year for SPEI3 under SSP245 and SSP585, respectively. The corresponding upper-quantile estimates reach 1.248 and 1.827 month/year for SPEI1 and 1.779 and 2.645 month/year for SPEI3. Consequently, the 5th–95th quantile spread for SPEI3 extreme drought expands from only 0.098 month/year historically to 1.227 month/year under SSP245 and 1.697 month/year under SSP585. These results indicate that the direction of increasing SPEI-based drought occurrence is more consistent across the GCM ensemble than for SPI, even though the magnitude of the increase—particularly for extreme drought at the 3-month timescale—remains highly uncertain.
Figures S9–S12 show the inter-model uncertainty in concurrent SPI-SPEI drought occurrence using the 5th and 95th ensemble quantiles. For concurrent severe drought, both quantiles indicate decreases under future conditions. At the 1-month timescale, the lower-quantile global mean decreases from 0.231 month/year historically to 0.139 and 0.108 month/year under SSP245 and SSP585, respectively, while the upper-quantile mean declines from 0.389 to 0.336 and 0.303 month/year. The reduction is stronger at the 3-month timescale, with the lower quantile decreasing from 0.230 to 0.093–0.064 month/year and the upper quantile declining from 0.378 to 0.308–0.269 month/year. The consistent direction of change at both ensemble bounds suggests that the projected reduction in concurrent severe-drought occurrence is relatively robust, although the magnitude varies among models.
An opposite pattern is evident for concurrent extreme drought. Both quantiles increase under all future scenarios and timescales. For the 1-month indices, the lower-quantile mean increases from 0.087 month/year historically to 0.119 and 0.141 month/year, while the upper-quantile mean rises from 0.173 to 0.363 and 0.506 month/year. At the 3-month timescale, the corresponding lower-quantile values increase from 0.086 to 0.110 and 0.148 month/year, whereas the upper-quantile values reach 0.464 and 0.719 month/year. Spatially, the strongest increases are concentrated in the Amazon basin and other parts of South America, the Mediterranean region, southern Africa, and parts of Australia, with broader and stronger signals in the upper-quantile projections. The 5th–95th spread for concurrent SPI3-SPEI3 extreme drought expands from 0.085 month/year historically to 0.354 month/year under SSP245 and 0.570 month/year under SSP585, indicating substantial uncertainty in the magnitude of intensification. Nevertheless, the simultaneous decline in severe-class occurrence and increase in extreme-class occurrence at both ensemble bounds supports a relatively consistent redistribution of concurrent drought months toward the extreme severity class, rather than a direct transition of individual severe drought events into extreme events.
4.3. Inter-Model Agreement on the Direction of Projected Drought-Occurrence Change
Directional agreement was evaluated as the percentage of valid paired GCMs for which the model-specific future-minus-historical change had the same sign as the corresponding paired ensemble-mean change. Only grid cells with at least nine valid historical–future model pairs were retained. Overall, directional agreement was moderate to high across much of the global land area, but substantial spatial heterogeneity remained (Figures S13–S18).
Clear differences were evident among the drought indicators. SPEI-based projections generally showed the most spatially extensive high directional agreement, particularly for extreme drought (Figure S16) across most global areas. This indicates that the projected direction of SPEI-based drought-occurrence change is supported by a relatively large proportion of the valid GCM ensemble across these regions. Nevertheless, agreement remained lower in parts of high-latitude North America and Eurasia, equatorial Africa, and South and Southeast Asia, showing that the SPEI response was not spatially uniform.
SPI-based projections exhibited greater regional heterogeneity (Figures S13 and S14). High agreement was evident across much of South America, southern Africa, parts of North America, Europe, and the Mediterranean region, but lower values were more common across northern and equatorial Africa and many parts of Asia. The spatial contrast was particularly evident for extreme drought, for which neighbouring regions could exhibit substantially different levels of agreement. Concurrent SPI-SPEI drought occurrence generally displayed agreement patterns intermediate between the individual SPI and SPEI results (Figures S17 and S18). For concurrent severe drought, high agreement was particularly evident across northern mid- and high-latitude regions and parts of the Americas, whereas lower agreement occurred across several regions, including South America, northern and southern Africa, western Asia and the Middle East. However, concurrent extreme drought showed more spatially extensive high agreement, especially across South America, Europe, the Mediterranean region, southern Africa, and parts of western and central Asia.
The effects of accumulation timescale and forcing scenario were less uniform. Agreement at the 3-month timescale was often more spatially coherent than at the 1-month timescale, particularly for SPI-based and concurrent drought occurrence. However, this tendency did not apply consistently across tropical Africa, South Asia and Southeast Asia for SPEI-based drought occurrence. Similarly, SSP245 and SSP585 generally produced comparable broad-scale agreement patterns. SSP585 locally expanded areas of high agreement, particularly for some 3-month projections, but the differences between the two scenarios were generally smaller than the contrasts among SPI, SPEI, concurrent drought occurrence, and the two accumulation timescales.
The directional-agreement analysis provides information complementary to the 5th–95th ensemble-quantile ranges discussed in Section 4.2. The quantile spread characterises inter-model uncertainty in the magnitude of projected annual drought-month occurrence rates, whereas directional agreement evaluates whether the individual GCMs consistently support the sign of the ensemble-mean change. Regions with high directional agreement but broad quantile ranges therefore indicate that the models largely agree on whether drought occurrence will increase or decrease, while remaining uncertain about the magnitude of that change. By contrast, regions with both broad ensemble spreads and low directional agreement represent areas where both the magnitude and the sign of the projected response remain model dependent.
The generally higher agreement for SPEI than for SPI is consistent with a more spatially coherent response to the temperature-related increase in atmospheric evaporative demand than to regional precipitation changes alone. SPI projections depend directly on changes in precipitation, which remain comparatively heterogeneous across the GCM ensemble. Concurrent SPI-SPEI drought occurrence incorporates uncertainties associated with both precipitation and atmospheric evaporative demand and consequently displays less spatially uniform agreement in several regions. Importantly, high directional agreement does not imply close agreement in the magnitude of projected change. Conversely, low agreement indicates that the ensemble-mean direction may be supported by only a limited proportion of the valid models, potentially because a smaller number of GCMs project changes of comparatively large magnitude.
5. Implications for Drought Monitoring and Climate Adaptation
The projected spatial patterns of drought occurrence provide a basis for prioritising regional drought monitoring and further climate-impact assessment. The Mediterranean region, the Amazon and other parts of South America, southern Africa and Australia consistently emerge as areas of increasing extreme-drought occurrence, particularly in the SPEI-based and concurrent SPI-SPEI results. Regions showing both large projected increases and high directional agreement among the GCMs may warrant particular attention in drought preparedness, early-warning development, climate-service provision, and long-term water-resource assessment. Conversely, regions characterised by broad ensemble spreads and low directional agreement require more cautious interpretation and additional regional evaluation before the results are used to support adaptation decisions.
The contrasting responses of SPI and SPEI also demonstrate that precipitation-based indicators alone may provide an incomplete representation of future drought conditions. While SPI-based severe-drought occurrence generally decreases, SPEI-based severe- and extreme-drought occurrence increases across many regions, reflecting the additional sensitivity of the climatic water balance to reference evapotranspiration and atmospheric evaporative demand. Similarly, the decline in concurrent severe-drought occurrence should not be interpreted as an overall reduction in drought conditions, because concurrent extreme-drought occurrence increases substantially, particularly at the 3-month timescale under SSP585. Operational monitoring systems may therefore benefit from reporting SPI, SPEI, and concurrent SPI-SPEI conditions together. Such a multi-indicator approach can help identify where drought diagnoses are primarily precipitation driven, where they are strongly influenced by atmospheric evaporative demand, and where both indicators support the same severity classification.
The projected increases in SPEI-based drought-month occurrence should not, however, be interpreted as evidence that the entire land surface will experience continuous drying or equivalent increases in drought duration and cumulative water deficit. SPEI identifies standardised anomalies in the climatic water balance relative to the historical reference climatology. More frequent threshold crossings may therefore reflect changes in the timing, seasonality, and regional distribution of precipitation and atmospheric evaporative demand. The present analysis does not quantify changes in total water availability, terrestrial water storage, streamflow, soil moisture, groundwater, or actual evapotranspiration. Accordingly, the projected occurrence rates should be used as broad-scale screening information to identify emerging drought hotspots and indicator-sensitive regions, rather than as direct prescriptions for local water allocation, irrigation scheduling, or ecosystem management.
6. Conclusions
This study assessed projected changes in short-term severe- and extreme-drought occurrence at the 1- and 3-month accumulation timescales using SPI, SPEI, and concurrent SPI-SPEI conditions derived from 12 CMIP6 GCMs under SSP245 and SSP585. By applying consistent severity thresholds and a fixed historical reference period, the analysis compared how precipitation-only and climatic-water-balance indicators diagnose the direction, magnitude, and spatial extent of future drought-occurrence changes.
The results show a clear contrast between SPI and SPEI. SPI-based severe-drought occurrence generally decreases, whereas SPI-based extreme-drought occurrence increases over substantial parts of the global land area, particularly at the 3-month timescale under SSP585. SPEI produces a much stronger and more spatially extensive increase in both severe- and extreme-drought occurrence. The largest increases are concentrated in the Mediterranean region, the Amazon and other parts of South America, southern Africa, western and central Asia, and Australia. For SPEI3-based extreme drought, the global mean annual occurrence rate increases from 0.207 month/year historically to 1.716 months/year under SSP585, with approximately 92% of analysed land grid cells showing an increase.
Concurrent SPI-SPEI results indicate a changing balance between the mutually exclusive severity classes. Concurrent severe-drought occurrence decreases, whereas concurrent extreme-drought occurrence increases across approximately 70–77% of analysed land grid cells. This pattern represents an aggregate redistribution of concurrent drought months toward the extreme severity class; it does not demonstrate that individual severe-drought events transition directly into extreme events.
The ensemble analysis further shows that uncertainty in magnitude and consistency in direction provide complementary information. SPEI-based increases are generally supported across both lower and upper ensemble quantiles, although the spread of projected magnitudes expands under future scenarios. Concurrent severe and extreme droughts display relatively consistent decreases and increases, respectively, while SPI-based changes are more spatially heterogeneous and model dependent. Accordingly, this study’s core contribution lies in a unified global synthesis of indicator discrepancies, severity redistribution, ensemble magnitude uncertainty, and inter-model directional agreement.
Nevertheless, the results remain conditional on the selected GCM ensemble, SSP scenarios, fixed historical reference period, reference-evapotranspiration estimates, spatial resolution, and index-distribution assumptions. First, the ensemble quantiles characterise inter-model spread rather than formal probabilistic confidence limits. Second, this work quantifies monthly meteorological drought occurrence exclusively, without evaluating drought duration, cumulative water deficit, or hydrological, ecological and sectoral drought impacts. Third, SPI and SPEI both rely on precipitation inputs; their concurrent occurrence merely signals consistency between two correlated meteorological drought indicators rather than an independent compound hazard, so the respective roles of precipitation deficits and atmospheric evaporative demand cannot be disentangled here. Future research should examine longer accumulation timescales, alternative reference-evapotranspiration formulations, explicit attribution of the projected changes, and integration with impact-relevant variables such as soil moisture, streamflow, groundwater storage, and vegetation stress.
Supplementary Materials
The following supporting information can be downloaded at: https://www.mdpi.com/article/10.3390/hydrology13070187/s1, Figures S1–S12: Spatial distribution of the 5th and 95th ensemble quantile of the annual drought month occurrence rate for SPI-based, SPEI-based, and concurrent SPI-SPEI drought conditions; Figures S13–S18: Spatial distributions of inter-model directional agreement for projected changes in SPI, SPEI and concurrent SPI-SPEI severe and extreme-drought occurrence.
Author Contributions
A.Y.: Conceptualisation, Methodology, Formal Analysis, Visualisation, Writing—Original Draft, Validation, Funding acquisition; J.G. and Y.S.: Software, Visualisation, Writing—Review and Editing; Y.F.: Conceptualisation, Investigation, Formal Analysis, Validation; X.W.: Formal Analysis, Resources, Visualisation. All authors have read and agreed to the published version of the manuscript.
Funding
This research was supported by the projects of the Fujian Provincial Department of Science and Technology (2025I0052), and the projects of the Fujian Provincial Department of Finance (2025119-03).
Data Availability Statement
The CMIP6 simulated precipitation data used in this study are available from the Earth System Grid Federation (ESGF) Archive, https://esgf.llnl.gov/ (accessed on 20 February 2024). The potential evapotranspiration data derived from CMIP6 projections are available at https://zenodo.org/records/7789759 (accessed on 20 February 2024).
Conflicts of Interest
The authors declare no conflicts of interest.
References
- Lund, J.; Medellin-Azuara, J.; Durand, J.; Stone, K. Lessons from California’s 2012–2016 drought. J. Water Resour. Plan. Manag. 2018, 144, 04018067. [Google Scholar] [CrossRef] [Scilit]
- Tortajada, C.; Kastner, M.J.; Buurman, J.; Biswas, A.K. The California drought: Coping responses and resilience building. Environ. Sci. Policy 2017, 78, 97–113. [Google Scholar] [CrossRef] [Scilit]
- Arpe, K.; Leroy, S.; Lahijani, H.; Khan, V. Impact of the European Russia drought in 2010 on the Caspian Sea level. Hydrol. Earth Syst. Sci. 2012, 16, 19–27. [Google Scholar] [CrossRef] [Scilit]
- Niggli, L.; Huggel, C.; Muccione, V.; Neukom, R.; Salzmann, N. Towards improved understanding of cascading and interconnected risks from concurrent weather extremes: Analysis of historical heat and drought extreme events. PLoS Clim. 2022, 1, e0000057. [Google Scholar] [CrossRef] [Scilit]
- AghaKouchak, A. A multivariate approach for persistence-based drought prediction: Application to the 2010–2011 East Africa drought. J. Hydrol. 2015, 526, 127–135. [Google Scholar] [CrossRef] [Scilit]
- Haile, G.G.; Tang, Q.; Hosseini-Moghari, S.M.; Liu, X.; Gebremicael, T.; Leng, G.; Kebede, A.; Xu, X.; Yun, X. Projected impacts of climate change on drought patterns over East Africa. Earth Future 2020, 8, e2020EF001502. [Google Scholar] [CrossRef] [Scilit]
- Wang, X.; Lan, L.; Xing, X.; Yang, W.; Zhu, H.; Ding, R. Extreme weather events and early childhood growth in low-and middle-income regions: A systematic review and meta-analysis. Environ. Res. 2025, 286, 122876. [Google Scholar] [CrossRef] [Scilit] [PubMed]
- Sheffield, J.; Wood, E.F. Global trends and variability in soil moisture and drought characteristics, 1950–2000, from observation-driven simulations of the terrestrial hydrologic cycle. J. Clim. 2008, 21, 432–458. [Google Scholar] [CrossRef] [Scilit]
- Dai, A. Drought under global warming: A review. Wiley Interdiscip. Rev. Clim. Change 2011, 2, 45–65. [Google Scholar]
- McKee, T.B.; Doesken, N.J.; Kleist, J. The relationship of drought frequency and duration to time scales. In Proceedings of the 8th Conference on Applied Climatology, Anaheim, CA, USA, 17–22 January 1993; pp. 179–183. [Google Scholar]
- Vicente-Serrano, S.M.; Beguería, S.; López-Moreno, J.I. A multiscalar drought index sensitive to global warming: The standardized precipitation evapotranspiration index. J. Clim. 2010, 23, 1696–1718. [Google Scholar] [CrossRef] [Scilit]
- Li, L.; She, D.; Zheng, H.; Lin, P.; Yang, Z.-L. Elucidating diverse drought characteristics from two meteorological drought indices (SPI and SPEI) in China. J. Hydrometeorol. 2020, 21, 1513–1530. [Google Scholar] [CrossRef] [Scilit]
- Li, S.-Y.; Miao, L.-J.; Jiang, Z.-H.; Wang, G.-J.; Gnyawali, K.R.; Zhang, J.; Zhang, H.; Fang, K.; He, Y.; Li, C. Projected drought conditions in Northwest China with CMIP6 models under combined SSPs and RCPs for 2015–2099. Adv. Clim. Change Res. 2020, 11, 210–217. [Google Scholar] [CrossRef] [Scilit]
- Trenberth, K.E.; Dai, A.; Van Der Schrier, G.; Jones, P.D.; Barichivich, J.; Briffa, K.R.; Sheffield, J. Global warming and changes in drought. Nat. Clim. Change 2014, 4, 17–22. [Google Scholar] [CrossRef] [Scilit]
- Su, B.; Huang, J.; Mondal, S.K.; Zhai, J.; Wang, Y.; Wen, S.; Gao, M.; Lv, Y.; Jiang, S.; Jiang, T. Insight from CMIP6 SSP-RCP scenarios for future drought characteristics in China. Atmos. Res. 2021, 250, 105375. [Google Scholar] [CrossRef] [Scilit]
- Wang, T.; Tu, X.; Singh, V.P.; Chen, X.; Lin, K. Global data assessment and analysis of drought characteristics based on CMIP6. J. Hydrol. 2021, 596, 126091. [Google Scholar] [CrossRef] [Scilit]
- Zhao, F.; Wu, Y.; Yin, X.; Sun, K.; Ma, S.; Zhang, S.; Liu, S.; Wang, W.; Chen, J. Projected changes in population exposure to drought in China under CMIP6 forcing scenarios. Atmos. Environ. 2022, 282, 119162. [Google Scholar] [CrossRef] [Scilit]
- Nwayor, I.J.; Robeson, S.M. Exploring the relationship between SPI and SPEI in a warming world. Theor. Appl. Climatol. 2024, 155, 2559–2569. [Google Scholar]
- Bhardwaj, K.; Mishra, A.; Khedun, C.P. Global droughts in a warming climate: Evaluation of SPI and SPEI under 1.5°, 2°, and 3 °C global warming. J. Hydrol. 2025, 659, 133309. [Google Scholar] [CrossRef] [Scilit]
- Cook, B.I.; Mankin, J.S.; Marvel, K.; Williams, A.P.; Smerdon, J.E.; Anchukaitis, K.J. Twenty-first century drought projections in the CMIP6 forcing scenarios. Earth Future 2020, 8, e2019EF001461. [Google Scholar] [CrossRef] [Scilit]
- Ukkola, A.M.; De Kauwe, M.G.; Roderick, M.L.; Abramowitz, G.; Pitman, A.J. Robust future changes in meteorological drought in CMIP6 projections despite uncertainty in precipitation. Geophys. Res. Lett. 2020, 46, e2020GL087820. [Google Scholar] [CrossRef] [Scilit]
- Peña-Angulo, D.; Vicente-Serrano, S.; Domínguez-Castro, F.; Reig-Gracia, F.; El Kenawy, A. The potential of using climate indices as powerful tools to explain mortality anomalies: An application to mainland Spain. Environ. Res. 2021, 197, 111203. [Google Scholar] [CrossRef] [Scilit] [PubMed]
- Eyring, V.; Righi, M.; Lauer, A.; Evaldsson, M.; Wenzel, S.; Jones, C.; Anav, A.; Andrews, O.; Cionni, I.; Davin, E.L. ESMValTool (v1.0)—A community diagnostic and performance metrics tool for routine evaluation of Earth system models in CMIP. Geosci. Model Dev. 2016, 9, 1747–1802. [Google Scholar] [CrossRef] [Scilit]
- Cherchi, A.; Fogli, P.G.; Lovato, T.; Peano, D.; Iovino, D.; Gualdi, S.; Masina, S.; Scoccimarro, E.; Materia, S.; Bellucci, A. Global mean climate and main patterns of variability in the CMCC-CM2 coupled model. J. Adv. Model. Earth Syst. 2019, 11, 185–209. [Google Scholar] [CrossRef] [Scilit]
- Luo, N.; Guo, Y.; Chou, J.; Gao, Z. Added value of CMIP6 models over CMIP5 models in simulating the climatological precipitation extremes in China. Int. J. Clim. 2022, 42, 1148–1164. [Google Scholar]
- Rashid, H.A.; Sullivan, A.; Dix, M.; Bi, D.; Mackallah, C.; Ziehn, T.; Dobrohotoff, P.; O’Farrell, S.; Harman, I.N.; Bodman, R. Evaluation of climate variability and change in ACCESS historical simulations for CMIP6. J. South. Hemisph. Earth Syst. Sci. 2022, 72, 73–92. [Google Scholar] [CrossRef] [Scilit]
- Song, S.; Yan, X. Evaluation of events of extreme temperature change between neighboring days in CMIP6 models over China. Theor. Appl. Climatol. 2022, 150, 53–72. [Google Scholar] [CrossRef] [Scilit]
- Pimonsree, S.; Kamworapan, S.; Gheewala, S.H.; Thongbhakdi, A.; Prueksakorn, K. Evaluation of CMIP6 GCMs performance to simulate precipitation over Southeast Asia. Atmos. Res. 2023, 282, 106522. [Google Scholar] [CrossRef] [Scilit]
- Suthinkumar, P.; Varikoden, H.; Babu, C. Assessment of extreme rainfall events over the Indian subcontinent during the historical and future projection periods based on CMIP6 simulations. Int. J. Climatol. 2024, 44, 39–58. [Google Scholar]
- O’Neill, B.; Tebaldi, C.; Vuuren, D.; Eyring, V.; Friedlingstein, P.; Hurtt, G.; Knutti, R.; Kriegler, E.; Lamarque, J.-F.; Lowe, J.; et al. The Scenario Model Intercomparison Project (ScenarioMIP) for CMIP6. Geosci. Model Dev. 2016, 9, 3461–3482. [Google Scholar] [CrossRef] [Scilit]
- Bjarke, N.; Barsugli, J.; Livneh, B. CMIP6 Derived Ensemble of Global Vapor Pressure Deficit, Potential Evapotranspiration, and Reference Evapotranspiration; University of Colorado Boulder: Boulder, CO, USA, 2022. [Google Scholar]
- Bjarke, N.; Barsugli, J.; Livneh, B. Ensemble of CMIP6 derived reference and potential evapotranspiration with radiative and advective components. Sci. Data 2023, 10, 417. [Google Scholar] [CrossRef] [Scilit] [PubMed]
- Sraj, M.; Bezak, N.; Brilly, M. Bivariate flood frequency analysis using the copula function: A case study of the Litija station on the Sava River. Hydrol. Process. 2015, 29, 225–238. [Google Scholar]
- Zou, L.; Xia, J.; She, D. Analysis of impacts of climate change and human activities on hydrological drought: A case study in the Wei River Basin, China. Water Resour. Manag. 2018, 32, 1421–1438. [Google Scholar]
- Shao, Q. Maximum likelihood estimation for generalised logistic distributions. Commun. Stat.-Theory Methods 2002, 31, 1687–1700. [Google Scholar] [CrossRef] [Scilit]
- Chang, J.; Li, Y.; Wang, Y.; Yuan, M. Copula-based drought risk assessment combined with an integrated index in the Wei River Basin, China. J. Hydrol. 2016, 540, 824–834. [Google Scholar] [CrossRef] [Scilit]
- Liu, C.; Yang, C.; Yang, Q.; Wang, J. Spatiotemporal drought analysis by the standardized precipitation index (SPI) and standardized precipitation evapotranspiration index (SPEI) in Sichuan Province, China. Sci. Rep. 2021, 11, 1280. [Google Scholar] [CrossRef] [Scilit] [PubMed]
- Wen, Y.; Fei, Y.; Fan, Y.; Yang, A.; Wang, B.; Gao, P.; Scott, D. Development of a probabilistic agricultural drought forecasting (PADF) framework under climate change. Agric. For. Meteorol. 2024, 350, 109965. [Google Scholar] [CrossRef] [Scilit]
- Wen, Y.; Yang, A.; Fan, Y.; Wang, B.; Scott, D. Stepwise cluster ensemble downscaling for drought projection under climate change. Int. J. Climatol. 2023, 43, 2318–2338. [Google Scholar] [CrossRef] [Scilit]
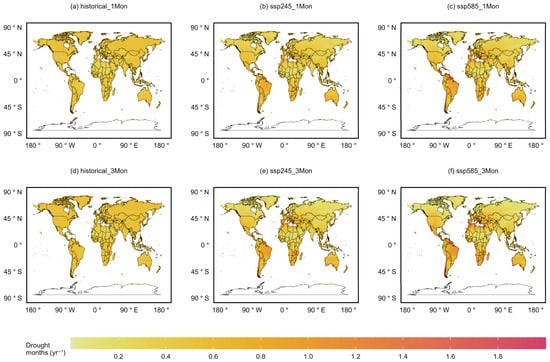
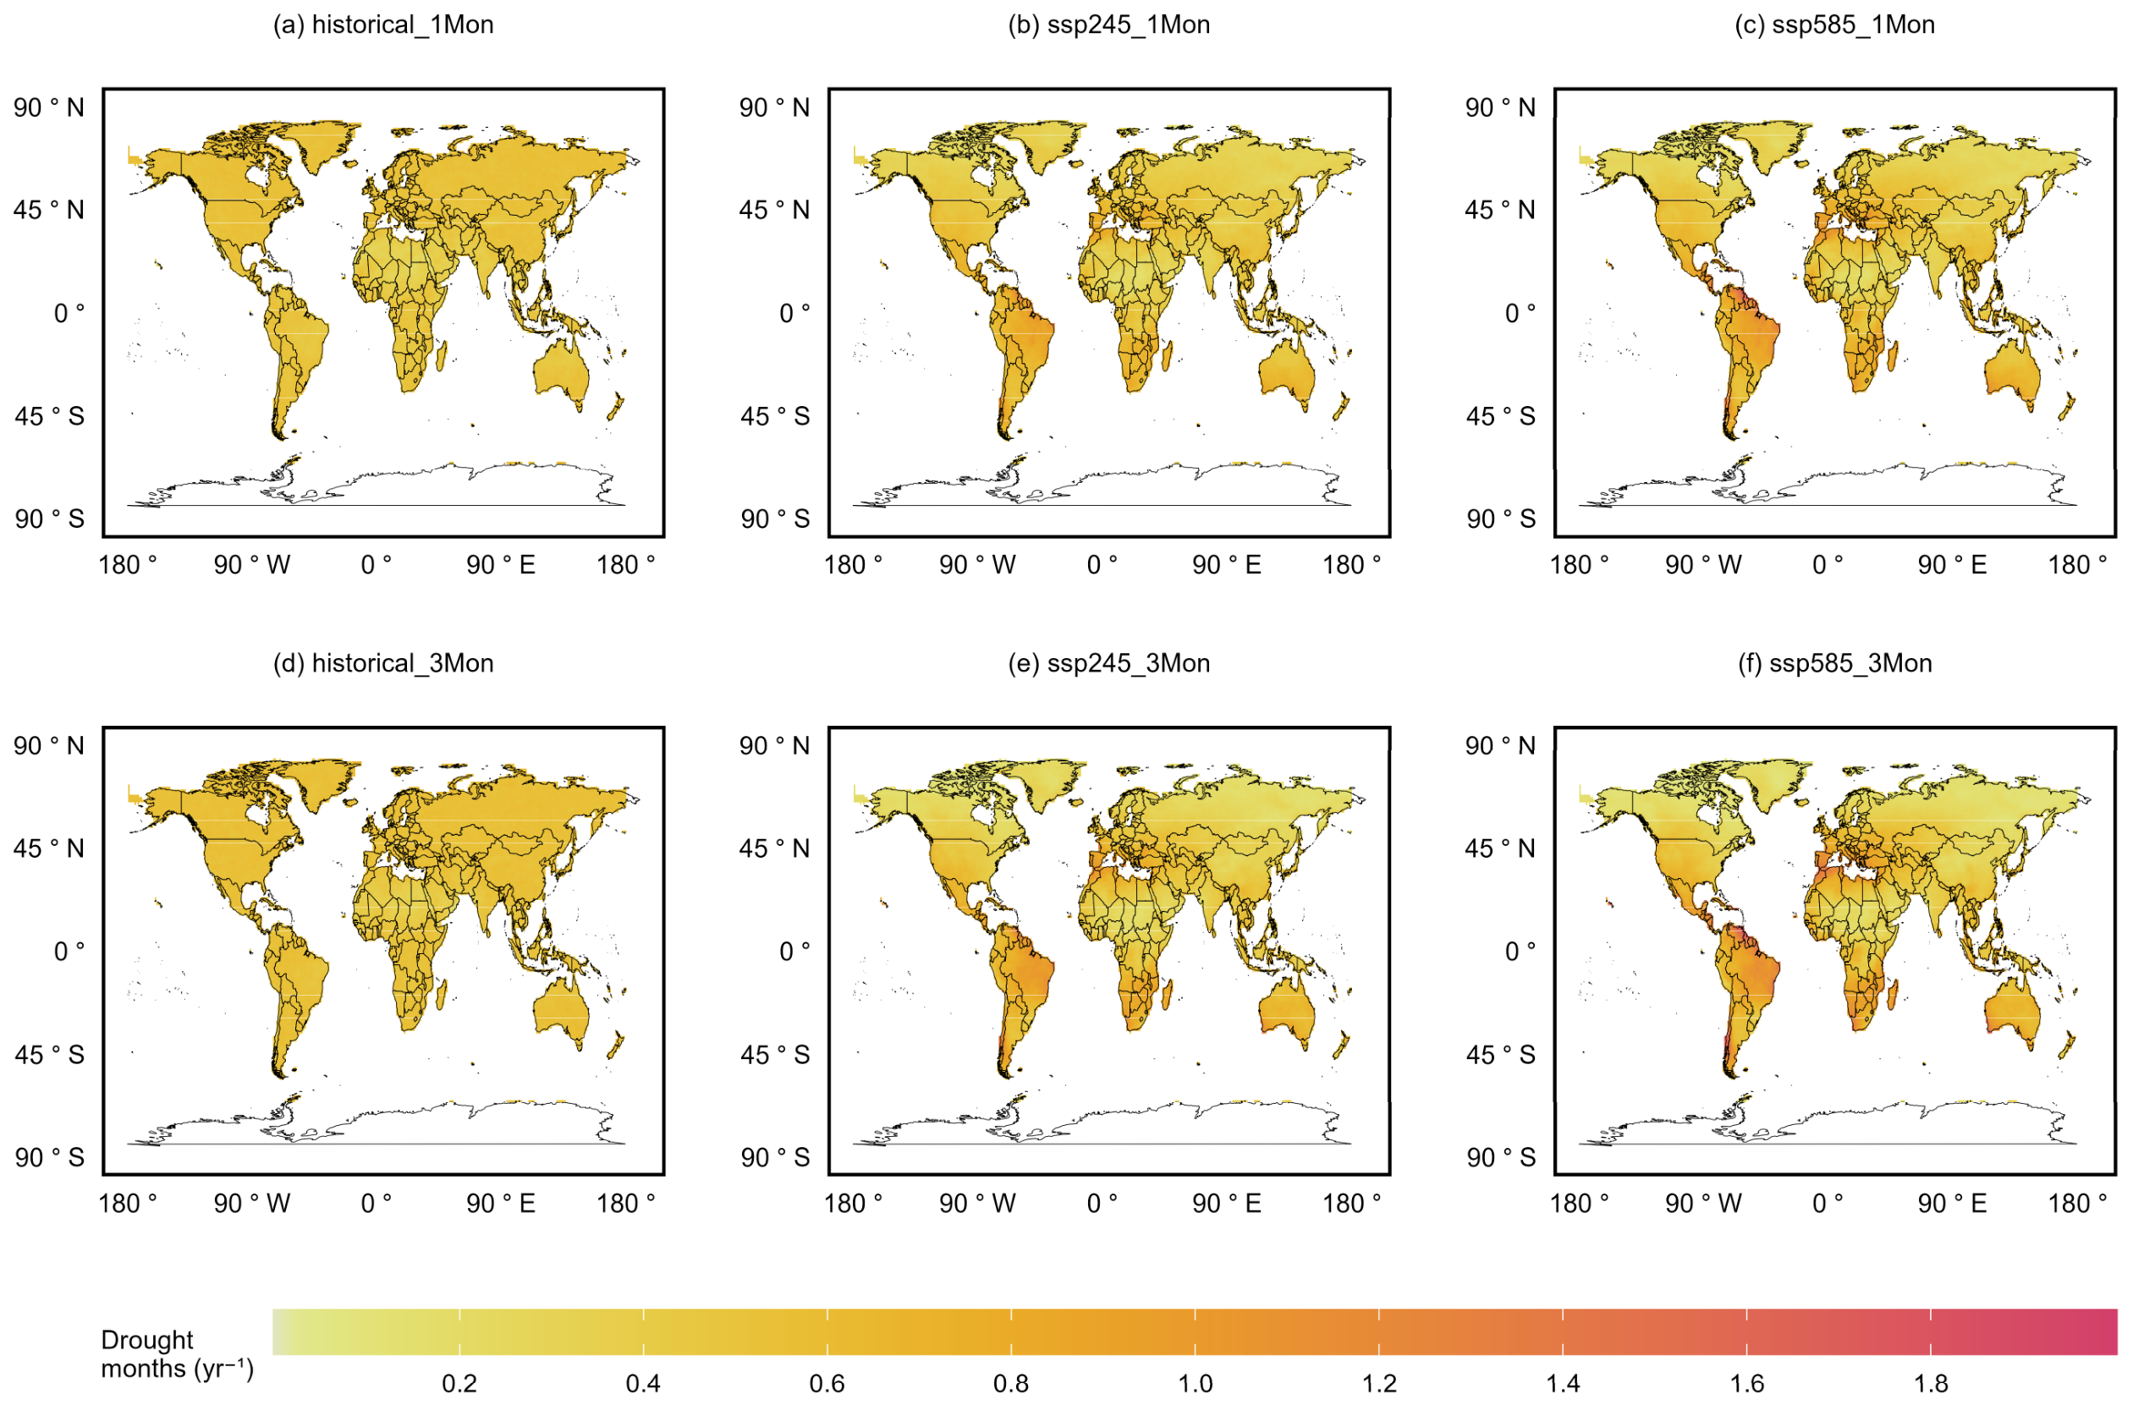
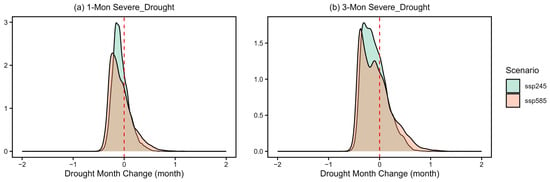
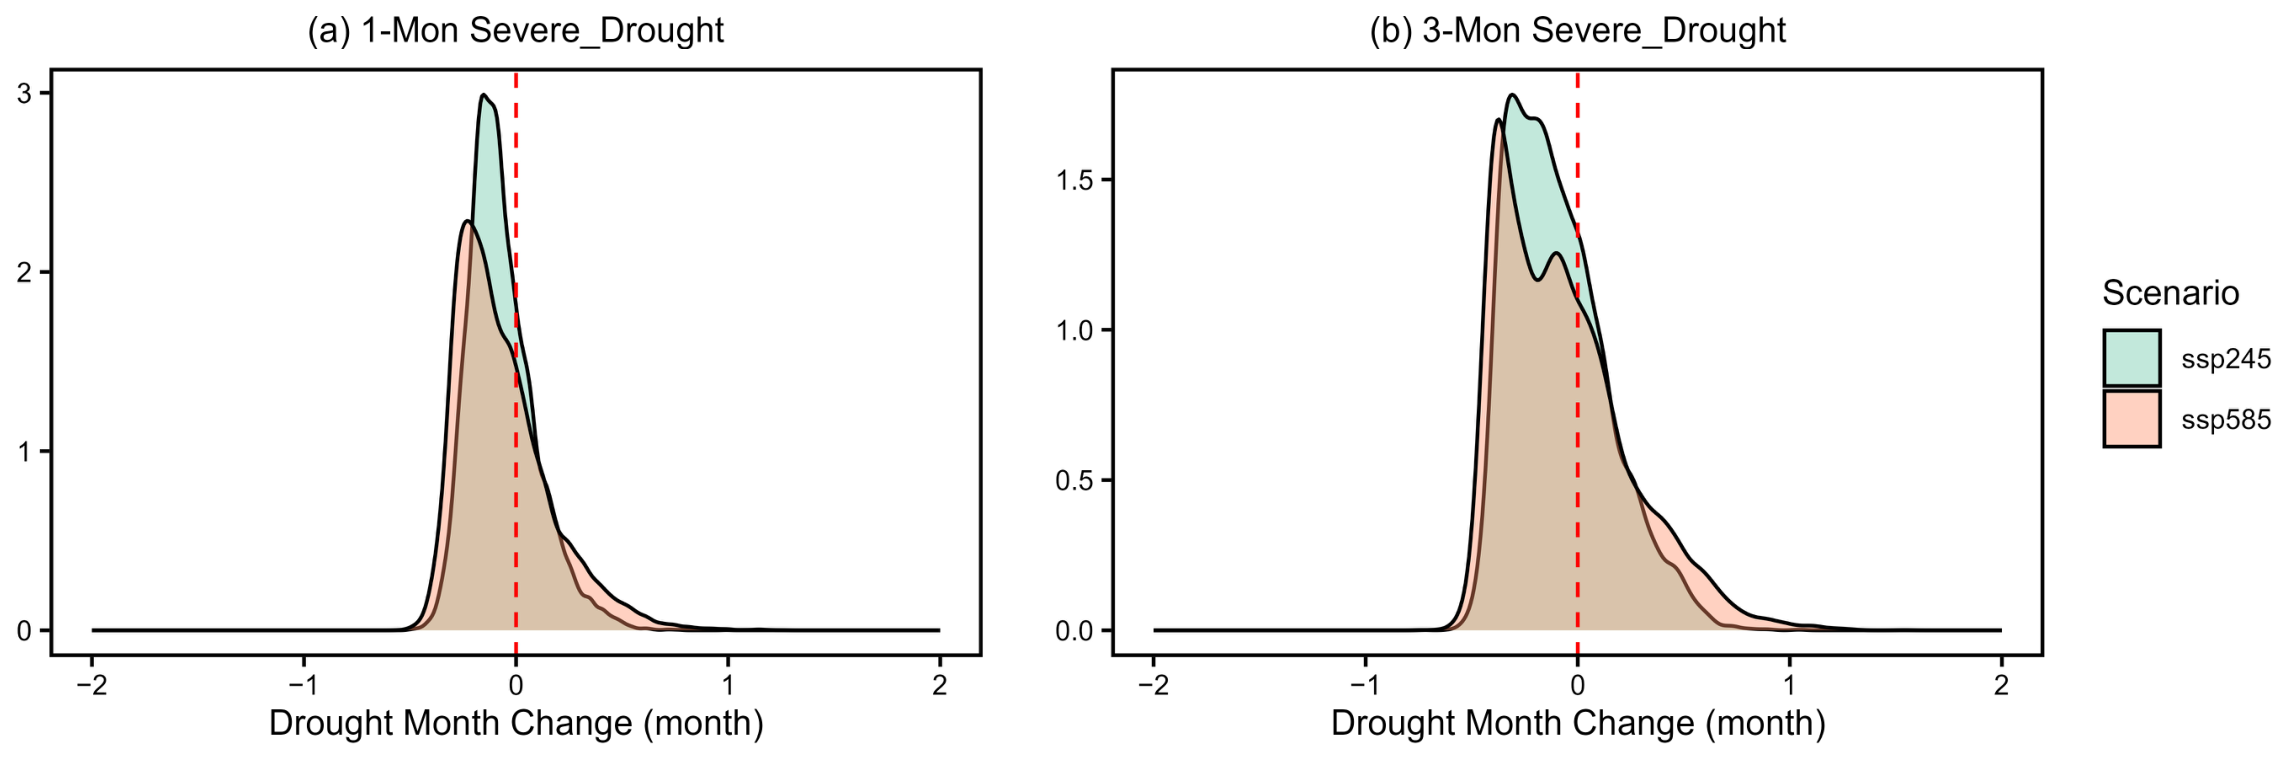
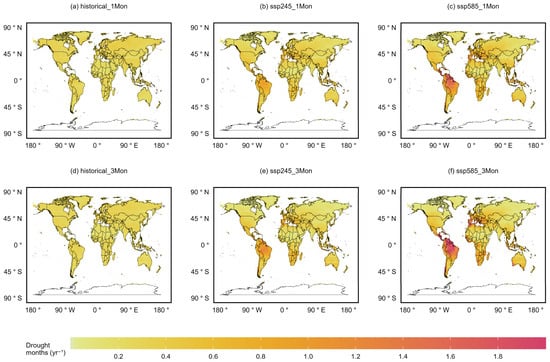
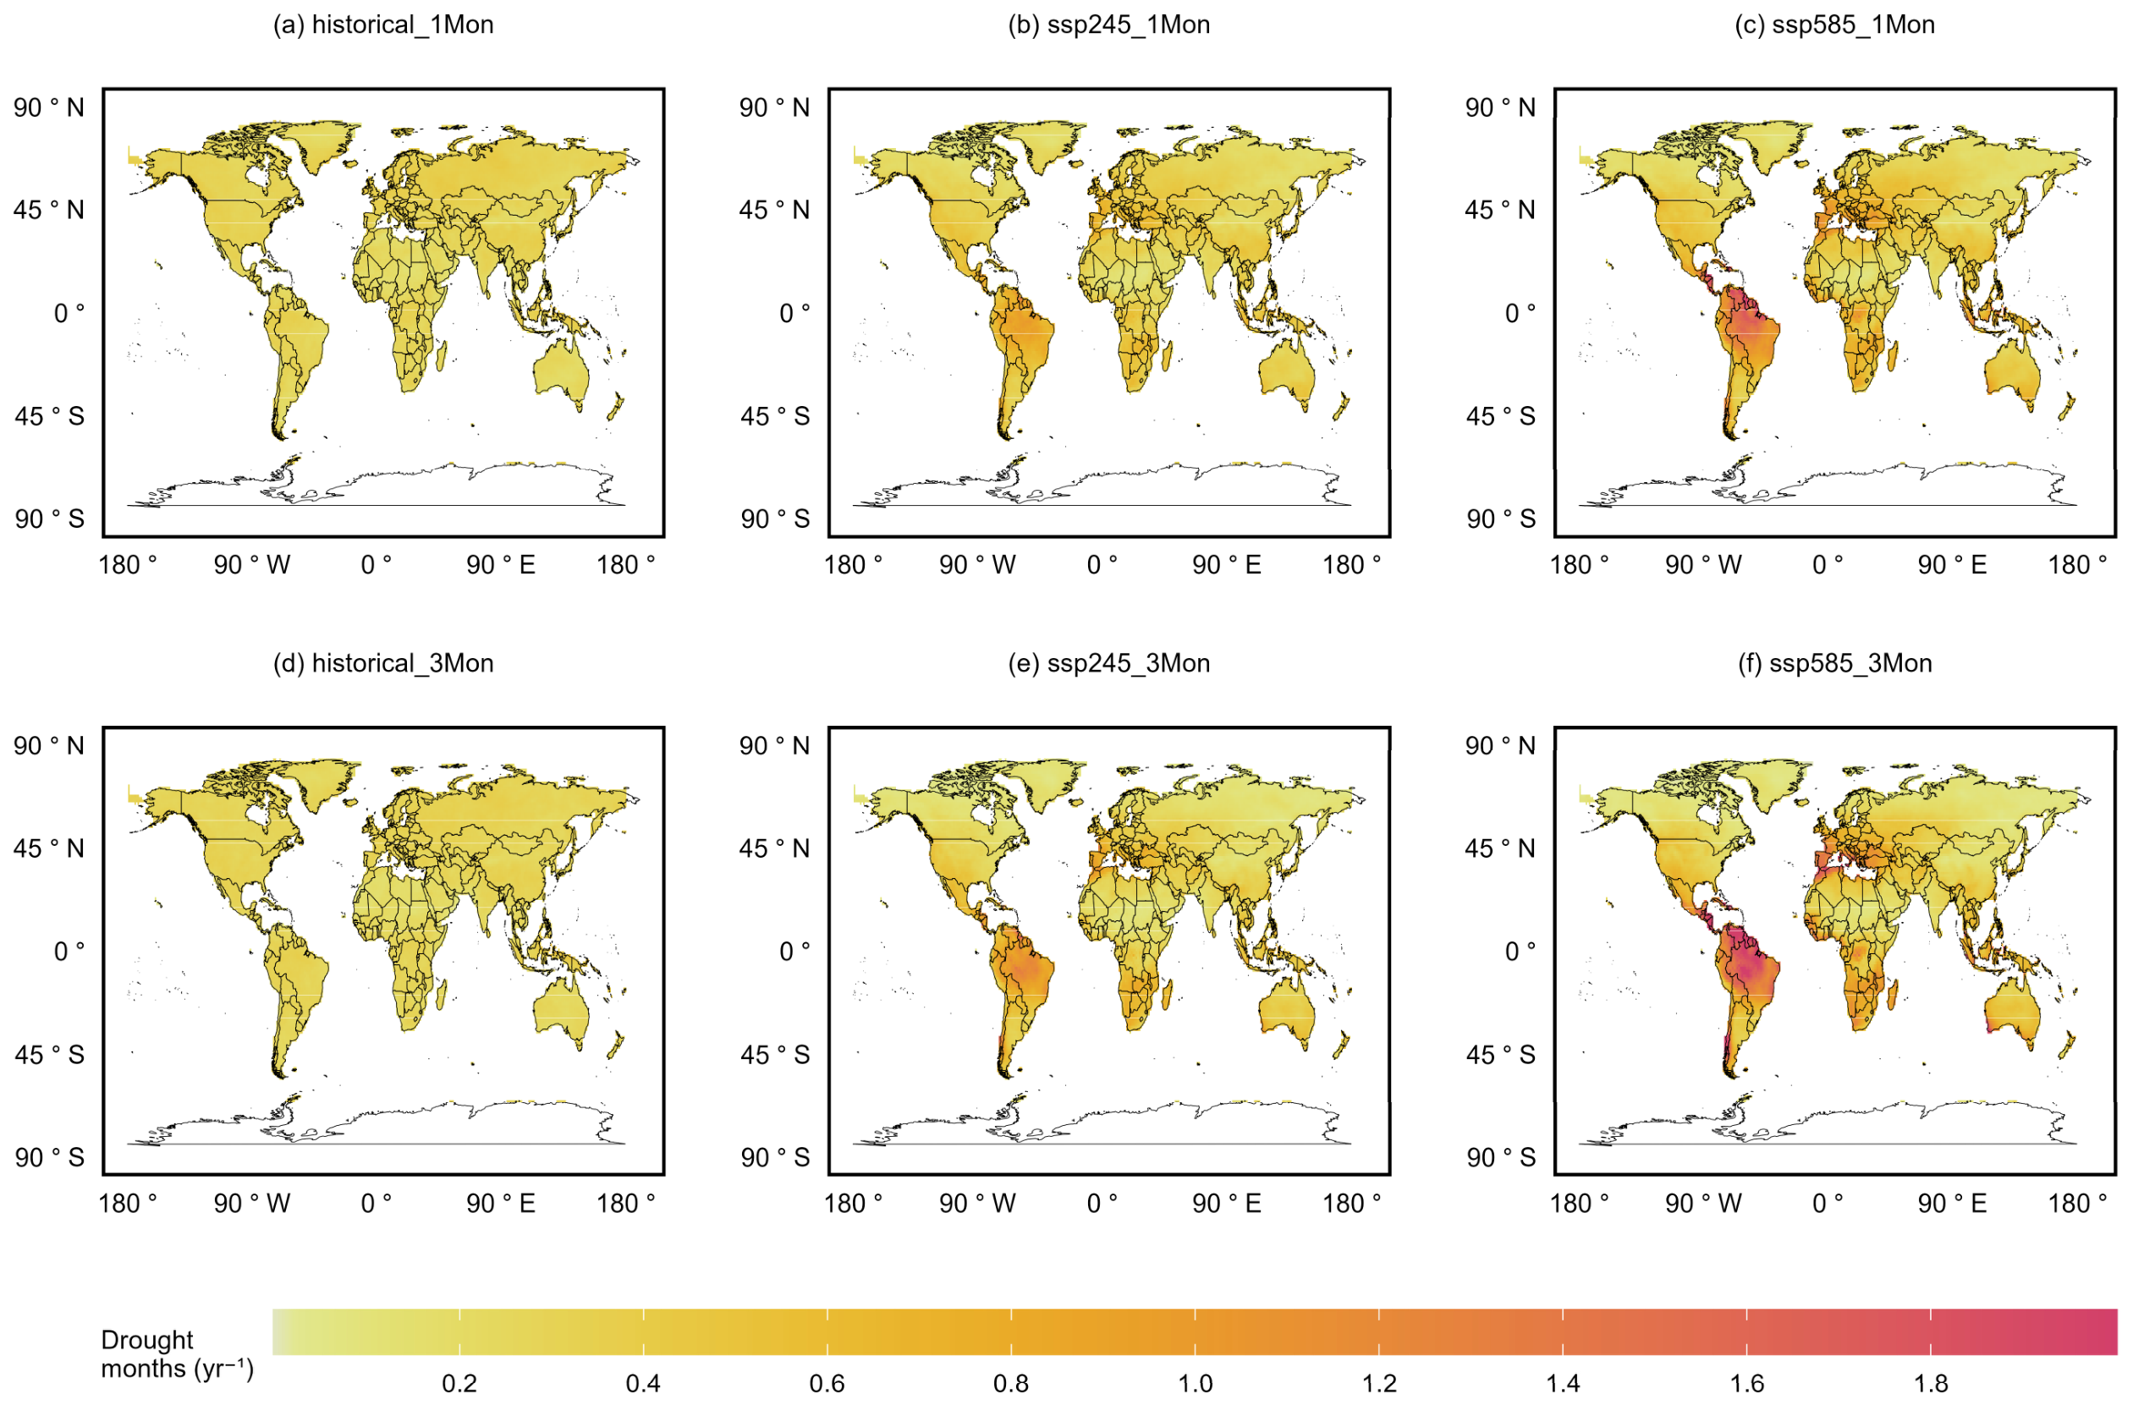
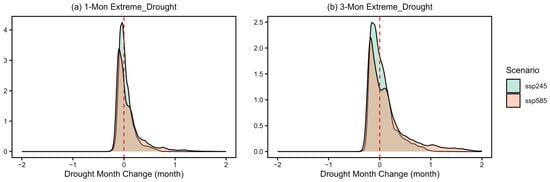
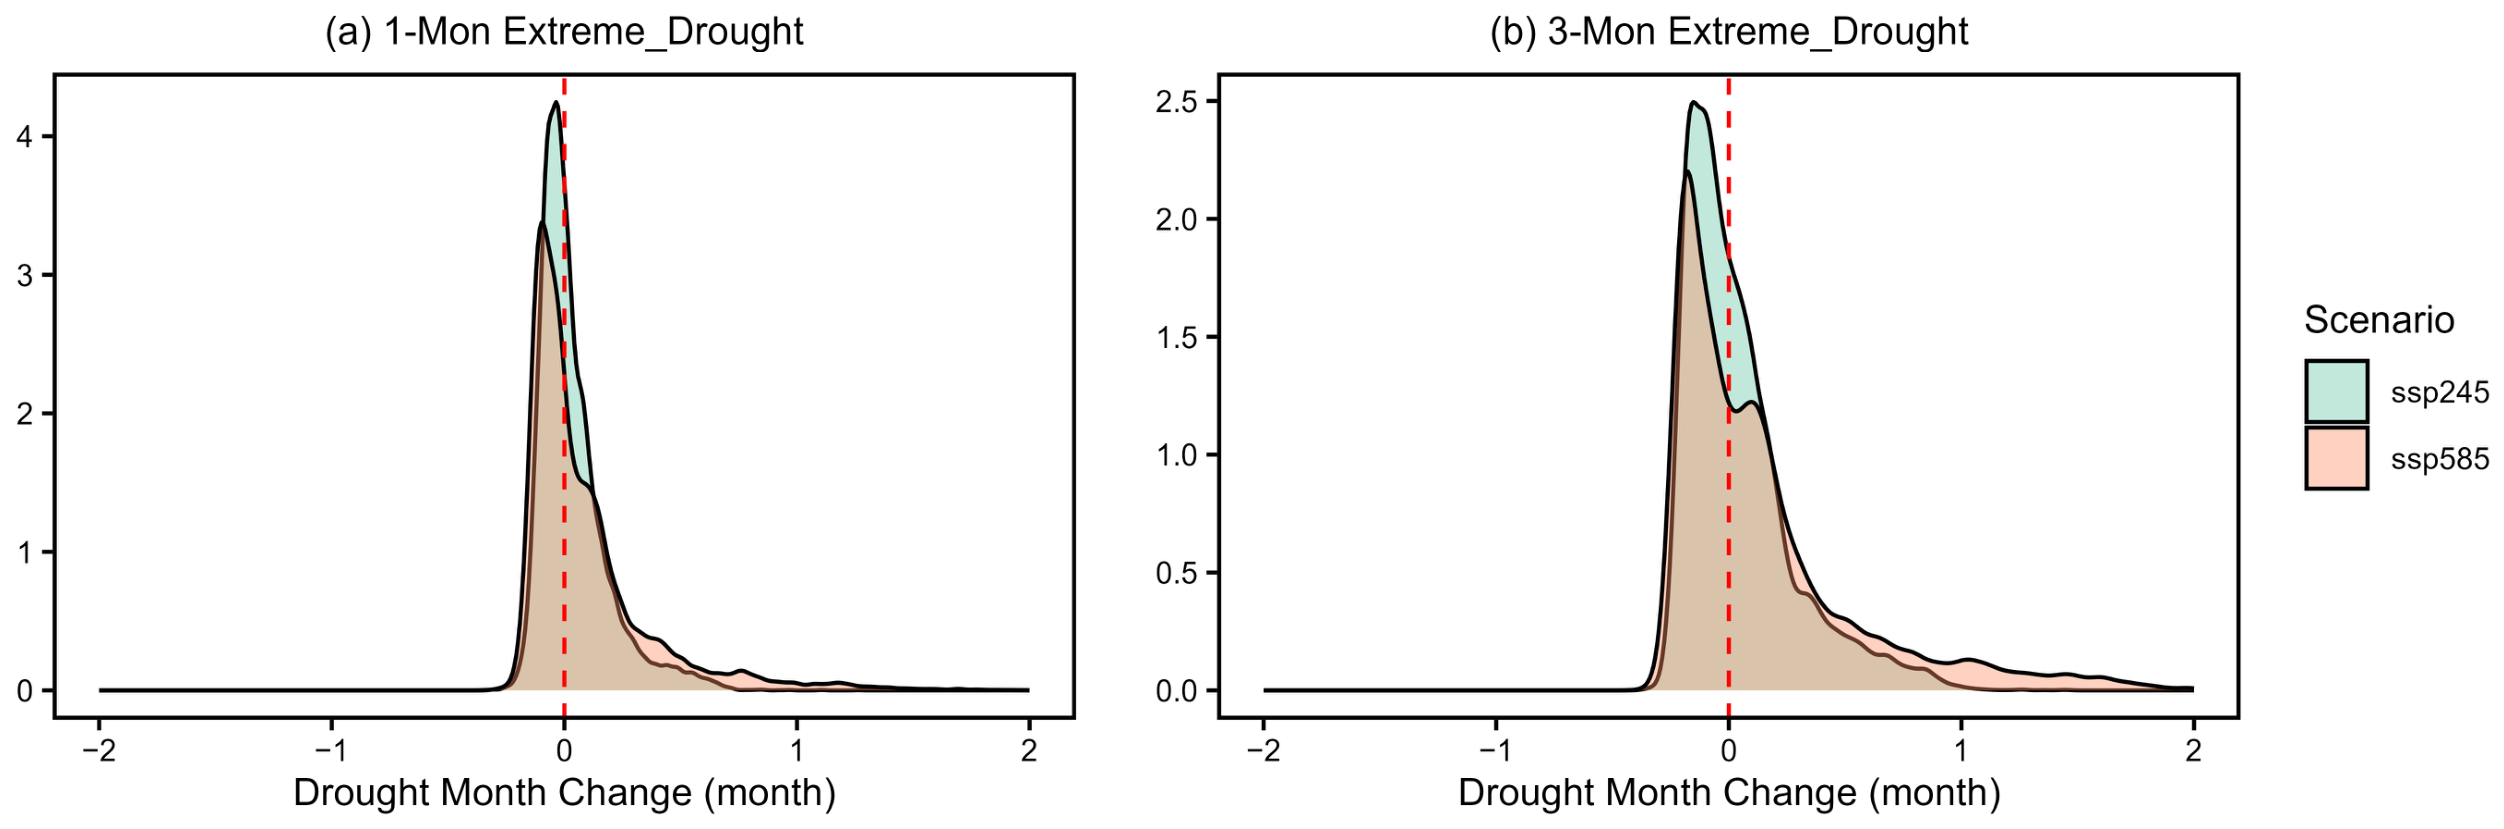
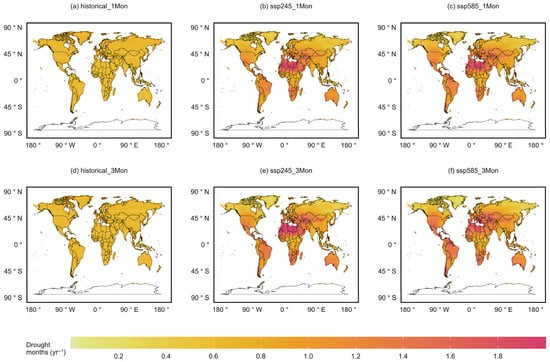
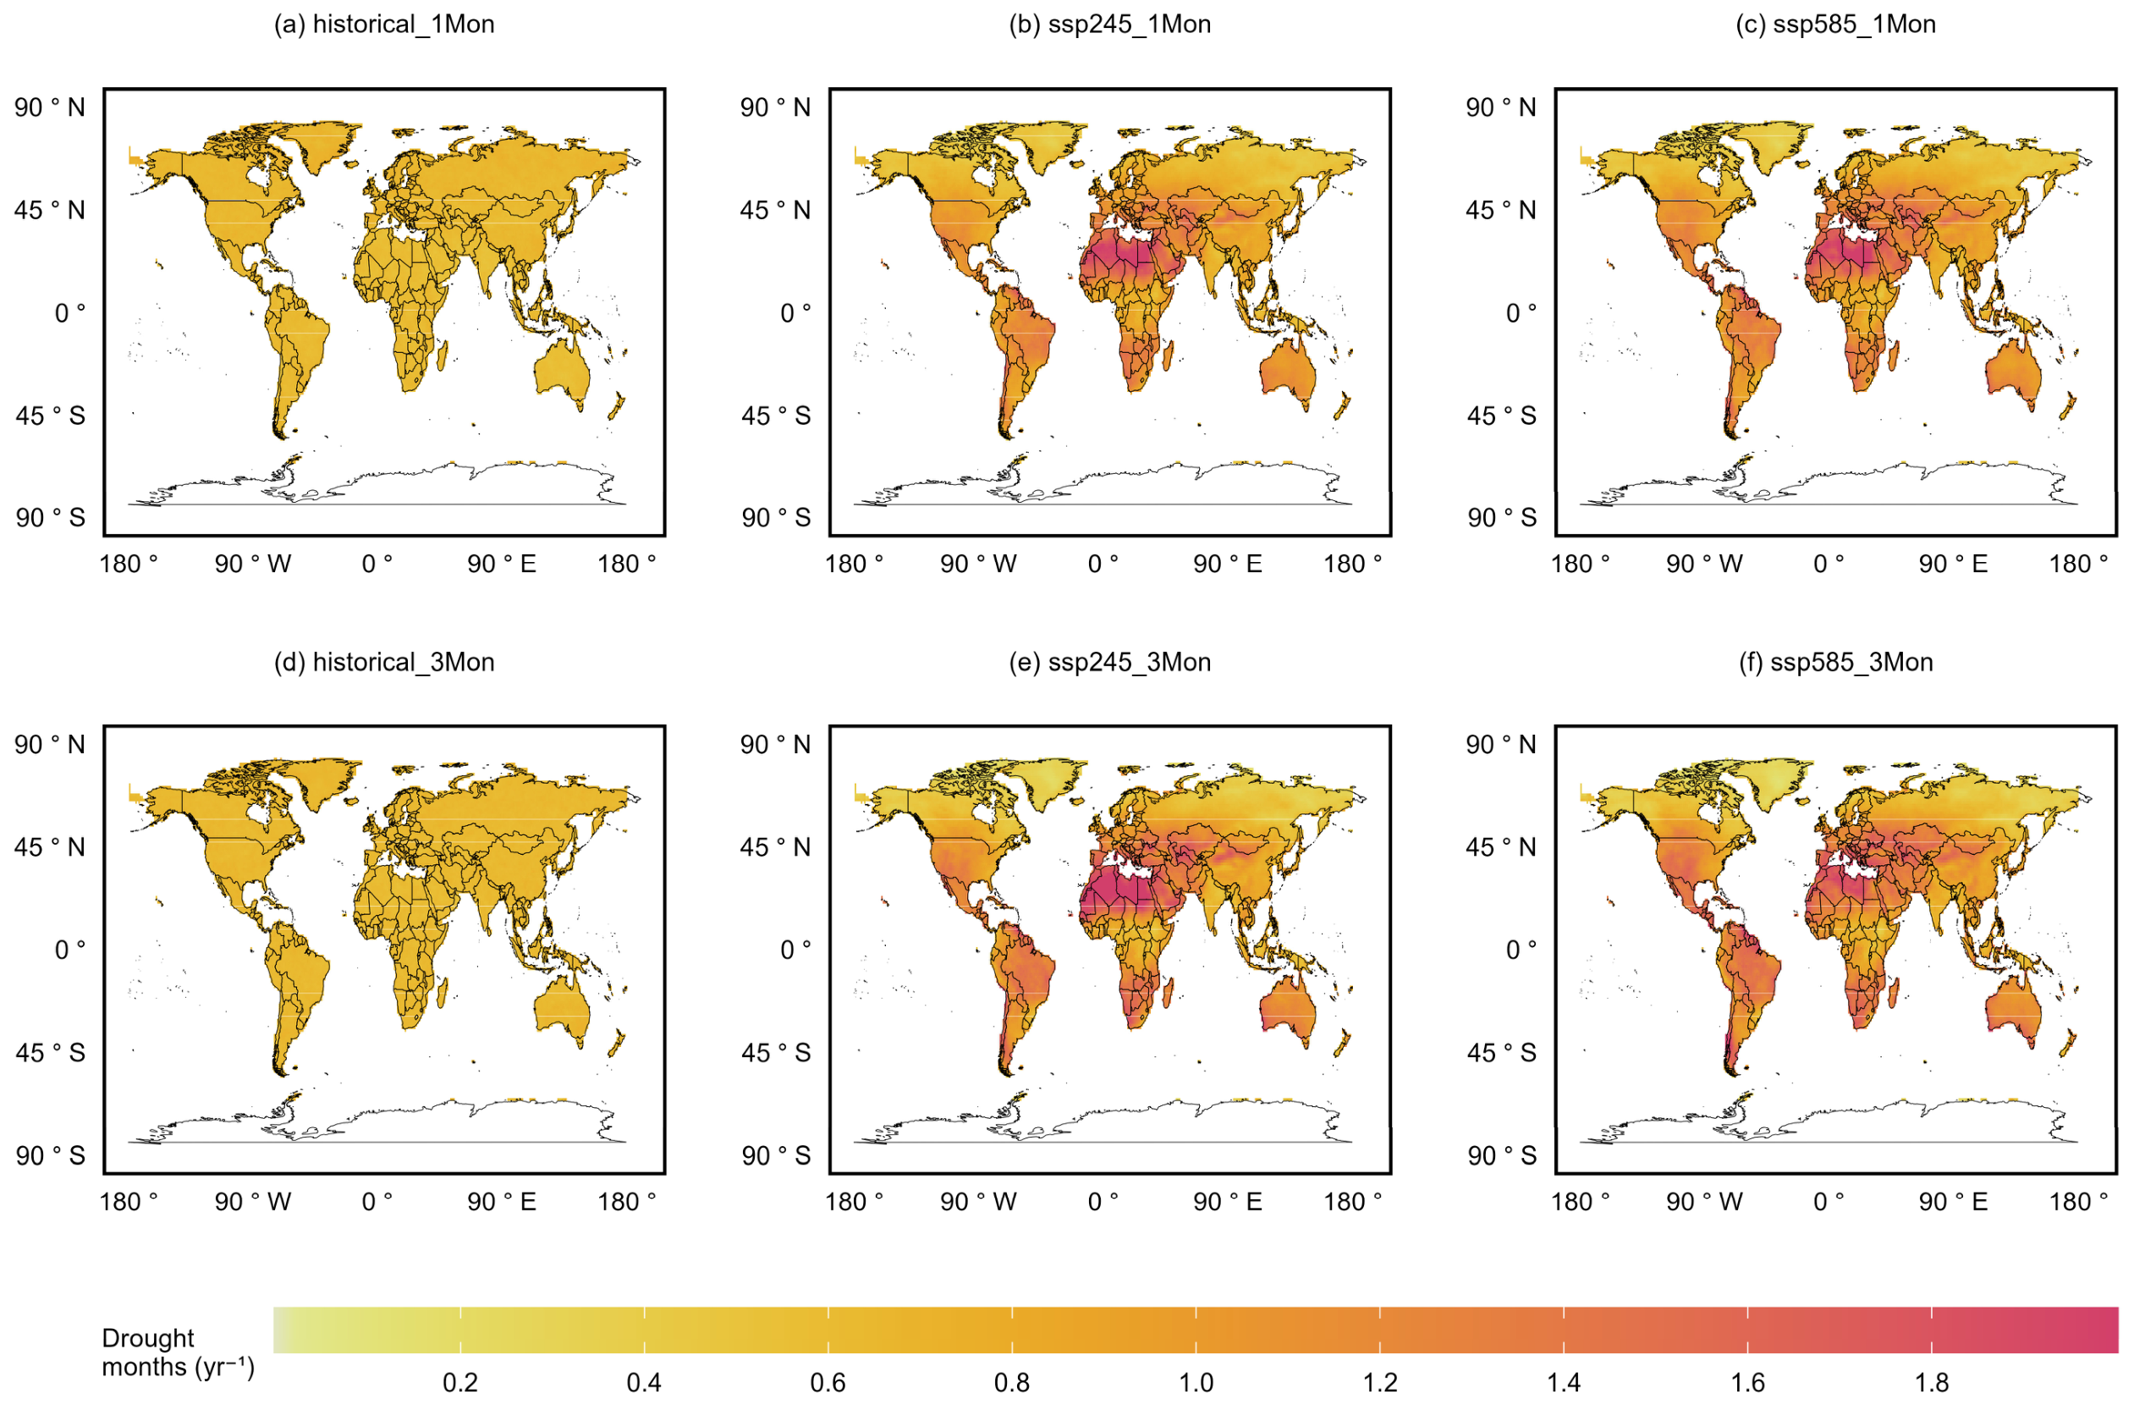
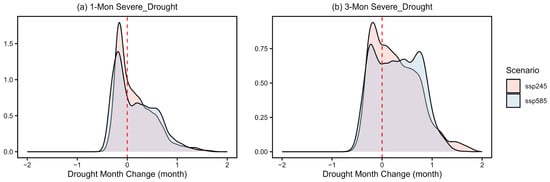
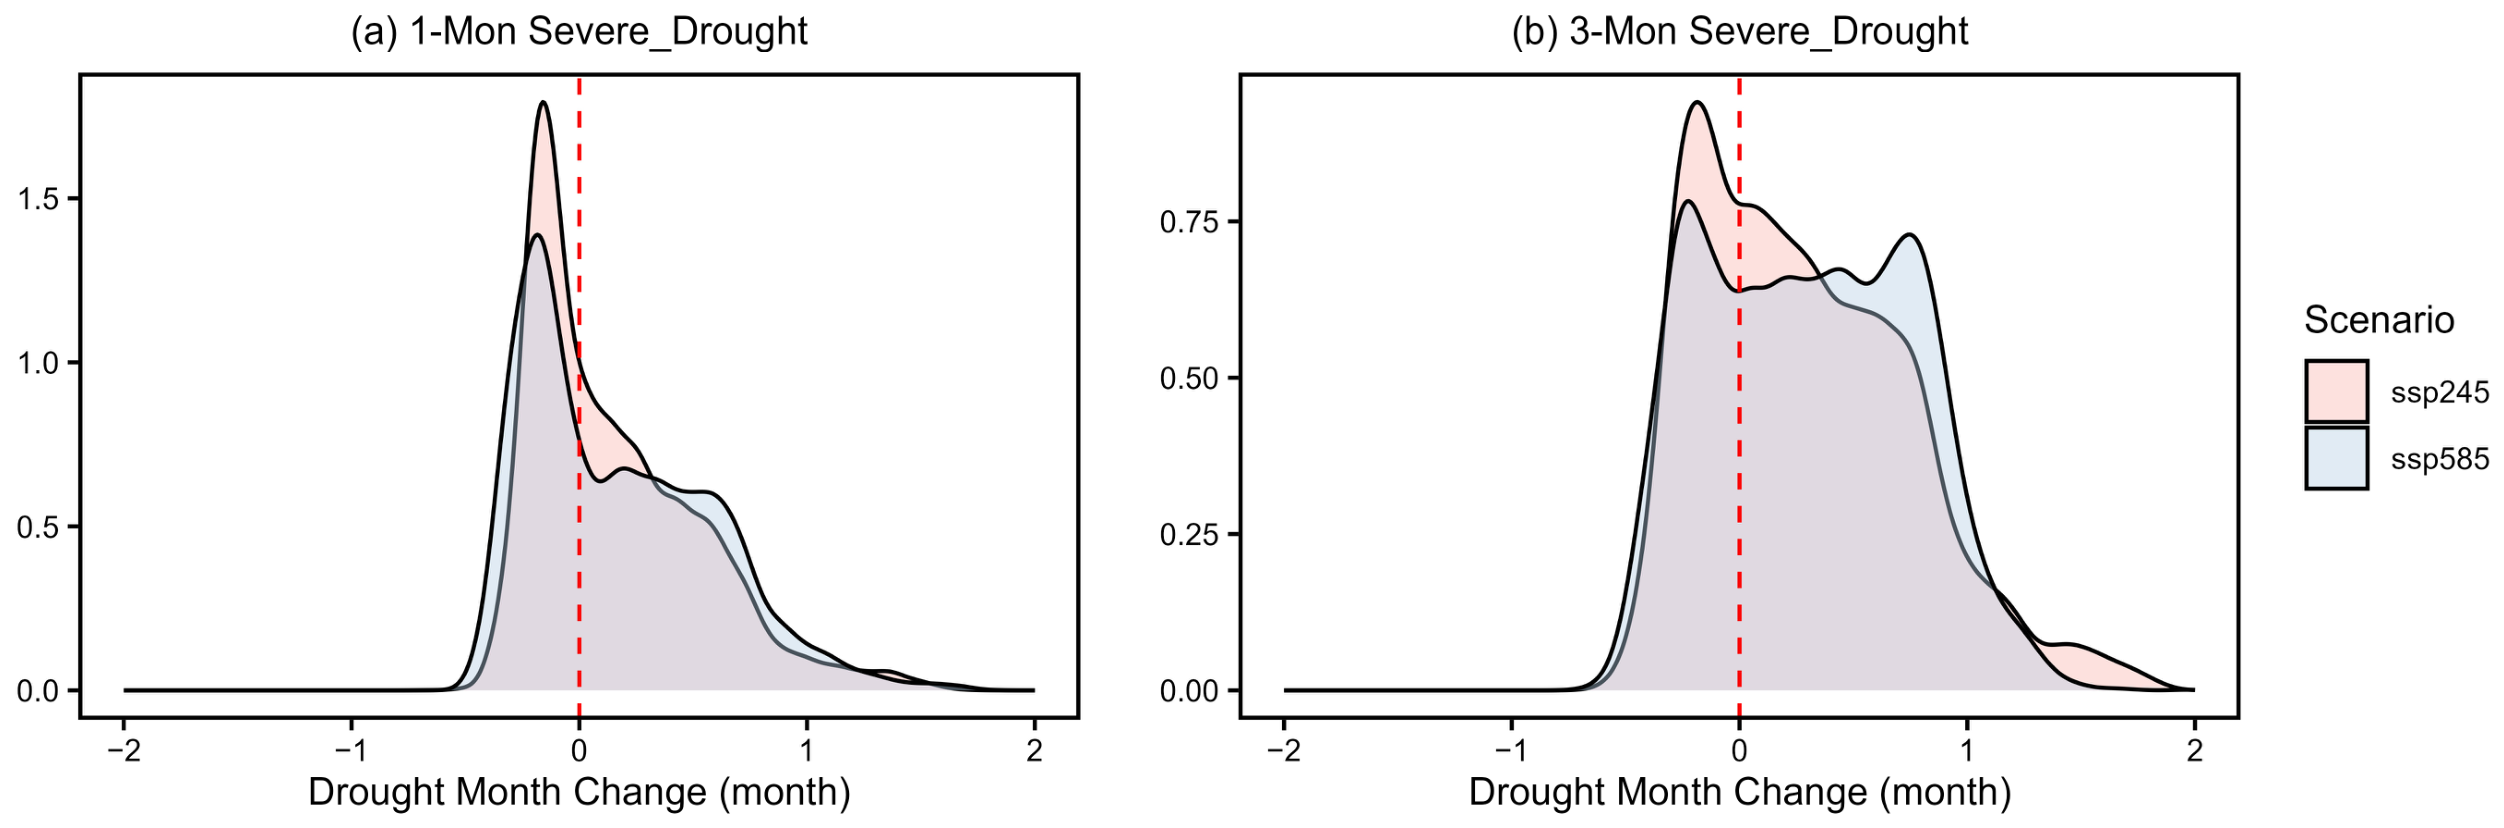
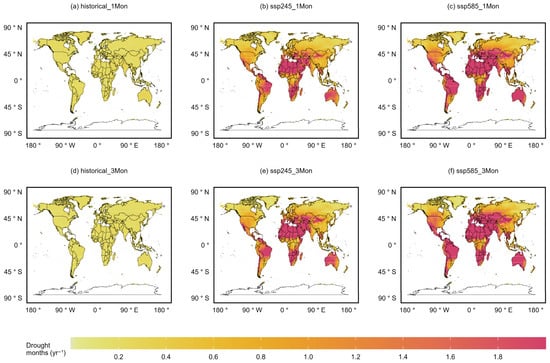
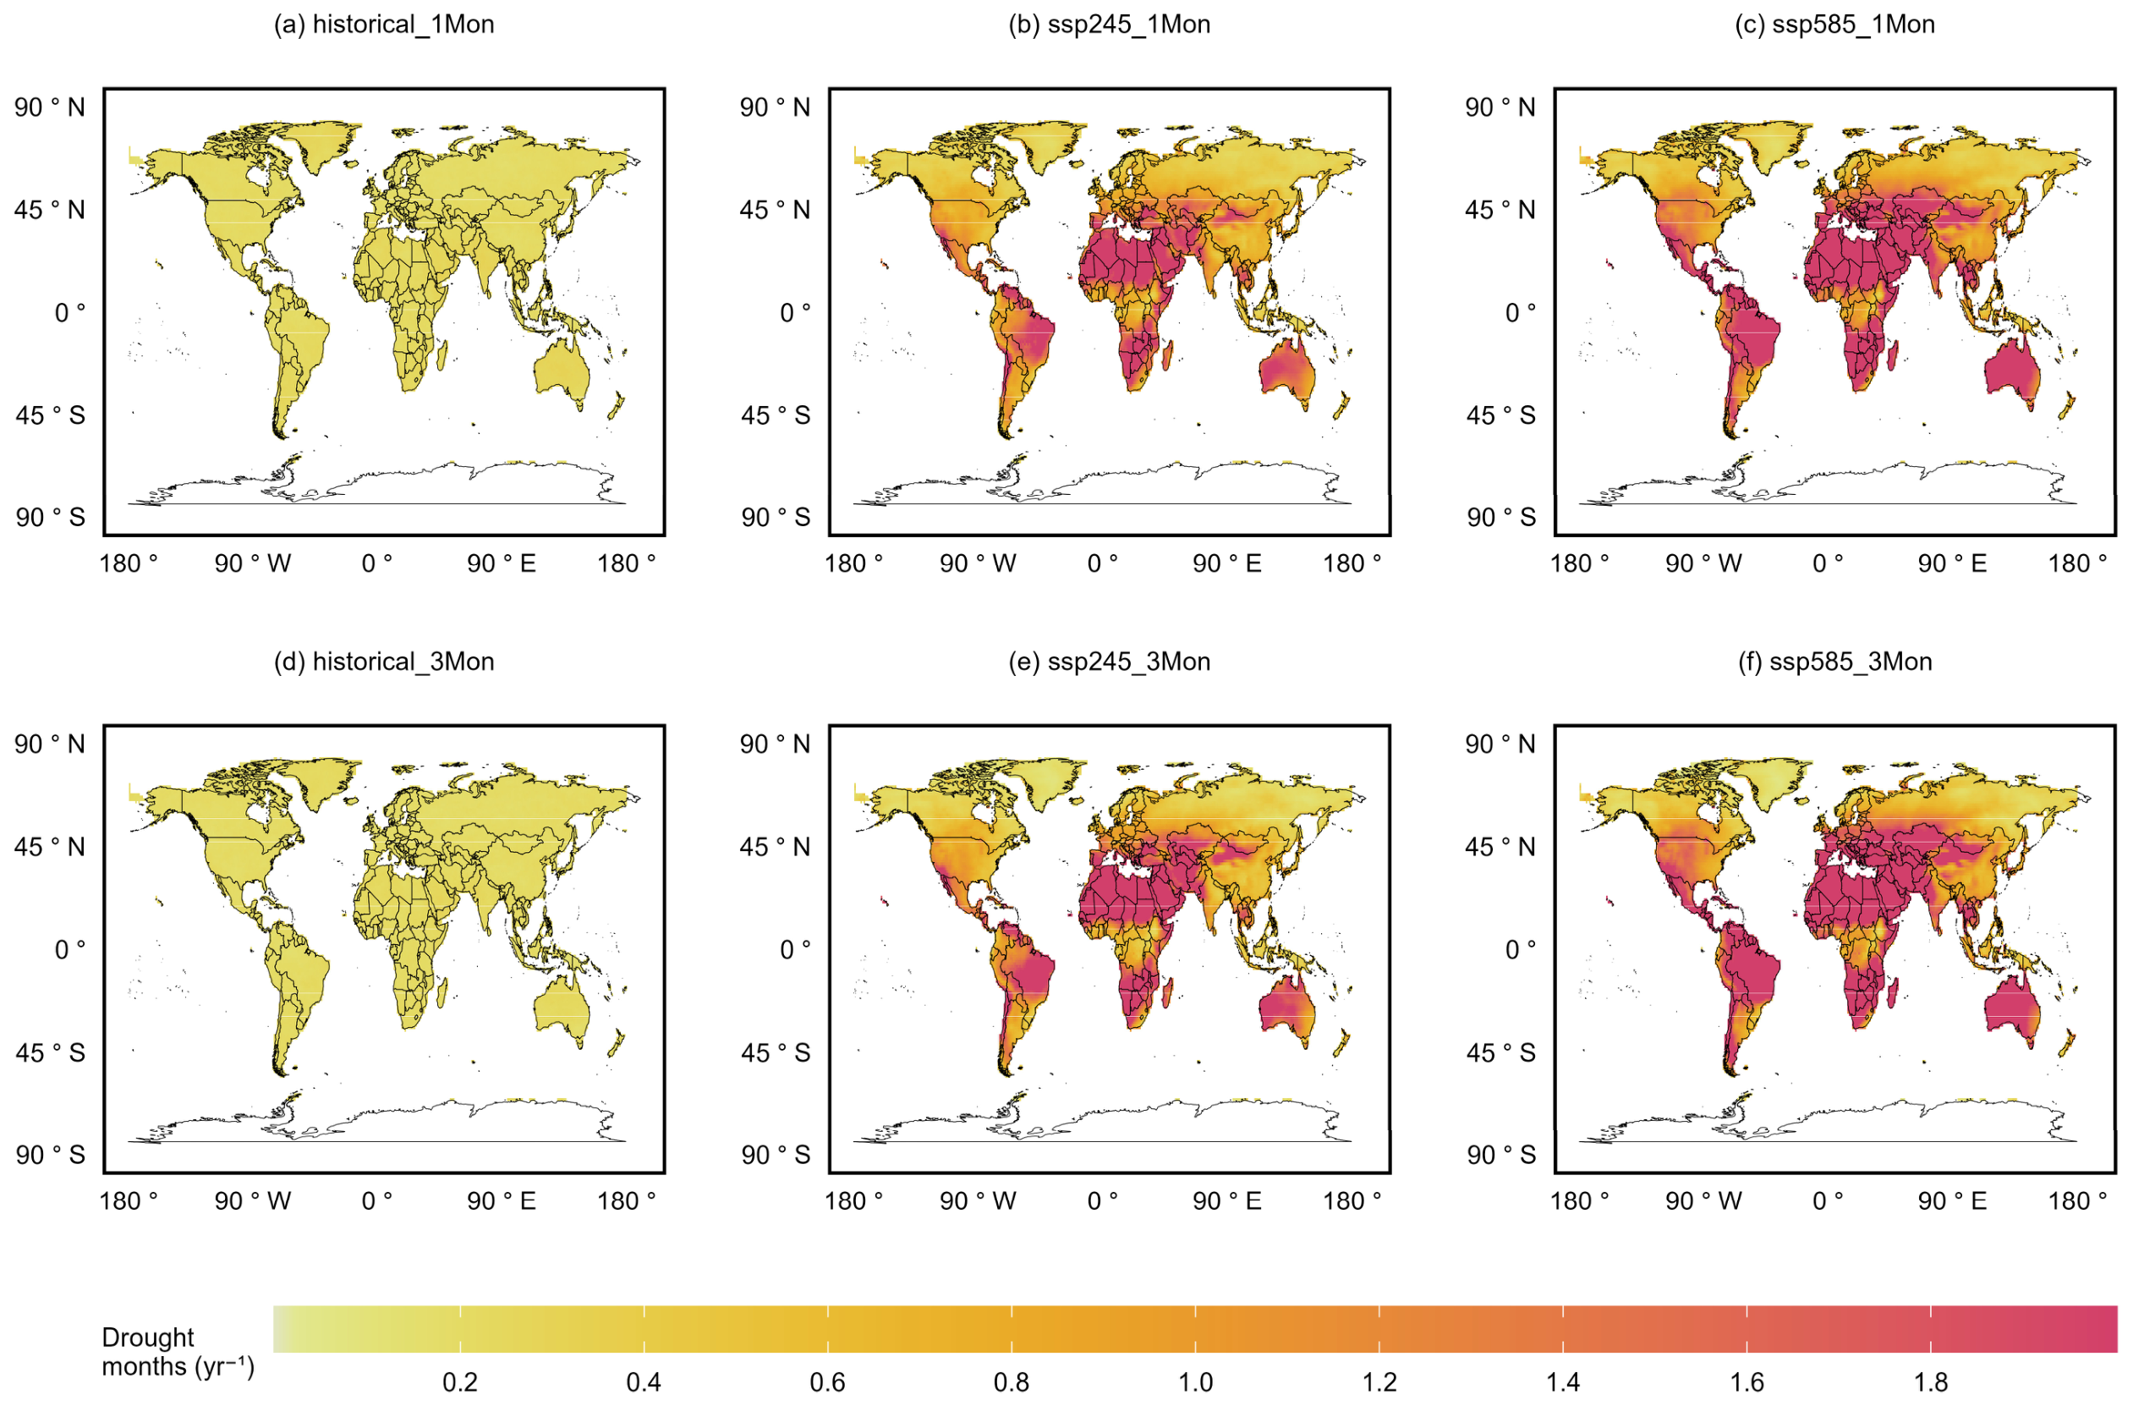
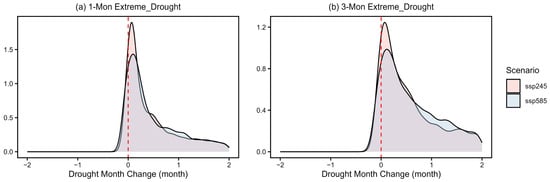
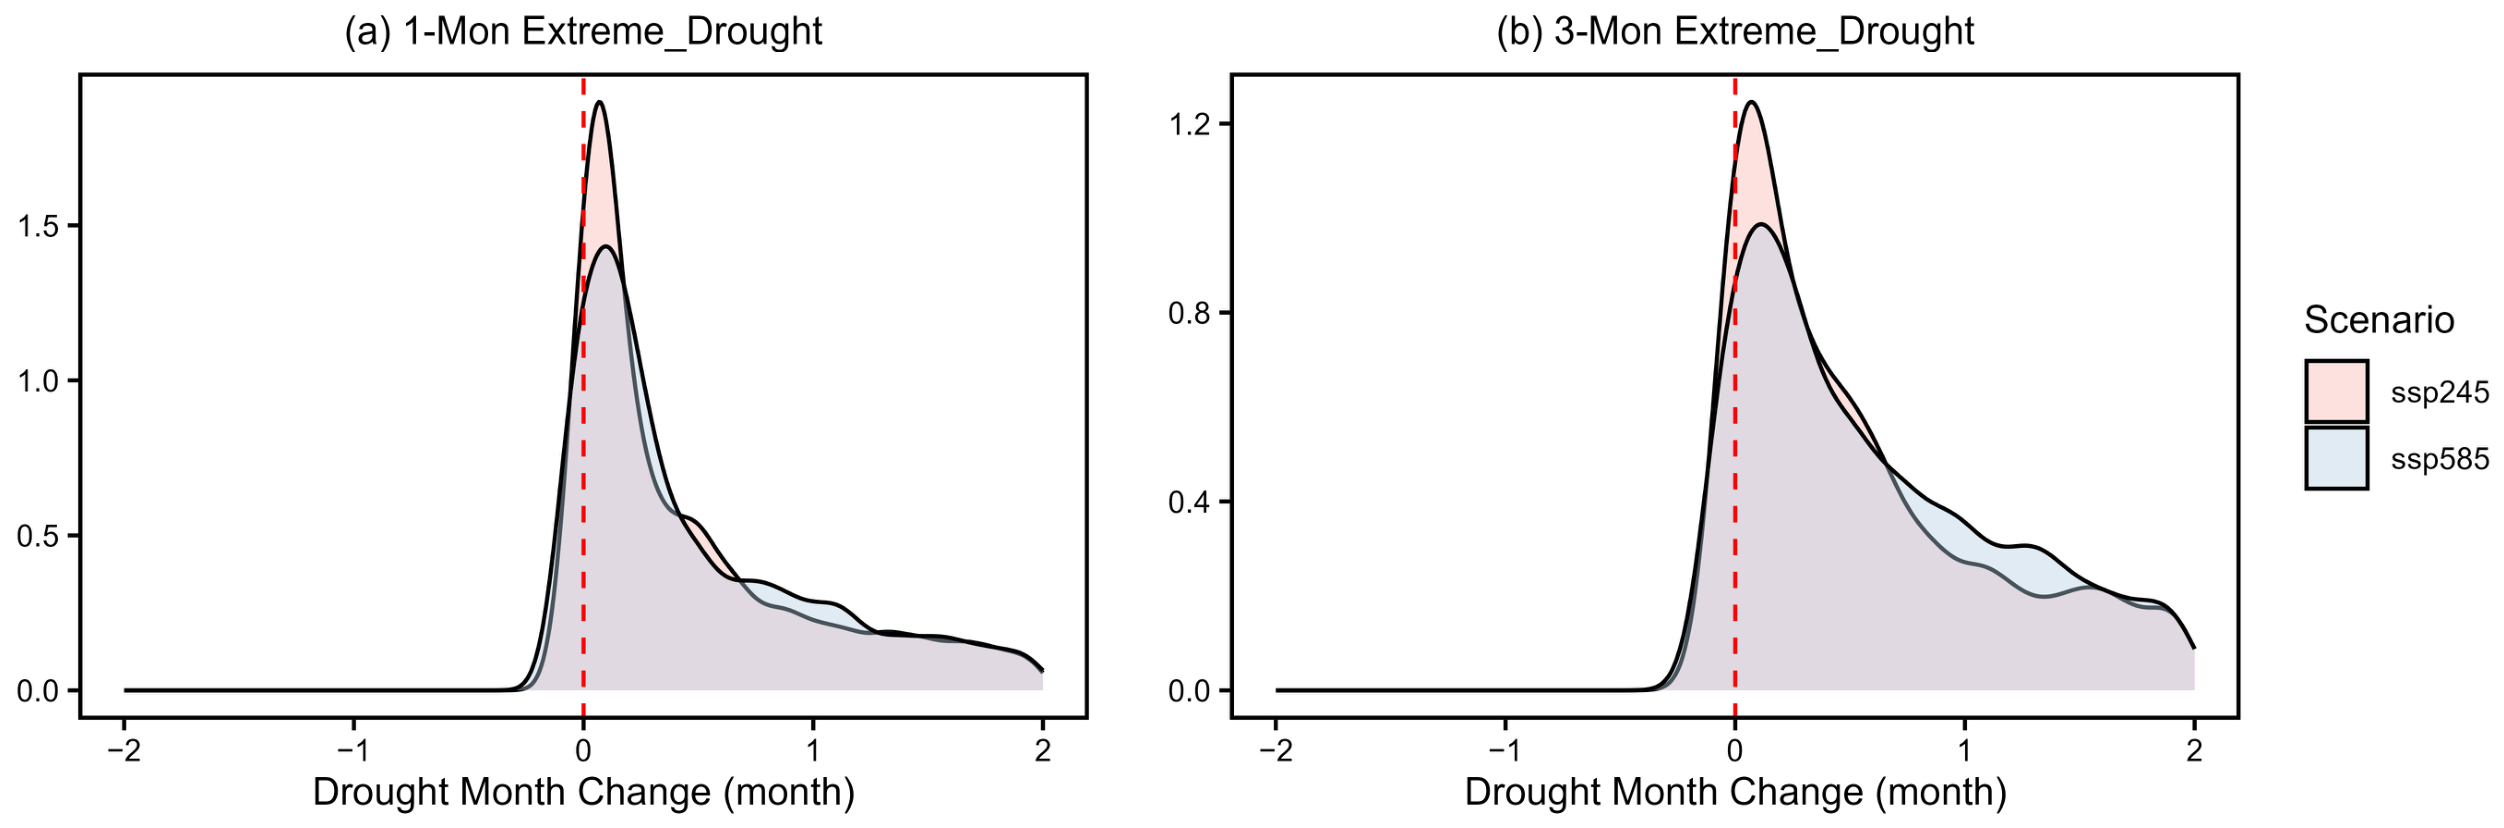
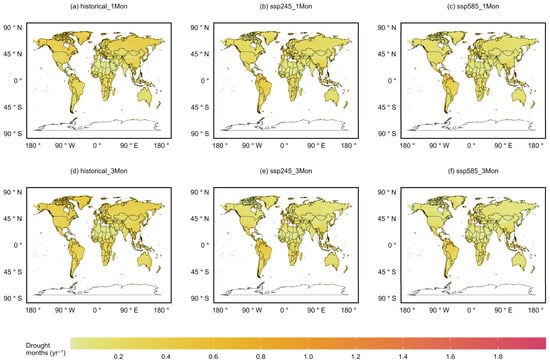
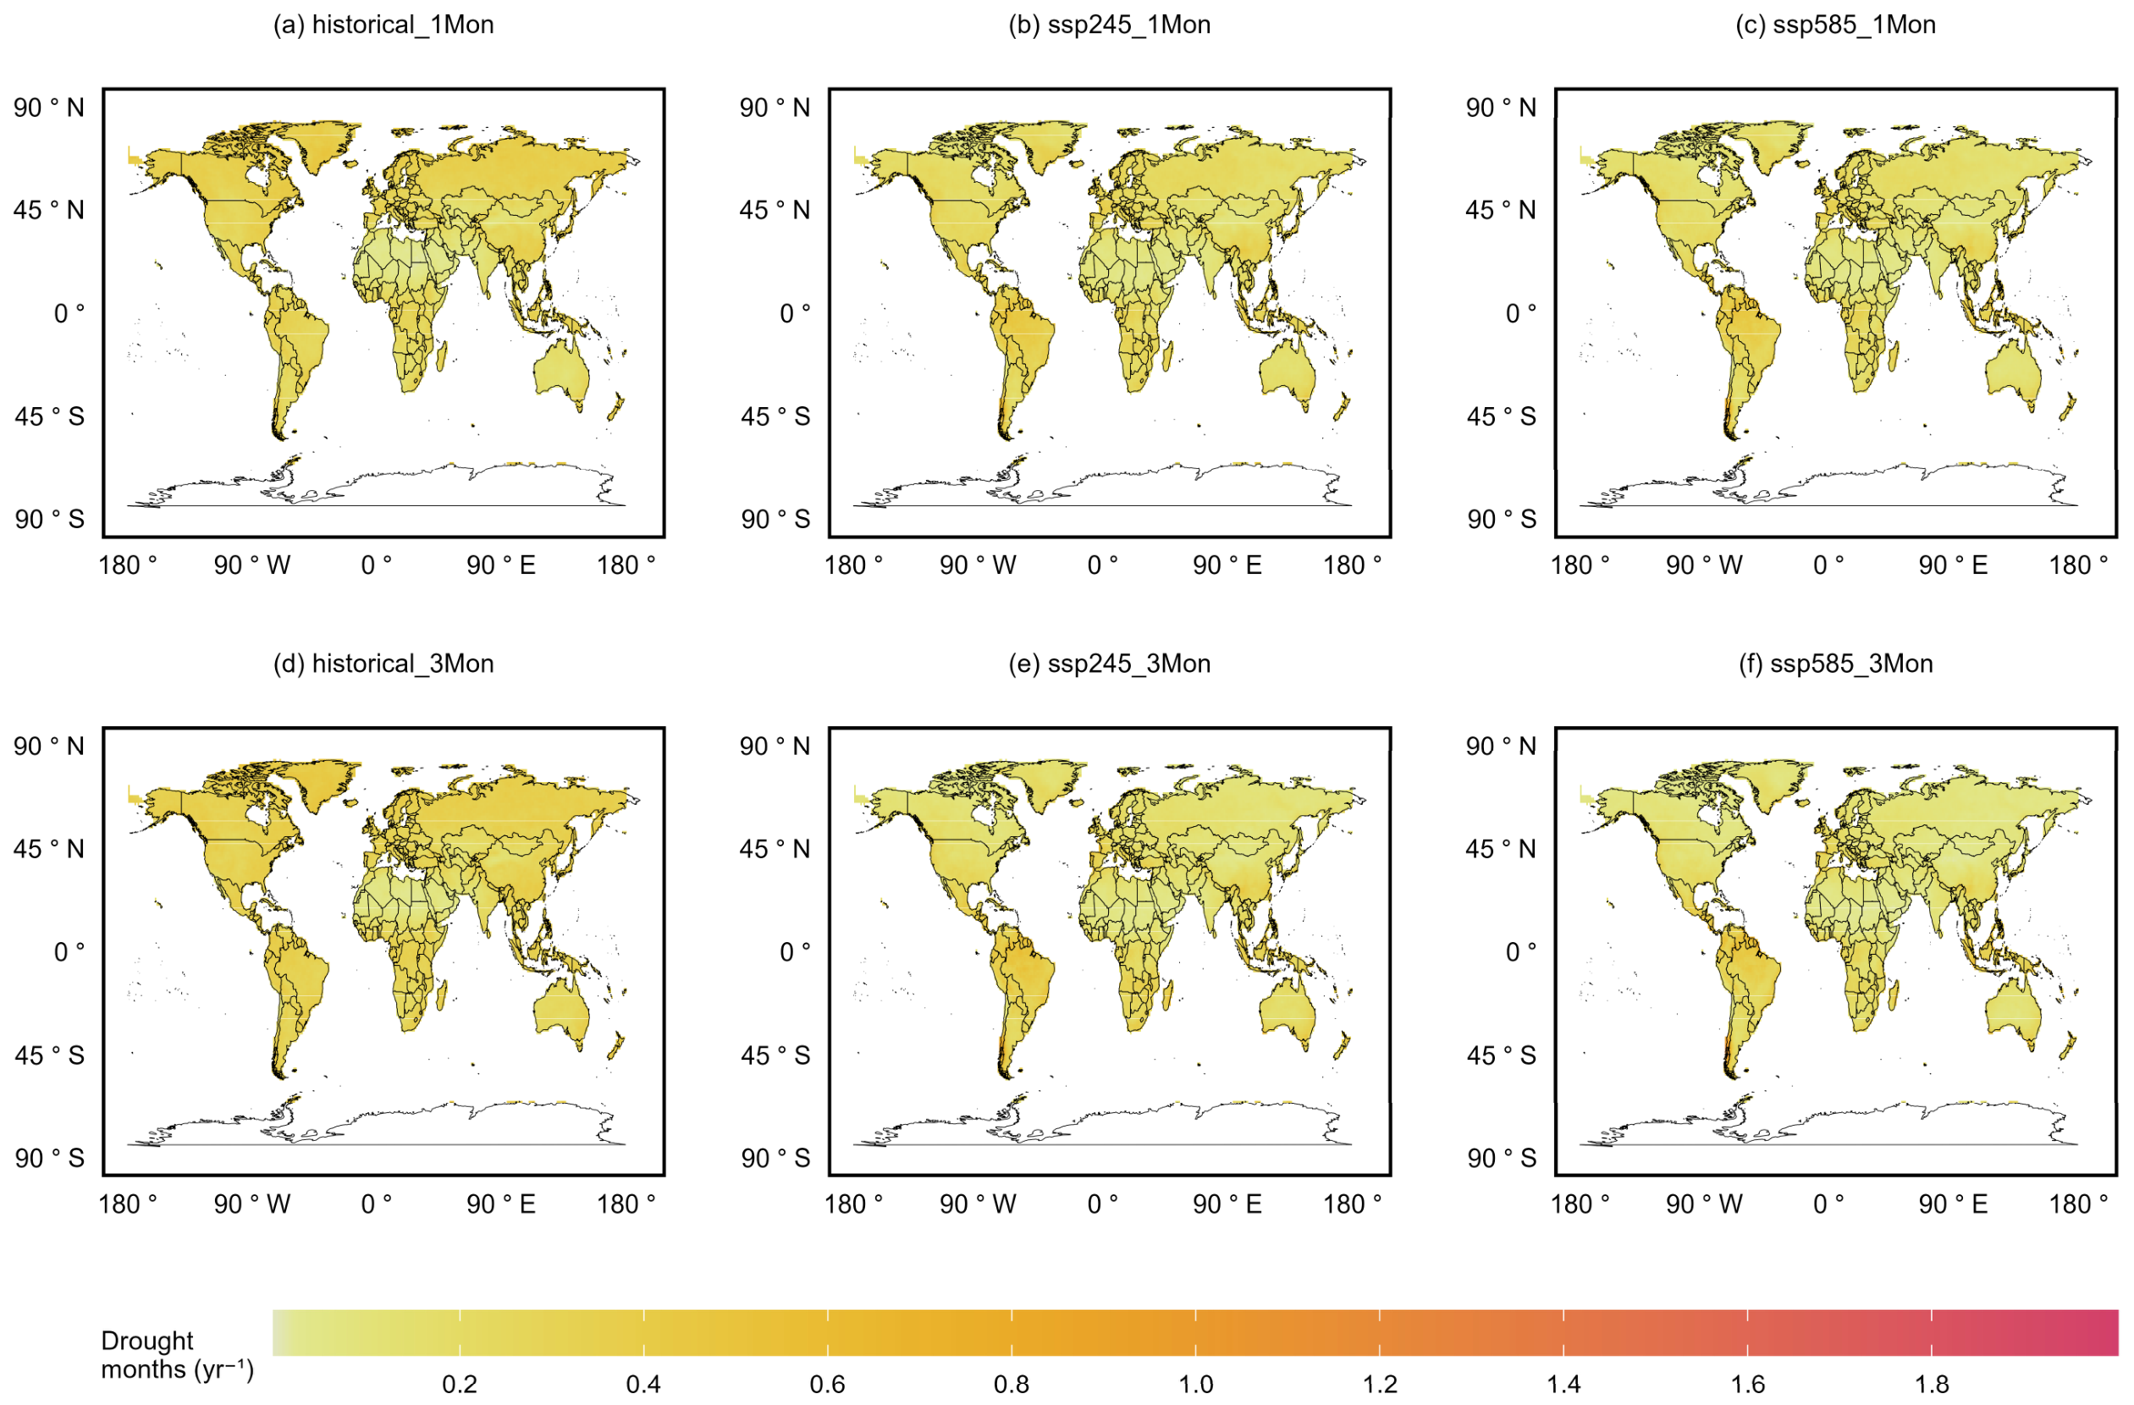
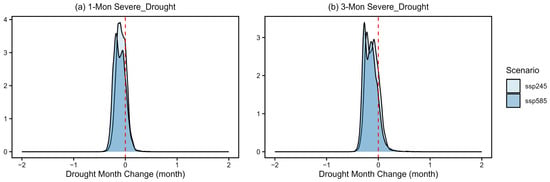
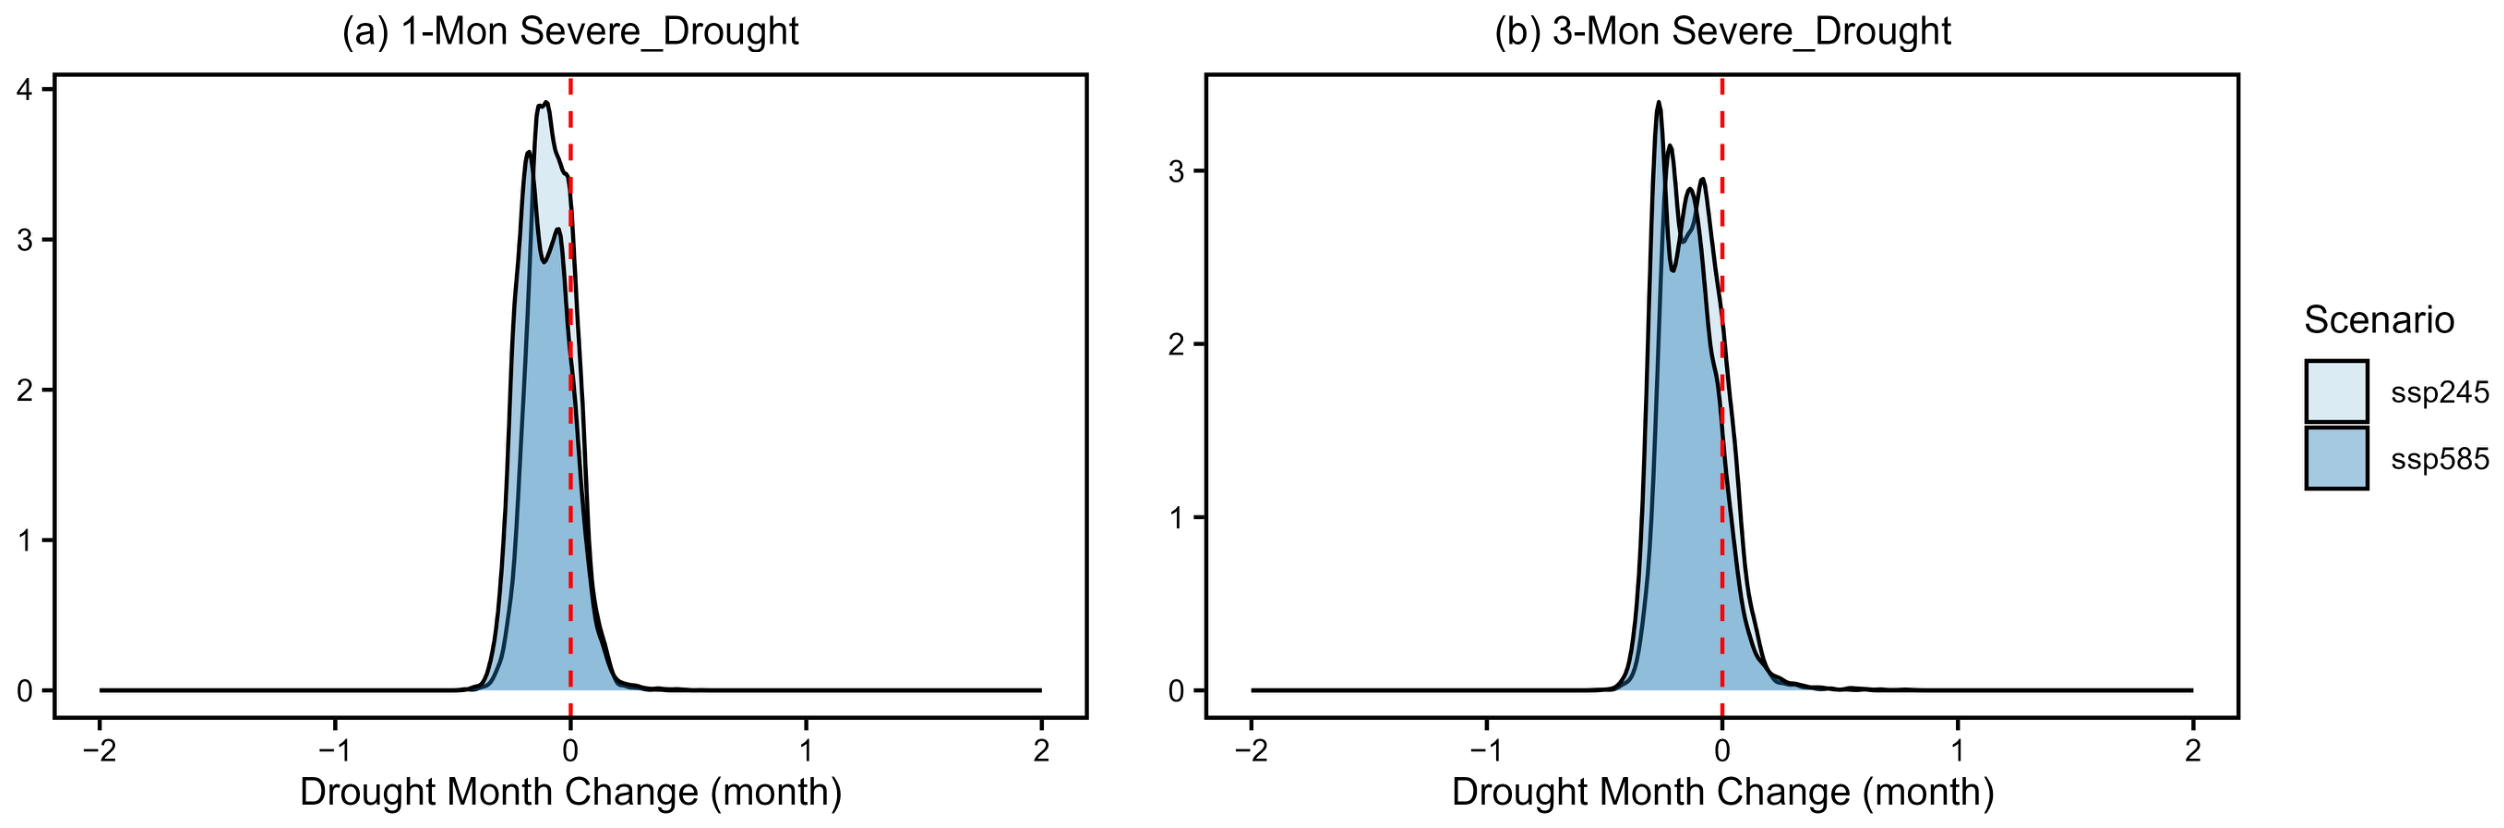
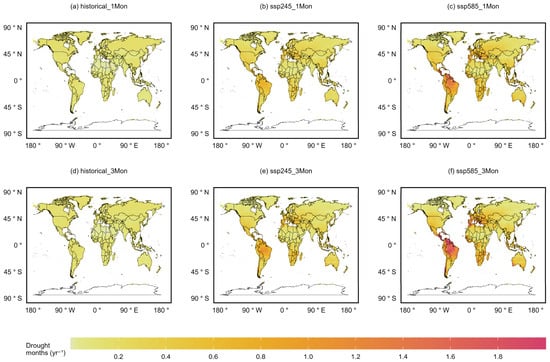
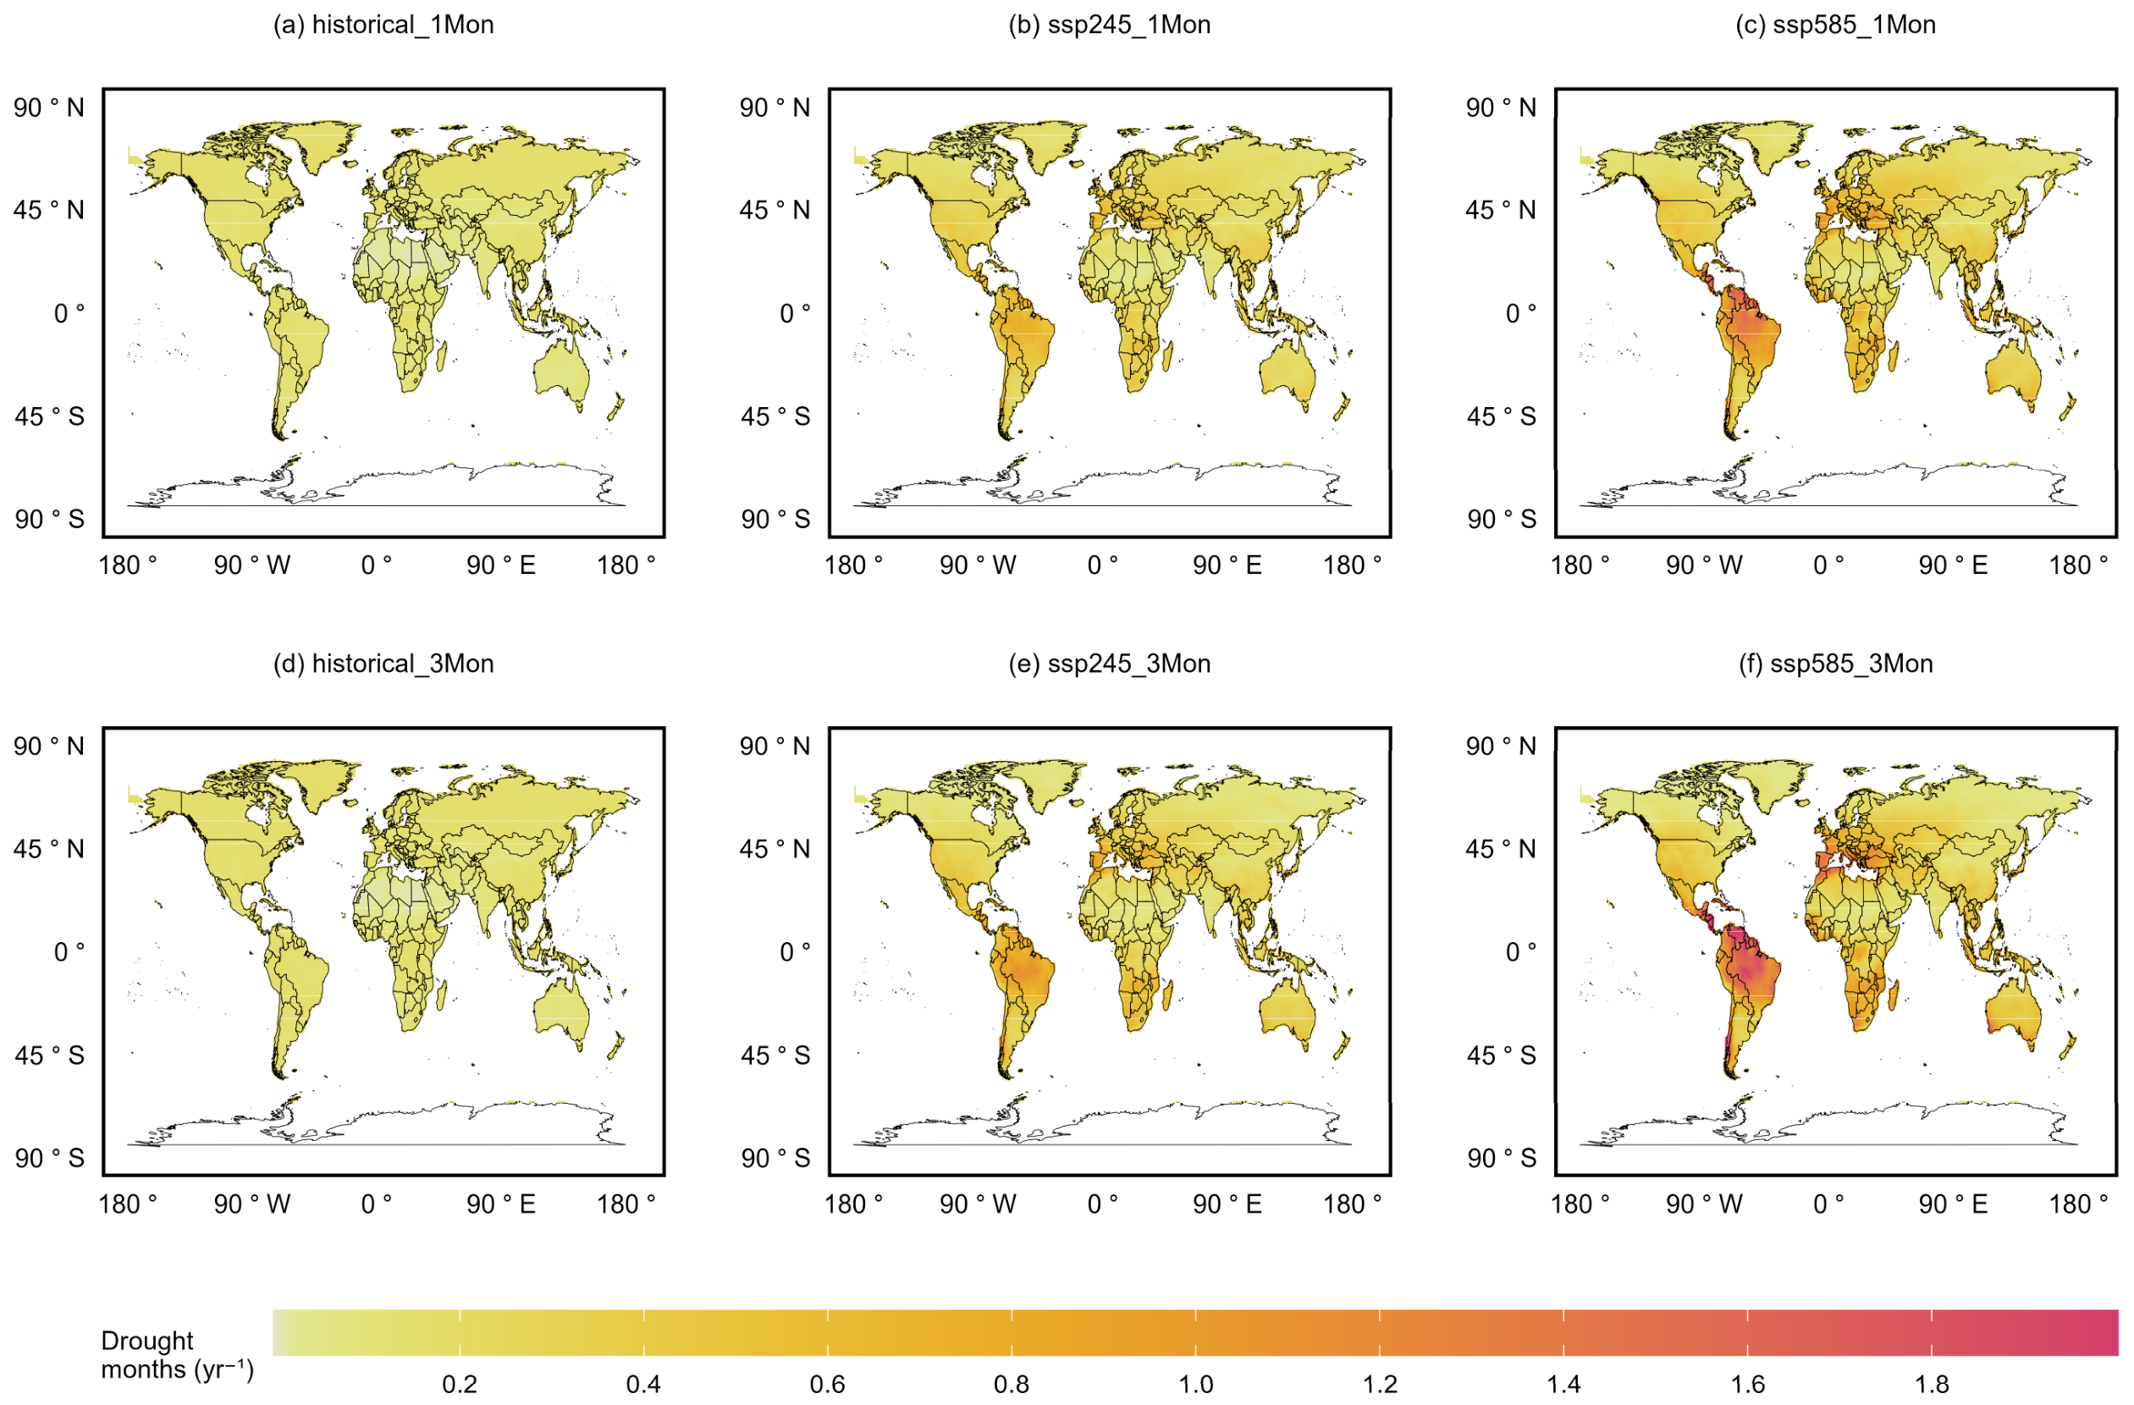
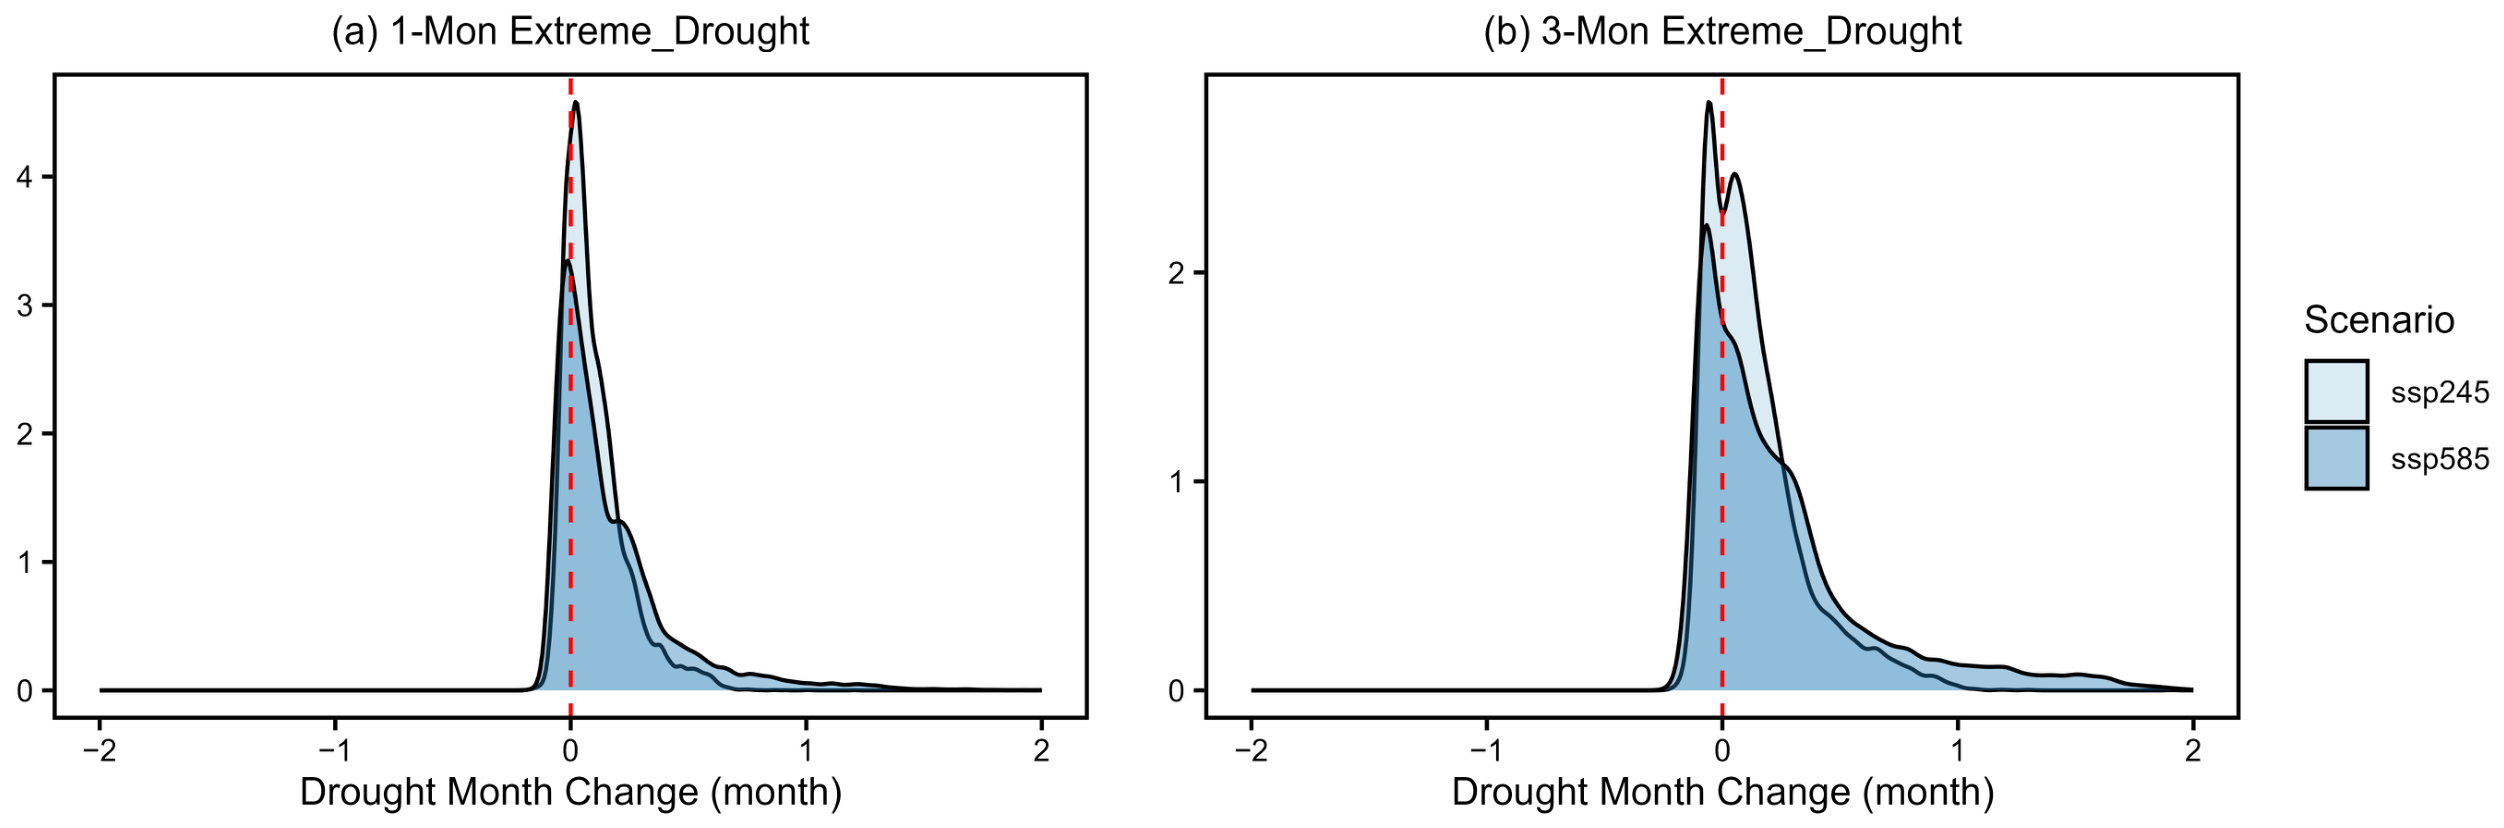

Disclaimer/Publisher’s Note: The statements, opinions and data contained in all publications are solely those of the individual author(s) and contributor(s) and not of MDPI and/or the editor(s). MDPI and/or the editor(s) disclaim responsibility for any injury to people or property resulting from any ideas, methods, instructions or products referred to in the content. |
© 2026 by the authors. Licensee MDPI, Basel, Switzerland. This article is an open access article distributed under the terms and conditions of the Creative Commons Attribution (CC BY) license.